Writing Across the Curriculum (WAC) Assessment … Writing Across the Curriculum (WAC) Assessment...
52
1 Writing Across the Curriculum (WAC) Assessment Report –August 23, 2011 Jeanne Herman, Director-WAC, 2008-2011 Deborah Goodwin, Director-WAC, 2011-2014 Carolyn Dobler, WPAC Member and Statistician for Project Rebecca Fremo, Aaron Banks, Sujay Rao, Kathy Tunheim – Members WPAC, 2009-2011 *To review WAC Mission, Goals, and Learner Outcomes visit this site: https://gustavus.edu/wac/assessment_plan/index.php I. Introduction During Fall 2010, the first phase of the WAC program assessment was initiated following extensive planning during the 2009-2010 academic year. A multi-phase approach was chosen to ensure that the process would be manageable, and that relevant constituencies of the College could be involved with the assessment process. The Writing Program Advisory Committee (WPAC) together with the Director of WAC collaborated on design and implementation of the assessment process. Members of WPAC include Rebecca Fremo, Kathy Tunheim, Aaron Banks, Sujay Rao (Director of FTS), Carolyn Dobler (Co-Coordinator, HLC), and Jeanne Herman (Director of Writing Across the Curriculum). Particular recognition must be given to Carolyn Dobler, who completed statistical analyses for the assessment process. II. Brief Overview of the Assessment Process *For complete description including surveys, tally sheets, and other elements of the assessment process, visit this site: https://gustavus.edu/wac/ During 2009-2010, WPAC discussions focused on appropriate methods to assess student writing at Gustavus and the impact of the writing program. A review of several Writing Across the Curriculum programs in similar liberal arts colleges revealed there is little agreement about feasible ways to assess WAC program effectiveness. Some colleges collect samples of student writing for review but WPAC was committed to learning more about both faculty and student perceptions as well as reading student papers. Finding examples of faculty surveys that focus on the teaching of writing, student surveys, and other tools that might yield data proved difficult. The committee also spent a significant amount of time developing student learner outcomes for each Writing Across the Curriculum program goal as a basis for the assessment process. We also focused the assessment process on criteria for a WRITD course. The next phase of development/design focused on determining what we could realistically assess and ways to do so. A three-phase process was determined to be the best way to assess both student writing and the impact of the WAC requirement. During summer 2010, Jeanne Herman in collaboration with WPAC members began to develop instruments and tools that could be used as part of Phase I. Phase I of the assessment process involved identification of 20 sections of WRITD courses offered during Fall 2010. Selection of courses was not random since the committee wanted to ensure a balanced representation of academic departments and an equal number of 200 and 300 level WRITD courses. Faculty who were scheduled to teach the 20 sections were asked to participate and 18 of the initial 20 faculty members asked to participate agreed to do so. One faculty member believed the style of writing within her course would be difficult to assess, and one faculty member had numerous other college responsibilities and did not feel he could take on additional tasks. Two additional WRITD courses were then selected for inclusion within the study and both faculty members agreed to participate. The final number of sections of WRITD courses and faculty who participated in Phase I of the study was 20.
Transcript of Writing Across the Curriculum (WAC) Assessment … Writing Across the Curriculum (WAC) Assessment...

1
Writing Across the Curriculum (WAC) Assessment Report –August 23, 2011
Jeanne Herman, Director-WAC, 2008-2011
Deborah Goodwin, Director-WAC, 2011-2014 Carolyn Dobler, WPAC Member and Statistician for Project
Rebecca Fremo, Aaron Banks, Sujay Rao, Kathy Tunheim – Members WPAC, 2009-2011 *To review WAC Mission, Goals, and Learner Outcomes visit this site: https://gustavus.edu/wac/assessment_plan/index.php I. Introduction During Fall 2010, the first phase of the WAC program assessment was initiated following extensive planning during the 2009-2010 academic year. A multi-phase approach was chosen to ensure that the process would be manageable, and that relevant constituencies of the College could be involved with the assessment process. The Writing Program Advisory Committee (WPAC) together with the Director of WAC collaborated on design and implementation of the assessment process. Members of WPAC include Rebecca Fremo, Kathy Tunheim, Aaron Banks, Sujay Rao (Director of FTS), Carolyn Dobler (Co-Coordinator, HLC), and Jeanne Herman (Director of Writing Across the Curriculum). Particular recognition must be given to Carolyn Dobler, who completed statistical analyses for the assessment process. II. Brief Overview of the Assessment Process *For complete description including surveys, tally sheets, and other elements of the assessment process, visit this site: https://gustavus.edu/wac/ During 2009-2010, WPAC discussions focused on appropriate methods to assess student writing at Gustavus and the impact of the writing program. A review of several Writing Across the Curriculum programs in similar liberal arts colleges revealed there is little agreement about feasible ways to assess WAC program effectiveness. Some colleges collect samples of student writing for review but WPAC was committed to learning more about both faculty and student perceptions as well as reading student papers. Finding examples of faculty surveys that focus on the teaching of writing, student surveys, and other tools that might yield data proved difficult. The committee also spent a significant amount of time developing student learner outcomes for each Writing Across the Curriculum program goal as a basis for the assessment process. We also focused the assessment process on criteria for a WRITD course. The next phase of development/design focused on determining what we could realistically assess and ways to do so. A three-phase process was determined to be the best way to assess both student writing and the impact of the WAC requirement. During summer 2010, Jeanne Herman in collaboration with WPAC members began to develop instruments and tools that could be used as part of Phase I. Phase I of the assessment process involved identification of 20 sections of WRITD courses offered during Fall 2010. Selection of courses was not random since the committee wanted to ensure a balanced representation of academic departments and an equal number of 200 and 300 level WRITD courses. Faculty who were scheduled to teach the 20 sections were asked to participate and 18 of the initial 20 faculty members asked to participate agreed to do so. One faculty member believed the style of writing within her course would be difficult to assess, and one faculty member had numerous other college responsibilities and did not feel he could take on additional tasks. Two additional WRITD courses were then selected for inclusion within the study and both faculty members agreed to participate. The final number of sections of WRITD courses and faculty who participated in Phase I of the study was 20.

2
Phase I of the WAC assessment process included the following steps and did not require a faculty member to add new assignments or change anything within a WRITD course.
Student Pre-Course Survey • All students enrolled in each WRITD class were asked via email to complete a short
online pre-course survey during the first ten days of class. This survey asked students to reflect on their own writing and was designed based on the Mission, Goals, and Learner Outcomes for the WAC program. The survey was created by the WPAC and posted in Survey Monkey by David Menk, Director of Institutional Research. To review the pre-course student survey, visit this site: https://gustavus.edu/wac/assessment_plan/appx_e.php
• Three students enrolled in each of the 20 sections of WRITD were randomly chosen to share first and final draft papers for one assignment chosen by the course instructor. Carolyn Dobler coordinated the selection process to ensure that selection was random. Each of the students selected signed a permission form developed by the committee. To review the permission form, visit this site: https://gustavus.edu/wac/assessment_plan/appx_d.php
• Each participating faculty member was asked to submit a course syllabus and related writing materials for the WRITD course included within the assessment. These materials were uploaded to a Moodle site created for the assessment process.
• In mid-December 2010, students enrolled in the 20 sections of WRITD included within the
assessment were asked to complete a post-course survey. As with the pre-course survey, questions within this final survey were directly related to the Mission, Goals, and Learner Outcomes associated with the WAC program. To review the student post-course survey, visit this site: https://gustavus.edu/wac/assessment_plan/appx_f.php
• All faculty participants were asked to complete a Faculty WRITD Post-Course Survey during December of 2010. Survey questions were based on the three criteria for a WRITD course. To review the faculty post-course survey, visit this site: https://gustavus.edu/wac/assessment_plan/appx_c.php
Phase II of the WAC assessment process is designed to focus on writing within FTS courses. Each FTS course is designated as a WRITI course. Modification of the process used for Phase I can be used to assess writing within a sample of FTS courses. The process should be based on learner outcomes for the FTS program that are related to writing. Details have yet to be worked out due to the transition in writing directors. Because part of this process could involve collection of a sample of student papers, these papers can also be used as part of Phase III of the overall writing assessment. Phase III of the writing assessment is designed to involve collection of papers from a sample of students enrolled in FTS during Fall 2011. The new director in collaboration with the director of FTS will determine how writing might be assessed within FTS, size of sample, and other logistics of the assessment. These papers could then also be used for the four-year cycle of evaluation. The vision for Phase III is collection of papers from the same sample of students during sophomore/junior, and senior year. This would potentially yield very useful data regarding quality of student writing and impact of the WRITI and WRITD program on student writing. Without doubt, Phase III is a significant undertaking that may or may not be possible.
*To see additional detail about the original plan for Phase II and III, visit this site: https://gustavus.edu/wac/assessment_plan/description_of_phases.php

3
III. Implementation: Reading and rating of documents – January, 2011
Following the process of copying and organizing student papers, faculty survey responses, and course materials, members of the WPAC convened on three mornings during January 2011. These days were used to begin the process of reading and rating student papers, analyzing course materials using tally sheets, and interpreting faculty survey responses using tally sheets.
The committee modified the AACU Value Rubric for Writing, which was then used to rate student first and final draft papers. The committee did not intend to “pair” student first and final draft papers. The goal was to discern quality of student writing following completion of a WRITD course, to compare and contrast student pre and post-course perceptions of writing improvement, and to consider faculty perceptions of student writing based on the sample of 20 WRITD courses. *To review the AACU modified rubric applied to student papers, visit this site: https://gustavus.edu/wac/assessment_plan/appx_g.php
Prior to reading student papers, a “norming” procedure was lead by Dr. Rebecca Fremo, Director of the Writing Center and member of WPAC. Readers applied the modified AACU Value Rubric to practice papers to increase the likelihood that readers understood the four-point rubric and how to apply it. (Later data analysis, however, revealed that inter-rater reliability was not strong. Additional detail provided under Analysis of Data section.) Following this exercise, readers began the process of reading first draft papers and applying the rubric using a tally form. On January 12, a similar process was used to read and rate final draft papers. “Tally sheets” were developed by the director of WAC, Jeanne Herman during fall 2010 and modified based on input from members of WPAC. Tally sheets were used for analysis of course syllabi and writing materials based on elements of interest including, for example, types of writing within a course, how well writing assignments seem to match criteria for WRITD, balance of formal and informal writing, and feedback process used within WRITD courses. Tally sheets for interpreting and summarizing faculty open-ended survey responses were linked to the criteria for WRITD. *To review tally sheets, visit this site: https://gustavus.edu/wac/assessment_plan/appx_g.php
Data gathered from these documents, in addition to student pre and post-course survey data and Faculty Post-Course Survey data, were then analyzed by Dr. Carolyn Dobler.
IV. Analysis of Data A. Preliminary Information: Overview
First and Final Draft Student Papers During Fall 2010, faculty members were asked to submit first and final draft papers from the three students within their section of WRITD who were randomly selected. Papers were submitted at varied times during the Fall semester since faculty participants may have chosen a writing assignment used early in the course, at a mid-point within the course, or near the end of the course.
Of a possible 60 first draft student papers, 56 papers were collected and reviewed by the committee. This is a 93% response rate. Of a possible 60 final draft student papers, 57 papers were collected and reviewed by the committee. This is a 95% response rate.
Pre-Course and Post-Course Student Surveys Dr. Carolyn Dobler analyzed data from the pre- and post-course student survey. At the beginning of Fall 2010, a total of 269 students were enrolled in the 20 sections of WRITD

4
included within this assessment and 250 students completed the survey. 223 students fully completed the survey and an additional 27 students partially completed the survey.
At the end of Fall term 2010, a total of 270 students were enrolled in the 20 sections of WRITD and 222 students completed the survey. 210 students fully completed the survey and an additional 12 partially completed the survey.
Faculty Post-Course Surveys 20 Faculty members who taught a WRITD course during Fall 2010 participated in the writing assessment. All 20 members submitted responses to a post-course survey. Analysis of WRITD Course Syllabi and Documents Related to Writing All 20 faculty members that participated in the writing assessment submitted a WRITD course syllabus/writing materials.
B. Data Tables, Summaries, and Recommendations Preliminary Comment As part of the assessment process, ratings of student papers and analysis of materials provided by faculty required application of rubrics and rating scales. Although measures were taken to improve the likelihood of rater agreement, there was still considerable variation in inter-rater reliability within Phase I ratings. In each batch, there was one “high,” one “medium,” and one “low” rating. Carolyn Dobler collapsed the data from the three raters as follows: 1. If complete agreement, used that category. 2. If two of the three agreed, used that category. 3. If no agreement, use the middle category. Learning Outcome 1A: Make consistent, appropriate choices regarding purpose, context, form, and style. SUMMARY Based on examination of a random sample of student writing and on analysis of student perceptions obtained by surveying all students in twenty WRITD courses, students in WRITD courses (in Fall 2010) make consistent, appropriate choices regarding purpose, context, form, and style. In the examined student work from Fall 2010, most (86%) demonstrated clear purpose and appropriately considered the audience, although there was no statistically significant difference in student work in the Level 2 (81%)and Level 3 (90%) courses. In addition, most (89%) used appropriate disciplinary conventions including organization, content, format, and style, with a statistically significant difference in the Level 2 (81%) and Level 3 (97%) courses. Among students enrolled in these courses in Fall 2010, most (73%) reported improvement in their ability to make appropriate choices in purpose, content, and style of writing within this discipline after taking this WRITD course, with about ¼ reporting no change in this ability. There was no statistically significant difference in the reported improvement by course level. At the beginning of the Fall 2010 semester, about ¼ of the students enrolled in these WRITD courses report a need for improvement in their ability to make effective choices regarding voice and language to suit the needs of specific audiences (24%), to effectively structure a paragraph to enhance clarity for readers (29%), and to use convention such as grammar and mechanics appropriately to produce clear, concise writing (23%). Of those expressing concern (needing improvement) in these aspects at the beginning of the semester, about 40% perceive their ability as strong at the end of the semester to use convention, while over 60% perceive their ability as

5
strong at the end of the semester to make effective choices regarding voice and language to suit the needs of specific audiences and also to effectively structure a paragraph. DIRECT EVIDENCE FINAL PAPER RUBRIC: Context and Purpose of Writing (appropriately considers audience; purpose is clear) Level of Achievement Percent Count Level 2 Level 3 Paper does not adequately address or difficult to discern Addressed with little detail or clarity 14.29% 8 5 3 Adequately addressed with some detail and clarity 60.71% 34 14 20 Mastery is evident 25.00% 14 7 7 100.00% 56 26 30 NOTE: There is no statistically significant difference in the proportions of level of achievement of Context and Purpose by Course Level (χ2=1.28, P=0.53, df =2) Genre and Disciplinary Conventions (appropriate use of conventions within the discipline/writing task including organization, content, format, and style) Level of Achievement Percent Count Level 2 Level 3 Paper does not adequately address or difficult to discern Addressed with little detail or clarity 10.71% 6 5 1 Adequately addressed with some detail and clarity 60.71% 34 17 17 Mastery is evident 28.57% 16 4 12 100.00% 56 26 30 NOTE: There is a statistically significant difference in the proportions of level of achievement of Genre and Disciplinary Conventions by Course Level (χ2=6.41, P=0.04, df =2) INDIRECT EVIDENCE Question 5: Student WRITD Post-Course Survey “After completing this WRITD course, my ability to make appropriate choices in purpose, content, and style of writing within this discipline has… Response Percentage Count Level 2 Level 3 Decreased 0.48% 1 1 Stayed the Same 25.60% 53 22 31 Improved 66.18% 137 68 68 Significantly Improved 7.73% 16 6 10 Total 100.00% 207 96 110 NOTE: There is no statistically significant difference in ability to make appropriate choices by course level (χ2=1.71, P=0.43, df =2) NOTE: The count for Level 2 and Level 3 do not sum to the total count because of missing data for course level for one student. Question 2: Student WRITD Pre-course and Post-course Survey How do you rate the following aspects of your writing?

6
Use convention such as grammar and mechanics appropriately to produce clear, concise writing.
Effectively structure a paragraph to enhance clarity for readers.

7
Make effective choices regarding voice and language to suit the needs of specific audiences.
RECOMMENDATIONS Although a high percentage of students meet expectations for this student learner outcome, there are still some students who do not. These results suggest that WRITD courses should emphasize appropriate choices in purpose, content, and style of writing within the discipline since about ¼ of students report no change in this ability after completing a WRITD course. Similarly, about ¼ of students within the sample believe they need further work on how to make effective choices regarding voice and language to suit the needs of specific audiences (24%), to effectively structure a paragraph to enhance clarity for readers (29%), and to use conventions such as grammar and mechanics appropriately to produce clear, concise writing (23%). Although the results suggest the majority of students are making consistent, appropriate choices regarding purpose, context, form, and style, teachers of writing should consider ways to reemphasize these skills and reach the ¼ of sample students who need further work in achieving this goal. One way to help students practice and emphasize how to make effective choices regarding voice and language is via informal writing exercises. For example, students might be asked to write a short précis of a research-based article for a scholarly audience; they might then revise that summary for a newsletter or another publication intended for a lay audience. Or, students might be asked to read a particular excerpt of published writing from a scholarly journal, and then distill that excerpt into language that might be shared with a different audience. Such exercises help students develop rhetorical strategies to make their work reach multiple audiences effectively. Finally, it may be beneficial for all WRITD course syllabi/ writing materials to include specific expectations regarding discipline-specific writing. For instance, teachers might include guidelines for students related to genre, format, audience, style, and types of sources.

8
Learning Outcome 2A: Opportunities to use formal and informal writing. SUMMARY Based on the analysis of course materials provided by faculty, the opportunities to use informal writing appear to be limited. This, however, does not mean that informal writing is not being used in WRITD courses, as it may appear on essay exams or homework. Analysis of course materials suggests that the majority (65%) of WRITD courses in the sample require a draft for one assignment. Although number of pages required for an assignment varies widely, as does the total number of graded assignments within a course, most WRITD courses within this sample require 3-5 formal assignments. In some 300 level courses, one more in-depth writing assignment was used with multiple drafts of sub-sections. Analysis of course syllabus and other materials provided:
# of graded formal assignments 1 2 3 4 5 6 7 8 9 10 11
# of pages
unclear 2 1 1 1 1-10 1 11-20 1 4 2 1 21-30 1 1 1 1 31-40 1
Total 1 2 4 3 3 1 2 1 0 1 1 Graded/Formal Assignments with Required Drafts: # assgn 0 1 2 3 4 5 6 7 8 9 10 11 12 13
# courses
1 13 1 1 2 1 1
Graded/Informal Assignments: # assgn 0 1 2 3 4 5 6 7 8 9 10 11 12 13
# courses
17 1 1
RECOMMENDATIONS Faculty teaching WRITD courses should include language about the value of informal writing within course materials and provide opportunities for students to write informally. Exercises designed to help students value and use informal writing can be very brief. Students can write a short response to a video, speaker, or reading with follow-up discussion of the response. In small groups, students can be asked to write a group analysis of the arguments used within a short reading. Completing thinking or concept maps can also be used as informal writing. This style of brief writing exercise can relate to a lecture, reading, speaker, or other information source. These are just a few examples of informal writing that can engage students and encourage them to explore and refine writing skills. Informal writing is typically not graded nor do faculty need to collect and read it. Discussion of the response can help students improve writing and demonstrate understanding of course material. Although there is fairly wide disparity in number of required formal assignments within WRITD courses included within this sample, we encourage faculty to consider requiring no fewer than

9
three formal writing assignments with required drafts for at least two of those assignments. To enhance clarity of writing, students should be expected to write drafts of papers, receive faculty and/or peer feedback, and revise. Exploring the genres of writing within the discipline through varied assignments and informal writing may also be beneficial. Learning Outcome 3A: Analyze and create arguments, explain, persuade, and communicate with varied audiences. SUMMARY Based on examination of student writing samples and on analysis of student perceptions, students in WRITD courses (in Fall 2010) are able to analyze and create arguments, explain, persuade, and communicate with varied audiences. In the examined student work in Fall 2010, most (86%) demonstrated clear purpose and appropriately considered the audience, although there was no statistically significant difference in student work in the Level 2 (81%) and Level 3 (90%) courses. In addition, slightly fewer (84%) used appropriate content to illustrate mastery of the subject, with a statistically significant difference in the Level 2 (73%) and Level 3 (93%) courses. Finally, slightly less (78%) used appropriate support for arguments, with a statistically significant difference in the Level 2 (61%) and Level 3 (93%) courses. Among students enrolled in these courses in Fall 2010, most (74%) reported improvement in their ability to analyze and create arguments, explain, and persuade within this discipline with about ¼ reporting no change in this ability. About 2/3 (65%) reported improvement in their ability to find, evaluate, and incorporate appropriate resources to support the thesis/premise/points of view within a paper, with about 1/3 reporting no change in this ability. Half of the students reported improvement in their ability to write for multiple audiences across disciplines. There was no statistically significance in the previous reported abilities by course level. At the beginning of the Fall 2010 semester, about ¼ of the students enrolled in these WRITD courses report a need for improvement in their ability to state a clear thesis and properly develop an argument (27%), to find, evaluate, and select primary and secondary sources (26%), and to effectively integrate and cite primary and secondary sources as evidence within a paper (22%). Of those expressing concern (needing improvement) in these aspects at the beginning of the semester, about 37% perceive their ability as strong at the end of the semester to state a clear thesis and properly develop an argument, while 73% perceive their ability as strong at the end of the semester to find, evaluate, and select primary and secondary sources and to effectively integrate and cite primary and secondary sources as evidence. DIRECT EVIDENCE: Final Paper Rubric: Context and Purpose of Writing (appropriately considers audience; purpose is clear) Level of Achievement Percent Count Level 2 Level 3 Paper does not adequately address or difficult to discern Addressed with little detail or clarity 14.29% 8 5 3 Adequately addressed with some detail and clarity 60.71% 34 14 20 Mastery is evident 25.00% 14 7 7 100.00% 56 26 30 NOTE: There is no statistically significant difference in the proportions of level of achievement of Context and Purpose by Course Level (χ2=1.28, P=0.53, df =2)

10
Content Development (Uses appropriate content to illustrate mastery of the subject; coherence and continuity evident) Level of Achievement Percent Count Level 2 Level 3 Paper does not adequately address or difficult to discern
Addressed with little detail or clarity 16.07% 9 7 2 Adequately addressed with some detail and clarity 44.64% 25 15 10 Mastery is evident 39.29% 22 4 18 100.00% 56 26 30 NOTE: There is a statistically significant difference in the proportions of level of achievement of Content Development by Course Level (χ2=12.47, P=0.002, df =2) Sources and Evidence (appropriate support for arguments, using quality sources) Level of Achievement Percent Count Level 2 Level 3 Paper does not adequately address or difficult to discern
Addressed with little detail or clarity 22.00% 11 9 2 Adequately addressed with some detail and clarity 40.00% 20 11 9 Mastery is evident 38.00% 19 3 16 100.00% 50 23 27 NOTE: There is a statistically significant difference in the proportions of level of achievement of Sources and Evidence by Course Level (χ2=13.31, P=0.001, df =2) INDIRECT EVIDENCE: Question 6 : Student WRITD Post-Course Survey “After completing this WRITD course, my ability to analyze and create arguments, explain, and persuade within this discipline has….” Response Percentage Count Level 2 Level 3 Decreased 1.92% 4 1 2 Stayed the Same 24.52% 51 26 25 Improved 61.54% 128 58 69 Significantly Improved 12.02% 25 11 14 Total 100.00% 208 96 110 NOTE: There is no statistically significant difference in ability to analyze and create arguments by course level (χ2=0.72, P=0.87, df =3) NOTE: The count for Level 2 and Level 3 do not sum to the total count because of missing data for course level for one student. Question 9: Student WRITD Post-Course Survey “Having completed this WRITD course, my ability to find, evaluate, and incorporate appropriate resources to support the thesis/premise/points of view within a paper has…” Response Percentage Count Level 2 Level 3 Decreased .97% 2 1 1 Stayed the Same 33.82% 70 33 37 Improved 54.11% 112 53 58 Significantly Improved 11.11% 23 9 14 Total 100.00% 207 96 110 NOTE: There is no statistically significant difference in ability to find, evaluate, and incorporate appropriate resources by course level (χ2=0.59, P=0.90, df =3) NOTE: The count for Level 2 and Level 3 do not sum to the total count because of missing data for course level for one student.

11
Question 16: Student WRITD Post-Course Survey “Having completed this WRITD course, my ability to write for multiple audiences across disciplines has…” Response Percentage Count Level 2 Level 3 Decreased 1.45% 3 3 Stayed the Same 48.79% 101 46 55 Improved 45.89% 95 46 48 Significantly Improved 3.86% 8 4 4 Total 100.00% 207 96 110 NOTE: There is no statistically significant difference in ability to find, evaluate, and incorporate appropriate resources by course level (χ2=0.25, P=0.88, df =2) NOTE: The count for Level 2 and Level 3 do not sum to the total count because of missing data for course level for one student. Question 2: Student WRITD Pre-course and Post-course Survey How do you rate the following aspects of your writing? State a clear thesis and properly develop an argument.
Find, evaluate, and select primary and secondary sources.

12
Effectively integrate and cite primary and secondary sources as evidence within a paper.
RECOMMENDATIONS It is exciting to see the high percentages of students who can analyze and create arguments, and explain, persuade, and communicate with varied audiences. These results clearly suggest the majority of students are improving these skills through completion of WRITD courses but there are still some students who need to refine these skills. These results suggest that teachers of Level 2 WRITD courses may need to further emphasize how to incorporate appropriate support for arguments since many students indicate concern

13
about their ability to do this effectively. Faculty might respond by developing Level 2 WRITD courses that focus on methods of argumentation across similar fields of study. Colleagues within a given division could share and rotate responsibility for teaching these courses. For instance, courses might be offered in Arguments in the Sciences, Arguments in the Social Sciences, Arguments in the Humanities, etc. Or, individual departments could develop courses that re-emphasize argumentation within their existing Level 2 offerings. Given that about ¼ of students reported no change in this ability after completing their WRITD course, it would be beneficial for WRITD courses to include opportunities for students to analyze and create arguments, explain, and persuade within the context of the discipline. Emphasis on incorporating appropriate resources to support the thesis/premise/points of view within a paper might be yet another goal for WRITD courses. This seems important given that about 1/3 of students report no change in this ability after completing the WRITD course. We recognize, of course, that WRITD courses vary not only by discipline but by type of writing assignments incorporated. The above recommendations must be considered within the context of the discipline and course. Learning Outcome 4A: Complete writing exemplifying structures, genre, and conventions of discipline. SUMMARY Based on examination of a random sample of student writing and on analysis of student perceptions obtained by surveying all students in twenty WRITD courses, students in WRITD courses (in Fall 2010) complete writing exemplifying structures, genre, and conventions of the discipline. In the examined student work collected Fall 2010, most (89%) demonstrated appropriate use of conventions within the discipline/writing task including organization, content, format, and style, with a statistically significant difference in student work in the Level 2 (81%) and Level 3 (97%) courses. In addition, most (87%) used appropriate voice, clarity, readability, and conventions, although there was no statistically significant difference in the Level 2 (81%) and Level 3 (93%) courses. Among students enrolled in these courses in Fall 2010, over half reported improvement in their ability to recognize different kinds of writing (57%) and to use discipline-specific conventions (62%) after taking this WRITD course. Further, most reported improvement in their knowledge and understanding of styles of writing within this discipline (75%) and in their ability to read and interpret professional discipline-specific articles and literature (74%). Many (66%) reported improvement in ability to write for audiences within their discipline. There was no statistically significant difference in the reported improvement of any of the previous abilities by course level. At the beginning of the Fall 2010 semester, only 14% of students enrolled in these WRITD courses reported a need for improvement in writing effective sentences and paragraphs. Of those expressing concern (needing improvement) at the beginning of the semester, half perceived their ability as strong at the end of the semester to write effective sentences and paragraphs. Review of course syllabi/writing materials submitted by faculty within this sample show that 55% stated very clear directions and expectations about structures, genre, and conventions of their discipline. Another 30% included some language about genre and conventions, and 15% did not provide examples or clearly explain expectations. In terms of appropriate audience for writing assignments, 85% of faculty clearly described audience and 70% of faculty explained expectations regarding voice and tone of writing assignments. Furthermore, 80% of faculty described in some detail expectations regarding format and length of the paper, and editing and grammar.

14
Results from the Faculty Post-Course Survey show wide variation in types of discipline-specific writing faculty asked students to complete in the WRITD courses included within this sample. Students were asked to review research-based academic papers or articles, case study papers, lab or field reports, and many other styles of writing. DIRECT EVIDENCE: Final Paper Rubric: Genre and Disciplinary Conventions (appropriate use of conventions within the discipline/writing task including organization, content, format, and style) Level of Achievement Percent Count 200 300 Paper does not adequately address or difficult to discern Addressed with little detail or clarity 10.71% 6 5 1 Adequately addressed with some detail and clarity 60.71% 34 17 17 Mastery is evident 28.57% 16 4 12 100.00% 56 26 30 NOTE: There is a statistically significant difference in the proportions of level of achievement of Genre and Disciplinary Conventions by Course Level (χ2=6.41, P=0.04, df =2) Control of Syntax and Mechanics (appropriate voice, clarity, readability, and conventions) Level of Achievement Percent Count 200 300 Paper does not adequately address or difficult to discern
Addressed with little detail or clarity 12.50% 7 5 2 Adequately addressed with some detail and clarity 67.86% 38 17 21 Mastery is evident 19.64% 11 4 7 100.00% 56 26 30 NOTE: There is no statistically significant difference in the proportions of level of achievement of Control of Syntax and Mechanics by Course Level (χ2=2.25, P=0.32, df =2) INDIRECT EVIDENCE: Question 4: Student WRITD Post-Course Survey “After completing this WRITD course, my ability to recognize different kinds of writing (informative, creative, scholarly, etc) within this discipline has….” Response Percentage Count Level 2 Level 3 Decreased Stayed the Same 43.48% 90 42 48 Improved 51.69% 107 48 58 Significantly Improved 4.83% 10 6 4 Total 100.00% 207 96 110 NOTE: There is no statistically significant difference in ability to recognize different kinds of writing by course level (χ2=0.79, P=0.67, df =2) NOTE: The count for Level 2 and Level 3 do not sum to the total count because of missing data for course level for one student. Question 7: Student WRITD Post-Course Survey “After completing this WRITD course, my knowledge and understanding of styles of writing within this discipline has...” Response Percentage Count Level 2 Level 3 Decreased 0.49% 1 1 Stayed the Same 24.76% 51 22 29 Improved 66.50% 137 67 69

15
Significantly Improved 8.25% 17 6 11 Total 100.00% 206 96 109 NOTE: There is no statistically significant difference in knowledge and understanding of styles of writing by course level (χ2=1.51, P=0.47, df =2) NOTE: The count for Level 2 and Level 3 do not sum to the total count because of missing data for course level for one student. Question 8: Student WRITD Post-Course Survey “After completing this WRITD course, my ability to read and interpret professional discipline-specific articles and literature has….” Response Percentage Count Level 2 Level 3 Decreased .48% 1 1 Stayed the Same 25.12% 52 25 27 Improved 63.77% 132 60 72 Significantly Improved 10.63% 22 11 10 Total 100.00% 207 96 110 NOTE: There is no statistically significant difference in ability to read and interpret professional discipline-specific articles and literature by course level (χ2=0.39, P=0.82, df =2) NOTE: The count for Level 2 and Level 3 do not sum to the total count because of missing data for course level for one student. Question 10: Student WRITD Post-Course Survey “After completing this WRITD course, my ability to use discipline-specific conventions (structure, style of writing, grammar, etc) has...” Response Percentage Count Level 2 Level 3 Decreased .49% 1 1 Stayed the Same 37.86% 78 36 42 Improved 52.91% 109 48 60 Significantly Improved 8.74% 18 11 7 Total 100.00% 206 96 109 NOTE: There is no statistically significant difference in ability to use discipline-specific conventions by course level (χ2=1.73, P=0.42, df =2) NOTE: The count for Level 2 and Level 3 do not sum to the total count because of missing data for course level for one student.

16
Question 17: Student WRITD Post-Course Survey “Having completed this WRITD course, my ability to write for audiences within my discipline has...” Response Percentage Count Level 2 Level 3 Decreased Stayed the Same 33.82% 70 31 39 Improved 60.87% 126 59 66 Significantly Improved 5.31% 11 6 5 Total 100.00% 207 96 110 NOTE: There is no statistically significant difference in ability to write for audiences within my discipline by course level (χ2=0.45, P=0.80, df =2) NOTE: The count for Level 2 and Level 3 do not sum to the total count because of missing data for course level for one student. Question 2: Student WRITD Pre-course and Post-course Survey How do you rate the following aspects of your writing? Write effective sentences and paragraphs.

17
Analysis of Syllabus/Writing Materials All WRITD courses should require students to complete writing assignments that exemplify the structures, genres, and conventions of the disciplines. Provide students with opportunities to read and analyze examples of discipline-specific writing. Based on the examination of the syllabus/course materials provided, to what degree is the nature of discipline-specific writing addressed within the course syllabus and materials? Count Percentage Included or mentioned without description 4 20% Briefly described 5 25% Described with expectations regarding discipline-specific writing clearly stated
11 55%
Total 20 100% Clarity of assignment descriptions based on syllabus materials. Count Percentage Lacks clarity in terms of expectations; examples not provided 3 15% Directions are clear but sub-sections may not adequately convey expectations
6 30%
Directions and expectations are clear and examples are provided 11 55% Total 20 100% Within the syllabus/other materials provided, what expectations regarding writing conventions/structure are conveyed to the students? Describes the purpose of the assignment. Level Count Percentage Not addressed in syllabus/assignments 4 20% Mentioned without detail 0 Explained in detail 16 80% Total 20 100% Describes expectations concerning audience. Count Percentage Not addressed in syllabus/assignments 3 15% Mentioned without detail 1 5% Explained in detail 16 80% Total 20 100% Describes expectations concerning voice and tone. Count Percentage Not addressed 6 30% Mentioned without detail 3 15% Explained in detail 11 55% Total 20 100%

18
Within the syllabus/other materials provided, what expectations regarding writing conventions/structure are conveyed to the students? (continued) Describes expectations concerning editing, grammar, and other conventions. Level Count Percentage Not addressed 4 20% Mentioned without detail 1 5% Explained in detail 15 75% Total 20 100% Describes expectations concerning format and length of paper. Level Count Percentage Not addressed 4 20% Mentioned without detail 1 5% Explained in detail 15 75% Total 20 100% Describes expectations concerning citation style (if appropriate to assignment). Count Percentage Not addressed 7 35% Mentioned without detail 0 Explained in detail 13 65% Total 20 100% Analysis of Faculty Survey Responses Faculty Survey, Question 1: How well prepared were the students within your class to do the work associated with WRITD? Count Percentage Well-prepared 4 20% Adequately prepared 9 45% Inadequately prepared 1 5% Varied too much to generalize 6 30% Total 20 100% Faculty Survey Question 2a: What kinds of discipline-specific writing did you ask students to review Count Research-based academic paper or article 12 Literature review 2 Lab or field report 2 Case study paper 2 Reflective paper or journal 1 Assessment of film, text, etc 6 Poetry or other literary text (primary) 4 and how did you introduce these examples? Count Textbook 5 Lesson or unit plan 1 Blogs 1

19
Faculty Survey Question 3: How well did the writing assignments within this course enable students to practice disciplinary conventions? Count Appropriate voice 1 Clarity of structure within paper 13 Writing for certain audience 7 Appropriate use of language within discipline 5 Citations and references used appropriately 6 Faculty Survey, Question 4: Question 4: What types of resources were used to support the teaching of writing conventions within this course? Count Primarily web sources 4 Writing handbook 13 Written examples provided to illustrate conventions 10 WC 2 Conference 2 RECOMMENDATIONS Clearly, WRITD courses included within this sample are helping students become better writers, with particular strides being made in terms of their knowledge of conventions within the discipline, including organization, content, format, and style. Likewise, gains are being made in terms of how their papers demonstrate appropriate voice, clarity, readability, and sentence level conventions (grammar, syntax, mechanics). The statistically significant difference between students’ knowledge in these areas in level two and level three courses supports the idea that as students move forward within their disciplines, their knowledge of disciplinary conventions improves. At the same time, although a high percentage of students meet expectations for this student learning outcome, there are still some students who do not. One way to help this group of students is to provide more opportunities to read and explore examples of writing that exemplify the genre and conventions within the discipline. Faculty members might upload samples to their course MOODLE pages, for instance, or include one full article - perhaps even annotated by the faculty member him/herself - from the discipline as an attachment to each syllabus. Having such models readily available might also facilitate the discussion of appropriate voice, organization and conventions. Still, models alone may not communicate expectations clearly. Instead, faculty members could be encouraged to include explicit descriptions of their expectations regarding discipline-specific writing. Results suggest that only 55% of WRITD course instructors included within this sample clearly describe their expectations regarding discipline-specific writing. Clear expectations for writing assignments appropriate within the discipline should be included within the syllabus or other writing materials. For instance, instructors might develop: --annotated examples of past student papers --annotated examples of professionally authored materials --handouts that state generic and/ or other discipline-specific expectations explicitly --exercises or assignments based on a required style manual
20
Additionally, sharing expectations regarding audience, voice, and tone for each assignment could be beneficial to students. Again, these might be communicated directly via handout or modeled with sample texts. In addition to providing clear expectations regarding discipline-specific writing, WRITD teachers should consider creating a broad variety of writing assignments appropriate to the discipline. By showing students that disciplinary discourse is not monologic, instructors help them understand the nuances of structure, voice, and other rhetorical strategies used within a discipline. When they produce literature reviews, research-based papers, field reports, and other forms, they benefit from being exposed to the multitude of genres that create and maintain a particular knowledge community. Learning Outcome 5A: Write drafts, receive peer and faculty feedback, revise and edit. SUMMARY Based on examination of a random sample of student writing and on analysis of student perceptions obtained by surveying all students in twenty WRITD courses, students in WRITD courses (in Fall 2010) are able to write drafts, receive peer and faculty feedback, and revise and edit. At the beginning of the Fall 2010 semester, only 19% of students enrolled in these WRITD courses reported a need for improvement in revising successfully with the help of instructor or peer feedback. Of those expressing concern (needing improvement) at the beginning of the semester, over half (64%) perceived their ability to revise successfully with feedback as strong by the end of the semester. Among students enrolled in sample courses during Fall 2010, over half (58%) reported improvement in their ability to write a good first draft of a paper after taking this WRITD course. Furthermore, many (64%) reported improvement in ability to incorporate faculty/peer feedback when revising a paper. There was no statistically significant difference in the reported improvement of any of the previous abilities by course level. It is also interesting to note that about 73% of students completed three or more papers that included instructor and/or peer feedback while 27% completed one or two papers that included instructor and/or peer feedback. Examination of syllabus/course materials show that 30% of faculty require revision of more than one assignment and set clear expectations, 50% require revision of one or more assignments but provide minimal reference to expectations, and 20% invite written drafts but do not require revision. Review of syllabus/course materials also shows that 50% of faculty in his sample dedicate class time for peer review and feedback on one or more writing assignments, 10% of faculty recommend peer review outside of class time, and 40% of faculty do not include information about peer review and feedback in writing materials. Further analysis of syllabus/course materials suggests that the most common kinds of revision students were asked to make after faculty review of a first draft include: development of a thesis, structural changes, and quality of evidence or analysis of argument. Patterns of concerns still noted by faculty in final drafts of student papers include: development of thesis, structure, conventions, quality of evidence, and appropriate use of citations and citation style. Although faculty identify types of improvements students need to make in final papers, it is interesting that the majority of faculty view revision as valuable or extremely valuable as a means to improve student writing.

21
Question 11: Student WRITD Post-Course Survey “Having completed this WRITD course, my ability to write a good first draft of a paper has….” Response Percentage Count Level 2 Level 3 Decreased 1.93% 4 1 3 Stayed the Same 36.72% 76 39 37 Improved 55.07% 114 51 62 Significantly Improved 6.28% 13 5 8 Total 100.00% 207 96 110 NOTE: There is no statistically significant difference in ability to write a good first draft by course level (χ2=1.87, P=0.59, df =3) NOTE: The count for Level 2 and Level 3 do not sum to the total count because of missing data for course level for one student. Question 12: Student WRITD Post-Course Survey “Having completed this WRITD course, my ability to incorporate faculty/peer feedback when revising a paper has...” Response Percentage Count Level 2 Level 3 Decreased 9.71% 2 1 1 Stayed the Same 29.61% 61 33 28 Improved 56.80% 117 49 68 Significantly Improved 12.62% 26 12 13 Total 100.00% 206 95 110 NOTE: There is no statistically significant difference in ability to incorporate faculty/peer feedback within revising a paper by course level (χ2=2.45, P=0.48, df =23) NOTE: The count for Level 2 and Level 3 do not sum to the total count because of missing data for course level for one student. Question 13: Student WRITD Post-Course Survey “Within this WRITD course, I received either faculty and/or peer feedback on ___ number of writing assignments.” Response Percentage Count Level 2 Level 3 1-2 26.44% 55 22 32 3-4 52.40% 109 54 54 5 or more papers 21.15% 44 19 25 Total 100.00% 208 95 111 NOTE: There is no statistically significant difference in the number of papers on which feedback was received by course level (χ2=1.44, P=0.49, df =2) NOTE: The count for Level 2 and Level 3 do not sum to the total count because of missing data for course level for two students. Question 2: Student WRITD Pre-course and Post-course Survey (NOTE: It is inappropriate to conduct significance test due to multiple zero cells.) How do you rate the following aspects of your writing? Revise successfully with the help of instructor or peer feedback.

22
Analysis of Syllabus/Writing Materials All WRITD courses should offer students opportunities to revise their work with the help of an instructor’s feedback. Based on an examination of the syllabus/course materials, what opportunities are there for revision with instructor feedback? Count Percentage Revision invited, but not required for one or more assignments 4 20% Revision is required for one or more assignments but there is minimal reference to expectations
10 50%
Revision is required for more than one assignment with clear reference to instructor feedback
6 30%
Total 20 100% Based on an examination of the syllabus/course materials, what opportunities are there for peer feedback on writing? Count Prob No information within syllabus/writing assignments related to peer feedback
8 40%
Documents indicate that peer feedback is recommended outside of class time
2 10%
There is dedicated class time for peer feedback on one or more assignments
10 50%
Total 20 100%

23
Analysis of Faculty Survey Responses Faculty Survey, Question 5: Please describe the cycle of feedback and revision used within this course? Count Instructor feedback on one assignment with required revision 5 Instructor feedback on two or more assignments with required revision
11
Instructor feedback optional on one or more assignments, revision optional
3
Peer feedback required on one or more assignments 10 Faculty Survey, Question 6a: Please describe the most common kinds of revisions students were asked to make after you reviewed first draft assignments, Count Development of thesis or argument 12 Use of appropriate voice 1 Use of language appropriate to audience 3 Structure within paper or essay 11 Quality of evidence used or analysis 9 Use of appropriate citations and citation style 2 Quality of introduction 2 Quality of closure 2 Convention (syntax, grammar, etc) 5 Faculty Survey, Question 6b: and then comment on how valuable revision is in improving student writing in this course. Count Little value 0 Some value 1 Valuable 2 Extremely valuable 9 Faculty Survey, Question 7: Please describe any patterns of concerns/writing problems that were still evident in final drafts of papers written by students within your course. Count Development of thesis or argument 9 Use of appropriate voice 1 Use of language appropriate to audience 2 Structure within paper or essay 8 Quality of evidence used 4 Use of appropriate citations and citation style 4 Quality of introduction 0 Quality of closure 2 Convention (sentence level) 5 RECOMMENDATIONS Results suggest that after completing a WRITD course, students improve their ability to write first draft papers effectively, and incorporate peer and instructor feedback. The number of students

24
who improved these skills suggests that instructors are being purposeful in designing discussions and assignments. Although a high percentage of students meet expectations for this student learning outcome, there are still some students who do not. What does data suggest about feedback and revision of writing assignments? Were revisions required by WRITD courses included within the sample? Given that the majority of WRITD courses required a first draft for just one assignment, WRITD courses could provide more opportunities for peer/faculty feedback, perhaps by requesting a first draft of at least two different types of assignments. Since about half of students show improvement when writing second drafts, and are better able to apply instructor comments when revising, more experience with feedback and revision is desirable. On the Faculty Post-Course Survey all faculty within the sample who responded to a question regarding the “value of revision” indicated they believe revision is of value in improving student writing. If revisions were required, how clearly were expectations regarding a revision communicated? Because examination of syllabus/course materials suggest that 50% of WRITD courses in this sample require revision of one or more assignments but provide “minimal reference to expectations”, more detail about expectations for revising and writing drafts of papers is needed. Was peer review utilized, and if so, was time designated for that activity during class? Review of syllabus/course materials shows that 40% of faculty do not include information about peer review and feedback in writing materials. If faculty believe peer feedback is of value in improving student writing, some explanation of how peer feedback will be used and its importance should be addressed within the course syllabus. It is certainly possible that students learn about the importance of peer feedback through information shared verbally in the classroom. In this sample, 50% of faculty provide class time for peer review and feedback activities. To ensure that peer feedback is of good quality and that it actually occurs, in-class opportunities for students to review peer assignments may be of value because these experiences allow the faculty member to observe and intervene when necessary. In addition, Writing Center staff members can often be available to help facilitate peer response. Peer review activities can be brief. For example:
students might be asked to complete a concept map to provide feedback on the thesis and arguments used to support it; as students are in the process of writing a paper they might be asked about one element of the writing process such as quality of sources used to support an argument. A brief computer-based assignment could then be used to help students assess quality of a source used in a paper based on clear criteria shared by the instructor. Peers might be asked to apply a short rubric to one page or one sub-section of another student’s paper.
There are many techniques that provide peer feedback on writing assignments, and many can take as little as 10-15 minutes. What concerns do faculty who teach WRITD courses have about revision and quality of first and final papers? Faculty survey responses identified some of the following as areas of concern in first drafts of student papers: structure within paper or essay, development of thesis or argument, and quality of evidence used. Similarly, when asked about concerns regarding final drafts of papers these same issues were mentioned, although less frequently. This reinforces the idea that quality feedback, from both instructors and peers, could be of value.

25
The literature suggests many students find brief feedback at varied intervals to be of value as opposed to feedback on “one complete draft” of a paper or essay. Perhaps it is easier for faculty to write specific expectations and to provide examples of ways to improve the quality of an argument or structure within a paper when they choose to comment on one section of a paper or essay (or provide feedback on one aspect of revision rather than revision of multiple problems within a paper). Quality and specificity of comments and suggestions multiple times during the writing process may help students revise a paper and improve overall quality of writing. Studies also suggest that conferencing with individual students during the semester can improve quality of revision. This technique can help faculty determine which students do/do not understand peer/instructor comments and guidelines on papers, and provide individual assistance with the writing process. Clarity of expectations for assignments is also needed within course syllabus/writing materials. Although we cannot assess how many faculty convey expectations regarding assignments verbally, additional detail within writing materials may promote student understanding of expectations. Without doubt, time is always a concern and we offer these recommendations with the understanding that being cognizant of faculty time is important. V. Challenges Within the Assessment Process
• Lack of appropriate guidelines and direction for college-level Writing Across the Curriculum assessment beyond use of a portfolio by some colleges. There simply is no widely used process for assessing writing across the curriculum. Without doubt, assessing writing is a highly subjective and qualitative process.
• Lack of relevant tools or instruments to facilitate interpretation of information-gathering elements such as writing course syllabi and writing materials.
• Absence of valid and reliable surveys to assess student knowledge and perception of writing.
• Absence of valid and reliable faculty post-course surveys related to teaching writing across the curriculum.
• Low interrater reliability when multiple readers applied the rubric to the same set of papers.
• The variation within writing assignments in 200 and 300 level WRITD courses, and the difficulty this creates in choosing a rubric and applying it to papers in a cross-disciplinary program such as Writing Across the Curriculum.
• Time commitment for members of WPAC and the director of WAC. • The need for a multi-phase writing assessment that spans four years to truly understand
the impact of WRIT courses on student writing, and the difficulties this creates including maintaining a viable sample, maintaining records regarding paper submissions, and other logistics of the process.
• Maintaining a high student sample for pre and post-course surveys required numerous emails and follow-up contacts.
Securing faculty participation, submission by faculty of WRITD course documents and student sample papers, and collection of faculty post-course surveys were NOT challenges. Faculty members that participated in the assessment process were very accommodating and helpful.

26
VI. Final Recommendations and Thoughts Results of the WAC Assessment suggest that students within the 20 sample WRITD courses are being positively impacted by the WRITD program and in fact, are very capable writers. During 2011-2012, the director of writing and members of WPAC may wish to consider ways to use results of the assessment process to further discussion among faculty, strengthen the WRITD program and provide support to faculty who teach writing courses.
• Provide faculty development opportunities with a clear focus on strengths and areas for improvement in student writing. Having data that identifies those strengths and areas for improvement can help focus faculty development on actual student needs.
• Consider the time and possible compensation for such faculty development opportunities carefully. January Term and June are times when faculty might be more likely to participate.
• Assessment results will also be invaluable in stimulating serious faculty conversation about the criteria for WRITD and WRITI courses, which are very brief and difficult to interpret in their existing format. Discussions might begin within WPAC, and then include faculty who currently teach WRITD/WRITI courses. An open meeting for all faculty to share ideas is also recommended.
• Other conversations with faculty might focus on ways to ensure that WRITI and WRITD courses address the appropriate criteria; perhaps some consideration of a re-approval cycle might be worthwhile.
• The results of the assessment can also be used to inform the Teachers Talking Writing program offered to faculty members. It would be very helpful to focus each session on one learner outcome, the results from the study, and then engage faculty in discussion of ways to address areas for improvement.
• The results of the assessment will also help WPAC focus their attention on ways to further improve student writing at Gustavus. It would be useful to discuss possible modifications to the assessment process in order to make it even more effective during Phase II and III.
The Director of WAC (2008-2011) and members of WPAC (2009-2011) would like to thank all faculty who participated in the assessment process. Their input was invaluable in so many ways, and they were both gracious and supportive as the process evolved. Similarly, students were very willing to participate in the assessment through completion of surveys and submitting papers. Appreciation in the form of follow-up emails was expressed to each student as they completed tasks. This first formal attempt to assess student writing at Gustavus, and the impact of WRITD courses on student writing, clearly suggests that the majority of students possess sound writing skills and that they are engaged in writing across the disciplines. Additionally, the assessment process shows that WRITD courses are positively impacting student writing in many ways. The Writing Across the Disciplines assessment process also provides a sound foundation for thinking about ways to further improve the program and student writing. During 2011-2012, opportunities for faculty discussion and development can be based on actual data gathered from both faculty and students. Hopefully, data summaries and recommendations will provide direction for the writing across the curriculum program, and what was learned about assessment of writing can be further refined as part of Phase 2 and 3 of the assessment process.

27
Appendix A Results – Student Pre-Course Survey WRITD ASSESSMENT FALL 2010 Prepared by Carolyn Pillers Dobler

28
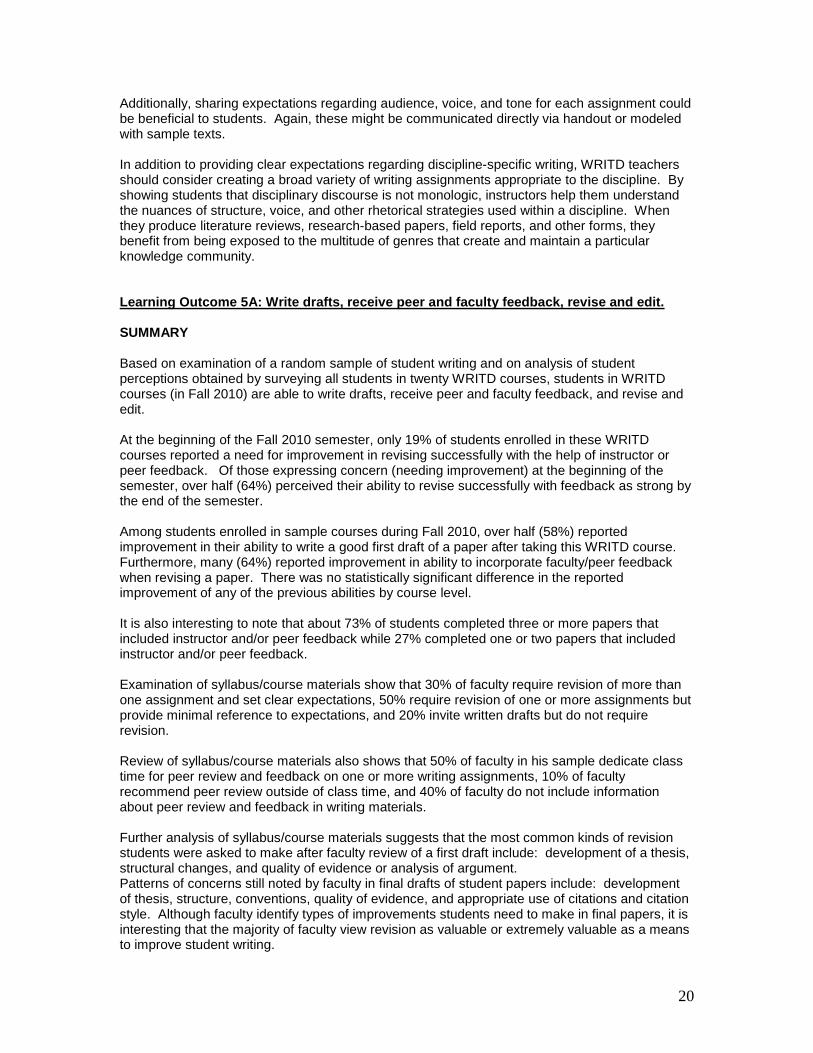
1. When you complete high school and began your FTS college level writing course, how well prepared did you feel for college-level writing? Level Count Percentage Not Prepared 10 4.6% Somewhat Prepared 60 27.7% Prepared 83 38.2% Well-Prepared 64 29.5% Total 217 100.0% Number Missing: 33 2. As you complete this WRITD course, how do you rate the following aspects of your writing? State a clear thesis and properly develop an argument. Response Count Percentage Needs significant improvement 1 0.4% Needs some improvement 60 26.8% Strong 109 48.7% Very Strong 54 24.1% Total 224 100.00 Number missing: 26 Find, evaluate, and select primary and secondary sources. Response Count Percentage Needs significant improvement 2 0.9% Needs some improvement 57 25.6% Strong 112 50.2% Very Strong 51 22.9% Not Sure 1 0.4% Total 223 100.0% Number missing: 30 Effectively integrate and cite primary and secondary sources as evidence within a paper. Response Count Percentage Needs significant improvement 2 0.9% Needs some improvement 43 19.5% Strong 121 55.0% Very Strong 53 24.1% Not Sure 1 0.5% Total 220 100.0% Number missing: 30 Use convention such as grammar and mechanics appropriately to produce clear, concise writing. Response Count Percentage Needs significant improvement 5 2.2% Needs some improvement 48 21.4% Strong 91 40.6%
29
Very Strong 78 34.8% Not Sure 2 0.9% Total 224 100.0% Number missing: 26 Write effective sentences and paragraphs. Response Count Percentage Needs significant improvement 2 0.9% Needs some improvement 60 27.0% Strong 117 52.7% Very Strong 43 19.4% Total 222 100.0% Number missing: 28 Effectively structure a paper to enhance clarity for readers. Response Count Percentage Needs significant improvement 2 0.9% Needs some improvement 60 27.0% Strong 117 52.7% Very Strong 43 19.4% Total 222 100.00% Number missing: 28 Avoid use of clichés and phrases that generalize. Response Count Percentage Needs significant improvement 3 1.3% Needs some improvement 54 24.1% Strong 116 51.8% Very Strong 45 20.1% Not Sure 6 2.7% Total 224 100.0% Number missing: 26 Make effective choices regarding voice and language to suit the needs of specific audiences. Response Count Percentage Needs significant improvement 2 0.9% Needs some improvement 54 24.2% Strong 116 52.0% Very Strong 46 20.6% Not Sure 5 2.2% Total 223 100.0% Number missing: 27 Revise successfully with the help of instructor or peer feedback. Response Count Percentage Needs significant improvement 6 2.7% Needs some improvement 37 16.5% Strong 121 54.0%

30
Very Strong 56 25.0% Not Sure 4 1.8% Total 224 100.0% Number missing: 26 3. When you enroll in a course that satisfies a WRITD general education requirement, what do you expect to learn? 4. How do you feel about writing within your college courses? Response Count Percentage I do not enjoy writing in college courses. 18 8.0% I don’t mind writing within college courses provided the topic is of interest. 139 62.1%
I generally enjoy writing projects and assignments within college courses. 67 29.9%
Total 224 100.0% Number missing: 26 5. How do you feel about writing outside of college courses (letters, web pages, poetry, or other forms of writing)? Response Count Percentage I do not enjoy writing outside of college courses. 28 12.5% I don’t mind writing outside of college courses. 88 39.3% I generally enjoy writing outside of college courses. 108 48.2% Total 224 100.0% Number missing: 26 6. Since beginning college, how many papers of each length have you written in college courses?
Number of Papers Short (5 pages or less) Medium (6-10 pages) Long (11 or more
pages) 0-10 33 150 196 10-20 67 61 8 20-30 59 5 30-40 26 1 40-50 6 1 More than 50 30 2 7. How many college writing courses have you completed for each category listed below? Number of Courses
WRITD WRITI Don’t know diff Count Percentage Count Percentage Count Percentage
0 63 38.0% 14 8.2% 13 20.6% 1 56 33.7% 81 47.6% 5 7.9%

31
2 32 19.3% 55 32.4% 1 1.6% 5 8 4.8% 12 7.1% 6 9.5% 4 5 3.0% 4 2.4% 11 17.5% 5 2 1.2% 4 2.4% 6 9.5% 6 3 4.8% 7 1 1.6% Total 166 100.0% 170 100.0% 63 100.0% DEMOGRAPHIC INFORMATION: Major Count Percentage Accounting 3 1.3% Chemistry-ACS 4 1.7% Art Education 3 1.3% Art History 3 1.3% Athletic Training 1 0.4% Biochemistry and Molecular Biology 3 1.3% Biology 22 9.4% Chemistry 2 0.8% Classics 2 0.8% Communication Studies 21 9.0% Communication Arts/Literature Education 3 1.3% Computer Science 3 1.3% Economics 1 0.4% English 25 10.7% Financial Economics 4 1.7% Gender, Women, and Sexuality Studies 2 0.8% Geography 7 3.0% Health and Physical Education 5 2.1% Health Fitness 4 1.7% History 16 6.8% International Management 1 0.4% Management 9 3.8% Mathematics 7 3.0% Music 10 4.3% Music Education 1 0.4% Nursing 2 0.8% Philosophy 6 2.6% Physics 4 1.7% Political Science 10 4.3% Psychology 17 7.3% Religion 7 3.0% Scandinavian Studies 2 0.8% Secondary Education Social Studies 7 3.0% Secondary Education Life Science 2 0.8% Theatre 1 0.4% Undecided/Undeclared 7 3.0% Year in School Count Percentage First Year 1 0.4% Sophomore 48 19.9% Junior 74 30.7% Senior 118 49.0%

32
241 100.0% 9 missing Appendix B: Results-Student Post-Course Survey

33
WRITD ASSESSMENT FALL 2010 Prepared by Carolyn Pillers Dobler 1. When you complete high school and began your FTS college level writing course, how well prepared did you feel for college-level writing? Level Count Percentage Not Prepared 16 7.8% Somewhat Prepared 62 30.1% Prepared 73 35.4% Well-Prepared 55 26.7% Total 206 100.0% Number Missing: 16 2. As you complete this WRITD course, how do you rate the following aspects of your writing? State a clear thesis and properly develop an argument. Response Count Percentage Needs significant improvement 3 1.4% Needs some improvement 50 23.9% Strong 85 40.7% Very Strong 67 32.1% Not Sure 4 1.9% Total 209 100.0% Number missing: 13 Find, evaluate, and select primary and secondary sources. Response Count Percentage Needs significant improvement 3 1.4% Needs some improvement 35 16.7% Strong 95 45.5% Very Strong 73 34.9% Not Sure 3 1.4% Total 209 100.0% Number missing: 13 Effectively integrate and cite primary and secondary sources as evidence within a paper. Response Count Percentage Needs significant improvement 1 0.5% Needs some improvement 32 15.4% Strong 92 44.2% Very Strong 77 37.0% Not Sure 6 2.9% Total 208 100.0% Number missing: 14 Use convention such as grammar and mechanics appropriately to produce clear, concise writing. Response Count Percentage Needs significant improvement 5 2.4% Needs some improvement 48 23.0%

34
Strong 74 35.4% Very Strong 77 36.8% Not Sure 5 2.4% Total 209 100.0% Number missing: 13 Write effective sentences and paragraphs. Response Count Percentage Needs significant improvement Needs some improvement 33 15.9% Strong 93 44.7% Very Strong 76 36.5% Not Sure 6 2.9% Total 208 100.0% Number missing: 14 Effectively structure a paper to enhance clarity for readers. Response Count Percentage Needs significant improvement Needs some improvement 44 21.1% Strong 100 48.1% Very Strong 57 27.4% Not Sure 7 3.4% Total 208 100.0% Number missing: 14 Avoid use of clichés and phrases that generalize. Response Count Percentage Needs significant improvement Needs some improvement 39 18.8% Strong 98 47.1% Very Strong 63 30.3% Not Sure 8 3.8% Total 208 100.0% Number missing: 14 Make effective choices regarding voice and language to suit the needs of specific audiences. Response Count Percentage Needs significant improvement 1 0.5% Needs some improvement 39 18.8% Strong 97 46.9% Very Strong 61 29.5% Not Sure 9 4.3% Total 207 100.0% Number missing: 15 Revise successfully with the help of instructor or peer feedback. Response Count Percentage Needs significant improvement 4 1.9% Needs some improvement 31 15.0%
35
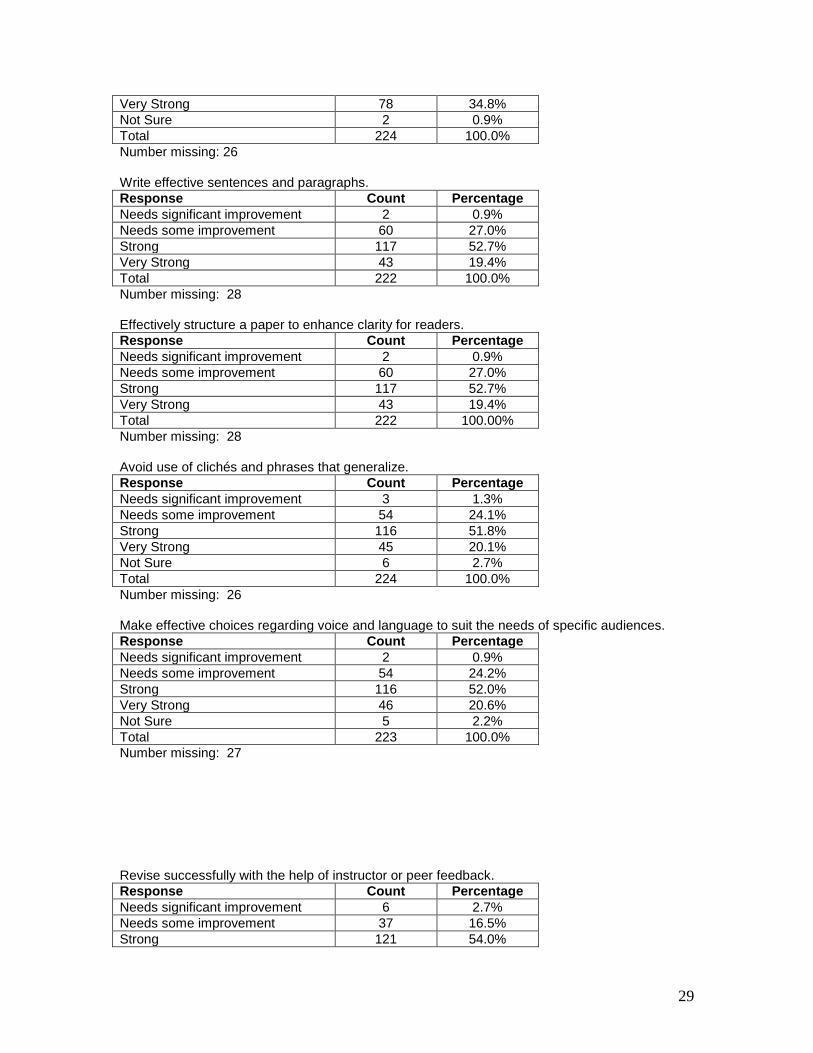
Strong 95 45.9% Very Strong 70 33.8% Not Sure 7 3.4% Total 207 100.0% Number missing: 15 3. As you complete this WRITD course, what do you view as the major areas for improvement within your writing? DATA ANALYSIS FOR THIS QUESTION STILL IN PROGRESS. 4. After completing this WRITD course, my ability to recognize different kinds of writing (informative, creative, scholarly, etc) within this discipline has…. Response Percentage Count Level 2 Level 3 Decreased Stayed the Same 43.48% 90 42 48 Improved 51.69% 107 48 58 Significantly Improved 4.83% 10 6 4 Total 100.00% 207 96 110 5. After completing this WRITD course, my ability to make appropriate choices in purpose, content, and style of writing within this discipline has… Response Percentage Count Level 2 Level 3 Decreased 0.48% 1 1 Stayed the Same 25.60% 53 22 31 Improved 66.18% 137 68 68 Significantly Improved 7.73% 16 6 10 Total 100.00% 207 96 110 6. After completing this WRITD course, my ability to analyze and create arguments, explain, and persuade within this discipline has….” Response Percentage Count Level 2 Level 3 Decreased 1.92% 4 1 2 Stayed the Same 24.52% 51 26 25 Improved 61.54% 128 58 69 Significantly Improved 12.02% 25 11 14 Total 100.00% 208 96 110 7. After completing this WRITD course, my knowledge and understanding of styles of writing within this discipline has... Response Percentage Count Level 2 Level 3 Decreased 0.49% 1 1 Stayed the Same 24.76% 51 22 29 Improved 66.50% 137 67 69 Significantly Improved 8.25% 17 6 11 Total 100.00% 206 96 109 8. After completing this WRITD course, my ability to read and interpret professional discipline-specific articles and literature has…. Response Percentage Count Level 2 Level 3 Decreased .48% 1 1

36
Stayed the Same 25.12% 52 25 27 Improved 63.77% 132 60 72 Significantly Improved 10.63% 22 11 10 Total 100.00% 207 96 110 9. Having completed this WRITD course, my ability to find, evaluate, and incorporate appropriate resources to support the thesis/premise/points of view within a paper has… Response Percentage Count Level 2 Level 3 Decreased .97% 2 1 1 Stayed the Same 33.82% 70 33 37 Improved 54.11% 112 53 58 Significantly Improved 11.11% 23 9 14 Total 100.00% 207 96 110 10. After completing this WRITD course, my ability to use discipline-specific conventions (structure, style of writing, grammar, etc) has...” Response Percentage Count Level 2 Level 3 Decreased .49% 1 1 Stayed the Same 37.86% 78 36 42 Improved 52.91% 109 48 60 Significantly Improved 8.74% 18 11 7 Total 100.00% 206 96 109 11. Having completed this WRITD course, my ability to write a good first draft of a paper has…. Response Percentage Count Level 2 Level 3 Decreased 1.93% 4 1 3 Stayed the Same 36.72% 76 39 37 Improved 55.07% 114 51 62 Significantly Improved 6.28% 13 5 8 Total 100.00% 207 96 110 12. Having completed this WRITD course, my ability to incorporate faculty/peer feedback when revising a paper has...” Response Percentage Count Level 2 Level 3 Decreased 9.71% 2 1 1 Stayed the Same 29.61% 61 33 28 Improved 56.80% 117 49 68 Significantly Improved 12.62% 26 12 13 Total 100.00% 206 95 110 13. Within this WRITD course, I received either faculty and/or peer feedback on ___ number of writing assignments.” Response Percentage Count Level 2 Level 3 1-2 26.44% 55 22 32 3-4 52.40% 109 54 54 5 or more papers 21.15% 44 19 25 Total 100.00% 208 95 111

37
14. For writing assignments within this WRITD course, I used services provided by the Writing Center. Response Count Percentage Did not use services provided by the Writing Center 178 85.2% Once 15 7.2% Twice 8 3.8% Three or more times 8 3.8% Total 209 100.0% Number missing: 13 15. If you did not use services provided by the Writing Center, why did you choose not to visit the Writing Center? Response Count Did not know what services they provide 16 Felt confident about my writing without assistance outside of class 120 Thought it would take too much time to use services provided by the WC 46 Would have felt embarrassed about going to the WC 11 16. Having completed this WRITD course, my ability to write for multiple audiences across disciplines has… Response Percentage Count Level 2 Level 3 Decreased 1.45% 3 3 Stayed the Same 48.79% 101 46 55 Improved 45.89% 95 46 48 Significantly Improved 3.86% 8 4 4 Total 100.00% 207 96 110 17. Having completed this WRITD course, my ability to write for audiences within my discipline has... Response Percentage Count Level 2 Level 3 Decreased Stayed the Same 33.82% 70 31 39 Improved 60.87% 126 59 66 Significantly Improved 5.31% 11 6 5 Total 100.00% 207 96 110 18. Having completed this WRITD course, my ability to write clearly and concisely has… Response Percentage Count Level 2 Level 3 Decreased 1.0% 2 Stayed the Same 33.7% 69 Improved 59.0% 121 Significantly Improved 6.3% 13 Total 100.00% 205

38
19. This WRITD course helped me… Response Count Percentage Address one of the areas for improvement needed within my writing 63 30.1%
Address two of the areas for improvement needed within my writing 46 22.0%
Make significant improvement in my writing 76 36.4% Make very little improvement in my writing 24 11.5% Total 209 100.0% Number missing: 13 20. Now that you have completed this WRITD course, how do you feel about writing within your college courses? Response Count Percentage I do not enjoy writing in college courses. 16 7.6% I don’t mind writing within college courses provided the topic is of interest. 122 58.4%
I generally enjoy writing projects and assignments within college courses. 71 34.0%
Total 209 100.0% Number missing: 13 DEMOGRAPHIC INFORMATION: Major Count Percentage Accounting 2 1.0% Chemistry-ACS 3 1.4% Art Education 3 1.4% Art History 3 1.4% Athletic Training Biochemistry and Molecular Biology 2 1.0% Biology 18 8.6% Chemistry 3 1.4% Classics 2 1.0% Communication Studies 18 8.6% Communication Arts/Literature Education 2 1.0% Computer Science 3 1.4% Economics 3 1.4% English 21 10.0% Financial Economics 3 1.4% Gender, Women, and Sexuality Studies 1 0.5% Geography 6 2.9% Health and Physical Education 5 2.4% Health Fitness 3 1.4% History 11 5.3% International Management 5 2.4% Management 15 7.7% Mathematics 4 1.9% Music 11 5.3% Music Education 4 1.9% Nursing Philosophy 1 0.5%

39
Physics 2 1.0% Political Science 12 5.7% Psychology 14 6.7% Religion 5 2.4% Scandinavian Studies 1 0.5% Secondary Education Social Studies 3 1.4% Secondary Education Life Science 2 1.0% Sociology/Anthropology 1 0.5% Theatre 3 1.4% Undecided/Undeclared 4 1.9% Year in School Count Percentage First Year 1 0.5% Sophomore 36 17.1% Junior 73 34.8% Senior 100 47.6% 210 100.0%

40
Appendix C: STUDENT: SURVEY RESULTS--PRE-POST COMPARISONS WRITD ASSESSMENT Fall 2010 Prepared by Carolyn Pillers Dobler Change in pre-survey and post-survey responses (matched pairs)
Count Percentage Improve 27 29.7% No change 94 54.7% Decline 51 15.7%
Count Percentage Improve 29 39.5% No change 75 43.6% Decline 68 16.9%
Count Percentage Improve 21 37.3% No change 85 50.3% Decline 63 12.4%
Count Percentage
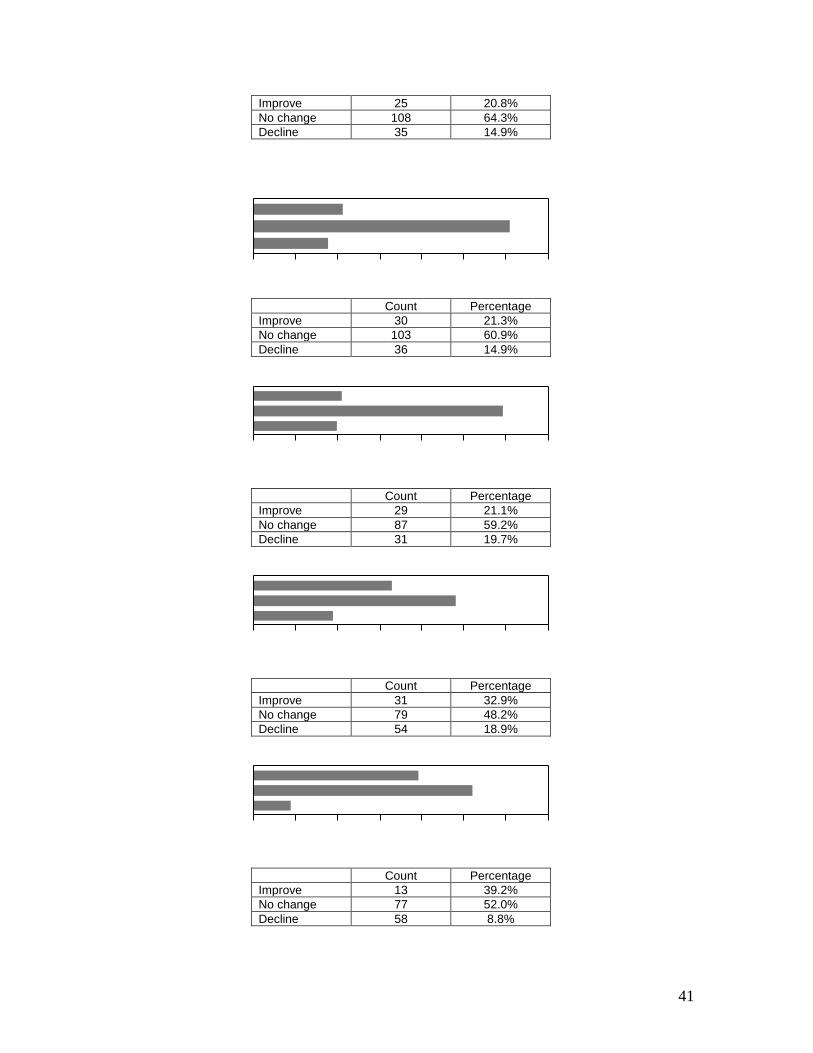
41
Improve 25 20.8% No change 108 64.3% Decline 35 14.9%
Count Percentage Improve 30 21.3% No change 103 60.9% Decline 36 14.9%
Count Percentage Improve 29 21.1% No change 87 59.2% Decline 31 19.7%
Count Percentage Improve 31 32.9% No change 79 48.2% Decline 54 18.9%
Count Percentage Improve 13 39.2% No change 77 52.0% Decline 58 8.8%

42
SUMMARY OF RESPONSES
1 rows excluded

43
1 rows excluded
2 rows excluded
1 rows excluded
2 rows excluded

44
2 rows excluded
1 rows excluded
1 rows excluded
3 rows excluded
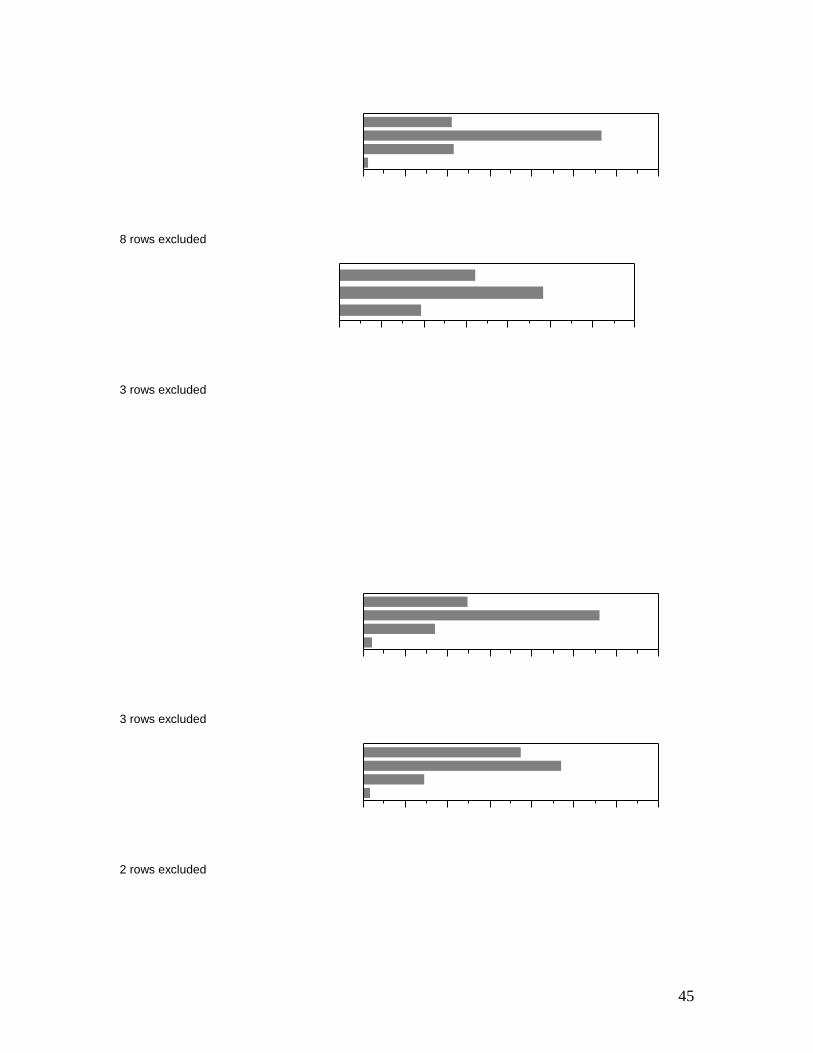
45
8 rows excluded
3 rows excluded
3 rows excluded
2 rows excluded

46
APPENDIX D: STUDENT: RUBRIC REVIEW OF FINAL DRAFTS WRITD ASSESSMENT FALL 2010 Prepared by Carolyn Pillers Dobler Context and Purpose of Writing (appropriately considers audience; purpose is clear) Level of Achievement Percent Count Level 2 Level 3 Paper does not adequately address or difficult to discern Addressed with little detail or clarity 14.29% 8 5 3 Adequately addressed with some detail and clarity 60.71% 34 14 20 Mastery is evident 25.00% 14 7 7 100.00% 56 26 30 NOTE: There is no statistically significant difference in the proportions of level of achievement of Context and Purpose by Course Level (χ2=1.28, P=0.53, df =2) Content Development (Uses appropriate content to illustrate mastery of the subject; coherence and continuity evident) Level of Achievement Percent Count Level 2 Level 3 Paper does not adequately address or difficult to discern
Addressed with little detail or clarity 16.07% 9 7 2 Adequately addressed with some detail and clarity 44.64% 25 15 10 Mastery is evident 39.29% 22 4 18 100.00% 56 26 30 NOTE: There is a statistically significant difference in the proportions of level of achievement of Content Development by Course Level (χ2=12.47, P=0.002, df =2) Genre and Disciplinary Conventions (appropriate use of conventions within the discipline/writing task including organization, content, format, and style) Level of Achievement Percent Count Level 2 Level 3 Paper does not adequately address or difficult to discern Addressed with little detail or clarity 10.71% 6 5 1 Adequately addressed with some detail and clarity 60.71% 34 17 17 Mastery is evident 28.57% 16 4 12 100.00% 56 26 30 NOTE: There is a statistically significant difference in the proportions of level of achievement of Genre and Disciplinary Conventions by Course Level (χ2=6.41, P=0.04, df =2)

47
Sources and Evidence (appropriate support for arguments, using quality sources) Level of Achievement Percent Count Level 2 Level 3 Paper does not adequately address or difficult to discern
Addressed with little detail or clarity 22.00% 11 9 2 Adequately addressed with some detail and clarity 40.00% 20 11 9 Mastery is evident 38.00% 19 3 16 100.00% 50 23 27 NOTE: There is a statistically significant difference in the proportions of level of achievement of Sources and Evidence by Course Level (χ2=13.31, P=0.001, df =2) Control of Syntax and Mechanics (appropriate voice, clarity, readability, and conventions) Level of Achievement Percent Count 200 300 Paper does not adequately address or difficult to discern
Addressed with little detail or clarity 12.50% 7 5 2 Adequately addressed with some detail and clarity 67.86% 38 17 21 Mastery is evident 19.64% 11 4 7 100.00% 56 26 30 NOTE: There is no statistically significant difference in the proportions of level of achievement of Control of Syntax and Mechanics by Course Level (χ2=2.25, P=0.32, df =2)

48
APPENDIX E: Faculty Survey Results WRITD ASSESSMENT FALL 2010 Prepared by Carolyn Pillers Dobler 1. How well prepared were the students within your class to do the work associated with WRITD? Response Count Percentage Well-prepared 4 20% Adequately prepared 9 45% Inadequately prepared 1 5% Varied too much to generalize 6 30% Total 20 100% 2. What kinds of discipline-specific writing did you ask students to review Count Research-based academic paper or article 12 Literature review 2 Lab or field report 2 Case study paper 2 Reflective paper or journal 1 Assessment of film, text, etc 6 Poetry or other literary text (primary) 4 and how did you introduce these examples? Count Textbook 5 Lesson or unit plan 1 Blogs 1 3. How well did the writing assignments within this course enable students to practice disciplinary conventions? Response Count Appropriate voice 1 Clarity of structure within paper 13 Writing for certain audience 7 Appropriate use of language within discipline 5 Citations and references used appropriately 6

49
4. What types of resources were used to support the teaching of writing conventions within this course? Response Count Primarily web sources 4 Writing handbook 13 Written examples provided to illustrate conventions 10 WC 2 Conference 2 5. Please describe the cycle of feedback and revision used within this course? Response Count Instructor feedback on one assignment with required revision 5 Instructor feedback on two or more assignments with required revision
11
Instructor feedback optional on one or more assignments, revision optional
3
Peer feedback required on one or more assignments 10 6. Please describe the most common kinds of revisions students were asked to make after you reviewed first draft assignments, Response Count Development of thesis or argument 12 Use of appropriate voice 1 Use of language appropriate to audience 3 Structure within paper or essay 11 Quality of evidence used or analysis 9 Use of appropriate citations and citation style 2 Quality of introduction 2 Quality of closure 2 Convention (syntax, grammar, etc) 5 and then comment on how valuable revision is in improving student writing in this course. Response Count Little value 0 Some value 1 Valuable 2 Extremely valuable 9

50
7. Please describe any patterns of concerns/writing problems that were still evident in final drafts of papers written by students within your course. Response Count Development of thesis or argument 9 Use of appropriate voice 1 Use of language appropriate to audience 2 Structure within paper or essay 8 Quality of evidence used 4 Use of appropriate citations and citation style 4 Quality of introduction 0 Quality of closure 2 Convention (sentence level) 5 8. How well prepared did you feel to teach the writing and revision process within this WRITD course? Response Count Not very well-prepared 1 Somewhat prepared 4 Well-prepared 10 Very well-prepared 3 9. What types of faculty development opportunities would be of value in helping you work with students to improve their writing? Response Count Peer feedback opportunities 1 Use of writing rubrics 2 Responding to student writing 2 10. Did you choose to include any language regarding services associated with the Writing Center within your syllabus or otherwise refer students to the WC? Response Count No information provided 3 Mentioned as an option 9 Discussed services provided by WC 6 Referred one or more students 5

51
APPENDIX F: FACULTY: REVIEW OF SYLLABUS AND COURSE MATERIALS RESULTS WRITD ASSESSMENT FALL 2010 Prepared by Carolyn Pillers Dobler Based on the examination of the syllabus/course materials provided, to what degree is the nature of discipline-specific writing addressed within the course syllabus and materials? Response Count Percentage Included or mentioned without description 4 20% Briefly described 5 25% Described with expectations regarding discipline-specific writing clearly stated
11 55%
Total 20 100% Clarity of assignment descriptions based on syllabus materials. Response Count Percentage Lacks clarity in terms of expectations; examples not provided 3 15% Directions are clear but sub-sections may not adequately convey expectations
6 30%
Directions and expectations are clear and examples are provided 11 55% Total 20 100% Within the syllabus/other materials provided, what expectations regarding writing conventions/structure are conveyed to the students? Describes the purpose of the assignment. Level Count Percentage Not addressed in syllabus/assignments 4 20% Mentioned without detail 0 Explained in detail 16 80% Total 20 100% Describes expectations concerning audience. Level Count Percentage Not addressed in syllabus/assignments 3 15% Mentioned without detail 1 5% Explained in detail 16 80% Total 20 100%

52
Within the syllabus/other materials provided, what expectations regarding writing conventions/structure are conveyed to the students? (continued) Describes expectations concerning voice and tone. Level Count Percentage Not addressed 6 30% Mentioned without detail 3 15% Explained in detail 11 55% Total 20 100% Describes expectations concerning editing, grammer, and other conventions. Level Count Percentage Not addressed 4 20% Mentioned without detail 1 5% Explained in detail 15 75% Total 20 100% Describes expectations concerning format and length of paper. Level Count Percentage Not addressed 4 20% Mentioned without detail 1 5% Explained in detail 15 75% Total 20 100% Describes expectations concerning citation style (if appropriate to assignment). Level Count Percentage Not addressed 7 35% Mentioned without detail 0 Explained in detail 13 65% Total 20 100% Based on an examination of the syllabus/course materials, what opportunities are there for revision with instructor feedback? Response Count Percentage Revision invited, but not required for one or more assignments 4 20% Revision is required for one or more assignments but there is minimal reference to expectations
10 50%
Revision is required for more than one assignment with clear reference to instructor feedback
6 30%
Total 20 100% Based on an examination of the syllabus/course materials, what opportunities are there for peer feedback on writing? Response Count Prob No information within syllabus/writing assignments related to peer feedback
8 40%
Documents indicate that peer feedback is recommended outside of class time
2 10%
There is dedicated class time for peer feedback on one or more assignments
10 50%