WP4 AWAST Trondheim, June 2002 – ISWA / Cemagref WORKPACKAGE 4 Collection & Transport O....
28
Trondheim, June 2002 – ISWA / Cemagref WP4 AWAST WORKPACKAGE 4 Collection & Transport O. Tabasaran, D. Steinbach, A. Schultheis
-
Upload
thomasine-york -
Category
Documents
-
view
215 -
download
0
Transcript of WP4 AWAST Trondheim, June 2002 – ISWA / Cemagref WORKPACKAGE 4 Collection & Transport O....

Trondheim, June 2002 – ISWA / Cemagref
WP4AWAST
WORKPACKAGE 4
Collection & Transport
O. Tabasaran, D. Steinbach, A. Schultheis
Trondheim, June 2002 – ISWA / Cemagref
WP4AWAST
Collection & Transport
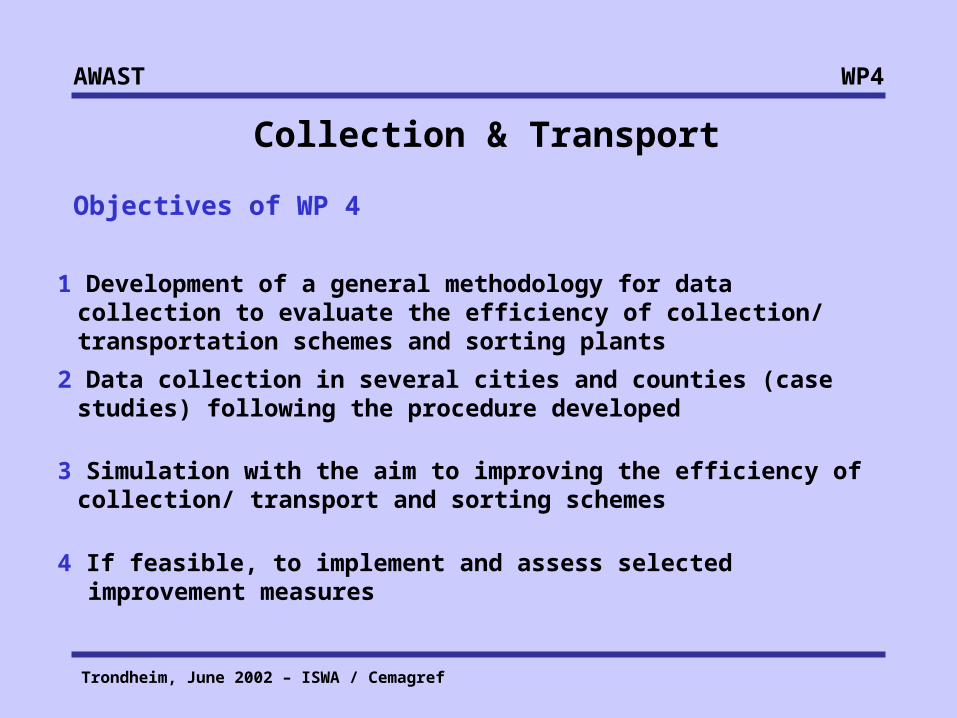
Objectives of WP 4
1 Development of a general methodology for data collection to evaluate the efficiency of collection/ transportation schemes and sorting plants
2 Data collection in several cities and counties (case studies) following the procedure developed
3 Simulation with the aim to improving the efficiency of collection/ transport and sorting schemes
4 If feasible, to implement and assess selected improvement measures
Trondheim, June 2002 – ISWA / Cemagref
WP4AWAST
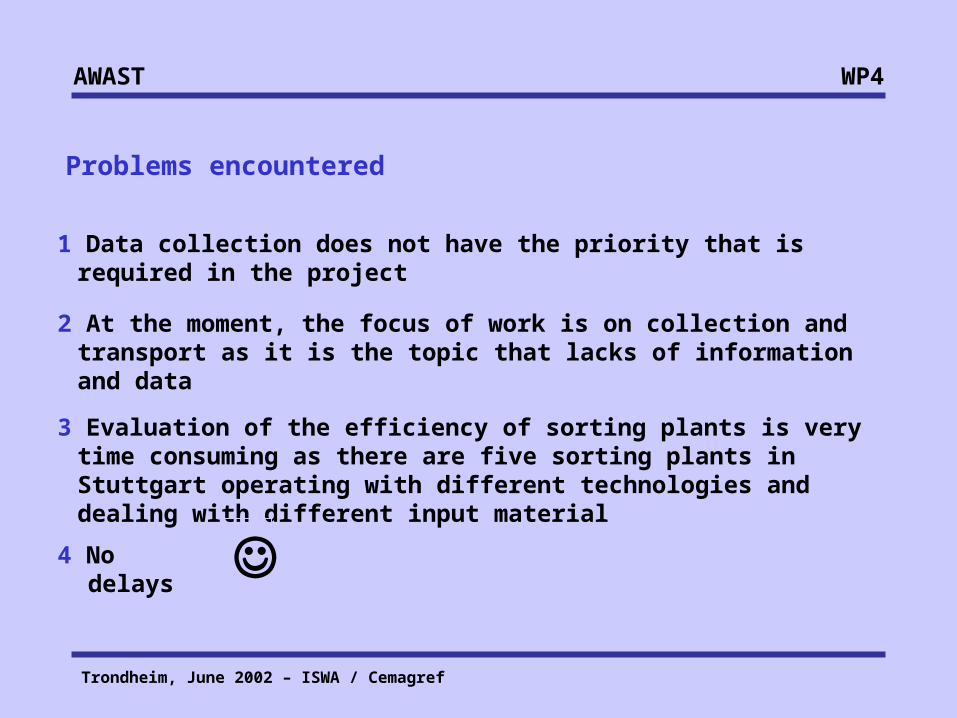
Problems encountered
3 Evaluation of the efficiency of sorting plants is very time consuming as there are five sorting plants in Stuttgart operating with different technologies and dealing with different input material
2 At the moment, the focus of work is on collection and transport as it is the topic that lacks of information and data
1 Data collection does not have the priority that is required in the project
4 No delays
Trondheim, June 2002 – ISWA / Cemagref
WP4AWAST
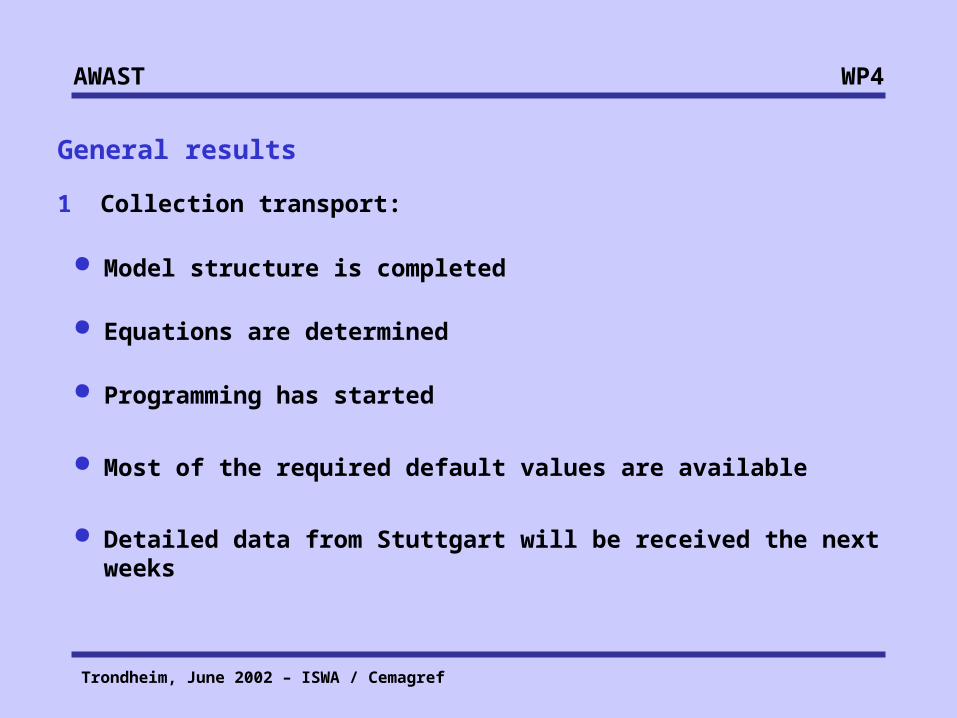
General results
1 Collection transport:
Model structure is completed
Programming has started
Equations are determined
Most of the required default values are available
Detailed data from Stuttgart will be received the next weeks
Trondheim, June 2002 – ISWA / Cemagref
WP4AWAST
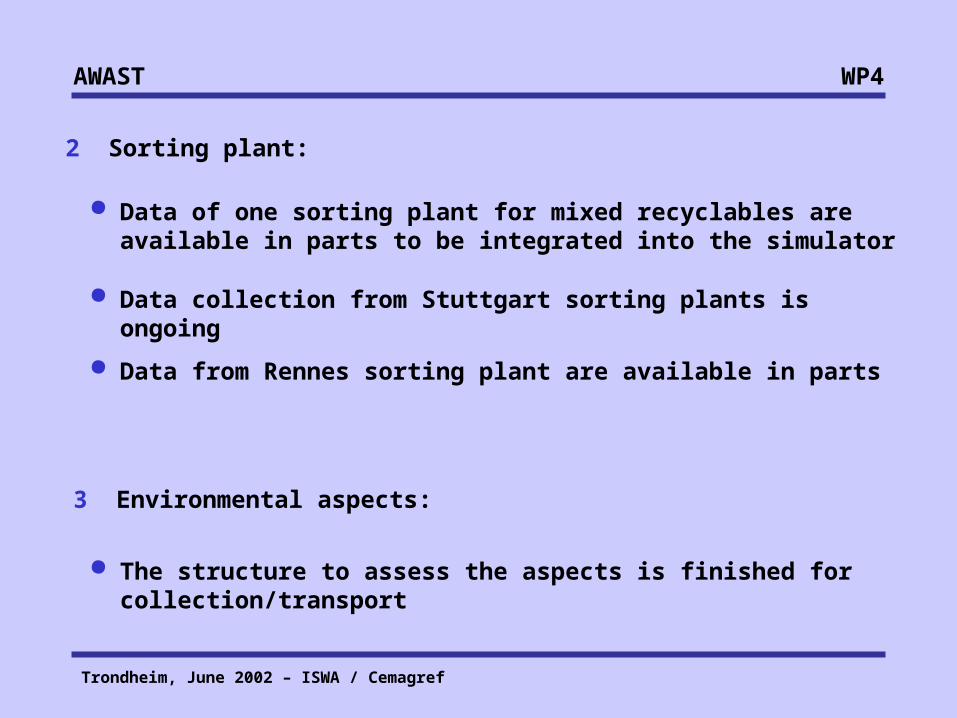
2 Sorting plant:
Data of one sorting plant for mixed recyclables are available in parts to be integrated into the simulator
Data collection from Stuttgart sorting plants is ongoing
3 Environmental aspects:
The structure to assess the aspects is finished for collection/transport
Data from Rennes sorting plant are available in parts
Trondheim, June 2002 – ISWA / Cemagref
WP4AWAST
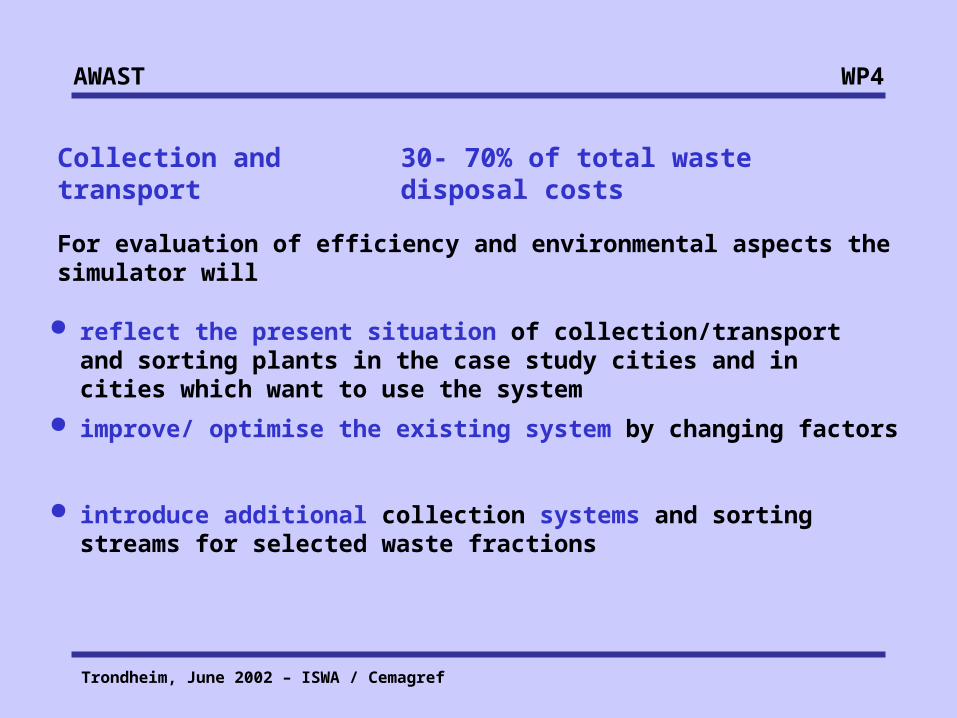
Collection and transport
For evaluation of efficiency and environmental aspects the simulator will
reflect the present situation of collection/transport and sorting plants in the case study cities and in cities which want to use the system
improve/ optimise the existing system by changing factors
introduce additional collection systems and sorting streams for selected waste fractions
30- 70% of total waste disposal costs
Trondheim, June 2002 – ISWA / Cemagref
WP4AWAST
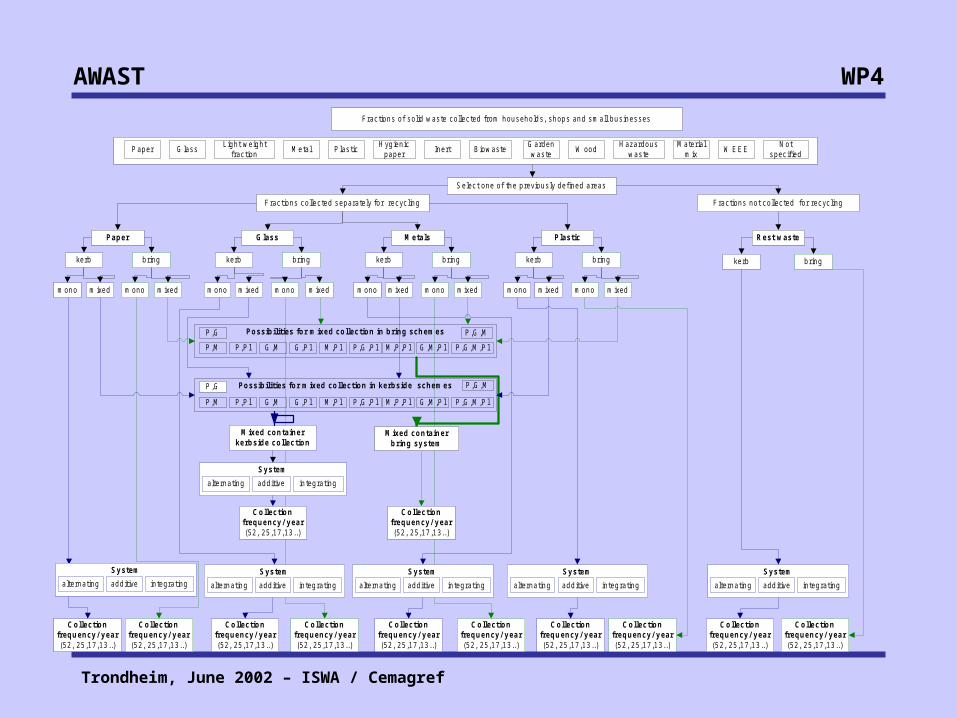
Fractions of solid waste collected from households, shops and small businesses
Select one of the previously defined areas
Fractions collected separately for recycling Fractions not collected for recycling
Paper GlassLight weight
fractionMetal Plastic
Hygienicpaper
Inert BiowasteGardenwaste
W oodHazardous
wasteMaterial
mixW EEE
Notspecified
Rest waste
kerb bring
Paper
kerb
mono
bring
mixed mono mixed
Glass
kerb
mono
bring
mixed mono mixed
M etals
kerb
mono
bring
mixed mono mixed
Plastic
kerb
mono
bring
mixed mono mixed
Possibilities for mixed collection in bring schemesP,G P,G,M
Possibilities for mixed collection in kerbside schemesP,G
M ixed containerkerbside collection
M ixed containerbring system
System
alternating additive integrating
System
alternating additive integrating
System
alternating additive integrating
System
alternating additive integrating
P,M P,Pl G,M G,Pl M,Pl P,G,Pl M,P,Pl G,M,Pl P,G,M,Pl
P,M P,Pl G,M G,Pl M,Pl P,G,Pl M,P,Pl G,M,Pl P,G,M,Pl
P,G,M
Collectionfrequency/ year(52, 25,17,13..)
Collectionfrequency/ year(52, 25,17,13..)
Collectionfrequency/ year(52, 25,17,13..)
Collectionfrequency/ year(52, 25,17,13..)
Collectionfrequency/ year(52, 25,17,13..)
Collectionfrequency/ year(52, 25,17,13..)
Collectionfrequency/ year(52, 25,17,13..)
System
alternating additive integrating
Collectionfrequency/ year(52, 25,17,13..)
Collectionfrequency/ year(52, 25,17,13..)
System
alternating additive integrating
Collectionfrequency/ year(52, 25,17,13..)
Collectionfrequency/ year(52, 25,17,13..)
Collectionfrequency/ year(52, 25,17,13..)
Trondheim, June 2002 – ISWA / Cemagref
WP4AWAST
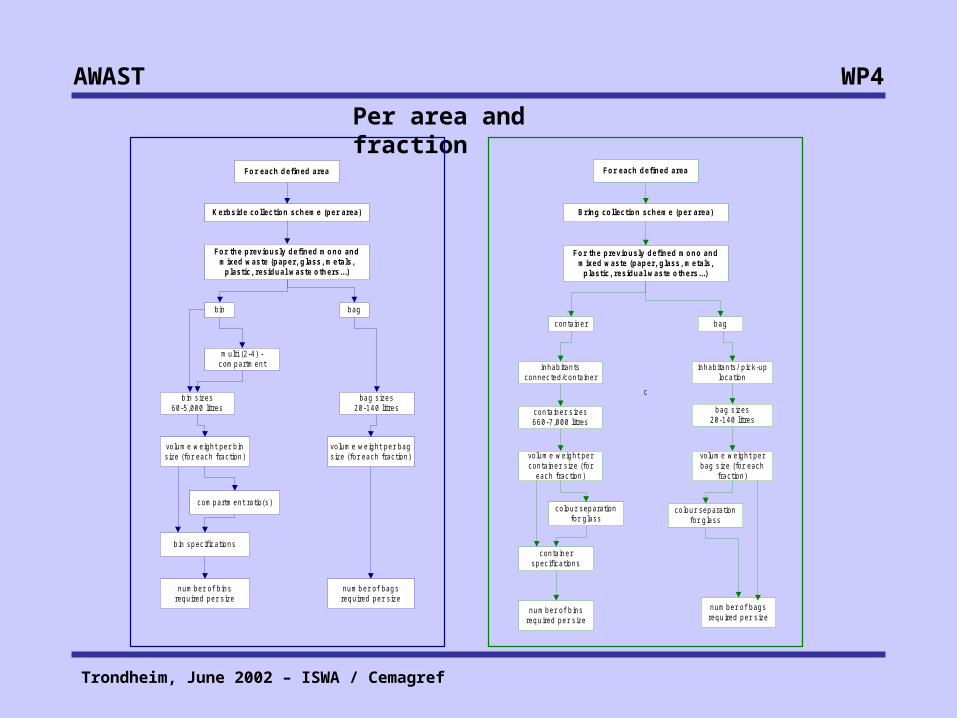
Per area and fraction
c
For the previously defined mono andmixed waste (paper, glass, metals,
plastic, residual waste others...)
For each defined area
Kerbside collection scheme (per area)
volume weight per binsize (for each fraction)
bin bag
multi (2-4) -compartment
bin sizes60-5,000 litres
compartment ratio(s)
bin specifications
number of binsrequired per size
bag sizes20-140 litres
volume weight per bagsize (for each fraction)
number of bagsrequired per size
For the previously defined mono andmixed waste (paper, glass, metals,
plastic, residual waste others...)
For each defined area
Bring collection scheme (per area)
volume weight percontainer size (for
each fraction)
container bag
inhabitantsconnected/container
container sizes660-7,000 litres
colour separationfor glass
containerspecifications
number of binsrequired per size
bag sizes20-140 litres
volume weight perbag size (for each
fraction)
number of bagsrequired per size
inhabitants/ pick-uplocation
colour separationfor glass
Trondheim, June 2002 – ISWA / Cemagref
WP4AWAST
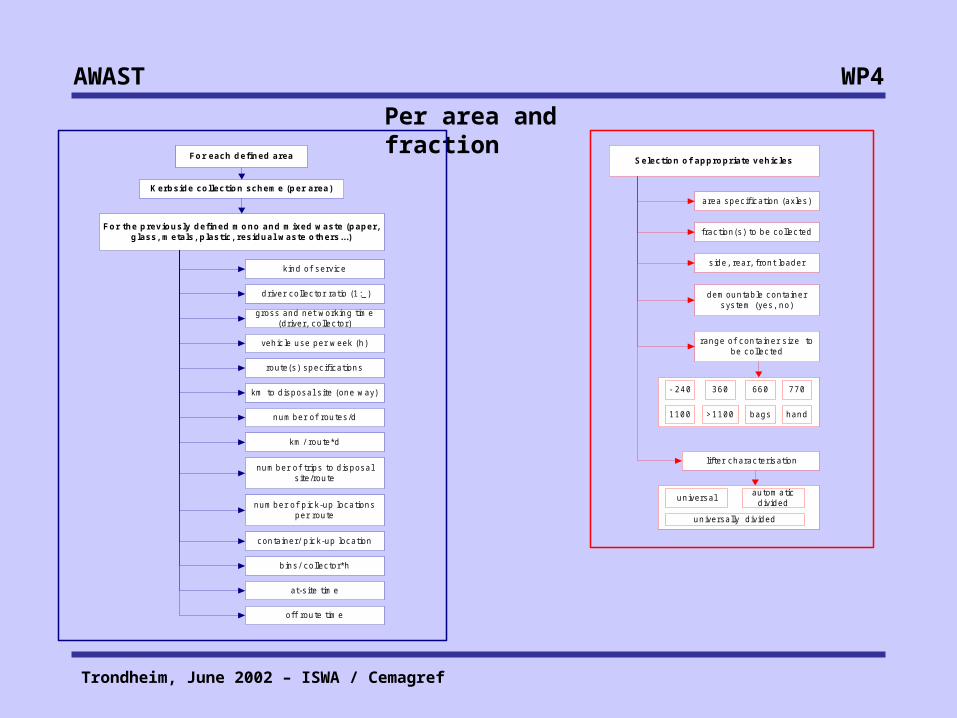
Per area and fraction
For the previously defined mono and mixed waste (paper,glass, metals, plastic, residual waste others...)
For each defined area
Kerbside collection scheme (per area)
kind of service
driver collector ratio (1:_)
gross and net working time(driver, collector)
vehicle use per week (h)
km to disposal site (one way)
km/ route*d
number of routes/d
number of trips to disposalsite/route
number of pick-up locationsper route
container/ pick-up location
at-site time
off route time
route(s) specifications
bins/ collector*h
Selection of appropriate vehicles
area specification (axles)
fraction(s) to be collected
side, rear, front loader
demountable containersystem (yes, no)
range of container size tobe collected
lifter characterisation
automaticdivided
universal
universally divided
- 240 360 660 770
1100 >1100 bags hand
Trondheim, June 2002 – ISWA / Cemagref
WP4AWAST
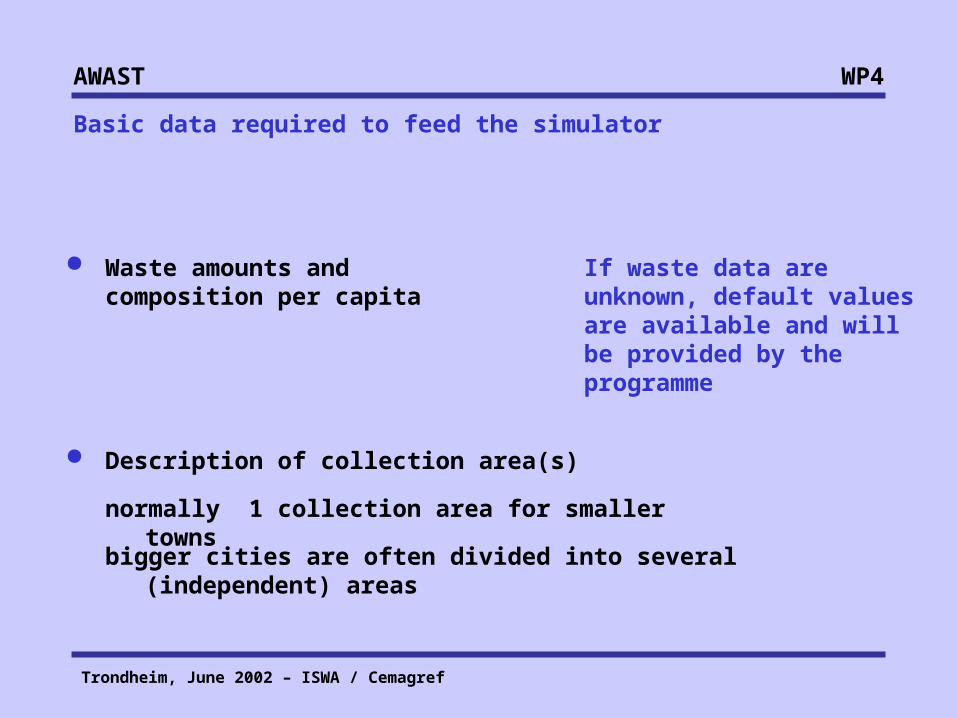
Waste amounts and composition per capita
If waste data are unknown, default values are available and will be provided by the programme
Basic data required to feed the simulator
Description of collection area(s)
normally 1 collection area for smaller towns
bigger cities are often divided into several (independent) areas
Trondheim, June 2002 – ISWA / Cemagref
WP4AWAST
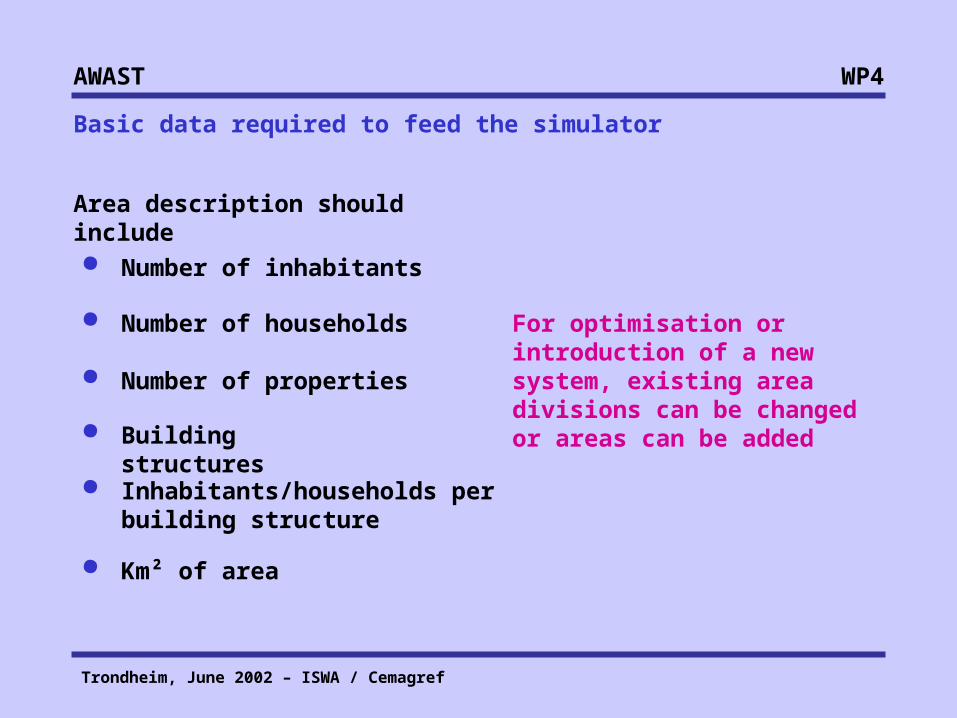
Area description should include
For optimisation or introduction of a new system, existing area divisions can be changed or areas can be added
Basic data required to feed the simulator
Number of inhabitants
Number of households
Number of properties
Building structures
Inhabitants/households per building structure
Km² of area

Trondheim, June 2002 – ISWA / Cemagref
WP4AWAST
Fractions collected separately per bin/bag, or together in one container (quantities)
User decides which fractions are to be collected separately with bin/bags
New system / improvementPresent situation
Data required per collection area
additive, alternating, integrated
Data required per collection area and fraction
Collection system
central collection points; inhabitants connected per central container
User can chose or change the collection systemkerbsid
e
collection frequency
Back-calculations will avoid logical errors
Trondheim, June 2002 – ISWA / Cemagref
WP4AWAST
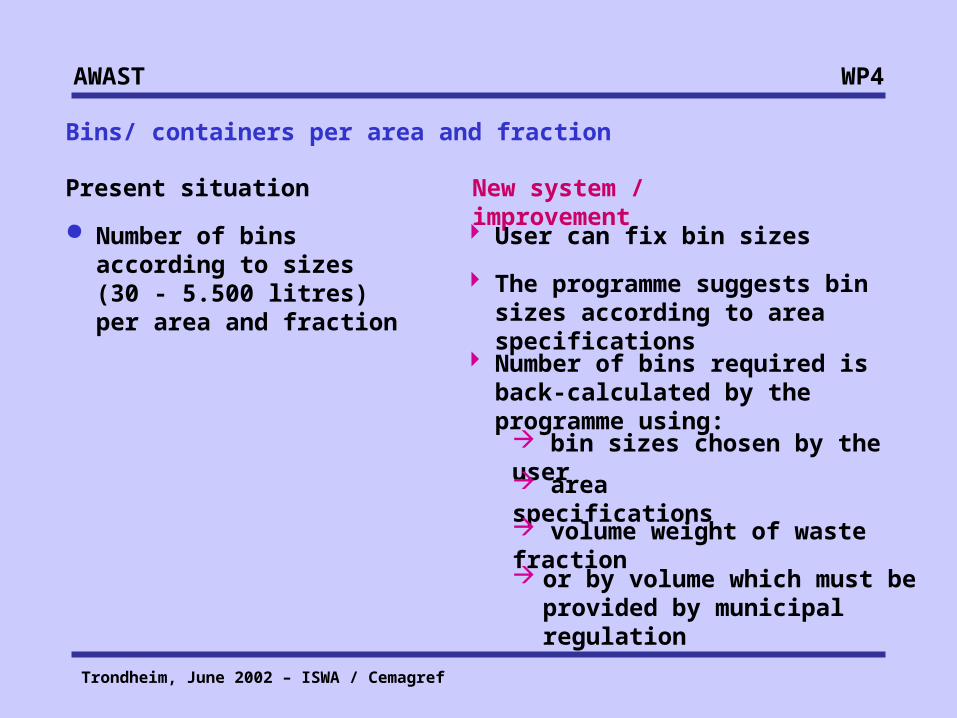
Number of bins according to sizes (30 - 5.500 litres) per area and fraction
The programme suggests bin sizes according to area specifications
Number of bins required is back-calculated by the programme using:
Bins/ containers per area and fraction
New system / improvementPresent situation
User can fix bin sizes
bin sizes chosen by the user
area specifications
volume weight of waste fraction
or by volume which must be provided by municipal regulation

Trondheim, June 2002 – ISWA / Cemagref
WP4AWAST
Collection and transport per area, vehicle and day is determined by the following factors:
Collection specifications per area and fraction
Length of a working day
Time spent driving between stops
Distance to the disposal site
Average haul speed to and from disposal site
One way delay time
Unloading time at disposal site
Off route time per day
Number of shifts
Vehicle specifications, lifter system
Area specifications
Trondheim, June 2002 – ISWA / Cemagref
WP4AWAST
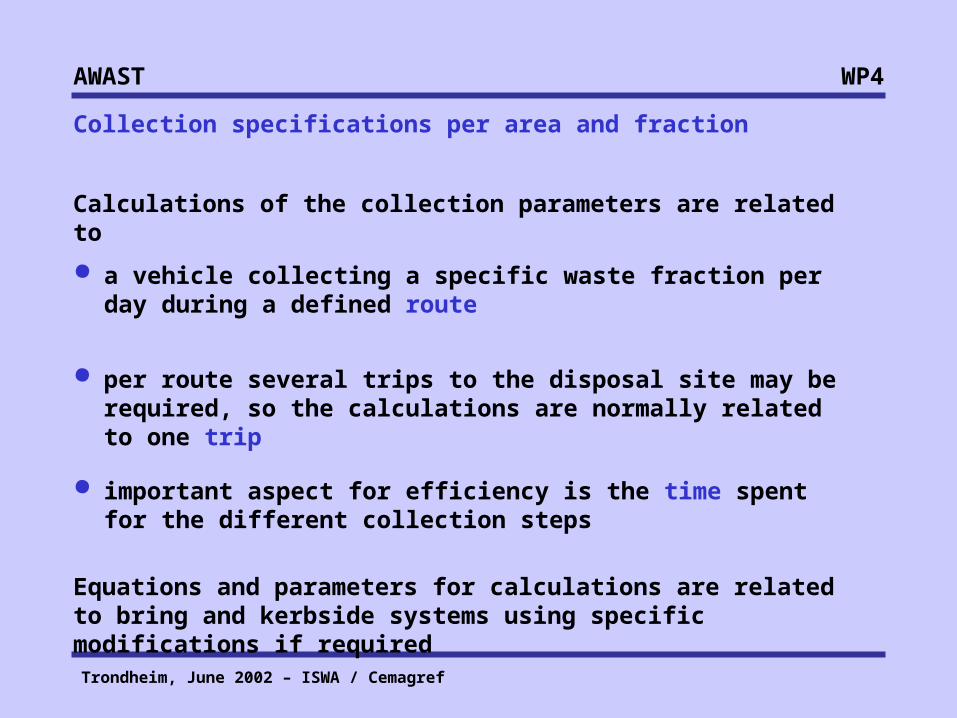
Calculations of the collection parameters are related to
a vehicle collecting a specific waste fraction per day during a defined route
per route several trips to the disposal site may be required, so the calculations are normally related to one trip
important aspect for efficiency is the time spent for the different collection steps
Collection specifications per area and fraction
Equations and parameters for calculations are related to bring and kerbside systems using specific modifications if required

Trondheim, June 2002 – ISWA / Cemagref
WP4AWAST
Collection per trip can be divided into:
Pick-up [Pscs]
Haul [x]
At site [tu]
From 1st container to be emptied until vehicle is full
Transport to the waste disposal plants, recycling facilities or transfer station (and back)
Time required for unloading the vehicle at the waste disposal plant, recycling facility or transfer station
Time per trip Tscs = Pscs + tu + a + bx
Collection specifications per area and fraction
a, b are empirical constants for distances and related velocities

Trondheim, June 2002 – ISWA / Cemagref
WP4AWAST
Pick-up- time depends on Pscs = Ct (uc) + (Np) (dbc)
Number of containers emptied per trip [Ct]
Unloading time per container (collector specific) [uct]
Number of container pick-up locations (stops) [Np]
Average time spent driving between the pick-up locations [dbc]
Collection specifications per area and fraction
Trondheim, June 2002 – ISWA / Cemagref
WP4AWAST
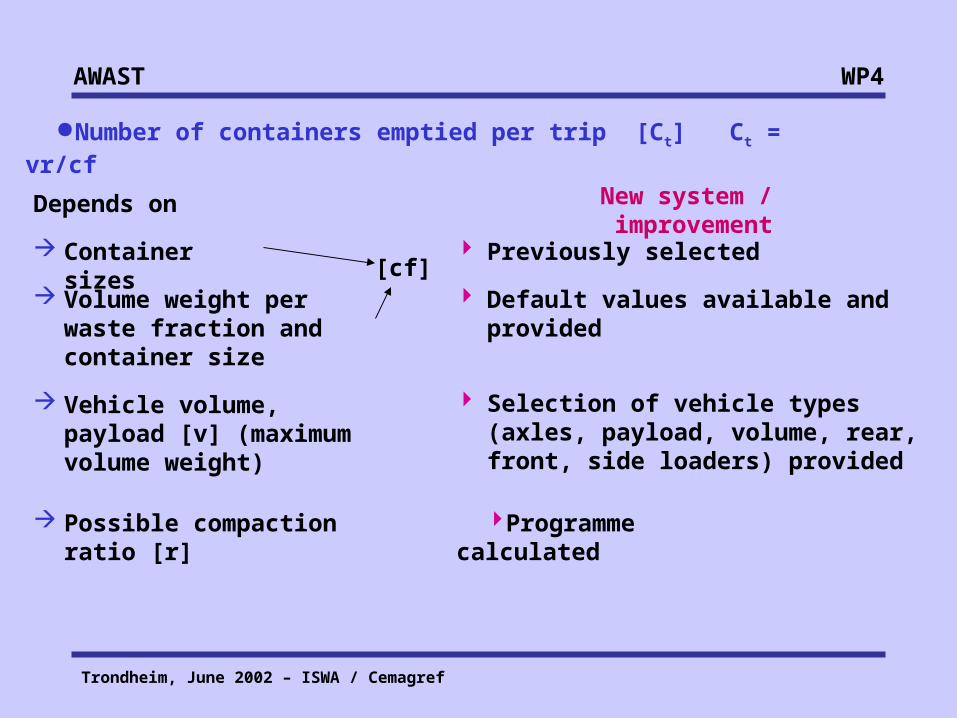
Default values available and provided
Programme calculated
Selection of vehicle types (axles, payload, volume, rear, front, side loaders) provided
Previously selected
Number of containers emptied per trip [Ct] Ct = vr/cf
New system / improvementDepends on
Container sizes
Volume weight per waste fraction and container size
Vehicle volume, payload [v] (maximum volume weight)
Possible compaction ratio [r]
[cf]
Trondheim, June 2002 – ISWA / Cemagref
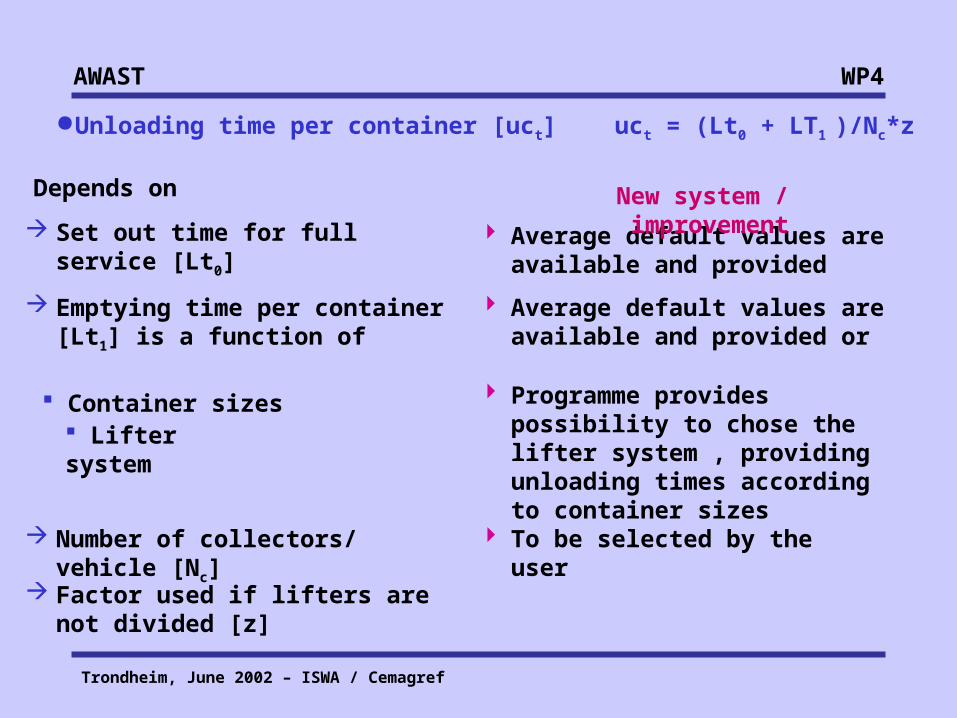
WP4AWAST
To be selected by the user
Lifter system
Number of collectors/ vehicle [Nc]
Average default values are available and provided
Container sizes
Average default values are available and provided or
Unloading time per container [uct] uct = (Lt0 + LT1 )/Nc*z
Set out time for full service [Lt0]
Emptying time per container [Lt1] is a function of
New system / improvementDepends on
Programme provides possibility to chose the lifter system , providing unloading times according to container sizes
Factor used if lifters are not divided [z]

Trondheim, June 2002 – ISWA / Cemagref
WP4AWAST
Number of container pick-up locations per trip Np = H/Nd - 2x/s - 2 td - tu - B/Nd
tpNew system / improvement
Length of working day/vehicle [H]
Number of trips [Nd]
Mean time per stop + time to reach the next stop [tp]
At site unloading time [tu]
Off-route time [B]
Distance to the disposal plant [x]
One way delay time [td]
tp= (uc*cloc)+dbc
Average haul speed to disposal plant [s]
1 or 2 shifts, working hours can be changed
Back-calculated
Can be changed for simulating transfer station, etc.
Average values road and distance specific available
For the present situation the following parameters are known or calculated
Related to selected vehicle
All factors can be changed (collectors, containers, vehicles ...)

Trondheim, June 2002 – ISWA / Cemagref
WP4AWAST
Changing collection system, container neighbourhoods, etc.
dbc = D/Vmax [1-exp(0,03D)]
Average time spent driving between the pick-up locations [dbc]
New system / improvement
Distance between stops [D]
Velocity [V]
Average values (number of bins/100 m) available according to area structures
Average values available according to area structures
Trondheim, June 2002 – ISWA / Cemagref
WP4AWAST
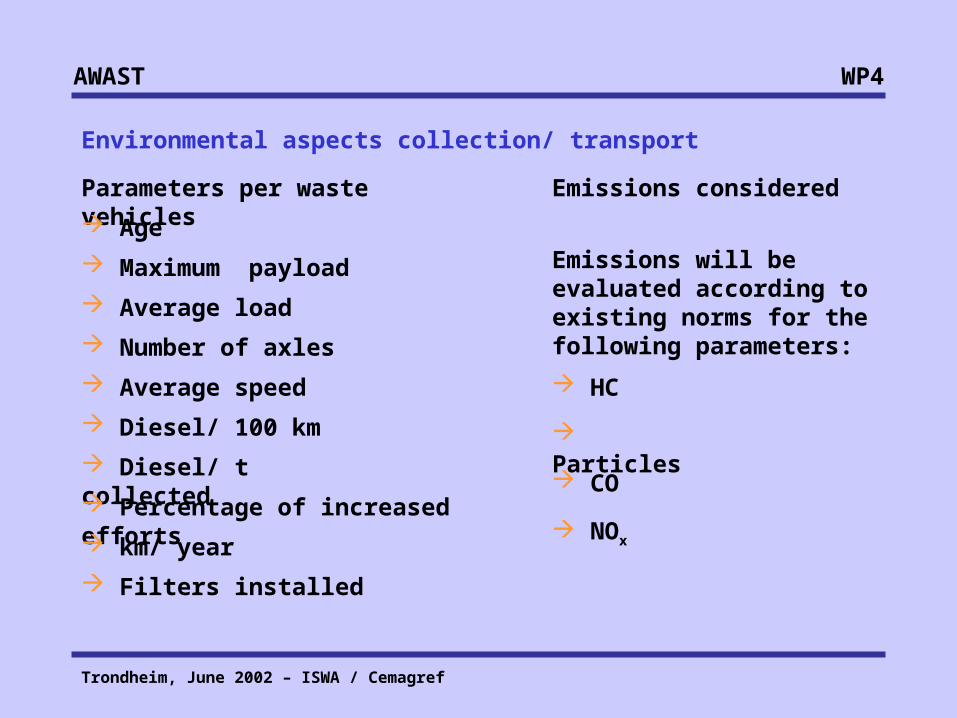
Environmental aspects collection/ transport
Parameters per waste vehicles
Age
Maximum payload
Average load
Number of axles
Average speed
Diesel/ 100 km
Diesel/ t collected
Percentage of increased efforts
km/ year
Filters installed
Particles
Emissions considered
CO
NOx
HC
Emissions will be evaluated according to existing norms for the following parameters:

Trondheim, June 2002 – ISWA / Cemagref
WP4AWAST
For central collection points/ civic amenity sites, private trips will be calculated by using average default values (according to inhabitants connected per location)
Waste transport from transfer station to recycling facilities, composting plant, incineration, MBPT or landfill (specific transportation trucks)
Waste transport from sorting plant to recycling facilities, incineration, MBPT or landfill
Transport considered
Waste collection and transport to the waste disposal plant or transfer station
Trondheim, June 2002 – ISWA / Cemagref
WP4AWAST
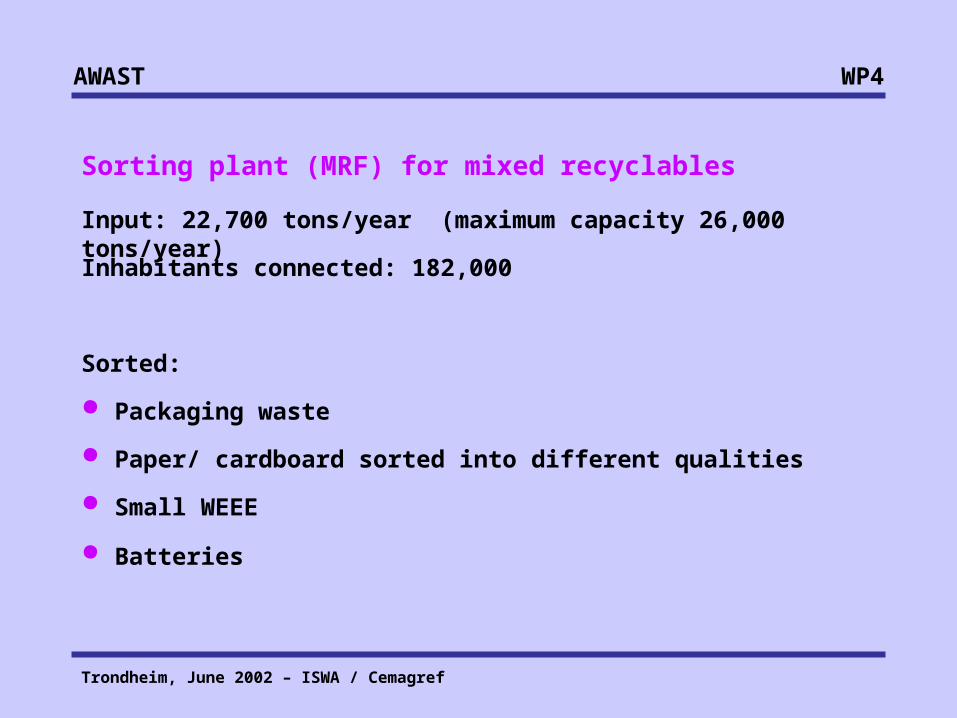
Sorting plant (MRF) for mixed recyclables
Packaging waste
Paper/ cardboard sorted into different qualities
Sorted:
Small WEEE
Inhabitants connected: 182,000
Input: 22,700 tons/year (maximum capacity 26,000 tons/year)
Batteries
Trondheim, June 2002 – ISWA / Cemagref
WP4AWAST
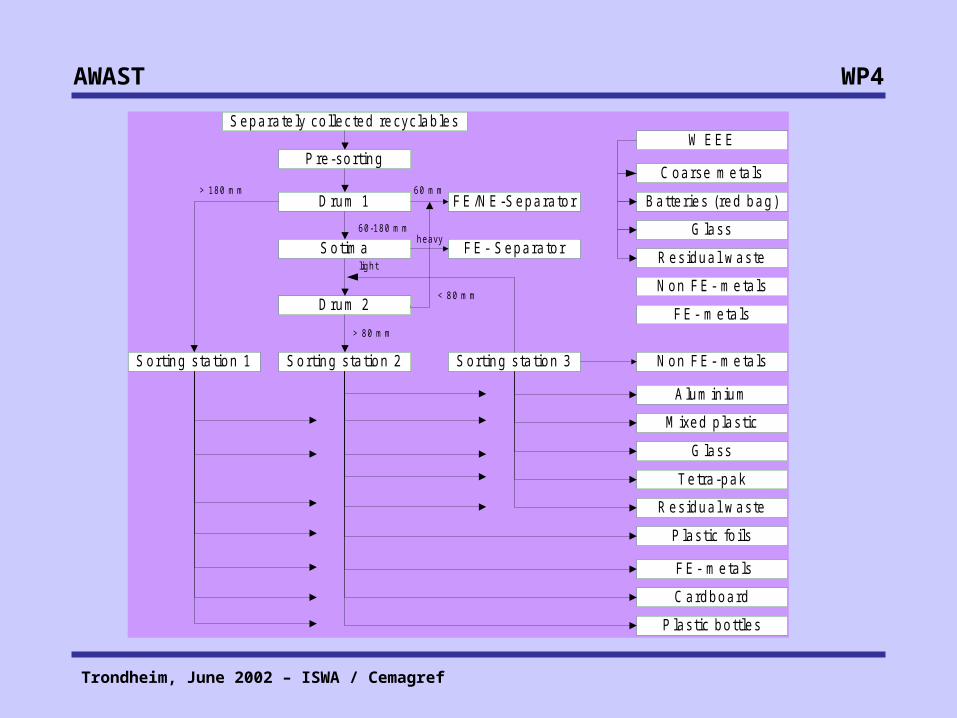
Separate ly co llected recyclab les
Pre-sorting
Drum 1
Drum 2
Sorting station 1
Sotima FE- Separator
W EEE
FE/NE-Separator
Residual waste
G lass
Batteries (red bag)
Coarse meta ls
Non FE- meta ls
FE- meta ls
60 mm
60-180 mmheavy
light
Sorting station 2 Sorting station 3 Non FE- meta ls
Tetra-pak
G lass
M ixed p lastic
A lumin ium
Residual waste
Plastic fo ils
FE- meta ls
Cardboard
Plastic bottles
> 180 mm
> 80 mm
< 80 mm
Trondheim, June 2002 – ISWA / Cemagref
WP4AWAST
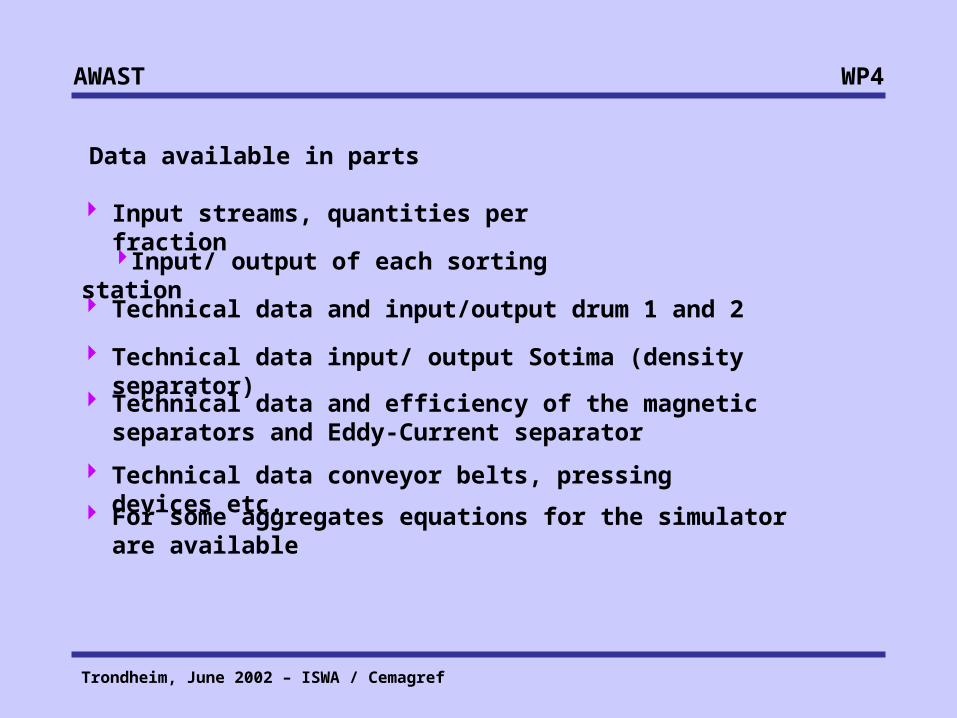
Data available in parts
Input streams, quantities per fraction
Input/ output of each sorting station
Technical data and input/output drum 1 and 2
Technical data input/ output Sotima (density separator)
Technical data and efficiency of the magnetic separators and Eddy-Current separator
Technical data conveyor belts, pressing devices etc.
For some aggregates equations for the simulator are available

Trondheim, June 2002 – ISWA / Cemagref
WP4AWAST
Available data concerning sorting efficiency (on a monthly basis)
Staff per shift
Quantities collected per fraction and shift
Time for pressing
Running hours
Tons per hour (from green household bin)
Tons per hour (commercial recyclables)
Additional cleaning
Interruption hours divided into cleaning, overfilled sorting belt, defect...
Capacity utilisation (%)
Working time (hours per person and month)
Working days per month
Total hours per shift
Trondheim, June 2002 – ISWA / Cemagref
WP4AWAST
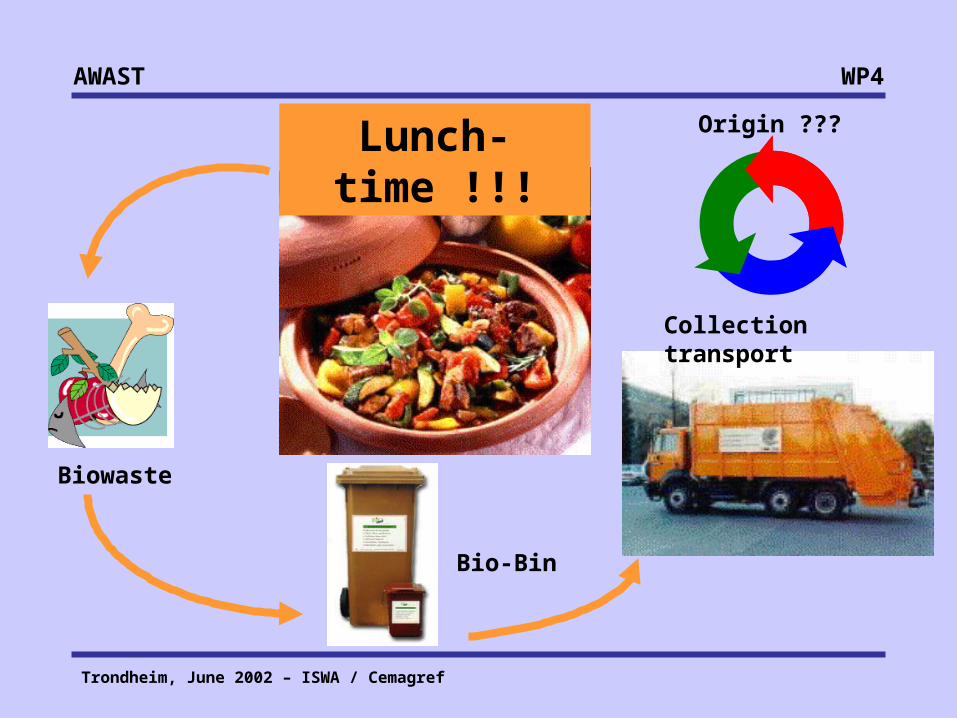
Collection transport
Bio-Bin
Biowaste
Lunch-time !!! Origin ???