Worst Election Ever in Russia? - University of Michiganwmebane/Russia2016.pdf · Worst Election...
23
Worst Election Ever in Russia? Kirill Kalinin * Walter R. Mebane, Jr. † December 18, 2016 * Department of Political Science, University of Michigan, Haven Hall, Ann Arbor, MI 48109-1045 (E-mail: [email protected]). † Professor, Department of Political Science and Department of Statistics, University of Michigan, Haven Hall, Ann Arbor, MI 48109-1045 (E-mail: [email protected]).
Transcript of Worst Election Ever in Russia? - University of Michiganwmebane/Russia2016.pdf · Worst Election...

Worst Election Ever in Russia?
Kirill Kalinin∗ Walter R. Mebane, Jr.†
December 18, 2016
∗Department of Political Science, University of Michigan, Haven Hall, Ann Arbor, MI48109-1045 (E-mail: [email protected]).†Professor, Department of Political Science and Department of Statistics, University of
Michigan, Haven Hall, Ann Arbor, MI 48109-1045 (E-mail: [email protected]).

Abstract
Analysis shows extensive signs of extensive frauds in the Russian 2016 Duma election. The
frequency and magnitude frauds are worse than in any Russian national election since 2000.

Because there was a Stalinist era it is an exaggeration to say that the Russian Duma
election in 2016 was the worst election ever in Russia, but it is no exaggeration to say the
2016 election had the most extensive and largest magnitudes of frauds since the 2000
presidential election. Many diagnostics can support that claim, but here we show only a
few results in support using methods in the Election Forensics Toolkit (Hicken and Mebane
2015; Mebane 2015), including the finite mixture likelihood model (Mebane 2016). We also
use results from a method developed by Rozenas (forthcoming).
In the September 2016 legislative (Duma) election Russians cast two ballots, one for a
party competing for seats determined nationally by proportional representation (PR) and
one for a candidate running for a single-member district (SMD) seat. A similar mixed
voting system had previously been used between 1993 and 2003. The State Duma consists
of 450 deputies elected for five-year terms. In 2016 half of the deputies were elected by PR
with 5% threshold and another half in plurality SMDs. The 2011 Duma elections were
marred by allegations of fraud (Enikolopov, Korovkin, Petrova, Sonin and Zakharov 2013)
and massive protests, but in 2016 authorities referred to the importance of genuine popular
support and clean elections. Since 2011 the electoral system was modified, the
parliamentary threshold was reduced from 7% to 5%, and independent candidates were
allowed to participate. Appointment of a new head of the Ella Pamfilova having a
reputation as a human rights advocate was aimed to build greater trust and credibility in
the upcoming elections (Roth 2016).
The legal framework remains complex restricting candidate registration, formation of
party blocks, campaigning, and electoral observation (OSCE 2016). New laws such as
anti-protest law, imposing heavy fines on organizers or participants of unsanctioned
demonstrations and anti-NGO laws,1 serve as additional checks on the civil society
(Gregory 2016).
1Such laws include a “foreign agents” law—any NGO receiving foreign funding and engaged in “politicalactivity” is required to register as foreign agent— and the undesirable organizations law targeting foreignorganizations that are considered threatening to Russia’s national security.
1

In 2016 the Kremlin enacted a “voter demobilization” campaign aimed to discourage
critically-minded voters from participation by shifting elections to the fall when many
Russians are on vacation, harvesting crops or students are back to school. Many
discouraged voters chose to ignore or to boycott the election (Rezunkov 2016). The
Kremlin used administrative resources—the regional political machines—to mobilize its
own supporters and to provide overwhelming victory to the party of power.
Putin’s high approval ratings suggests that no special measures would have been needed,
but over the electoral campaign preelection polls reported a sharp decline in the United
Russia party’s ratings: from 40% in early 2016 to 31% by the end of August according to
Russia’s leading independent polling agency Levada Center (Sharkov 2016). Unfavorable
election polls for the party of power provoked a sharp reaction from Kremlin. Two weeks
before the election the justice ministry labeled Levada Center a “foreign agent”, making its
future uncertain and sending a strong signal to other Russian pollsters (Vladimirov 2016).
New legal limitations on domestic observers reduced election observation. For instance
at most two observers were allowed per party/candidate, all observers were assigned to a
specific precinct, and observers under the guise of media representatives (one of the
solutions used in the past to involve non-partisan observers—non-partisan citizen
observation doesn’t exist in Russia) were no longer allowed (Law 2016). Often traditional
observers were substituted by “phony” observers from organizations aligned with the state
apparatus.
The official turnout for 2016 elections of 48% was the lowest in the Russian recent
history (62% in 2011 and 59% in 2007). Out of 14 parties listed in the ballot only four
traditional Duma parties managed to surpass the 5% threshold: United Russia with 54.2%,
Communists (13.34%), LDPR (13.14%) and Just Russia (6.22%). In SMDs with 4437
candidates participating, the major winner was United Russia, which gained the majority
of seats winning in 203 out of 206 districts it was running in, followed by the Communists
and Just Russia earning 7 seats each, LDPR (5 seats) and the remaining seats divided
2
between smaller parties and independents. In all 343 seats out of 450 seats, i.e. 76% of the
seats went to United Russia.
Were these elections clean? Observers report that unlike the previous 2011 election,
there were fewer cases related to vote rigging or conflicts between the observers and
election committees. While OSCE assessed the voting process as good in 97 percent of
observations, the counting process was worse: it was assessed by the observers as bad in 23
percent of the polling stations observed (OSCE 2016). In selected precincts the abuse with
administrative resources and illegal campaigning, ballot stuffing and carousel voting,
violation of the rights of observers, commission members and representatives of the media,
violation counting procedures, ghost voters in the registration lists, protocol tampering
were reported (Golos 2016). According to Golos ballot stuffing was reported in Moscow, St.
Petersburg, and many other regions including republics such as Chechnya, Bashkortostan,
Dagestan, Tatarstan. Those excessive figures for United Russia and turnout may reflect
both the extent of popular support for Kremlin policy, but more likely the strength of the
governors’ political machines to provide a favorable to Kremlin electoral outcome. As
always, Chechnya with its overwhelming level of support for United Russia 96% and
turnout 94% is a leading outlier (Fuller 2016).
Indirect evidence suggests pronounced election fraud. According toexit polls by
VCIOM (Russia’s leading polling agency closely aligned with the state), United Russia
should have received 44.5%—a ten percent discrepancy from the officially reported vote
share (Russian Public Opinion Research Center 2016).
Similar to the previous Russian elections, in 2016 the regional governors were
responsible for mobilizing their regional “political machines” to provide a favorable
electoral result and to signal their loyalty status to Kremlin (Kalinin 2016a). Governors
were interested in boosting the level of turnout to provide their respective regions with
more mandates in the lower chamber and they were incentivized to boost the United
Russia’s support to meet the Kremlin’s demand (Mebane and Kalinin 2010). Consequently
3
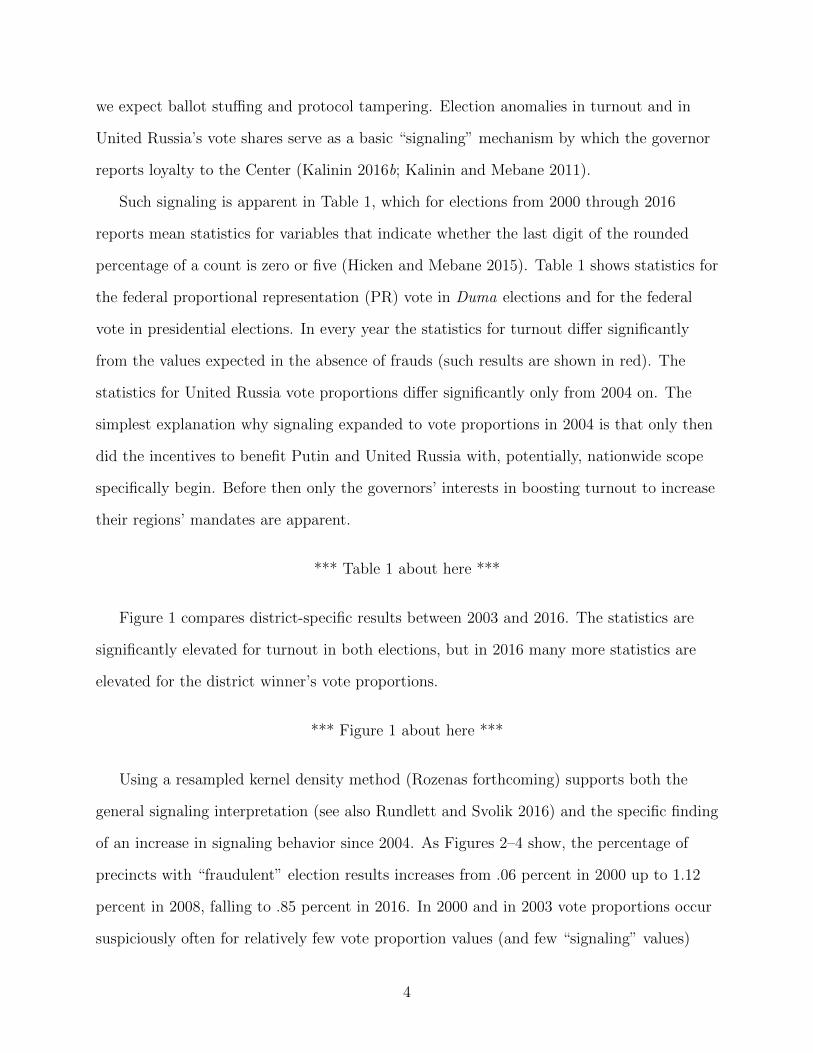
we expect ballot stuffing and protocol tampering. Election anomalies in turnout and in
United Russia’s vote shares serve as a basic “signaling” mechanism by which the governor
reports loyalty to the Center (Kalinin 2016b; Kalinin and Mebane 2011).
Such signaling is apparent in Table 1, which for elections from 2000 through 2016
reports mean statistics for variables that indicate whether the last digit of the rounded
percentage of a count is zero or five (Hicken and Mebane 2015). Table 1 shows statistics for
the federal proportional representation (PR) vote in Duma elections and for the federal
vote in presidential elections. In every year the statistics for turnout differ significantly
from the values expected in the absence of frauds (such results are shown in red). The
statistics for United Russia vote proportions differ significantly only from 2004 on. The
simplest explanation why signaling expanded to vote proportions in 2004 is that only then
did the incentives to benefit Putin and United Russia with, potentially, nationwide scope
specifically begin. Before then only the governors’ interests in boosting turnout to increase
their regions’ mandates are apparent.
*** Table 1 about here ***
Figure 1 compares district-specific results between 2003 and 2016. The statistics are
significantly elevated for turnout in both elections, but in 2016 many more statistics are
elevated for the district winner’s vote proportions.
*** Figure 1 about here ***
Using a resampled kernel density method (Rozenas forthcoming) supports both the
general signaling interpretation (see also Rundlett and Svolik 2016) and the specific finding
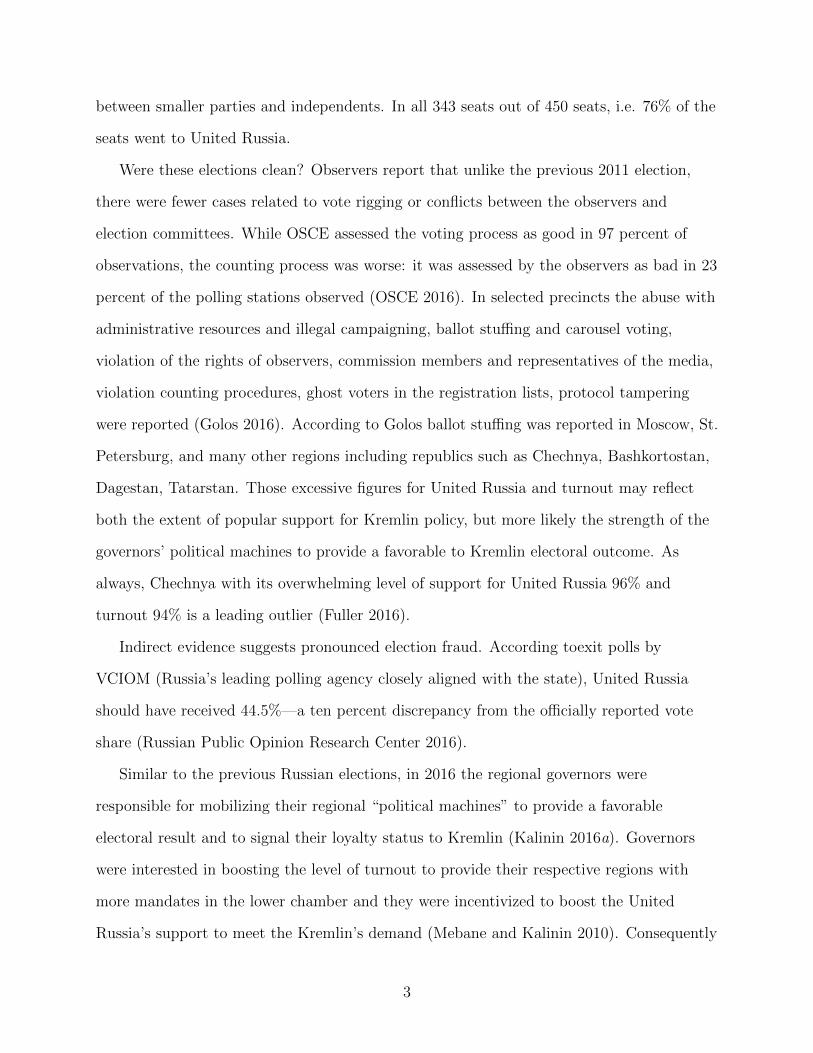
of an increase in signaling behavior since 2004. As Figures 2–4 show, the percentage of
precincts with “fraudulent” election results increases from .06 percent in 2000 up to 1.12
percent in 2008, falling to .85 percent in 2016. In 2000 and in 2003 vote proportions occur
suspiciously often for relatively few vote proportion values (and few “signaling” values)
4
while in 2004 and in subsequent years there are many more distinct suspicious values. In
2016 too many of the vote shares received by United Russia in individual precincts are
greater than 50 percent and evenly divisible by five: too many are 55%, 65%, 70%, 75%,
80%, 85%, 90%, 95% or 100%.
*** Figures 2, 3 and 4 about here ***
Estimates of the finite mixture “frauds” model (Mebane 2016; Klimek, Yegorov, Hanel
and Thurner 2012), using polling station observations,2 support the idea that the 2016
election exhibits the most fraud since 2000, but they also suggest the manner in which
frauds are committed is stable over time.3 Point estimates f̂i, f̂e, α̂, θ̂, τ̂ and ν̂ are reported
in Table 2 and Figures 5 and 6 (Mebane 2016).4 Table 2 shows that the probabilities of
frauds, f̂i and f̂e, are greater in the 2016 PR vote than in any previous national election
going back to 2000. In fact, f̂i = .22 in 2016 PR is about twice as large as the next largest
f̂i value and f̂e = .022 in 2016 PR is about seven times as large as the next largest f̂e value.
Figure 5(a) shows that frauds estimates for the 2016 SMD votes are frequently large and
sometimes larger than the values estimated for the 2016 PR vote.
*** Table 2 and Figures 5 and 6 about here ***
Despite the volatility in the probabilities of frauds, the mechanism used to effect the
fraudulent votes appears to be stable over time. Parameter α indicates whether vote
manufacturing or vote stealing predominate. If α = 1 then both processes are equally
2Data source information: Central Election Commission of the Russian Federation (2013).3In every election shown in Table 2 the party in focus in the analysis is the party that received the most
votes nationally. For Figure 5 the candidate in focus in each district is the candidate with the most votes inthe district.
4fi and fe are respectively the probabilities that each precinct is affected by incremental or extreme frauds.Smaller values of α mean that larger fractions of votes are shifted from opposition to the leading candidate.A higher value of θ implies that incremental fraud garners a higher number of votes for the leading party.τ and ν are respectively the mean turnout proportion and mean proportion of votes for the leading partyin the absence of fraud. Table 2 also includes reports of the likelihood ratio test statistic for the hypothesisthat there are no frauds (i.e., that fi = fe = 0), along with the number of polling station observations foreach election.
5

affecting votes. If α < 1 then vote stealing is more important, and if α > 1 manufacturing
votes from nonvoters is more important (Mebane 2016, 8–9). α̂ suggests that vote
manufacturing is the dominant fraud mechanism in every election since 2000.5 Indeed, α̂
has the same values in many of the elections: α̂ = 1.7 in 2004, 2007, 2008 and 2016
(α̂ = 1.8 in 2011); α̂ = 3.3 in 2000 and 2003 (α̂ = 3.4 in 2012). In terms of α, at least, vote
manufacturing appears to operate at two different scales across elections. Despite the
limited variation in α̂, θ̂ varies more than α̂ does, so the precise number of fraudulent votes
manufactured varies considerably across elections.
More votes are produced by frauds in 2016 than in previous Russian elections.
Estimates of the number of votes produced by incremental and extreme frauds (Mebane
2016, 13) show nearly two million fraudulent votes in the 2016 PR vote, amounting to 3.6%
of the recorded votes (Table 3). Both the number and percentage of fraudulent votes are
greater than in other elections going back to 2000. Figures 5(d,e) show that in the 2016
SMD votes the numbers and proportions of fraudulent votes are also frequently large.
Comparisons with Figures 6(d,e) show that many fewer votes were produced in particular
by extreme frauds in 2003 than in 2016.
*** Table 3 about here ***
To convey information about the geographic dispersion of frauds in the 2016 PR votes,
Figure 7 shows hotspots and Figure 8 shows local spatial clustering patterns of conditional
frauds probabilities f̂ii and f̂ei (Mebane 2016, 12–13). See Hicken and Mebane (2015,
13-14) and Mebane (2015, 8-12) for hotspot/clustering methods explanations and for color
legends.6 Briefly, red dots are locations where geographic concentrations of relatively high
frauds probabilities occur.
*** Figures 7 and 8 about here ***
5In Figure 5(b) usually α̂ > 1 for the 2016 SMD votes. In Figure 6(b) α̂ > 1 in just more than half ofthe districts for the 2003 SMD votes.
6Hotspots and clusters are estimated using estimates of the probability that that each precinct i = 1, . . . , nis a case of no fraud (f̂0i), incremental fraud (f̂ii) or extreme fraud (f̂ei) (Mebane 2016, 12).
6

We apply the Getis-Ord Gi analysis of hotspots (Ord and Getis 1995) to measure
whether the mean of f̂ii and f̂ei values geographically close to observation i differs from the
global mean. It seems that in both cases of extreme and incremental fraud high values (red
dots) are almost uniformly scattered across the Russian territory suggesting that anomalies
are clustered in many small localities across Russia (in the case of incremental frauds two
big clusters of anomalies draw our attention, these clusters are located in Altaiskii krai,
Republic Marii El and Amurskaya oblast’).
Figure 9 displays regional averages of frauds probabilities: brighter red color indicates
higher levels of election fraud. The figure suggests election fraud is much more frequent in
the south of Russia, especially, the republics of the North Caucasus, Russian regions
located on the south from Moscow, and Volga region republics such as Tatarstan and
Mordoviya. In addition to this several Siberian regions such as Yamalo-Nenets autonomous
district, Tyumenskaya Oblast’, Kemerovskaya Oblast’ and Tyva Republic expose elevated
levels of election fraud. Our findings with respect to geographical variation of fraud are
supported by data analysis performed by other scholars (see e.g. Kireev 2016).
*** Figure 9 about here ***
Our findings suggest that from a comparative perspective the quality of the most recent
Duma elections seems be the worst out of all elections of the 2000s. The estimated
magnitude of election fraud and its spread across the country suggests that Russian
election anomalies are deeply embedded in both the regional and local levels. As the
Russian regime becomes more authoritarian, the quality of elections also suffers.
7

References
Benjamini, Yoav and Yosef Hochberg. 1995. “Controlling the False Discovery Rate: A
Practical and Powerful Approach to Multiple Testing.” Journal of the Royal Statistical
Society, Series B 57(1):289–300.
Central Election Commission of the Russian Federation. 2013. “Elections and referendums.”
URL http://www.vybory.izbirkom.ru/.
Enikolopov, Ruben, Vasily Korovkin, Maria Petrova, Konstantin Sonin and Alexei Zakharov.
2013. “Field experiment estimate of electoral fraud in Russian parliamentary elections.”
Proceedings of the National Academy of Sciences 110(2):448–452.
Fuller, Liz. 2016. “Evidence Of Blatant Violations Calls Into Question Va-
lidity Of Elections In North Caucasus.”. URL http://www.rferl.org/a/
caucasus-report-duma-elections-blatant-violations/28007463.html.
Golos. 2016. Preliminary Statement on Election Observation on September, 18 2016. Tech-
nical report Golos. URL http://www.golosinfo.org/ru/articles/117564.
Gregory, Paul Roderick. 2016. “Putin Changes September Election Rules To Prop Up His
’United Russia’ Party.”.
Hicken, Allen and Walter R. Mebane, Jr. 2015. “A Guide to Election Forensics.” Working pa-
per for IIE/USAID subaward #DFG-10-APS-UM, “Development of an Election Forensics
Toolkit: Using Subnational Data to Detect Anomalies”.
Kalinin, Kirill. 2016a. “Signaling Games of Election Fraud.” URL: https://papers.ssrn.
com/sol3/papers.cfm?abstract_id=2836775, Working paper.
Kalinin, Kirill. 2016b. “Validating Precinct-Level Measures of Fraud: Evidence from the
Russian Electoral Cycle 2011-2012.” Paper presented at the 2016 Annual Meeting of the
Midwest Political Science Association, Chicago, April 7–10, 2016.
Kalinin, Kirill and Walter R. Mebane, Jr. 2011. “Understanding Electoral Frauds through
Evolution of Russian Federalism: from “Bargaining Loyalty” to “Signaling Loyalty”.”
Paper presented at the 2011 Annual Meeting of the Midwest Political Science Association,
8

Chicago, IL, March 31–April 2.
Kireev, Alexander. 2016. “My Estimate of Falsification Levels in the Duma Elections.” blog
. URL http://kireev.livejournal.com/?skip=20.
Klimek, Peter, Yuri Yegorov, Rudolf Hanel and Stefan Thurner. 2012. “Statistical Detection
of Systematic Election Irregularities.” Proceedings of the National Academy of Sciences
109(41):16469–16473.
Law. 2016. Federal Law (15 Feb. 2016). Technical Report N29-FZ Russian Federation. URL
https://rg.ru/2016/02/17/vybori-dok.html.
Mebane, Jr., Walter R. 2015. “Election Forensics Toolkit DRG Center Working Paper.”
Working paper for IIE/USAID subaward #DFG-10-APS-UM, “Development of an Elec-
tion Forensics Toolkit: Using Subnational Data to Detect Anomalies”.
Mebane, Jr., Walter R. 2016. “Election Forensics: Frauds Tests and Observation-level Frauds
Probabilities.” Paper presented at the 2016 Annual Meeting of the Midwest Political Sci-
ence Association, Chicago, April 7–10, 2016.
Mebane, Jr., Walter R. and Kirill Kalinin. 2010. “Electoral Fraud in Russia: Vote Counts
Analysis using Second-digit Mean Tests.” Paper prepared for the 2010 Annual Meeting of
the Midwest Political Science Association, Chicago, IL, April 22–25.
Ord, J. K. and Arthur Getis. 1995. “Local Spatial Autocorrelation Statistics: Distributional
Issues and an Application.” Geographical Analysis 27(4):286–306.
OSCE. 2016. Russian Federation State Duma Elections, 18 September 2016. Statement of
Preliminary Findings and Conclusions. Technical report OSCE.
Rezunkov, Victor. 2016. “The Most Boring Campaign (Interview with Grigorii Golosov).”.
URL http://www.svoboda.org/a/27991655.html.
Roth, Andrew. 2016. “Meet the Woman Who Says She’s Going to Fix Russia’s Rigged Elec-
tions.” The Washington Post . URL https://www.washingtonpost.com/world/europe/
meet-the-woman-who-says-shes-going-to-fix-russias-rigged-elections/2016/
05/14/13f9ed7e-0e36-11e6-bc53-db634ca94a2a_story.html.
9
Rozenas, Arturas. forthcoming. “Detecting Election Fraud from Irregularities in Vote-Share
Distributions.” to appear in Political Analysis.
Rundlett, Ashlea and Milan W. Svolik. 2016. “Deliver the Vote! Micromotives and Mac-
robehavior in Electoral Fraud.” American Political Science Review 110(1):180–197.
Russian Public Opinion Research Center. 2016. “Russian State Duma Elections: VCIOM
Exit Poll Data.”. URL http://wciom.com/index.php?id=61&uid=1305.
Sharkov, Damien. 2016. “Putin’s United Russia Drops In Polls
Ahead of September Elections.”. URL http://www.newsweek.com/
putins-united-russia-drops-polls-ahead-september-elections-494887.
Vladimirov, Victor. 2016. Russian Pollster: Authorities Want to Destroy NGOs. Technical
report.
10

Table 1: “Signaling” Digit Tests for National Votes
2000 2003 PR 2004 2007Turnout 0.221 0.217 0.236 0.228
(0.218, 0.223) (0.214, 0.22) (0.233, 0.239) (0.225, 0.23)United Russia 0.202 0.202 0.207 0.21
(0.199, 0.204) (0.199, 0.204) (0.204, 0.209) (0.207, 0.212)
2008 2011 2012 2016 PRTurnout 0.232 0.219 0.22 0.225
(0.229, 0.235) (0.216, 0.221) (0.218, 0.223) (0.222, 0.228)United Russia 0.204 0.209 0.209 0.208
(0.202, 0.207) (0.207, 0.212) (0.207, 0.212) (0.205, 0.21)
Note: the statistic is the mean of a variable indicating whether the last digit of therounded percentage of votes for the referent party or candidate at each polling station iszero or five. Values in parentheses are nonparametric bootstrap confidence intervals.
Table 2: Finite Mixture Model Parameter Estimates for Russian Elections
Election f̂i f̂e α̂ θ̂ τ̂ ν̂ LR n2000 President .033 .000032 3.3 .71 .71 .54 22,286 91,3062003 Duma PR .16 .0033 3.3 .27 .58 .36 106,850 95,0772004 President .049 .000087 1.7 .44 .69 .72 20290 95,4242007 Duma .040 .00016 1.7 .53 .67 .66 18694 95,8022008 President .013 .0000017 1.7 .53 .76 .70 586 96,2422011 Duma .12 .0032 1.8 .36 .61 .48 69244 95,1662012 President .084 .0020 3.4 .35 .65 .65 55352 95,4132016 Duma PR .22 .022 1.7 .27 .48 .49 233724 94,987
Note: LR is the likelihood ratio test statistic for the hypothesis that there are no frauds(i.e., that fi = fe = 0). n is the number of polling station observations.

Table 3: Estimated Fraudulent Vote Counts and Proportions for Russian Elections
Election Mi Me pi pe pi + pe2000 President 135,061 1,452 .00187 .0000202 .001902003 Duma PR 256,759 185,278 .00430 .00311 .007412004 President 203,955 4,951 .00297 .0000721 .003042007 Duma 270,490 11,914 .00395 .000174 .004132008 President 84,933 113 .00116 .00000155 .001162011 Duma 680,082 260,254 .0105 .00403 .01462012 President 292,339 189,912 .00413 .00268 .006812016 Duma PR 739,005 1,080,856 .0145 .0212 .0356
Note: Mi, Me are estimated numbers of votes produced by incremental and extreme frauds;pi, pe are fraudulent vote counts as proportions of the recorded votes.

Figure 1: “Signaling” Tests by District, Russia 2003 and 2016 SMD Votes
●
●●
●
●
●
●●●
●
●
●●
●●
●
●●●
●
●
●
●●
●
●
●●●●●●
●●●
●●●
●
●
●●
●●●●●
●
●
●
●
●
●●●
●
●
●
●
●●●●●●●
●●
●
●●
●
●●●
●●●
●
●●
●●●
●
●●●●●●
●●●
●
●
●
●
●
●
●
●
●
●●
●●
●●
●
●●●●
●
●●
●●●●●
●
●●
●
●●●●●●
●●●●●●●●●●●
●
●●●●●●●●●
●
●
●
●●●
●
●●●
●
●
●
●●●●
●●●
●●●●●
●●●
●
●●
●●●●
●
●●
●●
●●
●
●
●●
●
●
●
●
●
●●●●●
●●
●
●
●
●
●
●
●●●
●
●
●
0 50 100 150 200
0.15
0.25
0.35
0.45
(a) 2003 Turnout
District Number
P05
s
●
●
●●
●
●
●●
●
●
●
●●
●
●
●
●
●
●
●●
●●●●
●
●
●●●●
●●
●●●●●●
●●●
●●
●●●●●●
●
●●●
●●●
●
●
●●●●●●●●●
●
●●●
●●●●●●
●
●
●●
●●
●●●●
●
●●
●●●
●
●
●
●
●
●●●●●●●●
●
●
●
●
●●●●
●
●
●●●●●●●●●●●●●
●●
●●●●●●●●
●
●
●
●●●●●●●
●
●●●●
●
●
●●
●
●●
●●●●●●●●●
●
●
●●●●●●●●
●
●
●●●●●
●●●●●
●
●●
●●
●●●●
●
●
●●●
●●
●
●
●
●
●
●
●
●
●
●
●
●
●
●
0 50 100 150 200
0.05
0.15
0.25
0.35
(b) 2003 Winner
District Number
P05
s
●●
●
●●
●
●
●
●
●
●
●●
●
●
●
●●●●●●
●
●●
●
●
●
●
●
●
●
●●●
●
●●●
●●●●
●
●
●●
●
●●●
●
●
●
●
●●●●●●
●
●
●
●●
●
●
●●
●●
●●
●●●
●●
●●●
●
●●●
●●●
●●
●
●●
●
●
●
●
●
●
●
●
●
●
●●●●
●
●●
●
●
●
●
●
●
●
●
●
●
●●
●●
●●
●
●
●●●
●●●
●
●●●●●●●●●●●
●
●
●
●
●
●
●
●
●●
●●●
●
●●●
●●
●
●
●
●●●●●
●
●●●
●●●●●●●●●●●●●●●●●
●
●●
●●
●●
●
●
●
●
●
●
●
●●
●
●
●●
●
●
●
●
●●
●●
●
●
0 50 100 150 200
0.15
0.25
0.35
(c) 2016 Turnout
District Number
P05
s
●
●
●
●
●●
●
●●
●●
●
●
●
●
●●●●
●
●
●
●●
●●●●
●
●
●●
●
●●
●●
●
●
●●
●
●
●
●●
●
●
●
●●●●
●●
●●
●
●●●
●
●●
●●●●●●●●
●●
●
●●●
●
●
●
●
●
●●
●
●●
●●●●●
●●
●
●●
●●●
●●●
●
●
●●●
●
●
●
●
●●●●
●
●●●●
●
●
●
●
●
●●
●
●
●
●
●
●●●●
●●
●
●●
●
●
●
●
●●
●
●
●
●
●
●
●●
●
●●●
●●
●
●
●
●
●
●●●
●●●
●●
●
●
●
●
●
●●
●
●
●
●●
●
●●
●
●
●
●●
●
●●
●●
●
●
●●
●
●
●
●
●
●
●
●
●●●
●●
●
●
●●
●
●
●
0 50 100 150 200
0.15
0.25
(d) 2016 Winner
District Number
P05
s
Note: SMD-specific statistics and tests based on polling station observations from 224(2003) and 225 (2016) districts. “P05s,” mean of variable indicating whether the last digitof the rounded percentage of votes for the referent party or candidate is zero or five.Statistics that deviate from the values they are expected to have in the absence of fraudare in red.

Figure 2: “Spikes” Tests for Vote Proportions, 2000–2003
020
4060
8010
012
0
Russia 2000
Vote−share
Den
sity
F = 0.06
0.0 0.1 0.2 0.3 0.4 0.5 0.6 0.7 0.8 0.9 1.0
020
4060
8010
012
014
0
Russia 2003 PR
Vote−share
Den
sity
F = 0.11
0.0 0.1 0.2 0.3 0.4 0.5 0.6 0.7 0.8 0.9 1.0
020
4060
8010
012
014
0
Russia 2003 SMD
Vote−share
Den
sity
F = 0.15
0.0 0.1 0.2 0.3 0.4 0.5 0.6 0.7 0.8 0.9 1.0
Note: light gray lines show values for which the kernel density of the observed data exceedsthe upper envelope of the kernel density of the resampled data (Rozenas forthcoming).
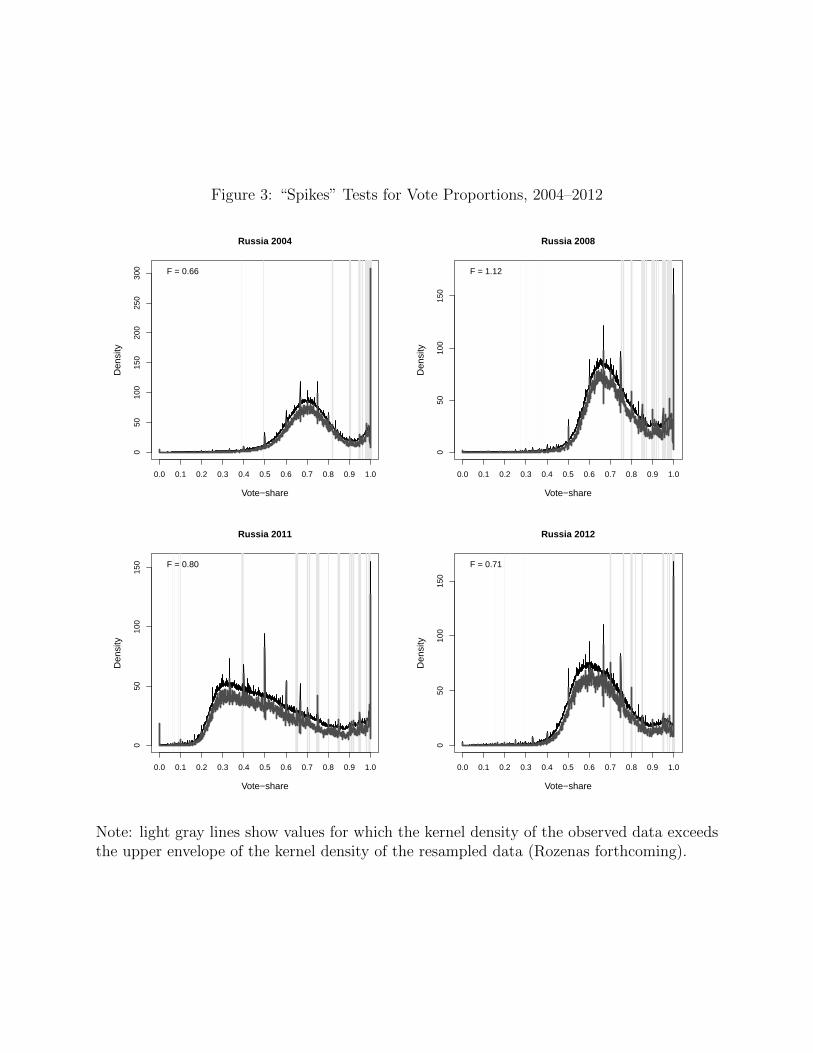
Figure 3: “Spikes” Tests for Vote Proportions, 2004–2012
050
100
150
200
250
300
Russia 2004
Vote−share
Den
sity
F = 0.66
0.0 0.1 0.2 0.3 0.4 0.5 0.6 0.7 0.8 0.9 1.0
050
100
150
Russia 2008
Vote−share
Den
sity
F = 1.12
0.0 0.1 0.2 0.3 0.4 0.5 0.6 0.7 0.8 0.9 1.0
050
100
150
Russia 2011
Vote−share
Den
sity
F = 0.80
0.0 0.1 0.2 0.3 0.4 0.5 0.6 0.7 0.8 0.9 1.0
050
100
150
Russia 2012
Vote−share
Den
sity
F = 0.71
0.0 0.1 0.2 0.3 0.4 0.5 0.6 0.7 0.8 0.9 1.0
Note: light gray lines show values for which the kernel density of the observed data exceedsthe upper envelope of the kernel density of the resampled data (Rozenas forthcoming).

Figure 4: “Spikes” Tests for Vote Proportions, 2016
020
4060
8010
0
Russia 2016 PR
Vote−share
Den
sity
F = 0.85
0.0 0.1 0.2 0.3 0.4 0.5 0.6 0.7 0.8 0.9 1.0
020
4060
8010
012
0
Russia 2016 SMD
Vote−share
Den
sity
F = 0.43
0.0 0.1 0.2 0.3 0.4 0.5 0.6 0.7 0.8 0.9 1.0
Note: light gray lines show values for which the kernel density of the observed data exceedsthe upper envelope of the kernel density of the resampled data (Rozenas forthcoming).

Figure 5: Finite Mixture Model Estimates, Russia 2016 SMD
●
●●
●
●
●
●
●
●
●
●
●
●●
●
●
●
●
●
●
●
●
●
●
●●●●●●
●
●●
fI fE
0.00
0.10
0.20
0.30
(a) probabilities
●
●−1
01
23
(b) log(alpha)
●●●●
●●●
●
●●●
●
●●●●●●●
●
●●●
●
●●●●●
●
●●
theta tau nu
0.0
0.2
0.4
0.6
0.8
1.0
(c) means
●
●●
●
●
●
●
●
●
●
●
●
●
●
●
●
●
●
●
●
●●●
●
●●
●
●
●
meanI meanE
050
0015
000
2500
0
(d) counts
●●●
●
●●
●●
●
●
●
●●
●
●
●
●
●
●
●●
●●
●●
●●
●
●
●
●
●●
●
●
●●
●
●
●
●
pI pE pIE
0.00
0.05
0.10
0.15
(e) proportions
Note: distribution of district-specific estimates over 225 districts; (a) f̂i, f̂e; (b) log(α̂); (c)θ̂, τ̂ , ν̂; (d) Mi, Me; (e) pi, pe, pi + pe.

Figure 6: Finite Mixture Model Estimates, Russia 2003 SMD
●
●●●
●●
●
●
●●●●
●●●●●●●●●●●
●●●●●●●
●
●●●●●
●
fI fE
0.0
0.1
0.2
0.3
(a) probabilities
01
23
(b) log(alpha)
●
●
●
●
●
●
●
●
●
●●●
●●
●●●
●
theta tau nu
0.0
0.2
0.4
0.6
0.8
(c) means
●
●
●
●
●
●
●●
●
●
●
●
●●
●
●●●
●●●●
●
●
●●●●●●
●
●
●
●
●●●
●●
meanI meanE
010
000
2000
030
000
(d) counts
●
●
●
●●
●
●
●
●●
●
●●
●●●
●
●●●
●●●●●
●
●
●
●●●
●●
●
●●
●
●●
●
●
●
●
●
●
●
●
●
●
●
●
●
pI pE pIE
0.00
0.04
0.08
0.12
(e) proportions
Note: distribution of district-specific estimates over 224 districts; (a) f̂i, f̂e; (b) log(α̂); (c)θ̂, τ̂ , ν̂; (d) Mi, Me; (e) pi, pe, pi + pe.

Figure 7: Frauds Conditional Probability Hotspots, 2016
(a) f̂ii (incremental frauds)
(b) f̂ei (extreme frauds)
Note: polling station fraud probability hotspot analysis using Getis-Ord Gi (Mebane 2015,8-12). Red colors show areas where local average scores are significantly above the overallaverage. Blue colors show areas where local average scores are significantly below theoverall average. Gray indicates polling station locations that do not differ significantly fromaverage. Significance levels refer to tests adjusted for the false discovery rate (Benjaminiand Hochberg 1995).

Figure 8: Frauds Conditional Probability Clusters and Outliers, 2016
(a) f̂ii (incremental frauds)
(b) f̂ei (extreme frauds)
Note: polling station fraud probability hotspot analysis using local Moran’s Ii (Mebane2015, 8-12). Red, high value among high values; blue, low value among low values; green,low value among high values; orange, high value among low values. Gray indicates pollingstation locations that do not differ significantly from average. Significance levels refer totests adjusted for the false discovery rate (Benjamini and Hochberg 1995).

Figure 9: Frauds Conditional Probability Region Averages, 2016
(a) f̂ii (incremental frauds region averages)
(b) f̂ei (extreme frauds region averages)