WORLD STEEL The truth DYNAMICS sustainable. Mistakes ...
28
WORLD STEEL DYNAMICS Truth & Consequences #47 The truth: Pricing volatility and disparities widening in steel boom. The consequence: Boom not sustainable. Mistakes common. The facts and forces driving global steel April 3, 2008 Peter F. Marcus (201) 503-0902 Becky E. Hites (201) 503-0935 Philipp G. Englin (201) 503-0908 Key points • The incredible boom in steel prices so far in 2008 is not sustainable. • Spy versus Counterspy: WSD’s Peter more bearish on the steel price outlook than Pat. • Steel scrap gone wild – price up $100-150 per gross ton. • Coking coal gone wild – international price up $150+ per tonne. • World Cost Curve gone topsy-turvy – some USA integrated mills among the world’s lowest cost. • Global pricing feedback • Hope for the global economy? Don’t give up on the global economy. WSD’s “Global Income Shift Paradigm” theory says that price spikes are good. • Might the USA dollar recover and the USA stock market take off? • Mistakes the norm when making decisions in volatile pricing environments • Chinese steel threatening, changing, dangerous, muzzled. The incredible steel price boom so far in 2008 is not sustainable Please consider these items: • The world export price for hot-rolled band in the past few weeks has risen at least $40 per tonne to about $940 per tonne (ranging from about $870 to $1,060 per tonne), FOB the port of export. The Chinese steel mills appear to be on the low side of the price range, with at least one EU producer on the high side. • Given the recent $100+ per gross ton surge in steel scrap prices, a last-gasp push of the world HRB export price seems possible to about $1,000 per tonne, FOB the port of export. In comparison, the current average export price may be about $940 per tonne. • The steel price boom is creating the conditions for a price reversal. First, steel prices are so lofty that some steel buyers can’t pass on the higher cost of steel to their customers. Second, some steel buyers will not be able to finance the higher cost of the steel they need to buy. Third, steel scrap prices seem to have risen to unsustainable heights. Once they start to fall, many steel buyers will sit on their hands anticipating a lower price for steel products (about one-half of the steel products produced in the world are impacted by the price of steel scrap).
Transcript of WORLD STEEL The truth DYNAMICS sustainable. Mistakes ...
WORLD STEEL DYNAMICS
Truth & Consequences #47
The truth: Pricing volatility and disparities widening in steel boom.
The consequence: Boom not sustainable. Mistakes common.
The facts and forces driving global steel
April 3, 2008 Peter F. Marcus (201) 503-0902 Becky E. Hites (201) 503-0935
Philipp G. Englin (201) 503-0908
Key points • The incredible boom in steel prices so far in 2008 is not sustainable. • Spy versus Counterspy: WSD’s Peter more bearish on the steel price outlook than Pat. • Steel scrap gone wild – price up $100-150 per gross ton. • Coking coal gone wild – international price up $150+ per tonne. • World Cost Curve gone topsy-turvy – some USA integrated mills among the world’s
lowest cost. • Global pricing feedback • Hope for the global economy? Don’t give up on the global economy. WSD’s “Global
Income Shift Paradigm” theory says that price spikes are good. • Might the USA dollar recover and the USA stock market take off? • Mistakes the norm when making decisions in volatile pricing environments • Chinese steel threatening, changing, dangerous, muzzled.
The incredible steel price boom so far in 2008 is not sustainable Please consider these items:
• The world export price for hot-rolled band in the past few weeks has risen at least $40 per tonne to about $940 per tonne (ranging from about $870 to $1,060 per tonne), FOB the port of export. The Chinese steel mills appear to be on the low side of the price range, with at least one EU producer on the high side.
• Given the recent $100+ per gross ton surge in steel scrap prices, a last-gasp push
of the world HRB export price seems possible to about $1,000 per tonne, FOB the port of export. In comparison, the current average export price may be about $940 per tonne.
• The steel price boom is creating the conditions for a price reversal. First, steel
prices are so lofty that some steel buyers can’t pass on the higher cost of steel to their customers. Second, some steel buyers will not be able to finance the higher cost of the steel they need to buy. Third, steel scrap prices seem to have risen to unsustainable heights. Once they start to fall, many steel buyers will sit on their hands anticipating a lower price for steel products (about one-half of the steel products produced in the world are impacted by the price of steel scrap).

WORLDSTEELDYNAMICS
2
• Indicators to watch in the months ahead, in WSD’s opinion, include:
Steel scrap prices, which are assured to remain highly volatile; The value of the U.S. dollar versus the Euro, which WSD thinks has a good
chance to rally in the next few months; The global steel demand outlook, which for the present is not looking good in
the Advanced Countries; and Steel buyer/seller psychology, for which the pendulum has now swung so far
in the favor of the mills that it may be at its limit.
• WSD’s “most likely” forecast calls for the world export price for hot-rolled band to peak about June this year and fall back to $675-725 per tonne by early in the fourth quarter of 2008. (Note: Prior to this year, a world export price of $700 per tonne, FOB the port of export, would have been a world record. Yet, given the surge in many steel mills’ costs this year, the $700 per tonne price today would cause a sizable margin squeeze.)
What will happen to HRB prices in the European, Chinese and USA home markets when the world export price declines? WSD thinks that HRB prices in Europe and China would respond almost immediately to a drop in the world export price. However, in the USA, because foreign deliveries are so low, a sizable fall in the home-market price may not occur for several months.
“The Snake”
$345Apr ‘97
---- The “V” ----
VolcanoMay’95
$475
$255Feb. ‘96
$300June ’94
Volcanoes and Death SpiralsWorld Hot-Rolled Band Export PriceDollars per metric tonne
Death Valley $185
Dec. 1998
$333Apr 2000
VOLCANO
Raw material
price spikes
MassiveEruption
$625 Sept-Oct 2004
Rock Bottom$175
Dec. 2001
$353Feb 2003
Death Spiral Threat$250, June 2003
MiniVolcano
MiniVolcano
$390July2005
$475Oct
2005
$400Dec2005
$610June2006
$502Dec2006
$596Mar2007
$550July2007
$585Oct
2007
$870Mar2008
$581Nov2007
Death Spiral
Death Spiral D
eath Spiral
RecordEruption
$280July2003
$275Sep
2003

WORLDSTEELDYNAMICS
3
Spy versus Counterspy Peter versus Pat
Peter and Pat are in disagreement about the steel price outlook. Peter thinks that a downturn in the world HRB export price is almost imminent (by June, if not earlier). Two of the forces driving up steel prices – surging steel scrap prices and a steel buyers’ panic – are not sustainable. Moreover, when the price declines on the world export market, he sees a sharper decline than Pat. Peter expects the price by the early fourth quarter to fall to $675-725 per tonne, FOB the port of export. Factors driving down the price will include steel buyers’ fear of price declines, stagnant demand for steel in Advanced Countries and, possibly, a stronger dollar. Pat is less near-term bearish than Peter on when the export price may peak and, subsequently, how much it will fall. Pat looks for a peak later in the summer and for the HRB export price to bottom out at $750-800 per tonne, FOB the port of export. Pat says that he was slow in recognizing how sharply steel export prices could rise because he was looking at the rise in raw material prices as the primary driver. Today, he’s more aware of the impact of steel trade flow shifts. Due to far lower Chinese steel exports, a physical shortage of steel has developed in parts of the Developing World outside of China. As he sees it, the price surge has been both cost-push (reflecting higher raw material costs) and demand-pull (due to regional imbalances). When the export price falls, he sees it being sustained at relatively high price levels because of: a) the huge rise in operating costs for producers of HRB the world over; b) the greater concentration of HRB producers outside of China than several years ago; c) steel buyers in most cases don’t seem to have excess inventories; and d) non-Chinese mills are more likely than in the past to quickly cut back production when the price falls because the cost of the last tonne is now so high. (Note: Pat McCormick was in charge of steel purchasing at Emerson for 20 years before joining WSD in October 2006. He spends virtually all of his time on what we call the buyer-seller interface.)

WORLDSTEELDYNAMICS
4
Steel scrap gone wild – price up $100-150 per gross ton Our contacts report that steel scrap prices in the USA are in the process of rising by about $100-150 per gross ton:
• #1 heavy melting steel scrap delivered to the steel plant appears to have risen to about $470 per gross ton delivered to the steel plant versus $330 per ton in February 2008 and $267 per ton in December 2007.
• Shredded scrap, delivered to the steel plant, is up to about $500 per gross ton
versus $387 in February 2008 and $305 per tonne in December 2007. Shredded prices have been relatively high due to strong export demand (in part stimulated by the weak U.S. dollar).
• Busheling, given the $155 per ton increases in the automotive auction on April 1,
is now about $575 per ton delivered to the steel plant versus $398 in February 2008 and $313 per ton in December 2007.
Moreover, it appears that the price of steel scrap delivered to Asia has surged to $625-655 per metric tonne in some cases. Pig iron, FOB Brazil, has risen to about $580 per tonne. We hear that the Japanese major steel mills have become big scrap buyers. Because the major steel mills are short of iron ore pellets and coking coal, they are increasing the steel scrap ratio as a proportion of the metallics charge in their BOF steelmaking furnaces. Steel production in Japan in 2007 via the BOF route was 90 million tonnes, which means that about 100 million tonnes of metallics were needed. If the mills decide to boost the scrap ratio by two points, let’s say from 12% to 14% of the charge, an additional two million tonnes of steel scrap would be needed. In comparison, global obsolete steel scrap recovery in 2007 was about 320 million tonnes. The global BOF and EAF steelmaking breakdown in 2007 was about as follows:
• Chinese BOF steel output was 439 million tonnes, and EAF output was 50 million tonnes.
• Non-Chinese BOF steel output was 461 million tonnes, and EAF output was 363
million tonnes.
• The global figures were BOF output at 900 million tonnes, and EAF output was 413 million tonnes.

WORLDSTEELDYNAMICS
5
Finished steel product prices have surged so substantially that, almost no matter what price an integrated mill pays for steel scrap, it wins. For example, if steel scrap is 20% of the metallics charge and the price rises by $250 per ton, this represents a $50 per ton increase in costs. In comparison, the world HRB export price is up about $300 per tonne this year – from $633 per tonne in early January to about $940 per tonne. Coking coal gone wild – international price up $150+ per tonne Regarding the one-year Australian coking coal settlement prices, FOB the port of export, our contacts now expect the following:
• Hard coking coal. The price may settle at $270 per tonne, FOB Australia, versus $98 per tonne last year. Hard coking coal represents 60% of total deliveries.
• Semi-hard coking coal. The price may settle at $200-220 per tonne, FOB
Australia, versus $88 per tonne last year. Soft coking coal represents about 40% of total deliveries.
Our contacts indicate that the recent spot price on hard coking coal sales to Japan was about $270 per tonne. This compares to the brief high of $325 per tonne on a few transactions perhaps a month ago. Sales of spot semi-hard coking coal may be about $230 per tonne (including Elk Valley of Canada). The coking coal trade also hears that Xstrata is seeking to obtain $300 per tonne when selling to Japan. However, there are mixed views on their success. Several contacts in the coal industry in the United States say that, in mid-2007, U.S. Steel booked ahead its coking coal needs for 2008, and also to a sizable extent for 2009 and 2010, at very low prices – perhaps $85 per net ton for hard coking coal, FOB the mine. The company does not confirm this point of view. World Cost Curve gone topsy-turvy – Some USA integrated mills among the world’s lowest cost Steelmakers’ costs have surged beyond expectations due to greater-than-imagined international price increases for coking coal, iron ore, steel scrap and metallurgical coke (the Chinese export price). Hence, North American integrated steel mills that have their own iron ore supplies – including the Gary plant of USS, the Burns Harbor and Dofasco plants of ArcelorMittal – have become low cost by global standards. Besides low raw material costs, labor costs for these plants probably represent no more than 20% of operating costs given the improvements in labor productivity over the years.

WORLDSTEELDYNAMICS
6
Where’s the best place to build a new steel plant? WSD remains with the view that the five best places in the world to build a new steel plant, in order, are India, the Middle East, the USA, Russia and Brazil. The five worst, in order, are Venezuela, Germany (the EU), Japan, Taiwan and China.
Surging Steel Mill Cost Inputs ($ per metric tonne unless otherwise indicated)
Cost Input Price in
Fall of 2007 Prior
Expected Price in
Spring of 2008
New Expected Price in
Spring of 2008
Comment
Iron ore 1-year international price for fines, FOB Brazil
$52 $68 $86 Need 1.6 tonnes per tonne shipped for integrated steel mill. Chinese spot iron ore price delivered to steel plant at $200 per tonne in March 2008 versus $160 in November 2007.
Coking coal 1-year international price, FOB Australia, for hard coking coal
$98 $150 $260 Need 0.55 tonnes per tonne shipped for integrated steel mill. Chinese spot coking coal price delivered to steel plant at $165 per tonne in March 2008 versus $120 in November 2007.
Metallurgical coke export price, FOB China
$360 $360 $520 Need 0.38 tonnes per tonne shipped for integrated steel mill.
Steel scrap #1 USA heavy melting
$250 $300 $470 Need 0.20 tonnes per tonne shipped for integrated mill; 1.03 tonnes for EAF-based steel mill.
Pig iron FOB Brazil
$275 $315 $580 Moves with scrap and hot-briquetted iron prices on world market.
Iron ore ocean freight cost Brazil to China
$85 $85 $70 Only about $8 per tonne in 2002.
Finished steel ocean freight cost Far East to USA
$100 $90 $85 Only about $25 per tonne in 2002.
Oil price per barrel
$90 $85 $105 Ranged from $20-29 per barrel in 2002.
Electricity, ferroalloy and freight costs in home country
100 (index number)
103 (index number)
105 (index number)
Prices stable to lower in freight costs and still rising in the other items.
Value of U.S. dollar per Euro
1.49 1.50 1.57 Dollars per Euro were 0.95 in 2002. The weaker the dollar, the lower the world export price of steel, all other things held the same.

WORLDSTEELDYNAMICS
7
Repositioning of the Global Steel Industry’s HRB World Cost Curve
($ per metric tonne unless otherwise indicated)
Hot-rolled band cost with overhead
November 2007 WSD World Cost
Curve
Spring 2008 costs (as
expected in the fall of
2007)
Spring 2008 costs (now expected)
Comment
Low-cost integrated mill with own iron ore: • USA • Brazil • Russia • India • China
$425 $345 $335 $350 $415
$435 $380 $345 $395 $445
$450 $455 $400 $495 $480
Improved relative cost position for those USA mills with their own iron ore mines, particularly given today’s steel scrap prices, is quite extraordinary.
Integrated mill purchasing iron ore and coking coal at the world or USA price: • USA • Brazil • Japan • Germany • China
$540 $375 $500 $545 $510
$625 $425 $550 $595 $545
$720 $520 $650 $710 $650
In China’s case, coking coal is purchased at the domestic price. Costs in Europe may be up 100-110 Euros ($156-170) per tonne. Coking coal has been less expensive in the United States.
USA EAF-based mini-sheet mill
$465
$530
$690
Mini-sheet mills are now investing to find their own upstream sources of metallics.
Global pricing feedback Our non-Chinese steel trading contacts are not yet seeing signs of “sticker shock” and/or a credit squeeze that would cause steel buyers to pull back orders. What are the export prices for hot-rolled band, FOB the port of export?
• The USA mills appear to be at about $920 per metric tonne.
• Chinese mills are at about $870 per tonne (which gives them a higher price realization than on domestic sales even after paying the 17% VAT and the 5% tax surcharge).

WORLDSTEELDYNAMICS
8
• One EU mill is at $1,068 (680 Euro) per tonne.
• The Russian mills appear to be at $960 per tonne.
• Ukrainian mills, apparently, are in the $910-980 per tonne, range. Of course, the export price varies to some extent on the shipping distance. Ocean freight rates remain fairly firm, says a contact. Steel slab is apparently priced at about $750 per tonne, FOB Russian ports, and at about $800 per tonne for the world’s leading non-CIS export sources. Hope for the global economy? Might the global economy overcome the triple whammy of price spikes in oil, raw materials and food prices? The answer is “yes,” in theory, if enough capital is allocated because of these spikes to create more supply and, at the same time, inflation in labor costs stays restrained. At this moment in time, we are not aware of a global surge in wage rates. WSD hopes that the incredible power of the information revolution – which promotes global GDP growth, stimulates rising fixed asset investment and dampens inflation – will work to offset the price spikes in oil, raw materials and food. The price spikes in these products are “signals” that more capital is needed to boost capacity. According to the “Global Income Shift Paradigm” way of looking at things, anything that promotes capital spending and a more rapid allocation of resources is good. Since the Developing World has a far higher ratio of savings and investment to GDP than the Advanced Countries, and since the Developing World grows faster than the Advanced Countries and now accounts for about 50% of global GDP on a purchasing power parity (PPP) basis, the global economy seems to be in a period in which fixed asset investment is rising as a share of global GDP.

WORLDSTEELDYNAMICS
9
Might the USA dollar recover and the USA stock market take off?
WSD thinks that the answer to both is “yes.” We see a combination of events that could be remarkably favorable. First, the USA trade deficit continues to diminish due to: a) reduced manufacturing costs versus those in many countries, which boosts exports of manufactured goods; b) rising food and grain prices, which boosts the USA export of these goods; and c) some drop in the international oil price because so much capital has been committed to increasing its supply (and, also, reduced consumption due to the high price). Second, the U.S. dollar starts to recover, especially versus the Euro, because of the far lower costs to produce manufactured products than in Europe. With the USA trade deficit lessening and common stock prices beaten down to attractive levels, the flow of funds away from USA common stocks starts to reverse itself. Third, the USA stock market takes off as foreign investors anticipate that the U.S. dollar has reached its low point and the profit outlook is improving for 2009. Interestingly, the Democratic candidates for president in the USA seem to be calling for more trade protection in order to protect U.S. jobs. In fact, the current situation is just the opposite. It’s the prospect of rising USA exports and increased fixed asset investment in the USA that holds the greatest hope for providing a rising number of good job opportunities in the country.
Mistakes the norm when making decisions in volatile pricing environments Steel buyers and sellers find it very hard to successfully anticipate future developments in highly volatile price situations. Competition is fierce, rivalries are strong and the buyer/seller relationship is greatly influenced by traditional behavior patterns. For example, in late 2007, WSD heard that:
• Some steel mills sold forward sizable tonnages for 2008 delivery. We are hearing rumblings that some EU mills did not negotiate sufficient price increases for 2008 with their largest customers such as their automotive accounts. For example, in Europe, perhaps the automotive price boosts were on the order of 50 Euro per tonne, speculates a contact, versus cost increases for 2008 that may be 100-110 Euro per tonne.
• Some large steel buyers did not consummate their one-year contracts for 2008
before 2007 ended. In this case, they are probably facing far more severe steel price boosts in 2008 than some of their competitors.
WORLDSTEELDYNAMICS
10
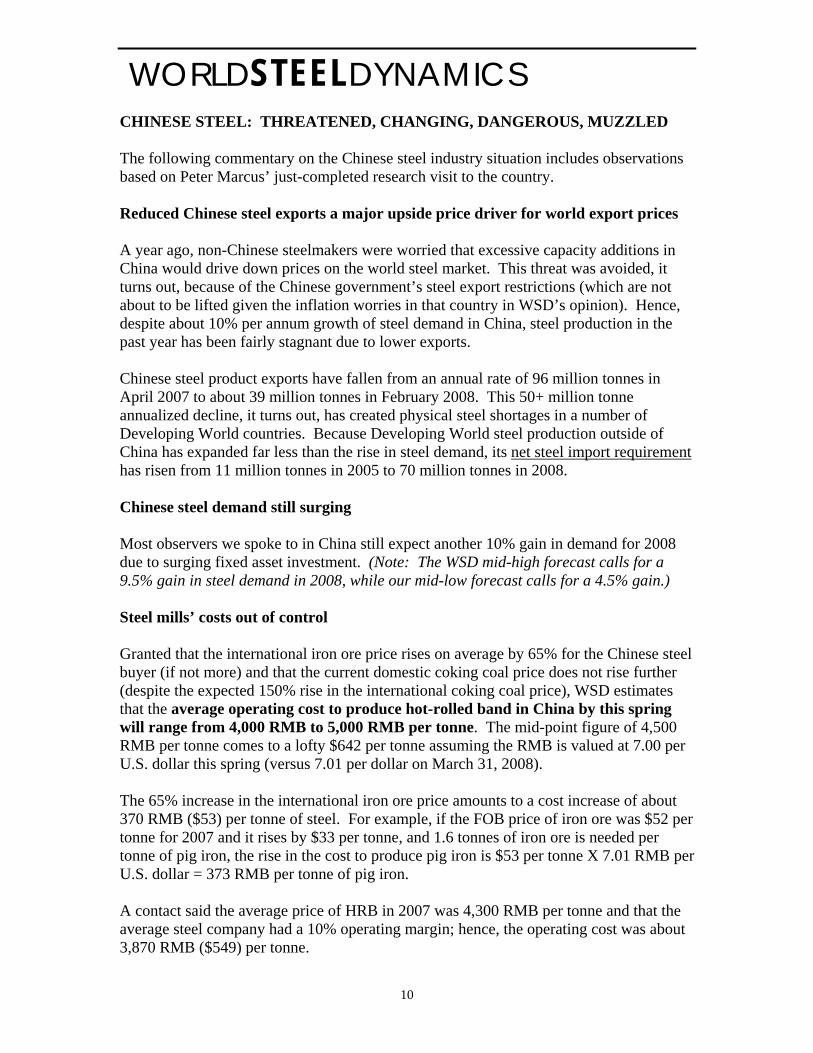
CHINESE STEEL: THREATENED, CHANGING, DANGEROUS, MUZZLED The following commentary on the Chinese steel industry situation includes observations based on Peter Marcus’ just-completed research visit to the country. Reduced Chinese steel exports a major upside price driver for world export prices A year ago, non-Chinese steelmakers were worried that excessive capacity additions in China would drive down prices on the world steel market. This threat was avoided, it turns out, because of the Chinese government’s steel export restrictions (which are not about to be lifted given the inflation worries in that country in WSD’s opinion). Hence, despite about 10% per annum growth of steel demand in China, steel production in the past year has been fairly stagnant due to lower exports. Chinese steel product exports have fallen from an annual rate of 96 million tonnes in April 2007 to about 39 million tonnes in February 2008. This 50+ million tonne annualized decline, it turns out, has created physical steel shortages in a number of Developing World countries. Because Developing World steel production outside of China has expanded far less than the rise in steel demand, its net steel import requirement has risen from 11 million tonnes in 2005 to 70 million tonnes in 2008. Chinese steel demand still surging Most observers we spoke to in China still expect another 10% gain in demand for 2008 due to surging fixed asset investment. (Note: The WSD mid-high forecast calls for a 9.5% gain in steel demand in 2008, while our mid-low forecast calls for a 4.5% gain.) Steel mills’ costs out of control Granted that the international iron ore price rises on average by 65% for the Chinese steel buyer (if not more) and that the current domestic coking coal price does not rise further (despite the expected 150% rise in the international coking coal price), WSD estimates that the average operating cost to produce hot-rolled band in China by this spring will range from 4,000 RMB to 5,000 RMB per tonne. The mid-point figure of 4,500 RMB per tonne comes to a lofty $642 per tonne assuming the RMB is valued at 7.00 per U.S. dollar this spring (versus 7.01 per dollar on March 31, 2008). The 65% increase in the international iron ore price amounts to a cost increase of about 370 RMB ($53) per tonne of steel. For example, if the FOB price of iron ore was $52 per tonne for 2007 and it rises by $33 per tonne, and 1.6 tonnes of iron ore is needed per tonne of pig iron, the rise in the cost to produce pig iron is $53 per tonne X 7.01 RMB per U.S. dollar = 373 RMB per tonne of pig iron. A contact said the average price of HRB in 2007 was 4,300 RMB per tonne and that the average steel company had a 10% operating margin; hence, the operating cost was about 3,870 RMB ($549) per tonne.

WORLDSTEELDYNAMICS
11
For coking coal in Shanxi Province, the average price in 2007 was 650 RMB per tonne, with the price in March 2008 at 950 RMB per tonne. Hence, given the increase of 300 RMB per tonne and a usage rate of about 0.6 tonnes per tonne of pig iron produced (and steel product shipped), the rise in operating costs would be about 180 RMB ($25) per tonne shipped. (Note: The current price at 900 RMB, or $127, per tonne in Shanxi Province compares to the forecasted 2008 price for Australian semi-hard coking coal, FOB Australia, of perhaps $220 per tonne and the hard Australian coking coal at $270 per tonne. Hence, the Chinese price may rise when the new Australian price is announced.)
Given a base cost of 3,870 RMB per tonne in 2007, cost changes in 2008 may be as follows:
• For the higher iron ore price, add 370 RMB per tonne.
• For higher coking coal costs, add 180 RMB per tonne (or more if the coking coal
price in China rises from March 2008 levels).
• For other cost items, add 200 RMB per tonne.
• If so, the cost in 2008 would be 4,520 per tonne – or $644 with the RMB at 7.01 per U.S. dollar.
WSD is now estimating that the operating costs to produce hot-rolled band in China in 2008 will range from 4,000 to 5,000 RMB per tonne for the mills that lack their own iron ore after the expected price increases in iron ore and coking coal on the world market. Chinese steel industry concentration continuing By about 2012, WSD forecasts there may be seven Chinese steel companies with capacities of 31 million tonnes or more. This list includes BaoSteel at maybe 90 million tonnes, Wuhan at 66 million tonnes, Anben at 52 million tonnes, Tangshen at 34 million tonnes, Capital Steel (Shougang) at 36 million tonnes; Jiangsu Shagang at 36 million tonnes and Shandong at 42 million tonnes. Concentration has increased in part because, in 2005, the Chinese government announced a policy to encourage consolidation because of its desire to reduce pollution and energy usage in the steel industry. Hot-rolled band spot price in China is depressed At $650 per tonne, the Chinese ex-works spot price compares to $940 per tonne for the world export price, FOB the port of export, about $930 per tonne for the USA (expected for delivery in May 2008), and about $1,000 per tonne in Europe. We think that the Chinese home market prices may rally as long as the world export price remains so lofty. In fact, at these export price levels, the Chinese steel mills have an

WORLDSTEELDYNAMICS
12
export incentive. Hot-rolled band, for example, could rise by $100 per tonne to about $750 per tonne, ex-works. (Note: If we assume $650 per tonne for the mills’ ex-works X 1.17 for the VAT expense when exporting = $761 per tonne + $25 per tonne for transport costs to the port and loading on a ship X 1.05 for the export tax = $825 per tonne. This price compares to the Chinese mills’ current export offering price, say our contacts, of about $870 per tonne, FOB the port of export.) Chinese steel mills may temporarily seek to boost HRB exports in the months ahead This writer is less convinced than before that jawboning actions by the government will cause the steel companies to voluntarily hold down their attempted foreign deliveries. However, if the Chinese mills turn to the world market as an outlet for their excess hot-rolled band capacity, we think a likely development is a further rise in the government’s export surcharge (currently at 5%). The steel industry in China is a significant contributor to inflationary pressures in China at present; hence, export restraints would be a positive for the economy. Once the world HRB export price heads down, WSD expects a sizable fall in the Chinese price – quite possibly to marginal cost “death spiral” levels The steel industry has a highly “competitive” pricing structure because of the many producers (35 wide hot strip mills in the country that are owned by 30 corporate entities). The mills have high fixed costs and remain production growth oriented in almost all cases. An important announcement was BaoSteel’s new monthly price for May. In the past, it had only announced price increases to be effective on a quarterly basis. If there is a pricing “death spiral” in the second half of 2008, it would be the second one since 2005. Given that the average marginal cost for the steel mills to produce hot-rolled band may be about 3,800 RMB ($542) per tonne, the mills’ ex-world spot price for hot rolled band might fall to this level versus the current figure of $653 per tonne (and the possible rise to $750 per tonne in the next few months).

WORLDSTEELDYNAMICS
13
Chinese capacity additions in hot-rolled band still prodigious China’s wide hot-rolled band capacity is forecast by WSD to rise to 164 million tonnes in 2008 versus 140 million tonnes in 2007, with a further boost to 221 million tonnes by 2010. A number of new coastal greenfield plants have recently received approval; hence, our capacity forecast for 2015 is 276 million tonnes. Interestingly, in BaoSteel’s case, it has received permission to build a major new greenfield steel plant on the coast in Guangzhou (just north of Hong Kong); however, it first must take over and close down several marginal long products steel plants in the region. Overcapacity to produce HRB in China is looming By this summer, WSD forecasts that oversupply of hot-rolled band will be a problem for the Chinese steel mills. In the past year, Chinese production of wide hot-rolled band has risen from about a 120 million tonne annual rate to a 132 million tonnes annual rate; yet, hot-rolled band capacity in 2007 rose by 33 million tonnes, with another 23 million tonnes planned in 2008.
Chinese "Death Spiral" Track (Hot-rolled band 4.75 mm thick home-market price, dollars per tonne)
250
300
350
400
450
500
550
600
650
7001/
7/20
05
2/18
/200
5
4/1/
2005
5/13
/200
5
6/24
/200
5
8/5/
2005
9/16
/200
5
10/2
8/20
05
12/9
/200
5
1/20
2006
3/3/
2006
4/14
/200
6
5/26
/200
6
7/7/
2006
8/18
/200
6
10/9
/200
6
11/1
7/20
06
12/2
9/20
06
2/9/
2007
3/23
/200
7
5/11
/200
7
6/22
/200
7
8/3/
2007
9/14
/200
7
10/2
6/20
07
12/7
/200
7
1/18
/200
8
2/29
/200
8
$ pe
r met
ric to
nne
ChinaHRB Domestic Price
March 2008 Marginal Cost ($542) of Average Cost Producer
2007 Marginal Cost ($297) of Average Cost Producer

WORLDSTEELDYNAMICS
14
If this scenarios is correct, the timing of the drop of the world steel export price – i.e., this coming June – may coincide with rising overcapacity in China to produce hot-rolled band.
Massive Chinese new greenfield seaside capacity is planned Listed below are 11 announced and/or possible additions with a capacity of 71 million tonnes on a first phase basis and 126 million tonnes on a second phase basis:
1. WISCO in Guangxi Province a seaside Greenfield approved. Phase I = 10 mmtpy. Phase II = 20 mmtpy. Odds = 100%.
2. BaoSteel in Guangdong Province a seaside Greenfield approved. Phase I = 10
mmtpy. Phase II = 20 mmtpy. Odds = 100%. 3. Shougang and Tangshan Steel combined for a seaside Greenfield plant at 10
mmtpy for Phase I. Planned for start up in late 2008. Phase II start up in 2011 at 20 mmtpy. Odds = 100%.
4. Ningbo Steel 4 mmtpy is already in operation. Phase II = 8 mmtpy.
Odds = 80%.
Chinese HRB Production vs. Capacity(million tonnes, annualized basis)
40
70
100
130
160
190
220
250
280
Jan-
02
May
-02
Sep-
02
Jan-
03
May
-03
Sep-
03
Jan-
04
May
-04
Sep-
04
Jan-
05
May
-05
Sep-
05
Jan-
06
May
-06
Sep-
06
Jan-
07
May
-07
Sep-
07
Jan-
08
May
-08
Sep-
08
Jan-
09
May
-09
Sep-
09
Jan-
10
May
-10
Sep-
10
Mill
ion
tonn
es, a
nnua
lized
oversupply
Capacity
Production
Source: WSD estimates

WORLDSTEELDYNAMICS
15
5. Jinan Steel and Laiwu Steel combined in Shandong Province, and planned a seaside Greenfield in Rizhao Port, for Phase I at 10 mmtpy. Phase II at 20 mmtpy. Odds = 70%.
6. Shougang to build a plate mill at 3 mmtpy just started up; then add another 2
mmtpy in 2010 at Qinghuangdao – a seaside location. Odds = 100%. 7. Angang planed a new plant – plate plus HRB. Phase I starts production in H1
2009 at seaside of Bayuquan. Phase I in H1 09 at 5 mmtpy; Phase II at 10 mmtpy. Odds = 100%.
8. Magang now is building a third BOF, CC and new HSM for production in 2010.
Adding 5 mmtpy. Odds = 100%. 9. In Jiangsu, Tieben Steel is not yet approved. Phase I capacity at 4 mmtpy.
Odds = 50%. Phase II capacity at 8 mmtpy. 10. Shagang is expanding another 6 mmtpy at a new site further to the West on the
Yangtzee River. 2 mmtpy plate and 4 mmtpy HRB. Odds = 100%. (Note: Shagang may be purchasing iron ore and coking coal mines in Shanxi Province.)
11. A private group wants to build a greenfield plant at Lianyungang City, seaport for
export of coal, at 10 mmtpy. Phase I = 4 mmtpy. Of which 2 mmtpy plate and 2 mmtpy HRB. Then, same size all over again. Owner is friendly with top leaders. Odds = 80% chance for approval.
Bank credit is not tight in China Money seems to be readily available because the country’s savings rate may be close to 50% of GDP and, as a consequence, the banks still have more money to lend than groups to lend it to. Rising corporate profits in recent years have held back the need for borrowed funds. In our discussion with steel traders, we did not hear stories that buyers were having trouble financing inventories.
Chinese economic growth seems likely to slow down in the second half of the year Reasons for the probable slowdown include: a) the Central Government has taken recurring steps to retard the growth of the economy – i.e., raising interest rates, increasing the banks’ reserve requirements and approving fewer major construction projects; b) the USA and European economies, which are key export outlets, are not strong at the present time; and c) the RMB has been appreciating more rapidly (no doubt because the government is worried about inflation). China is now in its 11th 5-year plan that ends in 2010. In this plan, the goal was to use energy 20% more efficiently, which may not be accomplished.

WORLDSTEELDYNAMICS
16
The country has 1.3 billion people, of which about 900 million have an average income of about 30,000 RMB per year. Yet, in a rural environment, we were told this is enough income to live on.
China is a heavy consumer of oil and gas; yet, consumption per capita is quite low.
Keys to growth for a Developing World country include: a) a good educational system; b) no religious strife; and c) a high investment to GDP ratio.
In the 2002-2007 time frame, Chinese investment rose 16% per year based on IMF data versus GDP growth of 10-11% per year. In the years ahead, the fixed asset investment growth rate will eventually fall to 14%, and then to 12%, and then to 10%. However, the timing of these changes is not yet clear, says a contact.
The government began measures in Q3 07 to slow down the economy. However, the impact was not immediate. Exports were lower in Q1 08 because the RMB has been strong. Fixed asset investment has remained strong due to high profits in raw materials (such as steel and coal).
Infrastructure spending growth may slow down in the years ahead because there will be enough roads and related items. Motorways are built on a PPP basis = public and private partnership; these roads collect tolls.
The snowstorms did not have much impact on the Chinese economy, in part because so much of it is located on the coast (where there were only limited snowstorms). Production of iron ore and coal were not impacted because these raw materials are produced in the North, where cold weather and snow is normal in the winter. The bad weather had little impact on construction and on agriculture.
Actions to restrict the Chinese rate of expansion included, starting in Q3 07:
• Higher interest rates.
• Tighter credit. The reserve ratio was boosted to about 15%. Also, there will be tighter licensing for the approval of new projects.
• Adjustment of interest rate spreads. The savings rate is now 4.5%, with the interest rate charged on loans at 7-11%.
Fixed asset investment at an 18% annual rate in H2 07. The growth may be 17% in H1 08, but only 14-15% in the second half of 2008. If so, this means that the rate of expansion of steel demand will be less.
Chinese economists are worried about the impact of a weaker U.S. economy.
WORLDSTEELDYNAMICS
17
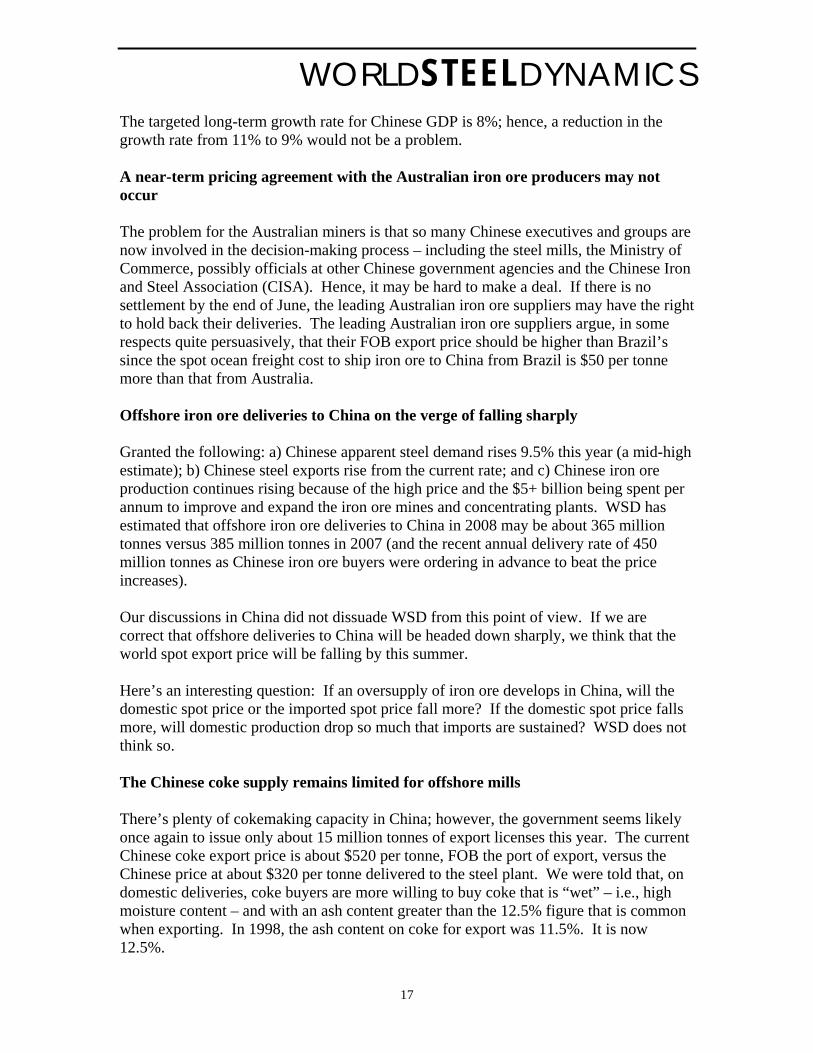
The targeted long-term growth rate for Chinese GDP is 8%; hence, a reduction in the growth rate from 11% to 9% would not be a problem. A near-term pricing agreement with the Australian iron ore producers may not occur The problem for the Australian miners is that so many Chinese executives and groups are now involved in the decision-making process – including the steel mills, the Ministry of Commerce, possibly officials at other Chinese government agencies and the Chinese Iron and Steel Association (CISA). Hence, it may be hard to make a deal. If there is no settlement by the end of June, the leading Australian iron ore suppliers may have the right to hold back their deliveries. The leading Australian iron ore suppliers argue, in some respects quite persuasively, that their FOB export price should be higher than Brazil’s since the spot ocean freight cost to ship iron ore to China from Brazil is $50 per tonne more than that from Australia. Offshore iron ore deliveries to China on the verge of falling sharply Granted the following: a) Chinese apparent steel demand rises 9.5% this year (a mid-high estimate); b) Chinese steel exports rise from the current rate; and c) Chinese iron ore production continues rising because of the high price and the $5+ billion being spent per annum to improve and expand the iron ore mines and concentrating plants. WSD has estimated that offshore iron ore deliveries to China in 2008 may be about 365 million tonnes versus 385 million tonnes in 2007 (and the recent annual delivery rate of 450 million tonnes as Chinese iron ore buyers were ordering in advance to beat the price increases). Our discussions in China did not dissuade WSD from this point of view. If we are correct that offshore deliveries to China will be headed down sharply, we think that the world spot export price will be falling by this summer. Here’s an interesting question: If an oversupply of iron ore develops in China, will the domestic spot price or the imported spot price fall more? If the domestic spot price falls more, will domestic production drop so much that imports are sustained? WSD does not think so. The Chinese coke supply remains limited for offshore mills There’s plenty of cokemaking capacity in China; however, the government seems likely once again to issue only about 15 million tonnes of export licenses this year. The current Chinese coke export price is about $520 per tonne, FOB the port of export, versus the Chinese price at about $320 per tonne delivered to the steel plant. We were told that, on domestic deliveries, coke buyers are more willing to buy coke that is “wet” – i.e., high moisture content – and with an ash content greater than the 12.5% figure that is common when exporting. In 1998, the ash content on coke for export was 11.5%. It is now 12.5%.

WORLDSTEELDYNAMICS
18
Some Indian blast furnace producers cannot afford to pay the price for coke at present. The cost to purchase coke in China, at the coke ovens, including the 17% VAT, is about 2,000-2,210 RMB per tonne says a contact. There is not great profit nowadays in the production of coke for export due to the high taxes, says a contact. The profit is only about 50 RMB per tonne if there are no by-product sales from the coke oven, and about 150 RMB per tonne with by-product sales.
The cost to buy an export license is now about $50 per tonne. Last year it was only $8-10 per tonne. When selling coke for domestic application, the moisture content is 7%. Yet, the price is the same as for export. The interest expense when exporting is 5%,
Coke exports in February were only 300,000 tonnes because of the bad weather. Chinese raw material prices up sharply Our contacts indicated the following:
• Coking coal sells for 1,400 RMB per tonne delivered to the steel plant. This price includes the VAT and a railroad freight expense of about 110 RMB per tonne.
• PCI delivered prices are 900 RMB per tonne. Large BFs may use 140-150 kg of PCI per tonne of pig iron; small ones about 50 kg of PCI. Even smaller BFs commonly use PCI because it saves money.
• Metallurgical coke prices are 2,250 RMB per tonne delivered to the steel plant.
• Domestic iron ore prices are 1,800 RMB per tonne on a dry basis with an iron content of 66% minimum.
Regarding freight costs for iron ore, from Liaoning Province in the Northeast (the home of Angang) to steel plants in the Shanghai region, it costs about 100 RMB to ship to the ports of Dalian, Yingkou and Donggang, and then 50 RMB per tonne to ship by barge to the Shanghai region. For iron ore in Hebei province (which produces the most steel of any province in China), the cost is the same to ship iron ore to ports such as Tangshan and Tianjin and then to barge the iron ore down the coast.
Barges hold 3,000 to 10,000 (not often) tonnes of iron ore. Cost to ship down the coast is about 80 RMB per tonne.

WORLDSTEELDYNAMICS
19
Good demand for Chinese steel rail Our contacts indicated that a high-speed rail line is being built from Beijing to Shanghai. The train will travel at 300 km/hour and take only 4.5 hours from city to city. The railroad line may require 5 million tonnes of steel during its construction. Similarly, a rail line from Harbin to Dailin may require 2 million tonnes of steel.
The Chinese steel marketplace incredibly complex In addition to the 150,000 or so steel trading firms, there are about 200 steel depots/marketplaces in China that distribute about 150-200 million tonnes of steel each year says a contact. The marketplaces vary in size from 0.1 to 1.0 million tonnes per year.
Prices in China at the present time seem to be headed up because inventory is low and the mills’ costs are rising. Steel futures not yet gaining major traction in China. During discussions with officials at SSEC (Shanghai Steel Exchange Center), we learned that daily trading of steel, in the form of common stocks with fixed expiration dates that represent tonnes of hot-rolled band, rebar and wire rod, has plummeted during the past year. Trading in hot-rolled band, rebar and wire rod apparently fell from 1.4 million tonnes per day in September 2007 to only 120,000 tonnes per day at present. Reasons for the decline include:
• The deposit – i.e., the guarantee – to trade share (a contract) rose from 10% to 20%. This increase was mandated by the Ministry of Commerce.
• Higher price of steel hurt because the guarantee posted for a transaction had to go up so much.
• Higher cost of money.
• Banks not lending as easily.
• After learning how to have transactions in steel, some of those trading steel shifted their activity to other products such as industrial metals, gold and agricultural products.
• The Shanghai Futures Exchange has grown in importance in non-steel products. The “guarantee” on the Shanghai Futures Exchange is only 10% of the value of the contract.

WORLDSTEELDYNAMICS
20
• A sizable increase in the number of competitors. There are now about a dozen competitors to SSEC.
• China’s Ministry of Commerce did not see the relative merits of their type of business. Hence, trading on the exchange was viewed by some as a quasi-legal activity. SSEC was viewed by some to be operating somewhere between a legal and illegal status.
• In the second half of 2007, we were told that “everybody liked to play with common stocks. Everyone was so sure that they would make money.”
The management of SSEC is planning to transform their business into on-line physical trading in steel – i.e., e-commerce in steel. Regarding the Shanghai Futures Exchange, we were told that it accounted for 57% of all Chinese futures transactions. It had a breakthrough in March 2007 with zinc, which was actively traded after listing. In January 2008, it started to trade gold futures. Trading on the Shanghai Futures Exchange has been approved by CSRC and CBRC.
The Shanghai Futures Exchange is studying a steel index.
The information contained in this report is based upon or derived from sources that are believed to be reliable; however, no representation is made that such information is accurate or complete in all material respects, and reliance upon such information as the basis for taking any actions is neither authorized nor warranted. A variety of factors, including changes in prices, shifts in demand, variations in supply, international currency movements, technological developments, governmental actions and/or other factors, including our own misjudgments or mistakes, may cause the statements herein concerning present and future conditions, results and trends to be inaccurate. The officers, directors, employees or stockholders of World Steel Dynamics Inc. do not, directly or indirectly, hold securities of, and/or that are related to, any of the companies that are referred to herein. World Steel Dynamics Inc. may act as a consultant to one or more of the companies mentioned in this report.
Copyright © 2008 by World Steel Dynamics Inc., all rights reserved.

WORLDSTEELDYNAMICS
21
2007 2012 2007 2012 2012 2007 2012Capacity Capacity Capacity Capacity Capacity Capacity Capacity
Baosteel Group 25 30 5 33-46 20 30 83-96
Wuhan Steel Group 12 15 9 29-32 20 21 64-67
Anben Steel Group 24 26 2 16-24 10 26 52-60
Tangshan Steel Group 14 18 10 13-20 0 24 31-38
Capital Steel Group 12 9 0 6--10 20 12 35-39
Jiangsu Shagang Group 15 15 8 13-20 6 23 34-41
Shandong Steel Group 24 26 0 4--9 20 24 50-55
Total 126 139 34 114-161 96 160 349-391
Source: WSD estimates
(mmtpy)China Large Steel Group With Production Capacity Over 15 Million Tonnes
Main Group Merging mills Group TotalNew projects
Chinese HRB Production Y on Y Change, 2006-2008
0%
10%
20%
30%
40%
50%
60%
70%
Jan-
06
Feb-
06
Mar
-06
Apr
-06
May
-06
Jun-
06
Jul-0
6
Aug-
06
Sep
-06
Oct
-06
Nov
-06
Dec
-06
Jan-
07
Feb-
07
Mar
-07
Apr
-07
May
-07
Jun-
07
Jul-0
7
Aug
-07
Sep-
07
Oct
-07
Nov
-07
Dec
-07
Jan-
08
Feb-
08
Source: WSD Estimates

WORLDSTEELDYNAMICS
22
2000 2001 2002 2003 2004 2005 2006 2007 2008e
Hot-rolled bandCapacity 41,400 43,500 45,150 59,040 79,300 125,070 152,790 185,790 208,490Production 16,463 17,299 20,996 32,000 59,740 83,140 107,900 130,060 150,000Consumption 17,638 19,916 25,389 36,800 61,750 85,700 102,930 122,090 138,000Implied Exports -1,175 -2,617 -4,393 -4,800 -2,010 -2,560 4,970 7,970 12,000Production y on y % 5.1% 21.4% 52.4% 86.7% 39.2% 29.8% 20.5% 15.3%
Cold rolled coilCapacity 12,100 12,400 13,300 15,300 23,400 37,900 48,600 56,000 71,300Production 9,800 10,300 11,240 12,800 13,200 21,060 30,660 39,320 49,000Consumption 13,600 14,800 15,300 15,760 16,930 28,300 32,800 40,970 48,000Implied Exports -3,800 -4,500 -4,060 -2,960 -3,730 -7,240 -2,140 -1,650 1,000Production y on y % 5.1% 9.1% 13.9% 3.1% 59.5% 45.6% 28.2% 24.6%
Galvanized/coatedCapacity 3,900 4,200 5,400 6,900 9,060 14,000 20,100 23,400 28,000Production 3,237 3,748 6,105 5,980 7,289 10,200 16,250 20,720 25,000Consumption 6,033 6,302 10,064 12,348 11,320 14,790 17,460 19,990 23,000Implied Exports -2,796 -2,554 -3,959 -6,368 -4,031 -4,590 -1,210 730 2,000Production y on y % 15.8% 62.9% -2.0% 21.9% 39.9% 59.3% 27.5% 20.7%
Other including plateCapacity 16,400 16,760 17,060 19,960 28,600 38,000 50,900 58,700 62,800Production 12,900 13,600 14,760 17,480 27,920 32,470 40,230 52,400 58,000Consumption 13,200 14,100 15,200 20,300 29,490 32,060 37,360 47,390 54,000Implied Exports -300 -500 -440 -2,820 -1,570 410 2,870 5,010 4,000
Production y on y % 5.4% 8.5% 18.4% 59.7% 16.3% 23.9% 30.3% 10.7%
Total HRBEQ products
Capacity 73,800 76,860 80,910 101,200 140,360 214,970 272,390 323,890 370,590Production 42,400 44,947 53,101 68,260 108,149 146,870 195,040 242,500 282,000Consumption 50,471 55,118 65,953 85,208 119,490 160,850 190,550 230,440 263,000Implied Exports -8,071 -10,171 -12,852 -16,948 -11,341 -13,980 4,490 12,060 19,000
Source: WSD ProductionTrack
(thousand tonnes)
China Flat Products Market Analysis (HRBEQ)

WORLDSTEELDYNAMICS
23
HRB HRB----------- Annualized Equivalent------------- ----------- Annualized Equivalent-------------
Shipment Import Export Net Import ASC Shipment Import Export Net Import ASC
Q1 05 521,549 140,267 140,267 521,549 8.1% Q1 05 103,126 57,031 36,007 21,024 124,149 1.6%Q2 05 530,858 139,086 139,086 530,858 7.7% Q2 05 101,438 55,484 34,481 21,003 122,441 -2.7%Q3 05 523,069 127,012 127,012 523,069 4.9% Q3 05 90,697 46,890 30,740 16,151 106,848 -9.3%Q4 05 542,044 131,348 131,348 542,044 4.4% Q4 05 100,295 51,641 35,293 16,348 116,642 -6.6%Q1 06 557,297 143,107 143,107 557,297 6.9% Q1 06 102,445 58,449 39,199 19,250 121,694 -2.0%Q2 06 604,331 151,569 151,569 604,331 13.8% Q2 06 109,221 62,784 38,627 24,157 133,378 8.9%Q3 06 594,096 151,780 151,780 594,096 13.6% Q3 06 100,231 59,793 37,410 22,383 122,614 14.8%Q4 06 616,277 155,942 155,942 616,277 13.7% Q4 06 105,078 61,589 39,501 22,088 127,166 9.0%Q1 07 614,594 154,639 154,639 614,594 10.3% Q1 07 108,872 65,138 39,796 25,341 134,214 10.3%Q2 07 649,132 160,668 160,668 649,132 7.4% Q2 07 109,811 65,911 40,414 25,497 135,308 1.4%Q3 07 636,648 163,730 163,730 636,648 7.2% Q3 07 100,091 66,380 40,726 25,655 125,745 2.6%Q4 07 645,492 163,411 163,411 645,492 4.7% Q4 07 105,832 66,628 40,888 25,740 131,572 3.5%
LP LP----------- Annualized Equivalent------------- ----------- Annualized Equivalent-------------
Shipment Import Export Net Import ASC Shipment Import Export Net Import ASC
Q1 05 510,529 81,258 81,258 510,529 14.4% Q1 05 89,886 25,101 27,703 -2,602 87,284 6.8%Q2 05 533,423 83,661 83,661 533,423 17.0% Q2 05 88,409 24,684 29,018 -4,335 84,074 1.8%Q3 05 529,364 76,582 76,582 529,364 13.6% Q3 05 80,412 19,623 26,518 -6,894 73,518 -8.6%Q4 05 553,935 82,263 82,263 553,935 13.7% Q4 05 88,344 23,368 28,866 -5,498 82,846 -1.5%Q1 06 528,173 85,993 85,993 528,173 3.5% Q1 06 89,185 24,806 30,208 -5,402 83,783 -4.0%Q2 06 573,729 97,909 97,909 574,580 7.7% Q2 06 96,677 27,345 30,859 -3,514 93,163 10.8%Q3 06 576,384 97,959 97,959 578,458 9.3% Q3 06 95,682 26,877 28,455 -1,578 94,104 28.0%Q4 06 593,671 104,816 104,816 593,671 7.2% Q4 06 97,989 28,979 30,359 -1,380 96,609 16.6%Q1 07 590,485 111,402 111,402 590,485 11.8% Q1 07 94,977 31,902 34,577 -2,676 92,301 10.2%Q2 07 615,407 127,695 127,695 615,407 7.1% Q2 07 95,879 32,637 33,901 -1,264 94,615 1.6%Q3 07 618,727 116,268 116,268 618,727 7.0% Q3 07 93,442 34,508 33,902 605 94,048 -0.1%Q4 07 622,689 114,458 114,458 622,689 4.9% Q4 07 95,787 34,508 33,902 605 96,392 -0.2%
Total Total----------- Annualized Equivalent------------- ----------- Annualized Equivalent-------------
Shipment Import Export Net Import ASC Shipment Import Export Net Import ASC
Q1 05 1,032,078 221,524 221,524 0 1,032,078 11.1% Q1 05 193,011 82,132 63,710 18,422 211,433 3.7%Q2 05 1,064,281 222,747 222,747 0 1,064,281 12.2% Q2 05 189,846 80,168 63,499 16,669 206,515 -0.9%Q3 05 1,052,433 203,594 203,594 0 1,052,433 9.1% Q3 05 171,110 66,514 57,257 9,256 180,366 -9.0%Q4 05 1,095,979 213,612 213,612 0 1,095,979 8.9% Q4 05 188,639 75,009 64,159 10,849 199,488 -4.6%Q1 06 1,085,470 229,100 229,100 0 1,085,470 5.2% Q1 06 191,630 83,255 69,407 13,848 205,478 -2.8%Q2 06 1,178,059 249,479 249,479 0 1,178,911 10.8% Q2 06 205,899 90,129 69,487 20,643 226,541 9.7%Q3 06 1,170,480 249,739 249,739 0 1,172,554 11.4% Q3 06 195,914 86,670 65,866 20,805 216,718 20.2%Q4 06 1,209,948 260,758 260,758 0 1,209,948 10.4% Q4 06 203,067 90,568 69,860 20,708 223,775 12.2%Q1 07 1,205,080 266,041 266,041 0 1,205,080 11.0% Q1 07 203,849 97,039 74,374 22,666 226,515 10.2%Q2 07 1,264,539 288,363 288,363 0 1,264,539 7.3% Q2 07 205,690 98,548 74,315 24,233 229,923 1.5%Q3 07 1,255,376 279,998 279,998 0 1,255,376 7.1% Q3 07 193,533 100,888 74,628 26,260 219,793 1.4%Q4 07 1,268,181 277,869 277,869 0 1,268,181 4.8% Q4 07 201,619 101,136 74,791 26,346 227,964 1.9%
WORLD LP Equivalent Demand Europe LP Equivalent Demand(000 Tonnes) (000 Tonnes)
(000 Tonnes) (000 Tonnes)WORLD HRB Equivalent Demand Europe HRB Equivalent Demand
(000 Tonnes) (000 Tonnes)WORLD Total Equivalent Demand Europe Total Equivalent Demand

WORLDSTEELDYNAMICS
24
HRB HRB----------- Annualized Equivalent------------- ----------- Annualized Equivalent-------------
Shipment Import Export Net Import ASC Shipment Import Export Net Import ASC
Q1 05 103,094 18,224 8,623 9,601 112,695 17.2% Q1 05 418,455 122,043 131,644 -9,601 408,854 5.9%Q2 05 112,641 22,384 9,701 12,682 125,323 35.1% Q2 05 418,217 116,702 129,385 -12,682 405,535 1.4%Q3 05 119,379 20,967 5,497 15,470 134,849 37.9% Q3 05 403,690 106,045 121,515 -15,470 388,220 -3.2%Q4 05 121,750 18,038 5,720 12,317 134,067 28.3% Q4 05 420,294 113,311 125,628 -12,317 407,976 -1.6%Q1 06 132,202 13,262 10,653 2,609 134,812 19.6% Q1 06 425,095 129,845 132,454 -2,609 422,486 3.3%Q2 06 161,861 13,426 16,384 -2,958 158,903 26.8% Q2 06 442,470 138,144 135,186 2,958 445,428 9.8%Q3 06 162,683 13,190 19,148 -5,957 156,726 16.2% Q3 06 431,413 138,589 132,632 5,957 437,370 12.7%Q4 06 184,135 12,071 22,335 -10,264 173,870 29.7% Q4 06 432,142 143,872 133,607 10,264 442,407 8.4%Q1 07 175,785 11,721 18,911 -7,190 168,594 25.1% Q1 07 438,810 142,918 135,728 7,190 446,000 5.6%Q2 07 202,984 12,034 24,626 -12,592 190,393 19.8% Q2 07 446,148 148,634 136,042 12,592 458,739 3.0%Q3 07 199,664 11,296 25,076 -13,781 185,883 18.6% Q3 07 436,985 152,434 138,653 13,781 450,765 3.1%Q4 07 197,101 11,322 24,541 -13,218 183,883 5.8% Q4 07 448,391 152,089 138,871 13,218 461,609 4.3%
LP LP----------- Annualized Equivalent------------- ----------- Annualized Equivalent-------------
Shipment Import Export Net Import ASC Shipment Import Export Net Import ASC
Q1 05 176,391 3,364 9,796 -6,432 169,959 35.6% Q1 05 334,138 77,894 71,462 6,432 340,571 6.1%Q2 05 196,113 4,040 12,171 -8,131 187,982 50.4% Q2 05 337,310 79,621 71,490 8,131 345,441 4.4%Q3 05 204,549 4,182 9,176 -4,995 199,554 49.6% Q3 05 324,816 72,401 67,406 4,995 329,810 -0.8%Q4 05 213,941 3,581 11,293 -7,711 206,229 42.1% Q4 05 339,995 78,682 70,971 7,711 347,706 1.6%Q1 06 201,446 3,246 12,986 -9,740 191,706 12.8% Q1 06 326,726 82,747 73,007 9,740 336,467 -1.2%Q2 06 230,420 3,459 22,417 -18,958 211,462 12.5% Q2 06 343,308 94,451 75,493 18,958 363,118 5.1%Q3 06 234,292 3,586 22,951 -19,366 214,927 7.7% Q3 06 342,091 94,373 75,008 19,366 363,531 10.2%Q4 06 244,542 3,375 30,721 -27,346 217,196 5.3% Q4 06 349,129 101,441 74,095 27,346 376,475 8.3%Q1 07 247,684 3,369 32,694 -29,324 218,359 13.9% Q1 07 342,802 108,032 78,708 29,324 372,126 10.6%Q2 07 267,812 3,553 48,623 -45,070 222,742 5.3% Q2 07 347,595 124,142 79,072 45,070 392,665 8.1%Q3 07 271,710 3,473 37,092 -33,620 238,090 10.8% Q3 07 347,017 112,796 79,176 33,620 380,637 4.7%Q4 07 267,538 3,500 35,281 -31,782 235,756 8.5% Q4 07 355,151 110,958 79,176 31,782 386,932 2.8%
Total Total----------- Annualized Equivalent------------- ----------- Annualized Equivalent-------------
Shipment Import Export Net Import ASC Shipment Import Export Net Import ASC
Q1 05 279,485 21,587 18,419 3,169 282,653 27.6% Q1 05 752,593 199,937 203,106 -3,169 749,425 6.0%Q2 05 308,754 26,424 21,872 4,552 313,306 43.9% Q2 05 755,528 196,323 200,875 -4,552 750,976 2.8%Q3 05 323,927 25,149 14,674 10,475 334,403 44.6% Q3 05 728,506 178,446 188,921 -10,475 718,031 -2.1%Q4 05 335,691 21,619 17,013 4,606 340,297 36.3% Q4 05 760,288 191,993 196,599 -4,606 755,682 -0.1%Q1 06 333,648 16,508 23,639 -7,131 326,517 15.5% Q1 06 751,822 212,592 205,461 7,131 758,952 1.3%Q2 06 392,281 16,884 38,801 -21,916 370,365 18.2% Q2 06 785,778 232,594 210,678 21,916 808,546 7.7%Q3 06 396,975 16,776 42,099 -25,323 371,653 11.1% Q3 06 773,504 232,963 207,640 25,323 800,902 11.5%Q4 06 428,677 15,446 53,056 -37,611 391,066 14.9% Q4 06 781,271 245,312 207,702 37,611 818,882 8.4%Q1 07 423,468 15,090 51,605 -36,515 386,954 18.5% Q1 07 781,612 250,950 214,436 36,515 818,126 7.8%Q2 07 470,796 15,587 73,249 -57,662 413,135 11.5% Q2 07 793,742 272,775 215,114 57,662 851,404 5.3%Q3 07 471,374 14,768 62,169 -47,400 423,973 14.1% Q3 07 784,002 265,230 217,830 47,400 831,402 3.8%Q4 07 464,639 14,822 59,822 -45,000 419,639 7.3% Q4 07 803,542 263,047 218,047 45,000 848,542 3.6%
(000 Tonnes)
(000 Tonnes)
All but China HRB Equivalent Demand(000 Tonnes)
All but China Total Equivalent Demand
China LP Equivalent Demand All but China LP Equivalent Demand(000 Tonnes)
(000 Tonnes)China HRB Equivalent Demand
(000 Tonnes)China Total Equivalent Demand

WORLDSTEELDYNAMICS
25
HRB HRB----------- Annualized Equivalent------------- ----------- Annualized Equivalent-------------
Shipment Import Export Net Import ASC Shipment Import Export Net Import ASC
Q1 05 63,965 5,324 32,291 -26,967 36,998 7.5% Q1 05 25,744 4,123 5,209 -1,086 24,658 -0.4%Q2 05 66,736 5,641 30,734 -25,093 41,643 13.3% Q2 05 26,508 4,542 5,813 -1,270 25,238 4.6%Q3 05 64,127 4,775 28,651 -23,875 40,252 10.5% Q3 05 25,805 4,055 6,716 -2,661 23,144 -6.8%Q4 05 64,311 4,756 26,102 -21,347 42,964 9.7% Q4 05 26,209 4,111 7,265 -3,155 23,055 -11.9%Q1 06 64,532 4,672 28,992 -24,320 40,212 8.7% Q1 06 25,128 4,267 7,638 -3,371 21,757 -11.8%Q2 06 66,753 4,525 32,050 -27,525 39,228 -5.8% Q2 06 25,100 4,084 4,623 -539 24,561 -2.7%Q3 06 67,002 4,799 32,368 -27,569 39,433 -2.0% Q3 06 26,922 4,566 5,331 -765 26,157 13.0%Q4 06 69,504 5,283 32,378 -27,095 42,409 -1.3% Q4 06 26,700 4,563 6,472 -1,909 24,791 7.5%Q1 07 68,029 5,262 31,897 -26,635 41,394 2.9% Q1 07 26,629 4,622 6,710 -2,088 24,541 12.8%Q2 07 68,873 5,211 32,113 -26,903 41,970 7.0% Q2 07 27,279 4,506 5,858 -1,352 25,927 5.6%Q3 07 68,909 5,103 32,828 -27,724 41,185 4.4% Q3 07 27,480 4,552 5,710 -1,158 26,322 0.6%Q4 07 71,133 5,156 33,137 -27,981 43,152 1.8% Q4 07 28,409 4,647 5,846 -1,199 27,210 9.8%
LP LP----------- Annualized Equivalent------------- ----------- Annualized Equivalent-------------
Shipment Import Export Net Import ASC Shipment Import Export Net Import ASC
Q1 05 59,481 993 9,034 -8,040 51,441 -6.1% Q1 05 26,288 471 4,548 -4,077 22,211 -0.4%Q2 05 62,058 998 9,081 -8,083 53,975 -5.0% Q2 05 27,449 650 4,000 -3,350 24,100 6.2%Q3 05 59,632 808 8,256 -7,448 52,184 -9.0% Q3 05 25,920 684 3,833 -3,149 22,771 -3.5%Q4 05 59,803 1,113 8,271 -7,158 52,645 -9.7% Q4 05 26,711 723 3,985 -3,262 23,450 -0.6%Q1 06 61,440 957 8,801 -7,843 53,597 4.2% Q1 06 25,437 747 4,457 -3,710 21,727 -2.2%Q2 06 63,555 916 8,936 -8,020 55,535 2.9% Q2 06 25,718 921 3,521 -2,599 23,119 -4.1%Q3 06 63,792 640 9,432 -8,792 55,000 5.4% Q3 06 27,773 799 4,531 -3,733 24,041 5.6%Q4 06 66,174 762 9,063 -8,301 57,873 9.9% Q4 06 27,355 735 4,205 -3,470 23,885 1.9%Q1 07 64,062 779 9,184 -8,405 55,657 3.8% Q1 07 26,647 934 3,754 -2,820 23,827 9.7%Q2 07 64,856 832 9,507 -8,675 56,182 1.2% Q2 07 27,233 1,134 3,394 -2,260 24,973 8.0%Q3 07 64,891 546 9,289 -8,743 56,148 2.1% Q3 07 27,673 1,327 3,643 -2,315 25,358 5.5%Q4 07 66,985 546 9,289 -8,743 58,242 0.6% Q4 07 28,595 1,327 3,643 -2,315 26,280 10.0%
Total Total----------- Annualized Equivalent------------- ----------- Annualized Equivalent-------------
Shipment Import Export Net Import ASC Shipment Import Export Net Import ASC
Q1 05 123,446 6,318 41,325 -35,007 88,439 -0.9% Q1 05 52,033 4,594 9,757 -5,163 46,869 -0.4%Q2 05 128,793 6,639 39,815 -33,176 95,617 2.2% Q2 05 53,957 5,192 9,812 -4,620 49,337 5.4%Q3 05 123,759 5,583 36,907 -31,324 92,436 -1.4% Q3 05 51,726 4,739 10,548 -5,810 45,916 -5.2%Q4 05 124,114 5,868 34,373 -28,505 95,609 -1.9% Q4 05 52,921 4,834 11,250 -6,416 46,505 -6.5%Q1 06 125,972 5,629 37,793 -32,164 93,808 6.1% Q1 06 50,565 5,014 12,095 -7,081 43,484 -7.2%Q2 06 130,308 5,442 40,987 -35,545 94,763 -0.9% Q2 06 50,818 5,006 8,144 -3,138 47,680 -3.4%Q3 06 130,794 5,440 41,800 -36,360 94,433 2.2% Q3 06 54,696 5,365 9,863 -4,498 50,198 9.3%Q4 06 135,678 6,044 41,441 -35,396 100,282 4.9% Q4 06 54,055 5,298 10,677 -5,379 48,675 4.7%Q1 07 132,092 6,041 41,082 -35,040 97,051 3.5% Q1 07 53,276 5,556 10,464 -4,908 48,368 11.2%Q2 07 133,729 6,042 41,620 -35,578 98,151 3.6% Q2 07 54,511 5,641 9,252 -3,611 50,900 6.8%Q3 07 133,801 5,650 42,117 -36,467 97,333 3.1% Q3 07 55,153 5,879 9,352 -3,473 51,680 3.0%Q4 07 138,118 5,702 42,426 -36,724 101,394 1.1% Q4 07 57,003 5,974 9,489 -3,514 53,489 9.9%
Japan LP Equivalent Demand South America LP Equivalent Demand(000 Tonnes)(000 Tonnes)
South America HRB Equivalent Demand(000 Tonnes)
South America Total Equivalent Demand(000 Tonnes)
Japan HRB Equivalent Demand(000 Tonnes)
Japan Total Equivalent Demand(000 Tonnes)

WORLDSTEELDYNAMICS
26
HRB HRB----------- Annualized Equivalent------------- ----------- Annualized Equivalent-------------
Shipment Import Export Net Import ASC Shipment Import Export Net Import ASC
Q1 05 41,732 1,804 18,625 -16,821 24,911 -5.8% Q1 05 79,144 13,517 23,621 -10,104 69,040 12.4%Q2 05 42,483 3,428 20,919 -17,491 24,992 7.7% Q2 05 80,605 14,546 23,252 -8,707 71,898 14.1%Q3 05 42,222 3,208 19,382 -16,173 26,049 -1.4% Q3 05 82,055 11,232 23,300 -12,068 69,987 14.7%Q4 05 44,497 3,203 18,525 -15,322 29,175 6.9% Q4 05 82,741 10,494 25,260 -14,766 67,975 5.0%Q1 06 42,917 2,603 17,483 -14,880 28,037 12.5% Q1 06 83,095 11,199 27,038 -15,839 67,256 -2.6%Q2 06 46,441 3,079 20,544 -17,466 28,976 15.9% Q2 06 84,856 13,584 26,649 -13,065 71,792 -0.1%Q3 06 45,536 3,759 18,865 -15,106 30,430 16.8% Q3 06 84,540 13,840 27,141 -13,301 71,239 1.8%Q4 06 46,406 4,087 16,279 -12,192 34,215 17.3% Q4 06 87,620 14,382 27,051 -12,669 74,951 10.3%Q1 07 46,983 3,202 17,950 -14,748 32,235 15.0% Q1 07 86,869 15,282 26,589 -11,307 75,562 12.3%Q2 07 47,366 4,483 15,800 -11,317 36,049 24.4% Q2 07 86,635 14,151 27,552 -13,400 73,234 2.0%Q3 07 45,966 3,991 16,662 -12,671 33,295 9.4% Q3 07 90,827 14,325 28,593 -14,267 76,559 7.5%Q4 07 47,275 4,251 16,142 -11,891 35,384 3.4% Q4 07 92,646 14,256 28,406 -14,150 78,495 4.7%
LP LP----------- Annualized Equivalent------------- ----------- Annualized Equivalent-------------
Shipment Import Export Net Import ASC Shipment Import Export Net Import ASC
Q1 05 55,193 3,104 18,726 -15,623 39,570 -3.3% Q1 05 51,217 9,383 4,883 4,499 55,716 3.9%Q2 05 55,534 4,308 18,293 -13,985 41,548 0.5% Q2 05 52,445 10,821 4,365 6,455 58,900 5.7%Q3 05 55,069 4,358 17,397 -13,040 42,029 -4.2% Q3 05 53,085 8,549 4,821 3,728 56,813 8.6%Q4 05 58,537 4,166 17,863 -13,696 44,840 7.3% Q4 05 54,580 8,655 5,054 3,601 58,181 3.8%Q1 06 51,607 3,986 16,648 -12,662 38,945 -1.6% Q1 06 55,974 10,532 5,374 5,159 61,132 9.7%Q2 06 55,943 4,502 18,926 -14,424 41,519 -0.1% Q2 06 57,209 12,971 5,708 7,263 64,472 9.5%Q3 06 55,367 5,871 19,717 -13,846 41,521 -1.2% Q3 06 57,060 12,073 5,710 6,363 63,423 11.6%Q4 06 56,702 6,621 18,101 -11,480 45,222 0.9% Q4 06 59,181 10,720 5,747 4,973 64,154 10.3%Q1 07 52,971 6,159 18,340 -12,181 40,790 4.7% Q1 07 58,340 13,350 5,949 7,401 65,742 7.5%Q2 07 53,474 7,151 18,594 -11,443 42,031 1.2% Q2 07 58,251 15,153 6,603 8,550 66,801 3.6%Q3 07 52,115 7,151 18,594 -11,443 40,672 -2.0% Q3 07 61,170 12,978 6,921 6,057 67,227 6.0%Q4 07 53,423 7,151 18,594 -11,443 41,980 -7.2% Q4 07 62,978 12,978 6,921 6,057 69,034 7.6%
Total Total----------- Annualized Equivalent------------- ----------- Annualized Equivalent-------------
Shipment Import Export Net Import ASC Shipment Import Export Net Import ASC
Q1 05 96,925 4,908 37,351 -32,444 64,481 -4.3% Q1 05 130,360 22,900 28,504 -5,604 124,756 8.4%Q2 05 98,016 7,736 39,212 -31,476 66,540 3.1% Q2 05 133,050 25,367 27,618 -2,251 130,798 10.2%Q3 05 97,292 7,566 36,779 -29,213 68,078 -3.1% Q3 05 135,140 19,780 28,121 -8,340 126,799 11.9%Q4 05 103,033 7,369 36,387 -29,018 74,015 7.1% Q4 05 137,322 19,149 30,314 -11,165 126,157 4.5%Q1 06 94,525 6,589 34,131 -27,542 66,982 3.9% Q1 06 139,069 21,731 32,411 -10,681 128,388 2.9%Q2 06 102,384 7,581 39,470 -31,889 70,495 5.9% Q2 06 142,065 26,555 32,357 -5,801 136,264 4.2%Q3 06 100,903 9,630 38,582 -28,952 71,951 5.7% Q3 06 141,600 25,913 32,851 -6,938 134,662 6.2%Q4 06 103,108 10,708 34,380 -23,672 79,436 7.3% Q4 06 146,801 25,102 32,798 -7,697 139,105 10.3%Q1 07 99,954 9,361 36,290 -26,929 73,025 9.0% Q1 07 145,209 28,632 32,538 -3,906 141,303 10.1%Q2 07 100,840 11,634 34,393 -22,760 78,080 10.8% Q2 07 144,886 29,304 34,155 -4,851 140,035 2.8%Q3 07 98,081 11,141 35,255 -24,114 73,967 2.8% Q3 07 151,997 27,303 35,514 -8,211 143,786 6.8%Q4 07 100,698 11,401 34,736 -23,334 77,364 -2.6% Q4 07 155,623 27,234 35,327 -8,094 147,529 6.1%
CIS LP Equivalent Demand OMA LP Equivalent Demand(000 Tonnes) (000 Tonnes)
CIS HRB Equivalent Demand OMA HRB Equivalent Demand(000 Tonnes) (000 Tonnes)
CIS Total Equivalent Demand OMA Total Equivalent Demand(000 Tonnes) (000 Tonnes)

WORLDSTEELDYNAMICS
27
HRB HRB----------- Annualized Equivalent------------- ----------- Annualized Equivalent-------------
Shipment Import Export Net Import ASC Shipment Import Export Net Import ASC
Q1 05 76,079 17,697 12,220 5,477 81,556 -3.5% Q1 05 61,597 13,788 9,023 4,765 66,362 -7.5%Q2 05 70,723 16,795 8,856 7,939 78,662 -12.9% Q2 05 59,617 11,442 4,765 6,676 66,294 -14.8%Q3 05 69,229 14,018 7,612 6,406 75,635 -19.0% Q3 05 59,483 11,231 5,008 6,224 65,707 -17.6%Q4 05 72,619 17,528 8,690 8,838 81,456 -12.4% Q4 05 60,744 14,160 3,857 10,303 71,047 -11.5%Q1 06 76,778 21,513 8,307 13,206 89,984 10.3% Q1 06 64,974 17,004 4,830 12,174 77,148 16.3%Q2 06 79,074 25,457 8,281 17,176 96,250 22.4% Q2 06 66,519 20,168 4,499 15,669 82,189 24.0%Q3 06 76,078 25,292 7,782 17,510 93,588 23.7% Q3 06 63,626 20,815 4,182 16,632 80,258 22.1%Q4 06 65,921 22,036 7,413 14,623 80,544 -1.1% Q4 06 54,459 17,902 4,151 13,751 68,210 -4.0%Q1 07 69,439 16,039 8,224 7,815 77,254 -14.1% Q1 07 57,260 13,139 4,233 8,905 66,165 -14.2%Q2 07 73,971 17,356 10,053 7,303 81,273 -15.6% Q2 07 60,975 14,276 5,611 8,665 69,640 -15.3%Q3 07 70,857 16,182 9,872 6,310 77,167 -17.5% Q3 07 57,880 13,168 5,918 7,249 65,129 -18.8%Q4 07 69,807 15,916 10,192 5,724 75,530 -6.2% Q4 07 56,908 12,902 6,239 6,663 63,571 -6.8%
LP LP----------- Annualized Equivalent------------- ----------- Annualized Equivalent-------------
Shipment Import Export Net Import ASC Shipment Import Export Net Import ASC
Q1 05 29,232 13,938 5,087 8,851 38,083 22.6% Q1 05 20,395 11,032 3,742 7,289 27,684 18.9%Q2 05 27,904 16,125 5,263 10,862 38,766 9.2% Q2 05 18,544 10,459 3,752 6,707 25,251 4.7%Q3 05 27,199 13,886 5,432 8,454 35,652 2.1% Q3 05 20,155 9,792 3,797 5,995 26,150 6.9%Q4 05 28,832 14,953 5,379 9,574 38,406 13.8% Q4 05 18,737 11,191 3,835 7,356 26,093 11.2%Q1 06 24,066 18,487 5,898 12,590 36,656 -3.7% Q1 06 16,847 12,941 4,129 8,813 25,659 -7.3%Q2 06 25,383 19,269 6,155 13,115 38,498 -0.7% Q2 06 17,768 13,489 4,308 9,180 26,948 6.7%Q3 06 24,801 19,089 5,931 13,157 37,959 6.5% Q3 06 17,361 13,362 4,152 9,210 26,571 1.6%Q4 06 22,182 16,513 5,715 10,798 32,980 -14.1% Q4 06 15,528 11,559 4,001 7,558 23,086 -11.5%Q1 07 32,616 13,685 6,085 7,600 40,216 9.7% Q1 07 22,831 9,579 4,259 5,320 28,151 9.7%Q2 07 34,678 14,426 6,048 8,378 43,056 11.8% Q2 07 24,275 10,098 4,233 5,865 30,139 11.8%Q3 07 34,189 14,637 5,908 8,729 42,918 13.1% Q3 07 23,932 10,246 4,135 6,110 30,043 13.1%Q4 07 33,671 14,637 5,908 8,729 42,401 28.6% Q4 07 23,570 10,246 4,135 6,110 29,680 28.6%
Total Total----------- Annualized Equivalent------------- ----------- Annualized Equivalent-------------
Shipment Import Export Net Import ASC Shipment Import Export Net Import ASC
Q1 05 105,312 31,635 17,307 14,328 119,640 3.5% Q1 05 81,992 24,819 12,765 12,054 94,046 -1.1%Q2 05 98,627 32,920 14,119 18,801 117,428 -6.6% Q2 05 78,162 21,900 8,517 13,383 91,545 -10.2%Q3 05 96,428 27,904 13,044 14,860 111,287 -13.3% Q3 05 79,638 21,024 8,805 12,218 91,856 -11.9%Q4 05 101,451 32,481 14,069 18,412 119,863 -5.4% Q4 05 79,481 25,351 7,692 17,659 97,140 -6.4%Q1 06 100,844 40,000 14,204 25,796 126,640 5.9% Q1 06 81,821 29,945 8,959 20,986 102,807 9.3%Q2 06 104,457 44,726 14,436 30,290 134,748 14.7% Q2 06 84,288 33,657 8,807 24,850 109,137 19.2%Q3 06 100,880 44,381 13,713 30,668 131,547 18.2% Q3 06 80,987 34,177 8,334 25,843 106,829 16.3%Q4 06 88,103 38,549 13,128 25,420 113,524 -5.3% Q4 06 69,986 29,461 8,151 21,310 91,296 -6.0%Q1 07 102,055 29,724 14,309 15,415 117,469 -7.2% Q1 07 80,091 22,718 8,493 14,225 94,316 -8.3%Q2 07 108,649 31,782 16,101 15,681 124,330 -7.7% Q2 07 85,250 24,374 9,845 14,529 99,779 -8.6%Q3 07 105,046 30,819 15,780 15,039 120,085 -8.7% Q3 07 81,813 23,413 10,054 13,360 95,172 -10.9%Q4 07 103,478 30,553 16,100 14,453 117,931 3.9% Q4 07 80,478 23,148 10,374 12,773 93,251 2.1%
(000 Tonnes)(000 Tonnes)
(000 Tonnes)
(000 Tonnes) (000 Tonnes)North America Total Equivalent Demand USA Total Equivalent Demand
North America HRB Equivalent Demand USA HRB Equivalent Demand
North America LP Equivalent Demand USA LP Equivalent Demand
(000 Tonnes)

WORLDSTEELDYNAMICS
28
Mark your calendar!
STEEL SUCCESS STRATEGIES XXIII
A joint effort of AMM and World Steel Dynamics
June 23-25, 2008
Sheraton New York New York City
Our preliminary theme next year is:
Steel’s New World New Priorities New Strategies New Winners
http://www.WorldSteelDynamics.com