World Energy Outlook 2011 WEO-2012 Colation... · © OECD/IEA 2011 World Energy Outlook 2011 Laura...
9
© OECD/IEA 2011 World Energy Outlook 2011 Laura Cozzi Deputy Head, Office of the Chief Economist Coalition for energy savings -Brussels, 26 April 2012
Transcript of World Energy Outlook 2011 WEO-2012 Colation... · © OECD/IEA 2011 World Energy Outlook 2011 Laura...
© OECD/IEA 2011
World Energy Outlook 2011
Laura Cozzi Deputy Head, Office of the Chief Economist
Coalition for energy savings -Brussels, 26 April 2012
© OECD/IEA 2011
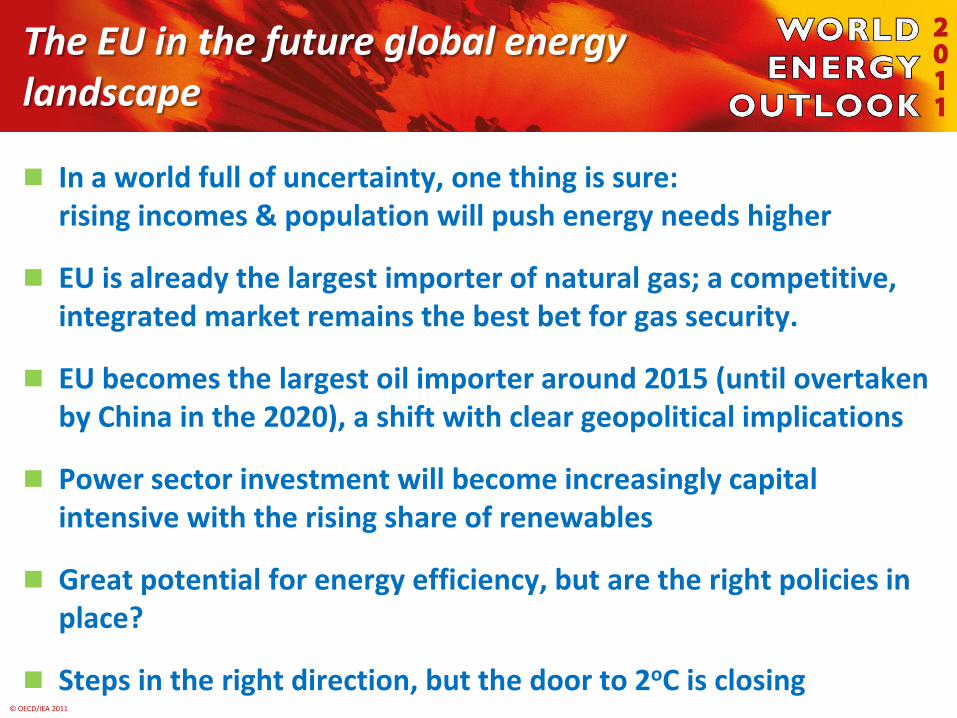
The EU in the future global energy landscape
In a world full of uncertainty, one thing is sure: rising incomes & population will push energy needs higher
EU is already the largest importer of natural gas; a competitive, integrated market remains the best bet for gas security.
EU becomes the largest oil importer around 2015 (until overtaken by China in the 2020), a shift with clear geopolitical implications
Power sector investment will become increasingly capital intensive with the rising share of renewables
Great potential for energy efficiency, but are the right policies in place?
Steps in the right direction, but the door to 2oC is closing
© OECD/IEA 2011
0
50
100
150
200
250
300
350
400
450
2008 2009 2010 2011
EUR
billion
Gas
Oil
3.1%
2.2%
2.7%
3.3%
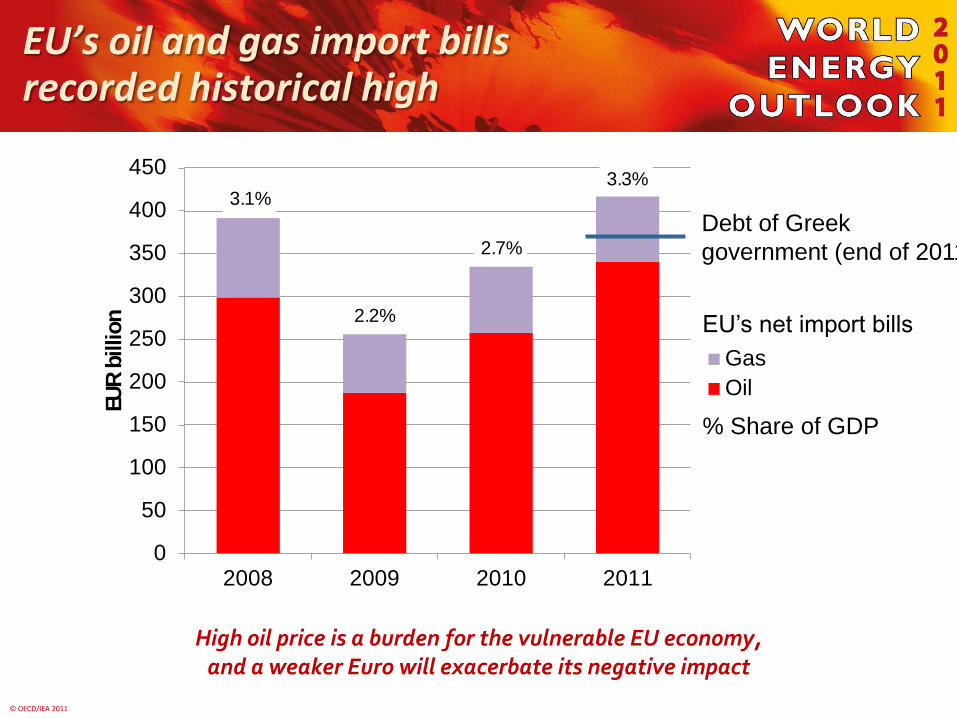
EU’s oil and gas import bills recorded historical high
High oil price is a burden for the vulnerable EU economy, and a weaker Euro will exacerbate its negative impact
EU’s net import bills
% Share of GDP
Debt of Greek
government (end of 2011)
© OECD/IEA 2011
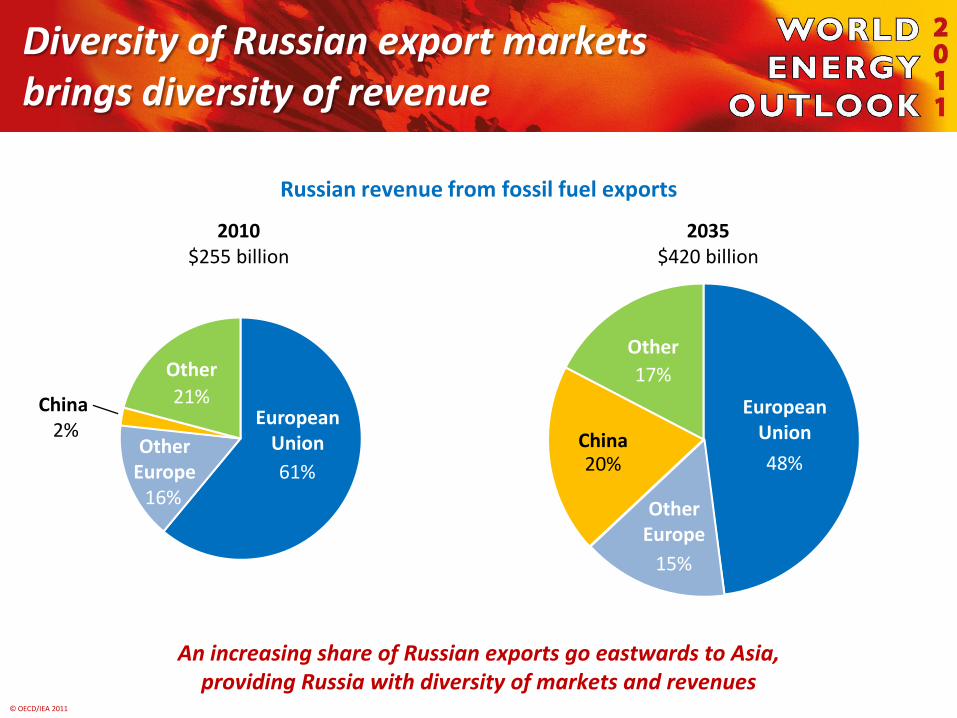
Diversity of Russian export markets brings diversity of revenue
Russian revenue from fossil fuel exports
An increasing share of Russian exports go eastwards to Asia, providing Russia with diversity of markets and revenues
2010 $255 billion
61% 16%
21%
2035 $420 billion
48%
European Union
17%
Other
20% China
15%
Other Europe
European Union Other
Europe
China 2%
Other
© OECD/IEA 2011
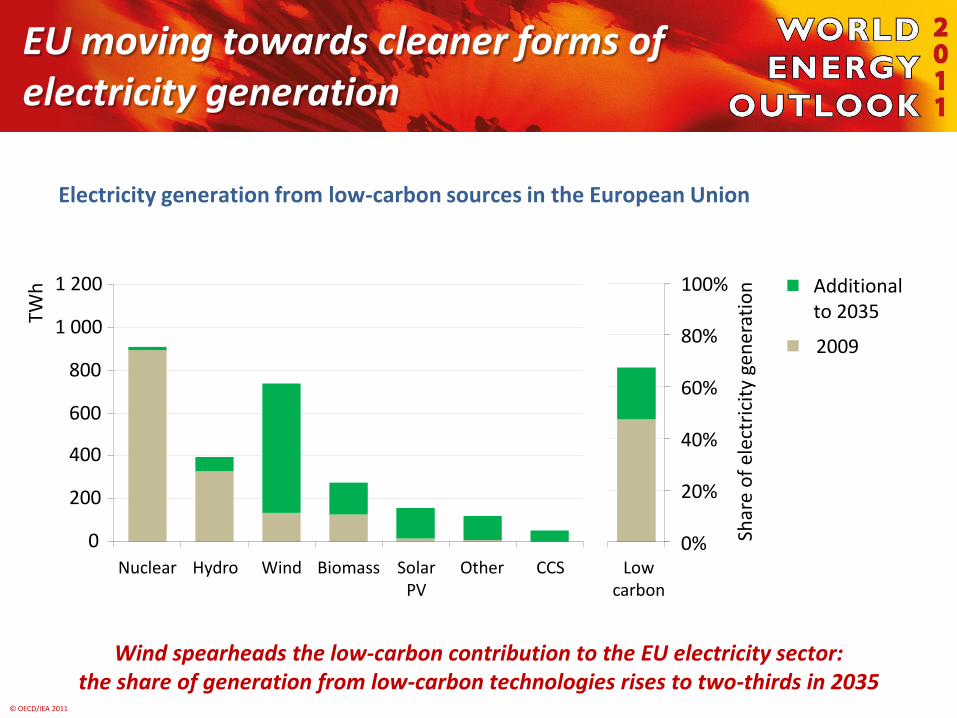
EU moving towards cleaner forms of electricity generation
Wind spearheads the low-carbon contribution to the EU electricity sector: the share of generation from low-carbon technologies rises to two-thirds in 2035
Electricity generation from low-carbon sources in the European Union
Additional to 2035
2009
0
200
400
600
800
1 000
1 200
Nuclear Hydro Wind Biomass Solar PV
Other CCS
TWh
0%
20%
40%
60%
80%
100%
Low carbon
Shar
e o
f el
ectr
icit
y ge
ner
atio
n

© OECD/IEA 2011
Efficiency gains can contribute most to EU emissions reductions
Energy efficiency measures – driven by strong policy action across all sectors – account for 50% of the cumulative CO2 abatement over the Outlook period
European Union energy-related CO2 emissions abatement in the 450 Scenario relative to the New Policies Scenario
Abatement
2020 2035
Efficiency 68% 48%
Renewables 25% 21%
Biofuels 2% 6%
Nuclear 1% 11%
CCS 3% 14%
Total (Mt CO2) 269 1032
1.5
2.0
2.5
3.0
3.5
4.0
2010 2015 2020 2025 2030 2035
Gt
New Policies Scenario
450 Scenario
© OECD/IEA 2011
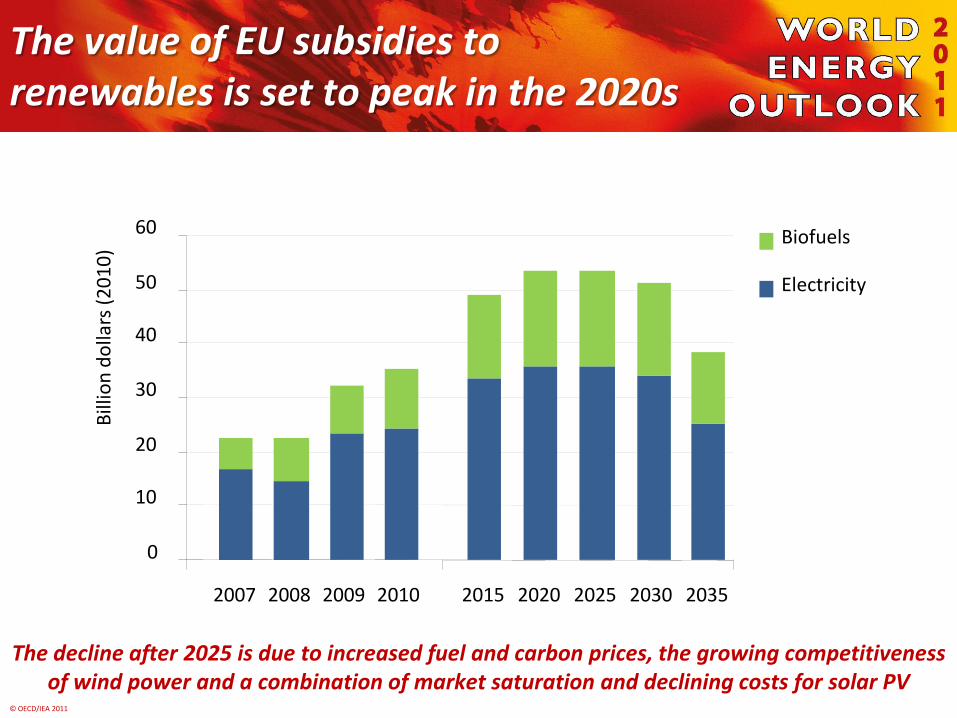
The value of EU subsidies to renewables is set to peak in the 2020s
The decline after 2025 is due to increased fuel and carbon prices, the growing competitiveness of wind power and a combination of market saturation and declining costs for solar PV
0
10
20
30
40
50
60
2007 2008 2009 2010 2015 2020 2025 2030 2035
Bill
ion
do
llars
(2
01
0)
Biofuels
Electricity

© OECD/IEA 2011
0
5
10
15
20
25
30
35
40
2010 2020 2025 2030 2035
Delay until 2017
Delay until 2015
2015
Emissions from existing infrastructure
The door to 2°C is closing, but will we be “locked-in” ?
Without further action, by 2017 all CO2 emissions permitted in the 450 Scenario will be “locked-in” by existing power plants, factories, buildings, etc
45
6°C trajectory
2°C trajectory
CO
2 e
mis
sio
ns
(gig
gato
nn
es)

© OECD/IEA 2011
Overview of WEO-2012
A full update of energy projections
by country, fuel & sector, to 2035
Objective & comprehensive analysis of topical issues
Fuel focus: energy efficiency – how to unlock the potential
climate impact on energy trends
energy-water nexus
indicators to track energy access
In addition, 2 special reports
29 May: the role of best practices (“Golden Rules”) for a Golden Age of Gas
9 October: first-ever in-depth outlook for Iraq (also included in full WEO)
Full WEO-2012 launch on 12 November