Energy Markets Outlook · Energy Markets Outlook September 2009 Outlook 1 ... GLOBAL MARKET ISSUES...
80
Energy Markets Outlook September 2009 1 Outlook GSC Energy Ashmead Pringle – GSC Energy
-
Upload
duonghuong -
Category
Documents
-
view
224 -
download
2
Transcript of Energy Markets Outlook · Energy Markets Outlook September 2009 Outlook 1 ... GLOBAL MARKET ISSUES...
Energy Markets OutlookSeptember 2009
1Outlook
GSC EnergyAshmead Pringle – GSC Energy
GSC Energy
©2009 The information reflected herein is derived from sources believed to be reliable; however, this information is not guaranteed as to its accuracy or completeness. This material and any view expressed herein are provided for any view expressed herein are provided for informational purposes only and should not be construed in any way as an inducement to buy or sell commodity futures or options contracts. Trading futures involves risk of loss.
2Outlook
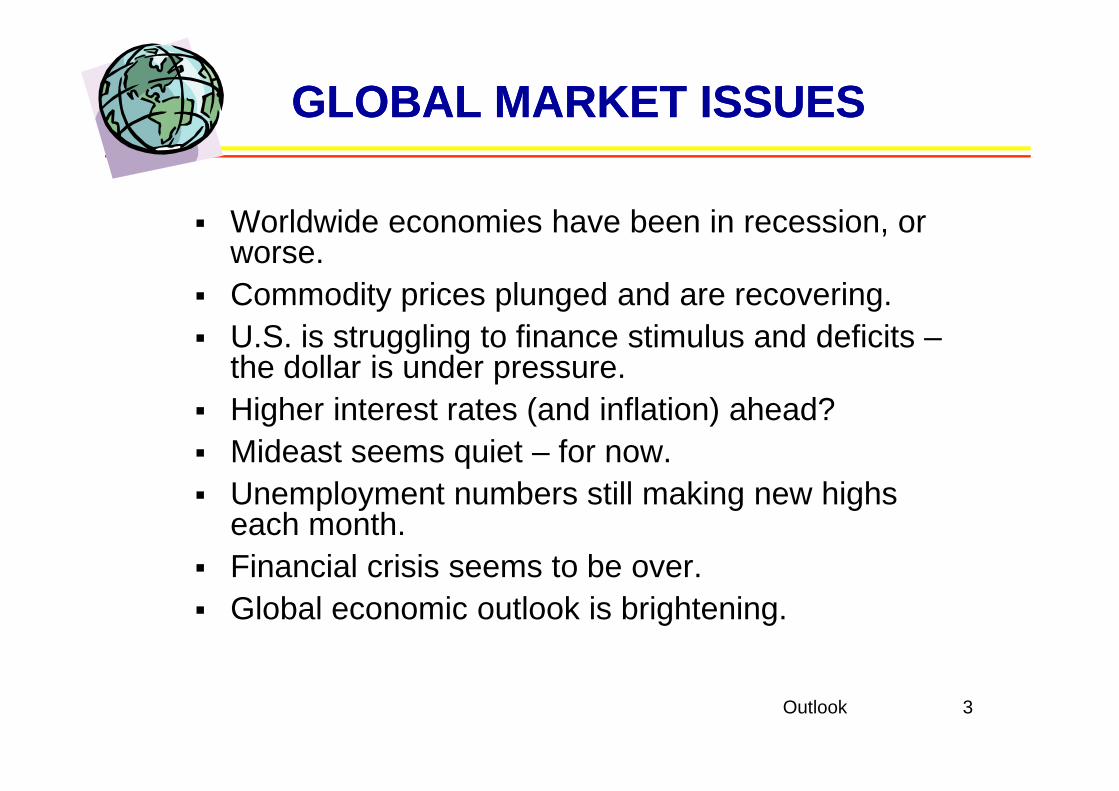
� Worldwide economies have been in recession, or worse.
� Commodity prices plunged and are recovering.� U.S. is struggling to finance stimulus and deficits –
the dollar is under pressure.Higher interest rates (and inflation) ahead?
GLOBAL MARKET ISSUESGLOBAL MARKET ISSUES
3Outlook
� Higher interest rates (and inflation) ahead? � Mideast seems quiet – for now.� Unemployment numbers still making new highs
each month.� Financial crisis seems to be over.� Global economic outlook is brightening.
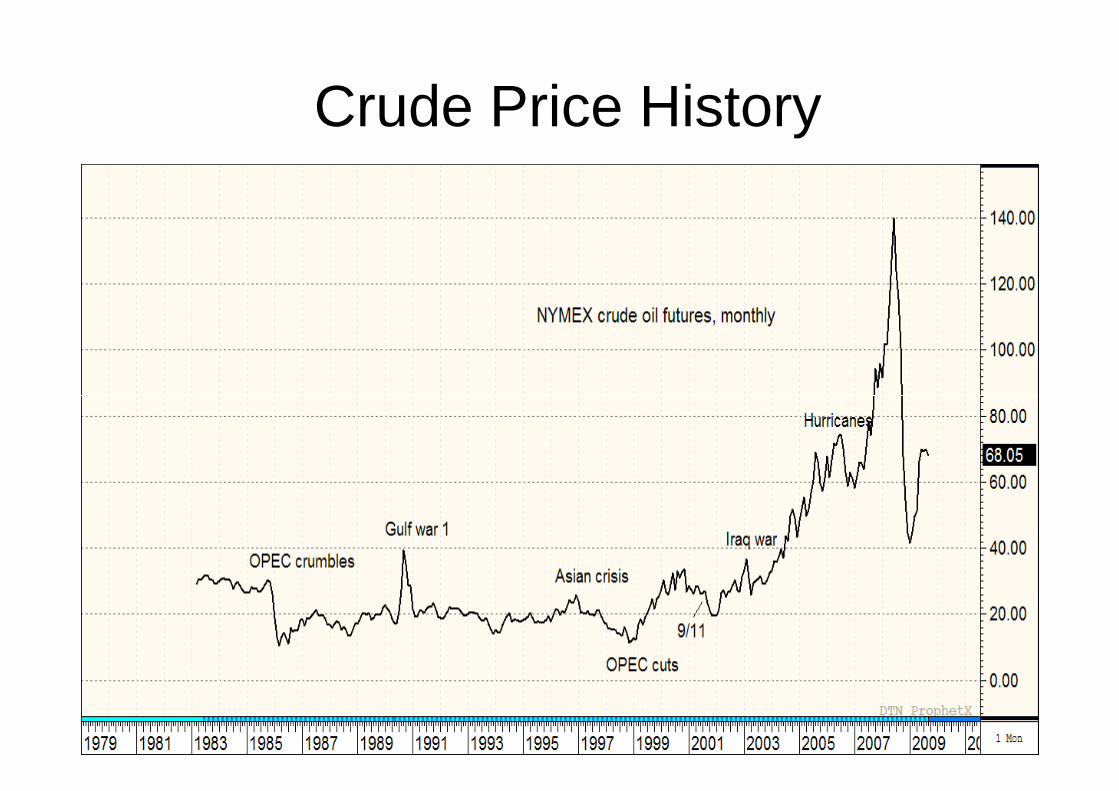
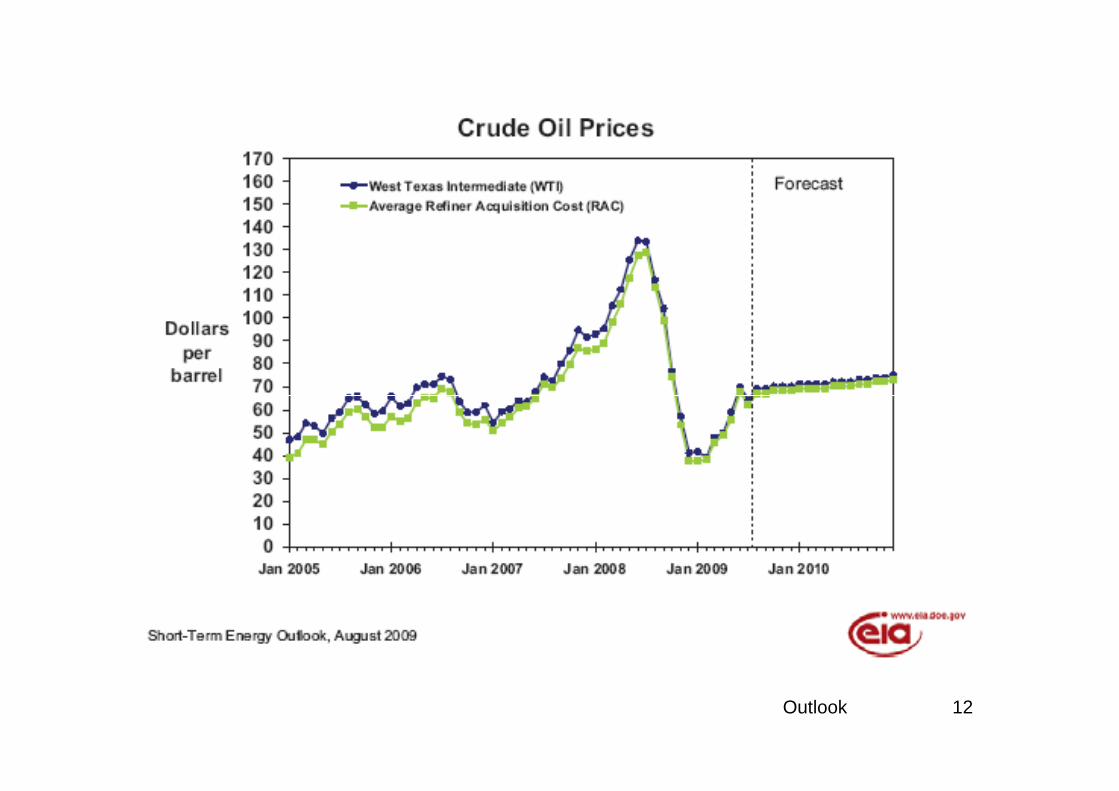
Crude Price History
4Outlook
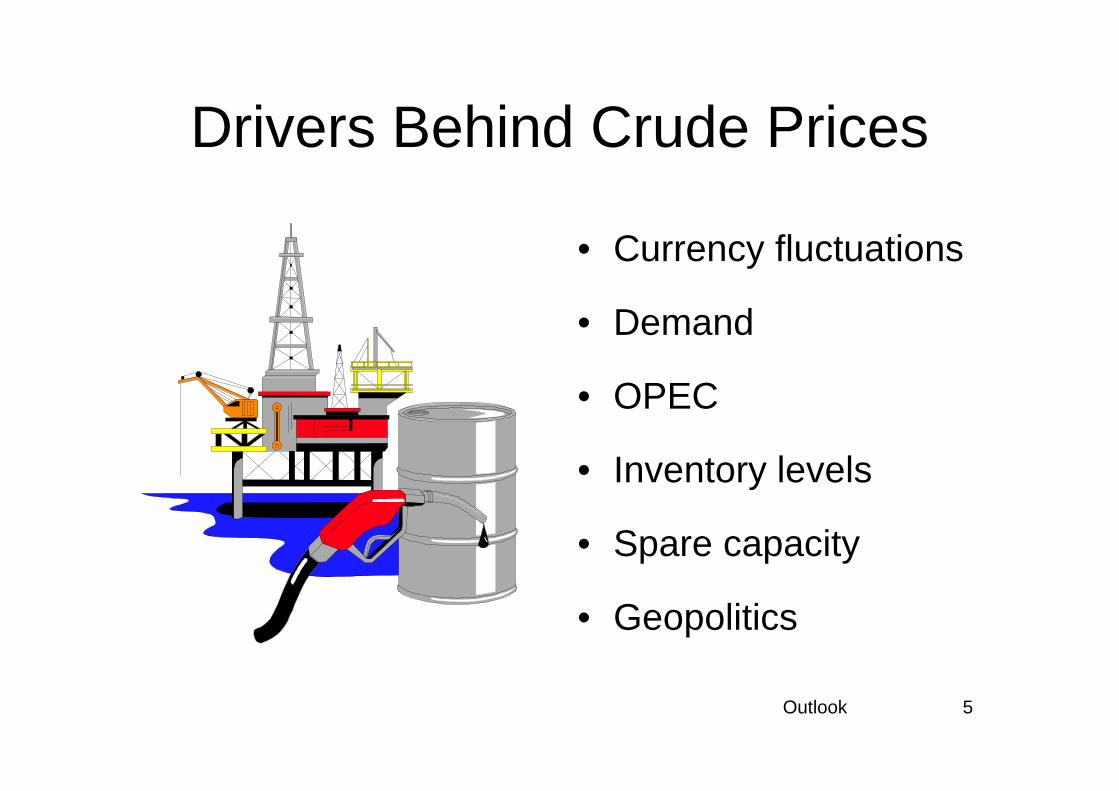
Drivers Behind Crude Prices
• Currency fluctuations
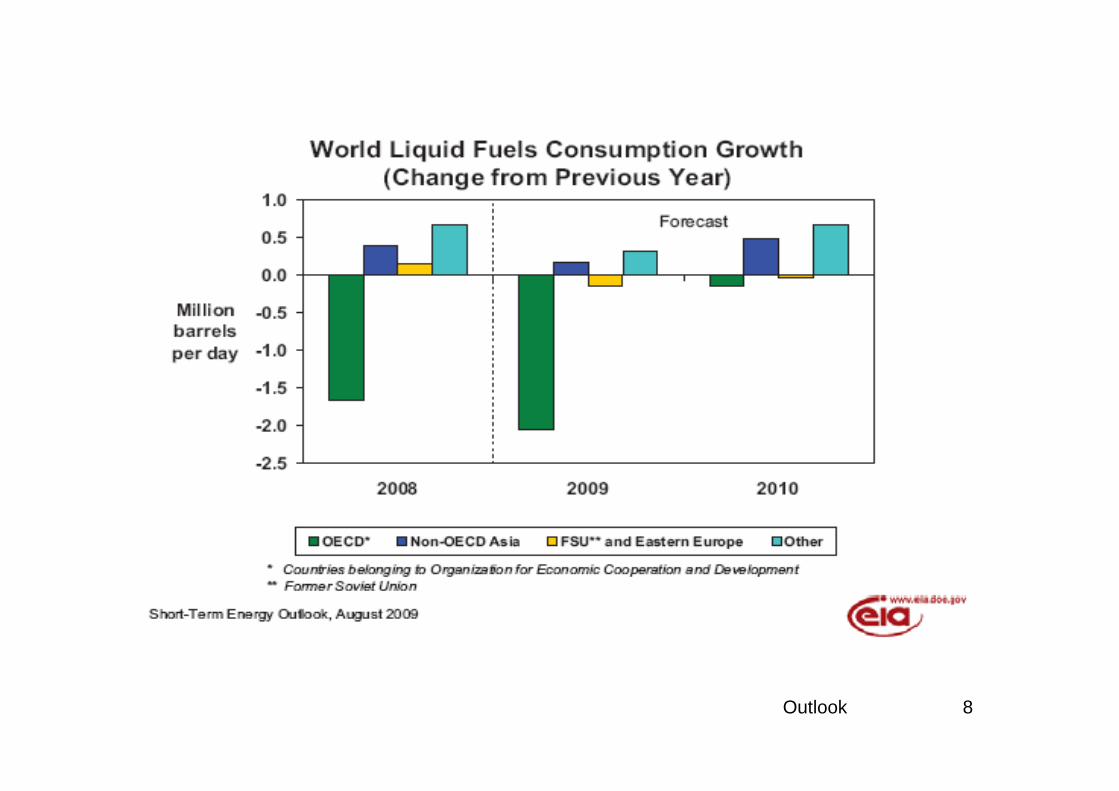
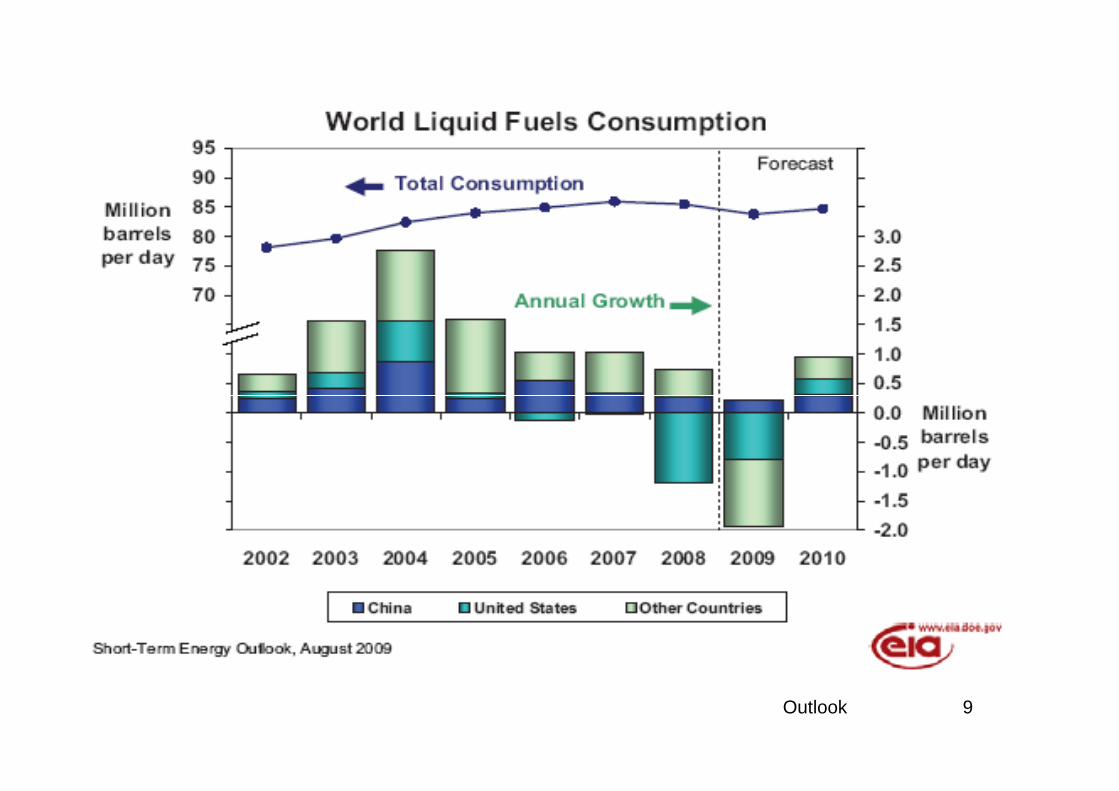
• Demand
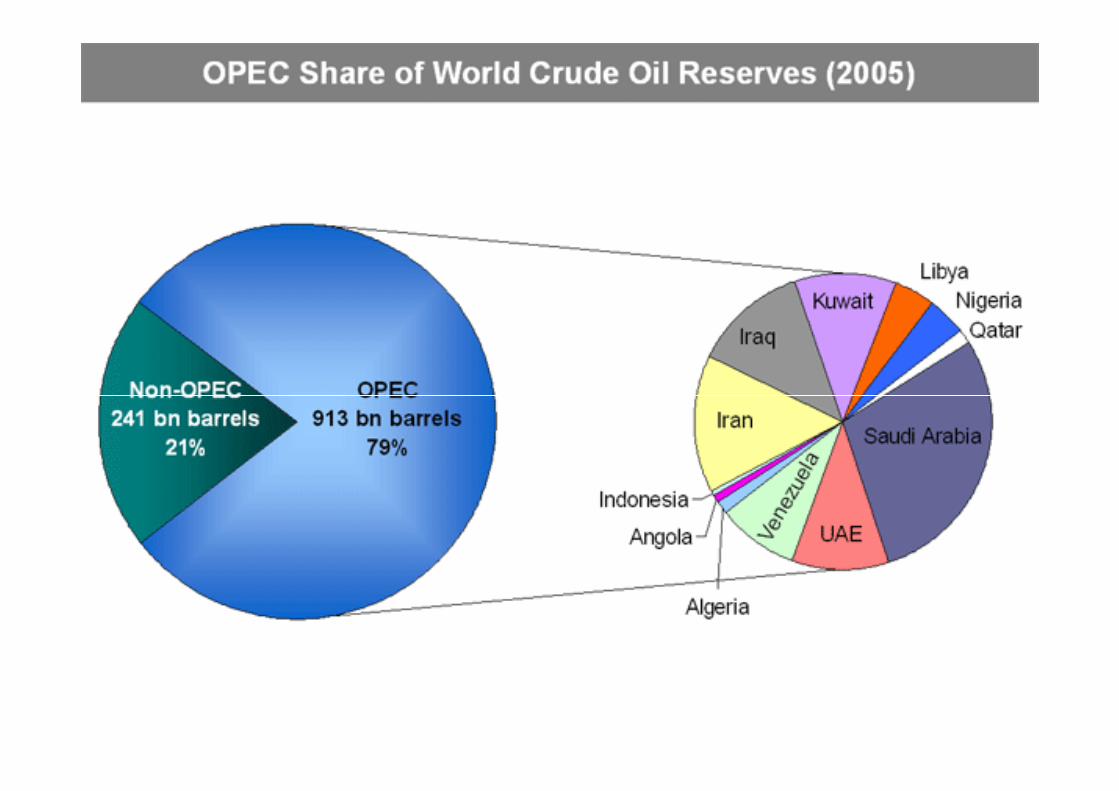
• OPEC
5Outlook
• OPEC
• Inventory levels
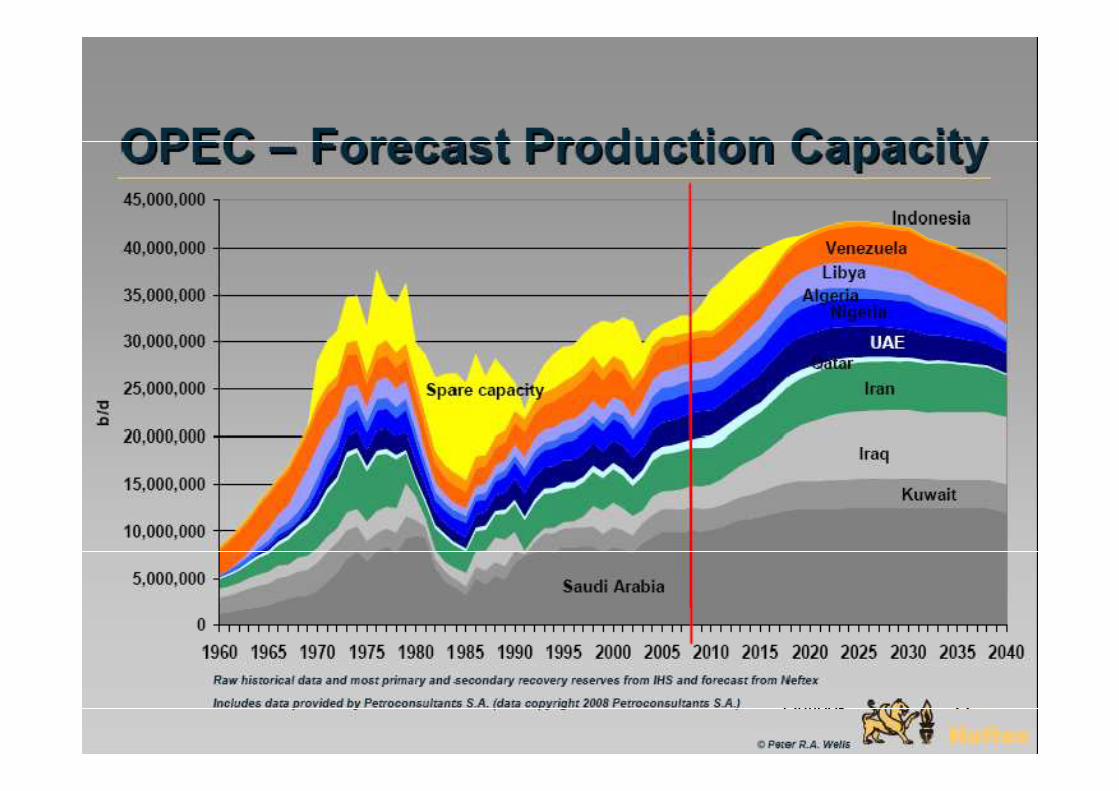
• Spare capacity
• Geopolitics
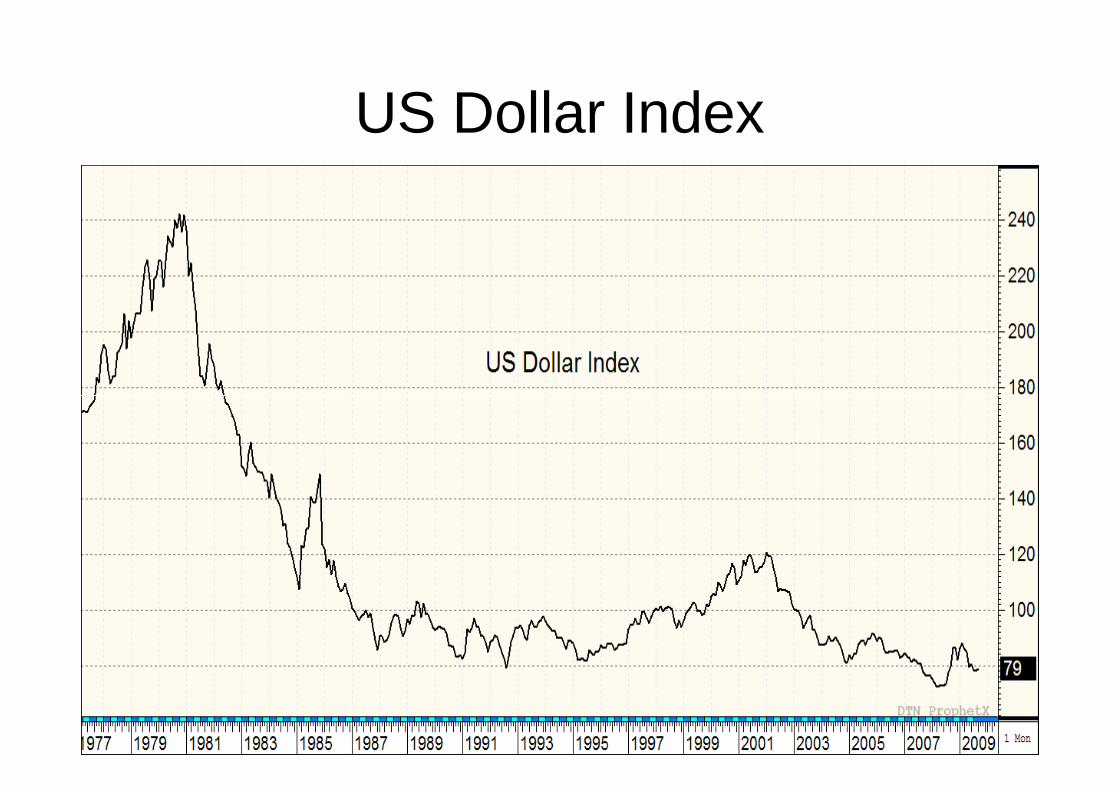
US Dollar Index
6Outlook
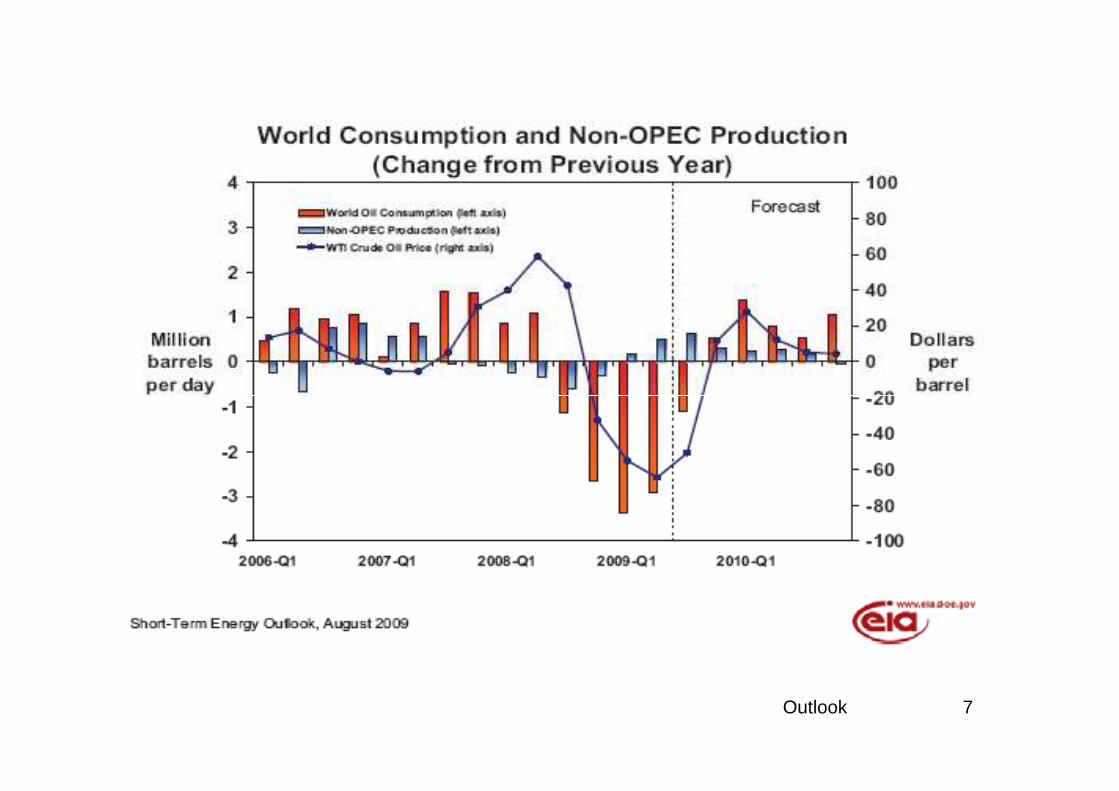
7Outlook
8Outlook
9Outlook
10Outlook
11Outlook
12Outlook
13Outlook
14Outlook
15Outlook
16Outlook
17Outlook
18Outlook
19Outlook
20Outlook
21Outlook
22Outlook
23Outlook
24Outlook
25Outlook
26Outlook
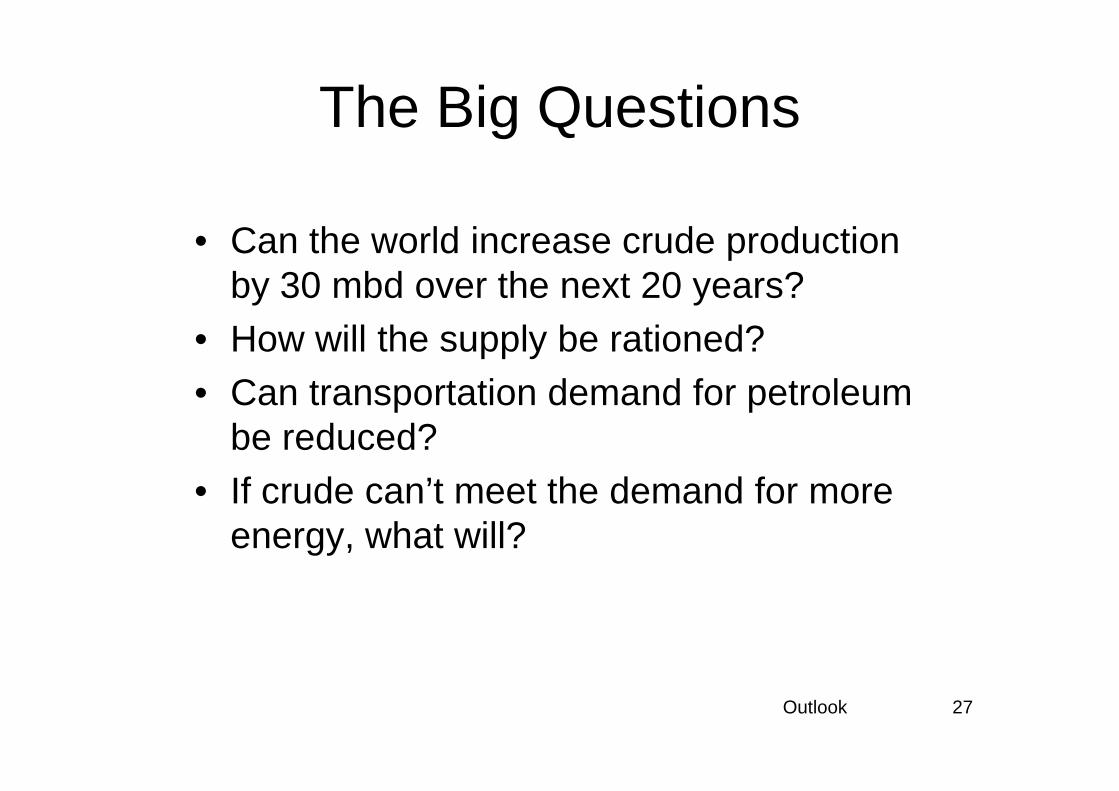
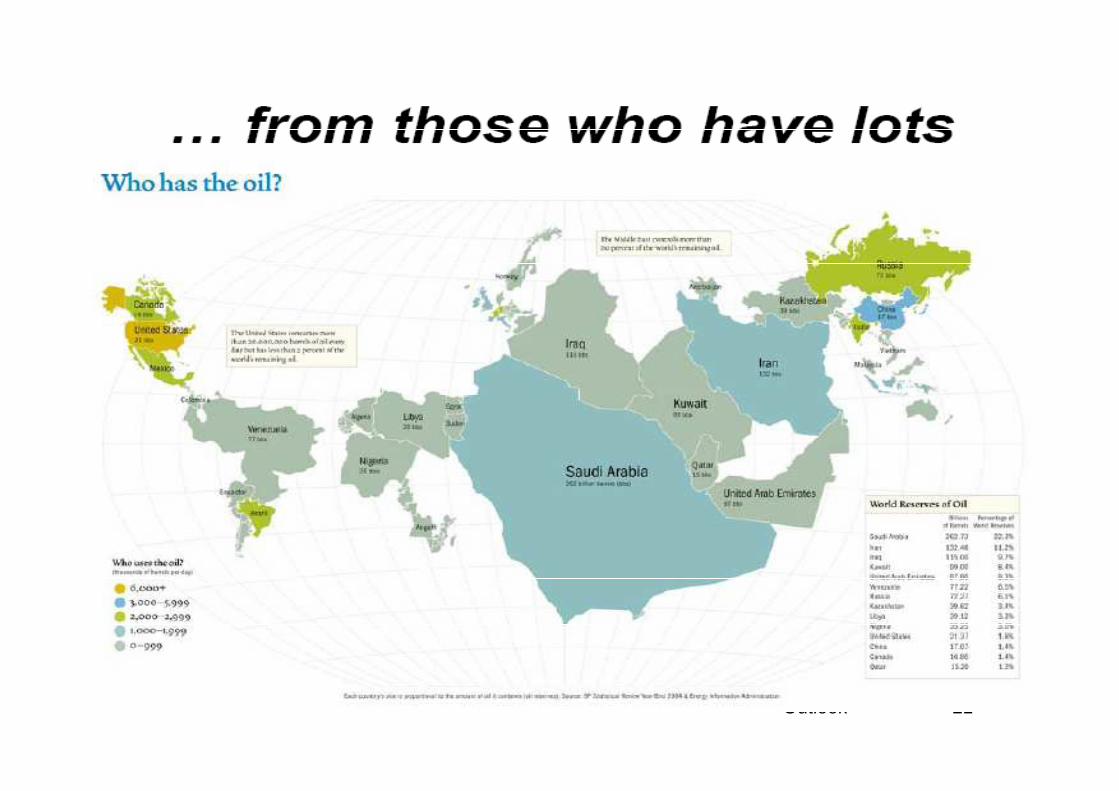
The Big Questions
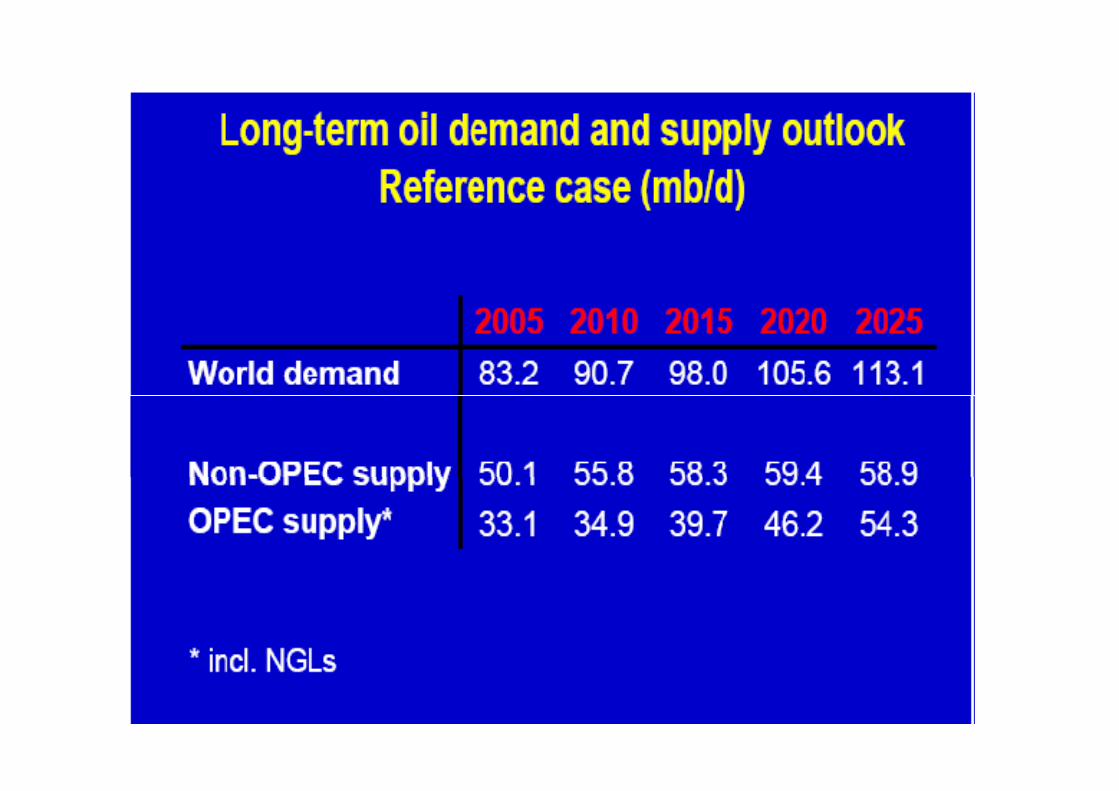
• Can the world increase crude production by 30 mbd over the next 20 years?
• How will the supply be rationed?• Can transportation demand for petroleum
27Outlook
• Can transportation demand for petroleum be reduced?
• If crude can’t meet the demand for more energy, what will?
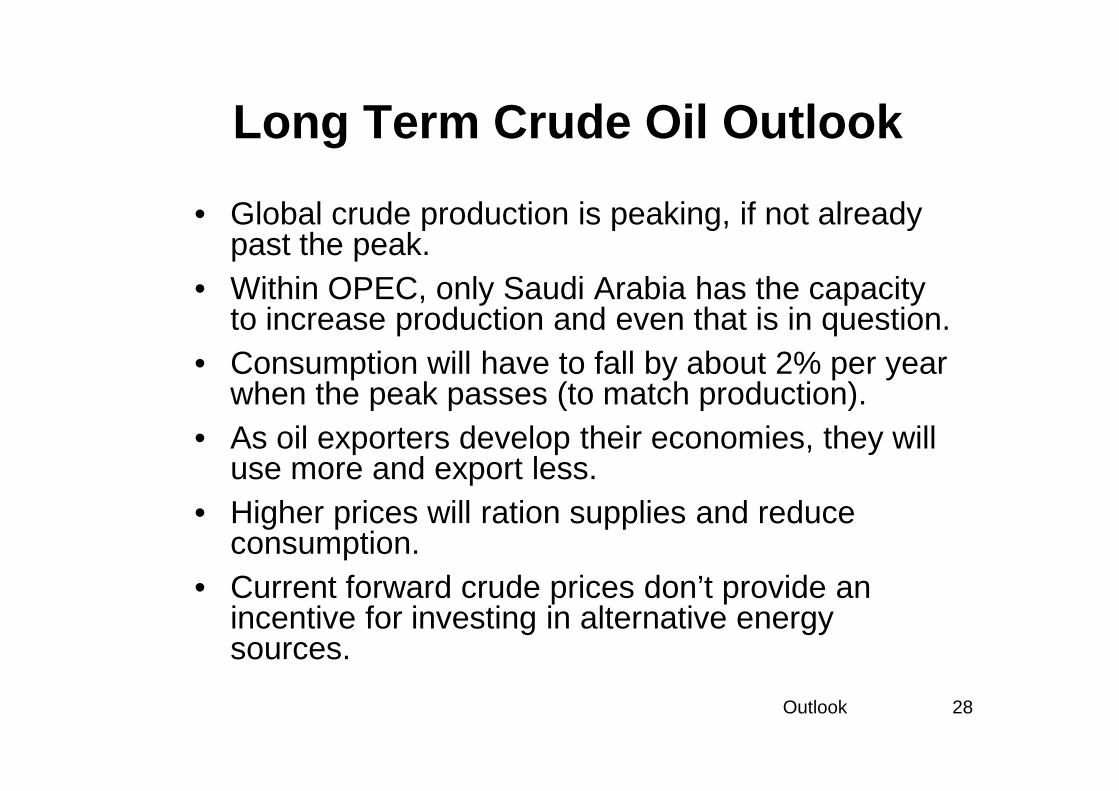
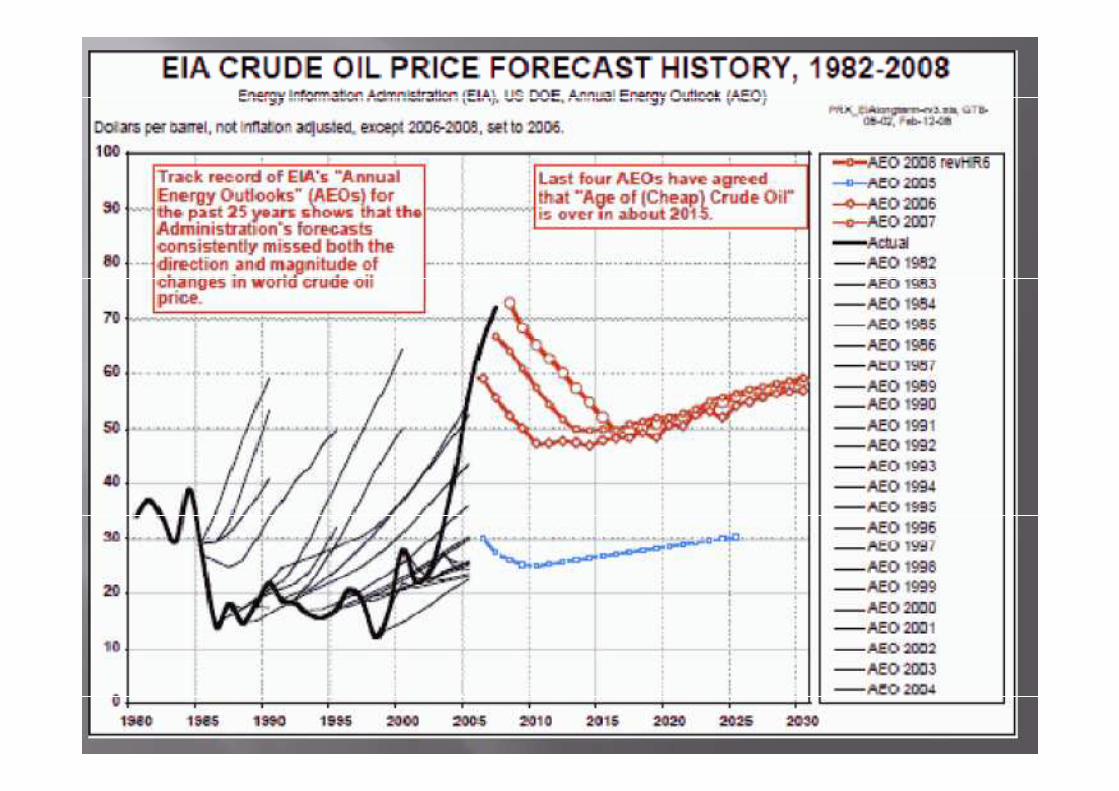
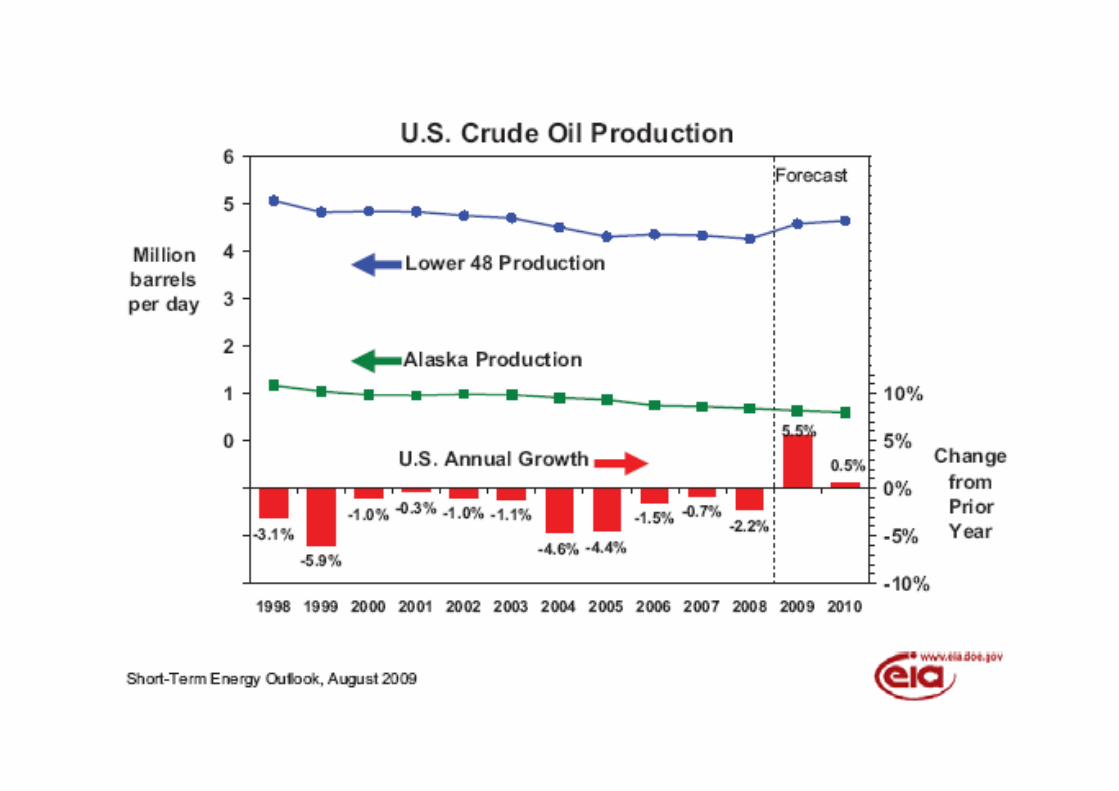
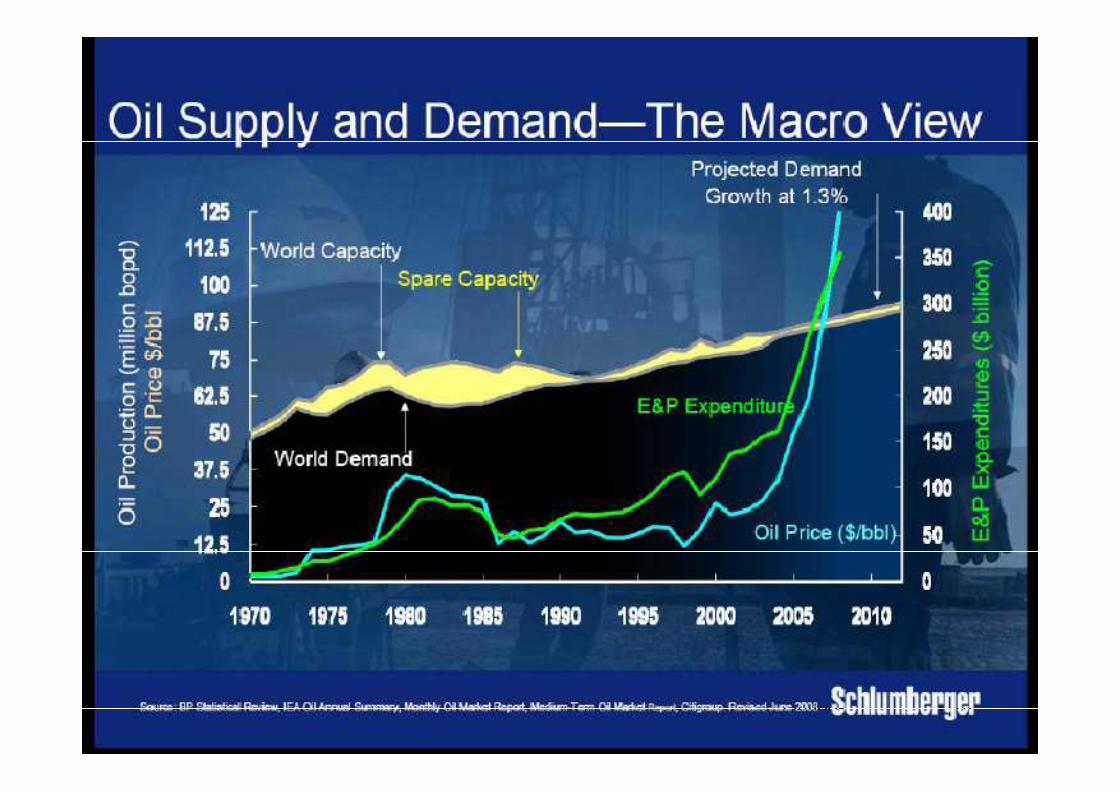
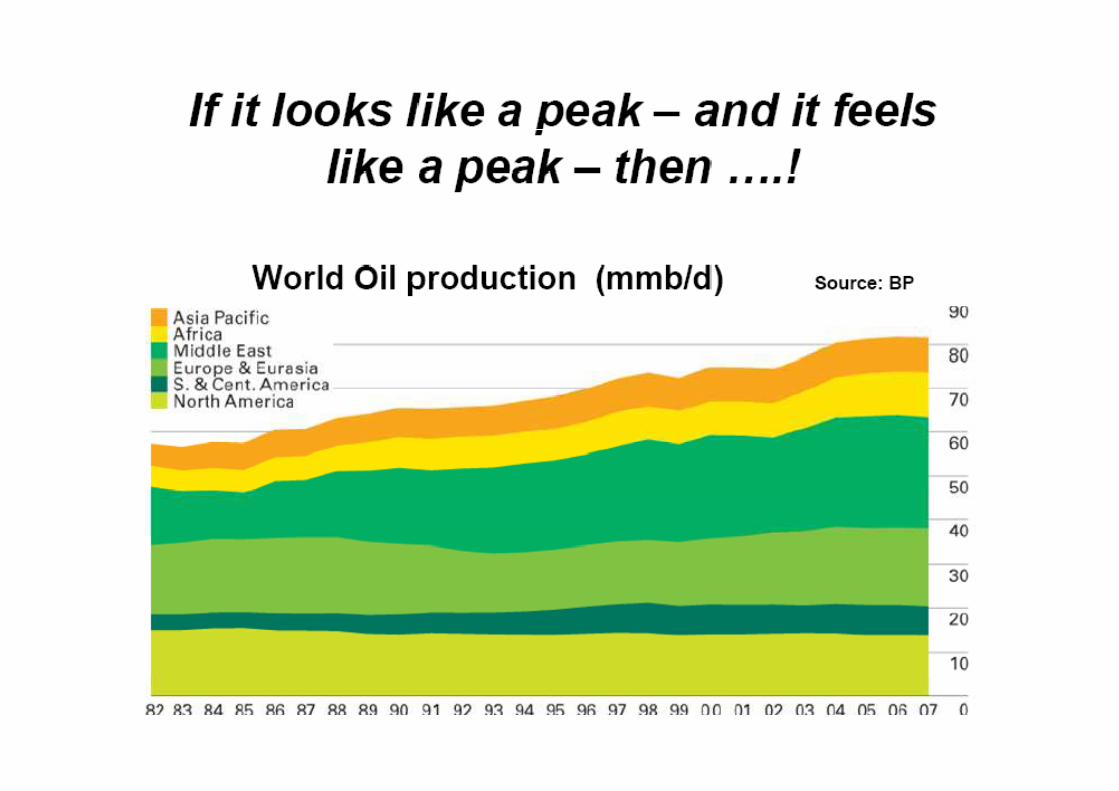
Long Term Crude Oil Outlook
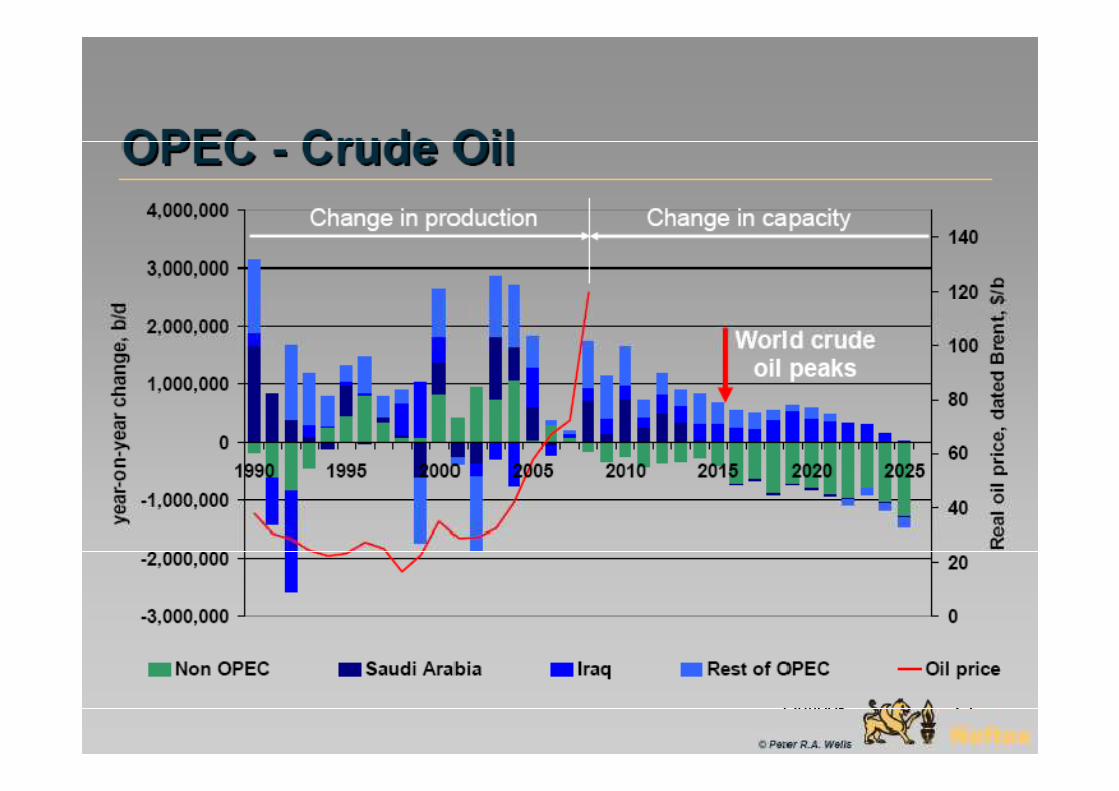
• Global crude production is peaking, if not already past the peak.
• Within OPEC, only Saudi Arabia has the capacity to increase production and even that is in question.
• Consumption will have to fall by about 2% per year when the peak passes (to match production).
28Outlook
when the peak passes (to match production).• As oil exporters develop their economies, they will
use more and export less.• Higher prices will ration supplies and reduce
consumption.• Current forward crude prices don’t provide an
incentive for investing in alternative energy sources.
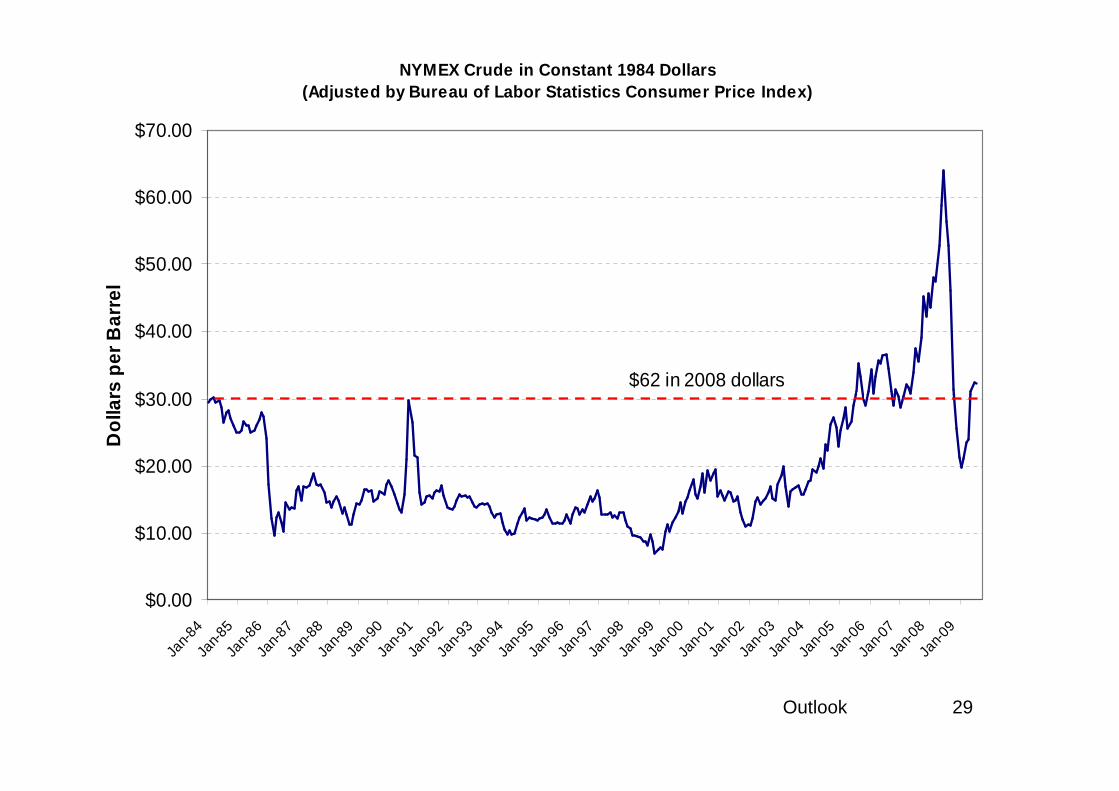
NYMEX Crude in Constant 1984 Dollars(Adjusted by Bureau of Labor Statistics Consumer Pr ice Index)
$30.00
$40.00
$50.00
$60.00
$70.00D
olla
rs p
er B
arre
l
$62 in 2008 dollars
29Outlook
$0.00
$10.00
$20.00
$30.00
Jan-
84Ja
n-85
Jan-
86Ja
n-87
Jan-
88Ja
n-89
Jan-
90Ja
n-91
Jan-
92Ja
n-93
Jan-
94Ja
n-95
Jan-
96Ja
n-97
Jan-
98Ja
n-99
Jan-
00Ja
n-01
Jan-
02Ja
n-03
Jan-
04Ja
n-05
Jan-
06Ja
n-07
Jan-
08Ja
n-09
Dol
lars
per
Bar
rel
30Outlook
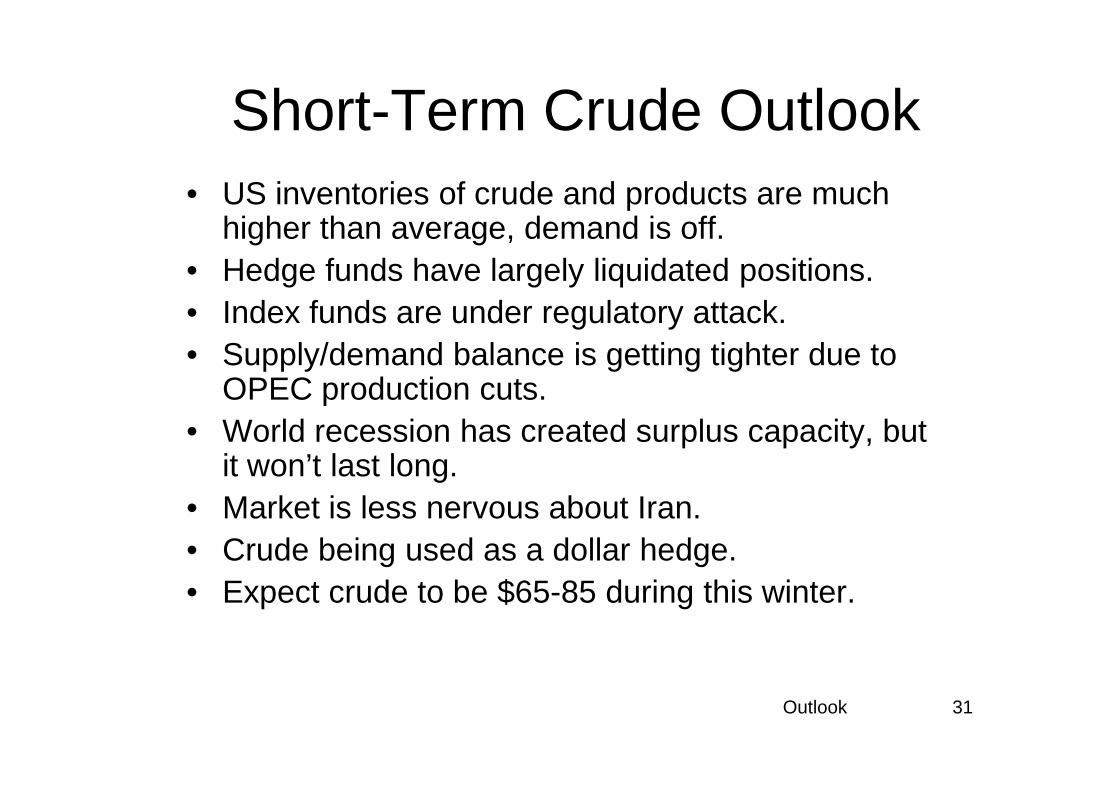
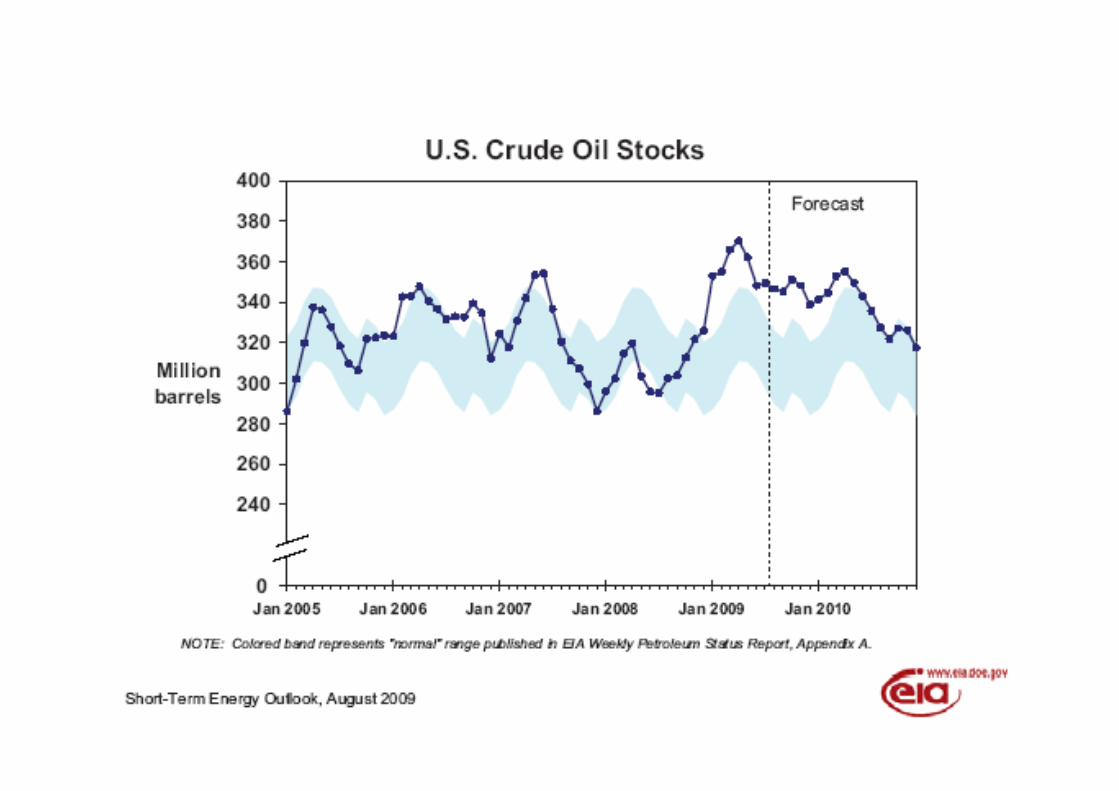
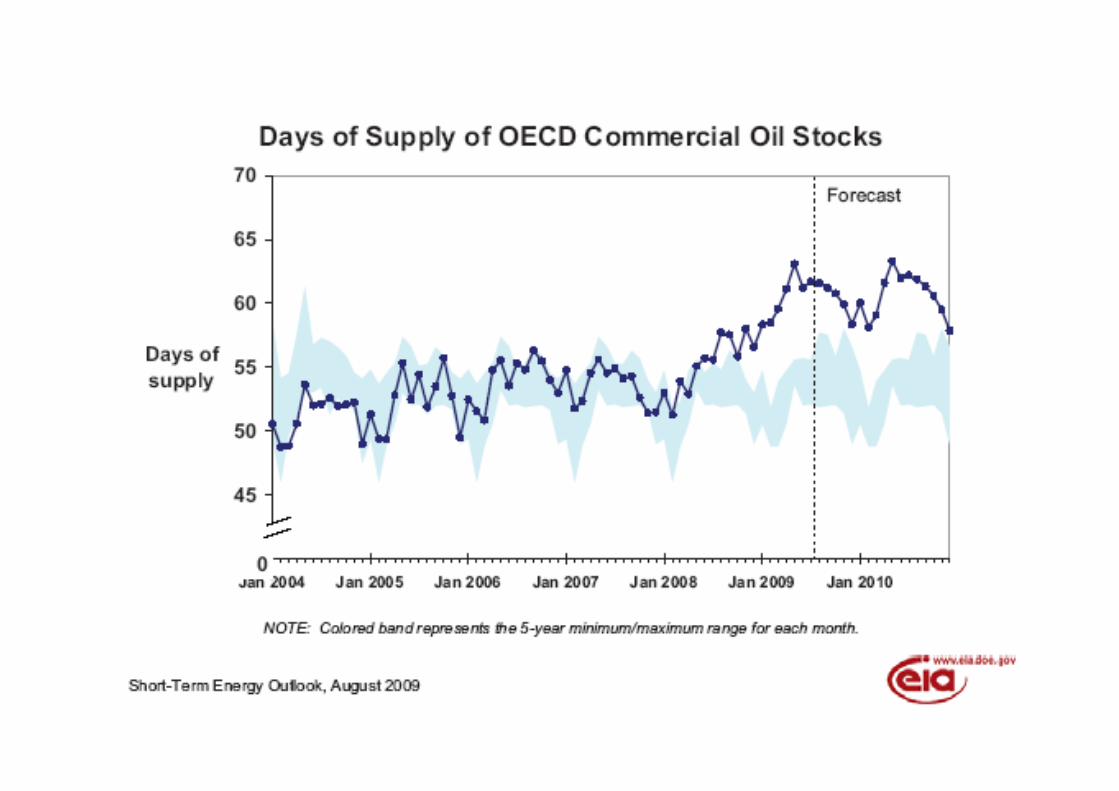
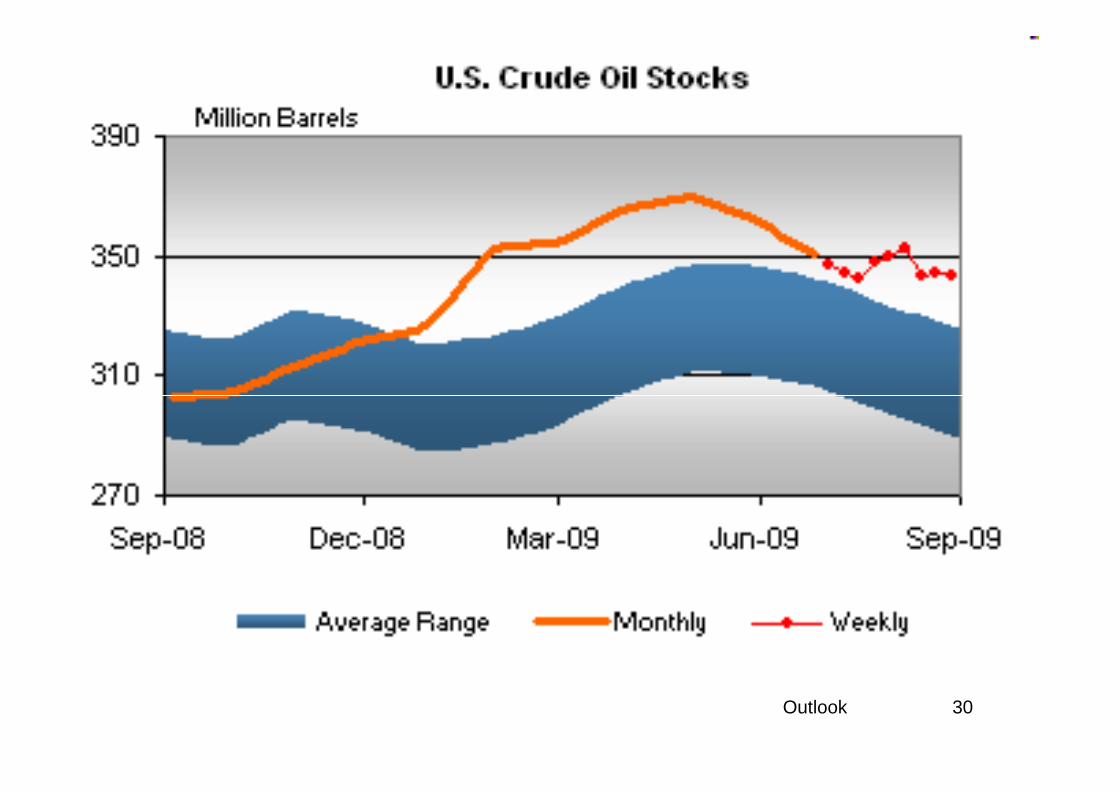
Short-Term Crude Outlook• US inventories of crude and products are much
higher than average, demand is off.• Hedge funds have largely liquidated positions.• Index funds are under regulatory attack.• Supply/demand balance is getting tighter due to
OPEC production cuts.
31Outlook
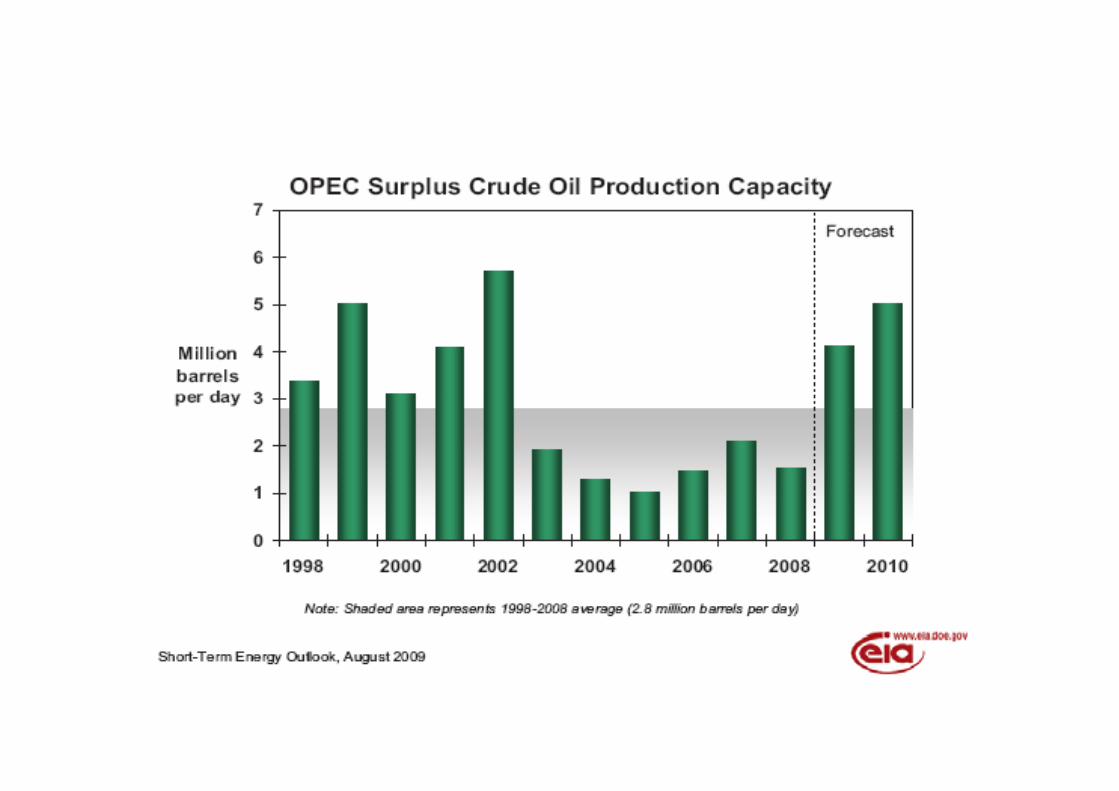
OPEC production cuts.• World recession has created surplus capacity, but
it won’t last long.• Market is less nervous about Iran.• Crude being used as a dollar hedge.• Expect crude to be $65-85 during this winter.

The Products
32Outlook
The Products
33Outlook
34Outlook
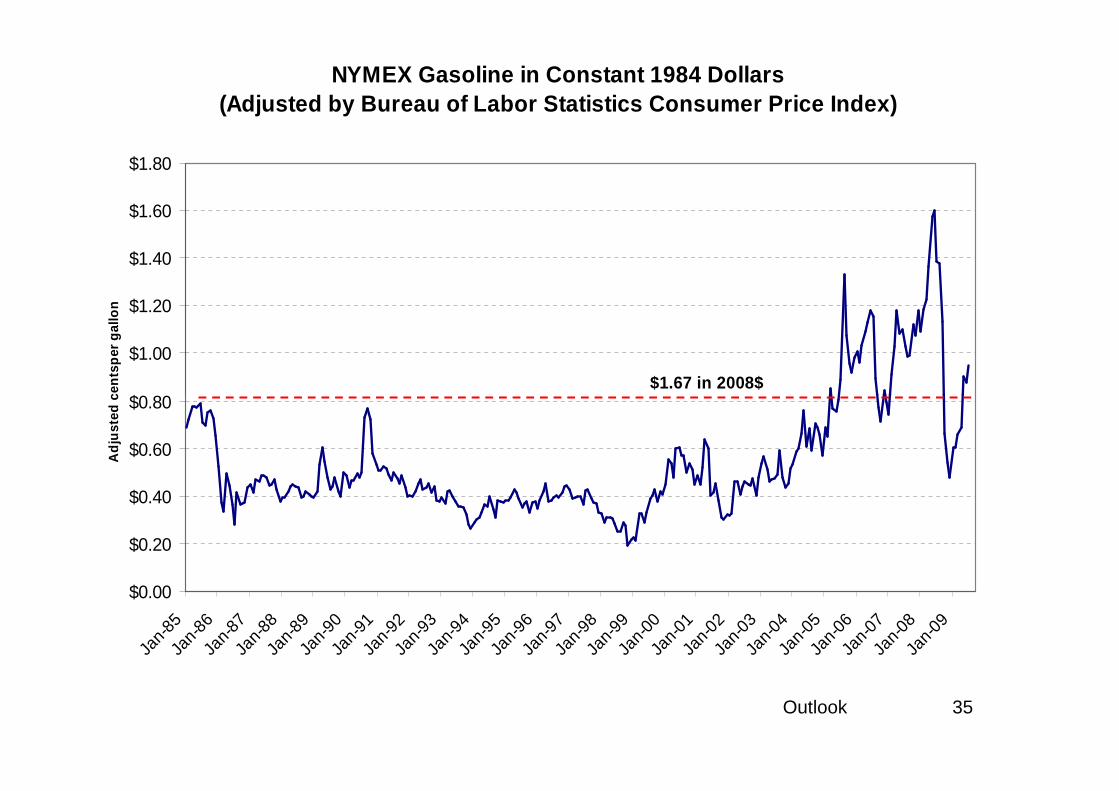
NYMEX Gasoline in Constant 1984 Dollars(Adjusted by Bureau of Labor Statistics Consumer Pr ice Index)
$0.80
$1.00
$1.20
$1.40
$1.60
$1.80
Adj
uste
d ce
ntsp
er g
allo
n
$1.67 in 2008$
35Outlook
$0.00
$0.20
$0.40
$0.60
$0.80
Jan-
85Ja
n-86
Jan-
87Ja
n-88
Jan-
89Ja
n-90
Jan-9
1Ja
n-92
Jan-9
3Ja
n-94
Jan-
95Ja
n-96
Jan-
97Ja
n-98
Jan-9
9Ja
n-00
Jan-
01Ja
n-02
Jan-
03Ja
n-04
Jan-0
5Ja
n-06
Jan-0
7Ja
n-08
Jan-
09
Adj
uste
d ce
ntsp
er g
allo
n
36Outlook
37Outlook
38Outlook
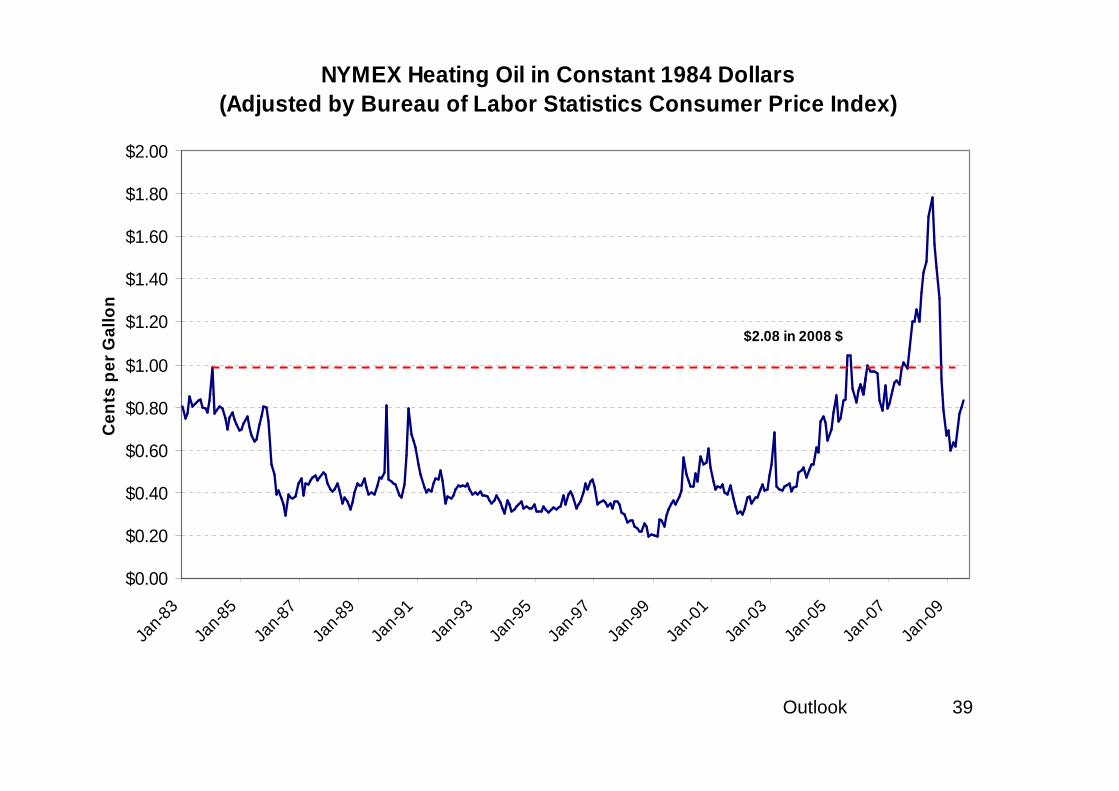
NYMEX Heating Oil in Constant 1984 Dollars(Adjusted by Bureau of Labor Statistics Consumer Pr ice Index)
$1.00
$1.20
$1.40
$1.60
$1.80
$2.00
Cen
ts p
er G
allo
n
$2.08 in 2008 $
39Outlook
$0.00
$0.20
$0.40
$0.60
$0.80
Jan-
83
Jan-
85
Jan-
87
Jan-
89
Jan-
91
Jan-
93
Jan-
95
Jan-9
7
Jan-9
9
Jan-
01
Jan-
03
Jan-
05
Jan-
07
Jan-
09
Cen
ts p
er G
allo
n
40Outlook
41Outlook
15
20
25
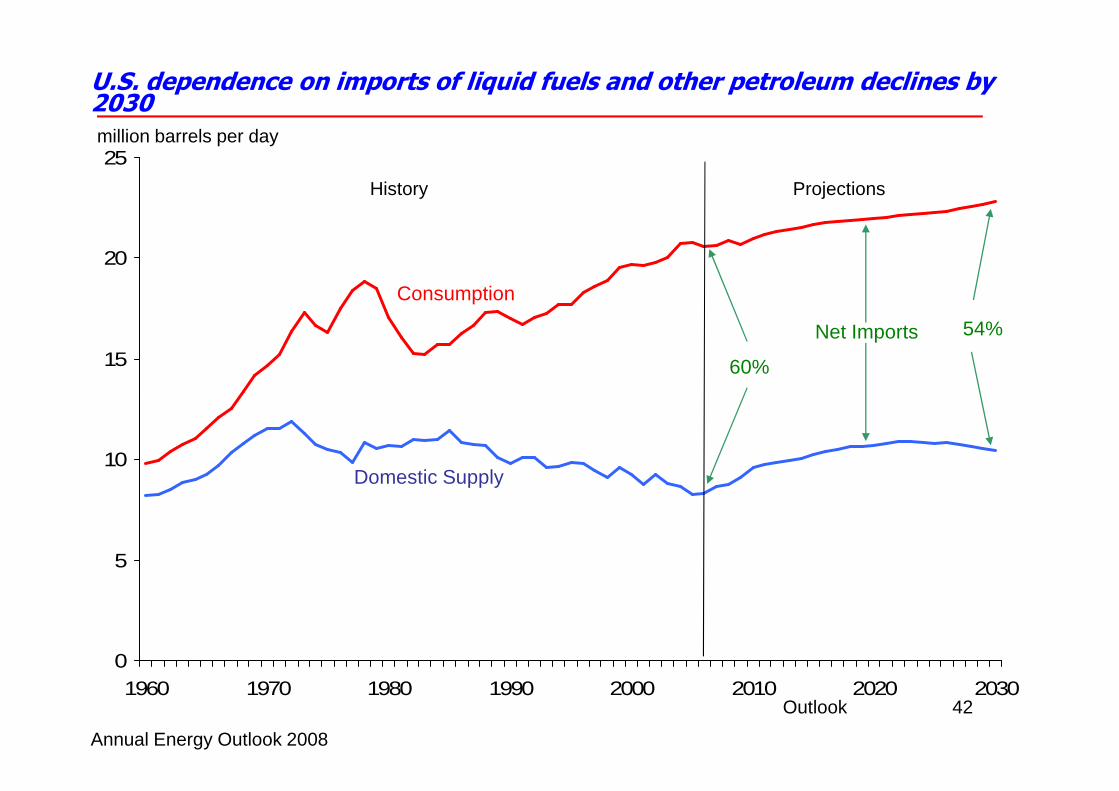
U.S. dependence on imports of liquid fuels and other petroleum declines by 2030
Consumption
Net Imports
60%
54%
History Projections
million barrels per day
42Outlook
0
5
10
1960 1970 1980 1990 2000 2010 2020 2030
Domestic Supply
Annual Energy Outlook 2008
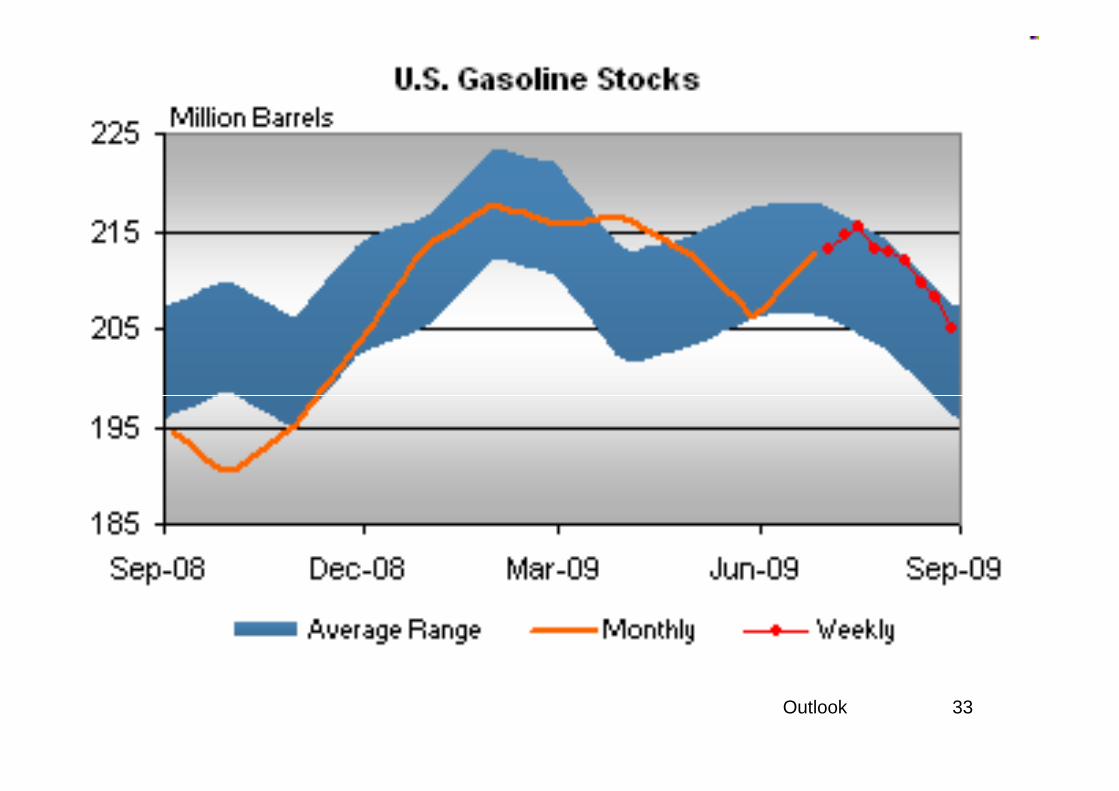
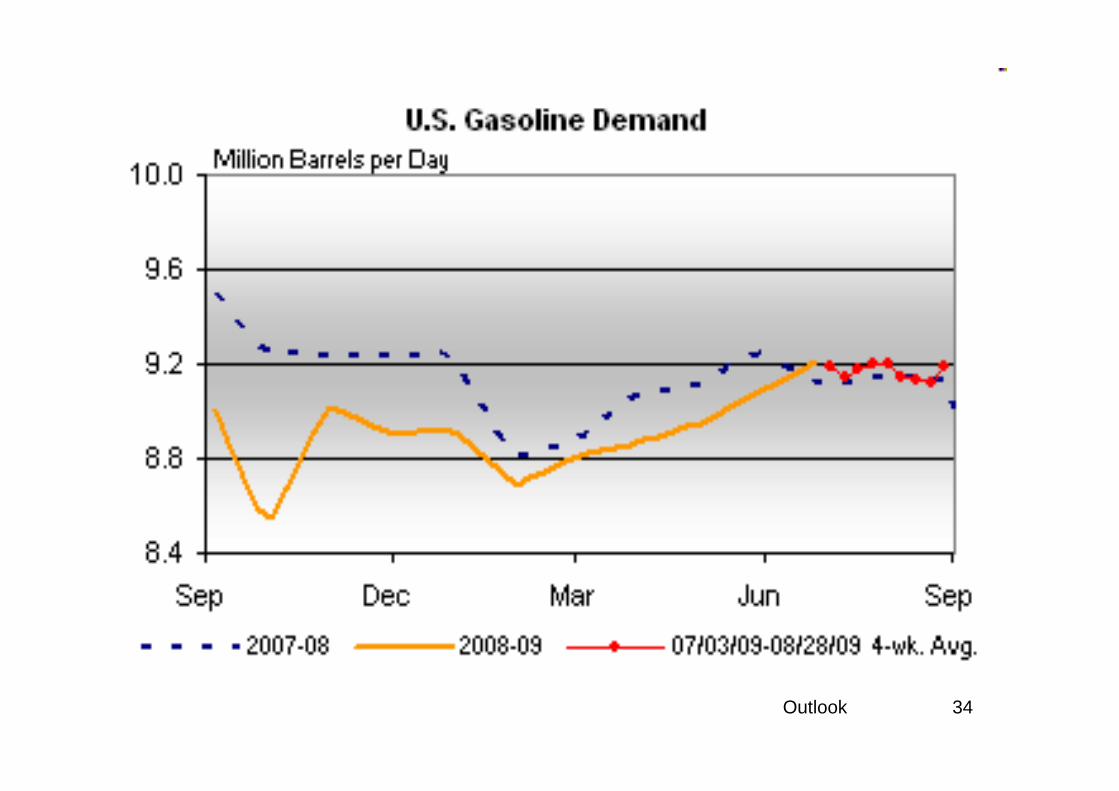
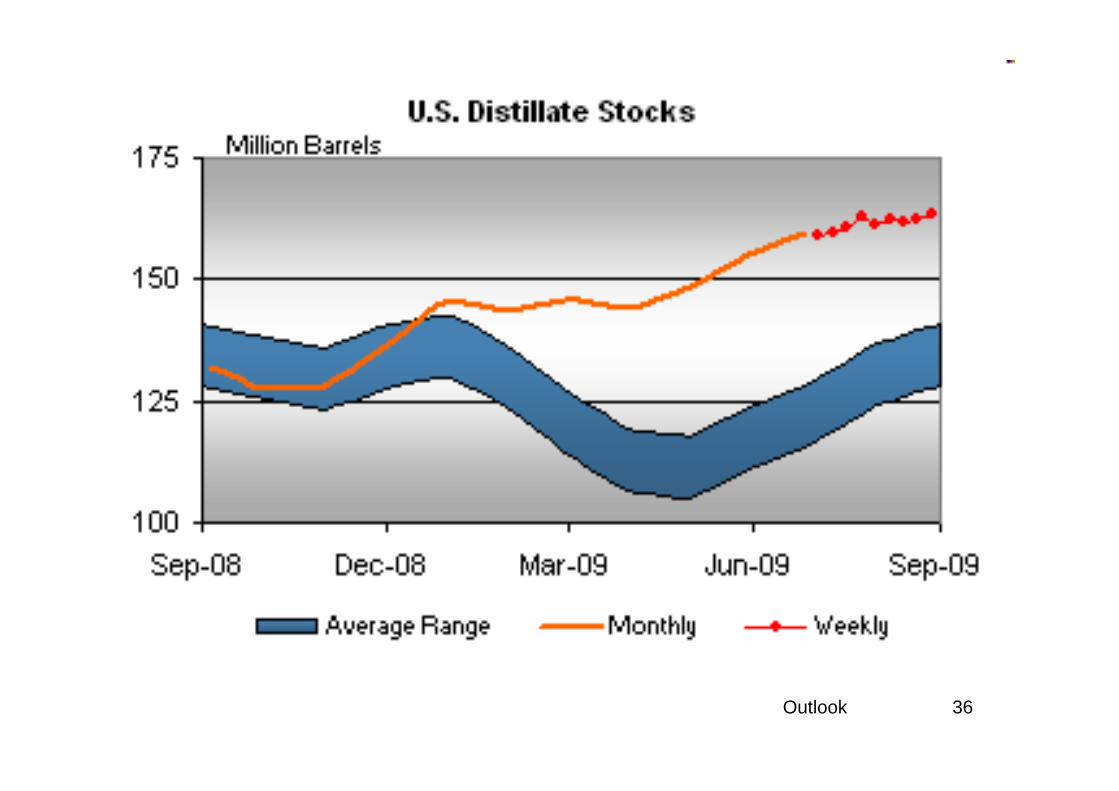
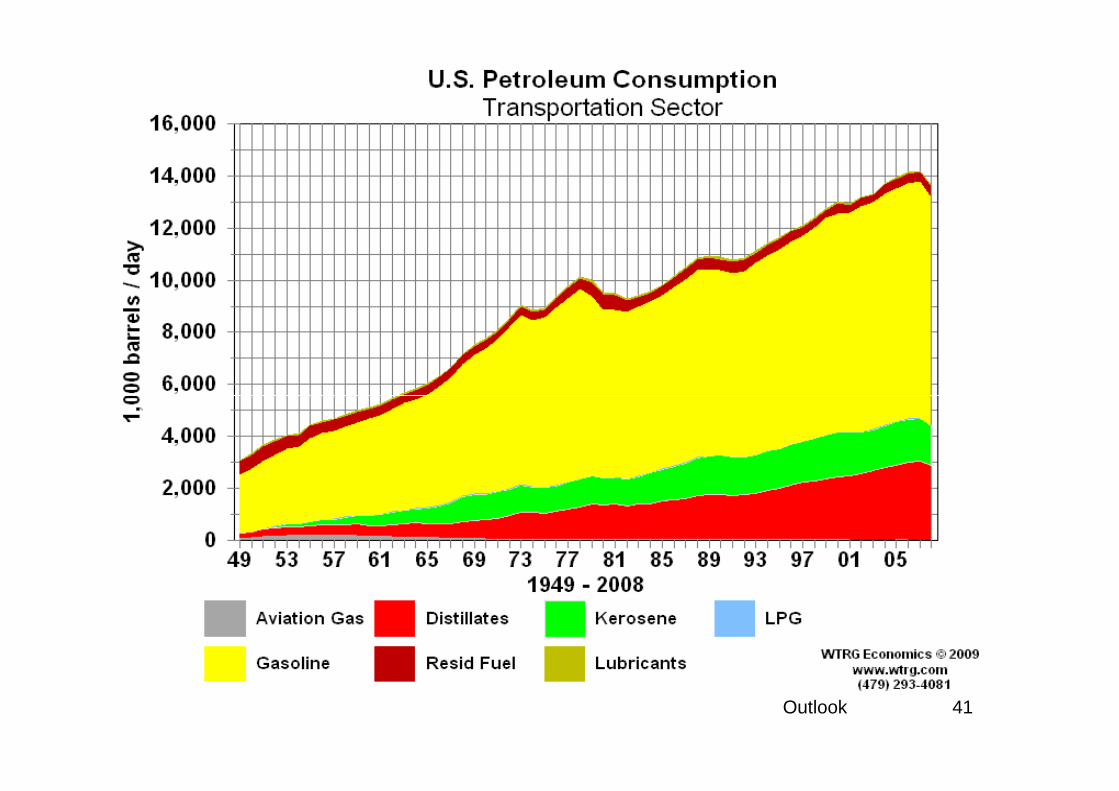
Products Outlook
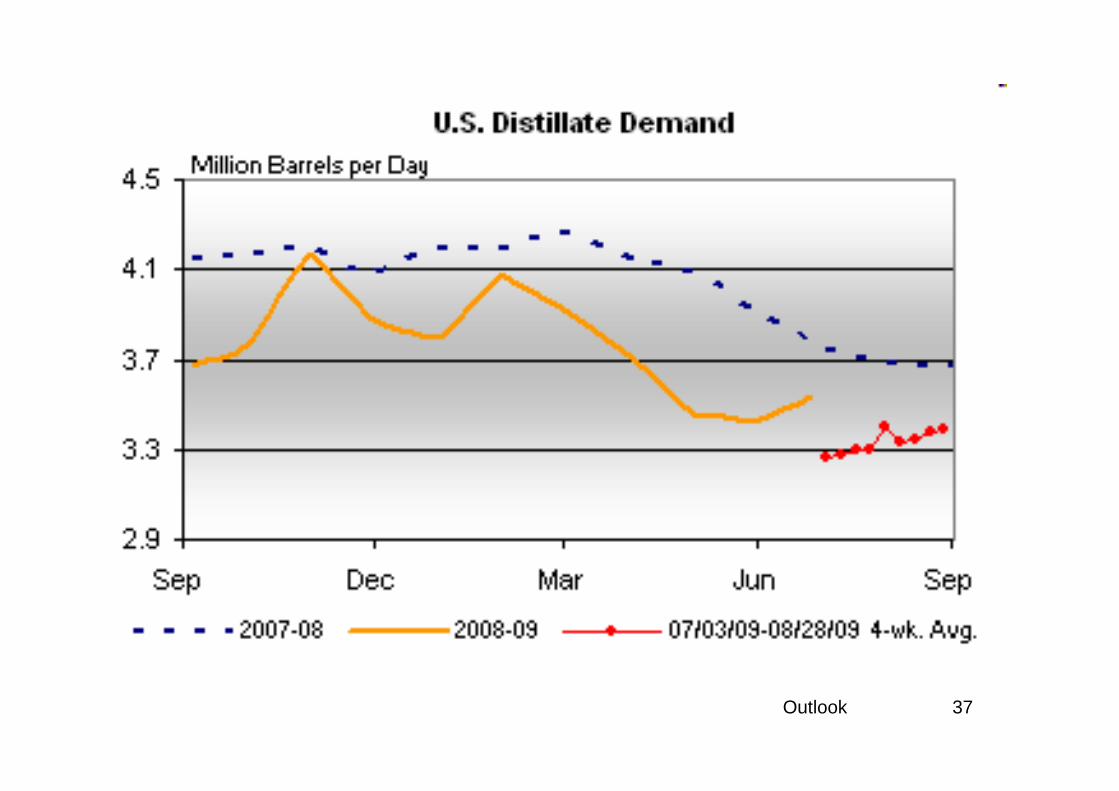
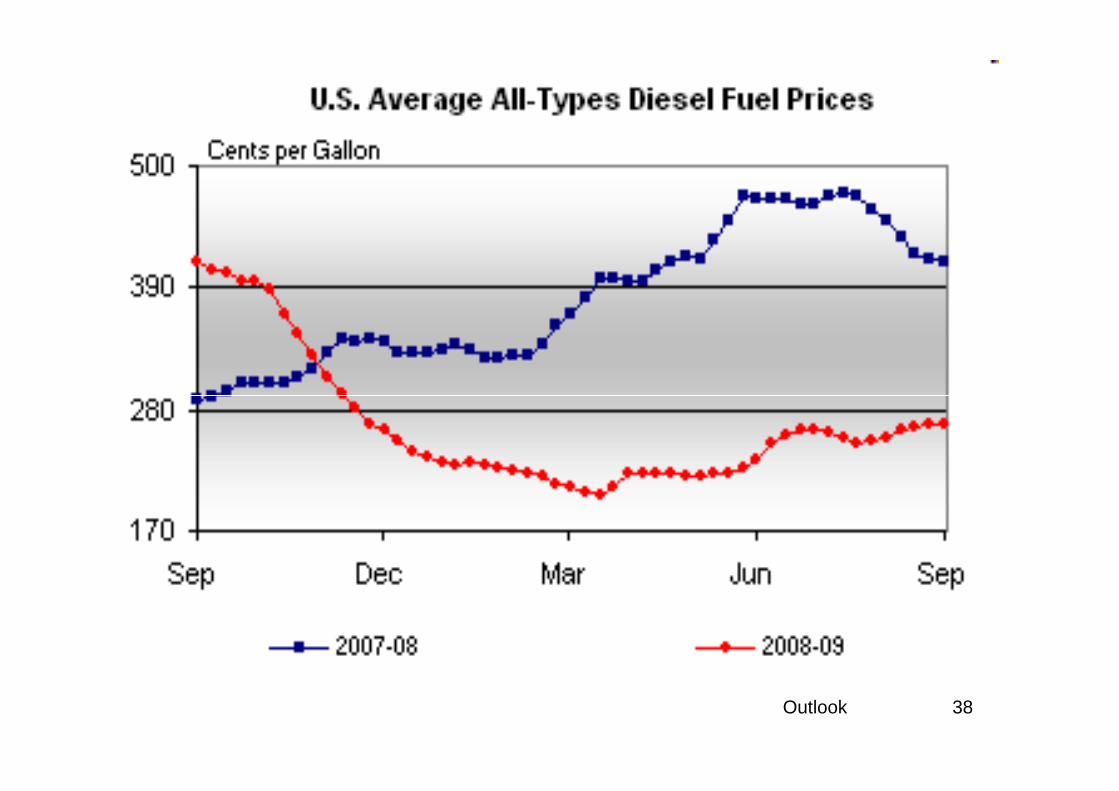
• Demand for both distillates and gasoline is down in response global slowdown.
• Distillate stocks have risen to above average.
• Gasoline stocks have risen to 5 year average due to stronger refining margins.
43Outlook
average due to stronger refining margins.
• Diesel may be premium to gasoline year-round due to greater demand overseas and efforts to reduce U.S. gasoline consumption.
• Prices are still cheap in “real” terms and will advance as economic growth resumes.

Natural Gas
44Outlook
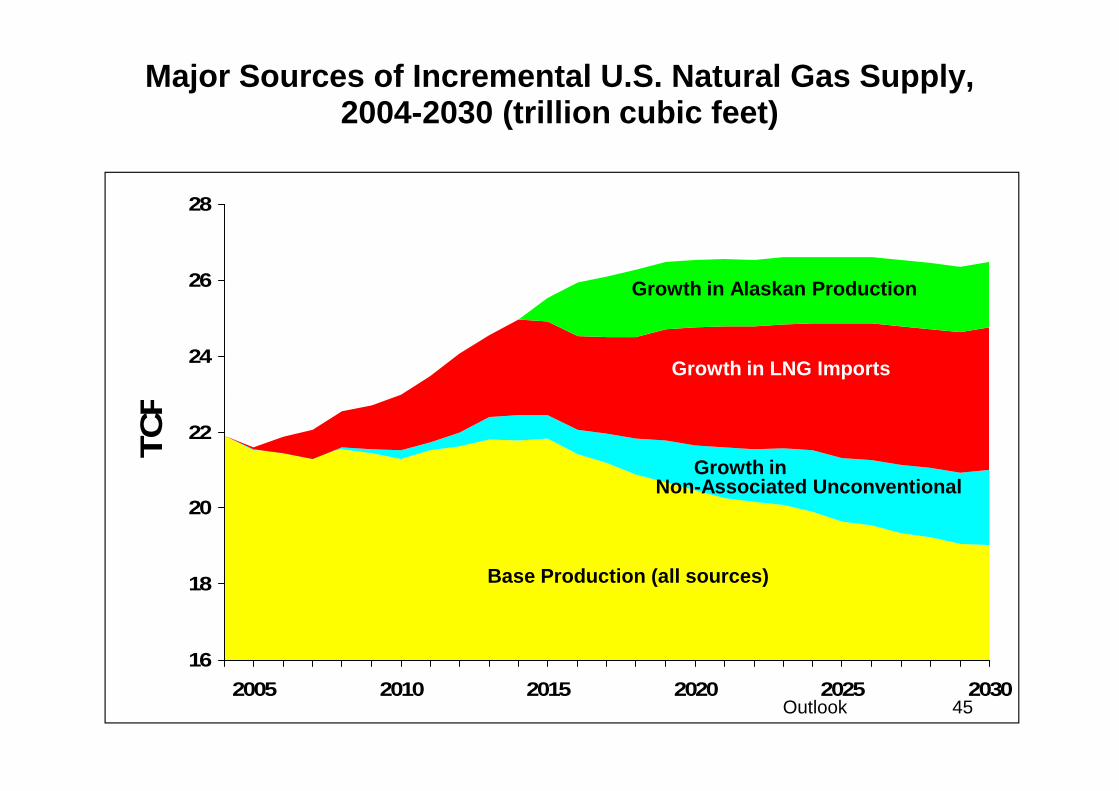
Major Sources of Incremental U.S. Natural Gas Suppl y,2004-2030 (trillion cubic feet)
24
26
28
Growth in Alaskan Production
Growth in LNG Imports
45Outlook
16
18
20
22
2005 2010 2015 2020 2025 2030
TC
F
Growth inNon-Associated Unconventional
Base Production (all sources)
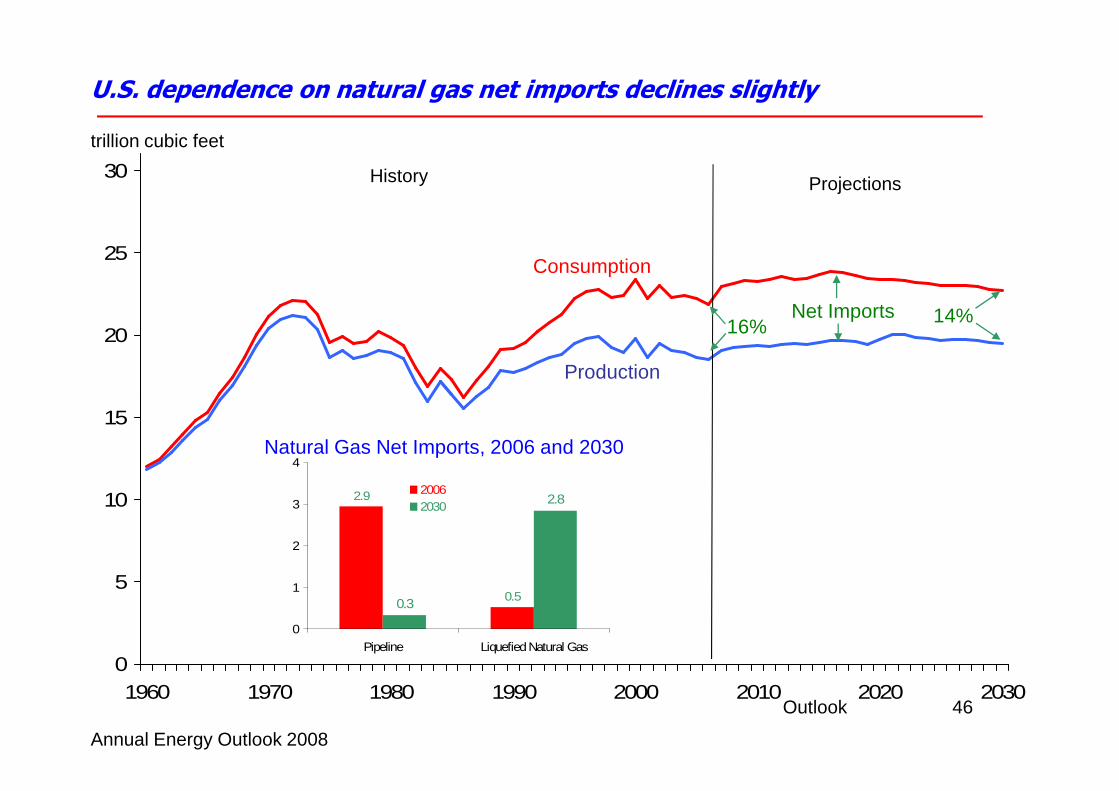
U.S. dependence on natural gas net imports declines slightly
20
25
30
16% 14%Net Imports
Consumption
Production
History Projections
trillion cubic feet
46Outlook
0
5
10
15
1960 1970 1980 1990 2000 2010 2020 2030
Natural Gas Net Imports, 2006 and 2030
2.9
0.50.3
2.8
0
1
2
3
4
Pipeline Liquefied Natural Gas
20062030
Annual Energy Outlook 2008
47Outlook
48Outlook
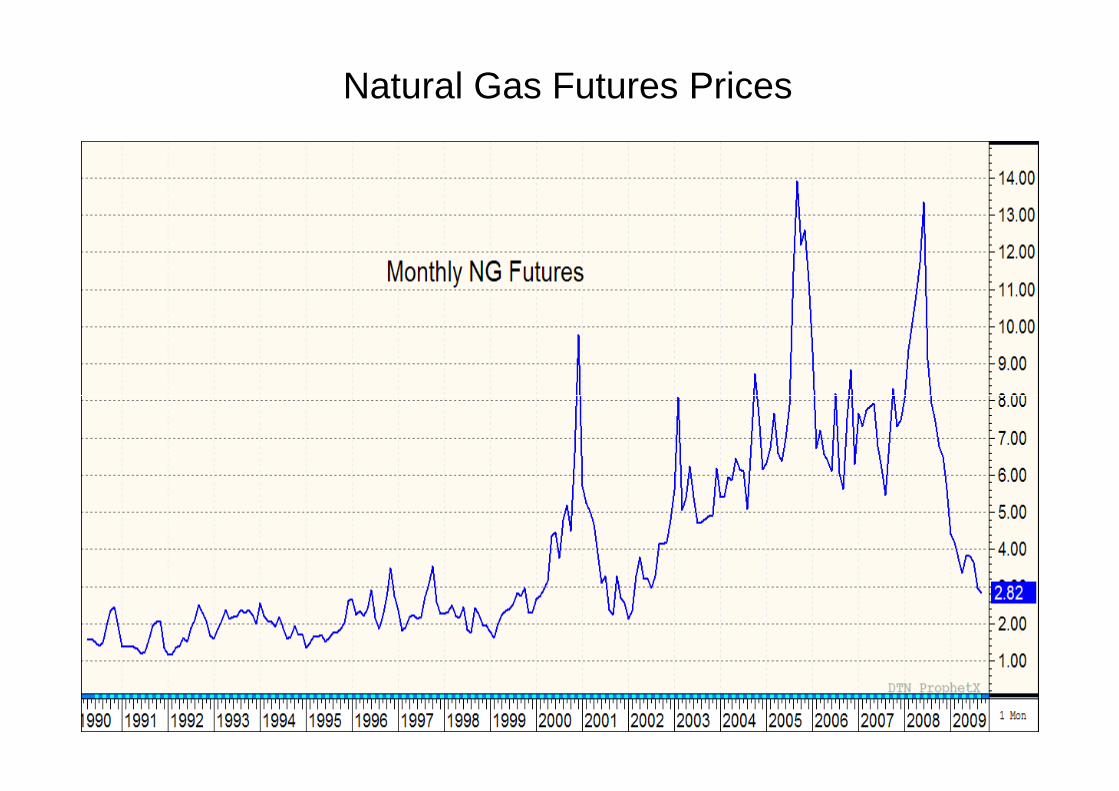
Natural Gas Futures Prices
49Outlook
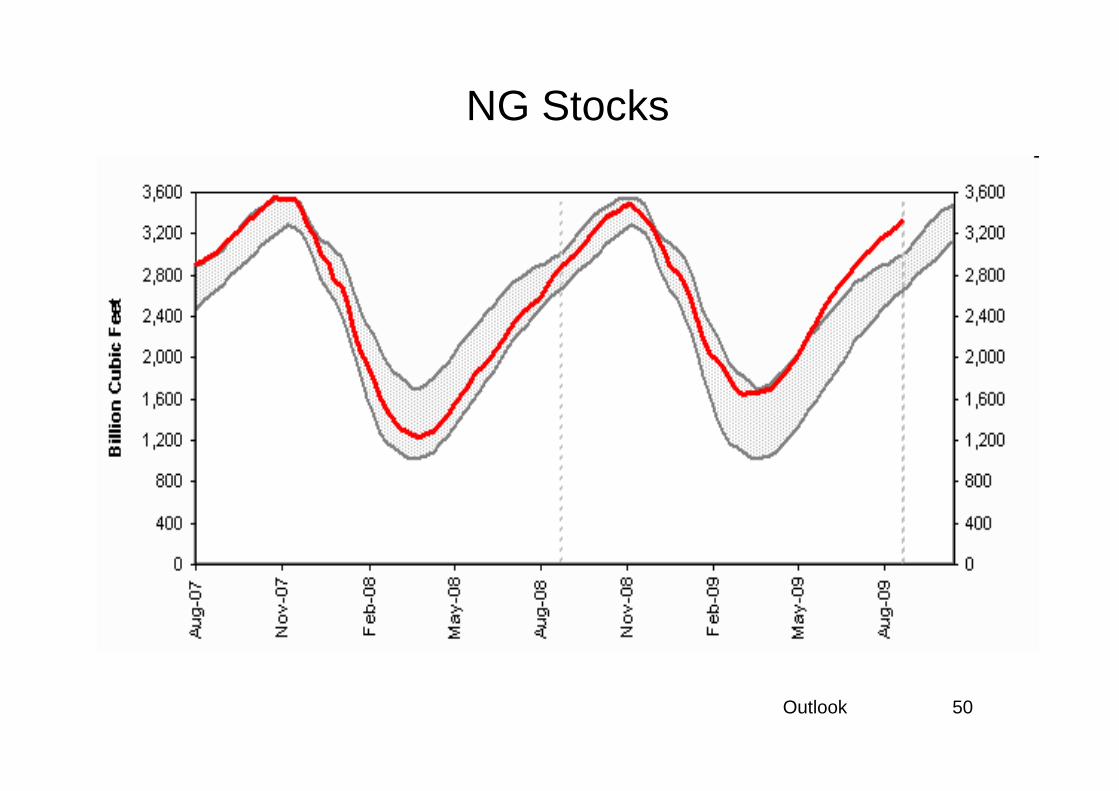
NG Stocks
50Outlook
51Outlook
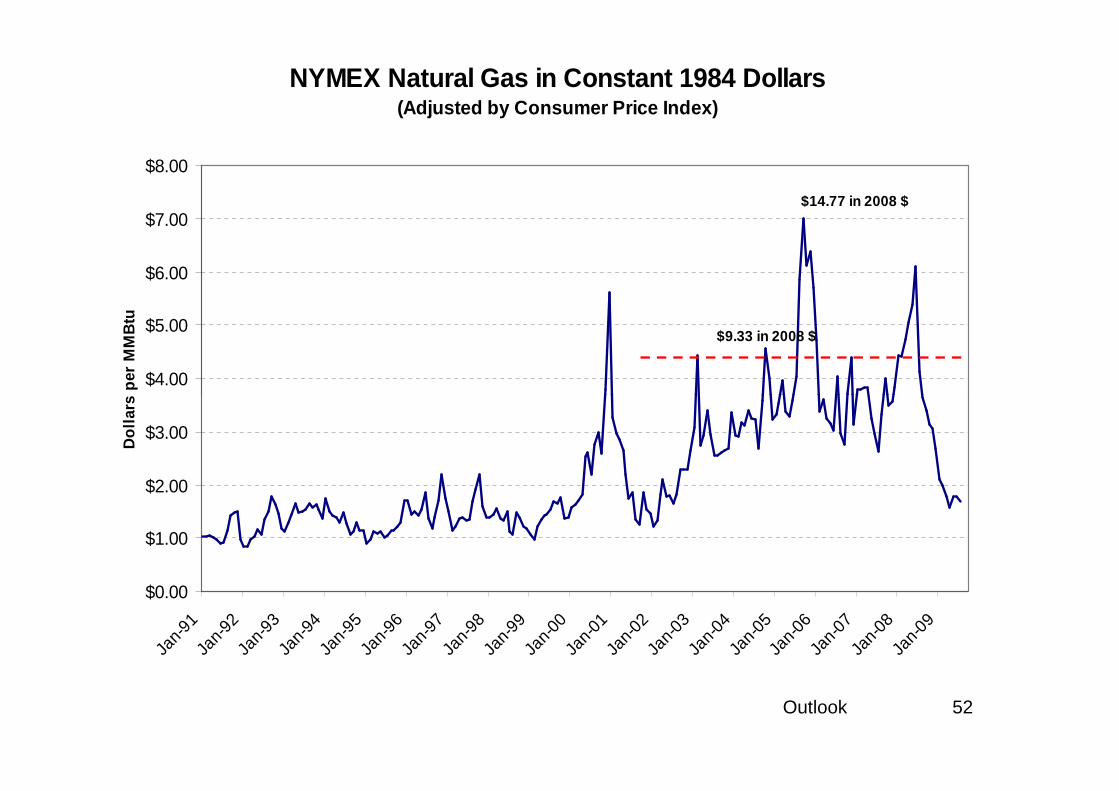
NYMEX Natural Gas in Constant 1984 Dollars(Adjusted by Consumer Price Index)
$4.00
$5.00
$6.00
$7.00
$8.00
Dol
lars
per
MM
Btu
$9.33 in 2008 $
$14.77 in 2008 $
52Outlook
$0.00
$1.00
$2.00
$3.00
Jan-
91Ja
n-92
Jan-9
3Ja
n-94
Jan-
95Ja
n-96
Jan-9
7Ja
n-98
Jan-
99Ja
n-00
Jan-0
1Ja
n-02
Jan-
03Ja
n-04
Jan-0
5Ja
n-06
Jan-0
7Ja
n-08
Jan-
09
Dol
lars
per
MM
Btu
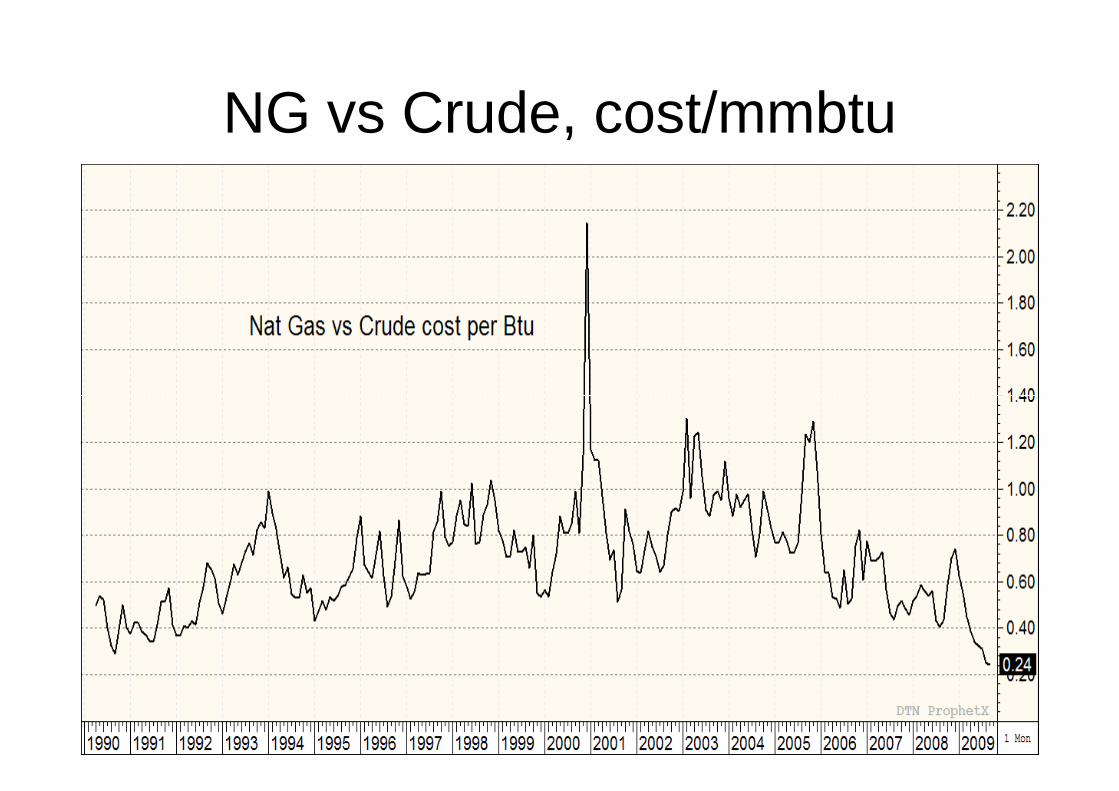
NG vs Crude, cost/mmbtu
Nat gas is cheap vs. crude and residual oil
53Outlook
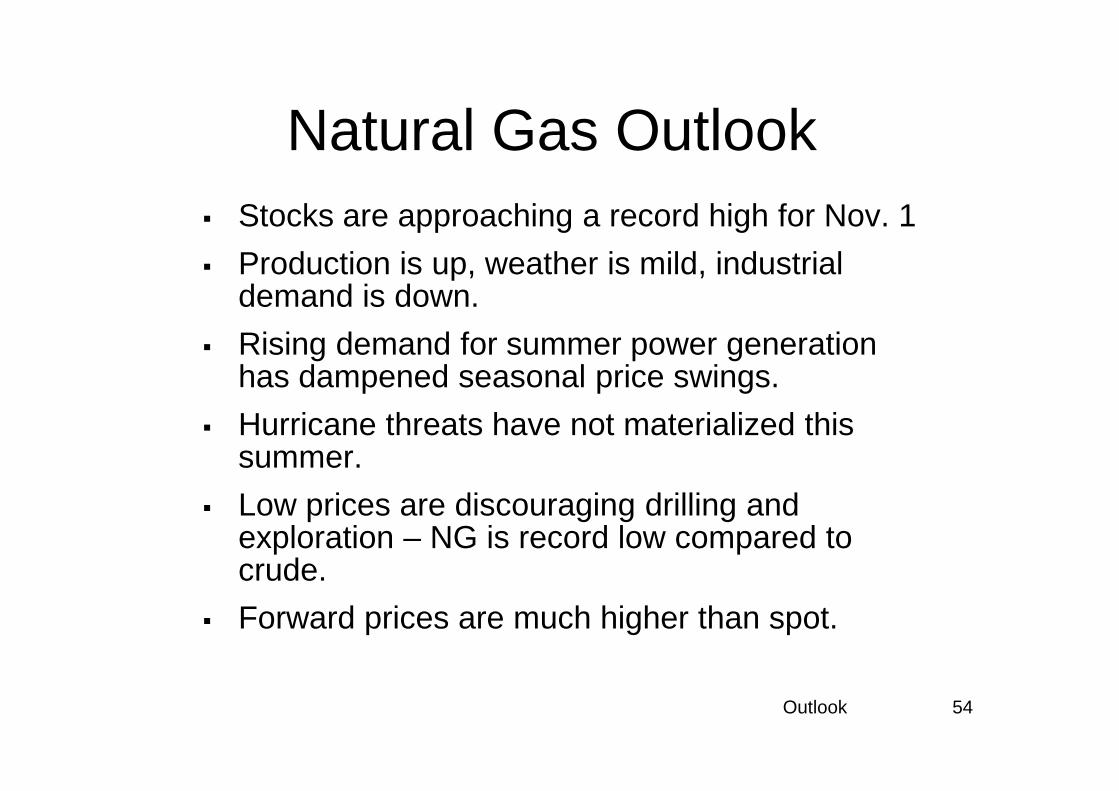
Natural Gas Outlook� Stocks are approaching a record high for Nov. 1
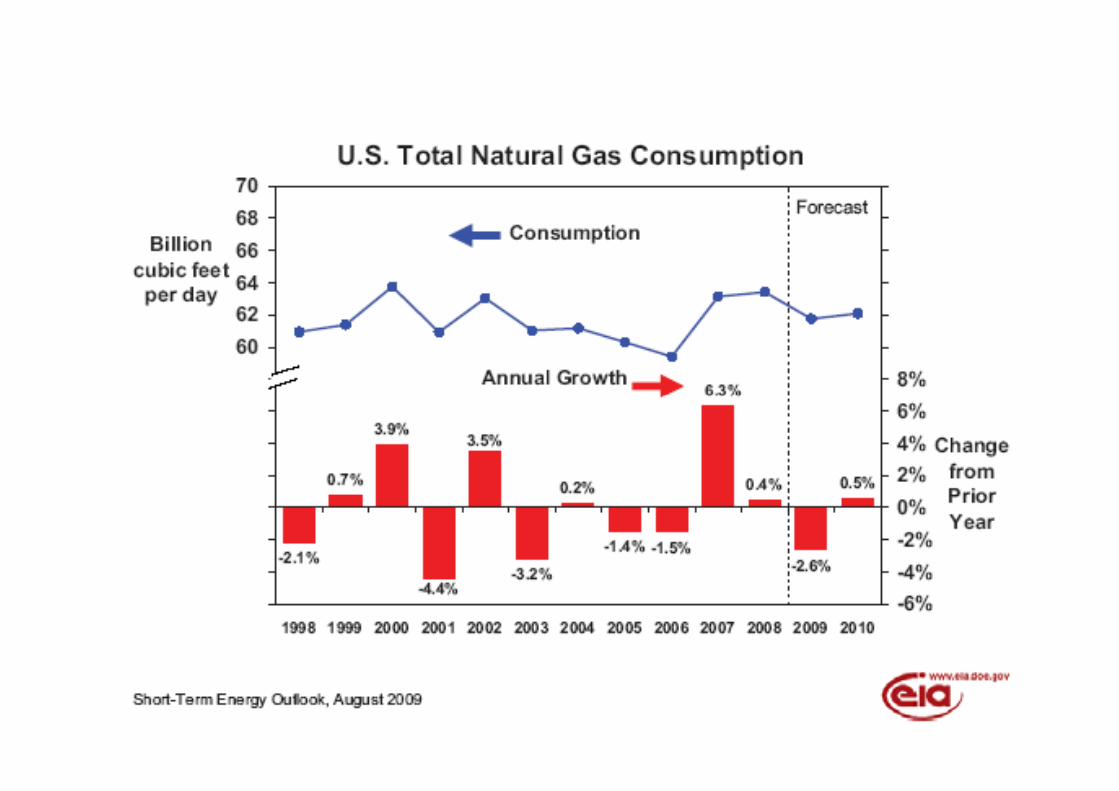
� Production is up, weather is mild, industrial demand is down.
� Rising demand for summer power generation has dampened seasonal price swings.
54Outlook
� Hurricane threats have not materialized this summer.
� Low prices are discouraging drilling and exploration – NG is record low compared to crude.
� Forward prices are much higher than spot.
The Propane Market
55Outlook
Market
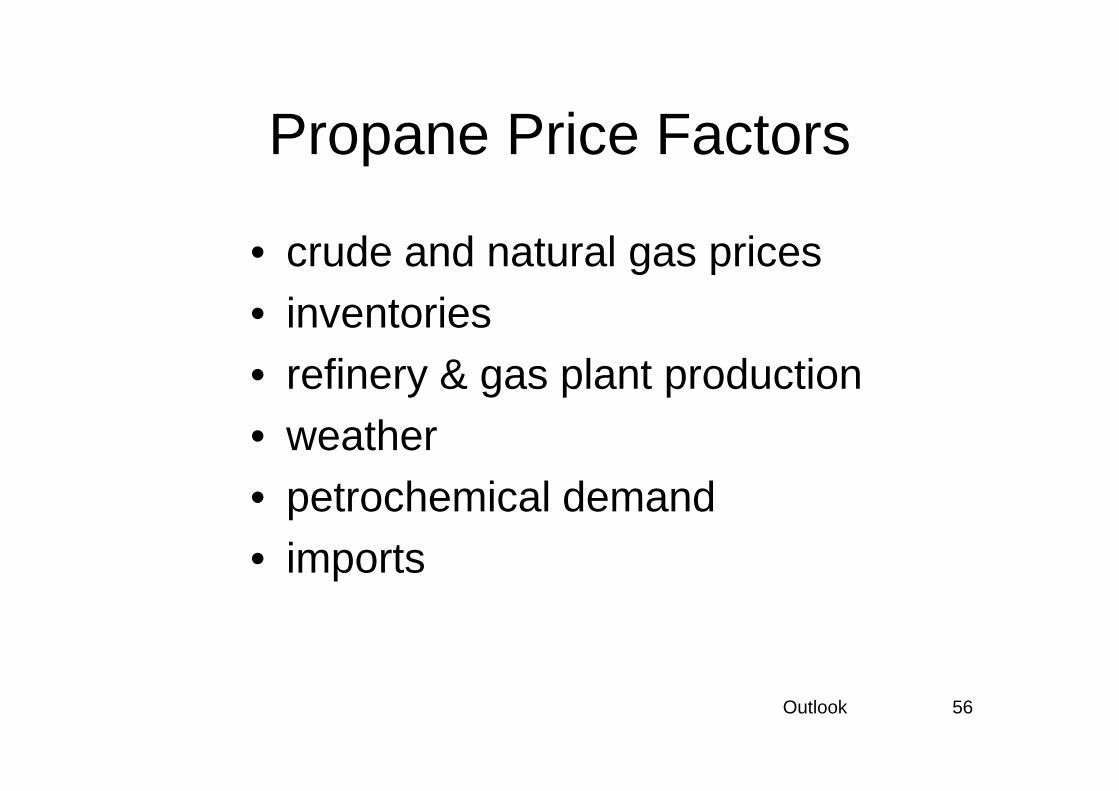
Propane Price Factors
• crude and natural gas prices• inventories• refinery & gas plant production
56Outlook
• refinery & gas plant production• weather • petrochemical demand• imports
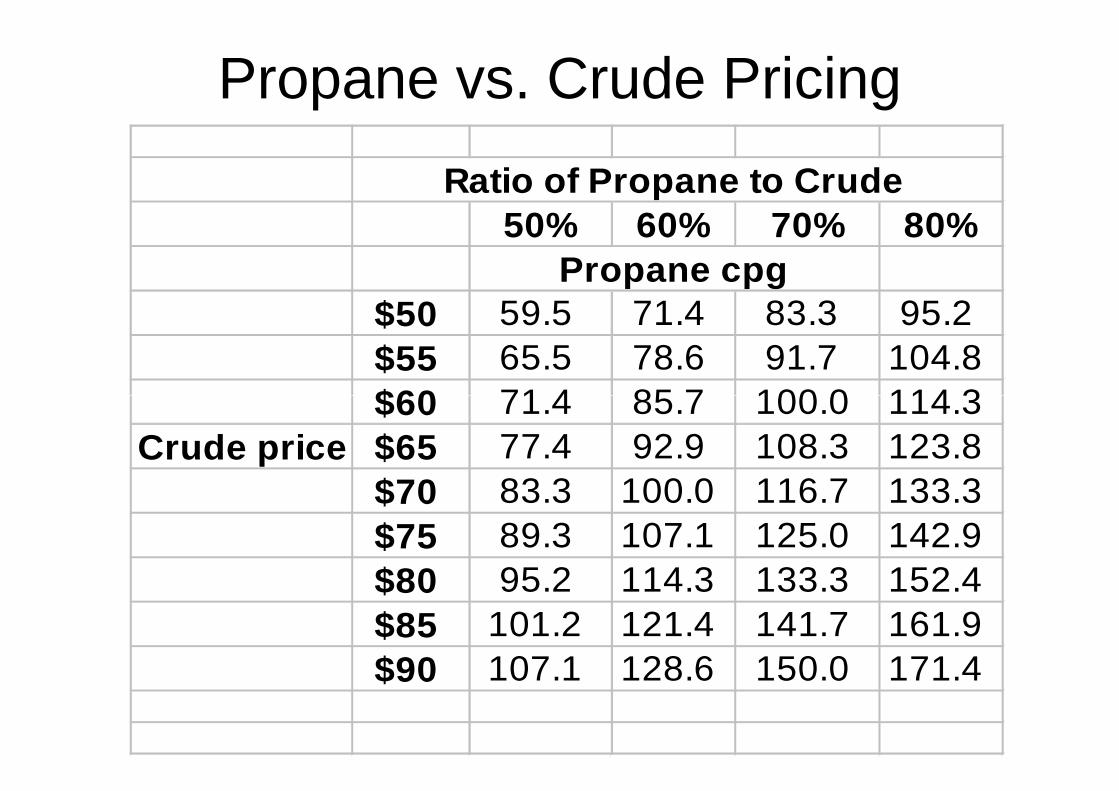
Propane vs. Crude Pricing
Ratio of Propane to Crude50% 60% 70% 80%
Propane cpg$50 59.5 71.4 83.3 95.2$55 65.5 78.6 91.7 104.8$60 71.4 85.7 100.0 114.3
57Outlook
$60 71.4 85.7 100.0 114.3Crude price $65 77.4 92.9 108.3 123.8
$70 83.3 100.0 116.7 133.3$75 89.3 107.1 125.0 142.9$80 95.2 114.3 133.3 152.4$85 101.2 121.4 141.7 161.9$90 107.1 128.6 150.0 171.4
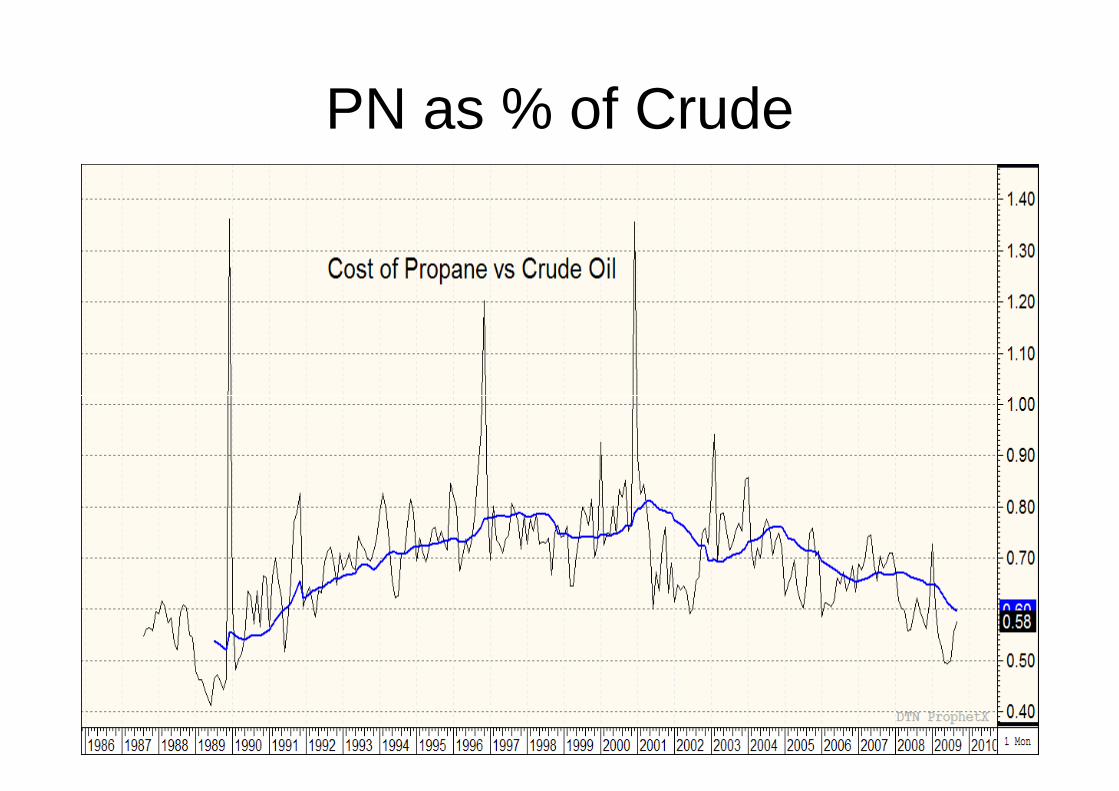
PN as % of Crude
58Outlook
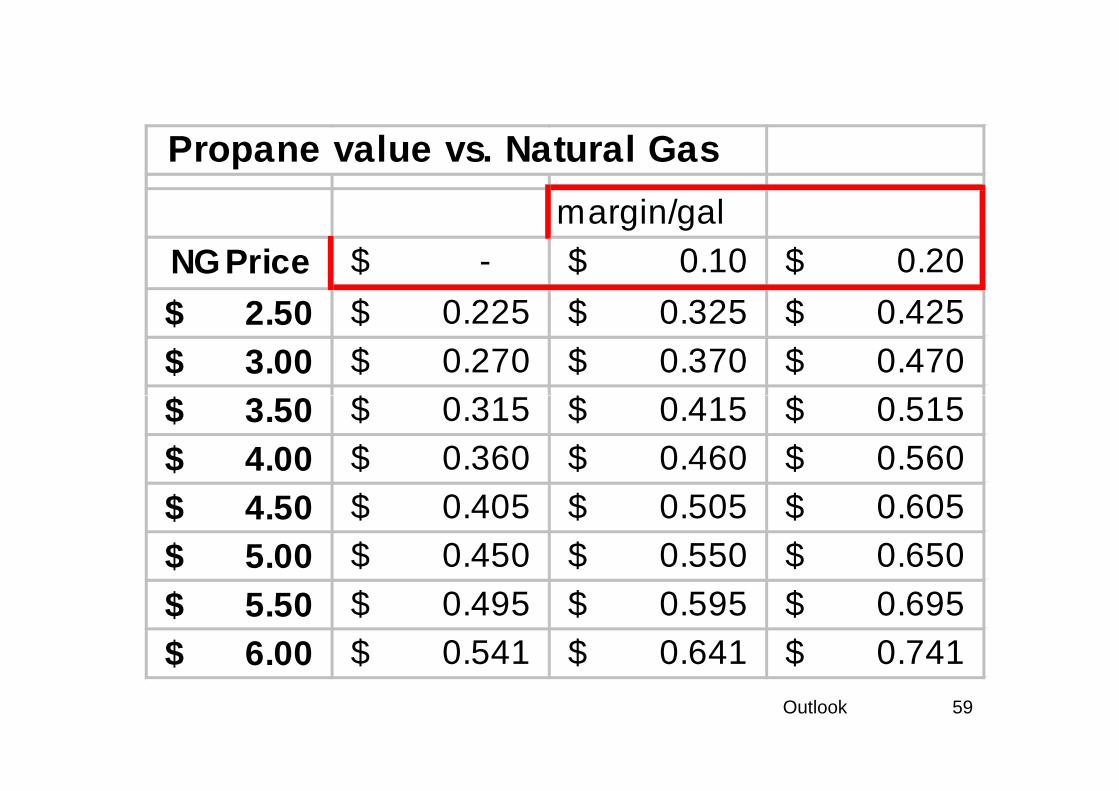
Propane value vs. Natural Gas
margin/gal
NG Price -$ 0.10$ 0.20$
2.50$ 0.225$ 0.325$ 0.425$
3.00$ 0.270$ 0.370$ 0.470$
3.50$ 0.315$ 0.415$ 0.515$
59Outlook
3.50$ 0.315$ 0.415$ 0.515$
4.00$ 0.360$ 0.460$ 0.560$
4.50$ 0.405$ 0.505$ 0.605$
5.00$ 0.450$ 0.550$ 0.650$
5.50$ 0.495$ 0.595$ 0.695$
6.00$ 0.541$ 0.641$ 0.741$
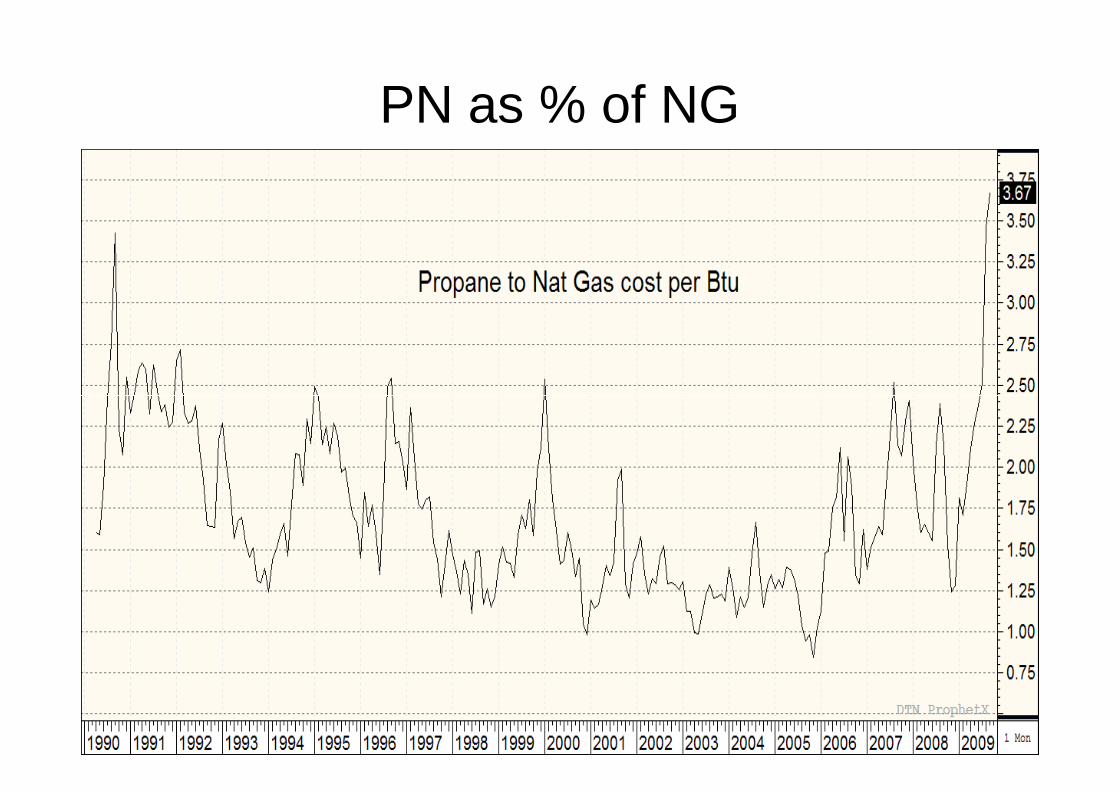
PN as % of NG
60Outlook
61Outlook
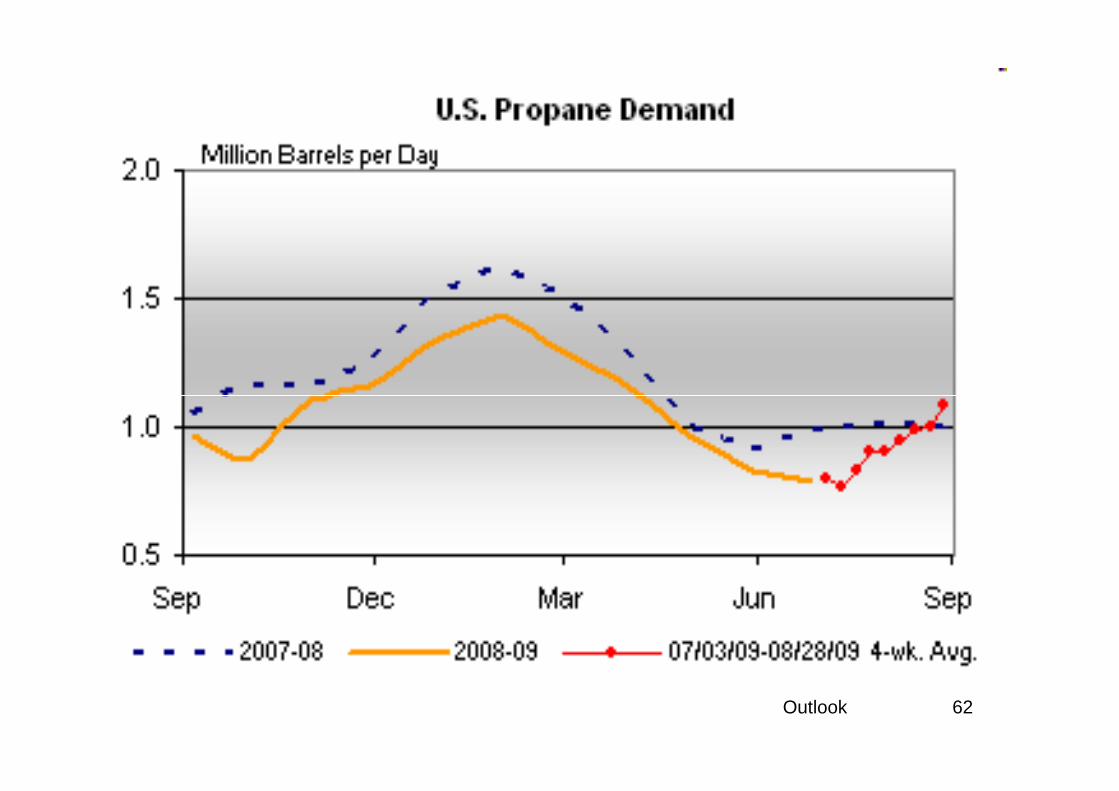
62Outlook
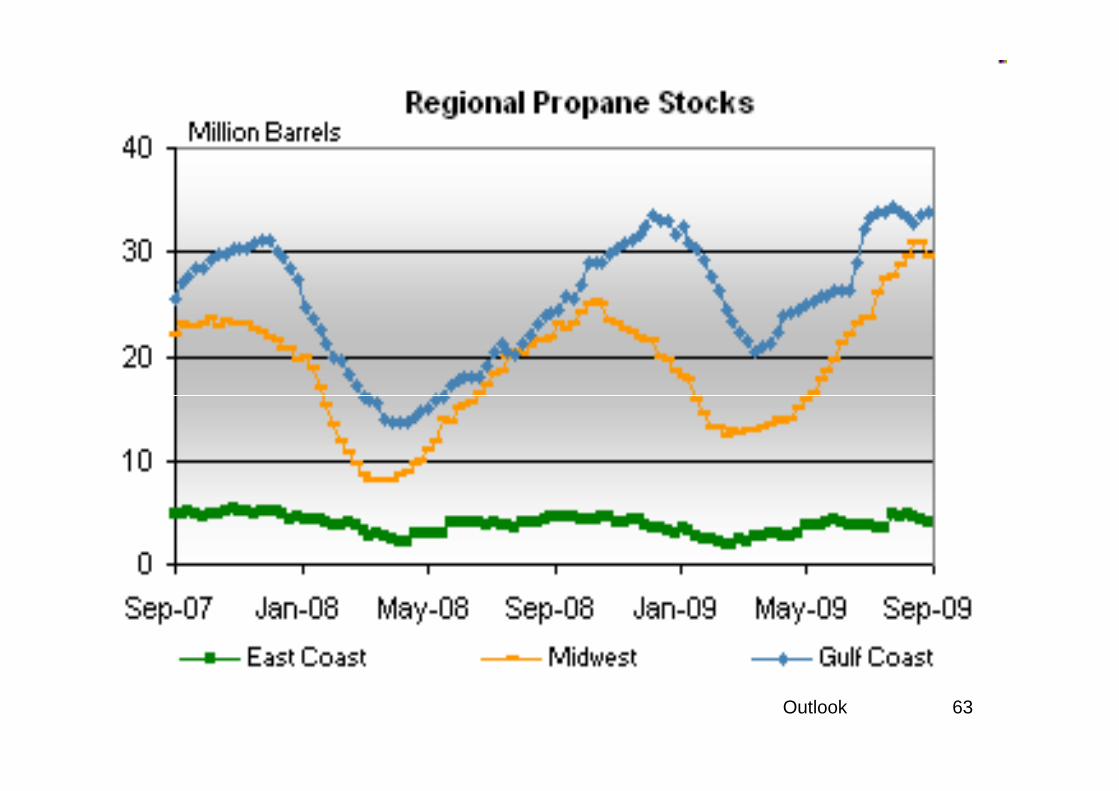
63Outlook
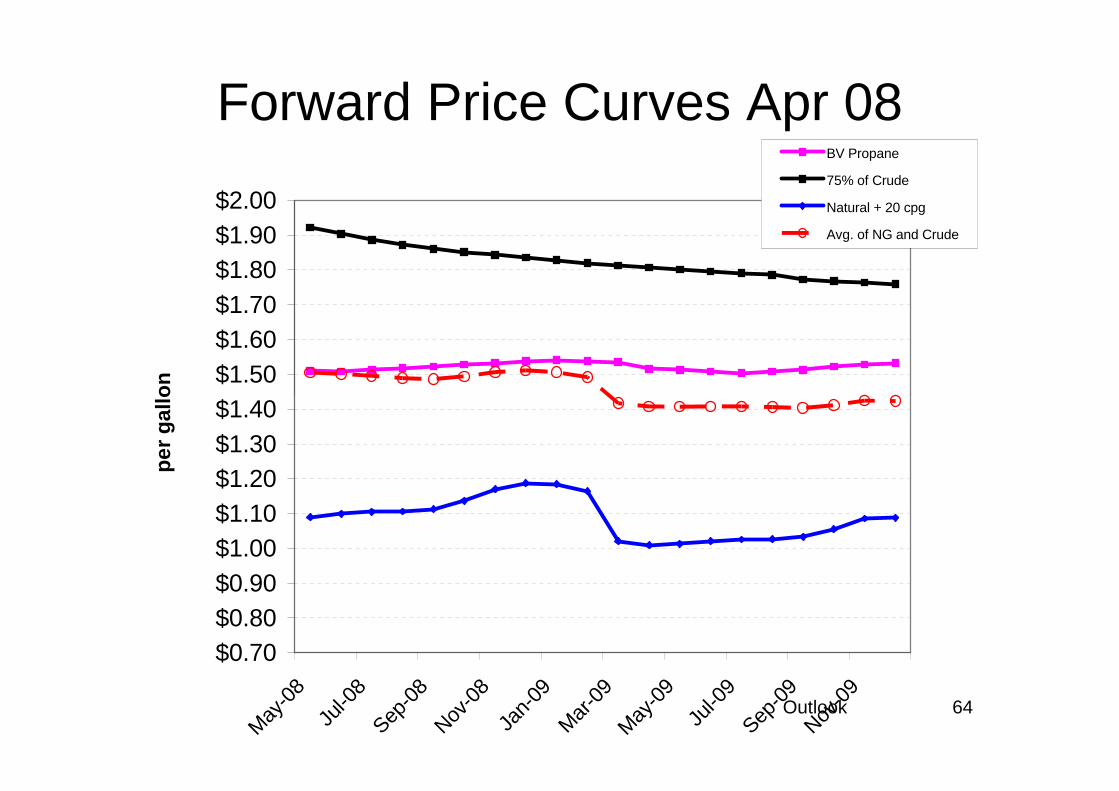
Forward Price Curves
$1.40$1.50$1.60$1.70$1.80$1.90$2.00
per
gallo
nBV Propane
75% of Crude
Natural + 20 cpg
Avg. of NG and Crude
Forward Price Curves Apr 08
64Outlook
$0.70$0.80$0.90$1.00$1.10$1.20$1.30$1.40
May
-08
Jul-0
8Sep
-08
Nov-0
8Ja
n-09
Mar
-09
May
-09
Jul-0
9Sep
-09
Nov-0
9
per
gallo
n
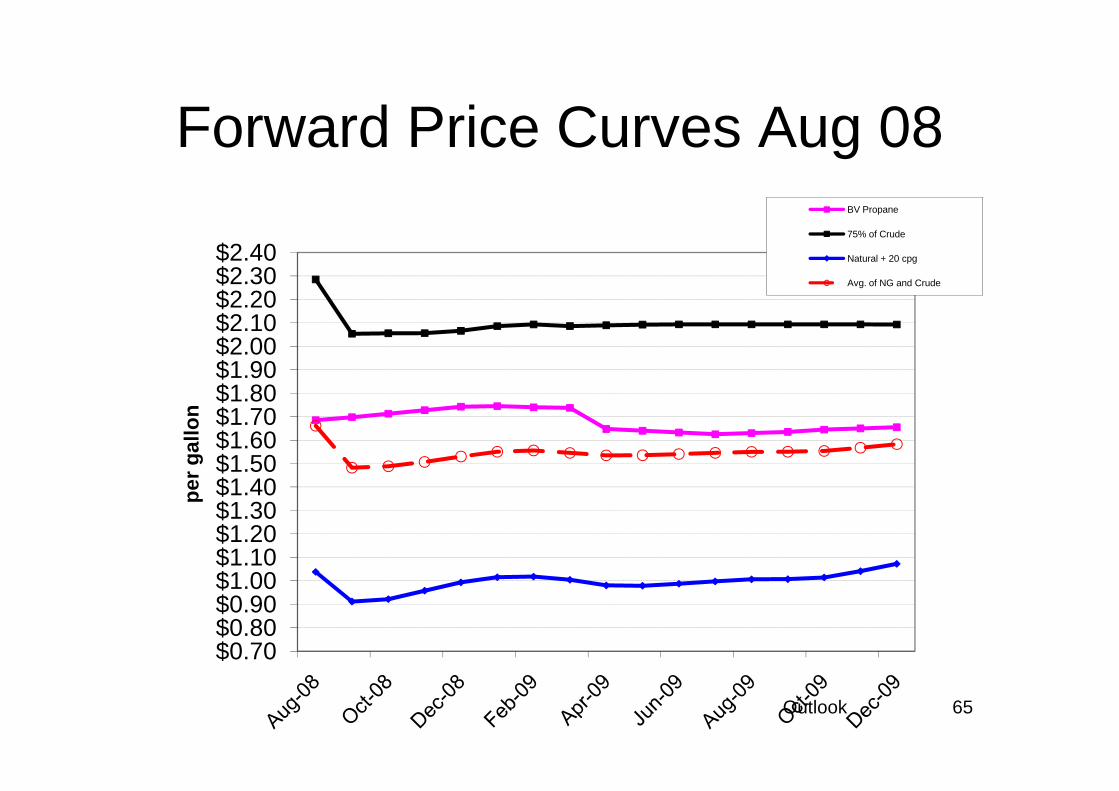
Forward Price Curves Aug 08
$1.80$1.90$2.00$2.10$2.20$2.30$2.40
BV Propane
75% of Crude
Natural + 20 cpg
Avg. of NG and Crude
65Outlook
$0.70$0.80$0.90$1.00$1.10$1.20$1.30$1.40$1.50$1.60$1.70$1.80
per
gallo
n
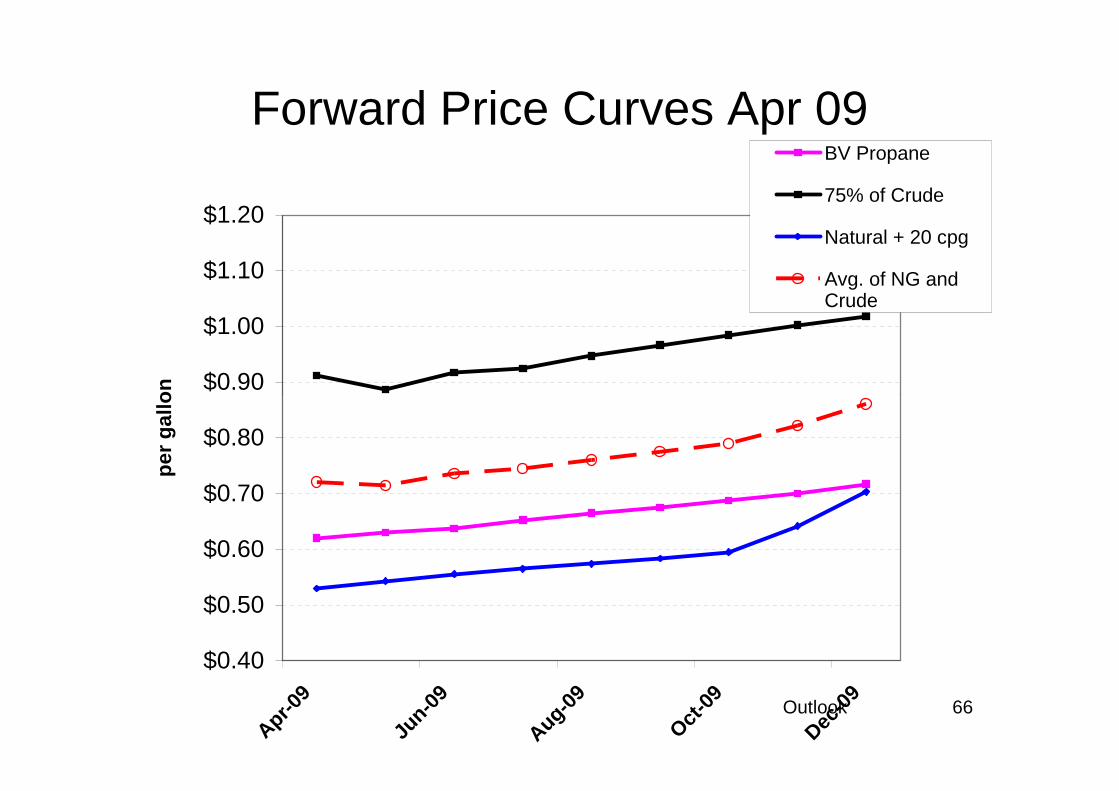
Forward Price Curves Apr 09
$0.90
$1.00
$1.10
$1.20
per
gallo
nBV Propane
75% of Crude
Natural + 20 cpg
Avg. of NG andCrude
66Outlook
$0.40
$0.50
$0.60
$0.70
$0.80
Apr-0
9
Jun-
09
Aug-0
9
Oct-09
Dec-0
9
per
gallo
n
67Outlook
68Outlook
69Outlook
70Outlook
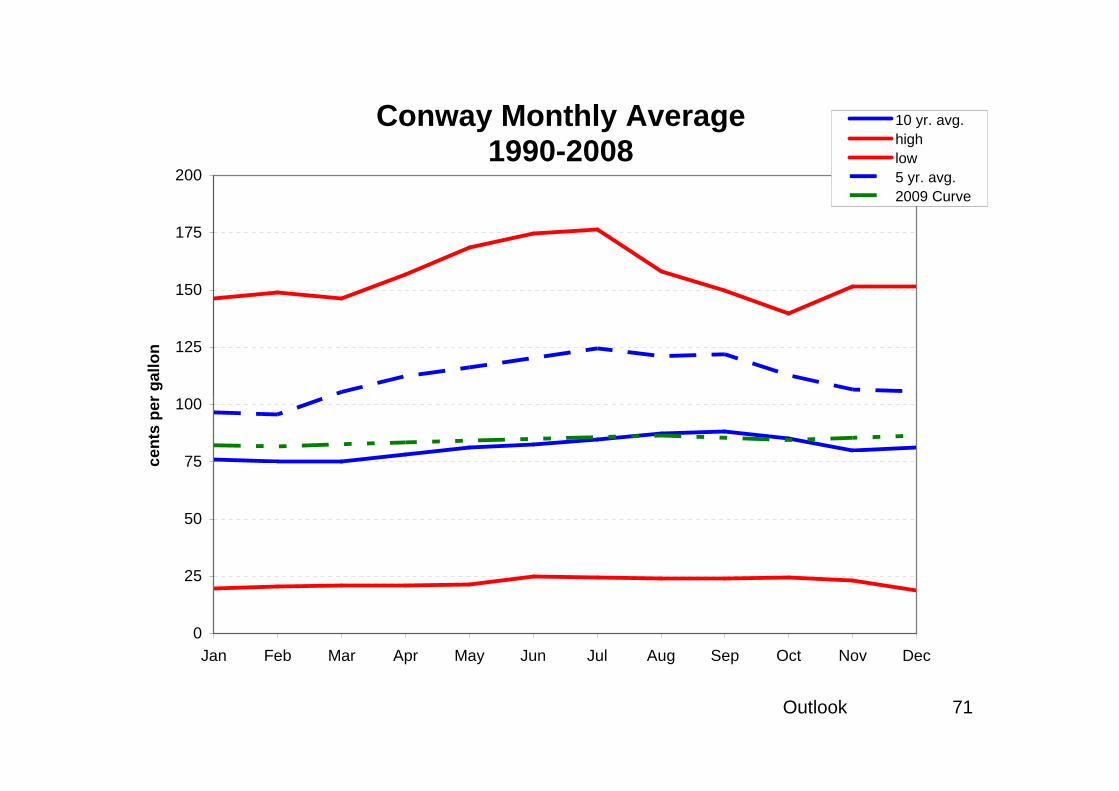
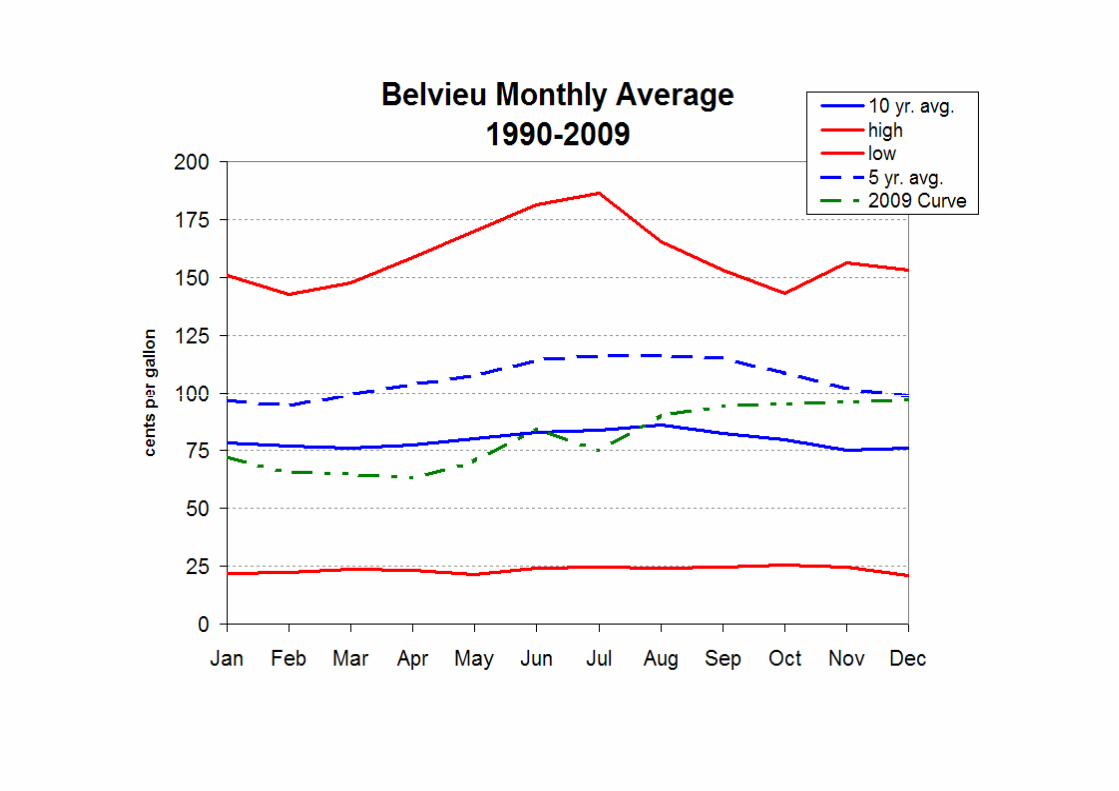
Conway Monthly Average1990-2008
100
125
150
175
200ce
nts
per
gallo
n
10 yr. avg.highlow5 yr. avg.2009 Curve
71Outlook
0
25
50
75
100
Jan Feb Mar Apr May Jun Jul Aug Sep Oct Nov Dec
cent
s pe
r ga
llon
72Outlook
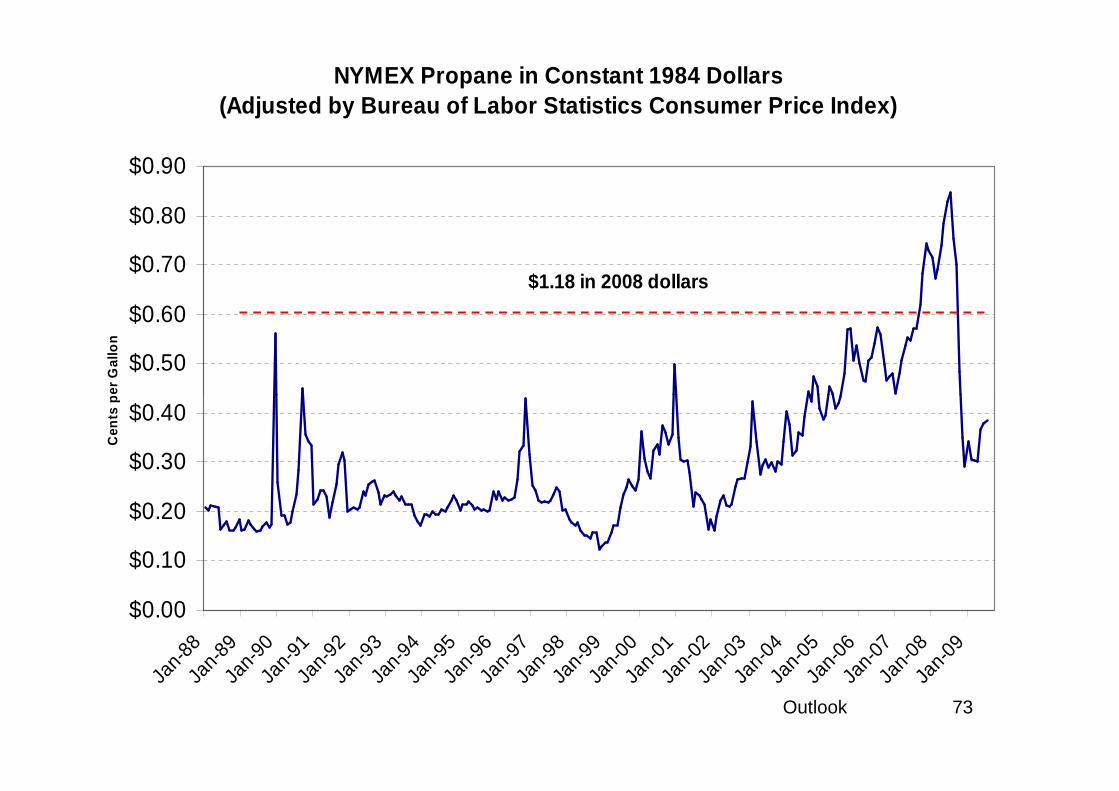
NYMEX Propane in Constant 1984 Dollars(Adjusted by Bureau of Labor Statistics Consumer Pr ice Index)
$0.50
$0.60
$0.70
$0.80
$0.90
Cen
ts p
er G
allo
n
$1.18 in 2008 dollars
73Outlook
$0.00
$0.10
$0.20
$0.30
$0.40
Jan-
88Ja
n-89
Jan-
90Ja
n-91
Jan-
92Ja
n-93
Jan-
94Ja
n-95
Jan-9
6Ja
n-97
Jan-
98Ja
n-99
Jan-
00Ja
n-01
Jan-
02Ja
n-03
Jan-
04Ja
n-05
Jan-0
6Ja
n-07
Jan-
08Ja
n-09
Cen
ts p
er G
allo
n
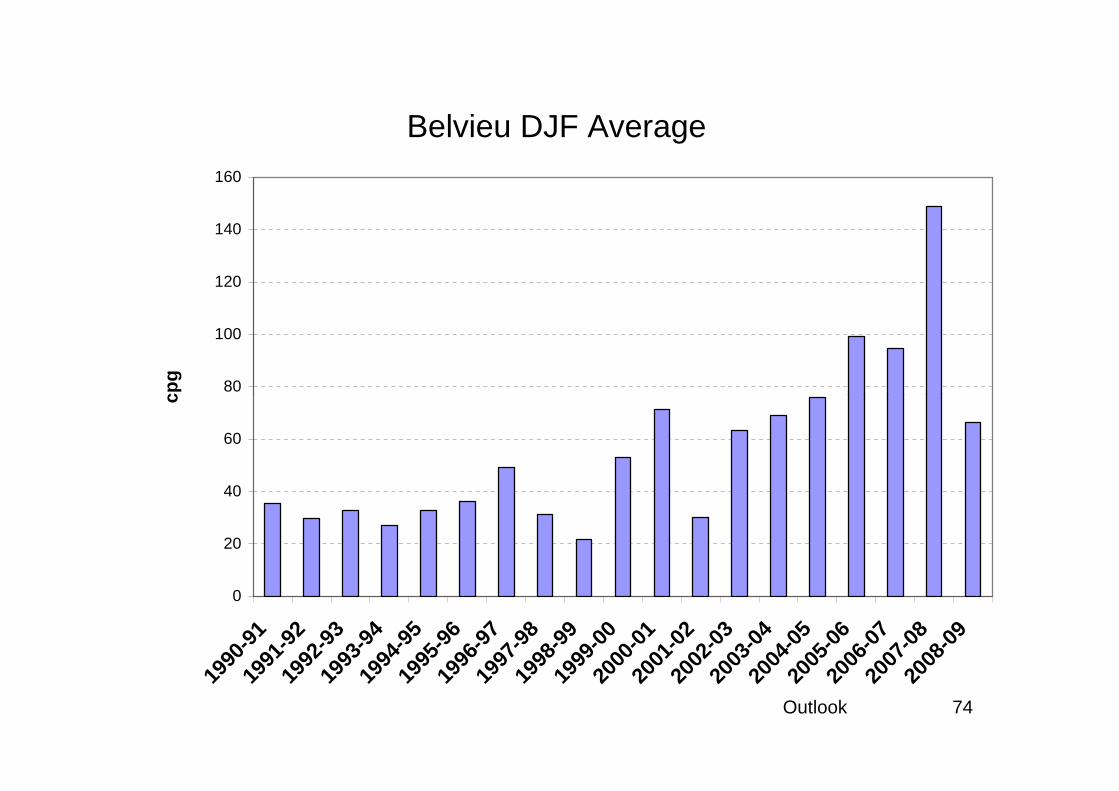
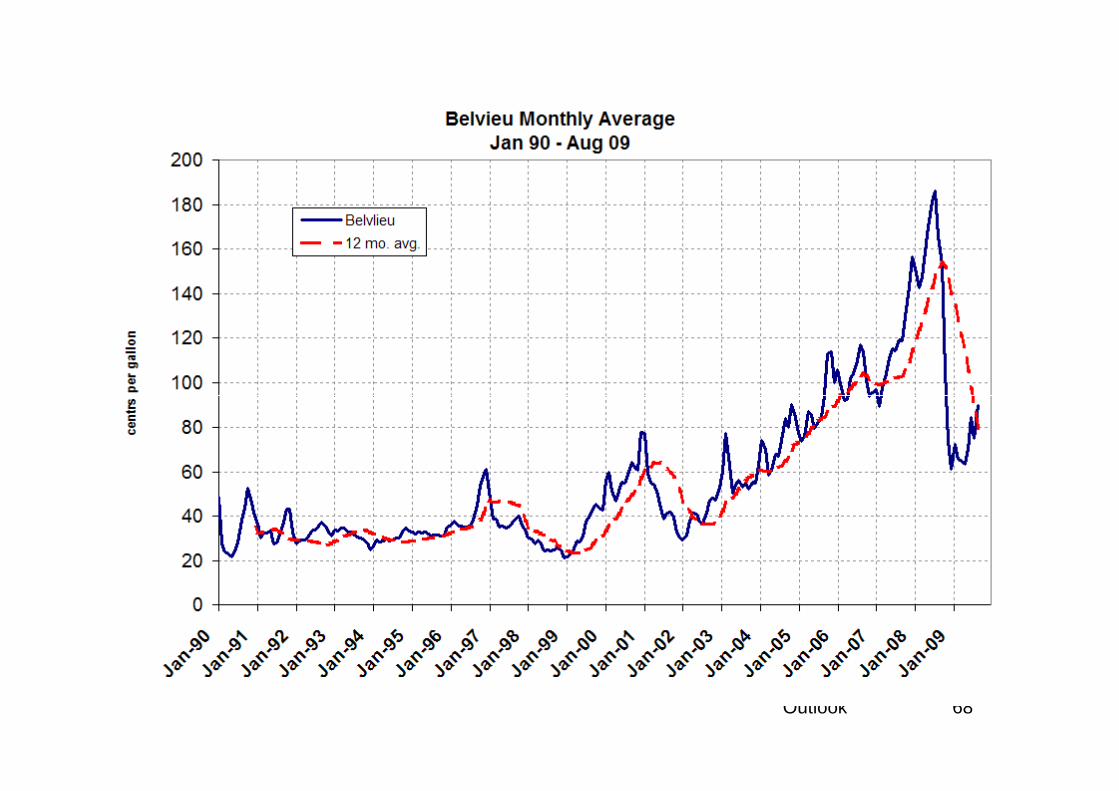
Belvieu DJF Average
80
100
120
140
160cp
g
74Outlook
0
20
40
60
1990
-91
1991
-92
1992
-93
1993
-94
1994
-95
1995
-96
1996
-97
1997
-98
1998
-99
1999
-00
2000
-01
2001
-02
2002
-03
2003
-04
2004
-05
2005
-06
2006
-07
2007
-08
2008
-09
cpg
75Outlook
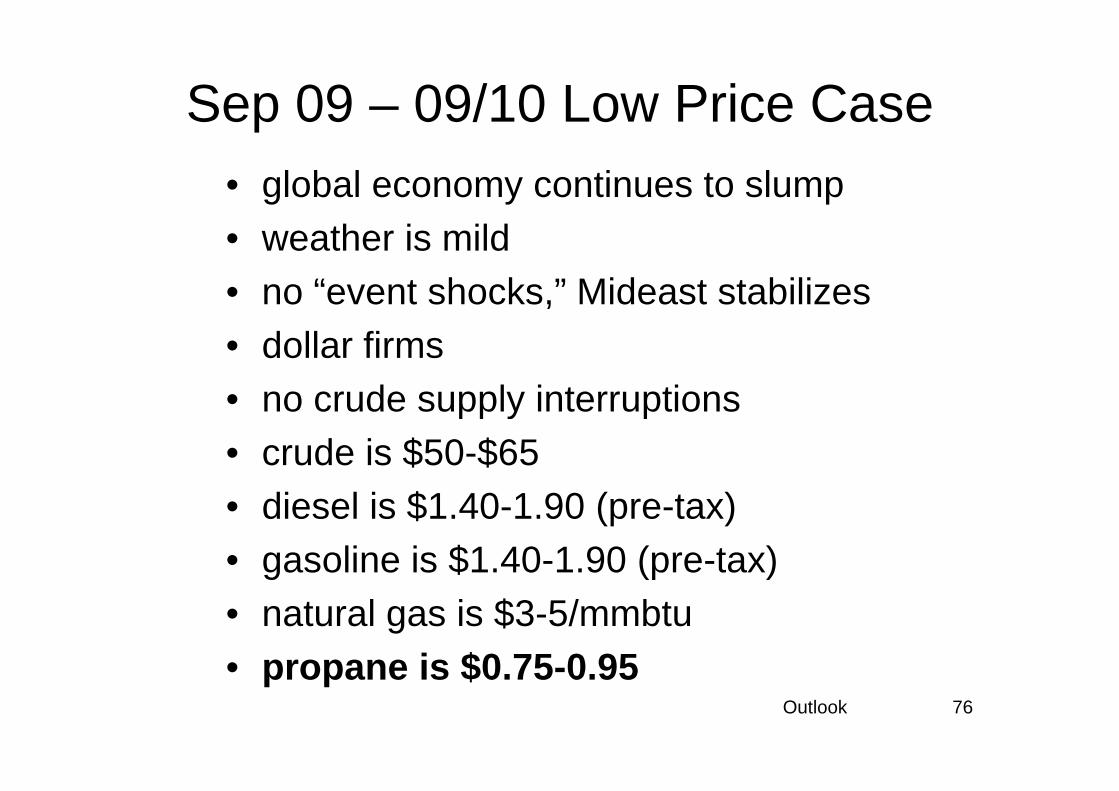
Sep 09 – 09/10 Low Price Case• global economy continues to slump• weather is mild• no “event shocks,” Mideast stabilizes• dollar firms• no crude supply interruptions
76Outlook
• no crude supply interruptions• crude is $50-$65• diesel is $1.40-1.90 (pre-tax)• gasoline is $1.40-1.90 (pre-tax)• natural gas is $3-5/mmbtu• propane is $0.75-0.95
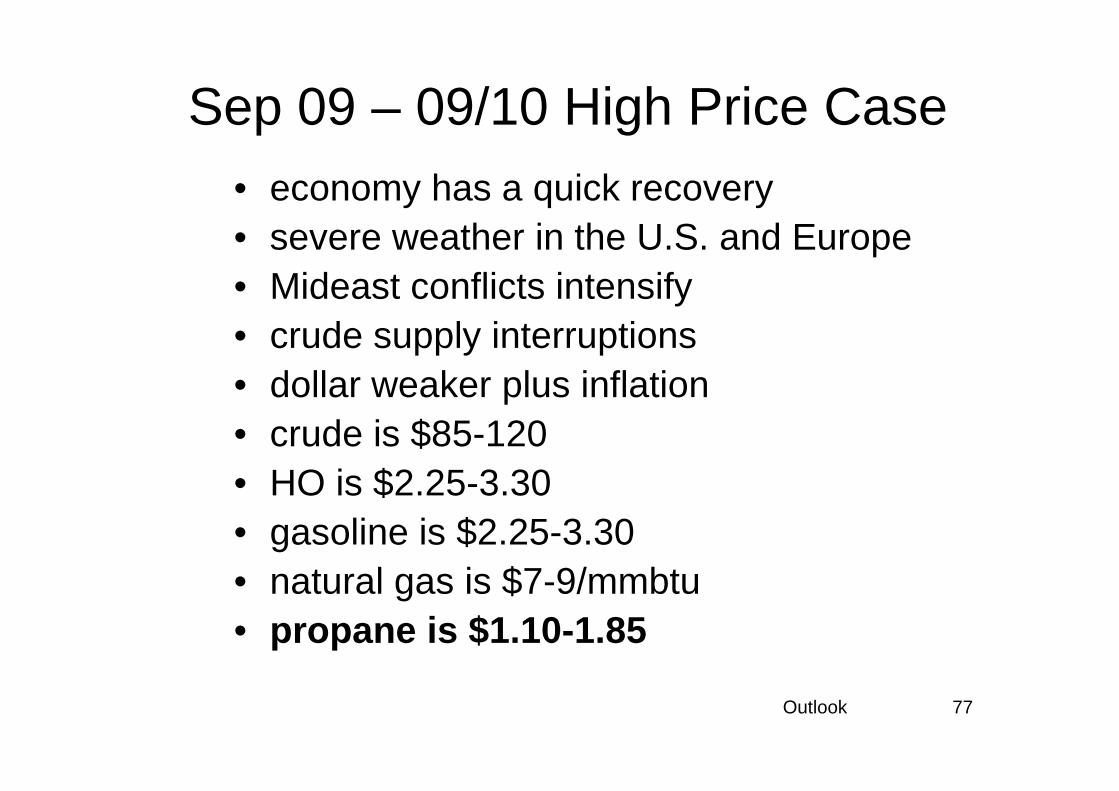
Sep 09 – 09/10 High Price Case• economy has a quick recovery• severe weather in the U.S. and Europe• Mideast conflicts intensify• crude supply interruptions • dollar weaker plus inflation
77Outlook
• dollar weaker plus inflation• crude is $85-120• HO is $2.25-3.30• gasoline is $2.25-3.30• natural gas is $7-9/mmbtu• propane is $1.10-1.85
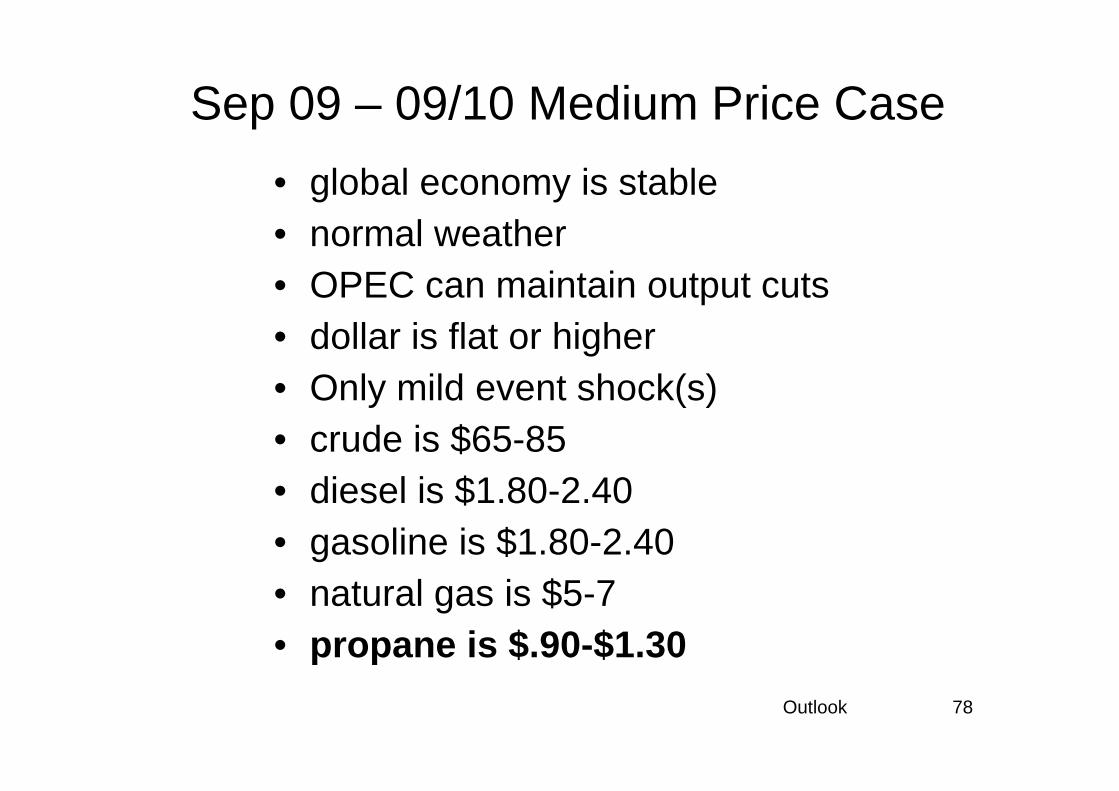
Sep 09 – 09/10 Medium Price Case
• global economy is stable• normal weather• OPEC can maintain output cuts• dollar is flat or higher• Only mild event shock(s)
78Outlook
• Only mild event shock(s)• crude is $65-85• diesel is $1.80-2.40• gasoline is $1.80-2.40• natural gas is $5-7• propane is $.90-$1.30
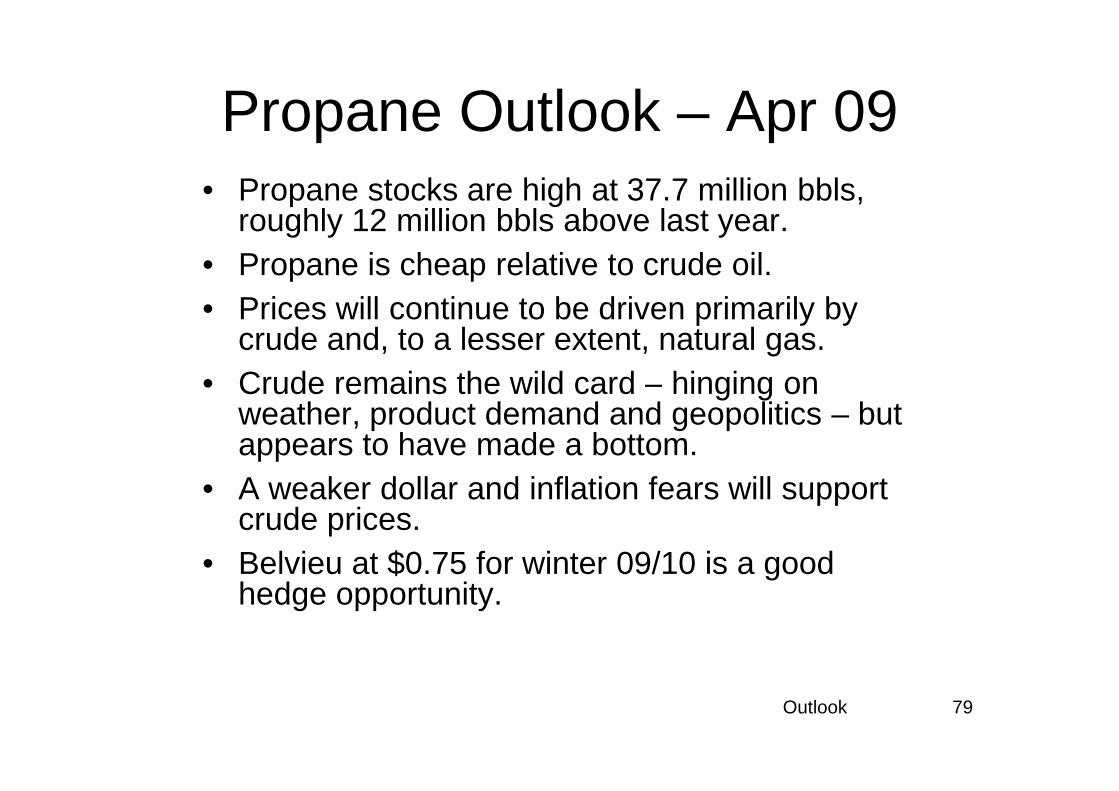
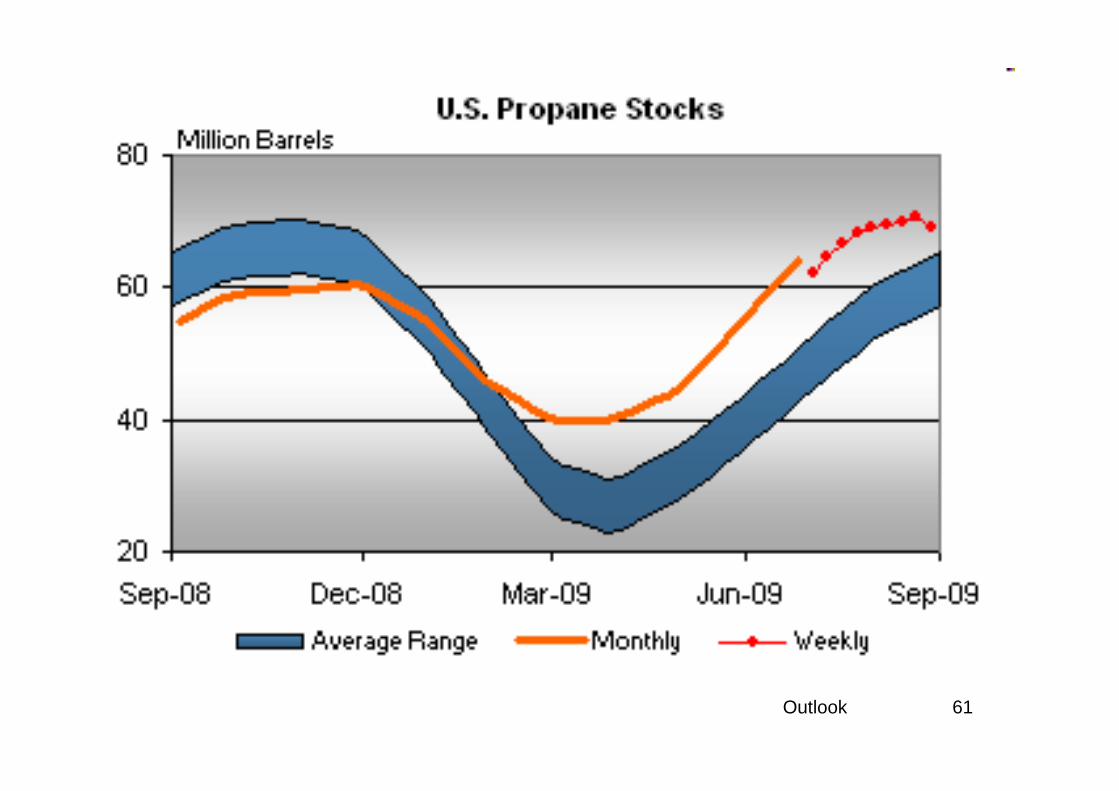
Propane Outlook – Apr 09• Propane stocks are high at 37.7 million bbls,
roughly 12 million bbls above last year.• Propane is cheap relative to crude oil.• Prices will continue to be driven primarily by
crude and, to a lesser extent, natural gas.• Crude remains the wild card – hinging on
79Outlook
• Crude remains the wild card – hinging on weather, product demand and geopolitics – but appears to have made a bottom.
• A weaker dollar and inflation fears will support crude prices.
• Belvieu at $0.75 for winter 09/10 is a good hedge opportunity.
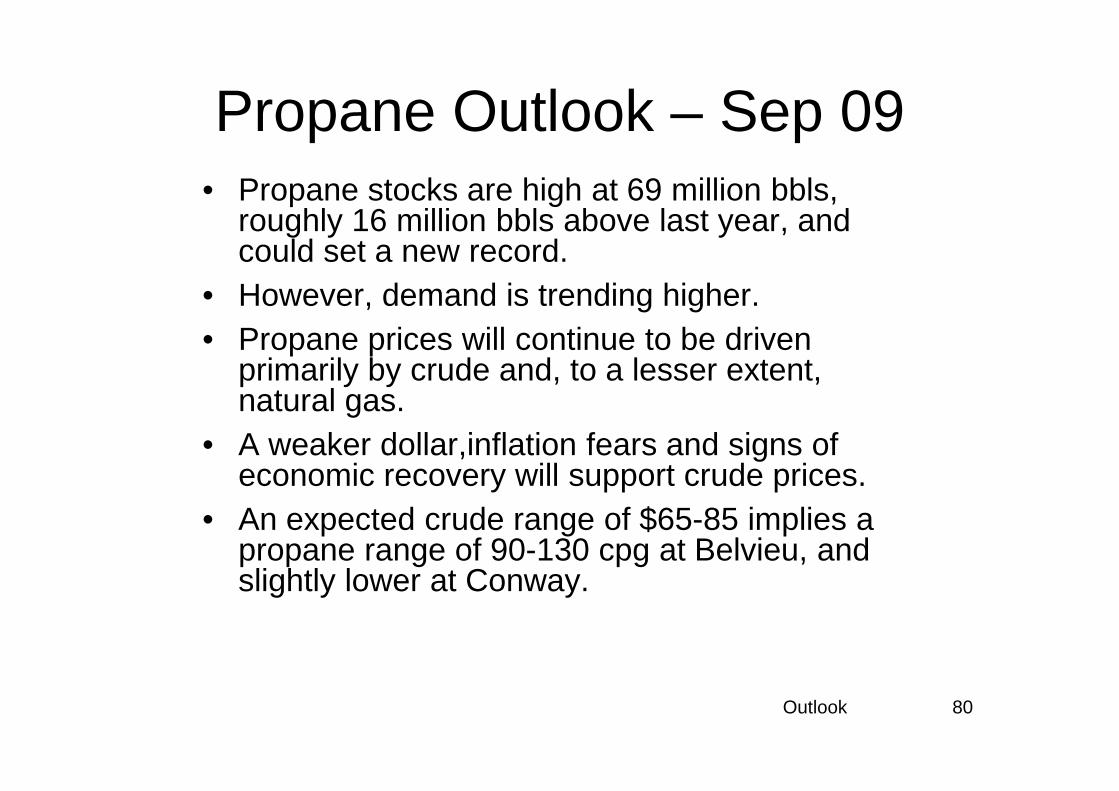
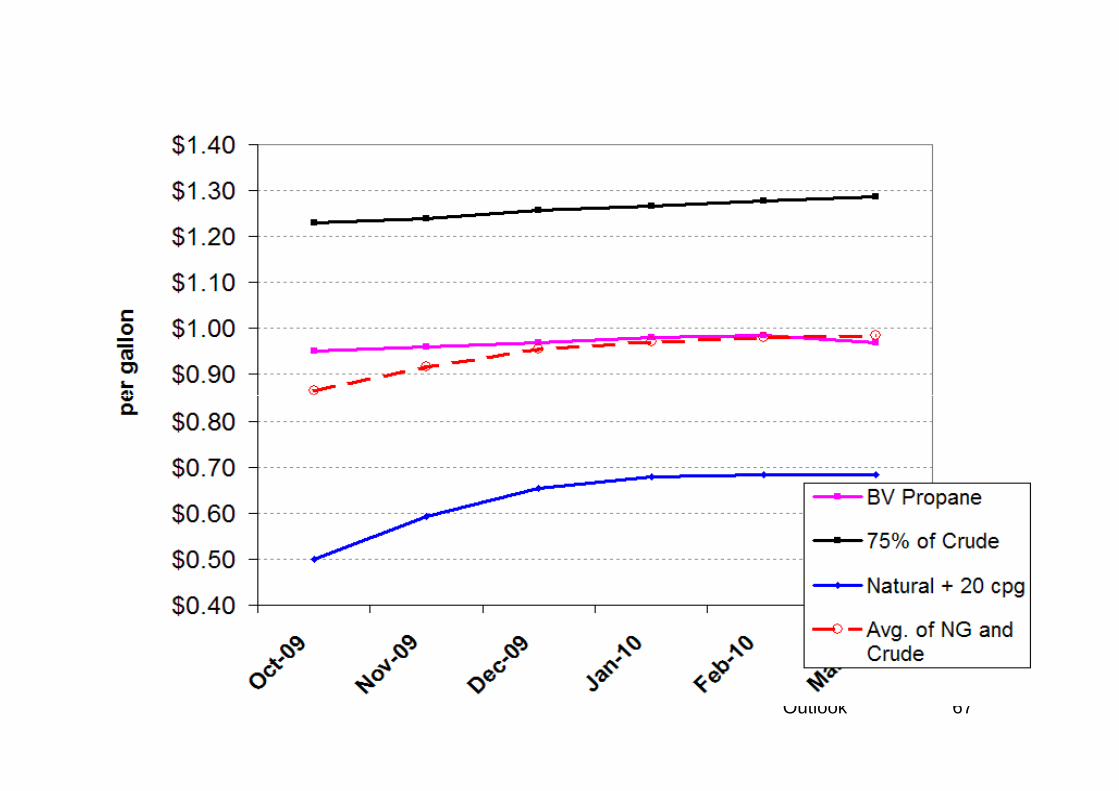
Propane Outlook – Sep 09• Propane stocks are high at 69 million bbls,
roughly 16 million bbls above last year, and could set a new record.
• However, demand is trending higher.• Propane prices will continue to be driven
primarily by crude and, to a lesser extent, natural gas.
80Outlook
natural gas.• A weaker dollar,inflation fears and signs of
economic recovery will support crude prices.• An expected crude range of $65-85 implies a
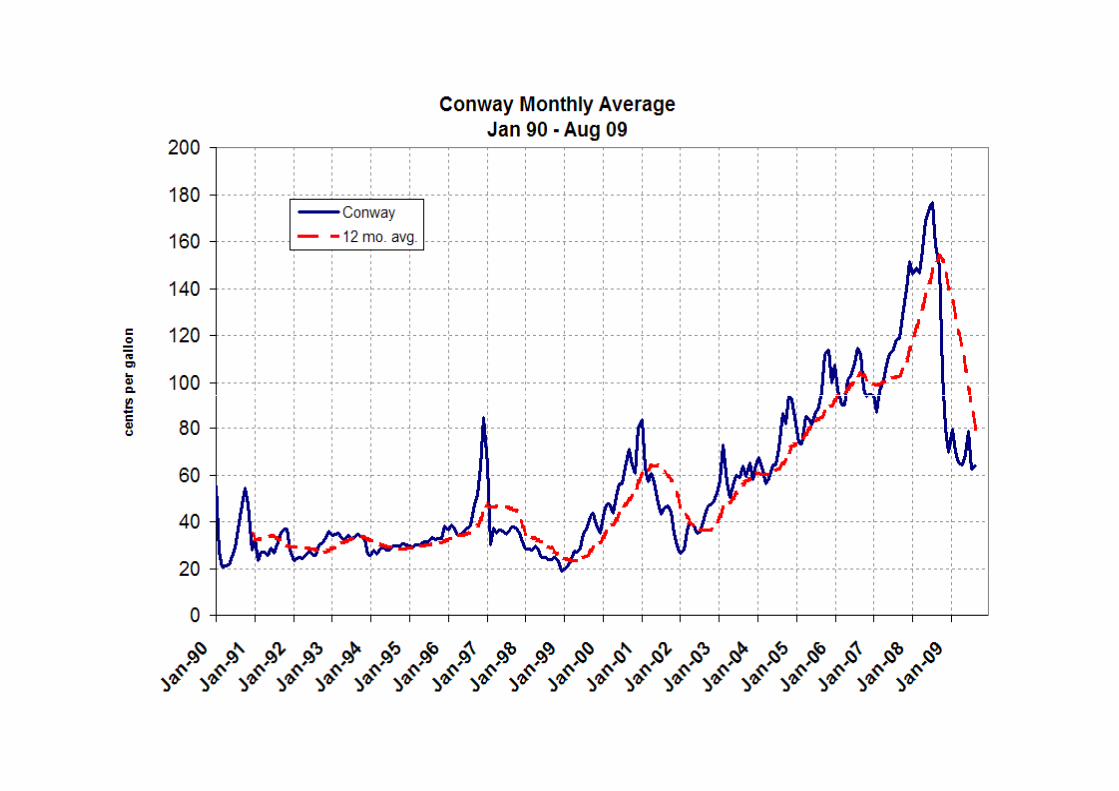
propane range of 90-130 cpg at Belvieu, and slightly lower at Conway.