World Economic Situation - United Nations · World Economic Situation and Prospects 2010 Update as...
28
World Economic Situation and Prospects 2010 Update as of mid-2010* United Nations New York, 2010 * The present document updates World Economic Situation and Prospects 2010 (United Nations publication, Sales No. E.10.II.C.2), released in January 2010. http://www.un.org/esa/policy/wess/wesp.html Embargo: 11 am 26 May 2010 New York time
Transcript of World Economic Situation - United Nations · World Economic Situation and Prospects 2010 Update as...
World Economic Situation and Prospects 2010Update as of mid-2010*
United NationsNew York, 2010
* The present document updates World Economic Situation and Prospects 2010 (United Nations publication, Sales No. E.10.II.C.2), released in January 2010.
http://www.un.org/esa/policy/wess/wesp.html
Embargo: 11 am
26 May 2010
New York time


World Economic Situation and Prospects 2010Update as of mid-2010*
The world economy continued to improve in the first half of 2010, leading to a slight upward revision in the United Nations outlook for global growth. The pace of the recovery is too weak, however, to close the global output gap left by the crisis. The recovery is also uneven across countries. While growth prospects for some developing countries are encouraging, economic activity is lacklustre in developed economies and below potential elsewhere in the developing world.
Important weaknesses in the global economy remain. Despite the large amounts of liquidity injected into the financial system, credit growth remains feeble in major developed economies and the process of financial de-leveraging is still ongoing. Unemployment rates are expected to remain elevated for a protracted period in most developed economies. In developing countries, many workers have been pushed into vulnerable employment and the number of working poor may still increase further in the immediate outlook. Fiscal positions are deteriorating rapidly, particularly among developed countries. This is limiting the space for further policy support needed to sustain the recovery in many economies. Escalated concerns about risks associated with sovereign debts in some economies have also become a new source for financial instability.
Continued macroeconomic stimulus remains crucial for solidifying and broadening the recovery, but should become more focused on boosting employment growth. A balance between the continued need for sustaining the recovery and the need for fiscal consolidation in the medium run is a key policy challenge for many developed countries. International policy coordination needs to be strengthened in order to put the world economy on a robust, sustainable and more balanced growth path, and for reforming both the national and international financial systems.
Summary
* The present document updates World Economic Situation and Prospects 2010 (United Nations publication, Sales No. E.10.II.C.2), released in January 2010.
http://www.un.org/esa/policy/wess/wesp.html

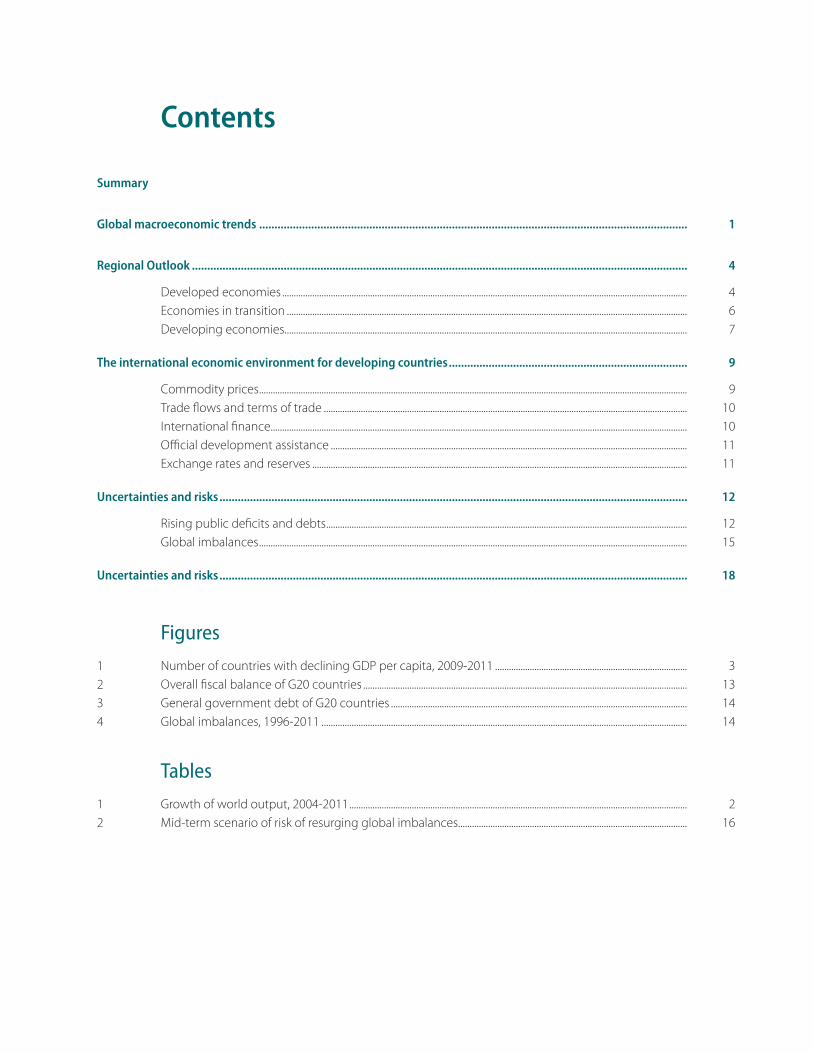
Contents
Summary
Global macroeconomic trends ............................................................................................................................................ 1
Regional Outlook .................................................................................................................................................................. 4
Developed economies ............................................................................................................................................................................... 4Economies in transition ............................................................................................................................................................................. 6Developing economies .............................................................................................................................................................................. 7
The international economic environment for developing countries .............................................................................. 9
Commodity prices ......................................................................................................................................................................................... 9Trade flows and terms of trade ............................................................................................................................................................. 10International finance.................................................................................................................................................................................... 10Official development assistance .......................................................................................................................................................... 11Exchange rates and reserves .................................................................................................................................................................. 11
Uncertainties and risks ......................................................................................................................................................... 12
Rising public deficits and debts ............................................................................................................................................................ 12Global imbalances ......................................................................................................................................................................................... 15
Uncertainties and risks ......................................................................................................................................................... 18
Figures
1 Number of countries with declining GDP per capita, 2009-2011 ................................................................................... 32 Overall fiscal balance of G20 countries ............................................................................................................................................ 133 General government debt of G20 countries ................................................................................................................................ 144 Global imbalances, 1996-2011 .............................................................................................................................................................. 14
Tables
1 Growth of world output, 2004-2011 .................................................................................................................................................. 22 Mid-term scenario of risk of resurging global imbalances................................................................................................... 16


1
Global macroeconomic trendsHaving fallen into the most severe recession since World War Two, the world economy is on the way to recovery. Following a contraction of 2.0 per cent in 2009, world gross product (WGP) is expected to grow by 3.0 per cent in 2010 and 3.1 per cent in 2011, (table 1). The pace of the recovery remains subdued, however. It is far from sufficient to recuperate the job losses and close the output gap created by the deep recession. The baseline forecast assumes that the multi-year policy stimulus measures put in place in the major economies will be implemented as envisaged, implying that in most countries government stimulus will continue at least during 2010, and that private sector confidence will pick up gradually.
Buttressed by unprecedented government support worldwide, global financial markets have progressively stabilized. By mid-2010, systemic risks in the world finan-cial system have abated notably, while risk premia in most credit market segments have dropped to pre-crisis levels. Also, major equity markets have recovered on average about half of the losses incurred during the crisis, while banks and other financial institutions have managed to rebuild their capital. Capital inflows are gradually returning to many developing economies, and prices of primary commodities have rebounded after steep declines from the start of the crisis to the second quarter of 2009.
The recovery in the real economy has also gained more traction. Propelled by fiscal stimulus packages and expansionary monetary policies, most economies registered positive growth in late 2009 and early 2010. The increase in policy-engendered public spending and the turn-around in inventories, which were curtailed precipitously during the crisis, have been major factors in the growth recovery. Meanwhile, household con-sumption and business investment are showing tentative signs of revival and international trade and global industrial production, which both collapsed during the crisis, have been rebounding steadily, although they are still below their pre-crisis peaks.
Yet, important weaknesses remain in the world economy. Despite the huge amount of liquidity that was injected into the financial system, credit flows to non-financial sectors in many economies, particularly the major developed economies, remain subdued. While the rebound in equity prices has mitigated the losses of many financial institutions, the process of establishing sounder balance sheets through write downs of troubled assets and de-leveraging is still on-going. At the same time, public finances of many developed countries have deteriorated rapidly due to the impact of the crisis and the policy responses. In some, such as in Greece, Portugal, Spain and Ireland, they have already become a new source of financial instability.
The recovery of economic activity at the global level is weaker and slower than observed after previous recessions of recent date. Economic recovery is also uneven across countries. In most developed countries, private sector activity is not yet on a solid footing. Facing elevated unemployment rates, soaring public debt, and limited credit flows, growth prospects for most developed economies remain lacklustre, unable to provide sufficient impetus to the global economy. While developing Asia, particularly China and India, is leading the way among developing countries, the recovery is much more subdued in many economies in Africa and Latin America. Although most economies in transition are seeing a visible rebound from the deep downturn in 2009, the recovery is fragile being heavily dependent on conditions in world commodity markets and access to external borrowing.
Many developing countries are still suffering from the fallout of the global financial crisis. Though only a reduced number of developing countries are expected to register another year of decline of per capita income during 2010 (figure 1), the impact on

2 World Economic Situation and Prospects 2010
Table 1 Growth of world output, 2004-2011
Annual percentage change)
Change from United Nations
forecast of January 2010d
2004-2007a 2008 2009b 2010c 2011c 2010
World 3.8 1.8 -2.0 3.0 3.2 0.6
Developed economies 2.6 0.4 -3.4 1.9 2.1 0.6USA 2.6 0.4 -2.4 2.9 2.5 0.8Japan 2.1 -1.2 -5.2 1.3 1.3 0.4European Union 2.7 0.8 -4.2 1.0 1.8 0.5
EU15 2.5 0.5 -4.2 0.9 1.7 0.4New EU Members 5.8 3.9 -3.5 1.7 3.2 0.5Euro zone 2.5 0.6 -4.0 0.9 1.5 0.5
Other European 3.0 1.8 -1.7 1.9 2.2 1.2Other developed countries 3.1 1.0 -1.0 3.1 2.9 1.0
Economies in transition 7.6 5.4 -6.7 3.9 3.4 2.3South-eastern Europe 5.3 4.3 -3.7 1.1 3.0 0.4CIS 7.8 5.5 -6.9 4.2 3.5 2.5
Russian Federation 7.4 5.6 -7.9 4.3 3.0 2.8Developing economies 7.2 5.3 2.2 5.9 5.8 0.6
Africa 5.7 5.0 2.4 4.7 5.3 0.4North Africa 5.2 4.9 3.6 4.6 5.3 0.7Sub-Saharan Africa 6.0 5.0 1.9 4.7 5.3 0.3
Nigeria 6.0 6.0 6.9 6.5 7.0 1.5South Africa 5.1 3.1 -1.8 2.7 3.5 -0.4Others 6.8 6.2 2.8 5.6 5.9 0.4
East and South Asia 8.5 6.2 4.8 7.1 6.9 0.7East Asia 8.6 6.1 4.7 7.3 6.9 0.6
China 11.7 9.0 8.7 9.2 8.8 0.4South Asia 8.1 6.5 5.1 6.5 6.9 1.0
India 9.2 7.3 6.4 7.9 8.1 1.4Western Asia 6.0 4.3 -1.0 4.2 4.0 0.6
Latin America and the Caribbean 5.3 4.0 -2.1 4.0 3.9 0.6South America 5.8 5.3 -0.3 4.5 4.6 0.8
Brazil 4.4 5.1 -0.2 5.8 5.6 1.3Mexico and Central America 4.1 1.7 -5.9 3.4 2.8 0.5Mexico 3.9 1.3 -6.5 3.5 2.8 0.5Caribbean 8.2 3.8 1.0 2.1 3.0 -0.4
Least developed countries 7.8 7.1 4.0 5.6 5.6 0.3
Memorandum items:
World trade 7.7 2.7 -13.1 7.6 5.9 2.2World output growth with PPP-based weights 4.8 2.9 -0.8 3.9 4.0 0.7
Source: UN/DESA.a Average percentage change.b Partly estimated.c Forecast, based in part on Project LINK.d See World Economic Situation and Prospects 2010, available at http://www.un.org/esa/analysis/wess/wesp2010files/wesp2010.pdf.

3Update as of mid-2010
labour markets and social conditions is still being felt more broadly. The reduction in em-ployment and income opportunities has led to a considerable slowdown in progress towards poverty reduction and the fight against hunger. By the end of 2010, the crisis will have left an estimated 64 million more persons in extreme poverty relative to the pre-crisis trend. The steep rise in food prices during 2007-2008 is estimated to have increased the number of malnourished people by 63 million, while the global economic crisis may have led to another 41 million undernourished than would have been the case without the crisis.1
The number of unemployed worldwide rose by more than 34 million people in 2009 as the estimated global rate of unemployment increased from 5.7 per cent at the end of 2007 to 6.6 per cent by the end of 2009. However, the impact of the crisis on employment levels varied greatly across countries: while some reported increases in unemployment rates of more than 10 per cent compared to pre-crisis levels (such as in the three Baltic countries and Spain), others reported increases of 5 per cent or more (such as in Ireland, the United States and Iceland). In many developing countries, informal sectors absorbed the impact on unemployment. As jobs in the informal sector tend to be more precarious and receiving low pay, the number of working poor is estimated to have increased by 215 million according to the International Labour Organization.2 At the present rate of recovery, it is expected to take at least 4 to 5 years to bring unemployment rates down to pre-crisis levels in most developed countries. In many developing economies informal sectors may continue to expand as firms postpone hiring.
Weak labour markets, lower global demand and excess capacity contributed to general downward pressures on prices in 2009, with global inflation declining from 4.7 per cent in 2008 to 1.4 per cent in 2009. In the outlook, inflationary pressures are expected
1 IMF and World Bank (2010), Global Monitoring Report 2010, Washington D.C.: The World Bank.
2 ILO (2010), Global Employment Trends, January 2010. Geneva: International Labour Office
Figure 1Number of countries with declining GDP per capita, 2009-2011a
33
7
1
10
0 0
54
107
0
20
40
60
2009 2010 2011
Developed countries
Economies in transition
Developing countries
Source: UN/DESA.
a 2009 data are partly estimated, 2010 and 2011 data are forecasts, according to baseline scenario of WESP update per mid 2010.
4 World Economic Situation and Prospects 2010
to remain muted in developed and in many developing economies. Yet, the recent rise in commodity prices may contribute to higher inflation, especially in developing countries with rates of growth close to pre-crisis levels.
The risk of a protracted period of mediocre growth for the world economy remains high in the aftermath of the global financial crisis. This poses new policy chal-lenges. In the near term, policy support remains essential for solidifying and broadening the global recovery. One key area is to strengthen support for boosting employment. A robust recovery in jobs is crucial to a recovery in effective demand, which in turn will help reduce budget deficits. An increasing number of countries have stepped up efforts to stimulate job creation, such as through subsidies to firms that hire new workers and enhanced re-employment programmes for the unemployed. However, more needs to be done to link aggregate demand management and labour market policies so as to ensure a much more job-intensive recovery.
During the financial crisis international policy cooperation among major economies, particularly in the Group of 20, played an important role in restoring confi-dence and averting a much deeper crisis. As the financial crisis ebbs, however, the coopera-tive spirit is fading. Given their diverse pace of recovery and their idiosyncratic challenges, individual countries have different policy priorities: some will be able to unwind stimulus policies earlier, while others may have to consolidate their public debt more urgently. These country-specific policy adjustments, however, require more international coordination to strengthen policy synergies at the global level and to mitigate negative policy spill-overs to the world economy. Meanwhile, the unfinished agenda in reforming national and interna-tional financial systems requires further broad international policy cooperation.
Regional Outlook
Developed economies
The United States economy has extricated itself from the deep recession and resumed growth since the second half of 2009. The slump in the housing sector that started in 2006 has stabilized. Meanwhile, the speed of inventory de-stocking decelerated sharply in late 2009, contributing significantly to quarterly GDP growth. The United States economy is expected to grow by 2.9 per cent in 2010 and slowing to 2.5 per cent in 2011. Private consumption growth is expected to remain subdued at 2.5 per cent in both 2010 and 2011. Payroll employment has decreased by more than eight million from 2007 to 2009 and unemployment will remain over 9 per cent in 2010 and 2011. Persistent high unemploy-ment and the need of households to save more to overcome wealth losses caused by the crisis will continue to restrain private consumption demand in the outlook. The fiscal costs of unemployment insurance and social welfare continue to weigh on the government deficit and compound other fiscal effects of the crisis, including the cost for various bailout measures for financial institutions. As a consequence, the government deficit has soared to $1.4 trillion, or about 10 per cent of GDP. While the cyclical factors driving up the fiscal deficit will weaken as the recovery progresses, maintaining fiscal sustainability over the medium-term poses a key challenge to the Government. Given that a large proportion of public debt is held abroad, pressures may emerge to raise interest rates if the dollar weakens with a resurging external deficit which in turn would make reducing the budget deficit more challenging. Along with the improvement in the financial system, the Federal
5Update as of mid-2010
Reserve has phased out some of its liquidity facilities and stopped purchasing of long-term assets. Policy interest rates are expected to be maintained at a very low level until the end of 2010, but modest increases may be expected in 2011.
Japan’s economy contracted by more than 5 per cent in 2009; its worst perfor-mance since the oil shock in the early 1970s. While a collapse in exports was the major cause of the recession, macroeconomic stimulus measures and a rebound in exports have turned the economy around. Despite a slight decline in the unemployment rate, employ-ment and income conditions remain inauspicious while persistent deflationary pressures continue to form a major obstacle to a more robust recovery. Growth is expected to remain lacklustre throughout 2010-2011, averaging 1.3 per cent over the two-year period. Being highly dependent on exports, the economy remains susceptible to any relapse in the recov-ery of its major trade partners, while high unemployment and low consumer confidence will curb household spending and concerns about public debt may constrain continuation of the fiscal stimulus.
Most of Western Europe exited recession by the third quarter of 2009. Nonetheless, in the Euro area the collapse in activity earlier in the year resulted in a decline in GDP by 4.0 per cent for 2009 as a whole. So far, the rebound has been driven by net exports, the end of inventory de-stocking and substantial fiscal support, through both automatic stabilisers and fiscal stimulus. Going forward, activity is expected to be driven by net exports with domestic demand, particularly investment, starting to contribute more in 2011. Nonetheless, domestic demand growth will remain subdued being held back by con-tinuing balance sheet adjustments and tight financing conditions. Investment may pick up with increasing foreign orders but no sooner than after capacity utilization has sufficiently rebounded from its record lows of mid-2009. Consumption expenditure is constrained by high rates of unemployment and meagre wage growth. As a result, overall output growth in the Euro area is forecast to remain subdued at 0.9 per cent in 2010 and 1.5 per cent in 2011. With such a meagre rebound in activity, unemployment is expected to remain elevated through 2011, though without significantly increasing from current levels.
Fiscal positions have moved sharply into deficit since the onset of the recession. Macroeconomic policy in most European countries is expected to shift from stimulus to consolidation in 2011, but the fiscal crisis in Greece is forcing immediate fiscal consolida-tion in those countries with perceived unsustainable budget positions. In Greece, with an estimated deficit of 13.6 per cent of GDP in 2009 and a public debt of 115 per cent of GDP, the government became caught in a solvency crisis requiring external assistance from the IMF in concert with the European Union, but not before causing contagion effects in other countries. Heightened scrutiny by financial markets and downgrades by ratings agencies have led to a sharp rise in sovereign bond spreads for Portugal, Ireland, and Spain, which have already strongly tightened fiscal policy.
In most of the new EU member states economic activity stabilized in the last quarter of the 2009. However, the overall decline in output was dramatic, especially in the Baltic States, which suffered double-digit contractions of GDP. With the possible excep-tion of these countries, positive output growth is expected in most of the EU member states in 2010. However, the recovery will be anaemic with GDP growth reaching 1.7 per cent in 2010, compared to a 3.5 per cent contraction in 2009. While several of the new EU countries have registered noticeable rebounds in industrial production in the first months of 2010, growth is also being constrained by low private spending and the reluctance of businesses to invest and banks to lend. Thus, an export-led recovery is the only realistic option, particularly as focus on fiscal consolidation will restrict stimulus
6 World Economic Situation and Prospects 2010
options. However, monetary policies will remain accommodative as inflationary pressures are subdued. Meanwhile, unemployment has reached alarming levels in the Baltic States and continues to rise among the new EU member, especially for the low skill-workers. Although the worst of the increase may be over, it will take years of economic expan-sion for labour markets to recover. Moreover, the risk of a double-dip recession caused by, for instance, a premature withdrawal of monetary stimulus or too zealous efforts to achieve fiscal consolidation can still not be discounted. Growth is expected to strengthen to 3.2 per cent in 2011, assuming export demand and bank lending to the real sector will continue to pick up.
Economies in transition
Growth performance of the CIS was dismal in 2009, highlighting the region’s reliance on external demand and external capital. With the global economy gradually recovering, and commodity prices, in particular for oil and metals, rebounding further from 2009 levels, the CIS is expected to grow by 4.2 per cent in 2010, compared to a 6.9 per cent contraction in 2009. However, growth in 2010 will be restrained by weak foreign direct investment and subdued export demand. Low-income countries of the CIS will also con-tinue to be affected by lower workers’ remittances. The combination of ample idle capacity, tight external financing and continued weak external demand is expected to result in a largely jobless recovery. Consequently, domestic demand will remain weak and banks will continue to restrain credit, despite the attempts of the authorities to boost liquidity and stimulate aggregate demand through accommodative monetary policy. Countries will ben-efit from anti-crisis measures. However, these are gradually being withdrawn and growth is expected to weaken in 2011. While resource-rich countries are benefiting from higher oil prices, resource-poor countries, like Belarus, Armenia, Kyrgyzstan and Ukraine, are expected to remain dependent on external support, including stand-by arrangements with the IMF and inflows from the EU. Overall, the potential for social unrest and political turmoil continues to add to the uncertainties surrounding the regional economic outlook, particularly in poorer countries in Central Asia.
Performance was also weak in South-eastern Europe. All countries, except Albania, registered a decline in GDP in 2009 on the back of declining export volumes, lower commodity prices, an abrupt slowdown in credit growth and shrinking remittances. However, most economies stabilized at the beginning of 2010 as the impact of the global downturn on the sub-region was more moderate than initially feared. In part this was due to the prompt delivery of international assistance to Bosnia and Herzegovina and Serbia; it was also a result of the policy stimulus in Albania and in the FYR of Macedonia. Indeed, while the countries of the sub-region avoided collapses of major banks despite their high degree of financial leverage, they were also able to sustain formal or informal currency pegs, and did not resort to massive nationalization of enterprises. Overall, aggregate GDP of South-eastern Europe is expected to expand by 1.1 per cent in 2010 and, subject to favour-able external conditions, by 3 per cent in 2011. However, the recovery will be constrained by weak growth in exports, modest FDI, and the worsening liquidity situation of companies caused by difficulties in collecting receivables and obtaining loans. Rising unemployment and increased taxes will further constrain increases in private consumption. Anti-recession policies are therefore expected to continue in South-eastern Europe in 2010, although the scope for direct public stimulus is generally limited. Governments will thus aim at returning the economies to growth by improving the business environment and improving access of
7Update as of mid-2010
businesses to financing, while low inflation will allow monetary policies to remain accom-modative. On the downside, the current fiscal crisis in Greece may directly affect Albania, the FYR Macedonia and Montenegro through weaker exports and remittances.
Developing economies
A rebound of exports and commodities prices contributed to a higher-than-expected GDP growth in Africa of 2.4 per cent in 2009, as did the fiscal and monetary stimuli, the continued rapid expansion of the telecommunication sector and the ongoing revival of manufacturing and increased investments. Overall, growth is expected to accelerate to 4.7 per cent in 2010 and 5.3 per cent in 2011. Though varying across countries, growth is forecast to remain below pre-crisis levels in the region. In most countries the recovery will be insufficient to achieve meaningful improvements in social conditions. In North Africa, robust domestic demand and a revival in manufacturing is driving the recovery. In Southern Africa, the economy of South Africa gathered momentum, having accelerating sharply at the end of 2009 due to improvements in primary, secondary and tertiary sectors. In 2010, the FIFA World Cup is expected to revitalize tourism and partly compensate for the subdued household consumption expenditure, which is expected to strengthen in 2011. The revival of the extracting industries will also benefit the sub-region. In Central Africa, oil production is expected to decline further. However, higher oil prices will boost fiscal revenues, allowing governments to expand public infrastructure investments. In West Africa, strong agricultural performance has cushioned the impact of the crisis. While services such as telecommunications and construction are expected to perform well, gold mines in Ghana and hydrocarbons in Côte d’Ivoire and Nigeria will also expand. Several East African economies will show some of the strongest performance in the region, under-pinned by robust growth in construction, mining and services. Agriculture is expected to recover from droughts in 2009 and tourism is expected to revive. Structural bottlenecks, such as the poor energy and transport infrastructures, will restrain a further acceleration of growth, however, if not addressed. Other key macroeconomic indicators for Africa offer a mixed picture. Although inflation is easing, the high levels of unemployment and precarious employment remain worrisome. Structural downside risks relate to Africa’s continued dependence on primary commodities and climatic conditions; an unexpected worsening in political and security situations, particularly in countries holding elections in 2010, might dampen growth prospects.
Following the severe downturn in late 2008 and early 2009, East Asia’s econo-mies have rebounded strongly over the past year and the outlook for 2010 and 2011 is favourable as industrial production and exports continue to expand while improved labour market conditions will support household demand. Led by strong growth in China, re-gional GDP is expected to increase by 7.3 per cent in 2010, up from 4.7 per cent in 2009. In 2011, growth is forecast to slow to 6.9 per cent as a further recovery in external demand is expected to only partly offset the gradual withdrawal of monetary and fiscal stimulus measures. The region’s recovery is not only faster than anticipated but also remarkably broad based and well balanced. In most countries, the strong rebound in exports since the second quarter of 2009 has been accompanied by a recovery of business investment. At the same time, household demand remained fairly robust, while public investment and consumption expenditure rose significantly. Growth disparities within the region will narrow markedly in 2010. China will again be the region’s fastest-growing economy in 2010 and 2011 with GDP estimated to rise by 9.2 per cent and 8.8 per cent, respectively.

8 World Economic Situation and Prospects 2010
However, growth is expected to slow somewhat in 2010 mainly owing to slower credit expansion. The strong economic rebound, along with several direct and indirect govern-ment measures to support and generate employment, has led to a sustained labour market recovery. In some East Asian countries unemployment rates are now close to—or even below—pre-crisis levels, with further improvements expected in 2010. Consumer price inflation has picked up somewhat since mid-2009 as the region’s economies rebounded and as commodity prices increased. However, in most countries inflation is not expected to accelerate strongly owing to subdued labour-cost pressures, remaining output gaps, some monetary tightening and low import-price inflation, partly as a result of appreciat-ing currencies. Against the backdrop of mild inflation and ongoing risks in the global economy, monetary conditions will continue to support growth, though central banks will gradually become more restrictive in the course of 2010 and 2011.
Economic activity in South Asia has also gained strength since mid-2009, driven by fiscal stimulus measures and a gradual recovery in private sector demand. Growth has picked up in India and Sri Lanka, but economic conditions have remained relatively weak in the Islamic Republic of Iran and Pakistan. GDP growth declined to 5.1 per cent in 2009 from 6.5 per cent in 2008. Overall, South Asia proved more resilient to the global eco-nomic downturn than other developing regions. This reflects a lower degree of integration with global financial markets, less dependence on manufacturing exports, robust domestic demand, countercyclical monetary and fiscal policies and strong inflows of remittances, particularly in Bangladesh, Nepal, Pakistan and Sri Lanka. Average growth is expected to accelerate to 6.5 per cent in 2010 and 6.9 per cent in 2011 as exports continue to recover and domestic conditions improve in most countries. The recovery is led by India, where growth accelerated to 7 per cent in the second half of 2009 due to a rapid expansion in manufacturing and in services. A recovery of exports and a further strengthening of investment and consumption demand is expected to lift growth in India to 7.9 per cent in 2010 and 8.1 per cent in 2011. Labour markets across South Asia deteriorated in 2009 as regional unemployment rates edged up and the proportion of workers in vulnerable employment conditions increased. These adverse trends are expected to be partly reversed in 2010 and 2011. Although the average rate of inflation is forecast to remain constant in 2010, pressures remain elevated in most countries, especially for food products and utili-ties. The Reserve Bank of India has already shifted its focus from supporting the recovery process to containing price increases.
Following a contraction of 1 per cent in 2009, regional growth in West Asia is forecast to reach 4.2 per cent in 2010, and 4.0 per cent in 2011. Oil-exporting countries continue to benefit from higher oil prices, which will back expansionary fiscal policies and thereby support private consumption. In Saudi Arabia, for example, GDP growth is expected to recover to 3.4 per cent in 2010, up from 0.2 per cent in 2009. Improved global economic conditions are expected to drive the recovery in the non-oil exporting countries of the region. GDP growth is expected to reach 3.5 per cent in Turkey in 2010, compared to a contraction of 4.7 per cent in 2009. Besides base effects, the recovery is supported further by lower interest rates, improved credit conditions and expansionary fiscal policy. Growth rates have also been revised upwards for Lebanon and Israel. Non-oil exporters will see further increases in their growth rates in 2011 if external demand continues to recover as projected in the baseline forecast. Slight improvements with respect to employment are expected while fiscal balances will also improve moderately thanks to higher oil prices (in the case of the oil-exporters), improved economic activity and fiscal consolidation measures.
9Update as of mid-2010
Economic activity in Latin America and the Caribbean has also recovered more strongly than previously expected. GDP growth in the region will reach 4.0 per cent in 2010 and 3.9 per cent in 2011, compared to a contraction of 2.1 per cent in 2009. Following the mild recession that several economies experienced in 2009 in South America, activity rebounded strongly in the last quarter of 2009, benefiting from higher commodity prices and increased export demand. The Brazilian economy is expected to grow by 5.8 per cent in 2010 due to robust domestic demand. Despite the recent surge in oil prices, economic recovery in Venezuela (Bolivarian Republic of) will remain sluggish as electricity shortages affect produc-tion (including in the oil sector) and private demand remains subdued. In Mexico, Central America and the Caribbean, economic activity is expected to recover only moderately due to the slow recovery in the demand for the region’s exports from the United States, reduced tourism inflows and still weak private consumption demand. Thus, after contracting signifi-cantly in 2009, the Mexican economy is expected to grow 3.5 per cent in 2010 and will not be back to its pre-crisis size anytime before 2012. Monetary policy stances in most countries of the region are expected to remain unchanged until the second half of 2010, as inflation is expected to remain under control this year. Fiscal constraints will restrict further fiscal stimulus in many countries as budget deficits increased significantly in 2009. However, with continued high unemployment and increasing vulnerable employment levels, the economic recovery needs to gain more impetus. To achieve this, further fiscal stimulus will be crucial in several countries, in particular those in Central America and the Caribbean.
The international economic environment for developing countries
The international economic environment for developing countries generally has started to improve. Capital inflows are returning, external financing costs are declining, commodity prices are rebounding, and trade flows are recovering. These factors are not equally benefi-cial to all developing countries, however. While some developing countries are benefiting from higher commodity prices, others are seeing their terms of trade deteriorate and their trade deficits widen. Similarly, quite a few are expected to continue to face more restricted access to capital inflows, while the level of official development assistance (ODA) remains short of the commitments made as part of the global partnership for development.
Commodity prices
Sharp declines were observed in commodity prices in 2009 as price indices of agricultural raw materials, minerals, ores, metals and of staples declined by more than 20 per cent due to weak global demand; oil prices dropped by more than 35 per cent. These trends have however been reversed since the second half of 2009. Although prices will remain well below their peaks observed in mid-2008, the increase will benefit net exporters of these products. Prices of minerals, ores and metals are expected to increase by more than 40 per cent as robust growth in China in particular is keeping up global demand for these commodities.
The price of Brent crude oil is expected to average $72 per barrel in 2010; 16 per cent increase higher than the average for 2009. Demand for oil is expected to grow by 1.5 per cent in 2010, mainly due to the measured increase in demand from major develop-ing countries, including China and India. Food prices, in contrast, are forecast to decline by 3.4 per cent, on average, in 2010.
10 World Economic Situation and Prospects 2010
Trade flows and terms of trade
World trade continues to pick up gradually owing to the rebound of export production in East Asia and other developing regions. However, the recovery remains constrained by weak aggregate demand and somewhat elevated trade finance costs. In the first two months of 2010, the world trade volume was 13 per cent higher than a year ago, but still 9 per cent below the corresponding level in 2008. World trade is expected to grow by 7.6 per cent in 2010, having declined by 13.1 per cent in 2009. This gradual upward trend is forecast to continue in 2011, with trade volumes expanding by 5.9 per cent (see table 1).
Trade in developed economies, particularly in Europe, remains subdued owing to a sluggish recovery of final demand. Japan’s exports have rebounded strongly after the country experienced the biggest decline in the aftermath of the Lehman Brothers’ collapse. Driven by strong demand from East Asia, year-on-year export growth in Japan accelerated to about 36 per cent in the first two months of 2010 while the United States and Europe experienced increases of 15 per cent and 7 per cent, respectively. However, these improve-ments partly reflect the low bases of early 2009; trade volumes in all developed regions are still far below pre-crisis levels.
In East Asia, in contrast, trade volumes are now almost back at pre-crisis levels. Intra-Asian trade strengthened with the strong recovery of industrial production in re-gional value chains and related demand for intermediate goods, supported by large stimu-lus packages. The impact of China’s massive development projects in infrastructure and construction will boost export revenues in mineral- and oil-exporting countries in Africa, South America and Western Asia. For instance, Peru’s total export revenues increased by a factor of 2.4 year-on-year in the fourth quarter of 2009, with exports to China more than quadrupling during this period. Meanwhile, energy-importing low-income countries have seen their terms of trade decline in the course of 2009, offsetting earlier gains. Moreover, they are expected to face a renewed surge in their trade deficits as import spending is likely to grow faster than export earnings in 2010 and 2011.
International finance
After a precipitous decline in late 2008 and early 2009, net private capital inflows to emerging market economies have rebounded. The net private inflows to these economies in 2009, totalling some $500 billion, remain well below pre-crisis levels of 2007, however, when they peaked at $1.2 trillion. While foreign direct investment inflows declined by about 30 per cent in 2009, portfolio investment rebounded markedly, turning from net outflows in 2008 to inflows of some $100 billion. Foreign commercial banks also regis-tered net outflows in 2009. In the outlook for 2010, total net capital inflows to this group of countries are expected to recover by about 30 per cent, to above $700 billion, but their growth will moderate considerably in 2010.
Robust growth in a number of emerging market economies underlies resurging private capital inflows. A quick return to pre-crisis levels of capital flows is not likely, however. On the supply side, the still ongoing de-leveraging of many financial institutions in advanced market economies is likely to limit capital flows to developing economies. Demand for foreign capital inflows may also not be very strong given abundant availability of domestic liquidity in many emerging market economies.
Meanwhile, the strong rebound of equity markets in emerging market econo-mies since early 2009 has generated concerns about the emergence of new speculative
11Update as of mid-2010
bubbles. To mitigate the impact of pro-cyclical and speculative private capital movements, several developing countries have responded by adopting capital controls. Lack of progress in internationally coordinated financial regulatory reforms may induce more countries to introduce capital controls.
After a surge during the global financial crisis, external financing costs for developing market economies have retreated to the pre-crisis levels, as measured through the Emerging Markets Bond Index (EMBI).
Official development assistance
Official development assistance (ODA) increased slightly in real terms to reach $119.6 billion in 2009.3 Nonetheless, at 0.31 per cent of donors’ aggregate gross national income (GNI), this share was below historic patterns achieved throughout the 1980s. The level is also still well short of the Gleneagles commitment, according to which the 22 members of the Development Assistance Committee (DAC) would have raised their annual aid flows to about $150 billion (measured in current dollars) in 2010. Current projections of OECD/DAC suggest that aid flows may increase to about $130 billion in 2010, which would be about $20 billion short of the commitments made in 2005 at the G8 Summit held at Gleneagles. The gap in delivering on the commitments to raise ODA for Africa would be about $14 billion.
From the perspective of recipient countries, a shortfall of this magnitude is criti-cal, especially in countries where ODA represents a sizeable part of government receipts. It becomes even more acute when the impact of the global crisis on these economies is con-sidered. A recent study by UN-DESA shows that the recession in 2009 and slow recovery thereafter would put several of Latin America’s lower income countries (Bolivia, Honduras and Nicaragua) substantially further off-track towards the Millennium Development Goals (MDGs) for primary school completion, child and maternal mortality and access to drinking water and sanitation.4 The Governments of Bolivia, Honduras and Nicaragua would need to spend an extra 1.5 to 3.5 per cent of GDP per year on education, health and basic services between 2010 and 2015 to achieve the MDGs, as compared with the pre-crisis scenario. Given immediate domestic financing constraints and still high levels of public indebtedness, the study concludes that without additional ODA support it will be difficult for these countries to meet the MDGs and lay foundations for more robust growth in the future. A similar analysis referring more broadly to a larger range of low-income and resource-poor countries equally concludes that strong aid flows will be needed to support domestic policy efforts towards achievement of the MDGs in these contexts.5
Exchange rates and reserves
The global financial crisis and attendant recession has seen large swings in the major ex-change rates as the competing forces of risk and expected relative returns ebbed and flowed. The value of the United States dollar against the euro has fluctuated within a narrower band since 2008, but volatility remains high. Most recently, the dollar strengthened again
3 According to data from OECD/DAC.
4 See Rob Vos and Marco V. Sánchez (2009) ‘Impact of the global crisis on the achievement of the MDGs in Latin America’, DESA Working Paper Series, No. 74 (updated version), available at http://www.un.org/en/development/desa/papers/2009/index.shtml.
5 See IMF and World Bank (2010), Global Monitoring Report, op. cit., pp. 109-111.

12 World Economic Situation and Prospects 2010
due to a weaker euro caused by the Greek and other looming debt crises. The situation has also exposed institutional weaknesses of the European monetary union, for lacking a lender-of-last-resort mechanism. The existence of such a mechanism would have allowed a swifter response to the Greek debt crisis.
Volatility in the dollar-yen exchange rate also has been less pronounced since 2008, despite the weak economic prospects for Japan. An explanation can be found in the major importance of the yen in the carry-trade currency market, which has helped keep up the value of the yen.
Holdings of foreign exchange reserves worldwide have continued to increase. During 2009, they increased by about $1 trillion to a total of $7.7 trillion. Developing countries and the economies in transition account for almost all of the increase. China alone, holds one-third of all global reserves, totalling $2.4 trillion, yet the countries with the largest percentage increase in reserves were in Latin America, and included Mexico and Brazil, for example. The Russian Federation also increased its reserves by $38 billion over the year, despite the heavy use of reserves in the beginning of 2009 when a crisis of the rouble had to be averted.
A main source for the accumulation of reserves in developing countries and the economies in transition has been the recovery in capital flows to these economies. Several countries have been using the additional reserves to intervene in currency markets to offset pressures towards exchange rate appreciation. The substantial increase in reserves further may have been motivated by lessons learnt in the financial crises of the past decade, in which countries with large amounts of foreign exchange reserves seemed to be in a better position for weathering the external shocks. However, this form of self-insurance comes at a significant cost for developing countries as the trillions of dollars held as reserves and invested to finance deficits in major developed countries could otherwise be used for the development of their own economies. It also seems paradoxical that individual countries continue to accumulate reserves for self insurance despite the substantial expansion of the resources of the International Monetary Fund to meet financing needs of member states in the occurrence of external shocks. Indeed, it highlights the importance of moving forward with reforms of the global reserve system.
Uncertainties and risksAlthough the global economy is slowly recovering from the deep recession, a number of uncertainties and risks cloud the outlook, in particular those associated with rising public sector indebtedness in major economies and resurging global imbalances under the present path of global recovery.
Rising public deficits and debts
A large number of countries responded to the economic and financial crisis with fiscal stimulus packages to support aggregate demand. While these packages were critical for stabilizing individual economies in 2009, their contribution to the economic recovery has been uneven. This can be explained in part by the large differences in the nature and size of the stimulus packages across countries and in the timing of their implementation. It is difficult to generalize, but broadly it can be said that swifter responses and larger packages
13Update as of mid-2010
(relative to the size of the economy), as was the case for several major developing countries, accelerated recovery.
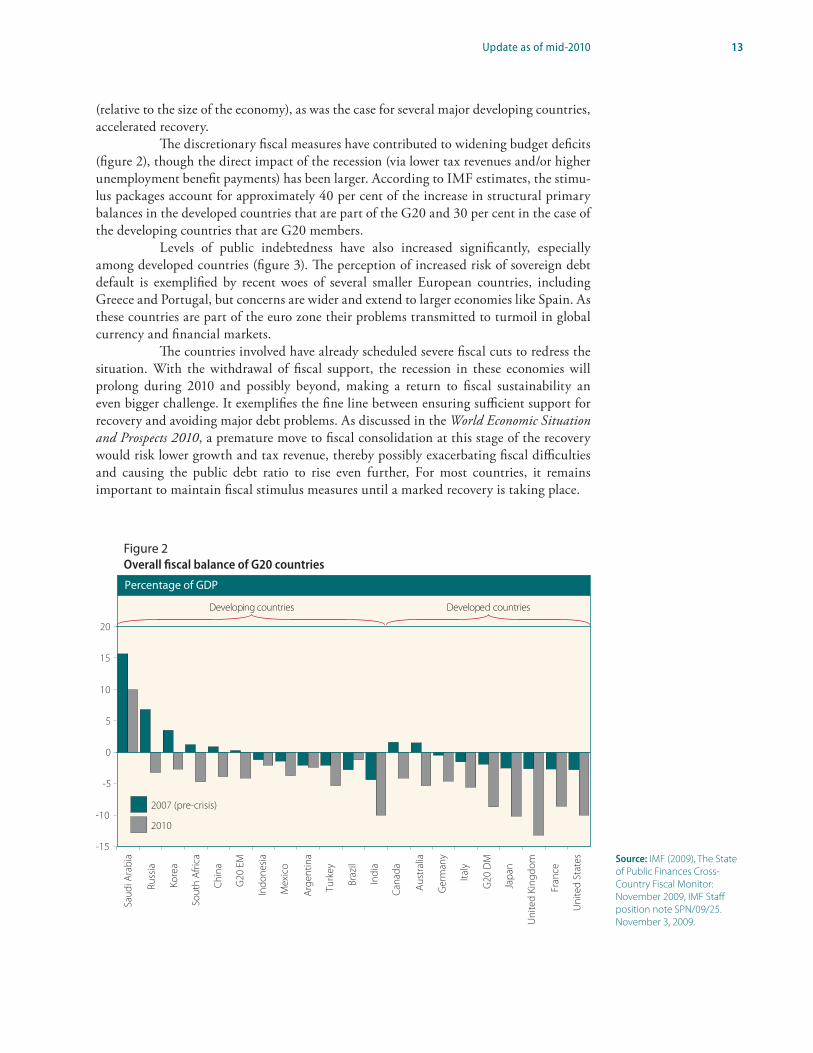
The discretionary fiscal measures have contributed to widening budget deficits (figure 2), though the direct impact of the recession (via lower tax revenues and/or higher unemployment benefit payments) has been larger. According to IMF estimates, the stimu-lus packages account for approximately 40 per cent of the increase in structural primary balances in the developed countries that are part of the G20 and 30 per cent in the case of the developing countries that are G20 members.
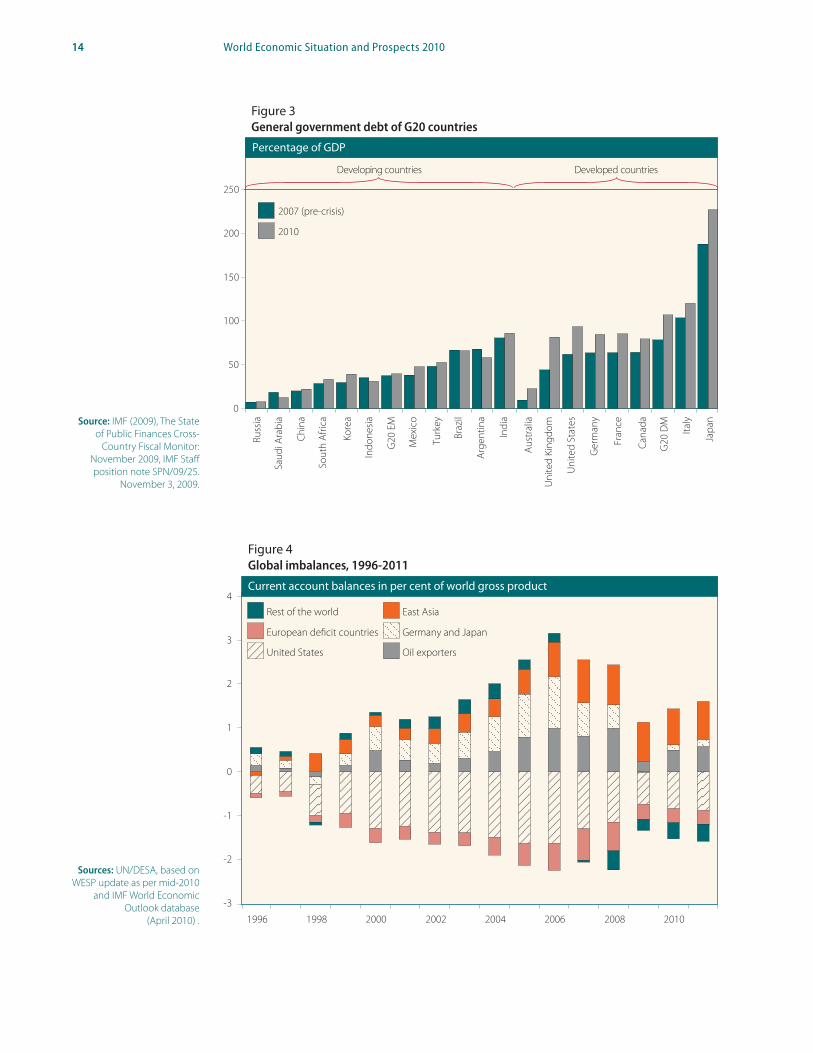
Levels of public indebtedness have also increased significantly, especially among developed countries (figure 3). The perception of increased risk of sovereign debt default is exemplified by recent woes of several smaller European countries, including Greece and Portugal, but concerns are wider and extend to larger economies like Spain. As these countries are part of the euro zone their problems transmitted to turmoil in global currency and financial markets.
The countries involved have already scheduled severe fiscal cuts to redress the situation. With the withdrawal of fiscal support, the recession in these economies will prolong during 2010 and possibly beyond, making a return to fiscal sustainability an even bigger challenge. It exemplifies the fine line between ensuring sufficient support for recovery and avoiding major debt problems. As discussed in the World Economic Situation and Prospects 2010, a premature move to fiscal consolidation at this stage of the recovery would risk lower growth and tax revenue, thereby possibly exacerbating fiscal difficulties and causing the public debt ratio to rise even further, For most countries, it remains important to maintain fiscal stimulus measures until a marked recovery is taking place.
Figure 2Overall fiscal balance of G20 countries
-15
-10
-5
0
5
10
15
20
Developing countries Developed countries
Saud
i Ara
bia
Russ
ia
Kore
a
Sout
h Af
rica
Chin
a
G20
EM
Indo
nesia
Mex
ico
Arge
ntin
a
Turk
ey
Braz
il
Indi
a
Cana
da
Aust
ralia
Ger
man
y
Italy
G20
DM
Japa
n
Uni
ted
King
dom
Fran
ce
Uni
ted
Stat
es
2007 (pre-crisis)
2010
Percentage of GDP
Source: IMF (2009), The State of Public Finances Cross-Country Fiscal Monitor: November 2009, IMF Staff position note SPN/09/25. November 3, 2009.
14 World Economic Situation and Prospects 2010
Figure 3General government debt of G20 countries
Developing countries Developed countries
2007 (pre-crisis)
2010
Percentage of GDP
0
50
100
150
200
250
Russ
ia
Saud
i Ara
bia
Chin
a
Sout
h Af
rica
Kore
a
Indo
nesia
G20
EM
Mex
ico
Turk
ey
Braz
il
Arge
ntin
a
Indi
a
Aust
ralia
Uni
ted
King
dom
Uni
ted
Stat
es
Ger
man
y
Fran
ce
Cana
da
G20
DM
Italy
Japa
n
Figure 4Global imbalances, 1996-2011
Rest of the world
European de�cit countries
United States
East Asia
Germany and Japan
Oil exporters
Current account balances in per cent of world gross product
-3
-2
-1
0
1
2
3
4
1996 1998 2000 2002 2004 2006 2008 2010
Sources: UN/DESA, based on WESP update as per mid-2010
and IMF World Economic Outlook database
(April 2010) .
Source: IMF (2009), The State of Public Finances Cross-
Country Fiscal Monitor: November 2009, IMF Staff position note SPN/09/25.
November 3, 2009.

15Update as of mid-2010
Global imbalances
As the crisis unfolded, the global imbalances narrowed markedly in 2009 (see figure 4). The large external deficit of the United States declined from $700 billion of 2008 to about $420 billion in 2009, approximately 3 per cent of its GDP. This was mirrored by smaller savings surpluses in China, Germany, Japan and a group of oil-exporting countries. This adjustment was a pure effect of the recession with the sharp retrenchment in imports of deficit countries and the collapse in exports of surplus countries, especially in early 2009. In the United States, declining import demand was closely linked to lower household con-sumption and a precipitous fall in both residential and business investment. The household savings rate increased from 1.7 per cent in 2007 to 4.2 per cent of disposable household income in 2009.6 Government savings, in contrast, declined along with the widening of the budget deficit which surged from 1.2 per cent of GDP in 2007 to 9.9 per cent in 2009. Adjustments in savings and investment balances of major surplus economies vary across countries, but falling government savings has been a common trend. Among the surplus countries that entered into recession, like Germany and Japan, falling tax revenue and higher fiscal spending as part of stimulus measures are key factors behind the decline in their aggregate savings surpluses. The decline in investment demand in Germany and Japan only partly offset this trend. In China, in contrast, fiscal stimulus and a strong increase in investment demand are main factors behind the reduction in its savings surplus in 2009. Consumption demand in China also increased markedly, but compared with other major economies total consumption relative to GDP still remains extremely low.
In the outlook, however, the global imbalances could widen with the path of the global recovery that has been set in. The large budget deficit of the United States is expected to remain high for some time and is likely to decrease only gradually as a share of GDP. At the same time, the private sector in the United States is not expected to gener-ate large enough savings surpluses to finance the government deficits, implying that the economy will to continue to rely on foreign borrowing. As the recovery proceeds, business confidence improves and output gaps are closed, private investment demand is likely will to pick up ahead of growth in private savings. Consequently, even with a gradual rebalancing from public to private demand during the recovery, the United States external deficit may increase further in the medium term. In Europe, the recovery may show a similar pattern of rebalancing, assuming that an ongoing recovery will induce a phasing out of the fiscal stimulus while private consumption and investment demand will pick up again from 2011. Such trends in Europe and the United States would need to be matched by increasing surpluses elsewhere. In major surplus countries, the saving-investment patterns have not been fundamentally changed. All other things being equal, the recovery will sustain the rebound in oil prices and thereby savings surpluses in major oil exporting countries. Most countries in Asia have resumed their export-led growth paths. China is taking policy mea-sures to rebalance growth towards domestic demand, particularly by stimulating household consumption growth, but in such a large economy structurally altering the basic drivers of growth will take a long time. In the short run, China’s external surpluses may still be expected to increase, especially as China’s net investment income on foreign assets is be-coming an increasingly important contributor to the country’s foreign-exchange earnings.
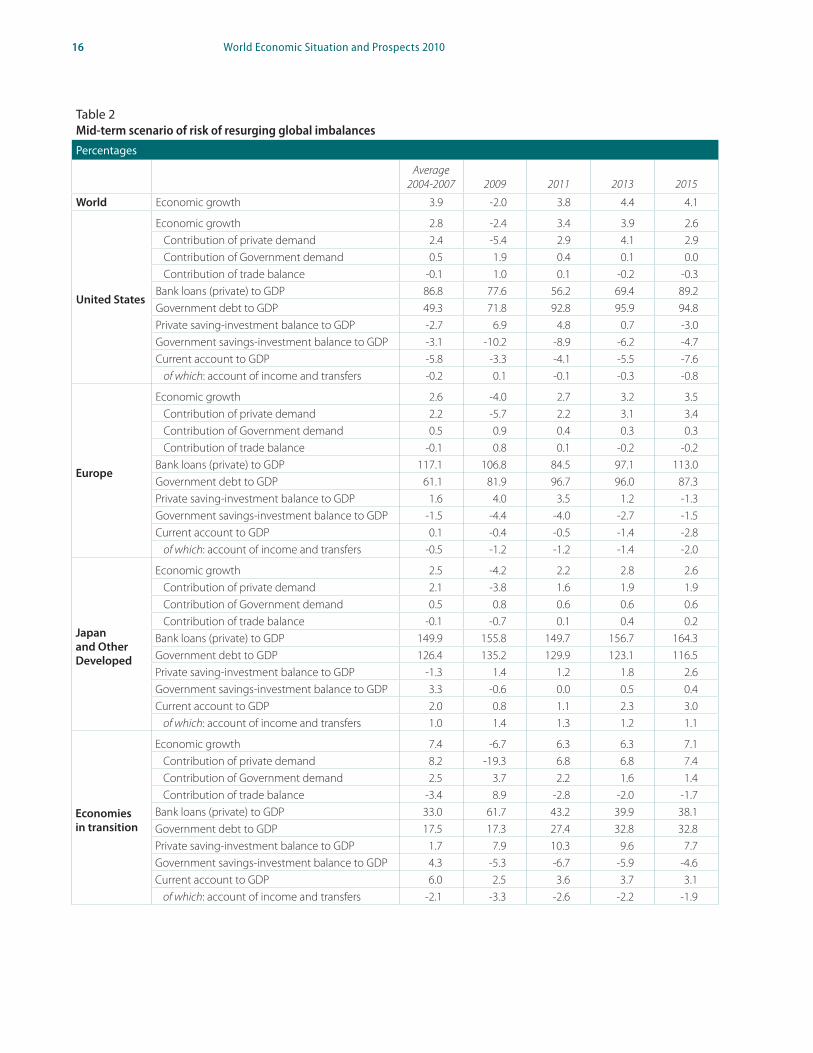
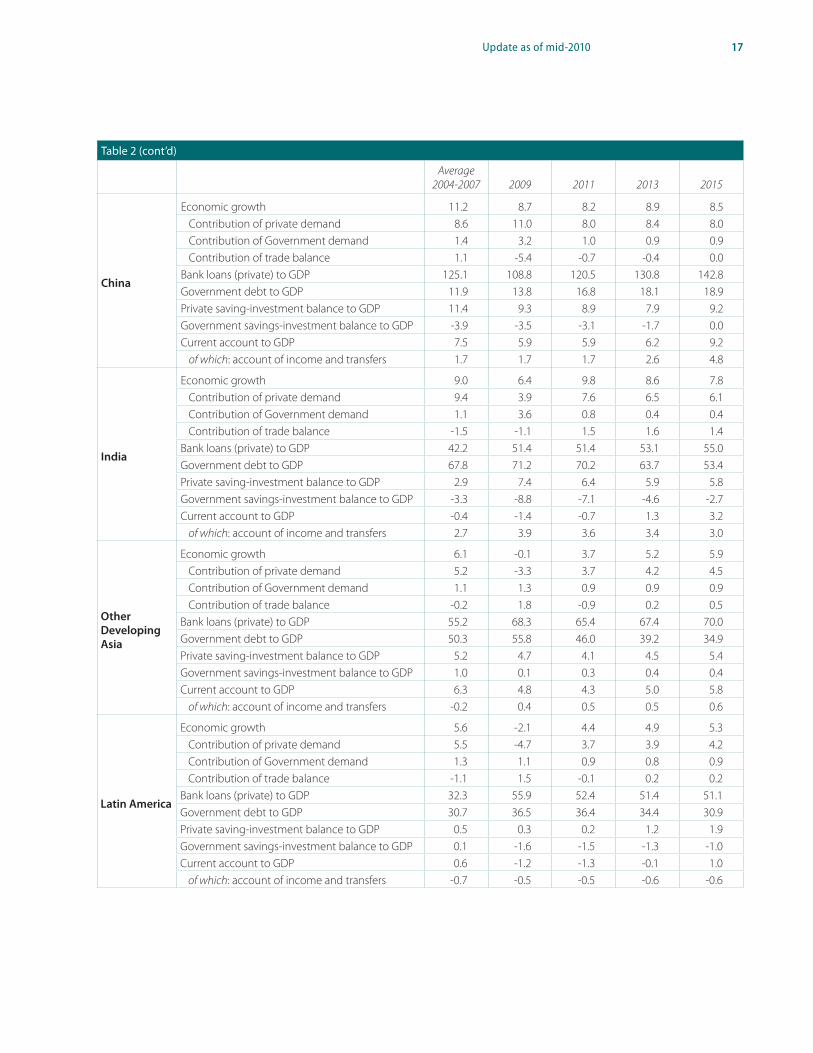
Table 2 presents such a possible pattern of global imbalances under a scenario of a continued slow global recovery for the world as a whole beyond the baseline forecast for
6 As a share of GDP, personal savings in the United States increased from 1.3 to 3.3 per cent between 2007 and 2009.
16 World Economic Situation and Prospects 2010
Table 2 Mid-term scenario of risk of resurging global imbalances
Percentages
Average 2004-2007 2009 2011 2013 2015
World Economic growth 3.9 -2.0 3.8 4.4 4.1
United States
Economic growth 2.8 -2.4 3.4 3.9 2.6Contribution of private demand 2.4 -5.4 2.9 4.1 2.9Contribution of Government demand 0.5 1.9 0.4 0.1 0.0Contribution of trade balance -0.1 1.0 0.1 -0.2 -0.3
Bank loans (private) to GDP 86.8 77.6 56.2 69.4 89.2Government debt to GDP 49.3 71.8 92.8 95.9 94.8Private saving-investment balance to GDP -2.7 6.9 4.8 0.7 -3.0Government savings-investment balance to GDP -3.1 -10.2 -8.9 -6.2 -4.7Current account to GDP -5.8 -3.3 -4.1 -5.5 -7.6
of which: account of income and transfers -0.2 0.1 -0.1 -0.3 -0.8
Europe
Economic growth 2.6 -4.0 2.7 3.2 3.5Contribution of private demand 2.2 -5.7 2.2 3.1 3.4Contribution of Government demand 0.5 0.9 0.4 0.3 0.3Contribution of trade balance -0.1 0.8 0.1 -0.2 -0.2
Bank loans (private) to GDP 117.1 106.8 84.5 97.1 113.0Government debt to GDP 61.1 81.9 96.7 96.0 87.3Private saving-investment balance to GDP 1.6 4.0 3.5 1.2 -1.3Government savings-investment balance to GDP -1.5 -4.4 -4.0 -2.7 -1.5Current account to GDP 0.1 -0.4 -0.5 -1.4 -2.8
of which: account of income and transfers -0.5 -1.2 -1.2 -1.4 -2.0
Japan and Other Developed
Economic growth 2.5 -4.2 2.2 2.8 2.6Contribution of private demand 2.1 -3.8 1.6 1.9 1.9Contribution of Government demand 0.5 0.8 0.6 0.6 0.6Contribution of trade balance -0.1 -0.7 0.1 0.4 0.2
Bank loans (private) to GDP 149.9 155.8 149.7 156.7 164.3Government debt to GDP 126.4 135.2 129.9 123.1 116.5Private saving-investment balance to GDP -1.3 1.4 1.2 1.8 2.6Government savings-investment balance to GDP 3.3 -0.6 0.0 0.5 0.4Current account to GDP 2.0 0.8 1.1 2.3 3.0
of which: account of income and transfers 1.0 1.4 1.3 1.2 1.1
Economies in transition
Economic growth 7.4 -6.7 6.3 6.3 7.1Contribution of private demand 8.2 -19.3 6.8 6.8 7.4Contribution of Government demand 2.5 3.7 2.2 1.6 1.4Contribution of trade balance -3.4 8.9 -2.8 -2.0 -1.7
Bank loans (private) to GDP 33.0 61.7 43.2 39.9 38.1Government debt to GDP 17.5 17.3 27.4 32.8 32.8Private saving-investment balance to GDP 1.7 7.9 10.3 9.6 7.7Government savings-investment balance to GDP 4.3 -5.3 -6.7 -5.9 -4.6Current account to GDP 6.0 2.5 3.6 3.7 3.1
of which: account of income and transfers -2.1 -3.3 -2.6 -2.2 -1.9
17Update as of mid-2010
Table 2 (cont’d)
Average 2004-2007 2009 2011 2013 2015
China
Economic growth 11.2 8.7 8.2 8.9 8.5Contribution of private demand 8.6 11.0 8.0 8.4 8.0Contribution of Government demand 1.4 3.2 1.0 0.9 0.9Contribution of trade balance 1.1 -5.4 -0.7 -0.4 0.0
Bank loans (private) to GDP 125.1 108.8 120.5 130.8 142.8Government debt to GDP 11.9 13.8 16.8 18.1 18.9Private saving-investment balance to GDP 11.4 9.3 8.9 7.9 9.2Government savings-investment balance to GDP -3.9 -3.5 -3.1 -1.7 0.0Current account to GDP 7.5 5.9 5.9 6.2 9.2
of which: account of income and transfers 1.7 1.7 1.7 2.6 4.8
India
Economic growth 9.0 6.4 9.8 8.6 7.8Contribution of private demand 9.4 3.9 7.6 6.5 6.1Contribution of Government demand 1.1 3.6 0.8 0.4 0.4Contribution of trade balance -1.5 -1.1 1.5 1.6 1.4
Bank loans (private) to GDP 42.2 51.4 51.4 53.1 55.0Government debt to GDP 67.8 71.2 70.2 63.7 53.4Private saving-investment balance to GDP 2.9 7.4 6.4 5.9 5.8Government savings-investment balance to GDP -3.3 -8.8 -7.1 -4.6 -2.7Current account to GDP -0.4 -1.4 -0.7 1.3 3.2
of which: account of income and transfers 2.7 3.9 3.6 3.4 3.0
Other Developing Asia
Economic growth 6.1 -0.1 3.7 5.2 5.9Contribution of private demand 5.2 -3.3 3.7 4.2 4.5Contribution of Government demand 1.1 1.3 0.9 0.9 0.9Contribution of trade balance -0.2 1.8 -0.9 0.2 0.5
Bank loans (private) to GDP 55.2 68.3 65.4 67.4 70.0Government debt to GDP 50.3 55.8 46.0 39.2 34.9Private saving-investment balance to GDP 5.2 4.7 4.1 4.5 5.4Government savings-investment balance to GDP 1.0 0.1 0.3 0.4 0.4Current account to GDP 6.3 4.8 4.3 5.0 5.8
of which: account of income and transfers -0.2 0.4 0.5 0.5 0.6
Latin America
Economic growth 5.6 -2.1 4.4 4.9 5.3Contribution of private demand 5.5 -4.7 3.7 3.9 4.2Contribution of Government demand 1.3 1.1 0.9 0.8 0.9Contribution of trade balance -1.1 1.5 -0.1 0.2 0.2
Bank loans (private) to GDP 32.3 55.9 52.4 51.4 51.1Government debt to GDP 30.7 36.5 36.4 34.4 30.9Private saving-investment balance to GDP 0.5 0.3 0.2 1.2 1.9Government savings-investment balance to GDP 0.1 -1.6 -1.5 -1.3 -1.0Current account to GDP 0.6 -1.2 -1.3 -0.1 1.0
of which: account of income and transfers -0.7 -0.5 -0.5 -0.6 -0.6
18 World Economic Situation and Prospects 2010
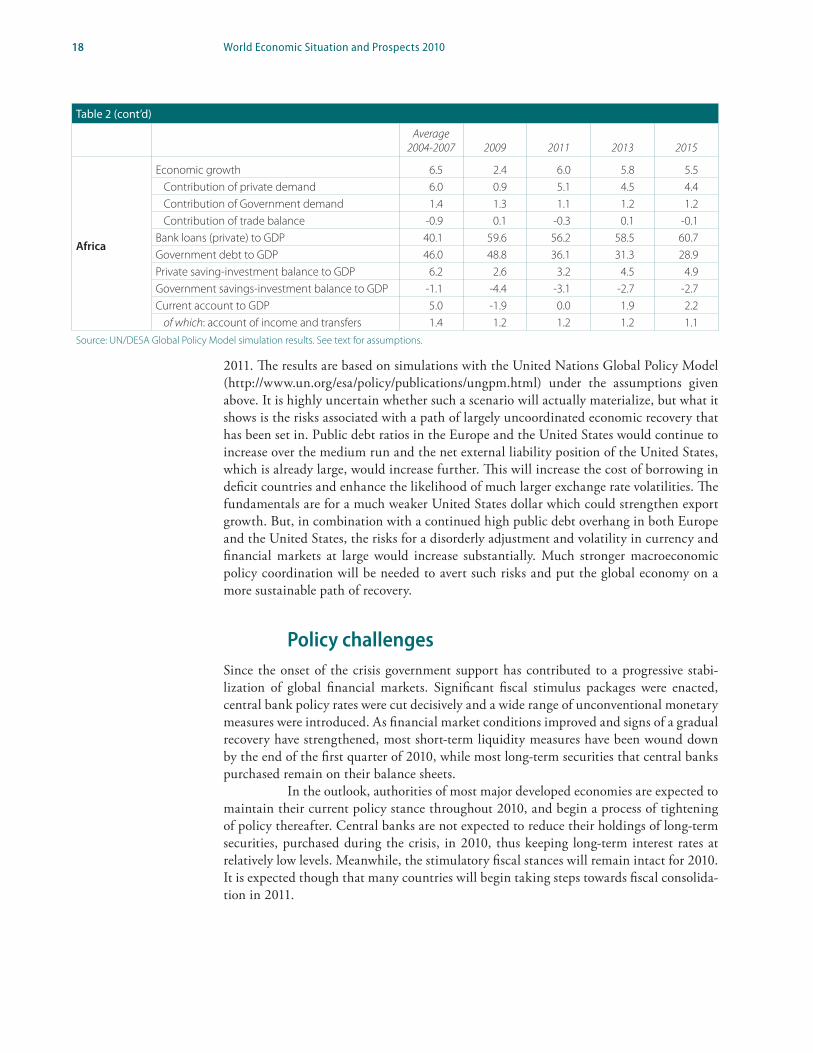
2011. The results are based on simulations with the United Nations Global Policy Model (http://www.un.org/esa/policy/publications/ungpm.html) under the assumptions given above. It is highly uncertain whether such a scenario will actually materialize, but what it shows is the risks associated with a path of largely uncoordinated economic recovery that has been set in. Public debt ratios in the Europe and the United States would continue to increase over the medium run and the net external liability position of the United States, which is already large, would increase further. This will increase the cost of borrowing in deficit countries and enhance the likelihood of much larger exchange rate volatilities. The fundamentals are for a much weaker United States dollar which could strengthen export growth. But, in combination with a continued high public debt overhang in both Europe and the United States, the risks for a disorderly adjustment and volatility in currency and financial markets at large would increase substantially. Much stronger macroeconomic policy coordination will be needed to avert such risks and put the global economy on a more sustainable path of recovery.
Policy challengesSince the onset of the crisis government support has contributed to a progressive stabi-lization of global financial markets. Significant fiscal stimulus packages were enacted, central bank policy rates were cut decisively and a wide range of unconventional monetary measures were introduced. As financial market conditions improved and signs of a gradual recovery have strengthened, most short-term liquidity measures have been wound down by the end of the first quarter of 2010, while most long-term securities that central banks purchased remain on their balance sheets.
In the outlook, authorities of most major developed economies are expected to maintain their current policy stance throughout 2010, and begin a process of tightening of policy thereafter. Central banks are not expected to reduce their holdings of long-term securities, purchased during the crisis, in 2010, thus keeping long-term interest rates at relatively low levels. Meanwhile, the stimulatory fiscal stances will remain intact for 2010. It is expected though that many countries will begin taking steps towards fiscal consolida-tion in 2011.
Table 2 (cont’d)
Average 2004-2007 2009 2011 2013 2015
Africa
Economic growth 6.5 2.4 6.0 5.8 5.5Contribution of private demand 6.0 0.9 5.1 4.5 4.4Contribution of Government demand 1.4 1.3 1.1 1.2 1.2Contribution of trade balance -0.9 0.1 -0.3 0.1 -0.1
Bank loans (private) to GDP 40.1 59.6 56.2 58.5 60.7Government debt to GDP 46.0 48.8 36.1 31.3 28.9Private saving-investment balance to GDP 6.2 2.6 3.2 4.5 4.9Government savings-investment balance to GDP -1.1 -4.4 -3.1 -2.7 -2.7Current account to GDP 5.0 -1.9 0.0 1.9 2.2
of which: account of income and transfers 1.4 1.2 1.2 1.2 1.1Source: UN/DESA Global Policy Model simulation results. See text for assumptions.

19Update as of mid-2010
The subdued and uneven recovery of the global economy poses additional policy challenges. First, dealing with the jobs crisis is of immediate urgency as persistent high unemployment and underemployment rates are slowing the global recovery itself as well as progress towards poverty reduction in developing countries. Much of the demand recovery still rests on government support. In most countries, these support measures will need to be maintained during 2010 and perhaps into 2011. In order to accelerate recovery in job markets, however, much more of the demand stimulus will need to be focused on providing incentives to productive employment creation. Job growth will also be a key ingredient in redressing the trend towards widening fiscal deficits by stemming the drop in tax revenue and reduce the need for social protection spending. Exit strategies from the extraordinary stimulus measures thus will need to be closely coordinated with labour market policies.
Second, there is a need for more resources and greater efforts to make up for the significant setbacks in progress towards the Millennium Development Goals (MDGs). Low-income countries with limited fiscal space are in need of additional ODA to finance the expansion of social services and programs needed to meet the MDGs and engage in counter-cyclical policies. These increased needs contrast with the still significant short-fall in aid delivery against commitments. Although OECD’s Development Assistance Committee (DAC) expects continued modest growth in total net ODA for 2009 and 2010, the estimated shortfall against the Gleneagles commitments will be $20 billion in 2010. Apart from fulfilling commitments, donor countries should consider mechanisms to de-link aid flows from their business cycles to prevent delivery shortfalls in times of crisis when the need for development aid is most urgent.
More broadly, the global crisis has highlighted the need for very large liquidity buffers to deal with sudden and large capital market shocks. In response to the financial crises of the 1990s, many developing countries have responded by accumulating vast amounts of reserves as a form of self-insurance. But doing so comes at high opportunity costs and, moreover, it has been conducive to the problem of the global imbalances. By better pooling reserves regionally and internationally such costs to individual countries could be reduced and it could also form the basis for more reliable emergency financing and the establishment of an international lender of last resort mechanism. Broadening existing SDR arrangements could be part of such new arrangements and, as argued at greater length in the World Economic Situation and Prospects 2010 (http://www.un.org/esa/policy/wess/wesp.html), form part of a much needed broader reform of the global reserve system.
Third, those efforts will need to be underpinned by strengthened international policy coordination to avoid weakening of the recovery which may result from premature and uncoordinated exit strategies from the macroeconomic stimulus measures and failure to address the spill-over effects from emerging public debt crises in developed countries. Further progress on systemic reforms will also be needed. The lack of a concerted approach and greater policy coordination among members of the European Union to tackle concerns of fiscal sustainability particularly in Greece, and the fallout of the initial indecisiveness on financial markets, highlights the importance, particularly in times of greater uncertainty, of a broad and effective policy coordination among the major economies to prevent the return of global imbalances and to ensure that the recovery is sustainable. In this regard, the G20 Summit at Pittsburgh launched a framework for strong, sustainable and balanced growth, under which the deficit members in the G-20, mainly the United States, pledge to

20 World Economic Situation and Prospects 2010
undertake policies to support private savings and to consolidate their fiscal deficit, while the surplus members agree to strengthen domestic sources of growth, through measures such as reducing financial markets distortions, boosting productivity in service sectors, and improving social safety nets. Although this framework has laid the first step towards a more balanced global growth, more specific and concrete policies need to follow. This is particularly important in the medium term, in which policy makers need to coordinate an ‘exit strategy’ and phase out stimulus measures once unemployment rates have decreased significantly, whilst simultaneously retaining a countercyclical policy framework. In the longer term, countries should ultimately coordinate their macroeconomic policies towards a combination of manageable global imbalances. These policies would require greater net financial transfers to developing countries and should ensure in the outlook that fiscal policy stances remain expansionary in developing countries, but are gradually phased out in developed countries.


For further information,
see http://www.un.org/esa/policy/wess/wesp.html
or contact
Rob Vos Director Development Policy and Analysis Division United Nations Department of Economic and Social Affairs 2 United Nations Plaza, Room DC2-2020 New York, NY 10017, U.S.A.
Tel: +1 212 963.4838 t Fax: +1 212 963.1061 t e-mail: [email protected]