THE WORLD DAIRY SITUATION
45
THE WORLD DAIRY SITUATION Caroline Emond Director General International Dairy Federation ESADA Congress, August 2019 1
Transcript of THE WORLD DAIRY SITUATION
THE WORLD DAIRY SITUATION
Caroline Emond Director General
International Dairy Federation
ESADA Congress, August 2019
1

1. A word about IDF
2. Global drivers
3. Where do we stand in terms of the overall market outlook
4. Global milk production
5. Consumption and import demand
6. Trade
7. State of play on the dairy contribution to sustainable diet
8. Conclusions
Content
2

Established in 1903
More than 40 member countries
75% of world milk produc@on
1,200 experts working in 17 Standing CommiFees and 3 Task Forces Accredited to the FAO, Codex, OIE, UNEP, ECOSOC
WHAT IS THE IDF?
3

IDF’S VISION To help nourish the world with safe and
sustainable dairy.
4

IDF can help Dairy Farmers to improve IDF working areas
• Science-‐based exper@se
• Consensus for the global sector
• World-‐wide voice of dairy to IGOs
IDF ROLE
5

IDF has formal agreements with key standard setting bodies
Create, Revise & Harmonise Standards
6

IDF WORK More in the IDF Annual Report 2017/2018
International Dairy Federation2017/18 ANNUAL REPORT
Global Dairy ExpertiseAdvancing Knowledge • Enhancing Value
hJps://store.fil-‐idf.org/product/idf-‐annual-‐report-‐2017-‐2018/ 7

IDF PublicaTons
8
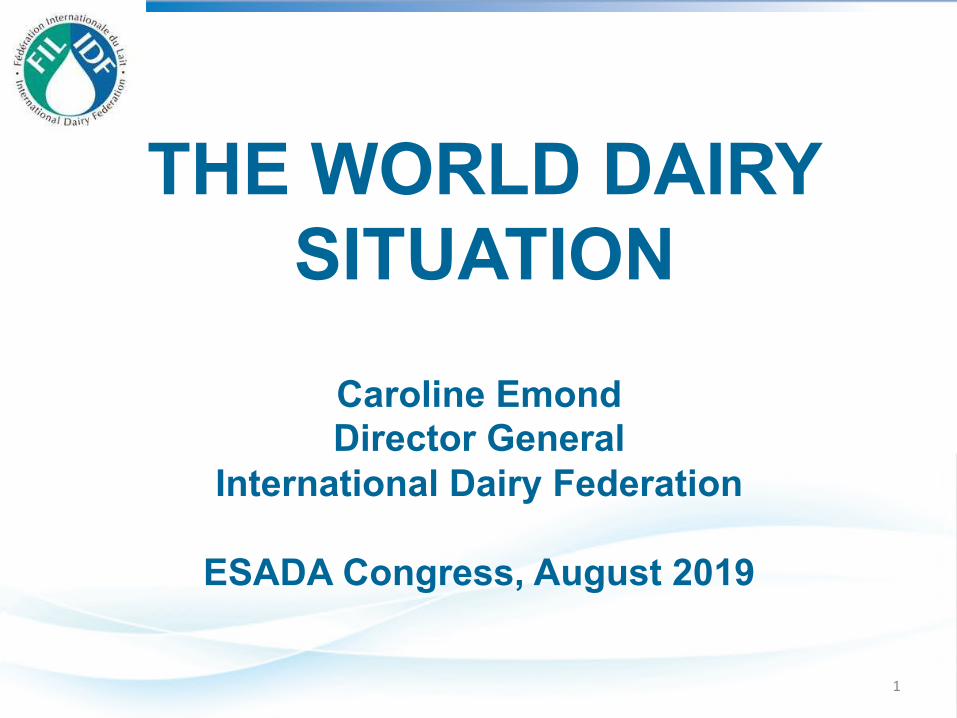
GLOBAL KEYDRIVERS POPULATION GROWTH, CLIMATE CHANGE
By 2050 >9 billion
Projected percentage in agricultural yields by 2050 given current agricultural practices and crop varieties
Source: World Bank (Development Report 2010)
Percentage change in yield between present and 2050
9

GLOBAL KEY DRIVERS DAIRY QUALITY, SUSTAINABILITY
Food Safe ty & Quality
Sustainable farming, processing, distribution
10

GLOBAL KEY DRIVERS PRODUCTIVE AND HEALTHY CATTLE
One Health
Animal Health and Welfare
11

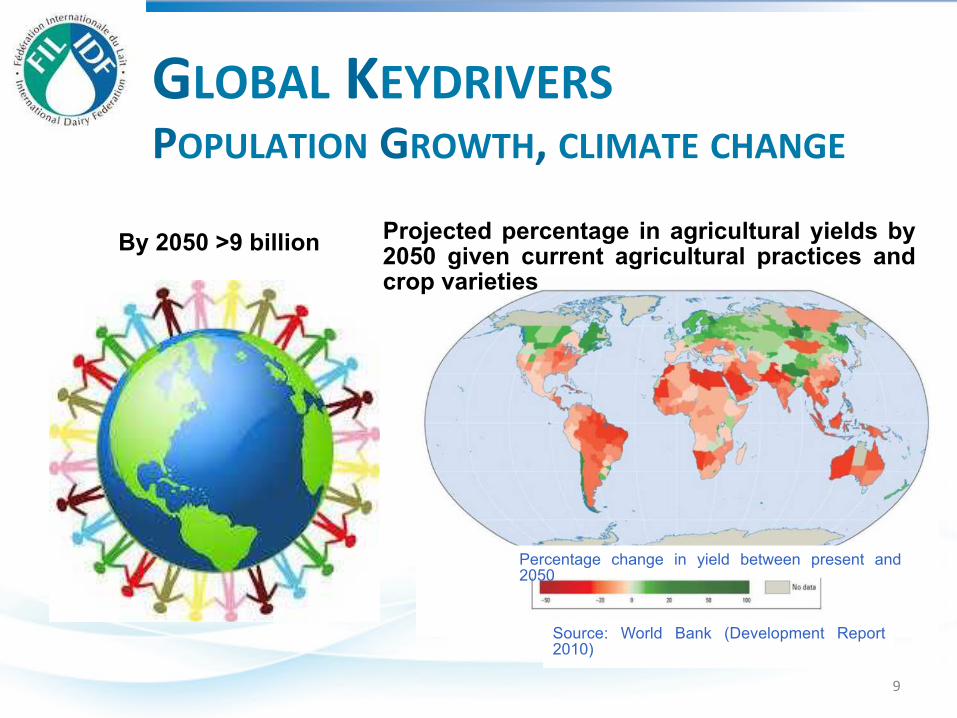
GLOBAL KEY DRIVERS: STRENGTHS …THE DAIRY SECTOR HAS A POWERFUL STORY TO TELL ON ITS CONTRIBUTION TO THE SDGS…
• Well nourished healthy people. • Safe, sustainable, nutri@ous products
– Affordable – Culturally acceptable.
• Healthy planet.
12

Signatories of the Dairy DeclaraTon of RoJerdam 1 ArgenTna 7 Cyprus 13 Ireland 19 Norway 25 Zimbabwe 2 Australia 8 Denmark 14 Israel 20 Poland 26 FEPALE 3 Belgium 9 Finland 15 Italy 21 Republic of Korea 27 ESADA 4 Canada 10 France 16 Lithuania 22 South Africa 5 Chile 11 Germany 17 New Zealand 23 United Kingdom 6 China 12 Japan 18 The Netherlands 24 United States
Dairy DeclaraTon of RoJerdam IDF-‐FAO 2016
13
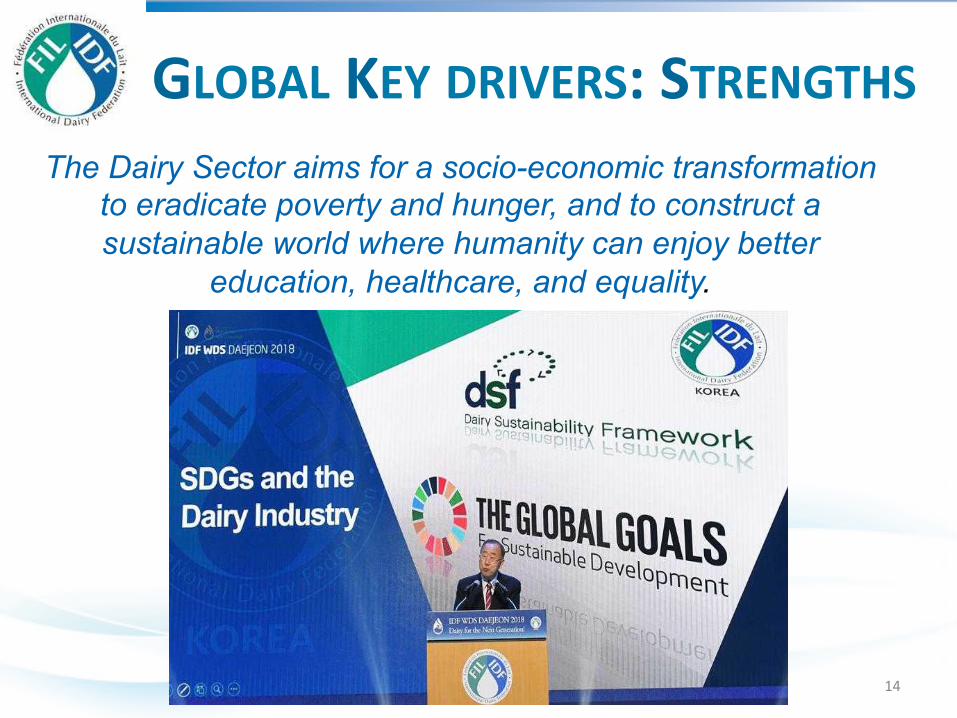
GLOBAL KEY DRIVERS: STRENGTHS The Dairy Sector aims for a socio-economic transformation
to eradicate poverty and hunger, and to construct a sustainable world where humanity can enjoy better
education, healthcare, and equality.
14

Global Dairy Sector Outlook
15

The overall market outlook: prices remain range bound
• Prices mainly remained in the same trading range throughout 2018 and H1 of 2019
• The strongest price dynamics occurred in butter, as the market is still looking for a new equilibrium
• Another interesting feature is the strong price divergence between the US, the EU and Oceania
Dairy commodity prices (2005 – June 2019 (USD/t)
Source: AMI, Dairyntel analysis
16
Global Milk ProducTon
17

Cow and buffalo milk producTon: Top 20 dairy countries in 2017 – with individual EU-‐28 countries
Cow and buffalo milk production and milk delivered 2017. National statistics, AMI, FAO, estimates for some countries. ECM correction: Milk in natural content adjusted to 4.0% fat and 3.3% protein. For more details please see chapter 4.5 AU, IN, NZ annualised milk production.
18

19

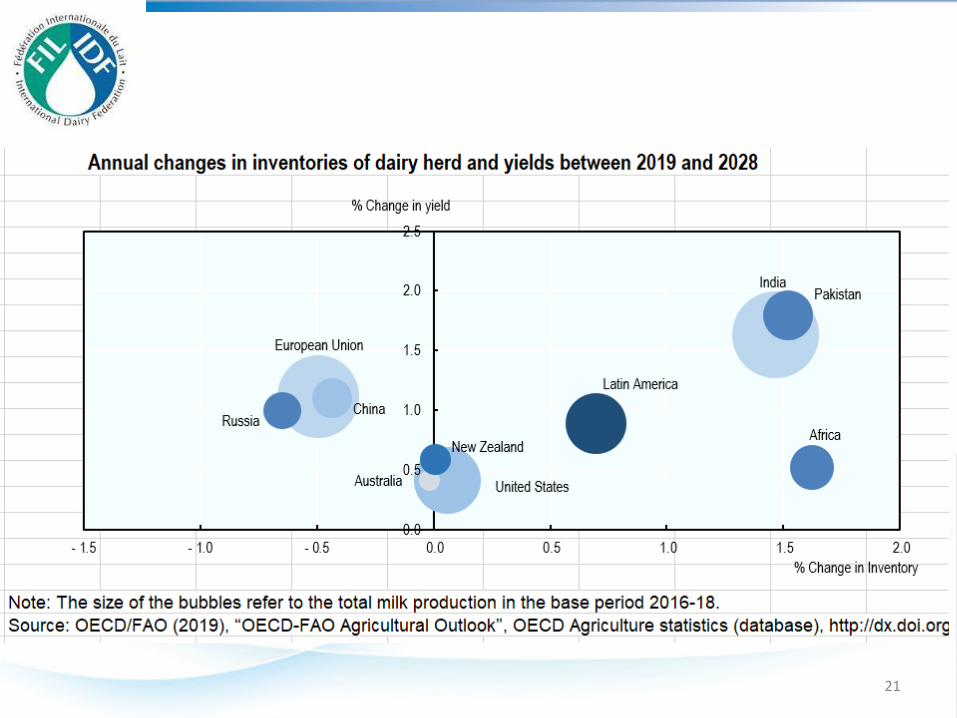
Milk production in exporting regions: struggling to get above 0% growth in first half of 2019
Year-‐on-‐year monthly growth of milk produc@on (2016 – June 2019)
• Global supply growth has been below the historic average for over 12 months now • Milk prices are not strong enough to stimulate output growth in the EU, especially in France,
Germany and the Netherlands • NZ production weakened in the second half of the season, Australia went through a lost season • US production growth is barely above 0% as well due high cow slaughter rates
• Milk prices do not seem high enough to expect strong recovery in the remainder of 2019 20
21

Average milk yield of cows and buffalos for every country 2017
Data: Average milk yield for cows and buffalos. 2017 in t ECM per animal and year Source: IFCN Database. Status of data: 08/18. National statistics, AMI, FAO, IFCN Estimates Calculation: Milk production of cows and buffalos divided by the number of milking animals. Remarks: Saudi Arabia – database is including only specialised dairy farms.
22

National statistics, AMI, FAO, GTT, estimates for some countries. Self-sufficiency in milk = All milk production (cow, buffalo, goat, sheep, camel) divided by national milk demand. The EU-28 data is only considering trade with countries outside the European Union.
Status of self-sufficiency in 2017
23

Source: IDF, FAO, national statistics
Africa: some dairy highlights
[CATEGORY NAME] 51% (20 million tonnes)
Kenya 10%
South Africa 9%
Ethiopia 8% Sudan
7%
Tanzania 6%
Uganda 4%
Mozambique 2%
Madagascar 1%
Zambia 1%
Rwanda 1%
Zimbabwe 0%
Malawi 0%
Mauri@us 0%
ESADA 49% (19 mln tonnes)
2018 ProducTon of cow's milk Importance of ESADA countries in Africa
24

Africa: some dairy highlights
2018: 5,5 % of world cow’s milk production
2018: 25% of world dairy cow’s numbers
Source: IDF, FAO, national statistics
Produc@on of cow's milk (´000 tonnes) 2005 2010 2015 2018 (est.) CAGR Country '05-‐'18 Africa 29 797 34 978 37 850 39 274 + 2,1% Egypt 2 400 2 995 4 486 4 674 + 5,3% Kenya 3 752 3 639 3 444 3 700 -‐ 0,1% Algeria 2 092 2 633 2 932 2 666 + 1,9% South Africa 2 368 2 851 3 273 3 547 + 3,2% Ethiopia 2 139 4 058 3 200 3 134 + 3,0% Sudan 5 480 5 373 2 858 2 865 -‐ 4,9% South Sudan -‐ -‐ 2 616 2 619 Morocco 1 400 1 900 2 450 2 450 + 4,4% Tanzania 1 428 1 699 2 120 2 472 + 4,3% Uganda 1 265 1 377 1 601 1 656 + 2,1% Tunisia 900 1 030 1 376 1 428 + 3,6% Chad 906 980 1 024 1 057 + 1,2% Zimbabwe 105 47 58 81 -‐ 2,0% Other 5 562 6 396 6 412 6 925 + 1,7%
Number of dairy cows (´000 head) 2005 2010 2015 2018 (est.) CAGR Country '05-‐'18 Africa 51 965 63 030 70 149 71 386 + 2,5% Ethiopia 3 116 10 677 11 326 11 900 + 10,9% Sudan 14 972 14 679 8 708 7 920 -‐ 4,8% South Sudan -‐ -‐ 7 375 7 385 Kenya 4 623 5 002 6 450 7 014 + 3,3% Tanzania 5 500 6 900 6 825 6 753 + 1,6% Egypt 1 700 1 737 4 018 4 262 + 7,3% Uganda 2 950 3 400 3 802 4 083 + 2,5% Morocco 1 400 1 485 1 727 1 763 + 1,8% Algeria 950 915 1 108 1 074 + 0,9% Chad 654 707 739 762 + 1,2% Tunisia 560 610 648 611 + 0,7% South Africa 540 540 630 605 + 0,9% Zimbabwe 48 27 33 39 -‐ 1,5% Other 14 952 16 352 16 760 17 215 + 1,1% 25

World: milk production by species
Global milk produc@on (2005-‐2018)
Source: IDF, FAO, national statistics
CAGR 2010/2018: 2.2%
0 200 400 600 800 1 000
2005
2010
2015
2018 (est)
Cow milk Buffalo milk Other milk
mln tonnes
26

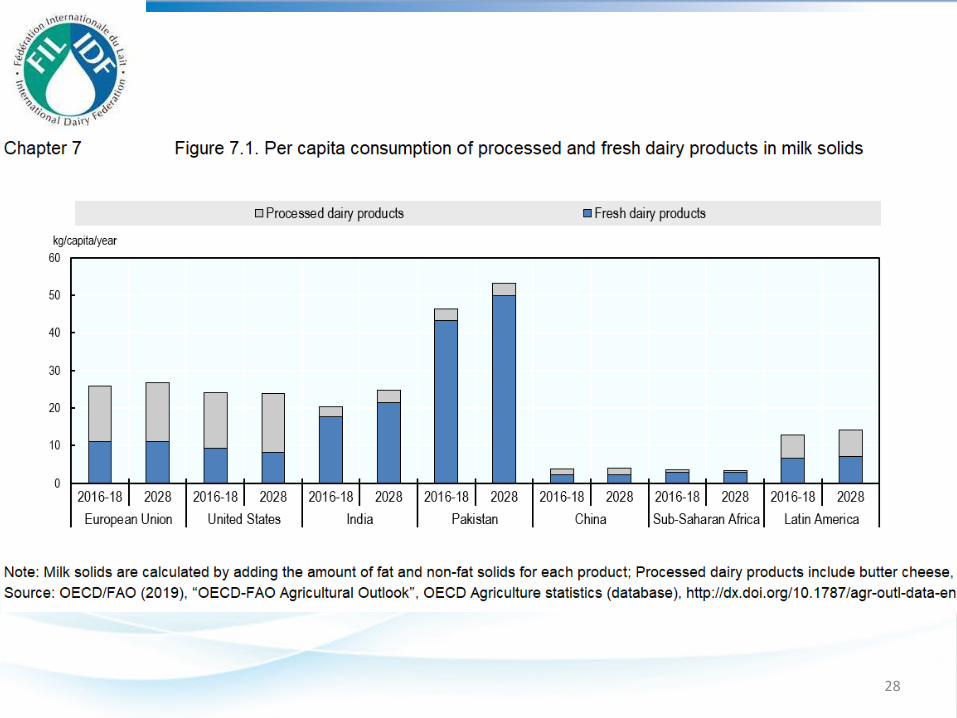
ConsumpTon and import demand
27
28
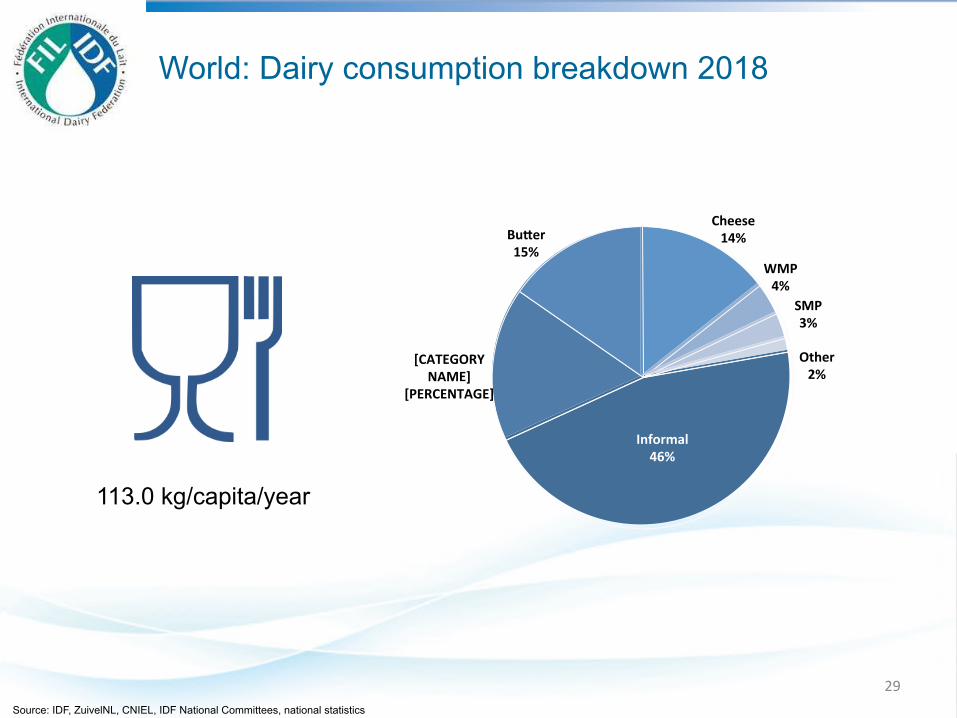
World: Dairy consumption breakdown 2018
Source: IDF, ZuivelNL, CNIEL, IDF National Committees, national statistics
Informal 46%
[CATEGORY NAME]
[PERCENTAGE]
BuJer 15%
Cheese 14%
WMP 4%
SMP 3%
Other 2%
113.0 kg/capita/year
29

Demand per capita in milk equivalent for every country 2017
Data: Demand per capita 2017 in kg ME/capita/year. ME = Milk equivalents, method “fat and protein” only. Source: IFCN Database. Status of data: 08/18. National statistics, AMI, FAO, GTT, IFCN Estimates Calculation: Demand per capita: (Milk production minus exports plus imports minus net stock changes) divided by the population number. Remarks: The calculation for New Zealand is based on a different approach due to the influence of undocumented stocks. The calculation for the EU-28 considers only trade with countries outside the European Union.
30

Annual Growth in demand per capita in milk equivalent per year for every country 2010 - 2017
Data: Demand per capita 2017 and 2010 in kg ME/capita/year. ME= Milk equivalents, method “fat and protein” only. Source: IFCN Database. Status of data: 08/18. National statistics, AMI, FAO, GTT, IFCN Estimates Calculation: Demand per capita: (Milk production minus exports plus imports minus net stock changes) divided by the population number. Compound annual growth rate (CAGR): ((2017 data divided by 2010 data) ^ (1 divided by 7)) minus 1 Remarks: The calculation for New Zealand is based on a different approach due to the influence of undocumented stocks. The calculation for the EU-28 considers only trade with countries outside the European Union. Due to data challenges in Sudan data lack in quality. Decrease of per capita demand particularly in crisis countries like Somalia, Venezuela, Libya, Yemen etc.
31

Trade
32

33

34

Trade: 2017 performance and outlook for 2018
• Overall import performance is “OK” without being spectacular; prices are comfortable, availability is solid despite supply issues and import markets are not affected by major wars or economic shocks
• Trade negotiations between the US and its trading partners may cause shifts in dairy trade flows towards countries like Mexico and China ….
• … but the overall impact on prices and trade volumes may turn out to be a zero sum game
0
1,400
2,800
4,200
5,600
7,000
201
6
201
7
201
8
201
6
201
7
201
8
201
6
201
7
201
8
201
6
201
7
201
8
201
6
201
7
201
8
201
6
201
7
201
8
201
6
201
7
201
8
201
6
201
7
201
8
201
6
201
7
201
8
201
6
201
7
201
8
China (Hong Kong included)
Mexico United States
Algeria Indonesia Philippines Japan Saudi Arabia
Malaysia United Arab Emirates
'000 tonnes
United States Others New Zealand EU-‐28 Australia
Jan – May imports in the 10 biggest dairy impor@ng countries (2016 – 2018: 1,000t of MEQ)
35
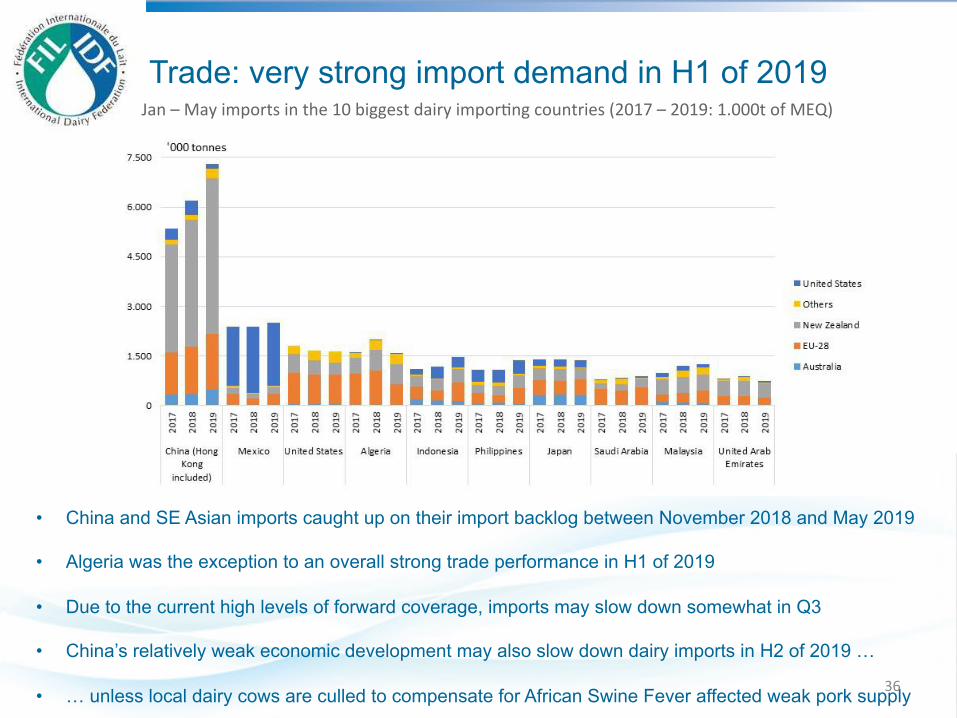
Trade: very strong import demand in H1 of 2019
• China and SE Asian imports caught up on their import backlog between November 2018 and May 2019
• Algeria was the exception to an overall strong trade performance in H1 of 2019
• Due to the current high levels of forward coverage, imports may slow down somewhat in Q3
• China’s relatively weak economic development may also slow down dairy imports in H2 of 2019 …
• … unless local dairy cows are culled to compensate for African Swine Fever affected weak pork supply
Jan – May imports in the 10 biggest dairy impor@ng countries (2017 – 2019: 1.000t of MEQ)
36

Africa: local dairy leaders
Source: IDF
2017 turnover in billion USD
37

CAGR 2010/2018: 3.4%
CAGR 2010/2018: 4.9%
Exports of milk and milk products1) to Africa and ESADA-‐countries (1.000t of MEQ)
1) HS code: 0401-0406
Source: Dairyntel analysis 2019, Comtrade
Africa: some dairy highlights
0
2 500
5 000
7 500
10 000
12 500
2010 2015 2018
Exports to Africa
Exports (x 1 000 tonnes meq)
0
300
600
900
1 200
1 500
2010 2015 2018
Exports to ESADA countries (~11% of total exports to Africa)
Exports (x 1 000 tonnes meq) 38
For more market data
39

Challenges
• Social license to operate: environment, animal health & welfare
• Food policies on sugar, fat and salt: Front of pack labelling, sugar tax, marke@ng ban
• Percep@on that plant based products are more sustainable
40

(FAO, 2010)
Sustainable diets: respect of the 4 dimensions
Environment
Economy Culture
Health & nutriTon
Sustainable Diets
“accessible, economically fair and affordable”
“nutritionally adequate, safe and healthy”
“protective and respectful of biodiversity and ecosystems”
“culturally acceptable”
41/30
Dairy part of a sustainable diet
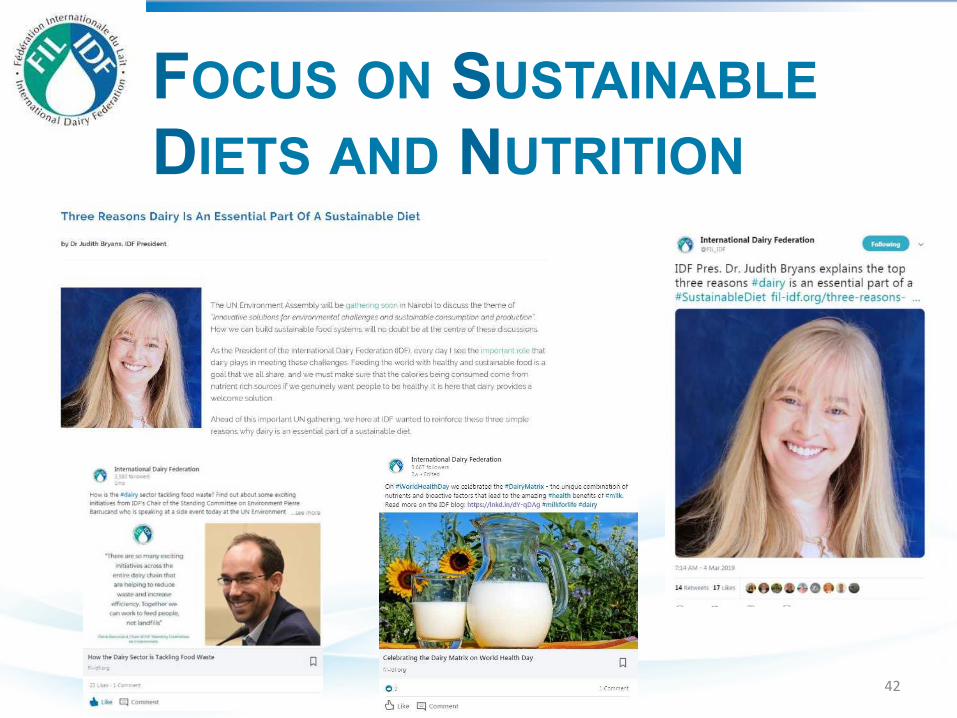
FOCUS ON SUSTAINABLE DIETS AND NUTRITION
42

Conclusions
• We need con@nous improvement so we can nourish the world with safe, nutri@ous and sustainable dairy.
• We need more voices to tell the great dairy story!
• We need more governments to promote the posi@ve contribu@on of dairy during their interven@ons at the UN, WHO, FAO, Codex mee@ngs.
43

2019 – Turkey 2020 – South Africa, Cape Town (Sept. 28-‐Oct.1) Dairy-‐ Wholesome and Sustainable 2021 – Chile 2022 – India 2023 – China
Upcoming IDF World Dairy Summits
44