Economic outlook
24
Winter 2015 1 Highlights While stagnation in the Eurozone and rebalancing policies in China will again restrain the global economy in 2015, growth should nonetheless be well supported thanks to a triple boost in the form of improving U.S. demand, a stronger U.S. dollar, and lower oil prices, all of which bode well for emerging economies. Moreover, low inflation will allow central banks in most major economies to assist growth by keeping monetary policy highly accommodative. We expect global GDP growth to accelerate to 3.5% in 2015. The U.S. is on a clear uptrend, buoyed by an invigorated private sector. The labour market has taken off and the resulting increased household income, coupled with cheap gasoline and re-leveraging, should boost consumption further. Exports could soften a bit due to the stronger dollar, although neither this nor a slight tightening of monetary policy by the Fed will prevent U.S. GDP growth from accelerating to 3% in 2015, the best performance in a decade. That, of course, assumes business confidence isn’t sapped by a dysfunctional Congress. The oil price slump prompted a three-tick downward revision to our 2015 GDP growth forecast for Canada to just 2.2%. The curtailment of investment in the oil patch and spending restraint particularly by provinces due to the revenue shortfall will offset the benefits of cheaper energy for consumers and non-energy producers. The housing market could also moderate a bit. So, domestic demand will remain soft for yet another year, leaving trade to once again lead the way, buoyed by a cheaper currency and strengthening U.S. demand. Another year of above potential growth will close the output gap and keep the annual core inflation rate above the Bank of Canada’s target. But given its concerns about the global economy and domestic risks, the central bank will likely delay rate hikes to 2016. Regionally, the impacts of weaker oil prices will vary. For the first time since 2000, Ontario will lead the nation in 2015 with growth of 2.7% buoyed by domestic demand, which should be supported by an overdue rebound in investment spending in light of elevated capacity usage, but also by exports which will get a boost from improving U.S. demand and a more competitive Canadian dollar. Quebec will also accelerate relative to 2014 thanks to better exports, although a less favourable housing market and tighter fiscal policy will cap growth at 1.9% in 2015. British Columbia too, should be able to grow a touch higher than the pace set in the prior year. Alberta, on the other hand, will see a marked deceleration in GDP growth as investment dries up and revenue shortfall from oil royalties prompt spending cuts by a government intent in controlling the deficit. Contents World Oil stimulus 2 United States Beacon of hope 5 Canada Deceleration in 2015 7 Provincial Economies Ontario 9 Quebec 11 British-Columbia 13 The Prairies 14 Atlantic Provinces 16 Annex 20
-
Upload
national-bank-of-canada -
Category
Documents
-
view
187 -
download
1
Transcript of Economic outlook

Winter 2015
1
Highlights While stagnation in the Eurozone and rebalancing policies in China will
again restrain the global economy in 2015, growth should nonetheless be well supported thanks to a triple boost in the form of improving U.S. demand, a stronger U.S. dollar, and lower oil prices, all of which bode well for emerging economies. Moreover, low inflation will allow central banks in most major economies to assist growth by keeping monetary policy highly accommodative. We expect global GDP growth to accelerate to 3.5% in 2015.
The U.S. is on a clear uptrend, buoyed by an invigorated private sector.
The labour market has taken off and the resulting increased household income, coupled with cheap gasoline and re-leveraging, should boost consumption further. Exports could soften a bit due to the stronger dollar, although neither this nor a slight tightening of monetary policy by the Fed will prevent U.S. GDP growth from accelerating to 3% in 2015, the best performance in a decade. That, of course, assumes business confidence isn’t sapped by a dysfunctional Congress.
The oil price slump prompted a three-tick downward revision to our 2015
GDP growth forecast for Canada to just 2.2%. The curtailment of investment in the oil patch and spending restraint particularly by provinces due to the revenue shortfall will offset the benefits of cheaper energy for consumers and non-energy producers. The housing market could also moderate a bit. So, domestic demand will remain soft for yet another year, leaving trade to once again lead the way, buoyed by a cheaper currency and strengthening U.S. demand. Another year of above potential growth will close the output gap and keep the annual core inflation rate above the Bank of Canada’s target. But given its concerns about the global economy and domestic risks, the central bank will likely delay rate hikes to 2016.
Regionally, the impacts of weaker oil prices will vary. For the first time
since 2000, Ontario will lead the nation in 2015 with growth of 2.7% buoyed by domestic demand, which should be supported by an overdue rebound in investment spending in light of elevated capacity usage, but also by exports which will get a boost from improving U.S. demand and a more competitive Canadian dollar. Quebec will also accelerate relative to 2014 thanks to better exports, although a less favourable housing market and tighter fiscal policy will cap growth at 1.9% in 2015. British Columbia too, should be able to grow a touch higher than the pace set in the prior year. Alberta, on the other hand, will see a marked deceleration in GDP growth as investment dries up and revenue shortfall from oil royalties prompt spending cuts by a government intent in controlling the deficit.
Contents
World
Oil stimulus 2
United States
Beacon of hope 5
Canada
Deceleration in 2015 7
Provincial Economies
Ontario 9
Quebec 11
British-Columbia 13
The Prairies 14
Atlantic Provinces 16
Annex 20

ECONOMIC OUTLOOK
WORLD
2
Oil stimulus The global economy just got a triple boost, courtesy of the U.S. resurgence. The world’s largest economy is set to register in 2015 its best performance this cycle (see U.S. section), and the resulting demand should translate into better exports and hence stronger growth for emerging markets in particular. A strengthening U.S. economy also means tighter Fed policy and hence a further appreciation of the U.S. dollar, which is another positive for emerging markets because it makes those export-driven economies more competitive relative to the U.S.. And last but not least, a stronger U.S. dollar suggests softness for oil prices which are often negatively correlated to the greenback.
While declining oil prices aren’t good for Saudi Arabia and other oil exporting nations with fixed exchange rates, they are nonetheless a boon to the global economy as a whole. Cheaper oil helps in rebalancing the global economy by improving the current account balance of oil importing
countries, which are often in deficit territory, at the expense of big oil exporters which usually enjoy large surpluses. More importantly, lower oil prices are equivalent to a stimulus for the global economy. Even assuming Brent oil prices near $70/barrel on average in 2015, that will be about 30% lower than in 2014. Large importers like India, where oil accounts for more than a third of total imports, will benefit the most. India, which according to the EIA consumes about 3.5 million barrels per day, stands to save US$38 bn/year, or more than 2% of GDP. For the global economy as whole, a 30% drop in oil prices is equivalent to a stimulus of over 1.5% of GDP assuming everything else remains constant.
Further stimulus will come from more familiar sources, namely monetary policy. Slumping oil prices will make an already mild inflation environment even milder, allowing central banks to keep rates low for longer or, even cut them as the People’s Bank of China just did. Despite being constrained by the zero lower bound, the Bank of Japan and European Central Bank already announced that they will still be able to deliver stimulus by increasing the size of their respective balance sheets via asset purchases, and hence injecting more liquidity in the financial system.
That said, there are still risks to the global economy. For instance, the greenback’s ascent is good as long as it doesn’t cause investors to flee emerging market debt instruments, as was the case in the summer of 2013 when then-Chair Ben Bernanke started talking about QE tapering by the Fed. At the time, bond yields in emerging markets soared as foreign investors, wary of holding assets in depreciated currencies, were engaged in a massive sell-off. That even prompted some central banks in emerging economies to raise interest rates to stem outflows of capital. Fortunately, with the exception of Russia, there hasn’t been a similar reaction this time, but
92
94
96
98
100
102
104
106
108
110
112
114
116
2009 2010 2011 2012 2013 2014
Trade-weighted U.S. dollar
0.0
0.1
0.2
0.3
0.4
0.5
0.6
0.7
Europe Japan Emerging
World: Global economy buoyed by U.S. demand, strong USD, …
NBF Economics and Strategy (data via Datastream, CPB)
Correlation of export volumes with U.S. real domestic demand
Exports of several economies should get a boost from
better U.S. demand ... ... and an appreciating U.S. dollar
70
75
80
85
90
95
100
105
110
115
120
2013Q1 2013Q2 2013Q3 2013Q4 2014Q1 2014Q2 2014Q3 2014Q4
0.0
0.5
1.0
1.5
2.0
2.5
3.0
India China World
... and cheaper oil
* Assuming consumption unchanged
NBF Economics and Strategy (data via EIA, IMF)
% of GDP
Brent oil price Savings brought by 30% drop in oil price/barrel*
2014 average fcst
US$/barrel
If oil prices average $70/barrel in 2015, the 30% drop will be equivalent ...
30%
... to a stimulus of over 1.5% of global GDP
4
5
6
7
8
9
10
11
12
13
2007 2008 2009 2010 2011 2012 2013 2014 2015 20160.0
0.4
0.8
1.2
1.6
2.0
2.4
2.8
3.2
3.6
4.0
4.4
4.8
2007 2008 2009 2010 2011 2012 2013 2014
World: Monetary policy to stay highly stimulative
Fed
BoE
BoJ
ECB
Trillion US$ Trillion US$
Central bank balance sheet Big Four central bank balance sheet
*Assuming BoJ increases balance sheet by 80 trillion yen annually, ECB increases balance sheet to 3.5 trillion euros by end-2016, USDJPY reaches 135 and EURUSD reaches 1.10 by end-2016
NBF Economics and Strategy (data via Datastream)
est.* est.*est.

ECONOMIC OUTLOOK
WORLD
3
the evolution of debt capital markets in emerging economies is worth watching closely.
The Eurozone, a major player in global trade, presents another risk for the world economy in 2015. The failure by the zone’s members to implement growth-friendly reforms and policies should continue to cap employment and growth, thereby restraining wages and prices. Markets seem to agree with that outlook based on inflation expectations which are now at record lows.
Once it gets its grip on the economy, deflation can show persistence and bring all sorts of problems. Besides the devastation it causes on consumption via deflationary expectations, deflation can worsen the already shaky government finances in the Eurozone by raising the real value of debt, and restraining nominal GDP and hence tax revenues. To address the threat of deflation, the European Central Bank may follow its purchases of covered bonds and asset backed securities with that of sovereign debt. However, it’s unclear if that extra liquidity will immediately rekindle credit which has been contracting for the last
couple of years for both households and non-financial corporations. If the U.S. experience is any guide, it can take several years to fully repair the transmission channels of monetary policy and bring an end to the deleveraging cycle. In light of the challenges ahead and our general lack of faith in European policymaking, we continue to expect the zone’s GDP growth to be no better than 1% in 2015.
Japan, another economy that will be battling deflation in 2015, is also set for another difficult year despite loose monetary policy by its central bank. But after the December elections gave him a new majority government, Prime Minister Shinzo Abe may press ahead with necessary structural reforms. The cheap currency policy will continue as the Bank of Japan ramps up the printing press, allowing the yen to depreciate against the USD to levels not seen since 2002. The weaker yen will be welcome news for exporters and allow the current account balance, which has been sinking in recent years, to stabilize. Having seen the devastating impacts of the sales tax hike of April 2014, the government is likely to delay the second hike that was scheduled for October 2015 and that, together with lower projections for the yen (i.e. a sharper depreciation than in our previous forecasts), prompts us to raise our 2015 GDP growth forecast for Japan to 1%.
4.1
4.2
4.3
4.4
4.5
4.6
4.7
4.8
4.9
5.0
5.1
5.2
5.3
5.4
5.5
5.6
12Q1 12Q2 12Q3 12Q4 13Q1 13Q2 13Q3 13Q4 14Q1 14Q2 14Q3 14Q4
World: Bonds in emerging economies holding firm for nowEmerging market effective bond yield
NBF Economics and Strategy (data via Bloomberg)
%
avg.
Fed taper talk
USD takes off
0.6
0.8
1.0
1.2
1.4
1.6
1.8
2.0
2.2
2.4
2.6
2.8
3.0
2004 2005 2006 2007 2008 2009 2010 2011 2012 2013 2014
Eurozone: Next stop, deflation? Inflation expectations measured by 5-yr inflation swaps
NBF Economics and Strategy (data via Bloomberg)
%
-6
-5
-4
-3
-2
-1
0
1
2
3
4
2009 2010 2011 2012 2013 2014
Households Businesses
Eurozone: Deleveraging continuesLoans by financial institutions to households and non-financial corporations
NBF Economics and Strategy (data via Datastream)
y/y % chg.
est.

ECONOMIC OUTLOOK
WORLD
4
In China, growth should soften further, although that shouldn’t be surprising as the economy’s rebalancing (towards consumption spending) continues. A moderation in private fixed investment is likely, more so in light of the government’s crackdown on the shadow banking sector. Indeed, loans made outside of banks grew at the slowest pace in three years, and odds are that there will be a further deceleration in 2015. A highly levered real estate sector looks vulnerable to a correction and related defaults could have a significant impact on financial markets. However, should things turn sour on that front, the central government will likely step in to prevent negative spillovers to the rest of the economy. Infrastructure spending associated with the government’s urbanization plan, coupled with the stimulus provided by the oil price slump and the central bank, should allow China to grow a healthy 6.5%. That, together with contributions from other emerging economies, Japan and the U.S., should help global GDP growth accelerate to 3.5% in 2015.
-4
0
4
8
12
16
20
24
28
70
80
90
100
110
120
130
140
150
1994 1996 1998 2000 2002 2004 2006 2008 2010 2012 2014
Japan: Cheap yen should help support external balance in 201512-month cumulative Current account balance and Yen/US$
NBF Economics and Strategy (data via Bloomberg)
Trillion yen
Yen/US$ (R)
Current account (L)
4.0
4.5
5.0
5.5
6.0
6.5
7.0
7.5
8.0
8.5
9.0
9.5
10.0
10.5
2011 2012 2013 2014
China: Cracking down on shadow bankingBank and non-bank new loans, 12- month cumulative
NBF Economics and Strategy (data via Datastream)
Trillion yuan
Non-bank loans
Bank loans

ECONOMIC OUTLOOK
UNITED STATES
5
Beacon of hope After a difficult start to the year, largely due to inclement weather, the U.S. economy rebounded sharply with a string of impressive results, allowing it to grow an estimated 2.4% in 2014 and even topping the prior year’s performance. The reduced fiscal drag helped, but so did an invigorated private sector. The labour market has, accordingly, taken off as evidenced by more than 2.5 million private sector jobs created in 2014, the largest annual gain since 1999. Private sector’s share of total U.S. employment is now almost 84.4%, the highest since 1959.
The resulting household income gains are boosting not just consumer confidence but also actual spending. Discretionary spending has soared in recent months, and we expect consumer momentum to extend to 2015. That forecast is based not only on the labour market which we expect to remain on an uptrend, but also on the massive drop in gasoline prices which leaves more cash to spend on other items. Assuming pump prices do not change from now through 2015, they will be down roughly 20% on a year on year basis. That’s a significant stimulus for American consumers. A low debt burden, as evidenced by a financial obligations ratio near multi-decade lows, should also help rekindle borrowing, providing another layer of support for consumption.
There is evidence that households are already starting to respond to the record low interest rates and low debt burden. Household debt has indeed risen in the last few quarters, even excluding student loans, and the uptrend is likely to continue into 2015. The persistence of low interest rates, the decline in delinquency rates, and the improvement in credit quality, will enhance the ability to borrow and spend. Auto loans, for example, already at an all-time high, should continue to rise as the economy and job prospects improve further and also to finance pent-up demand. There is indeed a need to replace an ageing fleet which is now the oldest on records. For the first time in years many households now have the ability to do so.
But not everything is rosy. Despite sharp employment and productivity gains, wages have stagnated in this recovery. True, there are promising signs that things could improve on that front with an increase in the labour market quits rate to the highest since 2008, which should in principle encourage employers to offer better compensation to retain talent. But in many cases, particularly in the goods
80.8
81.2
81.6
82.0
82.4
82.8
83.2
83.6
84.0
84.4
84.8
60 65 70 75 80 85 90 95 00 05 10-6
-5
-4
-3
-2
-1
0
1
2
3
4
99 00 01 02 03 04 05 06 07 08 09 10 11 12 13 14
U.S.: Best labour market in years
Annual change, millions
Private
Total
* Even assuming non farm payrolls flat in December 2014
NBF Economics and Strategy (data via Datastream)
Non farm payrolls Private sector share of total non farm payrolls
%
2014*
*
-30
-25
-20
-15
-10
-5
0
5
10
15
20
25
30
1995 2000 2005 2010 201515.2
15.4
15.6
15.8
16.0
16.2
16.4
16.6
16.8
17.0
17.2
17.4
17.6
17.8
18.0
82 84 86 88 90 92 94 96 98 00 02 04 06 08 10 12 14
U.S.: Fundamentals good for consumption spending in 2015
y/y % chg.
Sales
* Assuming consumption and price in December 2014 remain flat through 2015
NBF Economics and Strategy (data via EIA)
Gasoline consumption and price Financial obligations as a % of disposable income,4-quarter moving average
%Gasoline price decline will
provide a boost to consumers ...
... and so will the relatively low debt burden
Price
Price drop equivalent to a stimulus for consumers
*
6.8
7.2
7.6
8.0
8.4
8.8
9.2
9.6
10.0
10.4
10.8
11.2
11.6
12.0
12.4
12.8
2004 2006 2008 2010 2012 201468
69
70
71
72
73
74
3
4
5
6
7
8
9
10
2004 2006 2008 2010 2012 2014
U.S.: Households now borrowing again
US$ trillion
NBF Economics and Strategy (data via New York Fed)
%
Household debt
Auto loans (R)
Mortgages (L)
Mortgages, Student debt and Auto loans,share of total loans
Fourth increase inthe last five quarters for household
debt in 2014Q3 suggestsre-leveraging is in full swing ...
%
Excluding student debt
Total
Student debt (R)
... buoyed in part by auto loans

ECONOMIC OUTLOOK
UNITED STATES
6
sector, there is a limit to how much employers can sweeten the deal for workers before contemplating automation. That is not a new phenomenon. Real compensation and productivity have diverged since the mid-1970’s, in part due to the impacts of globalization and the decline of the labour unions which, taken together, have restrained wages and encouraged automation by U.S. firms to stay competitive relative to low cost centres. We expect wages to continue growing at a moderate pace in 2015 despite stronger economic growth.
The housing market is another area of concern. Residential construction remains well below demographic needs and skewed towards cheaper multiple dwellings which contribute less per unit to GDP than single family homes. The homeownership rate is at a 20-year low and is unlikely to improve significantly unless some of the barriers to entry for first time home buyers (e.g. student debt) are lessened. For instance, government could allow for renegotiation of student loans either through debt forgiveness or lower interest charges, or even by trying innovative methods, e.g. pairing an individual’s student loan with a mortgage at a lower average rate of interest. That could also help address some of the mounting risks in credit markets, such as disproportionately high delinquencies on student debt. Another issue worth following closely in 2015 is the rising delinquencies on auto loans related to “sub-prime” type of deals. That’s unlikely to trigger a financial crisis the way the sub-prime housing loans did a few years ago because the majority of the sub-prime auto loans originated from auto finance companies not banks. Still, such delinquencies could hurt credit scores somewhat and take some shine off an otherwise solid consumption picture.
The oil and gas industry will also be under pressure in light of the recent collapse in prices and there will likely be cutbacks in investment in that sector. But considering the earlier-discussed windfall for consumers, we estimate the energy price slump to be a net positive for the U.S. economy. Regardless, the oil price decline will not interrupt the U.S. drive towards energy independence. In our view, the solid fundamentals for consumption and non-energy investment outweigh the challenges elsewhere in the economy. Exports could soften a bit due to the stronger dollar, although neither this nor a slight tightening of monetary policy by the Fed will prevent U.S. GDP growth from accelerating to 3% in 2015, the best performance in a decade. That, of course, assumes business confidence isn’t sapped by a dysfunctional Congress.
0.65
0.70
0.75
0.80
0.85
0.90
0.95
1.00
1.05
1.10
10
12
14
16
18
20
22
24
26
28
30
32
34
1950 1960 1970 1980 1990 2000 201080
100
120
140
160
180
200
220
240
260
280
300
320
340
360
380
400
1950 1960 1970 1980 1990 2000 2010
U.S.: Compensation hasn’t kept up with productivity
Index=100 in 1950Q1
Productivity
Real compensation
NBF Economics and Strategy (data via Datastream)
Real compensation per hour and Non farm business productivity
Real compensation relative to productivity versus Union membership as % of employed
Unionization rate (R)
Real compensation relative to productivity (L)
%2
3
4
5
6
7
8
9
10
11
12
13
14
15
16
17
2004 2006 2008 2010 2012 20142
3
4
5
6
7
8
9
10
11
12
13
14
15
16
17
2004 2006 2008 2010 2012 2014
U.S.: Disproportionately elevated delinquencies for student and auto loans
%
Share of new delinquencies
Share of total loans
NBF Economics and Strategy (data via New York Fed)
Share of new delinquencies
Share of total loans
Student loans Auto loans%
Q3 Q3
2.5
2.6
2.7
2.8
2.9
3.0
3.1
3.2
3.3
3.4
3.5
1992 1994 1996 1998 2000 2002 2004 2006 2008 2010 2012 2014
U.S.: Heading towards energy independence
NBF Economics and Strategy (data via Census Bureau, EIA)
Consumption
Production
Gasoline production and consumption (Billion barrels, annualized)
Real imports of petroleum
15,000
16,000
17,000
18,000
19,000
20,000
21,000
22,000
23,000
24,000
25,000
26,000
27,000
1994 1996 1998 2000 2002 2004 2006 2008 2010 2012 2014
index
ECONOMIC OUTLOOK
CANADA
7
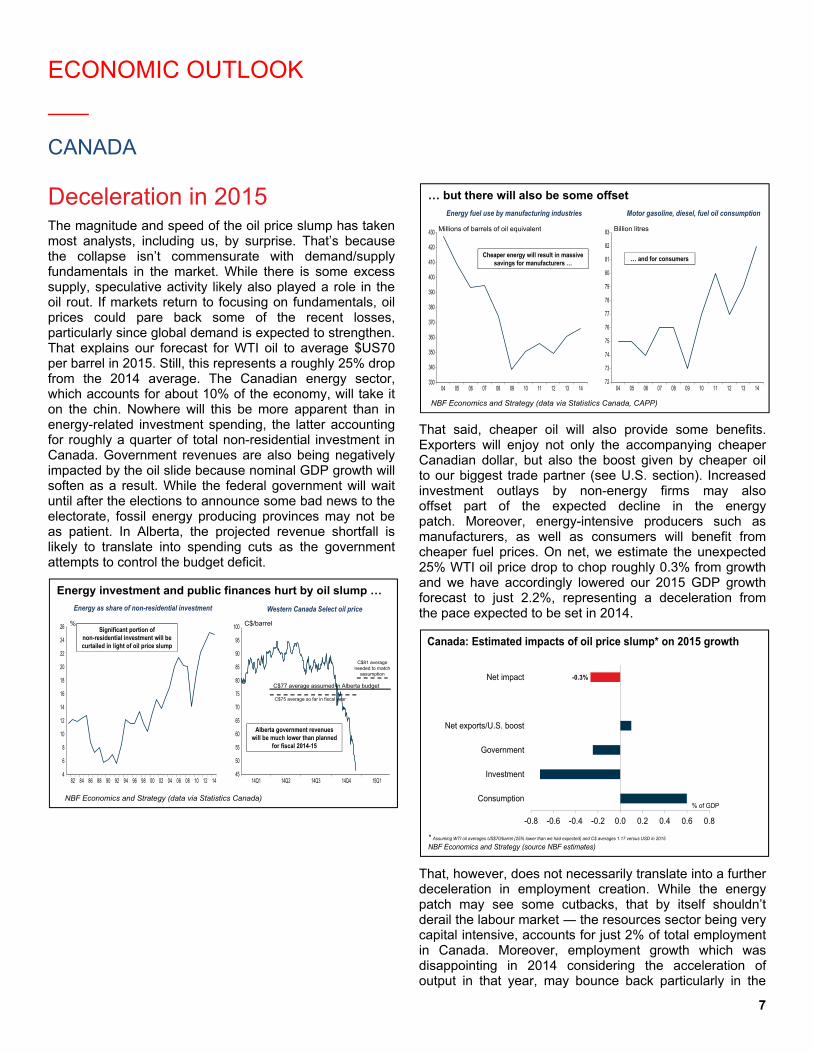
Deceleration in 2015 The magnitude and speed of the oil price slump has taken most analysts, including us, by surprise. That’s because the collapse isn’t commensurate with demand/supply fundamentals in the market. While there is some excess supply, speculative activity likely also played a role in the oil rout. If markets return to focusing on fundamentals, oil prices could pare back some of the recent losses, particularly since global demand is expected to strengthen. That explains our forecast for WTI oil to average $US70 per barrel in 2015. Still, this represents a roughly 25% drop from the 2014 average. The Canadian energy sector, which accounts for about 10% of the economy, will take it on the chin. Nowhere will this be more apparent than in energy-related investment spending, the latter accounting for roughly a quarter of total non-residential investment in Canada. Government revenues are also being negatively impacted by the oil slide because nominal GDP growth will soften as a result. While the federal government will wait until after the elections to announce some bad news to the electorate, fossil energy producing provinces may not be as patient. In Alberta, the projected revenue shortfall is likely to translate into spending cuts as the government attempts to control the budget deficit.
That said, cheaper oil will also provide some benefits. Exporters will enjoy not only the accompanying cheaper Canadian dollar, but also the boost given by cheaper oil to our biggest trade partner (see U.S. section). Increased investment outlays by non-energy firms may also offset part of the expected decline in the energy patch. Moreover, energy-intensive producers such as manufacturers, as well as consumers will benefit from cheaper fuel prices. On net, we estimate the unexpected 25% WTI oil price drop to chop roughly 0.3% from growth and we have accordingly lowered our 2015 GDP growth forecast to just 2.2%, representing a deceleration from the pace expected to be set in 2014.
That, however, does not necessarily translate into a further deceleration in employment creation. While the energy patch may see some cutbacks, that by itself shouldn’t derail the labour market ― the resources sector being very capital intensive, accounts for just 2% of total employment in Canada. Moreover, employment growth which was disappointing in 2014 considering the acceleration of output in that year, may bounce back particularly in the
45
50
55
60
65
70
75
80
85
90
95
100
14Q1 14Q2 14Q3 14Q4 15Q14
6
8
10
12
14
16
18
20
22
24
26
82 84 86 88 90 92 94 96 98 00 02 04 06 08 10 12 14
Energy investment and public finances hurt by oil slump …
NBF Economics and Strategy (data via Statistics Canada)
Energy as share of non-residential investment
%
Western Canada Select oil price
C$/barrel
C$75 average so far in fiscal year
C$77 average assumed in Alberta budget
C$81 average needed to match
assumption
Significant portion of non-residential investment will be curtailed in light of oil price slump
Alberta government revenues will be much lower than planned
for fiscal 2014-15
72
73
74
75
76
77
78
79
80
81
82
83
04 05 06 07 08 09 10 11 12 13 14330
340
350
360
370
380
390
400
410
420
430
04 05 06 07 08 09 10 11 12 13 14
… but there will also be some offset
NBF Economics and Strategy (data via Statistics Canada, CAPP)
Energy fuel use by manufacturing industries
Millions of barrels of oil equivalent
Cheaper energy will result in massive savings for manufacturers …
Motor gasoline, diesel, fuel oil consumption
Billion litres
… and for consumers
Canada: Estimated impacts of oil price slump* on 2015 growth
* Assuming WTI oil averages US$70/barrel (25% lower than we had expected) and C$ averages 1.17 versus USD in 2015
NBF Economics and Strategy (source NBF estimates)
-0.8 -0.6 -0.4 -0.2 0.0 0.2 0.4 0.6 0.8
Consumption
Investment
Government
Net exports/U.S. boost
Net impact -0.3%
% of GDP

ECONOMIC OUTLOOK
CANADA
8
goods sector as manufacturing exports take off. A catch-up in employment creation is also possible in an otherwise resilient services sector after an atypically soft 2014. The related income gains from employment, coupled with the massive energy stimulus should help support consumption spending. The cheaper Canadian dollar may also curb cross-border shopping somewhat and keep retail dollars at home. Another positive for consumption is that household debt, while elevated, remains manageable ― the interest paid as a % of disposable income may be higher than in the U.S., but it is nonetheless the lowest on record on this side of the border. So, the much-awaited deleveraging is likely to be delayed for yet another year.
While we anticipate Canadian housing to soften somewhat, particularly after solid growth in recent years, and in the aftermath of the increase by CMHC of fees charged to issuers to guarantee mortgages, an outright crash is unlikely given the still-solid fundamentals including low interest rates, generally good credit quality of mortgage holders, healthy demand helped by immigration growth, and a sound banking system. The home resale market should remain balanced nationally, although we expect some softening in the condo market, and in certain pockets around the country including in Alberta, after the oil price collapse, and in slow-growing Quebec and Atlantic Canada.
With domestic demand restrained by the curtailment of investment in the oil patch, tight fiscal policy, and a moderation in the housing market, trade will once again be the driver of growth in 2015. Strengthening U.S. demand, coupled with the lagged impacts of a cheaper Canadian dollar will give a boost to exporters, allowing GDP to grow 2.2% in 2015. That will be the third consecutive year of above potential growth, and should be enough to close the output gap. So, while headline inflation will be soft due to oil prices, core inflation will remain well supported as to slightly exceed the Bank of Canada’s 2% target. That's not to say the central bank will quickly abandon its dovish stance on monetary policy. Like us, it will have to chop its growth and headline inflation forecasts for 2015 in the upcoming Monetary Policy Report to reflect the oil price slump. And given its concerns about the global economy and domestic risks, the central bank will likely continue to err on the side of caution and delay interest rate hikes to 2016.
4.5
5.0
5.5
6.0
6.5
7.0
7.5
8.0
8.5
9.0
9.5
10.0
10.5
92 94 96 98 00 02 04 06 08 10 12
Canada: Household debt burden is manageable for nowInterest paid as a % of household disposable income
NBF Economics and Strategy (data via BEA, Statistics Canada)
Canada
U.S.
0.94
0.96
0.98
1.00
1.02
1.04
1.06
1.08
1.10
1.12
1.14
1.16
1.18
2010 2011 2012 2013 2014
-0.3
-0.2
-0.1
0.0
0.1
0.2
0.3
0.4
0.5
T T+1 T+2 T+3 T+4 T+5 T+6 T+7 T+8
Canada: Exporters are yet to see full benefits of loonie slump
NBF Economics and Strategy (data via Statistics Canada)
C$/US$ Correlation of changes in export volumes with C$/US$ lagged by quarters
Depreciating Canadian dollar ...… tends to lift exports with a lag

ECONOMIC OUTLOOK
PROVINCIAL ECONOMIES
9
Ontario The value of Ontario’s international merchandise exports in the first 10 months of 2014 was up 7.3% from a year earlier. Almost 40% of the rise was in autos and parts, a proportion consistent with this industry’s share of Ontario exports. Another large contribution was from pharmaceutical and medicinal products, whose exports rose 62%.
At the national level, real GDP of the automotive industry rose 9.7% annualized in the third quarter of 2014. In that quarter the value of shipments of the Ontario industry rose 19.6%. Then in October, the value of shipments rose 6.5% annualized over the third-quarter average. The popularity of cross utility vehicles and of trucks favoured production located in Canada.
However, the very high rate of capacity utilization in the Canadian transportation equipment industry raises the question whether this production growth can continue.
The expansion of the U.S. economy and depreciation of the Canadian dollar nevertheless suggest that overall, Ontario’s exports will grow further in 2015.
In 2013, real final domestic demand had been sluggish, growing 0.4%. This lethargy was mostly attributable to declines in business investment and residential construction. In 2014, despite a fourth consecutive year of declining government investment, the growth of final domestic demand finally accelerated, to 1.1%. Business investment in machinery and equipment is expanding again after two years of contraction, backed by corporate profits that by mid-2014 had grown for four consecutive quarters to a point just short of the all-time high of Q1 2012.
Real household spending is likely to be stimulated in 2015 by the fall of gasoline prices. Business investment should be robust in each of its three main segments – machinery and equipment, non-residential structures and intellectual property.
Quarterly employment numbers from the LFS flattened in late 2013 and early 2014 and then grew briskly in subsequent quarters. On this point the trend of payroll employment as reported by the SEPH was in agreement. However, the LFS reported that most of the jobs added in the last three quarters of 2014 were part-time. This could help explain why, although employment is on track for an increase of 0.8% in 2014, payroll earnings were up only 2.8% in the first three quarters of 2014, well below the national average of 3.6%.
35
40
45
50
55
60
65
70
75
80
85
90
95
100
105
110
2007 2008 2009 2010 2011 2012 2013 2014
Ontario: Auto industry gaining tractionU.S. new-vehicle sales; Ontario auto industry real GDP and value of shipments
Number of new cars and light trucks sold in the U.S. (annualized); Q4 2014 = October + NovemberIndex 2007 = 100
Real GDP of Ontario auto and parts industry
NBF Economics and Strategy, data from ISQ, Ontario Finance Department, Statistics Canada and Autodata Corp. via Thompson Reuthers
Value of new-vehicle shipments (Q4 2014 = October)
56
60
64
68
72
76
80
84
88
92
96
88 90 92 94 96 98 00 02 04 06 08 10 12 14
Canada: Capacity utilization, transportation equipment
%
NBF Economics and Strategy, data from Statistics Canada
44
48
52
56
60
64
68
72
76
80
84
99 00 01 02 03 04 05 06 07 08 09 10 11 12 13 14
Ontario: Corporate profitsOperating profits before income taxes and interest payments, annualized
NBF Economics and Strategy, data from Ontario Finance Department
$ billion
ECONOMIC OUTLOOK
PROVINCIAL ECONOMIES
10
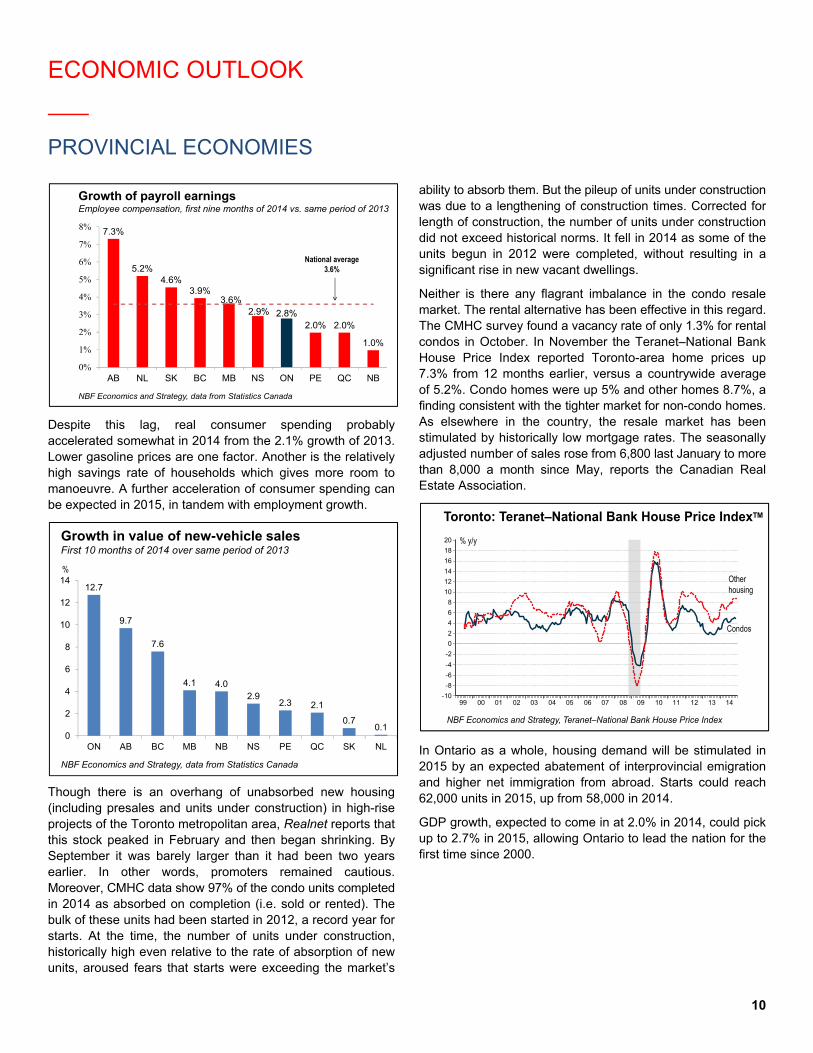
Despite this lag, real consumer spending probably accelerated somewhat in 2014 from the 2.1% growth of 2013. Lower gasoline prices are one factor. Another is the relatively high savings rate of households which gives more room to manoeuvre. A further acceleration of consumer spending can be expected in 2015, in tandem with employment growth.
Though there is an overhang of unabsorbed new housing (including presales and units under construction) in high-rise projects of the Toronto metropolitan area, Realnet reports that this stock peaked in February and then began shrinking. By September it was barely larger than it had been two years earlier. In other words, promoters remained cautious. Moreover, CMHC data show 97% of the condo units completed in 2014 as absorbed on completion (i.e. sold or rented). The bulk of these units had been started in 2012, a record year for starts. At the time, the number of units under construction, historically high even relative to the rate of absorption of new units, aroused fears that starts were exceeding the market’s
ability to absorb them. But the pileup of units under construction was due to a lengthening of construction times. Corrected for length of construction, the number of units under construction did not exceed historical norms. It fell in 2014 as some of the units begun in 2012 were completed, without resulting in a significant rise in new vacant dwellings.
Neither is there any flagrant imbalance in the condo resale market. The rental alternative has been effective in this regard. The CMHC survey found a vacancy rate of only 1.3% for rental condos in October. In November the Teranet–National Bank House Price Index reported Toronto-area home prices up 7.3% from 12 months earlier, versus a countrywide average of 5.2%. Condo homes were up 5% and other homes 8.7%, a finding consistent with the tighter market for non-condo homes. As elsewhere in the country, the resale market has been stimulated by historically low mortgage rates. The seasonally adjusted number of sales rose from 6,800 last January to more than 8,000 a month since May, reports the Canadian Real Estate Association.
In Ontario as a whole, housing demand will be stimulated in 2015 by an expected abatement of interprovincial emigration and higher net immigration from abroad. Starts could reach 62,000 units in 2015, up from 58,000 in 2014.
GDP growth, expected to come in at 2.0% in 2014, could pick up to 2.7% in 2015, allowing Ontario to lead the nation for the first time since 2000.
7.3%
5.2%4.6%
3.9%3.6%
2.9% 2.8%2.0% 2.0%
1.0%
0%
1%
2%
3%
4%
5%
6%
7%
8%
AB NL SK BC MB NS ON PE QC NB
Growth of payroll earningsEmployee compensation, first nine months of 2014 vs. same period of 2013
National average3.6%
NBF Economics and Strategy, data from Statistics Canada
Growth in value of new-vehicle salesFirst 10 months of 2014 over same period of 2013
12.7
9.7
7.6
4.1 4.02.9
2.3 2.1
0.70.1
0
2
4
6
8
10
12
14
ON AB BC MB NB NS PE QC SK NL
%
NBF Economics and Strategy, data from Statistics Canada
-10
-8
-6
-4
-2
0
2
4
6
8
10
12
14
16
18
20
99 00 01 02 03 04 05 06 07 08 09 10 11 12 13 14
Toronto: Teranet–National Bank House Price IndexTM
% y/y
Otherhousing
Condos
NBF Economics and Strategy, Teranet–National Bank House Price Index

ECONOMIC OUTLOOK
PROVINCIAL ECONOMIES
11
Quebec
In the first 10 months of 2014, Quebec’s volume international merchandise exports were up 9.2% from 2013, versus 4.3% for the rest of Canada. Almost a third of the 2014 growth came from metal ores, which account for only 5% of volume international merchandise exports. Aerospace products, which are Quebec’s largest category of exports at 13% of the total, contributed almost 22% of the growth.
Mining output, after major capital spending in recent years, jumped 27% in real terms between Q2 2013 and Q2 2014.
The strong showing of exports has yet to boost employment, which since January 2013 has been flat at best. On this point the indicators agree – the Labour Force Survey (LFS), the Survey of Employment, Payrolls and Hours (SEPH) and earnings from employment, which in the first nine months of 2014 were up only 2.0% from a year earlier.
Given the rate of household saving, which has been very low since late 2013, it is unlikely that consumer spending will pick up significantly in 2015 even if labour market conditions improve. Households could save more in the face of a higher tax burden.
In the housing market, oversupply persists for condos, where resale listings are far in excess of the buyer’s-market threshold of 10 months of sales at the current rate. The Teranet–National Bank House Price Index shows home prices up only 0.6% from a year earlier in the Montreal market and down 0.3% in the Quebec City market. The deflation in Quebec City was concentrated in the condo segment, where prices were down 1.9%.
24
25
26
27
28
29
30
31
32
33
34
4.8
5.0
5.2
5.4
5.6
5.8
6.0
6.2
6.4
6.6
6.8
2007 2008 2009 2010 2011 2012 2013 2014
International merchandise exports, customs basisConstant dollars, monthly average by quarter
NBF Economics and Strategy, Statistics Canada and ISQ data
$ billion$ billion
Rest of Canada (L)
Quebec (R)
Q4 2014: October
3340
3360
3380
3400
3420
3440
3460
3480
3500
3520
3540
3820
3840
3860
3880
3900
3920
3940
3960
3980
4000
4020
4040
4060
2008 2009 2010 2011 2012 2013 2014
Quebec: Employment indicators converge
Thousands Thousands
NBF Economics and Strategy, data from Statistics Canada
Total employment LFS (R)
Payroll employment SEPH (L)
National average 3.6%
Number of jobs according to LFS and SEPH Payroll growth
7.3%
5.2%
4.6%
3.9%
3.6%
2.9% 2.8%
2.0% 2.0%
1.0%
0%
1%
2%
3%
4%
5%
6%
7%
8%
AB NL SK BC MB NS ON PE QC NB
0
1
2
3
4
5
6
7
8
9
2008 2009 2010 2011 2012 2013 2014
Household savings rateNet saving as % of household disposable income
Quebec
Ontario
Rest of Canada
%
NBF Economics and Strategy, data from ISQ, Ontario Finance Department and Statistics Canada
2
4
6
8
10
12
14
16
18
20
22
24
00 01 02 03 04 05 06 07 08 09 10 11 12 13 144
5
6
7
8
9
10
11
12
13
14
15
16
04 05 06 07 08 09 10 11 12 13 14
Montreal
Number of months to clear inventory at current sales rate
Quebec City
Buyer’s market
Condo housing: Ratio of active listings to salesCondo resale market, Montreal and Quebec City Metropolitan Census Areas
NBF Economics and Strategy, data from Centris seasonally adjusted by NBF
Buyer’s market
Number of months to clear inventory at current sales rate

ECONOMIC OUTLOOK
PROVINCIAL ECONOMIES
12
In addition to a buyer’s market in resale housing, promoters and homebuilders face some overhang of unabsorbed new units. They are thus unlikely to launch new projects without a convincing rate of presale. For this reason we expect starts to decline from 39,000 units in 2014 to 37,000 in 2015, trailing the estimated household formation rate of 40,000 a year. Even taking into account the rise in home-renovation spending, which since last year has exceeded spending on new construction, investment in residential construction as a whole is likely to decline in real terms for a third consecutive year in 2015.
In its Fall 2014 Economic and Financial Update, the Quebec government reiterated its objective of a balanced budget for the following financial year. To this end it has targeted average annual growth of 1.7% for consolidated spending in the current fiscal year and the next two, with a target of 0.8% for the next fiscal year. A total of $1.2 billion in gap-closing measures remain to be identified. In addition, under the government’s 10-year infrastructure plan, government investment (excluding investment by government-owned corporations like Hydro-Québec) will peak at $11.5 billion this year, falling to $9.6 billion in 2015-16 and
$8.5 billion in 2016-17. In short, don’t expect much of a contribution to economic growth from government spending.
It is clear that the outlook for the components of final domestic demand reviewed so far is not one of marked acceleration. Final domestic demand edged up only 0.4% in 2013, held back by a decline of business nonresidential investment in that year. Since this investment on the whole seems unlikely to have increased in 2014, we expect growth of final domestic demand to come in at only 1,1% in that year.
On the other hand, the robust showing of the U.S. economy and the depreciation of the Canadian dollar will support the expansion of Quebec’s international exporters in 2015 and improve their profitability, with further help from a lower energy bill. Incidentally, profits of Quebec businesses have grown in each of the five quarters ending in the third quarter of 2014, a good omen for hiring and capital spending. So despite headwinds from residential construction and government spending, we expect final domestic demand to increase 1.2% in 2015. The contribution from external trade can be expected to bring
-6
-4
-2
0
2
4
6
8
10
12
14
16
18
92 94 96 98 00 02 04 06 08 10 12 14-6
-4
-2
0
2
4
6
8
10
12
14
16
92 94 96 98 00 02 04 06 08 10 12 14
Montreal Quebec City
Teranet–National Bank House Price IndexTM
Montreal and Quebec City Census Metropolitan Areas, by type of housing
% change y/y
Teranet–National Bank House Price Index
Condo
Other Condo
Other
% change y/y
2
3
4
5
6
7
8
9
10
11
12
2007 2008 2009 2010 2011 2012 2013 2014
$ billion, chained 2007 dollars
Quebec: Residential construction expenditureBy component, constant dollars
Renovation
New construction
Transfer of ownership
NBF Economics and Strategy, ISQ data
102
104
106
108
110
112
114
116
118
120
122
124
126
128
130
2008 2009 2010 2011 2012 2013 2014
Government investmentConstant dollars
2007 = 100Quebec
Canada
NBF Economics and Strategy, data from ISQ, Ontario Finance Department, Statistics Canada
6
7
8
9
10
11
12
13
14
15
2007 2008 2009 2010 2011 2012 2013 2014
Quebec: Nonresidential business investmentBy component, constant dollars
Machinery and equipment
Construction
Intellectual property
NBF Economics and Strategy, ISQ data
$ billion, chained 2007 dollars

ECONOMIC OUTLOOK
PROVINCIAL ECONOMIES
13
2015 GDP growth to 1.9%, up from an estimated 1.6% in 2014 and 1.0% in 2013.
Subsequently, as slack in economic resources is taken up, GDP growth will be limited by the growth of potential GDP, which will be slowed by demographic trends. According to the baseline scenario of the Institut de la Statistique du Québec (ISQ), the province’s population of 15- to 64-year-olds, the main pool of workers, will begin to shrink in 2016.
British Columbia British Columbia is on track for economic growth of 2.3% in 2014. Employment has grown almost 1%, though most of the jobs added have been part-time. The bulk of the new jobs have been in the private sector. The industries leading the hiring have been transportation and warehousing and manufacturing, along with health care and social services. On other hand, employment in trade is down and there has been a general consolidation of employment in the other service industries. Among goods-producing industries, agriculture and construction have shed jobs.
Perhaps because new jobs were part-time, average weekly earnings are at this writing up only 2.9% in 2014. B.C. is second among provinces in growth of retail sales, but in this province it is sometimes hard to distinguish sales to residents from sales to foreign visitors.
After declining in 2013, investment in new residential buildings was up 11.7% in the first 10 months of the year, the strongest gain of any province. Starts are likely to end the year up 5% from 2013, but that leaves them at the average of 1991-2013. The resale market is increasingly tight – sales
have increased steadily from the 2012 trough but new listings have been fairly flat.
Business investment, more or less flat in 2013, will probably end 2014 with a decline in real terms. This likelihood is hardly lessened by a sharp drop in real investment in non-residential buildings in the first nine months of the year. Government investment is also on track for a decline.
The value of B.C.’s international merchandise exports is on track to exceed the all-time high of 2000Q4. In the first 10 months of 2014 exports were up 9% from a year earlier despite a Vancouver port strike in March. A third of the increase came from forest products and another third from natural gas. Copper ore was also a major contributor. Except for coal, down 21% because of lower Chinese demand, B.C.’s traditional exports have had pride of place in 2014. The leading destination of its exports has been the U.S., which has taken half the total and 18% more than a year earlier. Exports to South Korea are up 30%, though accounting for only 6% of the total. Exports to China, more than 18% of the total, are down slightly. Exports to Japan, a little more than 10% of the total, have also declined.
The value of natural gas exports got a boost in the first half of the year from a spike in the continental price of this commodity, attributed to abnormally cold weather. Lumber prices were generally firm in 2014.
Exports can be expected to spearhead B.C.’s economic growth once again in 2015. We forecast an expansion of 2.5%. Output of metal ores is likely to grow at a double-digit rate, offsetting the blow to lumber production from the ravages of the mountain pine beetle.
5.42
5.44
5.46
5.48
5.50
5.52
5.54
5.56
2011
2012
2013
2014
2015
2016
2017
2018
2019
2020
2021
2022
2023
2024
2025
2026
2027
2028
2029
2030
Quebec: Population aged 15 to 64ISQ baseline scenario
Millions
NBF Economics and Strategy, ISQ data
Decreasing from 2016 on
3.5
4.0
4.5
5.0
5.5
6.0
6.5
7.0
7.5
8.0
8.5
9.0
9.5
88 90 92 94 96 98 00 02 04 06 08 10 12 14
B.C.: Value of international merchandise exportsSeasonally adjusted
NBF Economics and Strategy, data from BCStats
$ billion
U.S. recessions in gray
2014 Q4: October
2000 Q4

ECONOMIC OUTLOOK
PROVINCIAL ECONOMIES
14
In the first nine months of 2014, natural gas production was up 5.4% from a year earlier. Further vigorous growth is expected in 2015.
The Prairies In Alberta, oil and gas extraction accounts for almost a quarter of provincial real GDP. And that’s not counting oilsands investment. Business nonresidential investment is 27% of nominal GDP and 60% of that has been in the energy sector.
Population growth has been a major driver of the province’s economic growth. Over the 10 quarters ending last September, Alberta’s 12-month population growth was always in excess of 2.5%. Besides attracting many international immigrants, the province is by far the main destination for Canadians of other provinces looking for more opportunity than they find in their regions of origin. Strong population growth has required heavy investment in housing. The 41,000 starts of 2014 exceeded those in Quebec, a province twice as populous. New infrastructure, especially in utilities, education and health care, is needed to accommodate the influx. The upshot is that Alberta’s economic growth has averaged 4.5% annually since 2009.
From February 2011 through last September, the benchmark WCS oil price averaged close to C$78 a barrel, its level in mid-October. By mid-December WCS was going for about $45, barely more than in the last recession. Assuming an average of US$70 for WTI in 2015, with WCS selling at a 30% discount to WTI and the Canadian dollar averaging 85 cents US over the year, WCS will average less than C$60 in 2015. In that case, oilfield investment and production are both certain to decline.
Moreover, Alberta’s employment outlook will be less alluring. In-migration, especially from other provinces, will abate. As we have seen, other Canadians will generally enjoy improved labour markets where they are. Homebuilding will decline significantly as a result.
According to the Teranet–National Bank House Price IndexTM, Calgary home prices rose 9.2% over the 12 months ending in November. For the 11 metropolitan markets surveyed by the index, the weighted average gain was 5.2%. Unless the price of oil rebounds, home-price deflation cannot be ruled out in Alberta in 2015.
In short, the contraction of activity in the energy sector and its implications for in-migration and provincial finances suggest that Alberta’s economic growth in 2015 could slow to 2.0%, half the estimated rate for 2014. On our assumption of WTI at US$80 in 2016, growth could accelerate to 2.5% in that year.
Lower oil prices will have a profound impact on the provincial government’s revenues. In its budget of March 2014 the government assumed a WTI price averaging US$94.86 in fiscal 2015-16. Our assumption of $73.40 would mean, other factors equal, a $4.6-million shortfall in oil royalties. That would seriously compromise the projected surplus of about $1 billion in 2015-16. Our forecast for Alberta GDP growth in 2015
20
40
60
80
100
120
140
160
180
2007 2008 2009 2010 2011 2012 2013 2014
B.C.: Prices of selected export commoditiesIn USD, quarterly average
2007 = 100
NBF Economics and Strategy, data from Thompson Reuthwers Datastream
Softwood lumber
LME copper
Henry Hub natural gas
20
30
40
50
60
70
80
90
100
110
120
130
140
150
2008 2009 2010 2011 2012 2013 2014
Price of oil: WTI in US$, WCS in C$
WTI in USD
WCS in CAD
Per barrel
NBF Economics and Strategy, data from Bloomberg and Thomson Reuters Datastream

ECONOMIC OUTLOOK
PROVINCIAL ECONOMIES
15
assumes that the government would respond to the imbalance with spending cuts. Saskatchewan’s economic growth slowed in 2014 mainly for technical reasons. A bumper harvest in 2013 boosted real crop output 38%. Since crops account for almost 7% of its economy, that surge added 2½ percentage points to Saskatchewan’s GDP growth. Then in 2014, bad weather cut crop output by a quarter. This swing is a very large part of the reason why real GDP growth fell from 5.0% in 2013 to an estimated 0.9% in 2014.
Oil and gas extraction added to economic growth in 2014. In the first 10 months of the year, volume crude production was up 5.8% from a year earlier. In the first 11 months, the number of wells drilled was up 9.9%. Natural Resources Canada reports that 10 months into 2014, potash tonnage extracted in Canada as a whole was up 3.2% from the same period of 2013. Since this industry accounts for less than 3% of the province’s GDP, its impact on 2014 economic growth will be marginal.
Employment is on track for growth of 1.9% in 2014, a third consecutive year of robust expansion. The jobs added over these three years have been essentially full-time, and most new payroll employment has been in the private sector; the public-sector headcount contracted in 2014. The great majority of jobs added in 2014 were in goods-producing industries – agriculture, mining, construction.
Nine months into the year, Saskatchewan’s population was up 1.6% from a year earlier. Two-thirds of the growth was due to international immigration. Residential construction seems nevertheless to have overshot the mark a little, judging by the rise in unabsorbed new non-rental housing units in the Regina and Saskatoon markets. For that reason, we forecast a slight decline in housing starts in 2015 and 2016.
Like in Alberta, lower oil prices will impact the activity in the energy sector. Essentially for this reason, we are revising down our forecast of Saskatchewan’s 2015 growth to 1.3%.
In its midyear update the government planned for an average price of US$82.06 a barrel for WTI crude in the second half of the current fiscal year. At this writing, $65.25 seems more likely. Other factors equal, that would mean $168 million less in royalties than was projected at midyear, compromising the projected 2014-15 surplus of $105 million before transfers to the Growth and Financial Security Fund (GFSF). Since public accounts show the financial-security portion of the GFSF with an endowment of $296 million at the beginning of the year, the government will be in a position to make up the shortfall.
For fiscal 2015-16, the budget of March 2014 assumed an average WTI price of US$92. Our forecast is US$73.40. If we are on the mark, the royalty shortfall will amount to $372 million and the projected surplus of $108 million before transfer to the GFSF will become a $264-million deficit. The financial-security portion of the GFSF will in principle be insufficient to plug the gap. Since other variables could come in more favourable than forecast – the March budget assumed a Canadian dollar worth 90 cents US – the government will not necessarily need drastic measures to shore up its fiscal position.
Since oil and gas extraction accounts for only about 2.5% of Manitoba’s economy, the fall of oil prices will have relatively little effect. Crude production in the first 10 months of 2014 was down 16% from a year earlier.
Employment may end 2014 showing only marginal growth, due to a reduction in head counts in the private sector. There was a partial recovery in private employment late in the year. However, losses were concentrated in part-time jobs. Full-time employment is on track to grow 0.6%. That could explain why average weekly earnings in the first 10 months of 2014 were up 4.3% from a year earlier, matching Newfoundland and Labrador for the strongest gain among provinces.
Saskatchewan: Housing starts due to decelerate in 2015Current excess supply of new dwellings
0
1000
2000
3000
4000
5000
6000
7000
8000
9000
10000
2001 2003 2005 2007 2009 2011 2013 2015
Housing starts
0
100
200
300
400
500
600
700
90 92 94 96 98 00 02 04 06 08 10 12 14
Dwellings completed and unabsorbed(intended for homeowners and condos)
NBF Economics and Strategy, historical data from CMHC.
Saskatoon
Regina
NBF Forecast

ECONOMIC OUTLOOK
PROVINCIAL ECONOMIES
16
Also in the first 10 months of 2014, the value of Manitoba’s international merchandise exports was up 11.2% from a year earlier, with gains in 11 of 12 main categories. The strongest advances were in crop products, livestock, meat products and hydrocarbons. The rise in grain exports was due to the bumper crop of 2013. Despite U.S. legislation that since 2009 has required labelling by country of origin, hog and cattle exports were up 45%, good news for farm incomes.
Nonresidential building construction in the first nine months of 2014 was up 8.1% in real terms from a year earlier, with strong gains in commercial, institutional and government structures. Mining output rose sharply in 2014 as several sites came on stream.
Manitoba’s population continues to grow briskly. At the end of September 2014 it was up 1.3% from 12 months earlier, versus 1.1% for Canada as a whole. Nevertheless, unabsorbed new condo units on the Winnipeg market stood at an all-time high last November. Promoters are unlikely to continue starting 1,500 condo units a year as they did in 2013 and 2014 – a pace double that of the previous two years. Meanwhile, the rental vacancy rate in the Winnipeg market in October, though not alarming, was the highest since 2000. Housing starts in 2015 are unlikely to exceed those of 2014.
The lethargy of the labour market in 2014 is seen as a blip. Robust growth of domestic demand, led by investment in energy-related projects such as the Bipole III high-voltage direct-current transmission line, by government investment in infrastructure and by consumer spending, is likely to cause economic growth to accelerate from an estimated 2.0% in 2014 to 2.5% in 2015.
The provincial government’s midyear update revised its deficit for the current fiscal year from $357 million to $402 million, or 2.7% of consolidated revenues. In its budget of March 2014 the government projected a return to budget balance in fiscal 2016-17, implying that consolidated spending growth will be held to less than 2% annually.
Atlantic Provinces Newfoundland and Labrador’s real GDP is now expected to have declined in 2014, mainly because of lower-than-expected volume exports of crude oil and iron ore. The output of these industries has fallen considerably. Crude extraction during the first 10 months of the year was down 8% from a year earlier. Over the same period iron ore producers shipped 23% less tonnage than a year earlier, reflecting the closing of the Wabush mine and, to a lesser extent, temporary shutdowns at other mines. These two industries accounted for almost a third of the province’s GDP in 2013.
Newfoundland and Labrador employment is on track to decline 2.1% in 2014 after four years of strong growth. The major losses were not in resource industries but in the public sector, which may have shed 10% of its headcount. The cuts were concentrated in education, health care, social assistance and the government sector. The private sector, meanwhile, continues to add jobs at a good pace and has apparently been paying good wages – income from employment in the first nine months of 2014 was up 5.0% from a year earlier. Average weekly earnings were up 4.4%, the best showing in Canada. This income growth fuelled a 3.1% rise in retail sales, though new-vehicle sales were up only minimally. In addition, the number of bankruptcies and proposals to creditors is down,
4.3 4.34.1
3.2 3.2 3.12.9
2.5
2.1 2.1
1.5
2.0
2.5
3.0
3.5
4.0
4.5
MB NL AB NS NB SK BC PE ON QC
Canada: Growth of average weekly earningsFirst 10 months of 2014, change from year earlier
% y/y
NBF Economics and Strategy, data from Statistics Canada
0
3
6
9
12
15
18
21
03 04 05 06 07 08 09 10 11 12 13 14
Nov.-Dec.Jan.-Oct.
Newfoundland and Labrador: Crude oil production and producers’ shipments of iron ore
NBF Economics and Strategy, data from Natural Resources Canada and Canada–Newfoundland and Labrador Offshore Petroleum Board
0
20
40
60
80
100
120
140
98 00 02 04 06 08 10 12 14
Jan.-Oct.
Nov.-Dec.
Millions of barrels
Crude oil Iron ore shipments
Millions of tonnes
ECONOMIC OUTLOOK
PROVINCIAL ECONOMIES
17
suggesting that household balance sheets are on the whole holding up in the face of job losses.
Real non-residential investment of business and government combined is likely to come close in 2014 in real terms, to the prior year’s record. The ramp-up of capital spending for the White Rose and Hebron oilfields and the Muskrat Falls hydro project will offset the abatement of spending related to the Vale nickel-processing plant.
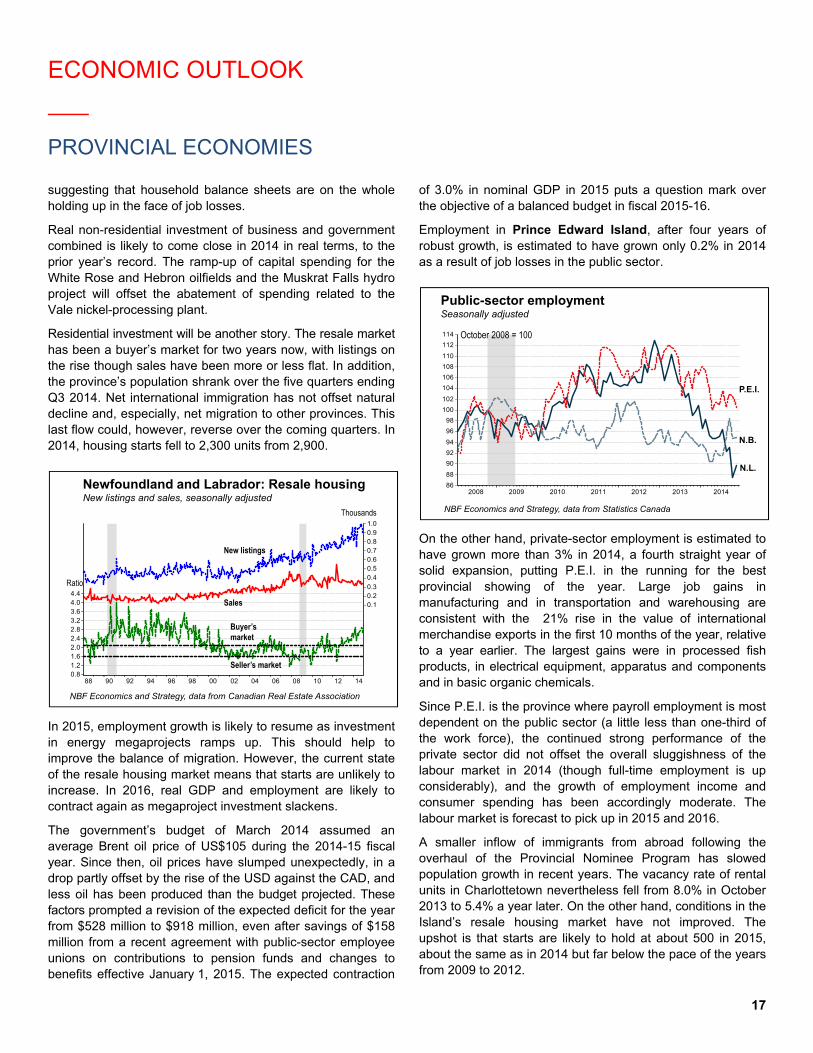
Residential investment will be another story. The resale market has been a buyer’s market for two years now, with listings on the rise though sales have been more or less flat. In addition, the province’s population shrank over the five quarters ending Q3 2014. Net international immigration has not offset natural decline and, especially, net migration to other provinces. This last flow could, however, reverse over the coming quarters. In 2014, housing starts fell to 2,300 units from 2,900.
In 2015, employment growth is likely to resume as investment in energy megaprojects ramps up. This should help to improve the balance of migration. However, the current state of the resale housing market means that starts are unlikely to increase. In 2016, real GDP and employment are likely to contract again as megaproject investment slackens.
The government’s budget of March 2014 assumed an average Brent oil price of US$105 during the 2014-15 fiscal year. Since then, oil prices have slumped unexpectedly, in a drop partly offset by the rise of the USD against the CAD, and less oil has been produced than the budget projected. These factors prompted a revision of the expected deficit for the year from $528 million to $918 million, even after savings of $158 million from a recent agreement with public-sector employee unions on contributions to pension funds and changes to benefits effective January 1, 2015. The expected contraction
of 3.0% in nominal GDP in 2015 puts a question mark over the objective of a balanced budget in fiscal 2015-16.
Employment in Prince Edward Island, after four years of robust growth, is estimated to have grown only 0.2% in 2014 as a result of job losses in the public sector.
On the other hand, private-sector employment is estimated to have grown more than 3% in 2014, a fourth straight year of solid expansion, putting P.E.I. in the running for the best provincial showing of the year. Large job gains in manufacturing and in transportation and warehousing are consistent with the 21% rise in the value of international merchandise exports in the first 10 months of the year, relative to a year earlier. The largest gains were in processed fish products, in electrical equipment, apparatus and components and in basic organic chemicals.
Since P.E.I. is the province where payroll employment is most dependent on the public sector (a little less than one-third of the work force), the continued strong performance of the private sector did not offset the overall sluggishness of the labour market in 2014 (though full-time employment is up considerably), and the growth of employment income and consumer spending has been accordingly moderate. The labour market is forecast to pick up in 2015 and 2016.
A smaller inflow of immigrants from abroad following the overhaul of the Provincial Nominee Program has slowed population growth in recent years. The vacancy rate of rental units in Charlottetown nevertheless fell from 8.0% in October 2013 to 5.4% a year later. On the other hand, conditions in the Island’s resale housing market have not improved. The upshot is that starts are likely to hold at about 500 in 2015, about the same as in 2014 but far below the pace of the years from 2009 to 2012.
0.81.21.62.02.42.83.23.64.04.4
0.10.20.3
0.40.50.60.70.80.91.0
88 90 92 94 96 98 00 02 04 06 08 10 12 14
Newfoundland and Labrador: Resale housingNew listings and sales, seasonally adjusted
Thousands
Ratio
NBF Economics and Strategy, data from Canadian Real Estate Association
New listings
Sales
Buyer’smarket
Seller’s market
86
88
90
92
94
96
98
100
102
104
106
108
110
112
114
2008 2009 2010 2011 2012 2013 2014
Public-sector employmentSeasonally adjusted
October 2008 = 100
P.E.I.
N.L.
N.B.
NBF Economics and Strategy, data from Statistics Canada

ECONOMIC OUTLOOK
PROVINCIAL ECONOMIES
18
Industrial building construction in the first nine months of 2014 was up very strongly from a year earlier. The resulting boost to the economy could bring P.E.I. economic growth to 1.0% in 2014, accelerating to 1.5% in 2015. These forecasts take into account the government’s upward revision of its deficit for the current fiscal year, to $44.7 million (2.8% of budgetary revenues) from $39.7 million, and its objective of a balanced budget in 2015.
In Nova Scotia, real GDP and employment followed divergent paths in 2014. The startup of production at the Deep Panuke gas field added to the former but had no effect on the latter. Though payroll employment was up in the public sector, total employment is on track to shrink 1.3% in 2014, deepening the 0.3% contraction of 2013 in a decline that goes well beyond what could be explained by demographics. Employment fell in 2014 in all of the five groups of goods-producing industries and five of the 11 service industry groups. The largest losses were in corporate services to facilities and other support services and in construction, trade, manufacturing and public services.
Employment in construction seems to have suffered from a sharp decline in homebuilding and a decline of investment in commercial buildings. Investment in the upgrading of Halifax shipbuilding facilities will wind down in 2015, though government investment will buoy the construction industry in the years ahead.
Since aging homeowners tend to leave their homes for rental accommodation, construction of such housing flourished from 2011 through 2013, so much so that the vacancy rate in the Halifax market rose from 2.4% in October 2011 to 3.7% in October 2014. Promoters cut back sharply on starts in 2014, no doubt to stop this rise, and are likely to continue doing so in 2015.
Manufacturers’ shipments in the first 10 months of 2014 were down 27% from a year earlier. A brighter future is promised by contracts under the National Shipbuilding Procurement Strategy, the expansion of the U.S. economy and depreciation of the Canadian dollar. Meanwhile, companies are prospecting for new offshore hydrocarbon fields.
In sum, we expect Nova Scotia real GDP to grow 1.7% in 2014 and accelerate to 2.1% in 2015, though natural gas extraction will of course contribute less to growth than in 2014.
In its midyear update the provincial government revised down its deficit for the current fiscal year to $221 million from $279 million. It is targeting a balanced budget in 2017-18.
In New Brunswick, 2014 will go down as the year that ended a four-year run of job losses. However, the gains are spotty: employment was down in nine of 16 broad sectors, including the five goods-producing sectors. The provincial government continues to reduce headcount. The main new hiring in 2014 was in professional, scientific and technical services and in business, building and other support services. Private-sector payrolls surged in late 2013 and early 2014 but lost the gains in the second half of that year as construction and trade shed jobs.
The labour market is likely to firm up more convincingly in 2015 and 2016. Volume exports will be the main driver. The Irving Oil refinery shutdown for maintenance in early 2014 is unlikely to recur in 2015. Forest industries will be buoyed by demand for lumber for the U.S. housing expansion, by the provincial government’s 20% hike in the volume of softwood that can be taken from Crown land and by substantial investment in mills. Potash output will continue to grow as the new Piccadilly mine comes on stream. The start of operations at the Caribou mine will boost the production of metal ores, severely reduced by the closing of the Brunswick zinc mine more than a year ago.
However, the oil price slide will reduce the value of exports (and corporate profits). Refined petroleum products account for about two-thirds of New Brunswick’s international exports by volume.
0
200
400
600
800
1000
1200
1400
1600
90 92 94 96 98 00 02 04 06 08 10 12 14p
Halifax: Rental housing starts
Number of units
NBF Economics and Strategy, historical data from CMHC

ECONOMIC OUTLOOK
PROVINCIAL ECONOMIES
19
Housing, in contrast to other components of private-sector domestic demand, is unlikely to contribute to economic growth in 2015 or 2016. The resale market has been oversupplied since 2012 and the overhang was exacerbated in 2014 by a
large rise in new listings. Meanwhile, the rental vacancy rate in October was 8.4% in Moncton and 8.7% in Saint John. Starts, which will end 2014 at an 18-year low, are for these reasons likely to remain modest over the forecast period.
New Brunswick’s economic growth is on track to finish 2014 at 0.9%. We see it rebounding to 1.5% in 2015 and 1.9% in 2016. The outlook for 2016 would be improved by a green light for the Energy East pipeline and for installation of export capability at the Canaport liquefied natural gas terminal.
Provincial government finances suffered from the economic downturn in 2012 and 2013. A midyear budget update projects a deficit of $377 million, or 4.6% of budgeted revenues, for 2014-15. In the budget of February 2014, the return to a balanced budget was deferred to fiscal 2017-18. About $300 million in gap-closing measures remain to be identified.
1.4
1.6
1.8
2.0
2.2
2.4
2.6
2.8
3.0
CA NL PE NS NB QC ON MB SK AB BC
Buyer’s market
Balanced market
Canada: Resale housing marketRatio of new listings to monthly sales, November 2014, by province
NBF Economics and Strategy, data from Canadian Real Estate Association

ECONOMIC OUTLOOK
ANNEX
20

ECONOMIC OUTLOOK
ANNEX
21
Q4/Q4(Annual % change)* 2012 2013 2014 2015 2016 2014 2015 2016
Gross domestic product (2007 $) 1.9 2.0 2.4 2.2 2.0 2.3 2.1 1.9Consumption 1.9 2.5 2.8 1.9 1.9 2.7 1.6 1.9Residential construction 5.7 (0.4) 2.5 1.4 (0.0) 4.7 (0.8) 0.1Business investment 9.0 2.6 (0.3) 1.1 1.4 0.6 0.7 1.7Government expenditures 0.2 0.1 (0.1) 0.0 0.1 0.3 (0.2) 0.2Exports 2.6 2.0 5.6 7.6 5.7 7.2 7.6 4.2Imports 3.7 1.3 1.7 4.8 2.6 2.8 4.5 2.0Change in inventories (millions $) 7,437 12,368 5,180 6,103 3,079 1,982 5,832 3,414Domestic demand 2.5 1.5 1.6 1.3 1.2 1.9 0.9 1.2
Real disposable income 2.8 2.5 1.7 2.4 2.0 1.7 2.4 1.9Employment 1.2 1.3 0.8 1.4 1.1 1.0 1.3 1.0Unemployment rate 7.3 7.1 6.9 6.5 6.3 6.6 6.4 6.2Inflation 1.5 0.9 2.0 1.4 2.2 2.3 1.6 2.3Before-tax profits (4.2) (0.6) 9.2 (0.1) 3.9 6.8 1.1 5.0Federal balance (Public Acc., bil. $) (18.4) (5.2) (2.9) 0.0 4.3 .... .... ....Current account (bil. $) (59.9) (56.3) (37.5) (26.6) (20.6) .... .... ....
* or as noted
Current Q4 Q4 2015 Q4 201612/18/14 Q1 2015 Q2 2015 Q3 2015 Q4 2015 2015 2016
Overnight rate 1.00 1.00 1.00 1.00 1.00 1.00 2.00 Prime rate 3.00 3.00 3.00 3.00 3.00 3.00 4.00 3 month T-Bills 0.90 0.90 0.95 0.96 1.22 1.22 1.96 Treasury yield curve 2-Year 1.02 1.16 1.22 1.64 1.90 1.90 2.30 5-Year 1.41 1.48 1.57 2.00 2.24 2.24 2.55 10-Year 1.87 1.93 1.99 2.36 2.49 2.49 2.75 30-Year 2.39 2.43 2.45 2.81 2.92 2.92 3.08
CAD per USD 1.16 1.15 1.16 1.18 1.20 1.20 1.15 Oil price (WTI), U.S.$ 54 65 70 72 80 80 80
National Bank Financial** end of period
CanadaEconomic Forecast
Financial Forecast**

ECONOMIC OUTLOOK
ANNEX
22
Q4/Q4(Annual % change)* 2012 2013 2014 2015 2016 ### 2014 2015 2016
Gross domestic product (2009 $) 2.3 2.2 2.4 3.0 2.3 2.5 2.5 2.1Consumption 1.8 2.4 2.4 3.1 2.5 2.7 2.9 2.2Residential construction 13.5 11.9 1.6 4.0 4.2 2.7 4.0 4.2Business investment 7.2 3.0 6.0 5.2 2.9 5.4 4.7 2.3Government expenditures (1.4) (2.0) (0.1) 0.9 0.3 1.2 0.5 0.2Exports 3.3 3.0 3.4 3.7 3.4 3.1 2.2 4.1Imports 2.3 1.1 3.9 4.9 4.1 5.3 4.5 3.7Change in inventories (bil. $) 57.1 63.6 70.6 62.3 53.6 83.4 58.4 54.1Domestic demand 2.1 1.9 2.4 3.0 2.2 2.8 2.7 1.9
Real disposable income 3.0 (0.2) 2.4 2.4 2.5 2.8 2.4 2.6Household employment 1.8 1.0 1.6 1.7 1.5 2.2 1.6 1.4Unemployment rate 8.1 7.4 6.2 5.7 5.5 5.8 5.6 5.4Inflation 2.1 1.5 1.6 1.2 2.2 1.3 1.8 2.3Before-tax profits 11.4 4.2 (0.7) 7.6 5.1 1.3 6.0 4.5Federal balance (unified budget, bil. $) (1,089.2) (680.2) (483.3) (469.0) (536.0) ... ... ...Current account (bil. $) (460.8) (400.3) (396.1) (385.0) (377.0) ... ... ...
-304
* or as noted
Current Q4 Q4 2015 Q4 201612/18/14 Q1 2015 Q2 2015 Q3 2015 Q4 2015 2015 2016
Fed Fund Target Rate 0.25 0.25 0.25 1.00 1.25 1.25 2.00 3 month Treasury bills 0.04 0.07 0.38 1.11 1.39 1.39 1.94 Treasury yield curve 2-Year 0.67 0.87 1.29 1.74 2.03 2.03 2.37 5-Year 1.68 1.75 1.99 2.22 2.38 2.38 2.78 10-Year 2.22 2.26 2.40 2.54 2.63 2.63 3.12 30-Year 2.82 2.83 2.93 3.04 3.10 3.10 3.52 Exchange rates U.S.$/Euro 1.23 1.22 1.19 1.17 1.15 1.15 1.10 YEN/U.S.$ 119 122 124 126 128 128 135
National Bank Financial** end of period
Financial Forecast**
United StatesEconomic Forecast

ECONOMIC OUTLOOK
ANNEX
23
Forecast Tables - Provinces
2009 2010 2011 2012 2013 2014f 2015f 2016f
Real GDP (% growth)
Newfoundland & Labrador -9.9 5.9 3.1 -4.5 7.2 -1.6 2.0 -1.0Prince Edward Island 0.4 2.2 1.6 1.0 2.0 1.0 1.5 1.7Nova Scotia 0.4 3.0 0.7 -0.3 0.3 1.7 2.1 2.0New Brunswick -1.1 2.0 0.6 -0.4 -0.5 0.7 1.5 1.9Quebec -0.6 2.3 2.0 1.5 1.0 1.6 1.9 1.7Ontario -3.1 3.4 2.6 1.7 1.3 2.0 2.7 2.0Manitoba -0.2 2.6 2.1 3.3 2.2 2.0 2.5 2.4Saskatchewan -4.8 4.2 5.8 3.1 5.0 0.9 1.3 1.7Alberta -4.1 4.5 5.7 4.5 3.8 4.0 2.0 2.5British Columbia -2.5 3.3 2.8 2.4 1.9 2.3 2.5 2.5Canada -2.7 3.4 3.0 1.9 2.0 2.4 2.2 2.0
Employment (% growth)Newfoundland & Labrador -2.9 3.5 2.7 2.1 1.2 -2.1 1.1 -0.1Prince Edward Island -1.4 3.1 1.9 1.0 2.1 0.2 1.4 0.6Nova Scotia -0.1 0.2 0.0 0.6 -0.3 -1.3 1.2 1.1New Brunswick 0.2 -1.0 -1.1 -0.2 -0.2 0.3 0.7 0.9Quebec -0.8 1.8 1.0 0.8 1.1 0.0 0.8 0.7Ontario -2.4 1.6 1.8 0.8 1.4 0.8 1.5 1.1Manitoba 0.0 1.9 0.7 0.9 0.5 0.1 1.6 1.5Saskatchewan 1.3 0.9 0.3 2.2 3.4 1.9 1.5 1.0Alberta -1.3 -0.4 3.5 2.6 2.8 3.0 1.5 1.5British Columbia -2.1 1.8 0.8 1.6 -0.2 0.9 1.7 1.4Canada -1.6 1.4 1.5 1.2 1.3 0.8 1.4 1.1
Unemployment rate (%)Newfoundland & Labrador 15.6 14.3 12.7 12.5 11.4 12.1 11.2 10.4Prince Edward Island 12.0 11.3 11.5 11.4 11.3 10.7 9.6 9.4Nova Scotia 9.1 9.2 8.8 9.0 9.0 8.8 8.3 8.3New Brunswick 8.7 9.3 9.5 10.3 10.4 9.6 9.0 8.4Quebec 8.5 7.9 7.7 7.8 7.6 7.8 7.5 7.3Ontario 9.0 8.6 7.8 7.8 7.5 7.3 6.6 6.7Manitoba 5.3 5.4 5.4 5.3 5.4 5.4 5.3 5.2Saskatchewan 4.8 5.2 4.9 4.7 4.0 3.7 3.8 4.0Alberta 6.6 6.5 5.5 4.6 4.7 4.6 4.2 4.0British Columbia 7.7 7.6 7.5 6.8 6.6 6.0 5.9 5.6Canada 8.3 8.0 7.5 7.3 7.1 6.9 6.5 6.3
Housing starts (000)Newfoundland & Labrador 3.1 3.6 3.5 3.9 2.9 2.3 2.2 1.9Prince Edward Island 0.9 0.8 0.9 0.9 0.6 0.5 0.5 0.6Nova Scotia 3.4 4.3 4.6 4.5 3.9 3.0 3.0 3.1New Brunswick 3.5 4.1 3.5 3.3 2.8 2.4 2.3 2.2Quebec 43.4 51.4 48.4 47.4 37.8 39.0 37.0 36.2Ontario 50.4 60.4 67.8 76.7 61.1 58.1 62.0 60.0Manitoba 4.2 5.9 6.1 7.2 7.5 6.4 6.3 6.3Saskatchewan 3.9 5.9 7.0 10.0 8.3 8.6 8.1 8.2Alberta 20.3 27.1 25.7 33.4 36.0 41.3 33.0 34.0British Columbia 16.1 26.5 26.4 27.5 27.1 28.4 28.3 29.0Canada 149.1 189.9 194.0 214.8 187.9 190.0 182.7 181.5
Consumer Price Index (% growth)Newfoundland & Labrador 0.3 2.4 3.4 2.1 1.7 2.1 1.3 2.2Prince Edward Island -0.1 1.8 2.9 2.0 2.0 1.8 1.1 2.0Nova Scotia -0.1 2.2 3.8 1.9 1.2 1.9 1.2 2.1New Brunswick 0.3 2.1 3.5 1.7 0.8 1.5 1.2 2.1Quebec 0.6 1.3 3.0 2.1 0.8 1.4 1.3 2.1Ontario 0.4 2.4 3.1 1.4 1.1 2.4 1.5 2.2Manitoba 0.6 0.8 2.9 1.6 2.3 2.0 1.3 2.1Saskatchewan 1.1 1.3 2.8 1.6 1.4 2.4 1.3 2.1Alberta -0.1 1.0 2.4 1.1 1.4 2.7 1.4 2.2British Columbia 0.0 1.4 2.3 1.1 -0.1 1.2 1.4 2.2Canada 0.3 1.8 2.9 1.5 0.9 2.0 1.4 2.2
f: forecast National Bank, Economy and Strategy Group

ECONOMIC OUTLOOK
ECONOMICS AND STRATEGY GROUP 514-879-2529 Stéfane Marion Chief Economist & Strategist [email protected]
Paul-André Pinsonnault Senior Fixed Income Economist [email protected]
Krishen Rangasamy Senior Economist [email protected]
Marc Pinsonneault Senior Economist [email protected]
Matthieu Arseneau Senior Economist [email protected]
General: National Bank Financial Markets is a business undertaken by National Bank Financial Inc. (“NBF”), an indirect wholly owned subsidiary of National Bank of Canada, and a division of National Bank of Canada. This research has been produced by NBF. National Bank of Canada is a public company listed on Canadian stock exchanges. The particulars contained herein were obtained from sources which we believe to be reliable but are not guaranteed by us and may be incomplete. The opinions expressed are based upon our analysis and interpretation of these particulars and are not to be construed as a solicitation or offer to buy or sell the securities mentioned herein. Canadian Residents: In respect of the distribution of this report in Canada, NBF accepts responsibility for its contents. To make further inquiry related to this report or effect any transaction, Canadian residents should contact their NBF Investment advisor. U.S. Residents: With respect to the distribution of this report in the United States, National Bank of Canada Financial Inc. (NBCFI) is regulated by the Financial Industry Regulatory Authority (FINRA) and a member of the Securities Investor Protection Corporation (SIPC). This report has been prepared in whole or in part by, research analysts employed by non-US affiliates of NBCFI that are not registered as broker/dealers in the US. These non-US research analysts are not registered as associated persons of NBCFI and are not licensed or qualified as research analysts with FINRA or any other US regulatory authority and, accordingly, may not be subject (among other things) to FINRA restrictions regarding communications by a research analyst with the subject company, public appearances by research analysts and trading securities held a research analyst account. All of the views expressed in this research report accurately reflect the research analysts’ personal views regarding any and all of the subject securities or issuers. No part of the analysts’ compensation was, is, or will be, directly or indirectly, related to the specific recommendations or views expressed in this research report. The analyst responsible for the production of this report certifies that the views expressed herein reflect his or her accurate personal and technical judgment at the moment of publication. Because the views of analysts may differ, members of the National Bank Financial Group may have or may in the future issue reports that are inconsistent with this report, or that reach conclusions different from those in this report. To make further inquiry related to this report, United States residents should contact their NBCFI registered representative. UK Residents: In respect of the distribution of this report to UK residents, National Bank Financial Inc. has approved the contents (including, where necessary, for the purposes of Section 21(1) of the Financial Services and Markets Act 2000). National Bank Financial Inc. and/or its parent and/or any companies within or affiliates of the National Bank of Canada group and/or any of their directors, officers and employees may have or may have had interests or long or short positions in, and may at any time make purchases and/or sales as principal or agent, or may act or may have acted as market maker in the relevant securities or related financial instruments discussed in this report, or may act or have acted as investment and/or commercial banker with respect thereto. The value of investments can go down as well as up. Past performance will not necessarily be repeated in the future. The investments contained in this report are not available to retail customers. This report does not constitute or form part of any offer for sale or subscription of or solicitation of any offer to buy or subscribe for the securities described herein nor shall it or any part of it form the basis of or be relied on in connection with any contract or commitment whatsoever. This information is only for distribution to Eligible Counterparties and Professional Clients in the United Kingdom within the meaning of the rules of the Financial Conduct Authority. National Bank Financial Inc. is authorised and regulated by the Financial Conduct Authority and has its registered office at 71 Fenchurch Street, London, EC3M 4HD. National Bank Financial Inc. is not authorised by the Prudential Regulation Authority and the Financial Conduct Authority to accept deposits in the United Kingdom. Copyright: This report may not be reproduced in whole or in part, or further distributed or published or referred to in any manner whatsoever, nor may the information, opinions or conclusions contained in it be referred to without in each case the prior express written consent of National Bank Financial.