World Bank Documentdocuments.worldbank.org/curated/en/699631481178146430/pdf/110818... · its...
63
Nigeria: Methodological Approach for Development of a Target Deposit Insurance Fund Model May 2016 Public Disclosure Authorized Public Disclosure Authorized Public Disclosure Authorized Public Disclosure Authorized
-
Upload
nguyendien -
Category
Documents
-
view
217 -
download
4
Transcript of World Bank Documentdocuments.worldbank.org/curated/en/699631481178146430/pdf/110818... · its...

Nigeria: Methodological Approach for Development of a Target Deposit Insurance Fund Model May 2016
Pub
lic D
iscl
osur
e A
utho
rized
Pub
lic D
iscl
osur
e A
utho
rized
Pub
lic D
iscl
osur
e A
utho
rized
Pub
lic D
iscl
osur
e A
utho
rized
CONFERENCE VERSION
1
Disclaimer
This paper was prepared as part of the World Bank technical assistance project with financial support
from FIRST initiative. Project participants were Julian Casal, Jan Nolte (both World Bank), John O’Keefe
and Alex Ufier (both FDIC) with assistance and support from the Nigeria Deposit Insurance Corporation.
The World Bank has reviewed and approved the findings, interpretations, and conclusions expressed in
this paper. The Government of Nigeria and the Nigeria Deposit Insurance Corporation has not completed
its review of the target fund model framework and project findings and their decision is pending
The views and conclusions expressed here do not necessarily represent those of the United States Federal
Deposit Insurance Corporation.

CONFERENCE VERSION
2
CURRENCY EQUIVALENTS
(Exchange Rate Effective March 24, 2016)
Currency Unit = Nigerian Naira
1 USD = 200 NGN
FISCAL YEAR
January 1 – December 31
ABBREVIATIONS AND ACRONYMS
AMCON Asset Management Corporation of Nigeria CBN Central Bank of Nigeria CP Core Principles for Effective Deposit Insurance Systems DMB Deposit Money Banks ED Exposure at Default e-FASS Electronic Financial Analysis Surveillance System EFCC Economic and Financial Crimes Commission FIU Financial Intelligence Unit GDP Gross Domestic Product IADI International Association of Deposit Insurers LGD Loss Given Default MIC Middle Income Country MOF Ministry of Finance NDIC Nigeria Deposit Insurance Corporation NGN Nigerian Naira NPL Non-Performing Loan PCA Prompt Correcting Action PD Probability of Default ROA Return on Assets ROE Return on Equity USD United States Dollar
Regional Vice President Makhtar Diop
Country Director Rachid Benmessaoud
Global Practice Senior Director Gloria Grandolini
Practice Manager Irina Astrakhan
Task Team Leader Julián Casal

CONFERENCE VERSION
3
Table of Contents
Preface .......................................................................................................................................................... 4
1. Introduction .......................................................................................................................................... 5
2. Overview of the Nigerian Banking Sector and Deposit Insurance Framework ..................................... 5
2.1. Evolution of the Nigerian Banking System .................................................................................... 5
2.2. NDIC .............................................................................................................................................. 7
2.3. Operating environment and target ratio ...................................................................................... 9
3. Previous Literature on Target Insurance Funds .................................................................................. 11
3.1. Loss Distribution Approach ......................................................................................................... 12
3.2. Credit Portfolio Approach ........................................................................................................... 13
3.3. Hybrid Approaches ...................................................................................................................... 14
4. Proposed Target Fund Model ............................................................................................................. 14
4.1. Probability of Bank Failure .......................................................................................................... 14
4.2. Credit Failures ............................................................................................................................. 15
4.3. Monte Carlo Simulations of Credit Failures ................................................................................ 16
4.4. Liquidity Failures ......................................................................................................................... 16
4.5. Systemic Failures ......................................................................................................................... 17
5. Economic States .................................................................................................................................. 17
6. Model Calibration ............................................................................................................................... 18
7. Model Results ..................................................................................................................................... 21
8. Sensitivity Analysis .............................................................................................................................. 22
9. Inherent Weaknesses of Model Assumptions .................................................................................... 23
10. Recommendations and Conclusion .................................................................................................... 24
References .................................................................................................................................................. 26
Appendix A – Insurance Scheme Characteristics ........................................................................................ 28
Appendix B – Asset Return Correlation Measurement ............................................................................... 29
Appendix C – Factor Loadings for Merton-Vasicek Model Risk Factors ..................................................... 31
Appendix D – Bank Value-at-Risk and the Basel II Advanced Approach Capital Requirements ................. 33
Appendix E – Identification of Economic States for DIF Target Fund Simulation Model ........................... 36
Appendix F – Estimating Bank Failure Probability ...................................................................................... 41
Appendix G – Determinants of Nigerian Deposit Insured Fund Losses: Loss Given Default (LGD) ............ 47
Appendix H – Deposit Insurance Function .................................................................................................. 61

CONFERENCE VERSION
4
Preface
Nigeria’s financial sector continues to face challenges in performing its intermediation role and supporting
economic growth. The decline in oil prices in 2015 combined with increased pressure on the exchange
rate has already resulted in banks reporting higher levels of loan non-performance (NPLs) and
rescheduling the loans of their dollar-indebted borrowers. The sector is more resilient than it was during
the 2009 banking crisis given that the Nigerian authorities have implemented a series of measures to
strengthen the banking system and overall financial safety net. As part of this comprehensive effort, the
Nigeria Deposit Insurance Corporation (NDIC) requested technical assistance from the World Bank in
providing a framework to determine an appropriate level of funding for the deposit insurance fund in
order to increase confidence in a key component of the financial safety net.1
In December 2011, with financial assistance from FIRST and an international team of facilitators, NDIC
completed a guided self-assessment of its operations using the International Association of Deposit
Insurers (IADI) Core Principles for Effective Deposit Insurance Systems (CP) as a benchmark. The
assessment identified shortcomings in NDIC’s operational structure and capacity including the absence of
a target fund ratio for the deposit insurance fund (CP 11). The assessment determined that an expert third
party evaluation was needed to develop a fund-targeting framework for the NDIC in line with international
best practices. The assessment also identified a need to evaluate the adequacy of NDIC’s existing fund
and to determine if additional measures were needed to address shortfalls, including special one-time
deposit-insurance premiums or adjustment of premium rates. The assessment recommended
establishment of a target fund ratio and a review of sources of funding in order to determine how best to
reach its target and over what period.
The conclusions of assessment were reinforced by the 2013 IMF-World Bank Financial Sector Assessment
Program (FSAP), which recommended that a target size for the deposit insurance fund should be adopted
taking into consideration its additional mandate to provide financial assistance to facilitate bank-failure
resolution arrangements. The 2013 FSAP also recommended that the NDIC should be exempt from the
Fiscal Responsibility Act requiring it to remit 80 percent of its operating surplus. With a target fund ratio
that considers all necessary factors and that removes the unusual limitation on growing the fund, the NDIC
will be better able to build up its financial capacity.
To prepare this document the task team met with the management and staff of the Nigeria Deposit
Insurance Corporation, the Central Bank of Nigeria and AMCON. The team is grateful for the excellent
cooperation received from all agencies and officials, the logistical support, and their time so generously
provided as part of this work.
1 Prepared by John O’Keefe and Alexander Ufier, both with the U.S. Federal Deposit Insurance Corporation (FDIC) as part of the World Bank-executed technical assistance project financed by FIRST and managed by Julián Casal and Jan Nolte under the guidance of Irina Astrakhan, Practice Manager for Africa in the Finance & Markets Global Practice in the World Bank. The document benefited from comments and suggestions made by Indira Konjhodzic, Cédric Mousset, Nadeem Karmali, Emiko Todoroki, Steven Seelig, and Claire McGuire. The team would like to thank Dr. Jacob Afolabi, Dr. Kabir Katata, Dahiru Yakubu and Ishaya Tarfa of the Nigeria Deposit Insurance Corporation (NDIC) for their valuable collaboration and support.

CONFERENCE VERSION
5
1. Introduction
The appropriate method to determine the adequacy of a given Deposit Insurance Fund (DIF), according to
internationally accepted best practice, is the Target Fund Ratio (or Reserve Ratio). The Target Fund Ratio
is the ratio of the balance in the DIF to estimated insured (or total) deposits in the banking system.
Principle 11 of the IADI Core Principles (CP 11) states that deposit insurers are required to have available
to them all funding mechanisms necessary to ensure the prompt reimbursement of depositors’ claims.
One of the Essential Criteria under CP 11 is that the size of the fund, the “fund reserve ratio”, should be
based on “clear, consistent and well-developed criteria.” Currently, NDIC sets its reserve ratio based on a
formula that may not properly consider future risks as it is based partially on the level of insured deposits
in banks deemed to be in distress.
This paper presents a framework to assist the Nigerian Deposit Insurance Corporation (NDIC) in
determining the target deposit insurance fund for Nigeria’s largest commercial and merchant banks. The
framework takes into consideration the role that credit and liquidity risks play in bank failure as well as
recent changes to bank regulation and crisis management in Nigeria. The remainder of the paper is
organized as follows. Section 2 discusses the recent history of Nigerian banks, particularly events that
affect the NDIC and provides an overview of the overall deposit insurance framework. Section 3 discusses
the previous literature on modeling the target deposit insurance fund. Section 4 presents the proposed
framework for determining the target deposit insurance fund. Section 5 discusses economic conditions
that might influence deposit insurance losses, followed by Monte Carlo simulation model calibration in
Section 6. Section 7 provides the results of target insurance fund estimates. Section 8 presents an analysis
of the sensitivity of target fund estimates to changes in the framework parameters. Section 9 discusses
model assumptions and weaknesses and section 10 concludes. The paper includes eight appendices that
provide detailed discussion of technical aspects of target fund modelling framework and deposit insurance
function.
2. Overview of the Nigerian Banking Sector and Deposit Insurance Framework
2.1. Evolution of the Nigerian Banking System
Between 1994 and 2015 the Central Bank of Nigeria closed 49 Deposit Money Banks (DMBs) with the
majority of closings concentrated in 1998 (27) and 2006 (13). The 1998 and 2006 DMB closings were
largely result of regulatory requirements to enhance bank capitalization.2 The central bank increased
minimum paid-up capital for commercial banks from NGN 20m to NGN 50m in 1990 and for merchant
banks from NGN 12m to NGN 40m relative the year before. Distressed banks whose capital fell short of
the new increased paid-up capital had to end-March 1997 to comply or face liquidation. The authorities
liquidated twenty-six banks in January 1998 (half merchant, half commercial banks). The central bank
2 Alford (2010, 2012), Cook (2011) and Obienusi and Obienusi (2015) discuss the history of the Nigerian banking industry and government reform efforts designed to address chronically undercapitalized and weak banks.
CONFERENCE VERSION
6
subsequently raised the uniform minimum paid-up capital for commercial and merchant banks to NGN
500 million in December 1998.3
Despite this early effort to bolster bank capitalization, the Central Bank of Nigeria implemented additional
reforms in 2004. The key elements of the 13-point reform program included: minimum capital base of
NGN 25 billion by December 2005; consolidation of banking institutions through mergers and acquisitions;
phased withdrawal of public sector funds from banks; adoption of a risk-focused and rule based regulatory
framework; zero tolerance for weak corporate governance, misconduct and lack of transparency;
accelerated implementation of the Electronic Financial Analysis Surveillance System (e-FASS); the
establishment of an Asset Management Company; promotion of the enforcement of dormant laws; and
closer collaboration with the Economic and Financial Crimes Commission (EFCC).4
From 2004 and 2007, CBN reduced the number of commercial banks from 89 to 25 through closures and
mergers.5 In 2002, all Nigerian commercial banks had received licenses as universal banks using the
European banking model. The universal banking model allowed banks to offer loans collateralized by
equity securities and banks’ exposures to margin loans contributed to the extraordinarily high non-
performing loan levels seen in 2007–2009. After a special examination of 10 of banks in late 2009, CBN
disclosed that five banks that held one third of industry deposits were insolvent and that three additional
banks, while solvent, still required additional capital. Nigeria responded to the financial crisis in much the
same way as other countries, with central bank and government support programs for banks that
provided for recapitalization, liquidity, government guarantees of all deposits and interbank lending, as
well as the establishment of the Asset Management Corporation of Nigeria (AMCON). AMCON’s role is to
purchase non-performing loans from banks and allow banks to focus on lending activities rather than the
management of problem credits.6 These and other support programs were successful in restoring the
Nigerian banking industry to health by 2014.
Nigeria enacted numerous regulatory reforms designed to promote banking industry growth while
recognizing the stabilizing influences of competition, transparency and accountability. The CBN has
restricted permissible banking activities, eliminating equity margin loans and expanded the types of bank
licenses to allow banks to specialize in different activities. The CBN has strengthened its supervisory
enforcement and adopted International Financial Reporting Standards (IFRS) for all banks as of end-2012.
Nonetheless, the financial sector is now under considerable strain due to its sizeable exposure to the
3 See “Banking Reforms and the Nigerian Economy, 1990 – 2007”, Historical Research Letter by Obienusi,
Ihuoma and Obienusi, E. A , ISSN 2224-3178 (Paper) ISSN 2225-0964 (Online),Vol 21 (2015), p. 27. 4 See “Banking Reforms and the Nigerian Economy, 1990 – 2007”, Historical Research Letter by Obienusi,
Ihuoma and Obienusi, E. A , ISSN 2224-3178 (Paper) ISSN 2225-0964 (Online),Vol 21 (2015), p. 31. 5 See “Nigerian Banking Reform: Recent Actions and Future Prospects” (April 2010) by Duncan E. Alford,
Social Science Research Network Working Paper. 6 See “Reform of the Nigerian Banking System: Assessment of the Asset Management Corporation of
Nigeria (AMCON) and Recent Developments” (February 2012) by Duncan E. Alford, Social Science
Research Network Working Paper.

CONFERENCE VERSION
7
decline in revenue from oil exploration. Bank loans to the oil sector represents 24 percent of total loans
as of end of June 2014 and there is significant indirect exposure through lending to oil industry suppliers.
Banks are also exposed to currency risk from their portfolio of FX-denominated loans, which appeared
affordable in terms of interest, but only at stable exchange rates. As a result, the quality of bank loan
portfolios remains highly vulnerable to the decline in oil prices and resultant pressure on the naira.
Nigeria also has a large number of Microfinance Banks that increased in number from 66 to 825 between
1991 when licenses were first issued and 2013. In addition, Nigeria licenses Primary Mortgage Banks that
increased in number from 23 to 82 between 1991 (licenses first issued) and 2013. The authorities
established a separate deposit insurance fund for Microfinance and Primary Mortgage Banks.
Recent changes to law have also enhanced the NDIC’s ability to close banks, liquidate bank assets and
reimburse insured depositors. While Nigeria’s financial stability framework still permits substantial
government support and open bank assistance to banks, the framework seeks to reduce moral hazard by
enacting prompt correcting action triggers that require supervisory intervention for solvent but poorly
capitalized banks, limits government lending and liquidity support to viable, solvent banks and calls for
the closing of all non-viable banks by NDIC.
2.2. NDIC
NDIC is responsible for insuring deposits held with licensed banks and other deposit taking institutions
including Deposit Money Banks, Microfinance Banks and Primary Mortgage Banks in order to increase
public confidence in the Nigerian banking system. Membership in NDIC is mandatory for all deposit-taking
institutions, and it covers all deposits with certain stated exceptions. The coverage limit is variable with
limits of NGN 500,000 per accountholder for Deposit Money Banks and NGN 200,000 for other deposit-
taking institutions on a netted basis.
NDIC establishes and collects annual premia from member institutions and manages the Deposit
Insurance Fund (DIF) set aside to reimburse insured deposits lost due to the failure of a financial institution
and to cover failure-resolution costs. In addition to its deposit insurance responsibilities, NDIC shares
supervisory responsibilities with the CBN, and it is the key resolution and liquidation authority. NDIC has
the power to conduct on-site examinations of insured institutions together with the CBN and has the
authority to take enforcement actions. NDIC is also the lead resolution authority for failing banks, with
resolution actions to be taken in consultation with the CBN. It also has authority to provide financial
assistance or purchase assets from a failing bank and the ability to act as a receiver.
Deposit insurance coverage levels appear broadly appropriate. As of 2014, the NDIC estimates that out of
NGN 18 trillion in total deposits about NGN 2.3 (13 percent) were insured, fully covering 97 percent of all
depositors. However, deposit figures in Nigeria and other resource exporters can be distorted because of
the presence of sizable government (oil-related) deposits in the banking system. Starting in 2016, the
CONFERENCE VERSION
8
authorities have consolidated all government deposits in a single account at the central bank, which will
reduce total deposits and overall liquidity in the banking system.7
NDIC employs a risk-adjusted insurance premia to fund its deposit insurance fund. NDIC charges banks
with a base rate of 0.30 percent of insured deposits for all banks and a risk premium that ranges from 0
to 0.30 percent depending on a bank’s prudential risk profile. In 2014, the DIF had funds equivalent to
NGN 614 billion equivalent to 3.4 percent of total deposits. NDIC invests in government securities, which
are the only eligible investment categories (holdings are approximately 40 percent in T-bills and 60
percent in Federal Bonds). In case of depletion of the DIF, NDIC can raise insurance premia (up to 200
percent) and has access to a credit line with the CBN.
The investment income on the DIF is used to fund the NDIC’s operating costs. Since the enactment of the
Fiscal Responsibility Act in 2007, NDIC is required to remit back 80 percent of its operating surplus
(investment income generated on the DIF minus operating expenses) to the Federal Government, which
slows down the accumulation of funds.
NDIC implemented a differential premium assessment system (DPAS) for Deposit Money Banks in 2008
but has retained flat-rate premiums for Microfinance and Primary Mortgage Banks. The current DPAS
system is comprised of a flat-rate base premium of 30 basis points with premium “add-ons” based on
quantitative and qualitative risk factors. The maximum total premium “add-on” is 30 basis points resulting
in a maximum total premium of 60 basis points as of April 2016. The assessment base is total deposits.8
The quantitative component of DPAS uses bank financial ratios that measure banks’ capital adequacy,
asset quality and liquidity, where each financial ratio is evaluated based on tiered ranges of values. The
poorer a bank’s condition suggested by DPAS financial ratios, the greater the number and magnitude of
premium “add-ons”. The qualitative component of DPAS uses bank examiners’ evaluations of banks’
internal controls, financial reporting timeliness and accuracy, risk management and compliance with bank
examiners’ recommendations. Each qualitative area is evaluated and if the finding is that the bank is
performing poorly in that area, a premium “add-on” is charged. NDIC states that they designed DPAS with
the goals of premium accuracy, simplicity, transparency in mind, as well as to encourage better risk
management at banks.
DFAS is a non-statistical scorecard and uses financial ratios and qualitative factors found to influence bank
safety and soundness in many jurisdictions. While NDIC did not disclose how DPAS was developed, the
scorecard structure suggests that DPAS financial ratios’ thresholds and premium “add-ons” were
7 In September 2015, the Government consolidated all government accounts on a single account at the
CBN (the Treasury Single Account). To compensate banks for the reduction in liquidity the CBN lowered
the cash reserve ratio (CRR) from 75 percent on public deposits to 20 percent.
8 See NDIC website for current DPAS structure at http://ndic.gov.ng/deposit-insurance/#tab-1-4

CONFERENCE VERSION
9
developed by subject matter experts. The relative size of flat rate and differential premiums as a share of
a bank’s total premiums also appears to have been decided by expert judgment.
A statistical analysis of the effectiveness of DPAS is beyond the scope of this study, however, it would be
fairly straightforward to test DPAS’s ability to detect banks well before they fail using historically paid
premiums, and to test whether DPAS also identifies banks with high failure-resolution costs. Given
sufficient historical data on bank failures and financial condition, the current scorecard can be statistically
evaluated. Statistical modelling of DPAS would better support the criteria used to determine premium
“add-ons” as well as the magnitude of each “add-on”.
2.3. Operating environment and target ratio
In general, the two main public policy objectives of a deposit insurer are to reimburse depositors and to
contribute to the stability of a financial system. To achieve these objectives and to build public confidence
in a deposit insurance system, the system has to have operational readiness to be able to act quickly after
a bank failure.
Sound funding arrangements are essential aspects of such readiness as they ensure prompt
reimbursement of depositors. Depositor confidence depends, in part, on knowing that adequate funds
for deposit insurance would always be available to ensure the prompt reimbursement of their claims. It is
therefore considered a best practice to build credible ex ante funding mechanisms which have available
the financial capacity to ensure that these obligations are met.
IADI, the international standard setter in the field of deposit insurance, recommends the following:
i. A deposit insurer should determine the appropriate target level of its deposit insurance fund on
the basis of clear and well-developed criteria that are consistent with their obligation.
ii. The appropriate target level should be determined based on relevant and readily available data,
and a well understood and transparent methodology and approach.
iii. Furthermore, the deposit insurers should set a reasonable time frame to achieve the expected
target level of the deposit insurance fund. In setting appropriate premium rates that facilitate the
accumulation of funds, deposit insurers should take into consideration the current and expected
outlook of the operating environment, as well as the financial impact on individual banks and on
the banking industry as a whole.
iv. The level of ex ante deposit insurance funds should not be static. Deposit insurers should
periodically review and validate the methodology and approach, and the models used to
determine the adequacy of the fund level, for example, when the operating environment changes.
The funding needs of a deposit insurer and its target level are directly influenced by the environment,
within which the deposit insurer operates, which in turn is dependent on the resilience of the financial
system, the soundness of the regulatory and supervisory regime, the interrelationship between financial
safety-net participants, and the financial strength of member banks.
The operating environment influences the deposit insurer’s ability to fulfill its mandate, determines in
part its effectiveness in protecting depositors, and has implications on its funding needs. For example, an
CONFERENCE VERSION
10
effective bank-failure resolution framework can resolve banks at a lesser cost and therefore limit the
contribution of a deposit insurer.
The operating environment includes:
i. The soundness of a financial system influences the appropriate funding needs of a deposit
insurance system. It includes the health of banks based on capital adequacy, liquidity and credit
quality of the financial system.
ii. The strength of prudential regulation and supervision has an influence as well. Strong prudential
regulation and supervision ensure that an institution’s weaknesses are promptly identified and
corrected. Implementation of corrective measures should be monitored and, where deficient,
early intervention and an effective resolution regime help to lower the costs associated with bank
failures. In the absence of strong regulation and supervision, the risks to the deposit insurer
cannot be fully mitigated. Intervention in weak banks comes late, increasing the cost of bank-
failure resolution.9
iii. Effective bank insolvency laws include a special resolution regime for banks that is separate from
the general corporate insolvency laws. Resolution authorities should act in a timely manner,
limiting contagion and maintaining financial stability. Such a regime would allow the resolution
authority under a least cost rule to use resolution tools as bridge bank or a purchase and
assumption (P&A) transactions, as well as appoint an administrator and/or liquidator.
iv. Strong information exchange and coordination within the safety-net based on formal
agreements or memoranda of understanding (MOUs) and supported by bodies such as a Financial
Stability Council ensure that resolution actions are taken in a swift manner. Contingency planning
within this group supports readiness to react to institutions in distress or a broader financial crisis.
v. The legal framework ensures that norms for the financial sector exist and are enforced. The legal
system should be supported by a well-functioning judiciary.
vi. Sound accounting and disclosure regimes are necessary for the effective evaluation of risks by
deposit insurance systems. Accurate, reliable and timely information ensure that sound decisions
are made regarding the risk profile of an institution, and thereby increase market, regulatory and
supervisory discipline.
While the determination of a target level for the deposit insurance fund supports its operational
readiness, it should be kept in mind that it cannot substitute for sound emergency liquidity arrangements
or provide funding for a wider financial crisis.
Adequate emergency liquidity funding arrangements to cover are important and a critical component of
a deposit insurer’s funding framework. Such liquidity funding arrangements should be explicitly set out in
law or regulation, and appropriate arrangements should be set up in advance to ensure effective and
timely access, when required.
9 The paper focuses on deposit insurer costs, but a poorly run financial sector increases burdens on both public and private sectors. Uninsured claimants suffer and the lack of credit availability reduces wealth in general.

CONFERENCE VERSION
11
Deposit insurers are responsible for the protection of depositors who hold insured deposits in the event
of a bank failure or a wave of failures. Systemic failure or crisis are typically addressed by all financial
safety-net players, led by the financial authorities (normally the finance ministry and central bank, in
coordination) and deposit insurers are not usually structured to deal with a systemic events.
An ex-ante deposit insurance fund is only one component of the deposit insurance system and financial
safety net as a whole. Other components of the deposit insurance system – such as insurance premiums,
back-up liquidity arrangements, prudential regulations, special resolution authorities, transparency of
financial reporting and coordination among safety net authorities discuss above — influence the target
fund level, however, the target fund itself does not, in turn, influence the effectiveness of these
components of the deposit insurance system.
3. Previous Literature on Target Insurance Funds
There is a vast literature on deposit insurance that examines all elements of deposit insurance schemes—
supporting legal and regulatory systems, insurance coverage, bank-failure resolution, deposit insurance
pricing and optimal insurance fund levels. IADI has examined this literature and in turn published a series
of papers on deposit insurance system design that incorporates their own experiences.
The immediate question addressed by this literature is “how should the deposit insurer pay for bank-
failure resolution and related insurance costs?” IADI (2009) discusses three funding options: 1) funding
used to resolve a bank failure that is received prior to the bank’s failure (ex ante funding), 2) funding
received after the bank’s failure (ex post funding); and 3) hybrid approaches that combine ex ante and ex
post funding. There are pros and cons to each funding alternative. Ex ante funding can help avoid delays
in bank closings and resolutions that can increase deposit insurance costs. Ex ante funding also improves
public confidence in the deposit insurance system, thereby, preventing bank runs. When ex ante insurance
is funded by deposit-insurance premiums, the funding system is arguably fairer since all banks support
the insurance fund, including those that eventually fail. If risk-related insurance premiums are used to
fund deposit insurance, the system can also act to penalize and possibly reduce risky behavior by bank
management. Finally, ex ante funding can reduce pro-cyclicality in bank profits and deposit insurance fund
levels by funding expected failure-resolution costs through insurance premiums when banks are better
able to bear the costs.
The disadvantages of ex ante funding result from the opportunity costs imposed on banks paying
insurance premiums in advance of failure costs. For jurisdictions with relatively small banking sectors, it
may not be feasible to collect sufficient ex ante insurance premiums to fully fund the deposit insurer
within a reasonable time period. Ex ante funding also imposes administrative costs associated with
managing and maintaining a deposit insurance fund. Finally, IADI (2009) states that ex ante funding might

CONFERENCE VERSION
12
exacerbate the moral hazard problem by reducing incentives for banks to police excessive risk taking by
peers.10
IADI (2009) states that most deposit insurance funding schemes combine elements of ex ante and ex post
funding. If the deposit insurer is facing a severe financial crisis it may be preferable from a social welfare
perspective to spread failure-resolution cost recovery over both pre- and post-crisis periods. High
insurance premiums collected as an emergency response during a crisis can exacerbate the crisis and
protract an economic recession. If public sector support is available during a recession, either on a back-
up or temporary basis, it may be preferable to use a hybrid funding approach, maintaining an ex ante fund
that is supplemented by the central government during severe crises. IADI (2009) concludes that the
benefits of ex ante funding outweigh the costs and that ex ante funding of deposit insurance is preferred
to ex post, especially for recently established deposit insurance systems.11 Given the possibility that the
deposit insurer may face a severe financial crisis, IADI (2009) concludes that as a practical matter the
funding choice can best be characterized by how much reliance is placed on ex ante versus ex post funding.
Given the potential benefits of ex ante over ex post funding, IADI (2009) states that the target deposit
insurance fund should, at a minimum, be adequate to absorb insurance losses the insurer might incur
under “normal” circumstances.
There are many factors that influence potential insurance losses and by extension the target fund level.
IADI (2009) states that the target fund level should take into consideration the number and size
distribution of insured banks, banks’ portfolio composition and the potential influence of other
components of the financial sector safety net on deposit insurance losses. IADI (2014) updates the core
principles for effective deposit insurance systems to reflect the experience of deposit insurers during the
2007- 2009 global financial crisis. IADI (2014) re-iterates the importance of an adequate, ex ante deposit
insurance fund in allowing the deposit insurer to promptly reimburse insured depositors. IADI (2014) also
states that an essential criteria for the determining whether the deposit insurer had adequate funding
and resources is that …“the target fund size is determined on the basis of clear, consistent and
transparent criteria, which are subject to periodic review.”12
3.1. Loss Distribution Approach
IADI (2009) states that the majority of countries use their historical experience with bank-failure losses to
determine the target deposit insurance fund. Given sufficient data on failure costs a deposit insurer can
estimate the empirical frequency distribution of losses and use that distribution to determine the level of
losses the insurance fund should be able to absorb. This approach to determining the target deposit
insurance fund is known as the Loss Distribution Approach.
10 Ex post funding’s advantages and disadvantages are, for the most part, the reverse of those for ex ante
funding schemes, so we do not discuss them separately. 11 IADI (2009) states that 80 percent of deposit insurance schemes at that time used ex ante funding. 12 See “IADI Core Principles for Effective Deposit Insurance Systems”, November 2014, p.29.

CONFERENCE VERSION
13
As a practical matter, to estimate an empirical frequency distribution of deposit insurance losses one will
need a history of insurance losses that includes one or more business cycles. Countries with limited
experience closing failed banks will lack sufficient data to develop an accurate empirical loss distribution
and may have difficulty estimating the likelihood of low-probability, high-loss events. As a consequence,
practitioners calibrate observed losses to an assumed probability distribution of losses. This calibration
serves to fill gaps in observed empirical frequency distribution of losses and is particularly important in
the treatment of low-probability, high-loss events.
IADI (2009) points out that while the Loss Distribution Approach is intuitively appealing, it is backward
looking and, therefore, cannot take into consideration recent changes in the banking industry risk profile.
A forward looking alternative to the Loss Distribution Approach is the Credit Portfolio Approach that
allows one to incorporate the effect of current economic conditions on deposit insurance losses.
3.2. Credit Portfolio Approach
The Credit Portfolio Approach to modeling the target deposit insurance fund is based on the model of
bond pricing by Merton (1974) and the loan portfolio model of Vasicek (1987, 1991 and 2002), hereafter
the Merton-Vasicek Model. Merton (1974) develops a model for the pricing of corporate bonds that takes
into account the possibility the issuing firm might default on coupon and principle payments. Merton
(1974) presents the simple case of a corporation financed by a single bond and equity. In the model
bondholders have a claim on all of the corporation’s assets should the corporation default on bond
payments while equity holders receive nothing. Merton recognizes that bond holders have a call option
of the value of the firm’s assets, therefore, bonds can be priced using the Black and Scholes (1973) option
pricing framework. Under Merton’s approach, a firm fails when the market value of firm’s assets (call
option value of the bond) falls below the nominal value of the firm’s obligations to bond holders. Merton
recognized this default model generalizes to failures occurring when the market value of a corporation’s
assets falls below the nominal value of the corporation’s liabilities and all of the corporation’s creditors
can be viewed as having a call option on the corporation’s assets.
Vasicek (1987, 1991 and 2002) generalizes the Merton (1973) framework to model losses on loan
portfolios. Like Merton, Vasicek also assumes loan default occurs when the market value of the obligor’s
assets falls below the nominal value of the obligor’s obligations to debt holders. Vasicek assumes obligors’
asset value changes are determined by idiosyncratic and systematic risk factors. The systematic risk factor
is common to all obligors (i.e., the state of the economy). In the Vasicek model changes in the value an
obligor’s assets are correlated with that of other obligors through the common risk factor. Finally, the
correlation among obligors’ asset values changes determines the correlation among obligor defaults. The
possibility of correlated default events is particularly important to models of the target deposit insurance
fund.
The Merton-Vasicek Model assumes that the features of the financial safety net that can influence deposit
insurance costs are captured in historical data and do not change over the forecast horizon; see Appendix
A for a brief discussion of these safety net issues. As we will show in the section 4 the Merton-Vasicek
CONFERENCE VERSION
14
Model allows for a forward looking view of banking industry risk through separate estimates of bank
probability of failure, correlation in failures, insurer exposure and losses given failure.
The Merton-Vasicek Model has been used to model the target deposit insurance fund for many countries.
Recent examples are Colombia (Fogafin, 2013), Canada (CDIC, 2011), Singapore (Oliver, Wyman &
Company, 2002) and an earlier application to Nigeria (Katata and Ogunleye, 2014).
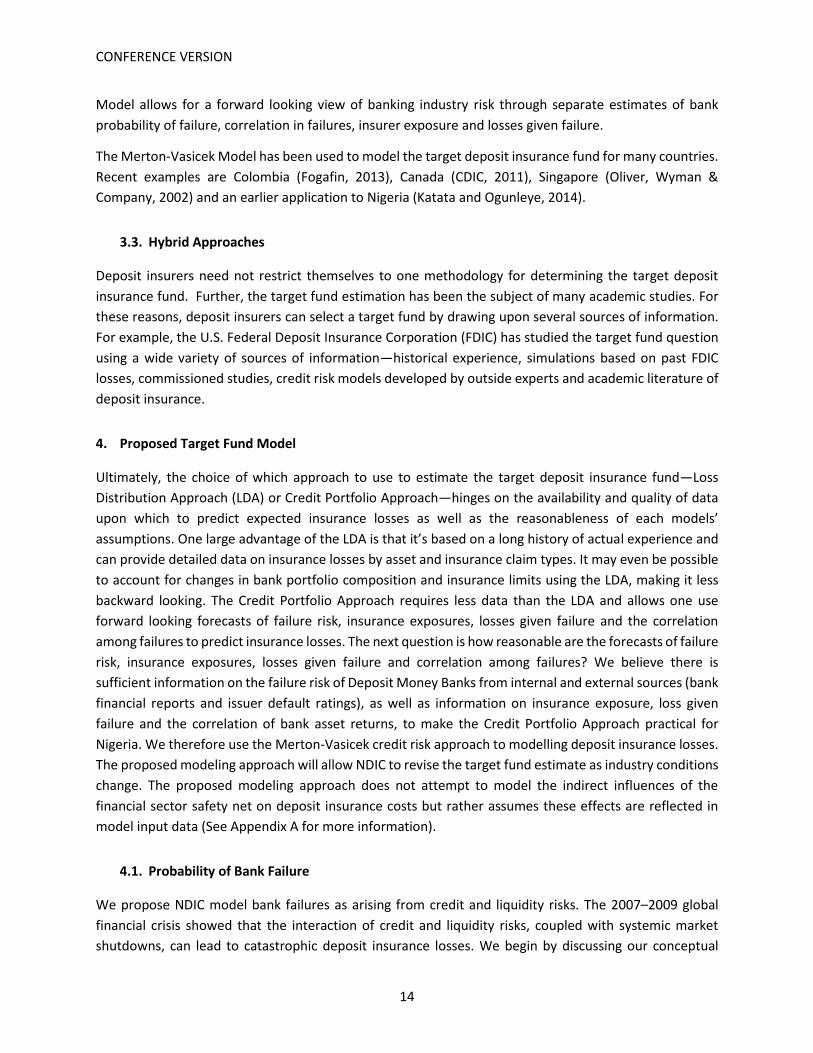
3.3. Hybrid Approaches
Deposit insurers need not restrict themselves to one methodology for determining the target deposit
insurance fund. Further, the target fund estimation has been the subject of many academic studies. For
these reasons, deposit insurers can select a target fund by drawing upon several sources of information.
For example, the U.S. Federal Deposit Insurance Corporation (FDIC) has studied the target fund question
using a wide variety of sources of information—historical experience, simulations based on past FDIC
losses, commissioned studies, credit risk models developed by outside experts and academic literature of
deposit insurance.
4. Proposed Target Fund Model
Ultimately, the choice of which approach to use to estimate the target deposit insurance fund—Loss
Distribution Approach (LDA) or Credit Portfolio Approach—hinges on the availability and quality of data
upon which to predict expected insurance losses as well as the reasonableness of each models’
assumptions. One large advantage of the LDA is that it’s based on a long history of actual experience and
can provide detailed data on insurance losses by asset and insurance claim types. It may even be possible
to account for changes in bank portfolio composition and insurance limits using the LDA, making it less
backward looking. The Credit Portfolio Approach requires less data than the LDA and allows one use
forward looking forecasts of failure risk, insurance exposures, losses given failure and the correlation
among failures to predict insurance losses. The next question is how reasonable are the forecasts of failure
risk, insurance exposures, losses given failure and correlation among failures? We believe there is
sufficient information on the failure risk of Deposit Money Banks from internal and external sources (bank
financial reports and issuer default ratings), as well as information on insurance exposure, loss given
failure and the correlation of bank asset returns, to make the Credit Portfolio Approach practical for
Nigeria. We therefore use the Merton-Vasicek credit risk approach to modelling deposit insurance losses.
The proposed modeling approach will allow NDIC to revise the target fund estimate as industry conditions
change. The proposed modeling approach does not attempt to model the indirect influences of the
financial sector safety net on deposit insurance costs but rather assumes these effects are reflected in
model input data (See Appendix A for more information).
4.1. Probability of Bank Failure
We propose NDIC model bank failures as arising from credit and liquidity risks. The 2007–2009 global
financial crisis showed that the interaction of credit and liquidity risks, coupled with systemic market
shutdowns, can lead to catastrophic deposit insurance losses. We begin by discussing our conceptual

CONFERENCE VERSION
15
approach to simulating bank failures caused by credit risk, followed by descriptions of the interaction of
credit and liquidity risks.
4.2. Credit Failures
For the purposes of this discussion, obligor default is synonymous with bank insolvency or failure. As
stated previously, in the Merton-Vasicek Model obligors are assumed to default when their wealth or total
asset value falls below that of their outstanding liabilities. Equation 1 expresses an asset’s one-period
gross return as a weighted average of systematic and idiosyncratic risk measures. In equation 1, Ri is the
one-period asset return, wi is the weight placed on a single systematic risk factor, X, and ni is the weight
placed on idiosyncratic risk factor, Ei. All obligors face the same systematic risk and while X can be a set of
several risk measures Gordy (2000) shows these risks can be reduced to one systematic risk factor.
Conversely, each obligor i has different idiosyncratic risk, Ei.13
𝑅𝑖 = 𝑤𝑖 ∗ 𝑋 + 𝑛𝑖 ∗ 𝐸𝑖 (1)
Without loss of generality the Merton-Vasicek Model assumes that X and Ei are standard normal random
variables, hence asset returns, Ri, are also distributed as standard normal random variables.14 As we shall
see in subsequent sections of this paper the use of standard normal random variables greatly simplifies
quantification of insurance losses.15 Obligor default occurs when the change in the value of their assets is
less than or equal to some critical value, Ci:
𝑤𝑖 ∗ 𝑋 + 𝑛𝑖 ∗ 𝐸𝑖 ≤ 𝐶𝑖 (2)
A more common representation of the asset return model is shown is equation 3.
𝑅𝑖 = √𝜌 ∗ 𝑋 + √1 − 𝜌 ∗ 𝐸𝑖 (3)
In equation 3 the term ρ is the correlation between firms’ asset returns and is assumed to be identical
across any two firms. Appendices B and C provide further information of the theory and motivation behind
the asset return correlation’s relevance for bank-failure modeling and Appendix D discusses the Merton-
Vasicek Model, as applied by the Basel II Advanced Approach capital standards. We next describe the
asset return and failure simulation process in general terms; specifics on model calibration are presented
in section 5.
13 This discussion of asset return process is based largely on Gordy (2000). Gordy shows that one can view the asset return generation process as being driven by a latent variable that is also determined by systematic and idiosyncratic risks. 14 Standard normal random variables are normalized by subtracting the mean value of the variable and dividing this difference by the standard deviation. Hence, a standard normal random variable has a mean of zero and standard deviation of one. 15 Notice, equation 1 does not include a time subscript since the default model is a one period model.

CONFERENCE VERSION
16
4.3. Monte Carlo Simulations of Credit Failures
To create an NDIC loss distribution we must first create a frequency distribution of bank failures using a
Monte Carlo simulation of asset returns. Rather than comparing simulated bank asset returns and ending
asset values to those of liabilities, the Monte Carlo simulation takes a more straightforward approach to
simulating failure events; failures are assumed to occur whenever a randomly chosen asset return is more
negative than that implied by the bank’s expected failure probability.
Using the assumptions of the Merton-Vasicek Model the asset return associated with an expected failure
probability can be obtained by taking the inverse of the cumulative standard normal density function,
evaluated at that failure probability, as shown is equation 4:
𝑅𝑖 = Φ−1(𝐸𝑥𝑝𝑒𝑐𝑡𝑒𝑑 𝐹𝑎𝑖𝑙𝑢𝑟𝑒 𝑃𝑟𝑜𝑏𝑎𝑏𝑖𝑙𝑖𝑡𝑦𝑖) (4)
Using this approach, we are assured that the simulated failure rate for each bank out of say 50,000 random
draws of asset returns equals the expected failure probability. We use two sources of information on
expected failure probabilities—a logistic regression model of bank failure and the bank failure rates
associated with banks’ issuer default ratings.
We use the Merton-Vasicek Model assumptions to randomly sample asset returns. Specifically, we
generate asset returns by taking random draws of values of the idiosyncratic and systematic risk factors
in equation 3. Next, we use an estimate of the correlation in bank failures based on bank stock return
correlations to weight the risk factors and sum the weighted terms to get a single random draw of the
asset return. As shown in equation 5, bank failure is assumed to occur whenever the simulated asset
return is more negative than that implied by the failure probability estimate. As stated at the beginning
of this section, equation 5 only refers to credit failure events.
𝐼𝑓 𝑅𝑖 < Φ−1(𝐸𝑥𝑝𝑒𝑐𝑡𝑒𝑑 𝐹𝑎𝑖𝑙𝑢𝑟𝑒 𝑃𝑟𝑜𝑏𝑎𝑏𝑙𝑖𝑡𝑦𝑖) 𝑡ℎ𝑒𝑛 𝐵𝑎𝑛𝑘 𝑖 𝐹𝑎𝑖𝑙𝑠 (5)
We calibrate the systemic risk factor to the Nigerian economy using the mean and standard deviation of
the annual GDP growth rate between 1983 and 2013. Since the idiosyncratic risk factors are standard
normal random variables, we generate failure events by random draws from the weighted sum of a
normal random variable and a standard normal random variable and using expected failure probabilities
to determine the failure threshold for asset returns.
4.4. Liquidity Failures
Banks rely on a variety of short-term funding sources and interruption in funding can make it impossible
for banks to continue operations. This was the case during the 2007–2009 global financial crisis when
many banks found interbank lending and loan securitization markets froze as a result of heightened
uncertainty about banks’ conditions. Without central bank liquidity and other support programs many of
the largest banks in the U.S. and other countries faced failure. We consider the possibility of liquidity
failures by assuming that banks will lose a significant portion of uninsured deposits and other short-term
funding if their asset returns place them “near” credit failure status. The near credit failure threshold is
admittedly subjective. We assume a near-credit-failure event occurs whenever the asset loss is 90 percent

CONFERENCE VERSION
17
or more of that which would cause a credit failure, excluding the previously discussed credit failures, as
shown in equation 6.
𝐼𝑓 0.90 ≤𝑅𝑖
Φ−1(𝑃𝐷𝑖)< 1.0 𝑎𝑛𝑑 𝑅 < 0 𝑡ℎ𝑒𝑛 𝑏𝑎𝑛𝑘 𝑖 𝑖𝑠 𝑎 𝑙𝑖𝑞𝑢𝑖𝑑𝑖𝑡𝑦 𝑓𝑎𝑖𝑙𝑢𝑟𝑒 (6)
In simpler terms, equation 6 increases bank failure rates to account for the possibility that liquidity failures
will occur. As discussed in section 2, Nigeria has adopted more stringent rules for liquidity support, limiting
it to viable banks. We defer further discussion of the measurement of liquidity failure rates to section 5
on model calibration.
4.5. Systemic Failures
In addition to the credit and liquidity risks banks face, there is the possibility of a systemic event that
disrupts the operations of all banks. We model systemic risk as arising from a loss of confidence in short-
and long-term interbank lending for all Nigerian banks, including lending by non-Nigerian banks to
Nigerian banks. All interbank lending is assumed to cease at the point where borrowing lost due to all
individual credit and liquidity failures is at least 30 percent of total interbank borrowing. We also consider
the importance of interbank borrowing to each bank and if the lost funding is at least 10 percent of the
bank’s assets the bank is assumed to fail due to the market-wide loss of interbank funds.
The proportions of simulated bank failures due insolvency, illiquidity and systemic events are 60%, 38%
and 2%, respectively. These proportions depend on the previously discussed assumptions about that
trigger each event as well as banks’ financial condition, particularly, capital adequacy and liquidity.
5. Economic States
Banking market conditions are influenced by economic conditions in the real sector of the economy and
real sector conditions are, in turn, influenced by conditions in the financial sector, especially credit
availability. In order to develop a robust estimate of deposit insurance fund adequacy we, therefore,
consider how deposit insurance losses vary under different macroeconomic conditions. Specifically, we
consider three states of the economy—a severe economic downturn, through-the-business cycle and
current conditions—and simulate NDIC losses from failed DMBs under each state of the economy.16 Our
approach to identifying the economic periods and states are discussed in Appendix E. Where possible, we
will calibrate the simulation model inputs to data from each of these three economic periods. Table 1
presents the three economic periods used to calibrate the target fund simulation model.
Table 1. Crisis Period and Business Cycle Identification
Crisis 2000–2009
Current (Most Recent Two Years) 2013–2014
Through the Cycle (Past Seven Years) 2008–2014
16 These three views of the economy are designed to show variation in potential deposit insurance losses and are similar in spirit to the views of the economy used in mandatory capital stress-tests for U.S. banks.

CONFERENCE VERSION
18
6. Model Calibration
Estimating the NDIC loss distribution using the Monte Carlo simulation model requires estimates of four
parameters—probability of default, loss given default, exposure at default, and correlation of default. We
next discuss alternative approaches to measuring each of these model inputs; details on the calibration
of model parameters are discussed in Appendices F and G.
1) Probability of Default (PD): NDIC provided data on all DMB closings since 1994; there were 48 closed
DMB’s between 1994 and 2006, and one closure in 2013. Nigeria provided capital support to DMBs in
recent years; hence there were no DMB closures between 2007 and 2012. Based on these data we
considered the following approaches for estimating bank failure probabilities:
a) Industry failure rates based on annual closings are available for the 2000–2009 crisis period
but insufficient closings occurred during the current (2013–2014) and through-the-cycle
(2008–2014) periods with which to calibrate failure risk. The actual bank closings between
1994 and 2009 are highly concentrated into a few years (1998, 2006) following major
government consolidation initiatives,17 with most years having no failures, as shown in table
2. Because of the damping effect that government assistance programs and industry
consolidation had of bank closings, and the highly concentrated closings, we do not use recent
past actual failure rates to measure bank failure risk.
17 Cook, Lisa. Were the Nigerian Banking Reforms of 2005 A Success...And for the Poor?
http://www.nber.org/chapters/c13361.pdf and Obienusi, Ihuoma and Obienusi, E. A , Banking Reforms and
the Nigerian Economy, 1990 – 2007, IISTE historical Research Letter Vol 21 (2015.)

CONFERENCE VERSION
19
Table 2. Deposit Money Bank Closings: 1998–2015
b) Statistical predictions of bank failure probabilities based on models of the relationship
between bank financial condition and failure events are not possible since we lack bank
financial data during the periods where we observe bank closings (1994–2006). As an
alternative, we modelled the likelihood of banks becoming critically undercapitalized (i.e., less
than 2% equity and reserves-to-assets ratio) using bank financial data between 2009 and
2014. The statistical model can be used to predict the likelihood of failure using banks’ current
financial statements and can provide estimates of each bank’s probability of default for the
current period; unfortunately, the statistical failure model cannot provide failure risk
estimates for the entire crisis and business cycle periods. We discuss the statistical bank-
failure prediction model in detail in Appendix F.
c) Implied failure risk from issuer default ratings have been used to model bank failure risk in
many jurisdictions where actual closings are infrequent. We use the implied failure rates
associated with DMBs’ issuer default ratings based on DMBs’ current issuer default ratings
and the failure rates these imply based on an analysis by FitchRatings. This approach is
explained in detail in Appendix F. One weakness of this approach is that not all DMBs have
issuer default rates and not all rated banks are rated by FitchRatings, however, implied failure
rates are available from 1990 to 2011.
Year
Number of
DMB closings
1994 4
1995 1
1996 0
1997 0
1998 27
1999 0
2000 2
2001 0
2002 0
2003 1
2004 0
2005 0
2006 13
2007 0
2008 0
2009 0
2010 0
2011 0
2012 0
2013 1
2014 0
2015 0
Total 49

CONFERENCE VERSION
20
Table 3 shows the data availability for each proposed approach to estimating DMB failure risk. As table 3
indicates, we can use the logit model predicted failure rates when issuer default ratings are not available
in the current period.
Table 3. Proposed Approaches for Bank-failure Rate Prediction
Period Modeling Approach
Actuarial Failure Rates Logit Regression Model Failure Rates Implied by Issuer Default Ratings
Crisis (2000–2009) na (too unstable) na 2000–2009 (c)
Through-the-Cycle (2008–2014)
na na 2008–2011 (c)
Current (2013–2014) na 2009–2014 logit model (b)
2011
d) Loss Given Default (LGD): We have data on NDIC’s recoveries from failed-bank asset
liquidations and insured deposits at closing between 1994 and 2006. While these data can
provide estimates of the loss given default (LGD) during the 2000–2009 crisis period, there is
simply too little resolutions activity since 2006 to estimate LGD for the through-the-cycle and
current period states of the economy. We assume the 1994–2006 period can be used to
calibrate the through-the-cycle period conditions, and we assume the current period has the
same recovery and loss rates as the through-the-cycle period. A detail description of our
approach to estimating LGD is available in Appendix G.
Table 4. Proposed Approaches for LGD Prediction
Period Recovery Rates Used
Crisis (2000- 2009) 2000-2006
Through-the-Cycle (2008–2014) 1994 – 2006
Current (2013–2014) Assumed same as TTC
e) Exposure at Default (ED): Data on insured deposits and bank liabilities are available from
quarterly bank financial statements that banks file with the NDIC. The percentage of deposits
that are insured tends to depend heavily upon bank type, with Merchant Banks hold an
average of 3% insured deposits at closing compared to 25% for all other closed banks between
1994 and 2006. Given the relatively low level of deposit insurance coverage for DMBs of NGN
500,000 (about USD 2,525 as of March 2016), it does not appear that level of insured deposits
will change significantly as banks approach failure due to a flight to quality.18 Since the target
fund simulation model predicts NDIC losses going forward, we therefore recommend using
current insured deposits and bank liabilities as estimates of insurance exposure under all
economic states. A detail description of our approach to estimating exposure at default is
available in Appendix G.
18 We acknowledge that we lack sufficient historical data to estimate the trend in the percentage of deposits that are insured a banks over time and as they approach failure.

CONFERENCE VERSION
21
f) Correlation of Bank Failures: Stock return data are available for publicly traded banks for the
period January 2002–January 2016, however, this data does not include all DMBs.
Correlations obtained from this era can be aggregated based on desired periods to generate
correlation inputs for the simulation model. Alternatively, returns to book equity could be
used to derive correlation. Table 5 shows that data availability for DMB stock returns aligns
well with our three economic periods.
Table 5. Proposed Approaches for Default Correlation Prediction
Period Overall Correlation across Traded DMBs Monthly Stock Returns Included Dates
Crisis (2000–2009) 2002–2009
Through-the-Cycle (2008–2014) 2008–2014
Current (2013–2014) 2013–2014
We estimated pairwise Pearson’s correlations for DMB stock returns for the three economic periods, take
the average for that period, and present results in table 6. Overall, the correlations remained relatively
stable across economic periods, reflecting the overall strong economic performance of Nigeria since 2000.
Table 6. Stock Return Correlations
Period Average Correlation in Stock Returns
Current, 2013-2014 0.4542
Through the Cycle, 2008-2014 0.5103
Crisis, 2006-2009 0.5110
Crisis, 2002-2009 0.4678
7. Model Results
We use three views of Nigerian economic conditions—current, through-the-cycle and crisis period—to
estimate NDIC losses from failed Deposit Money Banks. The Monte Carlo simulations used 50,000 random
draws of systematic and idiosyncratic risk factors to generate failure events. Figure 1 shows the results
for the simulation of NDIC losses under current economic conditions (2013–2014) where NDIC recovery
rates were based on asset type—risk assets, investments and physical assets—and the bank failure rate
is based on the most current (2011) one-year historical bank failure rate from FitchRatings (2013a). Figure
1 shows that the vast majority of simulations result in few if any failures. Just over 90% of loss events
resulted in losses less than 1% of total deposits, however, there is the risk that insurance losses can exceed
this 1% threshold. The level of losses NDIC wishes to cover is a policy matter, however, as a benchmark,
over the past 40 years U.S. Aaa and Aa rated municipal bonds have made payments of interest and
principal 99.97% of the time.19 The 99.97% confidence level is commonly used as a benchmark for U.S.
banks’ economic capital models and the Basel II capital requirements, i.e., banks should have enough
capital to cover losses they might incur up to the 99.97% confidence level. Using the 99.97% confidence
19 See “Safety of Investment Grade Bonds - Examining Credit Ratings and Default Rates of Municipal and Corporate Bonds” by Stephen J. Huxley and Brent Burns, Asset Dedication White Paper Series (February 2011).

CONFERENCE VERSION
22
level, NDIC would need to set a target fund of 4.6% of total deposits under 2013–2014 economic
conditions.
Table 7 presents results for estimates of the target fund-to-total deposit ratio (hereafter, DIF target ratio)
necessary to absorb insurance losses at the 99.97% confidence level for three economic states where all
results are based on the FitchRatings (2013a) global historical bank failure rates. Using a one-year bank
failure horizon and FitchRatings historical data, the target fund estimates under current, through-the-
cycle and crisis period conditions are 4.3%. 4.3% and 6.0% respectively. These results contrast with a
target fund estimate of 2.4% based on the logit model predictions of bank failures over one year and
assuming current (2013-2014) period conditions for all other target fund model inputs.
The target fund estimates increase as we increase the bank failure horizon, with the three year failure
horizon target fund estimate reaching 7.1% under crisis period conditions. These results show the
sensitivity of the target fund estimates to the bank failure horizon and the economic conditions NDIC
operates under when liquidating bank assets.
Table 7. DIF Target Fund Ratio (at the 99.97% Confidence Level)
(Based on Historical Failure Rates from FitchRatings and NDIC Recovery Rates by Asset Type)
Cumulative Failure Rate Current Period Through-the-Cycle Crisis Period
One Year 4.3% 4.3% 6.0%
Two Year 4.8% 5.1% 6.8%
Three Year 6.3% 5.4% 7.1%
8. Sensitivity Analysis
We tested the sensitivity of target DIF estimates to changes in target fund model parameters—correlation
of bank failures, EAD, LGD and PD. More specifically, we increased and decreased the value of all model
0%
10%
20%
30%
40%
50%
60%
70%
80%
90%
100%
0%
10%
20%
30%
40%
50%
60%
0.0%0.2%0.5%0.7%0.9%1.1%1.4%1.6%1.8%2.1%2.3%2.5%2.7%3.0%3.2%3.4%3.6%3.9%4.1%4.3%4.6%4.8%5.0%
Cu
mu
lati
ve P
erc
en
t
Fre
qu
en
cy (
%)
Loss/Total Deposits (%)
Figure 1: Monte Carlo Simulation of Insurance Losses(One-year Historical Failure Rates, Current View of Economy)
99.97% of Losses Covered at a Target Fund of 4.6%

CONFERENCE VERSION
23
parameters individually by +/-10 percent and +/-25 percent from current conditions values, holding all
other parameters at current period values. A one-year failure horizon is used in all sensitivity tests. The
current conditions parameter values are correlation of bank failure (45 percent), EAD (September 2014
insured deposits at each bank), LGD (risk assets, 84 percent; physical assets, 35 percent and investment
assets, 88 percent) and PD (4.92 percent). To test model sensitivity to LGD changes we changed loss rates
on risk assets, physical assets and investment assets by the same percentages, simultaneously.
Table 8 shows that target fund estimates are sensitive to model parameters but are not highly sensitive.
Target fund estimates are most sensitive to LGD and failure rates. A 50 percent change in EAD (-25 percent
compared to +25 percent) changes the target fund ratio estimate by 62 percent. A 50 percent change in
the failure rate (-25 percent compared to +25 percent) changes the target fund ratio by 34 percent.
Table 7. Target DIF-to-Total Deposit Ratio Sensitivity Analysis
(Target DIF is based on a 99.97 percent confidence level for loss coverage)
Parameter -25% -10% Current Conditions
+10% +25%
Correlation 4.1% 4.1%
4.3%
4.6% 4.6%
PD 3.5% 4.1% 4.6% 4.7%
LGD 4.1% 4.3% 4.7% 4.9%
EAD 3.4% 4.0% 5.1% 5.5%
9. Inherent Weaknesses of Model Assumptions
All approaches to estimating the target deposit insurance fund require one to make assumptions about
which factors influence the target fund (i.e., drivers of insurance losses) and the manner in which these
factors combine to influence the target fund. The Loss Distribution Approach relies on historical data on
deposit insurance losses and is entirely a data-driven approach. Implicit in the Loss Distribution Approach
is the broad assumption that past drivers of deposit insurance losses remain relevant in the future and
that the manner in which these drivers combine to influence insurance losses remains much the same in
the future. The Credit Portfolio Approach relies on much less data than the Loss Distribution Approach
and, therefore, the Credit Portfolio Approach must use explicit assumptions about the drivers of insurance
losses and how these drivers combine to influence insurance losses.
As discussed previously, the Credit Portfolio Approach does not model the influence of the legal and
regulatory environment on insurance losses and assumes the structure of the financial safety net, and
deposit insurance regime in particular, remain unchanged from that reflected in the model input data.
The Credit Portfolio Approach also makes strong assumptions about the process that generates bank asset
value changes and, therefore, bank failures. The specific assumptions for asset returns are:
a. assets value changes are driven by a linear combination of systematic and idiosyncratic risk factors
(Merton-Vasicek Model),
b. both risk factors are transformed to standard normal random variables (mean zero and standard
deviation of one),
c. idiosyncratic risk and systematic risk are distributed independently of one another,
CONFERENCE VERSION
24
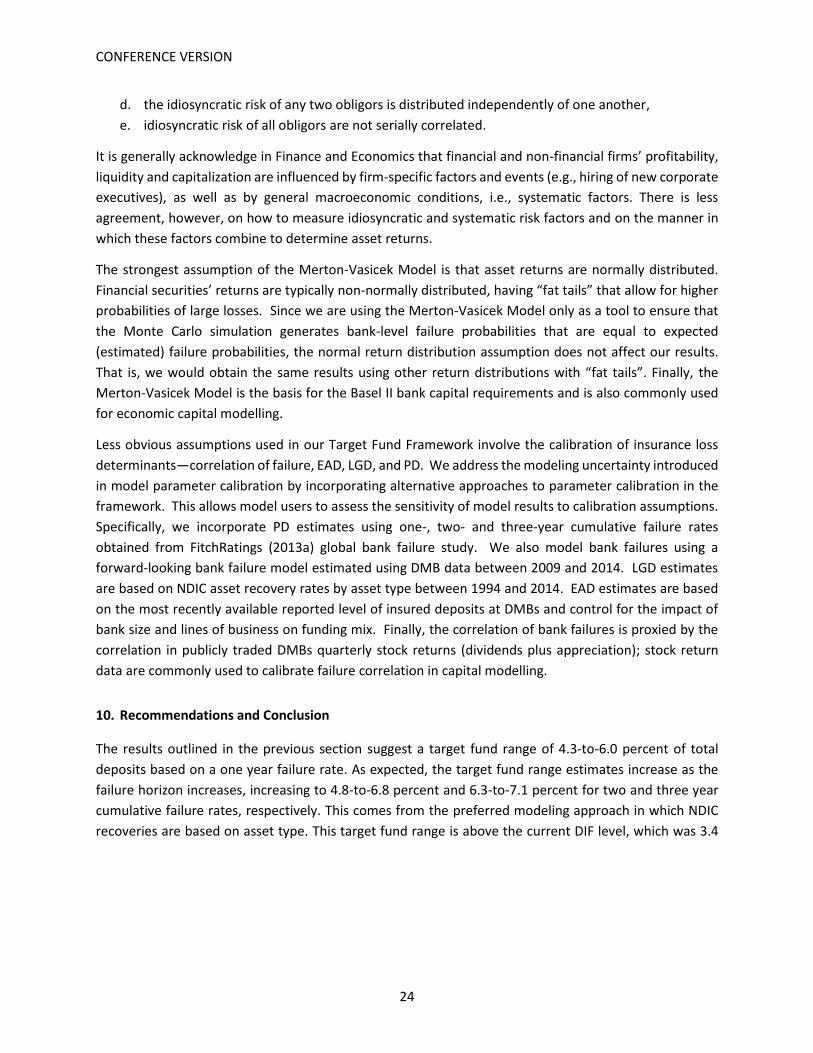
d. the idiosyncratic risk of any two obligors is distributed independently of one another,
e. idiosyncratic risk of all obligors are not serially correlated.
It is generally acknowledge in Finance and Economics that financial and non-financial firms’ profitability,
liquidity and capitalization are influenced by firm-specific factors and events (e.g., hiring of new corporate
executives), as well as by general macroeconomic conditions, i.e., systematic factors. There is less
agreement, however, on how to measure idiosyncratic and systematic risk factors and on the manner in
which these factors combine to determine asset returns.
The strongest assumption of the Merton-Vasicek Model is that asset returns are normally distributed.
Financial securities’ returns are typically non-normally distributed, having “fat tails” that allow for higher
probabilities of large losses. Since we are using the Merton-Vasicek Model only as a tool to ensure that
the Monte Carlo simulation generates bank-level failure probabilities that are equal to expected
(estimated) failure probabilities, the normal return distribution assumption does not affect our results.
That is, we would obtain the same results using other return distributions with “fat tails”. Finally, the
Merton-Vasicek Model is the basis for the Basel II bank capital requirements and is also commonly used
for economic capital modelling.
Less obvious assumptions used in our Target Fund Framework involve the calibration of insurance loss
determinants—correlation of failure, EAD, LGD, and PD. We address the modeling uncertainty introduced
in model parameter calibration by incorporating alternative approaches to parameter calibration in the
framework. This allows model users to assess the sensitivity of model results to calibration assumptions.
Specifically, we incorporate PD estimates using one-, two- and three-year cumulative failure rates
obtained from FitchRatings (2013a) global bank failure study. We also model bank failures using a
forward-looking bank failure model estimated using DMB data between 2009 and 2014. LGD estimates
are based on NDIC asset recovery rates by asset type between 1994 and 2014. EAD estimates are based
on the most recently available reported level of insured deposits at DMBs and control for the impact of
bank size and lines of business on funding mix. Finally, the correlation of bank failures is proxied by the
correlation in publicly traded DMBs quarterly stock returns (dividends plus appreciation); stock return
data are commonly used to calibrate failure correlation in capital modelling.
10. Recommendations and Conclusion
The results outlined in the previous section suggest a target fund range of 4.3-to-6.0 percent of total
deposits based on a one year failure rate. As expected, the target fund range estimates increase as the
failure horizon increases, increasing to 4.8-to-6.8 percent and 6.3-to-7.1 percent for two and three year
cumulative failure rates, respectively. This comes from the preferred modeling approach in which NDIC
recoveries are based on asset type. This target fund range is above the current DIF level, which was 3.4

CONFERENCE VERSION
25
percent of total deposits as of December 2014.20 The results are also higher than Katata and Ogunleye
(2014) who recommended a target fund range of 4.0-to-5.0 percent of total deposits.
Determining the appropriate overall funding level of the DIF is a policy decision the NDIC and other
authorities of the financial safety net have to make. It also requires factoring in recent developments
described in the overview section. This includes the impact of falling oil prices on the banking sector,
mounting pressures on the exchange rate, and the reduction in overall liquidity generated by the
consolidation of government deposits in a single account at the central bank. As a result, the authorities
should be cautious about fixing an overall target fund ratio at this point. More time is needed to better
understand the full impact of recent developments on the financial sector.
Nevertheless, there are measures the authorities could take immediately that would increase the
resilience of the deposit insurance scheme and its contribution to the overall financial safety net:
The most important would be to exempt NDIC from the Fiscal Responsibility Act in line with
recommendations from the 2013 FSAP. This would increase the rate of growth of the deposit
insurance fund and its capacity to address future bank failures.
Moreover, the provision of NDIC financial assistance to problem banks should be explicitly limited
to assisting in bridge bank and P&A arrangements under the least-cost rule; not for the provision
of liquidity support.
Institutionally, it is necessary to replace NDIC’s credit line to the CBN with a credit line to the
Ministry of Finance (MOF) so that supplemental support to the deposit insurance fund comes
from the fiscal authorities, which is more appropriate than support from the monetary
authorities. In addition, CBN should divest its shareholding in the NDIC in favor of the MOF as the
fiscal authority.
The operational capacity of NDIC requires improvements in line with the recommendations of the
guided IADI CP self-assessment. In particular, the statutory payout period should be significantly
shortened, particularly as the current target of thirty days is still long by international standards
(e.g. 7 days).
Data collection and information management systems need to improve in order to allow for
better monitoring of depositor data and periodic updates to the target fund ratio.
20 Total deposits of DIF-insured banks were NGN 18 trillion in December 2014 and the DIF stood at NGN 614 billion at that time according to the 2014 NDIC Annual Report.

CONFERENCE VERSION
26
References
Alford, Duncan E. February 2012. Reform of the Nigerian Banking System: Assessment of the Asset
Management Corporation of Nigeria (AMCON) and Recent Developments, Social Science Research
Network Working Paper, available at: http://ssrn.com/abstract=2006057
_____________. April 2010. Nigerian Banking Reform: Recent Actions and Future Prospects. , Social
Science Research Network Working Paper, available at: http://ssrn.com/abstract=1592599
Basel Committee on Banking Supervision and International Association of Deposit Insurers. 2009. Core
Principles for Effective Deposit Insurance Systems, June 2009.
Black, Fisher and Myron Scholes. 1973. The Pricing of Options and Corporate Liabilities. The Journal of
Political Economy, Vol. 81, No. 3 (May - Jun., 1973), pp. 637-654.
Canadian Deposit Insurance Corporation. 2011. Consultation Paper Premium Assessment Approach and
Target Fund Level (June 2011).
Cook, Lisa. Were the Nigerian Banking Reforms of 2005 A Success...And for the Poor? (March 2011) NBER
http://www.nber.org/chapters/c13361.pdf
De Lisa, Riccardo, Stefano Zedda, Francesco Vallascas, Francesca Campolongo and Massimo Marchesi.
2011. Modelling Deposit Insurance Scheme Losses in a Basel 2 Framework. Journal of Financial Services
Research Vol. 40, pp. 123–141.
Federal Republic of Nigeria. 2006. Nigerian Deposit Insurance Corporation Act (December 29, 2006),
Federal Republic of Nigeria Official Gazette Lagos Nigeria, Vol. 93, No. 73.
FitchRatings. 2014. Definitions of Ratings and Other Forms of Opinion (December 2014)
__________ . 2013a. Global Bank Rating Performance Study: 1990-2012 (November 27, 2013)
Special Report
__________. 2013b. Ratings Reality: Explaining What Fitch’s Ratings Do and Do Not Address Special
Report (May 8, 2013)
__________. 2011. Viability Ratings: An Introductory Primer Special Report (July 20, 2011)
Fogafin. 2013. “A Methodology for Determining the Target Funding Level of a Deposit Insurer”, Paper No.
4 February 2013. (Fogafin is a state-owned institution that protects bank depositors in Columbia.)
Gordy, Michael B. 2002. A Risk-Factor Model Foundation for Ratings-Based Bank Capital Rules, Working
Paper, Board of Governors of the Federal Reserve System.
_____________. 2000. A Comparative Anatomy of Credit Risk Models, Journal of Banking & Finance Vol.
24, pp. 119 -149.

CONFERENCE VERSION
27
International Association of Deposit Insurers. 2009. “Funding of Deposit Insurance Systems”, Guidance
Paper Prepared by the Research and Guidance Committee International Association of Deposit Insurers,
May 6, 2009.
____________________________________. 2011. “Evaluation of Deposit Insurance Fund Sufficiency on
the Basis of Risk Analysis”, Discussion Paper Prepared by the Subcommittee on DIF Sufficiency Research
and Guidance Committee, 2011.
____________________________________. 2012. “Enhanced Guidance for Effective Deposit Insurance
Systems: Reimbursement Systems and Processes”, Guidance Paper Prepared by the Research and
Guidance Committee International Association of Deposit Insurers, November 2012.
____________________________________. 2014. “IADI Core Principles for Effective Deposit Insurance
Systems”, November 2014.
Internal Monetary Fund and World Bank. 2013. Financial Stability Assessment Program: Crisis
Management and Crisis Preparedness Frameworks Technical Note (May 2, 2013).
Katata, Kabir S. and R.W. Ogunleye. 2014. “Target Funding Ratio and Assessing the Adequacy of the
Deposit Insurance Fund”, Nigerian Deposit Insurance Corporation, Working Paper 2014.
Koyluoglu, H. Ugur and Andrew Hickman. 1998. A Generalized Framework for Credit Risk Portfolio
Models.
Merton, Robert C. 1974. On The Pricing of Corporate Debt: The Risk Structure of Interest Rates. Journal of
Finance, Vol. 29, No. 2. pp. 449 – 470.
Monetary Authority of Singapore. 2002. Deposit Insurance Scheme Consultation Paper (August 6, 2002).
Obienusi, Ihuoma and Obienusi, E. A , Banking Reforms and the Nigerian Economy, 1990 – 2007, Historical
Research Letter www.iiste.org, ISSN 2224-3178 (Paper) ISSN 2225-0964 (Online),Vol. 21 (2015)
Oliver, Wyman & Company. 2002. Deposit Insurance Scheme: Technical Addendum (for the Monetary
Authority of Singapore) (August 6, 2002).
Thomas, Hugh and Zhiqiang Wang. 2005. Interpreting the Internal Ratings-Based Capital Requirements in
Basel II. Journal of Banking Regulation Vol. 6, pp. 274–289.
Vasicek, Oldrich A. 2002. Loan Portfolio Value. Risk (December 2002), pp. 160-162.
______________. 1991. Limiting Loan Loss Probability Distribution. Technical Document, KMV
Corporation (August 9, 1991).
______________. 1987. Probability of Loss on Loan Portfolio. Technical Document, KMV.

CONFERENCE VERSION
28
Appendix A – Insurance Scheme Characteristics
There are features of a deposit insurance scheme that address the allocation of insurance losses and loss
mitigation. These features may have an indirect impact on insurance losses and hence the target deposit
insurance fund (TDIF). Rather than attempt to model these features explicitly, we assume their
contribution to the TDIF is subsumed in NDIC historical loss experience. Implicitly our model assumes any
changes in these insurance scheme features going forward can be captured in insurance loss rates.
1.) We do not incorporate in our TDIF model alternative sources of ex ante insurance funding—public
sector, private sector and international aid organizations (e.g., International Monetary Fund)—
and types of insurance premium systems—flat rate and risk based. This is because alternative
deposit insurance funding sources and premium systems allocate deposit insurance costs across
institutions and individuals and do not have a direct effect on overall failure costs.
2.) Deposit insurance fund management is also not incorporated in our model of the TDIF. As IADI
(2009) points out, many deposit insurers have invested insurance premiums in low-risk securities,
such as government securities, while others have pursued higher return investments. There is also
the possibility of returning insurance funds to banks through investment in banks. These deposit
insurance fund management choices have not direct effect on the failure-resolution costs deposit
insurers must absorb, however.
3.) Back-up lines of credit for the deposit insurer, offered by the central bank, government treasury
or private sector, are often available to deposit insurers. Back-up lines of credit can allow the
deposit insurer to spread insurance losses over longer time periods than would be feasible under
a strictly ex ante premium system but have no direct effect on insurance losses.
4.) Failure-bank receivership activities are post-closing activities and can only influence resolution
costs indirectly. If the deposit insurer is responsible for managing the receivership established to
settle claims on the failed-bank’s assets, this duty might afford the insurer greater control over
the timing of liquidations and cash outlays needed to meet insurance claim.
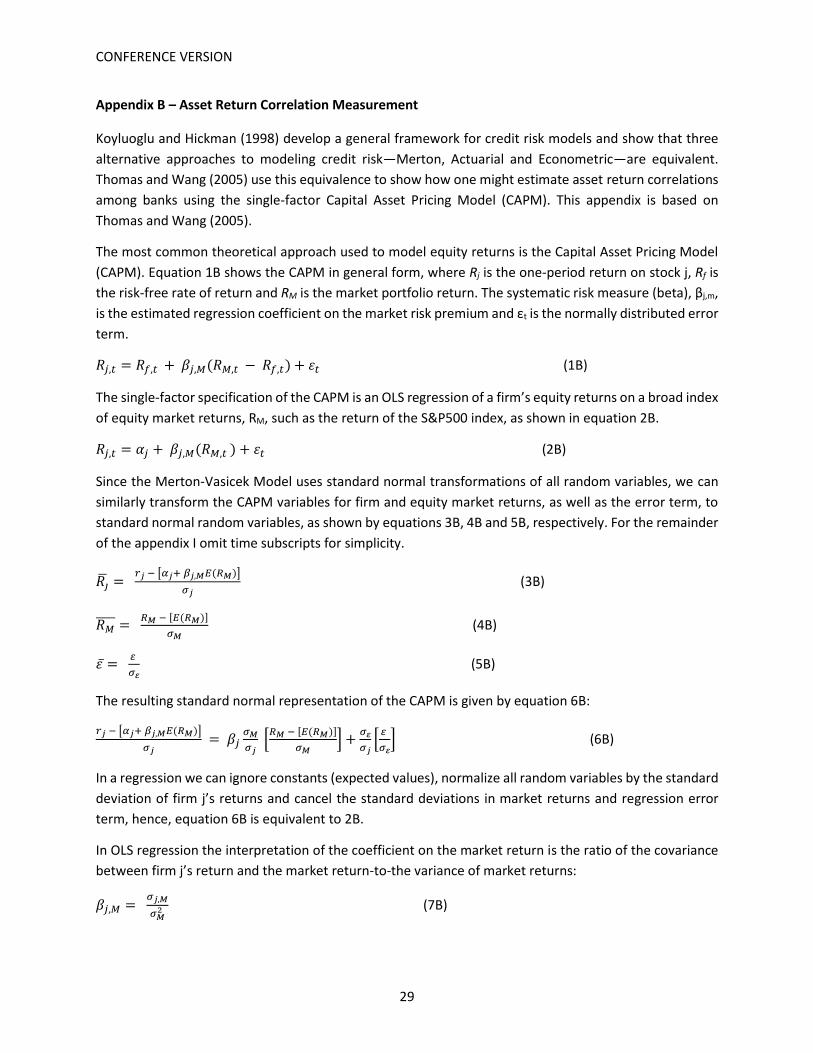
CONFERENCE VERSION
29
Appendix B – Asset Return Correlation Measurement
Koyluoglu and Hickman (1998) develop a general framework for credit risk models and show that three
alternative approaches to modeling credit risk—Merton, Actuarial and Econometric—are equivalent.
Thomas and Wang (2005) use this equivalence to show how one might estimate asset return correlations
among banks using the single-factor Capital Asset Pricing Model (CAPM). This appendix is based on
Thomas and Wang (2005).
The most common theoretical approach used to model equity returns is the Capital Asset Pricing Model
(CAPM). Equation 1B shows the CAPM in general form, where Rj is the one-period return on stock j, Rf is
the risk-free rate of return and RM is the market portfolio return. The systematic risk measure (beta), βj,m,
is the estimated regression coefficient on the market risk premium and εt is the normally distributed error
term.
𝑅𝑗,𝑡 = 𝑅𝑓,𝑡 + 𝛽𝑗,𝑀(𝑅𝑀,𝑡 − 𝑅𝑓,𝑡) + 휀𝑡 (1B)
The single-factor specification of the CAPM is an OLS regression of a firm’s equity returns on a broad index
of equity market returns, RM, such as the return of the S&P500 index, as shown in equation 2B.
𝑅𝑗,𝑡 = 𝛼𝑗 + 𝛽𝑗,𝑀(𝑅𝑀,𝑡 ) + 휀𝑡 (2B)
Since the Merton-Vasicek Model uses standard normal transformations of all random variables, we can
similarly transform the CAPM variables for firm and equity market returns, as well as the error term, to
standard normal random variables, as shown by equations 3B, 4B and 5B, respectively. For the remainder
of the appendix I omit time subscripts for simplicity.
𝑅�̅� = 𝑟𝑗 − [𝛼𝑗+ 𝛽𝑗,𝑀𝐸(𝑅𝑀)]
𝜎𝑗 (3B)
𝑅𝑀̅̅ ̅̅ =
𝑅𝑀 − [𝐸(𝑅𝑀)]
𝜎𝑀 (4B)
휀̅ = 𝜀
𝜎𝜀 (5B)
The resulting standard normal representation of the CAPM is given by equation 6B:
𝑟𝑗 − [𝛼𝑗+ 𝛽𝑗,𝑀𝐸(𝑅𝑀)]
𝜎𝑗 = 𝛽𝑗
𝜎𝑀
𝜎𝑗 [
𝑅𝑀 − [𝐸(𝑅𝑀)]
𝜎𝑀] +
𝜎𝜀
𝜎𝑗[
𝜀
𝜎𝜀] (6B)
In a regression we can ignore constants (expected values), normalize all random variables by the standard
deviation of firm j’s returns and cancel the standard deviations in market returns and regression error
term, hence, equation 6B is equivalent to 2B.
In OLS regression the interpretation of the coefficient on the market return is the ratio of the covariance
between firm j’s return and the market return-to-the variance of market returns:
𝛽𝑗,𝑀 = 𝜎𝑗,𝑀
𝜎𝑀2 (7B)

CONFERENCE VERSION
30
And the correlation coefficient between firm j’s return and the market return is the ratio of the covariance
between firm j’s return and market-to-the product of the standard deviations of firm j and market returns:
𝜌𝑗,𝑀 = 𝜎𝑗,𝑀
𝜎𝑗𝜎𝑀 (8B)
Next, define δj,M as the product of the two parameters preceding the standardized market return shown
in equation 6B:
𝛿𝑗,𝑀 = (𝛽𝑗𝜎𝑀
𝜎𝑗) (9B)
Substituting 7B for βj in equation 9B yields:
𝛿𝑗,𝑀 = (𝜎𝑗,𝑀
𝜎𝑀2 ∗
𝜎𝑀
𝜎𝑗) (10B)
Cancelling and simplifying terms in equation 10B allows us to express 10B in terms of the correlation
coefficient between firm j’s and the market returns (8B):
𝛿𝑗,𝑀 = (𝜎𝑗,𝑀
𝜎𝑀𝜎𝑗) (11B)
Or more simply:
𝛿𝑗,𝑀 = 𝜌𝑗,𝑀 (12B)
Therefore, a standard normal transformation of the CAPM single-factor regression provides an estimate
of the correlation between firm j’s and the market returns. If we assume the CAPM model holds, this is
also the measure of asset return correlation with the systematic risk factor.21
Another useful expression is the variance in standard normal returns:
𝜎𝑗2 = (𝛽𝑗
𝜎𝑀
𝜎𝑗)
2
𝜎𝜀2 + (
𝜎𝜀
𝜎𝑗)
2
𝜎𝑀2 (13B)
Using the assumed standard normal variable transforms and independence assumptions of Basel II we
can simplify 13B:
1 = (𝛽𝑗𝜎𝑀
𝜎𝑗)
2
(1) + (𝜎𝜀
𝜎𝑗)
2
(1) (14B)
This implies that for the obligor asset return model in standard normal form (6B), the factor loading on
the idiosyncratic risk factor is one minus that on the systematic risk factor:
1 − (𝛽𝑗𝜎𝑀
𝜎𝑗)
2
= (𝜎𝜀
𝜎𝑗)
2
(15B)
21 The market environment assumptions of the CAPM and Merton-Vasicek models are the same. Importantly, both models assume perfectly competitive markets where investors can completely diversity their portfolios.
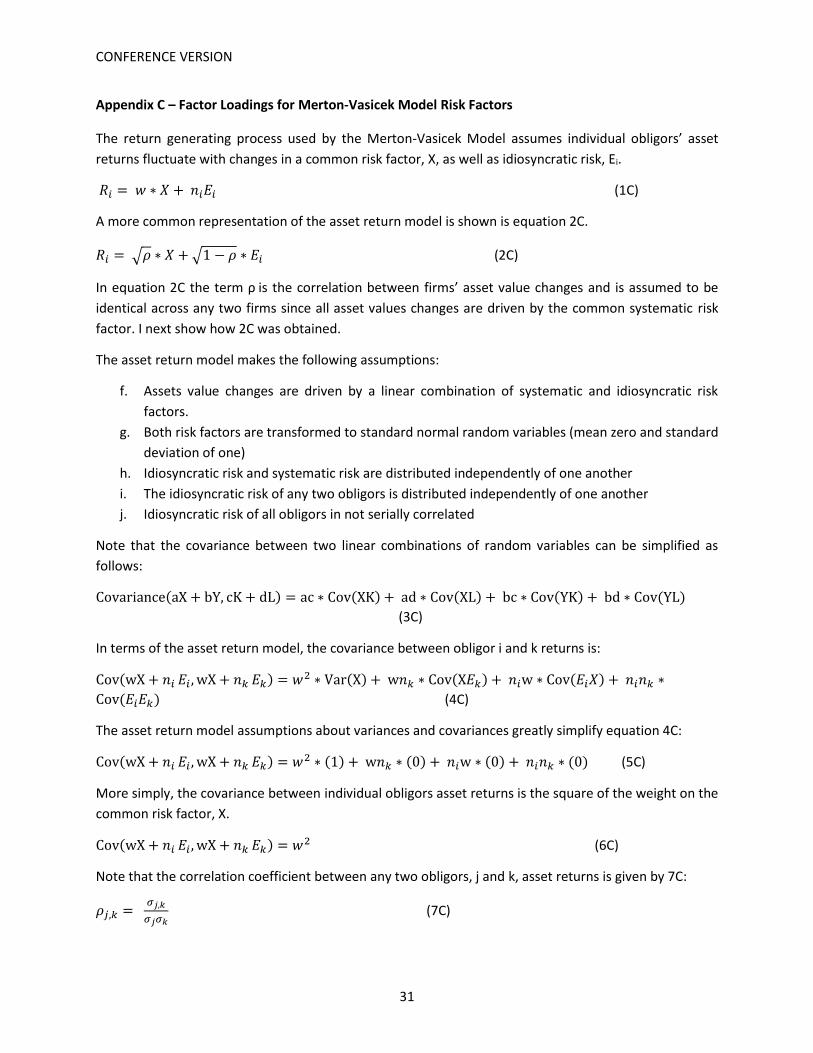
CONFERENCE VERSION
31
Appendix C – Factor Loadings for Merton-Vasicek Model Risk Factors
The return generating process used by the Merton-Vasicek Model assumes individual obligors’ asset
returns fluctuate with changes in a common risk factor, X, as well as idiosyncratic risk, Ei.
𝑅𝑖 = 𝑤 ∗ 𝑋 + 𝑛𝑖𝐸𝑖 (1C)
A more common representation of the asset return model is shown is equation 2C.
𝑅𝑖 = √𝜌 ∗ 𝑋 + √1 − 𝜌 ∗ 𝐸𝑖 (2C)
In equation 2C the term ρ is the correlation between firms’ asset value changes and is assumed to be
identical across any two firms since all asset values changes are driven by the common systematic risk
factor. I next show how 2C was obtained.
The asset return model makes the following assumptions:
f. Assets value changes are driven by a linear combination of systematic and idiosyncratic risk
factors.
g. Both risk factors are transformed to standard normal random variables (mean zero and standard
deviation of one)
h. Idiosyncratic risk and systematic risk are distributed independently of one another
i. The idiosyncratic risk of any two obligors is distributed independently of one another
j. Idiosyncratic risk of all obligors in not serially correlated
Note that the covariance between two linear combinations of random variables can be simplified as
follows:
Covariance(aX + bY, cK + dL) = ac ∗ Cov(XK) + ad ∗ Cov(XL) + bc ∗ Cov(YK) + bd ∗ Cov(YL)
(3C)
In terms of the asset return model, the covariance between obligor i and k returns is:
Cov(wX + 𝑛𝑖 𝐸𝑖 , wX + 𝑛𝑘 𝐸𝑘) = 𝑤2 ∗ Var(X) + w𝑛𝑘 ∗ Cov(X𝐸𝑘) + 𝑛𝑖w ∗ Cov(𝐸𝑖𝑋) + 𝑛𝑖𝑛𝑘 ∗
Cov(𝐸𝑖𝐸𝑘) (4C)
The asset return model assumptions about variances and covariances greatly simplify equation 4C:
Cov(wX + 𝑛𝑖 𝐸𝑖 , wX + 𝑛𝑘 𝐸𝑘) = 𝑤2 ∗ (1) + w𝑛𝑘 ∗ (0) + 𝑛𝑖w ∗ (0) + 𝑛𝑖𝑛𝑘 ∗ (0) (5C)
More simply, the covariance between individual obligors asset returns is the square of the weight on the
common risk factor, X.
Cov(wX + 𝑛𝑖 𝐸𝑖 , wX + 𝑛𝑘 𝐸𝑘) = 𝑤2 (6C)
Note that the correlation coefficient between any two obligors, j and k, asset returns is given by 7C:
𝜌𝑗,𝑘 = 𝜎𝑗,𝑘
𝜎𝑗𝜎𝑘 (7C)

CONFERENCE VERSION
32
The Merton-Vasicek Model uses standard normal returns, so the variance and standard deviations of
returns are 1; combining 7B and 6C we have can say the correlation coefficient between firm’s asset
returns is the square of the factor loading on the systematic risk factor:
𝜌𝑗,𝑘 = 𝜎𝑗,𝑘
1 = 𝑤2 (8C)
Hence,
𝑤 = √𝜌𝑖,𝑘 (9C)
Using the result from Appendix B that the factor loading on the standardized idiosyncratic risk factor is
one minus that on the systematic risk factor, we rewrite 1C in the standard asset return model expression
for returns:
𝑅𝑖 = √𝜌 ∗ 𝑋 + √1 − 𝜌 ∗ 𝐸𝑖 (10C)

CONFERENCE VERSION
33
Appendix D – Bank Value-at-Risk and the Basel II Advanced Approach Capital Requirements
In general terms, for the Merton-Vasicek asset return process the probability that bank i will incur a return
of Zi or less, under any state of the economy (systematic risk factor) represented by X, can be represented
by equation 1D (where P denotes the probability density function). It is important to note that equation
1D gives the unconditional probability of asset returns less than or equal to Zi.
𝑃(𝑅𝑖 ≤ 𝑍𝑖) = 𝑃(𝐸𝑖 ≤(𝑍𝑖− 𝑤𝑖𝑋)
𝑛 ) (1D)
More simply, the probability of an asset value return of Zi or less is the value of the cumulative probability
density function evaluated at the limiting return value:
𝑃𝑖 = Ф [𝑍𝑖− 𝑤𝑖𝑋
𝑛𝑖] (2D)
We can use the inverse function rule to solve for the asset return (in standard normal random variable
form) associated with the probability of it occurring:
𝑍𝑖 = Φ−1(𝑃𝑖) (3D)
Since equation 3D is an unconditional probability we solve for Zi across all possible states of the economy.
Basel II measures Zi using the unconditional probability of bank failure, Pi, (i.e., unconditional on the state
of the economy). Since Zi is a standard normal random variable, we can quickly find values of Z associated
with various probabilities using the inverse standard normal probability density function, evaluated at Pi.22
Finally, equation 4D gives the probability of an asset return less than or equal to Zi conditional on the state
of the economy being U. Basel II capital requirements use an extreme adverse state of the economy
assumption.
𝑃(𝑅𝑖 ≤ 𝑍𝑖| 𝑋 = 𝑈) = 𝑃(𝐸𝑖 ≤(𝑍𝑖− 𝑤𝑖𝑈)
𝑛 ) (4D)
Value at Risk and Implied Capital Requirement
We next use the asset return and obligor default processes to determine the amount of capital banks
should hold to absorb a specific level of loss. Figure 1D shows the relationships between the probability
distribution of losses, mean or expected loss (EL) and VaR. In this example, the VaR covers all losses that
might occur with 99.9% probability. Losses beyond the threshold value would only occur 0.01% of the
time.
22 Statistics textbooks typically include a table of standard normal variable values and associated probabilities. The standard normal density function and related functions are also available in Excel and all statistical software packages.
Figure 1D
1D\1.
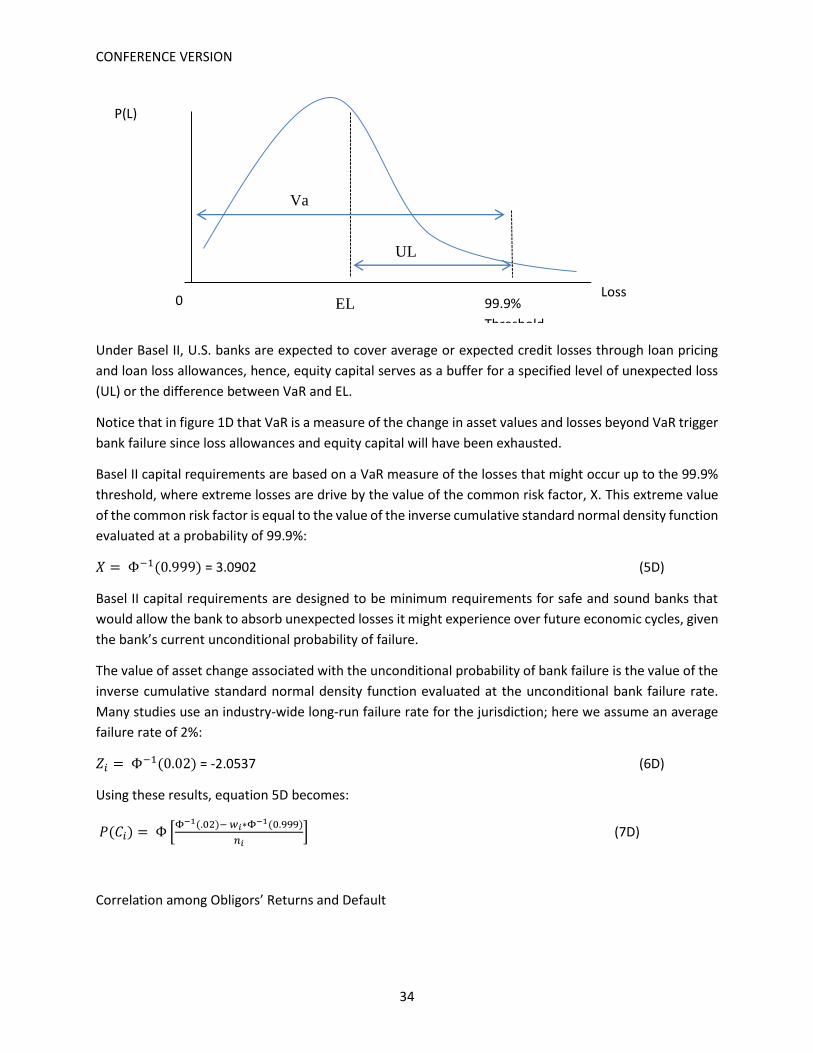
CONFERENCE VERSION
34
Under Basel II, U.S. banks are expected to cover average or expected credit losses through loan pricing
and loan loss allowances, hence, equity capital serves as a buffer for a specified level of unexpected loss
(UL) or the difference between VaR and EL.
Notice that in figure 1D that VaR is a measure of the change in asset values and losses beyond VaR trigger
bank failure since loss allowances and equity capital will have been exhausted.
Basel II capital requirements are based on a VaR measure of the losses that might occur up to the 99.9%
threshold, where extreme losses are drive by the value of the common risk factor, X. This extreme value
of the common risk factor is equal to the value of the inverse cumulative standard normal density function
evaluated at a probability of 99.9%:
𝑋 = Φ−1(0.999) = 3.0902 (5D)
Basel II capital requirements are designed to be minimum requirements for safe and sound banks that
would allow the bank to absorb unexpected losses it might experience over future economic cycles, given
the bank’s current unconditional probability of failure.
The value of asset change associated with the unconditional probability of bank failure is the value of the
inverse cumulative standard normal density function evaluated at the unconditional bank failure rate.
Many studies use an industry-wide long-run failure rate for the jurisdiction; here we assume an average
failure rate of 2%:
𝑍𝑖 = Φ−1(0.02) = -2.0537 (6D)
Using these results, equation 5D becomes:
𝑃(𝐶𝑖) = Φ [Φ−1(.02)− 𝑤𝑖∗Φ−1(0.999)
𝑛𝑖] (7D)
Correlation among Obligors’ Returns and Default
0 99.9%
Threshold
P(L)
Loss
EL
UL
Va
R

CONFERENCE VERSION
35
We have yet to quantify the factor loadings for systematic risk and idiosyncratic risk, wi and ni,
respectively. If loss events are driven by a single, common risk factor then it is intuitively clear that all
banks’ losses have the same correlation to this risk factor. Appendices B and C show that the factor loading
for the systematic risk factor is the square root of the correlation between any two firms’ asset returns, ρ
(rho), and the loading for idiosyncratic risk is the square root of 1 minus ρ.
The probability of a loss occurring that is generated by these values of the systematic risk factor and
unconditional bank failure probability is shown in equation 8D.
𝑃(𝐶𝑖) = Φ [Φ−1( 𝑃𝐷) − √𝜌∗Φ−1(0.999)
√1−𝜌] (8D)
Loss given default at the extreme value of the systematic risk factor is the product of the probability of
default (PD), exposure at default or outstanding loan balances (EAD) and loss rate on outstanding balances
given default (LGD). If a bank prefers to model LGD as 1 minus recovery rates or (1 – RR) we have equation
9D.
𝐿𝑜𝑠𝑠 (0.999) = Φ [Φ−1(𝑃𝐷) − √𝜌∗Φ−1(0.999)
√1−𝜌] ∗ 𝐸𝐴𝐷 ∗ (1 − 𝑅𝑅) (9D)
Finally, the difference between statistically expected losses and these extreme losses is the unexpected
loss (UL) Basel II and many banks’ economic capital models use as capital requirements. We can solve for
UL by subtracting expected losses from extreme losses where expected loss is the product of expected
PD, EAD and LGD (alternatively, 1- RR):
𝑈𝐿 = [ Φ [Φ−1(𝑃𝐷) − √𝜌∗Φ−1(0.999)
√1−𝜌] − 𝑃𝐷 ] ∗ 𝐸𝐴𝐷 ∗ (1 − 𝑅𝑅) (10D)
Economic capita models use estimates of UL based on equation D10, where PD, EAD and LGD are
estimated at the individual asset level. Basel II, however, uses a portfolio approach to measuring capital
requirements and uses estimates of EAD, LGD and PD to place asset in loan portfolio segments, then
applies historical actual values of EAD, LGD and PD for these segments before computing UL.

CONFERENCE VERSION
36
Appendix E – Identification of Economic States for DIF Target Fund Simulation Model
1. Overview
The purpose of this appendix is to discuss our approach to identifying three states of the economy—crisis
period, business cycle and current—and calibrate deposit insurance losses to each state. We analyzed
Nigerian macroeconomic economic data over the period 1998–2014 and identified periods that align with
a crisis period, full business cycle and current conditions. We used general macro-economic indicators as
well as summaries of bank economic conditions in this analysis.
Our approach is to first identify the combination of economic indicators that best “explain” variation in
the economic data for Nigeria and subsequently study how the economy, as characterized by these
indicators, changes over time. As an example of our approach, gross domestic product (GDP) reflects
changes in its underlying components—personal consumption expenditures, business investment,
government spending and net exports—so that trends in each component of GDP are reflected in GDP.
This means one can explain most of the movement in all five economic measures—GDP, C, I, G, X-M—by
looking at GDP alone. Similarly, we expect each component of GDP to be driven by changes in underlying
economic drivers. For instance, interest rates affect personal consumption expenditures and business
investment but have less impact on government spending. This means that for any collection of measures
of economic conditions some measures will “overlap” (i.e., move similarly over time). Our analytical
approach to identifying crisis periods and business cycles in Nigeria is to find a combination of economic
indicators that explain a majority of the variation in all key measures of the economy and use this
combination to measure variation in economic conditions. This approach allows us to greatly simplify the
identification of crisis and non-crisis periods by reducing analysis to a single composite variable—the first
principal component. The approach we use is Principal Component Analysis (PCA). PCA is similar in many
ways to the more commonly used linear regression in which a dependent variable (e.g., GDP) is related to
a set of explanatory variables and the regression detects those variables that best “explain” trends in the
dependent variable. The advantage of PCA over linear regression is that PCA can detect the most
important “explanatory variables” even when those variables are highly correlated with one another, and
it does not require choosing a specific dependent variable that is affected by the independent variables.
PCA is commonly used to devise socioeconomic indicators and is particularly useful when the cost of
obtaining direct measures of socioeconomic conditions is prohibitively expensive. A detailed discussion of
the technical aspects of PCA is beyond the scope of this appendix, however.
Based upon our analysis of the economic data for the period 1998–2014 we conclude that 2000–2009 was
an economic crisis period for Nigeria. We use the term crisis loosely, as economic performance was still
quite good, but these were the worst performing years in the recent era. For the through-the-cycle view,
we use the 7 most recent years of data, 2008-2014, as the longest business cycle observed in Nigerian
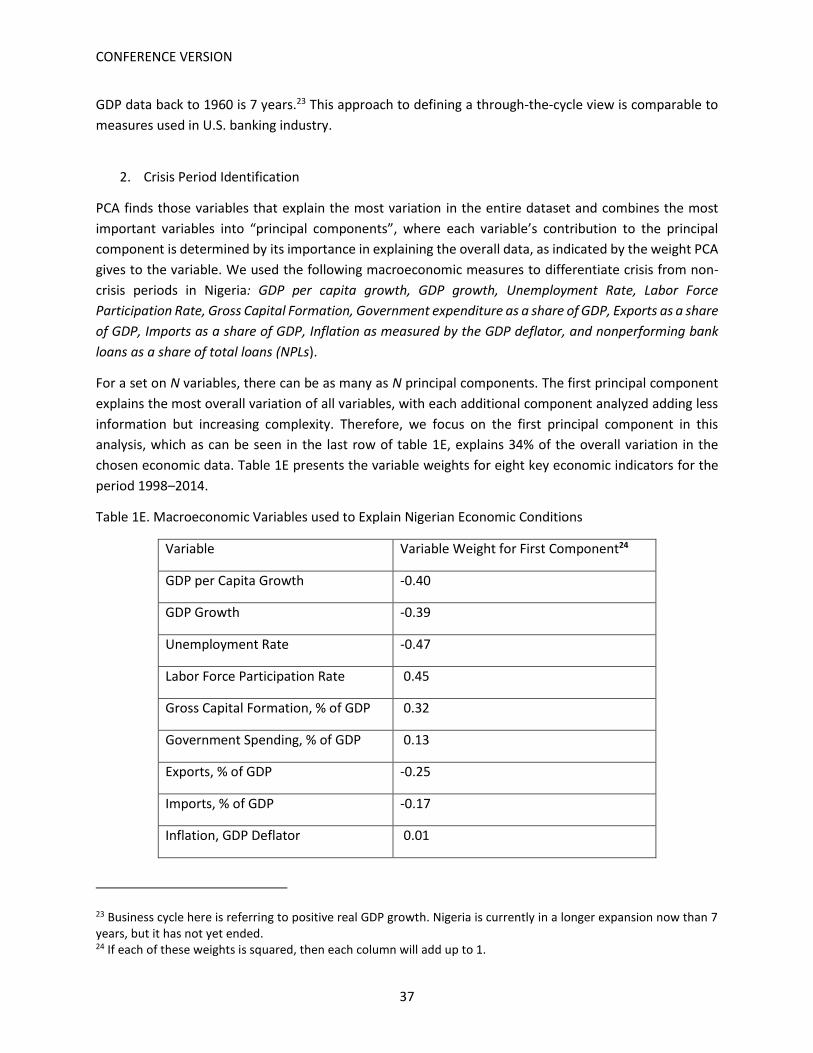
CONFERENCE VERSION
37
GDP data back to 1960 is 7 years.23 This approach to defining a through-the-cycle view is comparable to
measures used in U.S. banking industry.
2. Crisis Period Identification
PCA finds those variables that explain the most variation in the entire dataset and combines the most
important variables into “principal components”, where each variable’s contribution to the principal
component is determined by its importance in explaining the overall data, as indicated by the weight PCA
gives to the variable. We used the following macroeconomic measures to differentiate crisis from non-
crisis periods in Nigeria: GDP per capita growth, GDP growth, Unemployment Rate, Labor Force
Participation Rate, Gross Capital Formation, Government expenditure as a share of GDP, Exports as a share
of GDP, Imports as a share of GDP, Inflation as measured by the GDP deflator, and nonperforming bank
loans as a share of total loans (NPLs).
For a set on N variables, there can be as many as N principal components. The first principal component
explains the most overall variation of all variables, with each additional component analyzed adding less
information but increasing complexity. Therefore, we focus on the first principal component in this
analysis, which as can be seen in the last row of table 1E, explains 34% of the overall variation in the
chosen economic data. Table 1E presents the variable weights for eight key economic indicators for the
period 1998–2014.
Table 1E. Macroeconomic Variables used to Explain Nigerian Economic Conditions
Variable Variable Weight for First Component24
GDP per Capita Growth -0.40
GDP Growth -0.39
Unemployment Rate -0.47
Labor Force Participation Rate 0.45
Gross Capital Formation, % of GDP 0.32
Government Spending, % of GDP 0.13
Exports, % of GDP -0.25
Imports, % of GDP -0.17
Inflation, GDP Deflator 0.01
23 Business cycle here is referring to positive real GDP growth. Nigeria is currently in a longer expansion now than 7 years, but it has not yet ended. 24 If each of these weights is squared, then each column will add up to 1.

CONFERENCE VERSION
38
Nonperforming Loans, % of Loans -0.24
Overall Explained Variation 0.34
The first principal component characterizes the general level of economic conditions and changes in the
first principal component over time can be used to identify differing economic periods. To assess
Nigerian economic conditions over time we first estimate the first principal component annually using the
variable weights in table 1E and values of the economic indicators as of each year. In equation 1E, PC1 is
the first principal component and is the sum of the products of the variable weights from table 1E and the
value for the corresponding standardized macroeconomic measure for that year.
𝑃𝐶1,2009 = (−0.40) ∗ 𝑃𝑒𝑟 𝐶𝑎𝑝𝑖𝑡𝑎 𝐺𝐷𝑃 𝐺𝑟𝑜𝑤𝑡ℎ2009 + ⋯ + (−0.24) ∗ 𝑁𝑃𝐿/𝐿𝑜𝑎𝑛𝑠 2009 (1E.)
We estimated values for the first principal component for Nigeria between 2000 and 2014 and present
the resulting values, ranked from highest to lowest, in table 2E.
Table 2E. Ranked First Principal Component
Year Component 1
2014 2.61
2013 2.52
2012 2.12
1998 1.62
1999 1.30
2011 1.13
2010 0.66
2008 -0.23
2007 -0.44
2009 -0.45
2000 -0.46
2001 -0.71
2005 -0.81
2006 -1.05
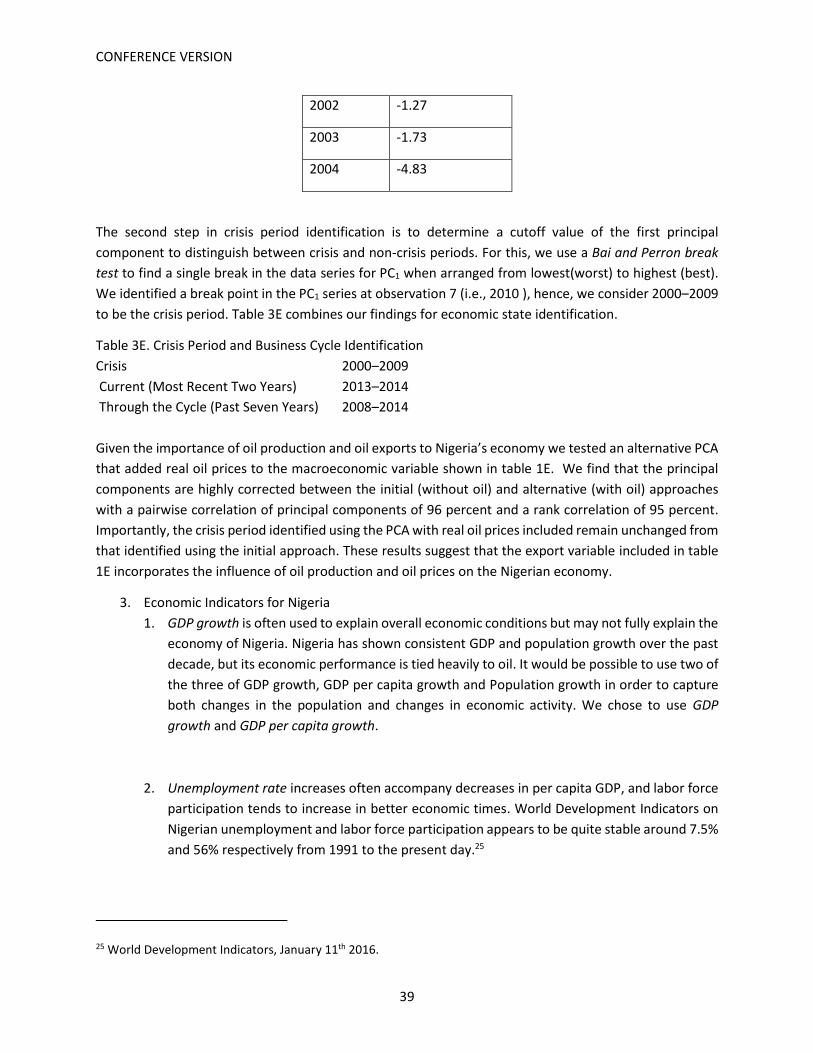
CONFERENCE VERSION
39
2002 -1.27
2003 -1.73
2004 -4.83
The second step in crisis period identification is to determine a cutoff value of the first principal
component to distinguish between crisis and non-crisis periods. For this, we use a Bai and Perron break
test to find a single break in the data series for PC1 when arranged from lowest(worst) to highest (best).
We identified a break point in the PC1 series at observation 7 (i.e., 2010 ), hence, we consider 2000–2009
to be the crisis period. Table 3E combines our findings for economic state identification.
Table 3E. Crisis Period and Business Cycle Identification
Crisis 2000–2009
Current (Most Recent Two Years) 2013–2014
Through the Cycle (Past Seven Years) 2008–2014
Given the importance of oil production and oil exports to Nigeria’s economy we tested an alternative PCA
that added real oil prices to the macroeconomic variable shown in table 1E. We find that the principal
components are highly corrected between the initial (without oil) and alternative (with oil) approaches
with a pairwise correlation of principal components of 96 percent and a rank correlation of 95 percent.
Importantly, the crisis period identified using the PCA with real oil prices included remain unchanged from
that identified using the initial approach. These results suggest that the export variable included in table
1E incorporates the influence of oil production and oil prices on the Nigerian economy.
3. Economic Indicators for Nigeria
1. GDP growth is often used to explain overall economic conditions but may not fully explain the
economy of Nigeria. Nigeria has shown consistent GDP and population growth over the past
decade, but its economic performance is tied heavily to oil. It would be possible to use two of
the three of GDP growth, GDP per capita growth and Population growth in order to capture
both changes in the population and changes in economic activity. We chose to use GDP
growth and GDP per capita growth.
2. Unemployment rate increases often accompany decreases in per capita GDP, and labor force
participation tends to increase in better economic times. World Development Indicators on
Nigerian unemployment and labor force participation appears to be quite stable around 7.5%
and 56% respectively from 1991 to the present day.25
25 World Development Indicators, January 11th 2016.

CONFERENCE VERSION
40
3. Nonperforming loans indicate bank distress and a high number of nonperforming loans means
a high probability of banks defaulting and higher deposit insurance costs in the event of
default. NPL data are available from World Development Indicators, with NPLs generally
falling over time, albeit with a large, short-lived spike in NPLs during the 2009–2010 financial
crisis.
4. Gross Capital Formation is a measure of investment that could also be used to summarize
economic conditions and Gross Capital Formation is available for a long span of time for
Nigeria. Capital formation has risen in recent years compared to its low levels before
5. Government expenditure could be a relevant determinant of economic activity as a counter-
cyclical economic force in downturns; on the other hand, it could behave as a pro-cyclical
force if governments tend to over-spend in good times and cut back in bad times. Here, it
shows a sign of counter-cyclicality as it was highest during 2009-2010 since the 1990’s.
6. Exports and Imports; as an oil dependent country export volume is likely to be an important
factor in economic performance, and trade data is available for a long span for Nigeria. These
have both fallen in recent years.
7. GDP deflator reflects average price levels. High inflation could be a sign of economic
mismanagement from monetizing debt or other commodity induced distress. Inflation is
variable in Nigeria.26
26 World Development Indicators, February 10th 2016.

CONFERENCE VERSION
41
Appendix F – Estimating Bank Failure Probability
This appendix discusses our approach to estimating bank failure probabilities based on statistical models
and Rating Agency studies of bank failure rates.
1. Selecting a Failure Horizon
An initial consideration for deposit insurers is to select the time horizon over which to measure failure-
resolution costs when determining the target deposit insurance fund. That choice requires the deposit
insurer to weigh the trade-offs between the insurer’s risk tolerance and the financial burden deposit
insurance premiums place on banks and the public.27 If, for example, a deposit insurer wishes to be able
to absorb potential failure resolution costs over a two-to-three year period, the required insurance
premiums and target fund might be considerably higher than for a one year period. There are also
practical implications for fund management that come with expanding the target fund time horizon.
Determining the target insurance fund under a long-term perspective requires long-term forecasts of bank
failures, insured deposits at failure and loss rates given failure.
It is generally acknowledged that long-term predictions are more error prone than short-term predictions.
For example, bank-failure prediction models become increasingly less accurate as the failure prediction
horizon increases. This is because short-term bank failure prediction models find failures are associated
current financial distress (e.g., high levels of nonperforming loans, operating losses and illiquidity) that
lead to capital depletion, while long-term failure prediction models find failures are associated with weak
bank franchise value and poor managerial decisions (e.g., reliance on non-core deposit funding and high
levels of out-of-market lending) even though current financial condition and capital levels are sound.
Given the two very different profiles of failed banks (short-term and long-term), and the difficulty in
making long-term failure predictions, it is challenging to establish an accurate forward looking target fund
framework beyond one year. As an alternative to forward looking loss modelling, the deposit insurer can
use historical experience to determine target fund levels that would absorb losses based on, for example,
cumulative two-to-three year insurance losses that occurred during previous financial crises.
To accommodate short-term and long-term perspectives in target fund design we include three bank-
failure forecast horizons in the target fund framework—one-, two- and three-year cumulative failure
rates. We obtained historical failure rates from the FitchRatings (2013a) study on global bank failure rates
between 1990 and 2011 (see Appendix F for details on the FitchRatings study). Table 1F presents historical
cumulative failure rates from the FitchTatings (2013a) study.28
27 In addition to the cost of deposit insurance premiums, there are costs associated with reallocation of capital from banks and the public to the deposit insurer. Higher deposit insurance costs reduce bank capital and lending. Higher insurance costs are also borne by bank customers through higher interest rates on loans and lower interest rates on deposits. The extent to which deposit insurance costs are borne by bank customers versus banks depends on the elasticity of supply and demand for banking services in affected markets. 28 See “Global Bank Rating Performance Study: 1990-2012”, Special Report, FitchRatings (November 27,
2013).

CONFERENCE VERSION
42
Table 1F. Cumulative Bank Failure Rates from FitchRatings (2013) Study
Economic State Period One Year Two Year Three Year
Crisis Period 2008-2009 4.92% 7.29% 7.70%
Through-the-Cycle 1990-2011 1.77% 3.66% 5.61%
Current Period 2011 1.82% 2.61% 8.59%
2. Statistical Forecasts of Bank Failure Risk
As discussed previously, the CBN did not allow Deposit Money Banks to fail during the 2007 – 2009
financial crisis. Nigeria has, however, adopted prompt corrective action policies that call for CBN to inject
capital into banks whose Capital Adequacy Ratio (tier 1 and tier 2 capital-to-Risk Weighted Assets) is
between zero and two percent and requires shareholders to recapitalize banks within 6 months. We
therefore developed a statistical bank-failure prediction model based on bank capital adequacy measures
as proxies for bank failure.
We developed several bank-failure prediction models based on alternative capital adequacy measures
using logistic regression. The models assume failure occurs if a bank’s Capital Adequacy Ratio is below a
designated threshold. We compared models based on two alternative capital adequacy measures—equity
plus reserves-to-book assets and tier 1 plus tier 2 capital-to-risk weighted assets. We used a 2 percent
threshold for critically undercapitalized status, in line with CBN and U.S. PCA policies. We found the best
results in terms of model explanatory power and intuition of results were those based on the equity plus
reserves-to-assets ratio. We also tested alternative groups of explanatory variables designed to measure
banks’ capital adequacy, asset quality, management, earnings, liquidity and sensitivity to market risk.
Table 1F presents the results for the preferred failure model, based on values for explanatory variables at
year-ends 2009 to 2013 and “PCA” failure events the following year. As shown in table 1F, the likelihood
of a bank failing increases with its overhead expenses, net fixed assets, net noncore fund dependence and
nonperforming assets. Conversely, the probability of failure decreases as liquid assets increase.
We can predict a bank’s probability of “PCA” failure within one year using the estimated coefficients for
the explanatory variables in table 2F and current values for the explanatory variables for each bank. For
the purposes of the target deposit insurance fund model we predict banks’ failure probabilities using the
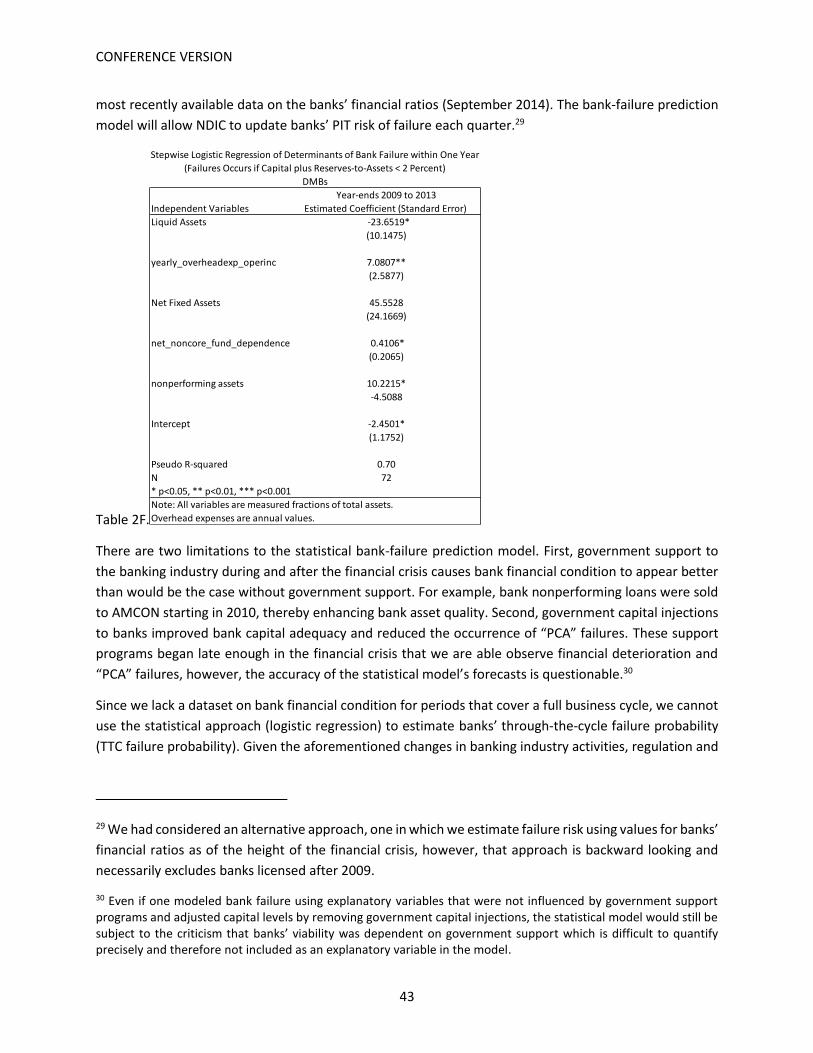
CONFERENCE VERSION
43
most recently available data on the banks’ financial ratios (September 2014). The bank-failure prediction
model will allow NDIC to update banks’ PIT risk of failure each quarter.29
Table 2F.
There are two limitations to the statistical bank-failure prediction model. First, government support to
the banking industry during and after the financial crisis causes bank financial condition to appear better
than would be the case without government support. For example, bank nonperforming loans were sold
to AMCON starting in 2010, thereby enhancing bank asset quality. Second, government capital injections
to banks improved bank capital adequacy and reduced the occurrence of “PCA” failures. These support
programs began late enough in the financial crisis that we are able observe financial deterioration and
“PCA” failures, however, the accuracy of the statistical model’s forecasts is questionable.30
Since we lack a dataset on bank financial condition for periods that cover a full business cycle, we cannot
use the statistical approach (logistic regression) to estimate banks’ through-the-cycle failure probability
(TTC failure probability). Given the aforementioned changes in banking industry activities, regulation and
29 We had considered an alternative approach, one in which we estimate failure risk using values for banks’
financial ratios as of the height of the financial crisis, however, that approach is backward looking and
necessarily excludes banks licensed after 2009.
30 Even if one modeled bank failure using explanatory variables that were not influenced by government support programs and adjusted capital levels by removing government capital injections, the statistical model would still be subject to the criticism that banks’ viability was dependent on government support which is difficult to quantify precisely and therefore not included as an explanatory variable in the model.
Year-ends 2009 to 2013
Independent Variables Estimated Coefficient (Standard Error)
Liquid Assets -23.6519*
(10.1475)
yearly_overheadexp_operinc 7.1438** (2.5219)7.0807**
(2.5877)
Net Fixed Assets 45.5528
(24.1669)
net_noncore_fund_dependence 0.4152* (0.2044) 0.4106*
(0.2065)
nonperforming assets 10.2215*
-4.5088
Intercept -2.4501*
(1.1752)
Pseudo R-squared 0.70
N 72
* p<0.05, ** p<0.01, *** p<0.001
Note: All variables are measured fractions of total assets.
Overhead expenses are annual values.
Stepwise Logistic Regression of Determinants of Bank Failure within One Year
(Failures Occurs if Capital plus Reserves-to-Assets < 2 Percent)
DMBs

CONFERENCE VERSION
44
structure the meaningfulness of a statistical approach to estimating average long-term default probability
would be questionable.
3. Rating Agency-based Forecasts of Bank Failure
To counter the aforementioned weakness in the statistical bank-failure model, we propose supplementing
statistical forecasts of banks’ failure probabilities with forecasts based on banks’ credit ratings. Banks that
issue publicly traded debt receive credit ratings from rating agencies; Fitch, Moody’s, and Standard and
Poor are the three most well know credit rating agencies that rate both the default risk of individual
securities and issuers. Fitch rates banks in most countries and rates the many of the Deposit Money Banks,
hence we use Fitch as the primary source of bank credit ratings.
According to FitchRatings (2014, 2013b, 2011) Fitch credit ratings are designed to rate debt issues and
issuers vulnerability to default, where default refers to failure to meet interest and principal payments on
securities. Since we are primarily interested in banks versus securities, we focus on Fitch Issuer Default
Ratings (IDRs) for banks. Fitch IDRs rate banks’ ability to service outstanding debt and are credit risk
ratings. IDRs do not take into consideration market, liquidity and other risks except to the extent these
risks imping on the ability of the bank to make debt payments.
Fitch bank IDRs have two components: 1) the default vulnerability of the issuer assuming “ordinary
support” from internal and external sources and 2) the likelihood of receiving extraordinary support.
Ordinary support includes support from parent organizations, shareholder support, as well as external
support, such as regular access to a central bank for liquidity. Extraordinary support includes support from
external sources that one would expect to be forthcoming should the bank become in danger of default.
Extraordinary support includes liquidity, guarantees and capital injections. Fitch states that extraordinary
support that was forthcoming in the past is not necessarily assumed to be available in the future, hence,
not all the government programs used to manage the 2007- 2009 financial crisis are assumed by Fitch
analysts to be available in future when they rate banks likelihood of receiving extraordinary support. Since
Fitch IDRs are measures of default risk, regardless of the source of a bank’s financial support, IDRs are the
higher of a bank’s individual rating and support rating.31 Fitch states that IDRs are not designed to be
predictors of the numeric probability of default but rather are ordinal risk measures. As a consequence,
the observed default rates for across all IDR ratings bands vary over economic cycles.
FitchRatings (2013a) reviews the experience of bank issuers of debt globally and presents cumulative
failure rates for one-to-three year horizons by IDR. Fitch points out that issuer default and issuer failure
are not the same thing. An issuer may be able to make debt payments but if that ability is contingent on
the bank receiving extraordinary support, Fitch classifies the bank as “failed” even though it’s not in
31 FitchRatings of issuer default risk have evolved over time, however there has not been any fundamental change of the way Fitch sets IDRs. Specifically, Fitch replaced its Individual Ratings (IRs) with Vulnerability Ratings (VRs) in 2011. The VRs consider the same core risks are IRs but use a more granular rating scale than did IRs.

CONFERENCE VERSION
45
default. More generally, when computing historical issuer failure rates, Fitch includes banks that were
non-viable without external support among the failed banks.
Table 3F lists the current, average long-term and crisis period one year bank failure rates from the 2013
Fitch study. In table 3F we see that bank failure rates increased dramatically for the 2008 – 2009 period
across all IDRs.
Table 3F. Fitch Credit Ratings and Global Bank Failure Rates32
Individual Rating
Long-term IDR Most Current
Available Long-term
Average Crisis Period
Average
Fitch IR Bands
Fitch LT IDR Bands 2011 failure
rate (%)
1990 – 2011 average annual failure rate (%)
2008 – 2009 average annual failure rate (%)
A AAA, AA+, AA 0 1.05 30.0
A/B AA+, AA,AA-,A+,A 0 1.03 9.60
B AA-, A+,A, A- 0 0.77 6.26
B/C A, A-, BBB+, BBB 0 0.90 4.55
C BBB+,BBB, BBB-, BB+ 0.42 1.59 3.58
C/D BBB-, BB+, BB, BB- 1.16 2.03 2.01
D BB, BB-,B+,B,B- 4.60 2.96 2.09
D/E B+,B,B-,CCC 1.72 3.93 7.93
E CCC,CC, C 13.33 7.38 18.16
All Banks 1.82 1.71 4.92
Note that the average bank failure rates in table 3F do not always increase the poorer the Fitch individual
ratings (IRs). Specifically, table 3F shows that average failure rate for A-rated banks exceeds that for B-
rated banks for the 1990–2011 period and the average failure rates for A, B, and C-rated banks exceeds
that for D-rated banks for the 2008–2009 period. The non-monotonic relationship between Fitch IRs and
bank failure rates is not necessarily inconsistent with the definitions of IRs and bank failures in the Fitch
2013 study. Recall that Fitch classified some banks as failed due to reliance on extraordinary support even
though these same banks made debt payments. In our model the historical average failure rates for A-
rated banks are capped at the corresponding historical average rate for B-rated banks.
Fitch does not rate all Nigerian banks and the other ratings agencies have not done studies of bank failure
rates that are as detailed as that done by Fitch. To address these data gaps we must either map other
32 See “Global Bank Rating Performance Study: 1990-2012”, FitchRatings, November 27, 2013, p. 9.
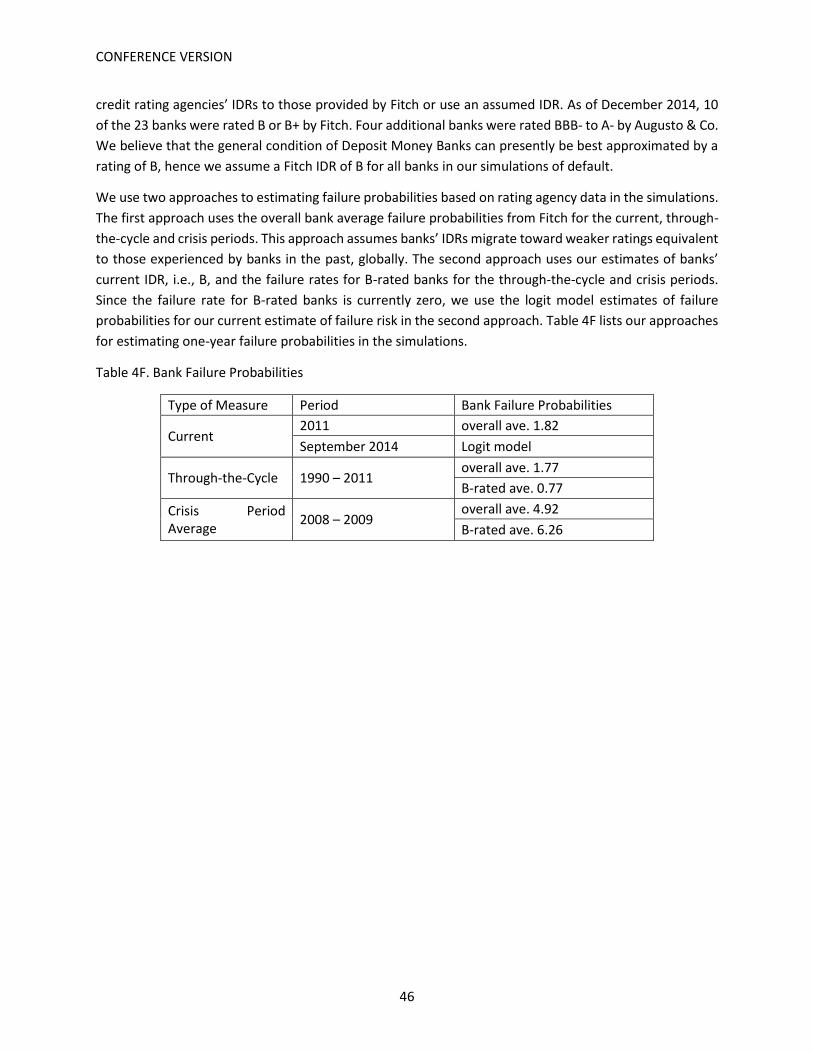
CONFERENCE VERSION
46
credit rating agencies’ IDRs to those provided by Fitch or use an assumed IDR. As of December 2014, 10
of the 23 banks were rated B or B+ by Fitch. Four additional banks were rated BBB- to A- by Augusto & Co.
We believe that the general condition of Deposit Money Banks can presently be best approximated by a
rating of B, hence we assume a Fitch IDR of B for all banks in our simulations of default.
We use two approaches to estimating failure probabilities based on rating agency data in the simulations.
The first approach uses the overall bank average failure probabilities from Fitch for the current, through-
the-cycle and crisis periods. This approach assumes banks’ IDRs migrate toward weaker ratings equivalent
to those experienced by banks in the past, globally. The second approach uses our estimates of banks’
current IDR, i.e., B, and the failure rates for B-rated banks for the through-the-cycle and crisis periods.
Since the failure rate for B-rated banks is currently zero, we use the logit model estimates of failure
probabilities for our current estimate of failure risk in the second approach. Table 4F lists our approaches
for estimating one-year failure probabilities in the simulations.
Table 4F. Bank Failure Probabilities
Type of Measure Period Bank Failure Probabilities
Current 2011 overall ave. 1.82
September 2014 Logit model
Through-the-Cycle 1990 – 2011 overall ave. 1.77
B-rated ave. 0.77
Crisis Period Average
2008 – 2009 overall ave. 4.92
B-rated ave. 6.26

CONFERENCE VERSION
47
Appendix G – Determinants of Nigerian Deposit Insured Fund Losses: Loss Given Default (LGD)
This document discusses potential determinants of NDIC Deposit Insurance Fund (DIF) losses. Sections 1
and 2 discuss those portions of the NDIC Act of 2006 (hereafter, The NDIC Act) that influence DIF losses.
Section 3 describes the key cash inflows and outflows that determine DIF losses and section 4 presents
information on Deposit Money Bank (DMB) closings between 1994 and 2006. In the immediate post-2006
period the government of Nigeria assisted critically undercapitalized DMBs though a variety of programs,
including capital injections, asset purchases, liquidity support and mergers. Therefore, we do not observe
DMB closings during the 2006–2012 period. There was one DMB closing in 2013, however.
The Deposit Insurance Act of 2006 gives the NDIC the ability establish a deposit insurance fund for each
type of insured bank and to set the level of deposit insurance coverage. 33 Presently, each depositor is
insured up to a maximum of NGN 500,000 (USD 2,525)34 per depositor, per insured bank for Deposit
Money Banks and NGN 200,000 (USD1,010) for Microfinance and Primary Mortgage Banks.35 Insurance
coverage includes principal and interest for all accounts held by the depositor per bank. NDIC states that
the majority of funds deposited with banks are insurable, including savings deposits, time deposits,
current account deposits and foreign currency account deposits. There are exclusions from deposit
insurance, however:
“All deposits of a licensed bank or any other financial institution shall be insured with the Corporation
with the exception of the following:
(a) insider deposits, that is, deposits of staff including directors of the insured institutions;
(b) counterclaims from a person who maintains both deposit and loan account, the former serving as a
collateral for the loan; or
(c) such other deposits as may be specified from time to time by the Board.”36
Nigerian banks hold substantial amounts of deposits from federal, state and local governments. As of
September 2014, government deposits comprised 16% of total Deposit Money Bank deposits and the
percentage of bank deposits from government sources was as much as 35% of some banks’ deposits. The
relatively low limit on deposit insurance combined with large government, business and interbank
deposits may explain why insured deposits are a relatively small fraction (12.9%) of total deposits despite
the fact that NDIC estimates that 97% of depositors are insured.
33 See “Nigerian Deposit Insurance Corporation Act (December 29, 2006), Federal Republic of Nigeria Official Gazette Lagos Nigeria, Vol. 93, No. 73. 34 U.S. dollar insured deposit levels based on Dollar/Naira exchange rate as on March 13, 2015 (1 USD = 200 NGN) 35 See NDIC website at http://ndic.gov.ng/frequently-asked-questions/ 36 See “Nigerian Deposit Insurance Corporation Act” (December 29, 2006).

CONFERENCE VERSION
48
1. Bank Closures
Upon the revocation of a bank’s license by the Central Bank of Nigeria (CBN), the Nigerian Deposit
Insurance Corporation (NDIC) is appointed provisional receiver and applies to the Federal High Court for
an order to wind up the affairs of the failed bank. In some instances individuals may contest a bank closure
and/or NDIC’s appointment as receiver. If the closure or receivership appointment is contested the NDIC
cannot make payments to insured depositors, as well as pay liquidation dividends to other claimants, until
the case has been decided by the courts. NDIC also has the power to terminate a bank’s deposit insurance
which would effectively cause closure.
“(7) Where in any action challenging the revocation of the license of an insured institution or a petition
for winding up the affairs of an insured institution or the appointment of the Corporation as liquidator, an
application for an interim or interlocutory injunction is brought against the Corporation seeking to restrain
the Corporation from paying depositors of a failed or failing institution, the trial court shall refer such
application to the Court of Appeal for determination; provided that such a referral to the Court of Appeal
shall not on its own operate as a stay of proceedings at the trial court; provided further that such
application for interim interlocutory injunction shall be determined by such Appeal Court within 60 days
of such referral, failing which it shall lapse.”37
2. Failure-resolutions
The bank failure-resolution process has three main elements: (1.) NDIC makes payments to insured
depositors using the resources of the Deposit Insurance Fund (DIF), (2.) NDIC reimburses all other bank
creditors using the proceeds (recoveries) from failed-bank asset liquidation and other forms of failure
resolution and (3) NDIC is entitled to receive reimbursement from asset liquidations based on the
subrogated rights of insured depositors.
The NDIC Act stipulates that insured depositors should be paid within 90 days of bank license revocation,
pending proof of ownership of the deposit account. If the NDIC is not satisfied with the proof of account
ownership offered, NDIC may require final determination of ownership by a court. NDIC may make insured
deposit payments either directly to depositors though cash payments or by check, or indirectly through
transfer of insured deposits to another bank. Payments to all uninsured fail-bank creditors are made over
time through liquidation dividends that are based on recoveries from asset liquidations. The dividends are
set after recoveries on liquidation. The liquidation dividend paid is a function of recoveries less cost of
recoveries.
2.1 Factors Affecting Insured Depositor Payments
The NDIC Act includes a clause for the netting of insured depositor claims against all amounts the
depositor owes to the failed-bank on outstanding loans and advances:
“(2) The Corporation may withhold payment of such portion of the insured deposit of any
depositor in a failed insured institution as may be required to provide for the payment of any
37 Nigerian Deposit Insurance Corporation Act of 2006.

CONFERENCE VERSION
49
liability of such depositor to the failed insured institution or its liquidator or receiver, pending the
determination and payment of such liability by such depositor or any other person liable
therefor”38
The NDIC Act also places a time limit of six years for insured depositors to file claims after a bank failure.
Should an insured depositor claim not be made within this time frame, NDIC is refunded the amount that
was transferred to a healthy bank on the depositor’s behalf or can otherwise cancel the claim. Further,
insured depositor claims after expiration of the six-year time limit cannot be enforced by any court
proceedings.
“(4) If, after the Corporation shall have given at least three months' notice to pay to every
depositor by mailing a copy to his last known address appearing in the records of the failed
insured institution, and publishing a general notice in at least two national dailies and two
electronic media houses with national coverage, notifying insured depositors of the particular
failed insured institution of the dates and venue for payment, any depositor of the failed insured
institution who--
(a) fails to claim his insured deposit from the Corporation within six years after the
notice of the Corporation has been sent to the depositor and the notice of payment to
the depositors is published in two national dailies and electronic media houses, shall
forfeit such sums to the Corporation; or
(b) fails within such period to claim or arrange to continue the transferred deposit with
the new insured institution, all the rights of the depositor against the failed insured
institution or its shareholders or the receivership estate to which the Corporation may
have become subrogated shall thereupon revert to the Corporation.
(5) The amount of any transferred deposit not claimed within the period stated in sub-section (4)
(b) of this section shall be refunded to the Corporation.”39
2.2 Asset Liquidations and Uninsured Creditor Claims
NDIC categorizes receivership assets in three groups: 1.) Risk Assets (bank loans and advances), 2.) Physical
Assets (e.g., bank property, premises and equipment) and 3.) Investments (i.e., marketable securities held
by the failed bank). The amount bank loan customers owe the failed bank receivership is fixed at
outstanding interest and principle as of the bank’s failure date. Bank loan customers are responsible for
repaying outstanding balances to NDIC, net of their insured deposit balances at the failed bank.
38 Nigerian Deposit Insurance Corporation Act of 2006. 39 Nigerian Deposit Insurance Corporation Act of 2006.

CONFERENCE VERSION
50
In place of asset liquidations the NDIC may also transfer all or some portion of a failed-bank’s risk assets
and deposits to a healthy bank under a purchase and assumption transaction.40 For investments and
physical assets in receivership, NDIC obtains appraisals of the market values prior to selling these assets.
NDIC is empowered to hire outside vendors to assist with asset liquidations.
“42. Power to appoint agents The Corporation may, when acting as liquidator of a failed insured institution, appoint an agent or agents
to assist it in the performance of its duties, and all fees, compensation and expenses of liquidation and
administration thereof shall be fixed and paid by the Corporation from the realized assets of the failed
insured institution.”41
The proceeds from liquidations of failed-bank assets are used to make payments to all bank creditors,
including NDIC’s subrogated claim, as well as to reimburse appointed agents for their expenses. NDIC
receivership expenses are reimbursed before bank creditors. Liquidation expenses are treated as first
charge from the recoveries before payment of liquidation dividends to other claimants.
2.2.1 Priority of Claimants
An important determinant of NDIC losses is how asset recoveries are disbursed—liquidation dividends are
based solely on each claimant’s pro-rate share of total claims.
The NDIC Act states that the NDIC’s subrogated claim has no priority over that of uninsured depositors
and other creditors, hence, NDIC is reimbursed for insurance losses based on its pro-rata share of bank
depositor claims. Similarly, liquidation dividends paid to depositors are based solely on each claimant's
pro-rata share of total claims.
“(2) The Corporation [NDIC] upon the payment of any depositor as provided in subsection (I) [i.e., insured
depositors] of this section shall be subrogated to all rights of the depositor against the failed insured
institution to the extent of such payment; and such subrogation shall include the right on the part of the
Corporation to receive the same dividends from the proceeds of the assets of such failed insured
institution and recoveries on account of shareholder’s liabilities as would have been payable to the
depositor for any uninsured portion of his deposit.”
“(3) (a) The Corporation acting as liquidator-
shall pay to the Corporation such portion of the amount realized from such liquidation as it shall
be entitled to receive on account of its subrogation to the claims of depositors and shall pay to
depositors and other creditors the net amount available for distribution to them;
40 NDIC may also arrange the merger of a failing but operating bank with a healthy bank allowing for the transfer of all or a portion of deposits and assets to another bank. Similarly, NDIC may create a bridge bank to which the assets and liabilities of the failed bank are transferred. Bridge banks and failing-bank mergers should not be confused with a closed bank purchase and assumption transaction, however. 41 Nigerian Deposit Insurance Corporation Act of 2006.
CONFERENCE VERSION
51
may pay dividends on proved claims at any time after the expiration of the period of advertisement made
pursuant to subsection (1) of this section and no liability shall attach to the Corporation itself by reason
of any such payment or for failure to pay dividend to a claimant whose claim is not proved.”42
Among claimants, deposits have preference over all other non-secured, non-preferred claimants.43
3. NDIC Losses
The previous discussion and academic literature suggest that there are three general factors that
determine NDIC losses—systematic, idiosyncratic and institutional. Systematic factors are comprised of
macroeconomic conditions that influence the market value of loans, securities and physical assets.
Idiosyncratic factors are those bank-specific determinants of asset values, such as failed-bank customers’
ability to repay loans. Finally, institutional factors include the legal and regulatory environment within
which NDIC, CBN and insured banks operate.
3.1 NDIC Loss Predictability
Based on the aforementioned three factors, the realizable values for some categories of failed-bank assets
might be more predictable that others. The market values of bank investments and physical assets at any
point in time should be largely independent of the bank that held them. NDIC valuation of failed-bank
assets is done using both model-based appraisals and appraisals based on comparable asset sales. Model-
based appraisals (specifically investment method) are used more often than are appraisals based on
comparable asset sales due to the general absence of comparable assets. The information on the valuation
method adopted in individual cases are not readily available, however.
Net recoveries on risk assets will reflect bank lending standards and borrowers’ ability to repay loans and
hence, are behaviorally determined and influenced by incentives created by the legal and regulatory
environment. Legal impediments to pursuing debt collections and logistical impediments, such as poor
record systems at failed banks, would reduce recoveries on risk assets. For these reasons, we anticipate
higher recovery rates on investment and physical assets than those for risk assets.
Table 1G lists the components of risk, investment and physical assets as measured on DMB’s balance
sheets as reported to NDIC and CBN.
42 Nigerian Deposit Insurance Corporation Act of 2006. 43 The existence of depositor preference was stated NDIC senior staff during meetings with World Bank in Abuja, Nigeria February 23-24, 2016.
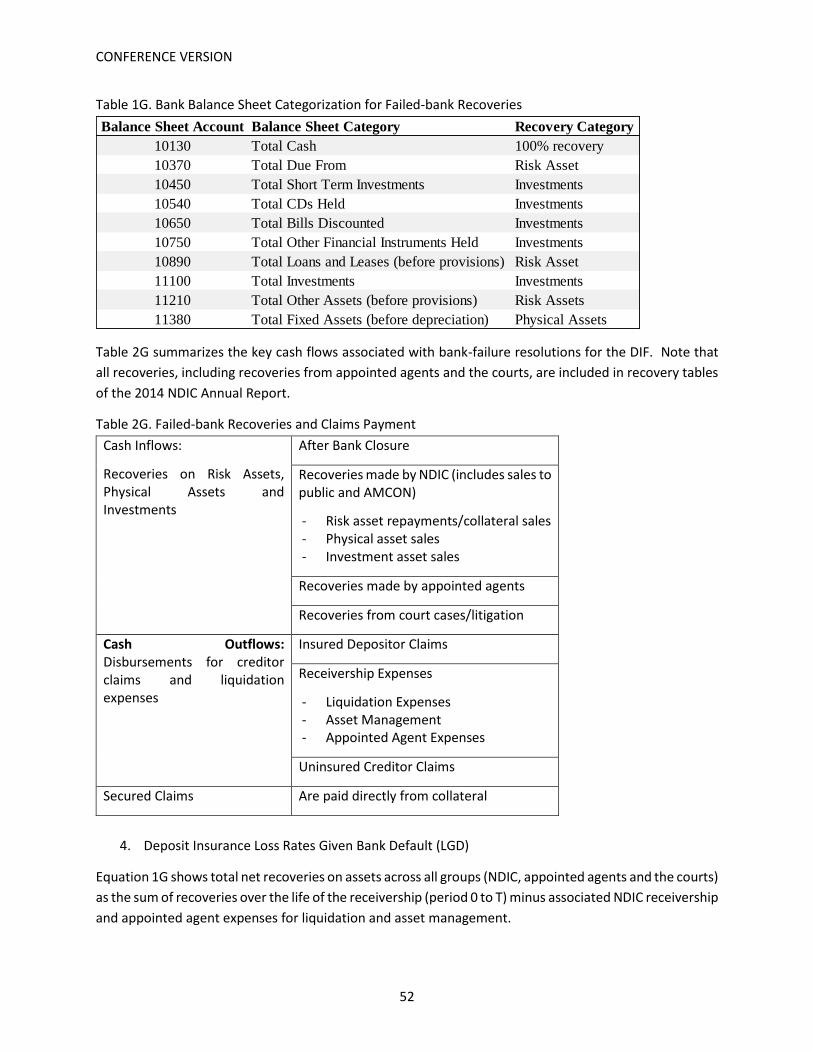
CONFERENCE VERSION
52
Table 1G. Bank Balance Sheet Categorization for Failed-bank Recoveries
Table 2G summarizes the key cash flows associated with bank-failure resolutions for the DIF. Note that
all recoveries, including recoveries from appointed agents and the courts, are included in recovery tables
of the 2014 NDIC Annual Report.
Table 2G. Failed-bank Recoveries and Claims Payment
Cash Inflows:
Recoveries on Risk Assets, Physical Assets and Investments
After Bank Closure
Recoveries made by NDIC (includes sales to public and AMCON)
- Risk asset repayments/collateral sales - Physical asset sales - Investment asset sales
Recoveries made by appointed agents
Recoveries from court cases/litigation
Cash Outflows: Disbursements for creditor claims and liquidation expenses
Insured Depositor Claims
Receivership Expenses
- Liquidation Expenses - Asset Management - Appointed Agent Expenses
Uninsured Creditor Claims
Secured Claims Are paid directly from collateral
4. Deposit Insurance Loss Rates Given Bank Default (LGD)
Equation 1G shows total net recoveries on assets across all groups (NDIC, appointed agents and the courts)
as the sum of recoveries over the life of the receivership (period 0 to T) minus associated NDIC receivership
and appointed agent expenses for liquidation and asset management.
Balance Sheet Account Balance Sheet Category Recovery Category
10130 Total Cash 100% recovery
10370 Total Due From Risk Asset
10450 Total Short Term Investments Investments
10540 Total CDs Held Investments
10650 Total Bills Discounted Investments
10750 Total Other Financial Instruments Held Investments
10890 Total Loans and Leases (before provisions) Risk Asset
11100 Total Investments Investments
11210 Total Other Assets (before provisions) Risk Assets
11380 Total Fixed Assets (before depreciation) Physical Assets

CONFERENCE VERSION
53
∑ 𝑇𝑜𝑡𝑎𝑙 𝑁𝑒𝑡 𝑅𝑒𝑐𝑜𝑣𝑒𝑟𝑖𝑒𝑠𝑡𝑇𝑡=0 = ∑ 𝑅𝑒𝑐𝑜𝑣𝑒𝑟𝑖𝑒𝑠𝑡
𝑇𝑡=0 − ∑ 𝐿𝑖𝑞𝑢𝑖𝑑𝑎𝑡𝑖𝑜𝑛 𝐸𝑥𝑝𝑒𝑛𝑠𝑒𝑠𝑡
𝑇𝑡=0 (1G)
NDIC’s share of total net recoveries is determined by its subrogated claim, or the proportion of insured
deposits-to-total deposits.
𝑁𝑒𝑡 𝑅𝑒𝑐𝑜𝑣𝑒𝑟𝑖𝑒𝑠 𝑡𝑜 𝑁𝐷𝐼𝐶 = ∑ 𝑇𝑜𝑡𝑎𝑙 𝑁𝑒𝑡 𝑅𝑒𝑐𝑜𝑣𝑒𝑟𝑖𝑒𝑠𝑡𝑇𝑡=0 ∗
𝐼𝑛𝑠𝑢𝑟𝑒𝑑 𝐷𝑒𝑝𝑜𝑠𝑖𝑡𝑠𝑡=0
𝑇𝑜𝑡𝑎𝑙 𝐷𝑒𝑝𝑜𝑠𝑖𝑡𝑠𝑡=0 (2G)
Since insured deposits are typically a small fraction of total deposits NDIC’s share of net recoveries will be
small.44
𝑁𝑒𝑡 𝑅𝑒𝑐𝑜𝑣𝑒𝑟𝑖𝑒𝑠 𝑡𝑜 𝑁𝐷𝐼𝐶 = ∑ 𝑇𝑜𝑡𝑎𝑙 𝑁𝑒𝑡 𝑅𝑒𝑐𝑜𝑣𝑒𝑟𝑖𝑒𝑠𝑡𝑇𝑡=0 ∗ (𝑁𝐷𝐼𝐶 𝑆ℎ𝑎𝑟𝑒) (3G)
Given the relatively low recovery rates on risk assets, which make up the vast majority of total bank assets,
we can expect total net recovery rates for NDIC to be small too.
𝑁𝑒𝑡 𝑅𝑒𝑐𝑜𝑣𝑒𝑟𝑖𝑒𝑠 𝑡𝑜 𝑁𝐷𝐼𝐶 = ∑ (𝑅𝐴𝑡 + 𝑃𝐴𝑡 + 𝐼𝐴𝑡)𝑇𝑡=0 (𝑁𝐷𝐼𝐶 𝑆ℎ𝑎𝑟𝑒) (4G)
Equation 5G shows the net cash flows to NDIC are net recoveries minus insured depositor claims that have
been paid. Should the six-year claims filing limit be reached, this is also realizable net revenue to NDIC.
𝑁𝑒𝑡 𝐶𝑎𝑠ℎ 𝑡𝑜 𝑁𝐷𝐼𝐶 = 𝑁𝑒𝑡 𝑅𝑒𝑐𝑜𝑣𝑒𝑟𝑖𝑒𝑠 𝑡𝑜 𝑁𝐷𝐼𝐶 − ∑ 𝐼𝑛𝑠𝑢𝑟𝑒𝑑 𝐷𝑒𝑝𝑜𝑠𝑖𝑡𝑜𝑟 𝐶𝑙𝑎𝑖𝑚𝑠𝑡𝑇𝑡=0 (5G)
It is important to point out that not all insured depositors file claims. Based on the 2014 NDIC Annual
Report approximately 56% of total insured deposits for 48 failed DMBs were claimed between 1994 and
2014, thereby offsetting cash outflows to claimants.
4.1 1994 – 2006 Failed-bank Resolutions
Tables 3G through 5G present information on DMB closings, recoveries and insured deposit claims for
banks closed between 1994 and 2006. These data are based entirely on tables in the 2014 NDIC Annual
Report and are used to provide historical estimates of LGD. We next review each component of LGD and
discuss historical trends in the components.
4.1.1 Net Recoveries
Table 3G shows the composition of net recoveries; risk assets and physical assets comprise 52% and 46%
of total recoveries on average, respectively. In terms of banks’ asset composition, however, risk assets
and physical assets are very different shares of total assets. While we lack historical data on bank assets
at closing with which to compute risk asset and physical asset shares, as of September 2014 risk assets
and physical assets averaged 66% and 6% of DMBs’ total assets, respectively. We expect the relative
shares of total assets that risk assets and physical assets each comprise to be relatively stable over time
since bank’s needs for property, plant and equipment are driven by technology and concentrations in risk
asset are driven by the need for earning assets. Hence, we use today’s DMB asset composition as a
benchmark for that of previously closed banks.
44 Based on bank closings between 1994 and 2006, the weighted average percentage of deposits that were insured is 6%.

CONFERENCE VERSION
54
Risk Assets
We have sufficient data to estimate recovery rates on risk assets; table 4G shows very low recovery rates
on risk assets for banks closed between 1994 and 2006. The average recovery rate on risk assets
(recoveries-to-initial risk asset book value) between 1994 and 2006 is 19% but recovery rates for the crisis
period, 2000-2006, fell to 12%. Since there are few failures over the 2008-2014 period used as our
through-the-cycle period, we use the 1994-2006 recovery rates as a proxy for the through-the-cycle view
of the economy. Similarly, we lack recent failures to estimate recovery rates for the 2013-2014 period or
current view of the economy. We adopt an approach suggested by NDIC, which is to use an average of
the crisis period and through-the-cycle period recovery rates at 16%.
Investment Assets
Table 3G suggests there is little data on investment asset recoveries with which one can estimate recovery
rates. Table 5G provides recovery rates on investment assets for eleven closed DMBs, however, data for
two DMBs may be erroneous given the recovery rates well over 100%. Based on all other banks in table
5G, the average recovery rate between 2000 and 2006 on investment assets is approximately 14%. Since
we lack data on investment asset recovery rates for most of the 2000-2009 crisis period we will assume
recovery rates on investment assets decline during the crisis period in the same manner as recovery rates
did for risk assets, i.e., decline by 35%. Under this assumption the crisis period recovery rate for
investment assets is assumed to be 9%. Finally, as was the case for risk assets, we assume current period
recovery rates on investment assets are an average of through-the-cycle and crisis period average rates
or 12%. Note that NDIC stated that the lack of investment asset recoveries for most closed banks in table
3G is due to bank sales of investment assets prior to failure, and those remaining on books are likely lower
quality.
Physical Assets
The relatively large share of total recoveries that physical assets have comprised, despite the small
proportion of total assets they comprise, suggests very high recovery rates on physical assets. While we
lack sufficient data for historical estimates of physical asset recovery rates, we will assume a baseline
physical recovery rate of 80% for the through-the-cycle view of the economy. We also use a similar
approach to setting assumed physical asset recovery rates for crisis period (50%) and current periods
(65%) as was used for risk assets and investment assets. Table 6G presents the combined recovery rates
and assumed rates for the three views of the economy.
NDIC Share of Recoveries
Table 6G presents the proportion of total deposits that are insured which is also NDIC’s estimate share of
receivership recoveries for DMB’s as of September 2014. We use bank’s current insured deposits-to-total
deposit ratio to estimate NDIC’s share of potential receivership recoveries.
Exposure at Default
Table 6G shows insured and total deposits at closure for banks closed between 1994 and 2006. The overall
average percentage of total deposits that were insured at closing is approximately 17% but shows
substantial variation. Insured deposits comprise a very low proportion of total deposits among closed

CONFERENCE VERSION
55
Merchant Banks (3%) and a much higher proportion of deposits among all other banks (25%), however
this is substantial variability in insured deposit levels among the all other bank group. Further, we find
insured deposits comprise a much smaller proportion of total deposits among the largest banks, as shown
in figure 1G. Given the strong correlation between insured deposit levels and bank type and deposit size
we will use bank’s most recently reported insured deposits as our measure of exposure for insurance
losses under the assumption that NDIC does not cover uninsured claimants.

CONFERENCE VERSION
56
Figure 1G
5. Predicting NDIC Loss Given Bank Default
We next combine our parameter estimates and assumptions for the loss given default prediction. To
begin, net recoveries are estimated by the sum of the products of benchmark asset recovery rates and
current asset levels for our three categories of assets—risk, physical and investment—as shown in
equation 9G.
𝑁𝑒𝑡 𝑅𝑒𝑐𝑜𝑣𝑒𝑟𝑖𝑒𝑠 = (0.19 ∗ 𝑅𝐴𝑡 + 0.80 ∗ 𝑃𝐴𝑡 + 0.14 ∗ 𝐼𝐴𝑡) (9G)
Net recoveries that NDIC may claim are estimated by the product of net recoveries and NDIC’s estimated
share of recoveries, as given by the ratio of a bank’s current insured deposits-to-total deposits (equation
10G.)
𝑁𝑒𝑡 𝑅𝑒𝑐𝑜𝑣𝑒𝑟𝑖𝑒𝑠 𝑡𝑜 𝑁𝐷𝐼𝐶 = (𝑁𝑒𝑡 𝑅𝑒𝑐𝑜𝑣𝑒𝑟𝑖𝑒𝑠) ∗ (𝐼𝑛𝑠𝑢𝑟𝑒𝑑 𝐷𝑒𝑝𝑜𝑠𝑖𝑡𝑠
𝑡𝑜𝑡𝑎𝑙 𝐷𝑒𝑝𝑜𝑠𝑖𝑡𝑠) (10G)
Finally, we deduct insured deposits from net recoveries to NDIC to get NDIC’s estimated failure resolution
costs or NDIC losses:
𝑁𝐷𝐼𝐶 𝐿𝑜𝑠𝑠𝑒𝑠 = 𝑁𝑒𝑡 𝑅𝑒𝑐𝑜𝑣𝑒𝑟𝑖𝑒𝑠 𝑡𝑜 𝑁𝐷𝐼𝐶 − 𝐼𝑛𝑠𝑢𝑟𝑒𝑑 𝐷𝑒𝑝𝑜𝑠𝑖𝑡𝑠 (11G)
Our analysis of Nigerian economic conditions since 1994 indicates that the economy and banking sector
has yet to undergo a period of severe economic stress. Therefore, we cannot identify a specific crisis
period over which to calibrate the loss model parameters, as used in equations 9G through 11G. We
therefore recommend “scaling” benchmark parameter estimates up or down to simulate crisis and non-
crisis period conditions.
0.0%
10.0%
20.0%
30.0%
40.0%
50.0%
60.0%
70.0%
80.0%
90.0%2
%
6%
10
%
15
%
19
%
23
%
27
%
31
%
35
%
40
%
44
%
48
%
52
%
56
%
60
%
65
%
69
%
73
%
77
%
81
%
85
%
90
%
94
%
98
%
insu
red
/to
tal d
ep
osi
ts (
%)
Ranked Deposit Size
DMB Insured Deposits at Closure(1994 - 2006 closings)

CONFERENCE VERSION
57
Table 3G. Cumulative Recoveries on DMB Closings (NGN millions)
(Recoveries are Net of Liquidation Expenses)
Deposit Money Bank
Date of
Closure
Recoveries on
Risk Assets
Recoveries on
Physical Assets
Recoveries on
Investment Assets
Total
Recoveries
Financial Merchant Bank 1/21/1994 148.98 10.33 159.31
Kapital Merchant Bank 1/21/1994 273.41 41.60 315.01
Alpha Merchant Bank 9/8/1994 907.89 123.06 1030.95
United Commercial Bank 9/8/1994 186.15 44.81 230.96
Republic Bank Ltd 6/29/1995 33.93 176.48 210.41
Abacus Merchant Bank 1/16/1998 41.81 6.37 48.18
ABC Merchant Bank 1/16/1998 77.84 7.23 85.07
Allied Bank of Nigeria 1/16/1998 393.43 789.41 1182.84
Amicable Bank of Nigeria 1/16/1998 28.21 32.69 60.90
Century Merchant Bank 1/16/1998 31.66 17.61 49.27
Commerce Bank Plc 1/16/1998 282.01 224.99 507.00
Commercial Trust Bank 1/16/1998 157.39 71.76 229.15
Continental Merchant Bank 1/16/1998 452.58 1018.26 1470.84
Cooperative & Commerce Bank 1/16/1998 627.66 772.68 1400.34
Credite Bank Nigeria 1/16/1998 24.27 43.98 68.25
Crown Merchant Bank 1/16/1998 12.49 24.86 37.35
Great Merchant Bank 1/16/1998 16.12 7.11 23.23
Group Merchant Bank 1/16/1998 36.82 6.84 43.66
Highland Bank of Nigeria 1/16/1998 20.07 26.50 46.57
ICON Merchant Bank 1/16/1998 210.99 691.80 902.79
Ivory Merchant Bank 1/16/1998 57.56 61.29 118.85
Lobi Bank of Nigeria 1/16/1998 84.70 98.71 183.41
Mercantile Bank of Nigeria 1/16/1998 260.24 437.02 697.26
Merchant Bank of Africa 1/16/1998 235.74 305.78 541.52
Nigeria Merchant Bank 1/16/1998 259.71 128.94 0.16 388.81
North South Bank Ltd. 1/16/1998 41.27 230.59 271.86
Pan African Bank Ltd. 1/16/1998 667.93 350.26 1018.19
Pinacle Commercial Bank 1/16/1998 155.98 30.61 186.59
Prime Merchant Bank 1/16/1998 52.80 7.67 60.47
Progress Bank of Nigeria 1/16/1998 490.94 191.33 682.27
Royal Merchant Bank 1/16/1998 49.08 6.72 55.80
Victory Merchant Bank 1/16/1998 21.10 6.94 28.04
Premier Commercial Bank 12/20/2000 34.25 51.31 85.56
Rims Merchant Bank 12/20/2000 65.00 406.93 1.74 473.67
African Express Bank 1/16/2006 4109.32 352.60 1.55 4463.47
Allstates Trust Bank 1/16/2006 3509.25 3040.57 382.25 6932.07
Assurance Bank 1/16/2006 303.77 1754.37 2058.14
City Express Bank 1/16/2006 918.78 706.63 979.18 2604.59
Eagle Bank 1/16/2006 11.39 885.49 896.88
Gulf Bank 1/16/2006 507.01 492.24 1.50 1000.75
Hallmark Bank 1/16/2006 3695.78 3220.40 1230.04 8146.22
Lead Bank 1/16/2006 2319.78 1049.82 892.72 4262.32
Liberty Bank 1/16/2006 227.41 886.59 29.73 1143.73
Metropolitan Bank 1/16/2006 1169.26 603.12 212.84 1985.22
Trade Bank 1/16/2006 3535.01 1473.99 620.18 5629.18

CONFERENCE VERSION
58
Table 4G. Cumulative Recovery Rates on Risk Assets (NGN millions, Net of Liquidation Expenses)
Deposit Money Bank
Date of
Closure
Total Risk
Assets
Recoveries on
Risk Assets
Recovery Rate on
Risk Assets (%)
Financial Merchant Bank 1/21/1994 447.19 148.98 33%
Kapital Merchant Bank 1/21/1994 344.27 273.41 79%
Alpha Merchant Bank 9/8/1994 1,030.72 907.89 88%
United Commercial Bank 9/8/1994 1,864.58 186.15 10%
Republic Bank Ltd 6/29/1995 232.56 33.93 15%
Abacus Merchant Bank 1/16/1998 1,213.87 41.81 3%
ABC Merchant Bank 1/16/1998 565.37 77.84 14%
Allied Bank of Nigeria 1/16/1998 2,535.48 393.43 16%
Amicable Bank of Nigeria 1/16/1998 328.99 28.21 9%
Century Merchant Bank 1/16/1998 809.81 31.66 4%
Commerce Bank Plc 1/16/1998 1,643.59 282.01 17%
Commercial Trust Bank 1/16/1998 570.59 157.39 28%
Continental Merchant Bank 1/16/1998 1,712.28 452.58 26%
Cooperative & Commerce Bank 1/16/1998 2,305.38 627.66 27%
Credite Bank Nigeria 1/16/1998 479.92 24.27 5%
Crown Merchant Bank 1/16/1998 340.31 12.49 4%
Great Merchant Bank 1/16/1998 393.44 16.12 4%
Group Merchant Bank 1/16/1998 741.81 36.82 5%
Highland Bank of Nigeria 1/16/1998 114.05 20.07 18%
ICON Merchant Bank 1/16/1998 140.62 140.62 100%
Ivory Merchant Bank 1/16/1998 491.37 57.56 12%
Lobi Bank of Nigeria 1/16/1998 291.60 84.70 29%
Mercantile Bank of Nigeria 1/16/1998 1,217.60 260.24 21%
Merchant Bank of Africa 1/16/1998 2,048.81 235.74 12%
Nigeria Merchant Bank 1/16/1998 1,243.15 259.71 21%
North South Bank Ltd. 1/16/1998 932.04 41.27 4%
Pan African Bank Ltd. 1/16/1998 1,282.45 667.93 52%
Pinacle Commercial Bank 1/16/1998 1,551.90 155.98 10%
Prime Merchant Bank 1/16/1998 838.11 52.80 6%
Progress Bank of Nigeria 1/16/1998 1,880.94 490.94 26%
Royal Merchant Bank 1/16/1998 1,131.07 49.08 4%
Victory Merchant Bank 1/16/1998 301.47 21.10 7%
Premier Commercial Bank 12/20/2000 1,102.00 34.25 3%
Rims Merchant Bank 12/20/2000 1,900.88 65.00 3%
African Express Bank 1/16/2006 9,847.81 4,109.32 42%
Allstates Trust Bank 1/16/2006 25,414.95 3,509.25 14%
Assurance Bank 1/16/2006 6,369.79 303.77 5%
City Express Bank 1/16/2006 13,323.06 918.78 7%
Eagle Bank 1/16/2006 217.62 11.39 5%
Gulf Bank 1/16/2006 21,269.06 507.01 2%
Hallmark Bank 1/16/2006 29,716.74 3,695.78 12%
Lead Bank 1/16/2006 12,380.78 2,319.78 19%
Liberty Bank 1/16/2006 5,191.10 227.41 4%
Metropolitan Bank 1/16/2006 8,258.00 1,169.26 14%
Trade Bank 1/16/2006 11,901.30 3,535.01 30%

CONFERENCE VERSION
59
Table 5G. Cumulative Recovery Rates on Investment Assets (NGN millions. Net of Liquidation Expenses)
Deposit Money Banks
Recoveries on Investment Assets
(2008 - 2014)
Investments at
Closure
Recovery Rate on
Invesments
Afex Bank Nig. Ltd 1.55 659.90 0.2%
Allstates Trust Bank Plc 382.25 4,358.95 8.8%
City Express Bank Plc 979.18 509.31 192.3%
Gulf Bank Ltd 1.50 296.66 0.5%
Hallmark Bank Plc 1,230.04 NA NA
Lead Bank Plc 892.72 432.46 206.4%
Liberty Bank 29.73 194.04 15.3%
Metropolitan Bank Ltd 212.84 883.72 24.1%
Nigeria Merchant Bank Ltd 0.16 2.54 6.3%
Rims Merchant Bank Ltd. 1.74 22.11 7.9%
Trade Bank Plc 620.18 1,373.99 45.1%

CONFERENCE VERSION
60
Table 6G: DMB Deposits at Closure (1994 – 2006)
Data of
Closure
Total Deposits at
Closure ₦
Number of
Depositors at
Closure
Total Insured
Deposits at Closure
₦
Insured Deposits-
to-Total Deposits
at Closure
1/21/94 Financial Merchant Bank 154,913,133.91 233 4,873,613.66 3.1%
1/21/94 Kapital Merchant Bank 314,600,554.24 240 5,874,453.51 1.9%
9/8/94 United Commercial Bank 275,907,082.61 5,162 34,098,734.12 12.4%
9/8/94 Alpha Merchant Bank 1,218,390,022.97 776 18,518,730.88 1.5%
6/29/95 Republic Bank Ltd 79,182,234.16 7,416 19,922,727.91 25.2%
1/16/98 Amicable Bank of Nigeria 41,035,298.83 24,038 26,225,242.42 63.9%
1/16/98 Ivory Merchant Bank 46,083,993.81 188 3,191,147.28 6.9%
1/16/98 Highland Bank of 91,274,672.15 28,186 39,490,401.08 43.3%
1/16/98 Crown Merchant Bank 111,603,217.73 438 9,476,028.21 8.5%
1/16/98 Victory Merchant Bank 114,856,351.58 227 4,454,777.77 3.9%
1/16/98 Great Merchant Bank 132,574,216.89 170 5,194,215.05 3.9%
1/16/98 Nigeria Merchant Bank 153,895,719.94 107 4,847,130.12 3.1%
1/16/98 Credite Bank Nigeria 155,222,766.79 5,997 24,665,697.10 15.9%
1/16/98 Prime Merchant Bank 204,724,737.94 248 4,760,302.08 2.3%
1/16/98 Commercial Trust Bank 215,769,562.45 13,891 29,122,279.26 13.5%
1/16/98 ABC k Merchant Bank 224,181,711.19 752 14,135,967.84 6.3%
1/16/98 Lobi Bank of Nigeria 233,611,823.96 112,819 146,604,258.85 62.8%
1/16/98 Abacus Merchant Bank 272,563,085.55 401 12,778,621.12 4.7%
1/16/98 Group Merchant Bank Nigeria 296,274,534.26 212 4,196,997.53 1.4%
1/16/98 North South Bank Ltd. 354,747,138.47 68,246 155,074,440.84 43.7%
1/16/98 Pinacle Commercial Bank 508,727,770.83 18,332 63,376,997.10 12.5%
1/16/98 Century Merchant Bank 573,287,230.39 357 11,023,134.41 1.9%
1/16/98 Pan African Bank Ltd. 648,630,106.36 132,540 360,745,495.86 55.6%
1/16/98 Royal Merchant Bank 677,855,736.00 531 11,042,104.55 1.6%
1/16/98 Merchant Bank of Africa 712,397,988.29 729 20,909,216.25 2.9%
1/16/98 Mercantile Bank of Nigeria 807,287,793.64 276,272 581,772,861.19 72.1%
1/16/98 Progress Bank of Nigeria 1,096,281,151.70 255,211 738,086,248.63 67.3%
1/16/98 Commerce Bank Pic 1,156,785,605.57 37,462 199,462,352.53 17.2%
1/16/98 Continental Merchant Bank 1,390,269,507.54 1,060 31,450,301.84 2.3%
1/16/98 ICON Merchant Bank 1,421,194,045.31 1,035 33,843,762.30 2.4%
1/16/98 Cooperative & Commerce Bank 1,915,586,954.26 364,239 1,366,665,529.05 71.3%
1/16/98 Allied Bank of Nigeria 2,777,807,120.81 365,883 1,205,361,272.98 43.4%
12/20/00 Premier Commercial Bank 31,050,831.71 30,439 24,407,130.83 78.6%
12/20/00 Rims Merchant Bank 263,373,528.19 299 6,956,832.42 2.6%
2/28/03 Peak Merchant Bank 3,424,404,152.16 1,044 20,467,998.54 0.6%
1/16/06 Eagle Bank 1,033,777,480.46 3,280 16,973,794.93 1.6%
1/16/06 Liberty Bank 2,153,333,156.91 19,800 142,875,503.89 6.6%
1/16/06 Triumph Bank 3,239,054,791.90 3,799 45,361,908.17 1.4%
1/16/06 Metropolitan Bank 5,087,572,976.21 34,409 161,389,281.17 3.2%
1/16/06 African Express Bank 6,283,713,772.37 16,092 123,327,054.75 2.0%
1/16/06 Assurance Bank 7,859,033,181.35 105,326 708,279,249.72 9.0%
1/16/06 Fortune Bank 9,244,297,624.41 33,557 302,885,618.55 3.3%
1/16/06 Lead Bank 10,151,124,937.98 3,925 62,982,640.70 0.6%
1/16/06 Trade Bank 10,504,293,662.05 155,178 742,179,273.89 7.1%
1/16/06 Gulf Bank 13,685,372,285.18 36,787 334,288,557.94 2.4%
1/16/06 City Express Bank 16,420,262,437.43 38,147 306,538,583.64 1.9%
1/16/06 Allstates Trust Bank 32,856,397,282.59 427,847 3,069,049,482.30 9.3%
1/16/06 Hallmark Bank 65,615,609,337.30 121,552 940,276,603.77 1.4%
Deposit Money Bank Name
CONFERENCE VERSION
61
Appendix H – Deposit Insurance Function
The following is drawn from the technical note on crisis management and crisis preparedness frameworks
prepared as part of the 2013 Financial Sector Assessment Program updated with the most recently
available information.45
Membership in NDIC is mandatory for all deposit-taking institutions, and it covers all deposits with certain
stated exceptions. The coverage limit is variable with limits of NGN 500,000 per accountholder for banks
and NGN 200,000 for other deposit taking entities on a netted basis. The NDIC Act provides exemptions
that includes certain insider depositors (e.g., bank directors, officers and senior staff) and counter-claims
from a person who maintains both a deposit and a loan account, where the former serves as collateral for
the loan.
Coverage levels appear broadly appropriate. As of 2014, the NDIC estimates that out of NGN 18 trillion in
total deposits, NGN 2.3 (around 13 percent) is insured, fully covering around 97 percent of all depositors,
which suggests that the scheme provides coverage to the vast majority of small retail depositors.46
However, in the particular case of Nigeria (and other resource exporters) the figures are somewhat
distorted because of the presence of sizable government (oil-related) deposits in the banking system,
which have since been removed.
NDIC has transitioned to risk-adjusted insurance premia. A base rate of 0.4 percent of insured deposits is
charged to all banks, in addition to which a risk premium that ranges from 0 to 0.68 percent depending
on a bank’s prudential risk profile. The migration towards the current hybrid scheme has led to an average
reduction by 35 percent of the annual contribution for the banking sector.
According to NDIC’s most recent annual statement, the DIF had funds equivalent to NGN 614 billion in
2014, corresponding to 3.4 percent of total deposits. As described in previous sections, the NDIC Act does
not prescribe a specific target fund ratio. Government securities are the only eligible investment
categories for the DIF. The investment policy is decided in-house. In practice, 40 percent is held in the
form of T-bills and 60 percent in Federal Bonds. In case of depletion of the DIF, it can raise insurance
premia (up to 200 percent), and it has access to a credit line to the CBN.
The Fiscal Responsibility Act slows down the accumulation of funds. The investment income on the DIF is
used to fund the NDIC’s operating costs. Since the enactment of the Fiscal Responsibility Act in 2007, the
NDIC is required to channel back 80 percent of its operating surplus (i.e., the investment income
generated on the DIF minus NDIC’s expenses) to the federal government, stalling the accumulation of
funds.
The NDIC plans to reduce the ninety-day pay out term to thirty days but faces various challenges in
delivering on this commitment. The thirty-day pay out term still seems comparatively long: in a bid to
boost depositor confidence, deposit insurers worldwide are moving increasingly towards shorter payout
45 Technical note prepared by Dawn Chew (IMF) and Miquel Dijkman (WB). 46 The core principles for effective deposit insurance mention percentages of 80 percent (by number of accounts) and 20-30 percent (by value) as a rule of thumb.
CONFERENCE VERSION
62
terms, usually fifteen days or less. In the mainstream banking system, the NDIC faces the problem of a
lack of finality of bankruptcy proceedings. Shareholders of failed banks can thus file injunctions before the
court, stalling the NDIC’s actions to resolve the bank and proceed to paying depositors. In practice, delays
of several years can occur, and in a significant number of cases liquidations were overruled by the court.
These difficulties need to be overcome (see recommendation in paragraph 64(b)) for the NDIC to be able
to credibly deliver on the shorter statutory payout period.
At the operational level, the practice of netting claims can cause complications. Due to its supervisory
involvement, the NDIC has good access to depositor information. The NDIC has access to the off-site data
systems (eFASS). It receives quarterly updates with detailed depositor information, which it intends to
expand with the introduction of a revised eFASS. The NDIC has the authority as per Article 27 of the NDIC
Act to prescribe the format for depositor data for the purpose of making insurance calculations.
Nonetheless, if deposits have to be netted against accelerated outstanding loans,47 it can be time-
consuming and labor intensive. Common practice elsewhere is to apply the set-off only to depositors that
are delinquent on their outstanding loans, i.e. past due or nonperforming loans, which is also helpful in
strengthening repayment discipline following a bank failure. The NDIC also reports that the task of filtering
out depositors with multiple accounts can be laborious. These tasks are complicated by the lack of a
unique national ID number.
In the microfinance deposit taking sector, pay out terms can be especially time-consuming. Verification of
depositor claims has often been problematic due to inadequate IT infrastructure and administrative
deficiencies. Depositors are also often unaware that their deposits are insured, especially in rural areas,
and are slow to file their claims. Through its six zonal offices, the NDIC has undertaken considerable efforts
to raise public awareness.
47 It is the NDIC’s interpretation that upon the failure of a bank, all claims against the depositor by the bank fall due. This view is however not universally shared and the supporting legal basis could not be found.