workplace flexibility - bc.edu · [email protected] 3 eooqa neab fqnu $ Figure 2. Flexibility...
21
[email protected] 1 issue brief 19 january 2009 workplace flexibility: Findings from the Age & Generations Study introduction Flexible workplaces are “all the rage.” Why? In part, because flexible work options have the potential to contribute to workplace effectiveness and can offer benefits to employees as well as to the organizations where they work. 1 There is ample evidence that employees of all ages and across career stages seek options for work flexibility. A 2008 survey by Randstat 2 found that flexible work hours are among the top three benefits employees identify as contributing to “happiness at the workplace,” with more than 4 of every 10 of the employees indicating that flexible work hours and increased paid time off are important, just after competitive pay and health insurance (See Figure 1, page 2.) These rankings differed a bit by generational group. For example, flexible work schedules ranked 4th among Gen Y employees, 3rd among the Gen X employees, 4th among Baby Boomers, and 3rd among the Matures (as indicated by the percentage of employees who reported that the individual benefit is important for happiness on the job). 2 As discussed in this Issue Brief, we found that when employees have “the flexibility they need,” there are positive outcomes such as higher employee engagement, perceptions of less work overload, better mental health, and more positive assessments of work-family balance. This Issue Brief addresses the following questions: Is it important to employees that they have access to flexible work options? π Who does have access to different types of workplace flexibility? And, which π kinds of flexibility do employees use (if they are available)? Do employees feel they have access to the flexibility they need to manage their π work and their family lives? Why do some employees report that they have the flexibility they need and π others don’t? Does having access to the flexibility employees need matter? Does it predict π important outcomes, such as employee engagement and perceptions of work overload? Marcie Pitt-Catsouphes, Christina Matz-Costa, and Elyssa Besen This Issue Brief presents selected findings about workplace flexibility using data from the Age & Generations Study. This study, conducted by the Sloan Center on Aging & Work, was designed and implemented in collaboration with forward-thinking employers to gather information about contemporary multi-generational work teams. Over 2,200 employees participated in the study, providing rich information about their employment experiences (See Box Insert on pages 17-18, “About the Age & Generations Study.”)
Transcript of workplace flexibility - bc.edu · [email protected] 3 eooqa neab fqnu $ Figure 2. Flexibility...

issue brief 19january 2009
issue brief 19january 2009
workplace flexibility: Findings from the Age & Generations Study
introduction
Flexible workplaces are “all the rage.”
Why? In part, because flexible work options have the potential to contribute to workplace effectiveness and can offer benefits to employees as well as to the organizations where they work.1
There is ample evidence that employees of all ages and across career stages seek options for work flexibility. A 2008 survey by Randstat2 found that flexible work hours are among the top three benefits employees identify as contributing to “happiness at the workplace,” with more than 4 of every 10 of the employees indicating that flexible work hours and increased paid time off are important, just after competitive pay and health insurance (See Figure 1, page 2.) These rankings differed a bit by generational group. For example, flexible work schedules ranked 4th among Gen Y employees, 3rd among the Gen X employees, 4th among Baby Boomers, and 3rd among the Matures (as indicated by the percentage of employees who reported that the individual benefit is important for happiness on the job).2
As discussed in this Issue Brief, we found that when employees have “the flexibility they need,” there are positive outcomes such as higher employee engagement, perceptions of less work overload, better mental health, and more positive assessments of work-family balance.
This Issue Brief addresses the following questions:
Is it important to employees that they have access to flexible work options? π
Who does have access to different types of workplace flexibility? And, which πkinds of flexibility do employees use (if they are available)?
Do employees feel they have access to the flexibility they need to manage their πwork and their family lives?
Why do some employees report that they have the flexibility they need and πothers don’t?
Does having access to the flexibility employees need matter? Does it predict πimportant outcomes, such as employee engagement and perceptions of work overload?
Marcie Pitt-Catsouphes, Christina Matz-Costa, and Elyssa Besen
This Issue Brief presents selected findings about workplace flexibility using data from the Age & Generations Study. This study, conducted by the Sloan Center on Aging & Work, was designed and implemented in collaboration with forward-thinking employers to gather information about contemporary multi-generational work teams. Over 2,200 employees participated in the study, providing rich information about their employment experiences (See Box Insert on pages 17-18, “About the Age & Generations Study.”)

http://www.bc.edu/agingandwork2
Figure 1. Benefits Assessed as “Important for Happiness on the Job” by at least 40% of Employees in 2008 (among 12 benefits listed, study with 2,199 employees) % of respondents
Source: Randstad, 20082
0%
10%
20%
30%
40%
50%
60%
70%
80%
Competitive Pay
Opportunities for Advancement
Increased PTO
Bonuses Based on Profits
Flexible Work Hours
Health Insurance46475050
66
72
the importance of workplace flexibility
Does having access to flexible work options matter?
The employees who participated in the Age & Generations Study said a resounding “yes.”
Over seventy-eight percent of respondents reported that having access πto flexible work options contributes to their success as employees to a “moderate” or “great extent.”
Ninety percent reported that having access to flexible work options contributes πto their overall quality of life to a “moderate” or “great extent.”
As can be seen in π Figure 2 (page 3), the largest percentage of the Gen X’ers and the Older Baby Boomers said that having access to flexible work options contributes to their success as an employee “to a great extent,” while the most frequent response from Gen Y’ers, Younger Baby Boomers, and Traditionalist was “to a moderate extent.”
A majority of each of the age groups/generations reported that having access to flexible work options contributes to their overall quality of life “to a great extent.” Employees between the ages of 36-52 were the most likely to indicate that workplace flexibility contributes to their success as an employee. (See Figure 3, page 3)
Given this clear indication that workplace flexibility matters to employees, we wanted to dig a bit deeper and find out the availability of different types of flexibility and patterns in employees’ use of these options.
Acknowledgements:
The Sloan Center on Aging & Work at Boston College is grateful for the generous support of the Alfred P. Sloan Foundation for the Age & Generations Study as well as other Center activities. We also want to express our appreciation for the patient support of the 12 worksites that collaborated with us to make this study a success. The research team for the Age & Generations Study included (in alphabetical order): Elyssa Besen, Javier Boyas, Jackie James, Kathy Lynch, Chris-tina Matz-Costa, Marcie Pitt-Cat-souphes (Co-Principal Investiga-tor), Michael Smyer (Co-Principal Investigator), Jennifer Swanberg, and Monique Valcour.

issue brief 19january 2009
Figure 2. Flexibility Contributing to Success as an Employee by Generation*3 % of respondents
Figure 3. Flexibility Contributing to Overall Quality of Life by Generation* 4 % of respondents
* Items developed by the Sloan Center on Aging & Work, 2007
* Items developed by the Sloan Center on Aging & Work, 2007
0.0% 10.0% 20.0% 30.0% 40.0% 50.0%
Not at all To a limited extent
Age 26 or younger (Gen Y’ers/Millenials)
Age 27 to 35 (Younger Gen X’ers)
Age 36 to 42 (Older Gen X’ers)
Age 43 to 52 (Younger Boomers)
Age 53 to 61 (Older Boomers)
Age 62 or older (Traditionalists)10.8
12.043.4
33.7
9.312.0
40.238.5
5.513.8
33.846.8
3.717.6
31.147.6
4.416.1
36.543.1
7.820.7
42.429.0
To a moderate extent To a great extent
0.0% 10.0% 20.0% 30.0% 40.0% 50.0% 60.0% 70.0% 80.0%
Not at all To a limited extent
Age 26 or younger (Gen Y’ers/Millenials)
Age 27 to 35 (Younger Gen X’ers)
7.27.2
25.360.2
4.410.6
23.961.1
2.24.4
21.571.8
1.57.7
18.472.4
2.75.4
25.466.5
3.210.6
30.755.5
Age 62 or older (Traditionalists)
Age 53 to 61 (Older Boomers)
Age 43 to 52 (Younger Boomers)
Age 36 to 42 (Older Gen X’ers)
To a great extent To a moderate extent

http://www.bc.edu/agingandwork4
the availability and use of different types of workplace flexibility
The Sloan Center on Aging & Work defines workplace flexibility to mean that employees and their supervisors have some choice and control over when, where, how work gets done, and what work tasks are assumed by which employees/work teams.
There are many different types of flexibility. For this purposes of this report, we have organized flexible work options into five categories. (See Figure 4, page 5)
1. FlexibilityintheNumberofHoursWorked. Employer provides options for the number of hours one works in a given week, month or year. The items in our survey included: part time work, part year work, job share, phased retirement, and input into overtime.
2. FlexibleSchedules. Employer provides options with regard to work schedule. The items in our study included: frequent requests for changes in starting/quitting times, occasional requests for changes in starting/quitting times, in compressed work, schedule that varies from typical schedule, choices about shifts.
3. FlexiblePlace. Employer provides options with regard to the location of work. The items in our study included: being able to work from home/remote site, or being able to select or periodically/seasonally change the work location (if the employer has more than a single worksite).
4. OptionsforTimeOff. Employer allows the employee to take time off, for either short or extended periods of time, so that the employee can meet responsibilities at work and/or at home. The items in our study included taking: paid leave for caregiving/personal/family responsibility, extra unpaid vacation days, paid/unpaid time for education/training, paid/unpaid sabbatical, and paid time to volunteer.
5. OtherOptions. There are several other flexible work options that employers might offer that do not fall into any of these categories. Two of these other options were included in our survey: control over the timing of breaks, and allowing employees to transfer to a job with reduced responsibilities and reduced pay, if they want to.
Figure 4 presents information about the percentage of employees who participated in the Age & Generations Study who reported having access to different types of flexible work options relevant to the five categories discussed above.
Do employees’ perceptions of access to flexible work options vary by age/generational groups?
As suggested by the information in Figure 5 (page 5), employees from different age/generational groups report they have similar access to different types of flexible work options.

issue brief 19january 2009
Figure 4. Access to Flexible Work Options % of respondents
*All items adapted from Bond, Thompson, Galinsky, & Prottas, 20025
0.0% 10.0% 20.0% 30.0% 40.0% 50.0% 60.0% 70.0% 80.0%
Input into the amount of overtime hours you work (n=2,046)
Structure job as a job share with another person where both receive their fair share of compensation and benefits (n=2,051)
Work part-time at the same level (n=1,829)
Phased retirement (n=2,009)
Flex
ibili
ty in
the
Num
bers
of
Hou
rs W
orke
dFl
exib
le S
ched
ule
Opt
ions
for
Tim
e O
ffFl
exib
lePl
ace
Oth
erO
ptio
nsCompressed work week (n=2,078)
Choose a work schedule that varies from the typical schedule at your worksite (n=1,485)
Make choices about which shift you work (n=797)
Work for part of the year at one worksite, and then art of the year at another (n=2,053)
Frequently request changes in starting and quitting times (n=2,086)
Occasionally request changes in starting and quitting times(n=2,086)
Remote work location (such as home) (n=2,085)
Take paid time off to volunteer in the community (n=2,032)
Take sabbaticals or career breaks - that is take leaves, paid or unpaid, of one or more months and return to a comparable job
Take paid/unpaid time for edcation or training (n=2,054)
Take extra unpaid vacation days (n=2,039)
Take paid leave for care giving or other personal or family responsibilities (n= 2,028)
Control when you take breaks (n=2,090)
Transfer to a job with reduced responsibiliites and reduced pay, if you want to (n=2,039)
Work part-year (n=2,309)
63.3
38.3
28.7
18.4
40.7
40.3
53.5
50.2
72.6
41.0
42.9
67.5
16.7
12.7
30.5
35.5
59.1
58.4
74.1
Figure 5. Perceived Access to Flexible Work Options by Age/Generational Groups 6 % of respondents
0.0% 10.0% 20.0% 30.0% 40.0% 50.0%
Has access to 0-5 options
Age 26 or younger (Gen Y’ers/Millenials)
Age 27 to 35 (Younger Gen X’ers)
31.541.6
27.0
36.444.8
18.8
30.243.0
26.8
33.943.9
22.1
32.545.8
21.7
34.143.9
22.0
Age 62 or older (Traditionalists)
Age 53 to 61 (Older Boomers)
Age 43 to 52 (Younger Boomers)
Age 36 to 42 (Older Gen X’ers)
Has access to 11-19 options
Has access to 6-10 options
http://www.bc.edu/agingandwork6
Table1.AccesstoandUtilizationofFlexibleWorkOptions*
Who has access?
Of those who have access, who use it?
Control when you take breaks. 72.6% (2) 91.8% (1)
Have input into the amount of overtime hours you work. 63.3% (4) 84.1% (2)
Make choices about which shift you work. 59.1% (5) 69.8% (3)
Work from an off-site location (such as home) for part (or all) of the regular work week, possibly linked by telephone and computer.
40.7% (11) 67.5% (4)
Occasionally request changes in starting and quitting times. 74.1% (1) 66.9% (5)
[IF YOU DON’T WORK A SHIFT] Choose a work schedule that varies from the typical schedule at your worksite.
58.4% (6) 57.7% (6)
Take paid or unpaid time for education or training to improve job skills.
67.5% (3) 55.0% (7)
Compress the work week by working longer hours on fewer days for at least part of the year.
35.5% (14) 44.5% (8)
Frequently request changes in starting and quitting times, such as on a daily basis.
28.7% (16) 34.4% (9)
Take paid time off to volunteer in the community. 41.0% (10) 31.6% (10)
Work part-year; that is work for a reduced amount of time on an annual basis (e.g., work full-time during the fall, winter, and spring and then take the summer off ).
12.7% (19) 29.3% (11)
Work for part of the year at one worksite, and then part of the year at another worksite.
18.4% (17) 28.0% (12)
Take extra “unpaid” vacation days. 40.3% (12) 25.5% (13)
Take a paid leave for caregiving or other personal or family responsibilities (e.g., parental or elder care giving responsi-bilities) beyond that which is required by law.
53.5% (7) 20.4% (14)
Structure jobs as a job share with another person where both receive their “fair share” of compensation and benefits.
16.7% (18) 20.4% (15)
Take sabbaticals or career break– that is take leaves, paid or un-paid, of one or more months and return to a comparable job.
42.9% (9) 19.4% (16)
Phase into retirement by working reduced hours over a pe-riod of time prior to full retirement.
38.3% (13) 10.9% (17)
[IF WORKING FULL TIME] Reduce your work hours and work on a part-time basis while remaining in the same position or at the same level.
30.5% (15) 10.8% (18)
Transfer to a job with reduced responsibilities and reduced pay, if you want to.
50.2% (8) 6.4% (19)
*All items adapted from Bond, Thompson, Galinsky, & Prottas, 20025
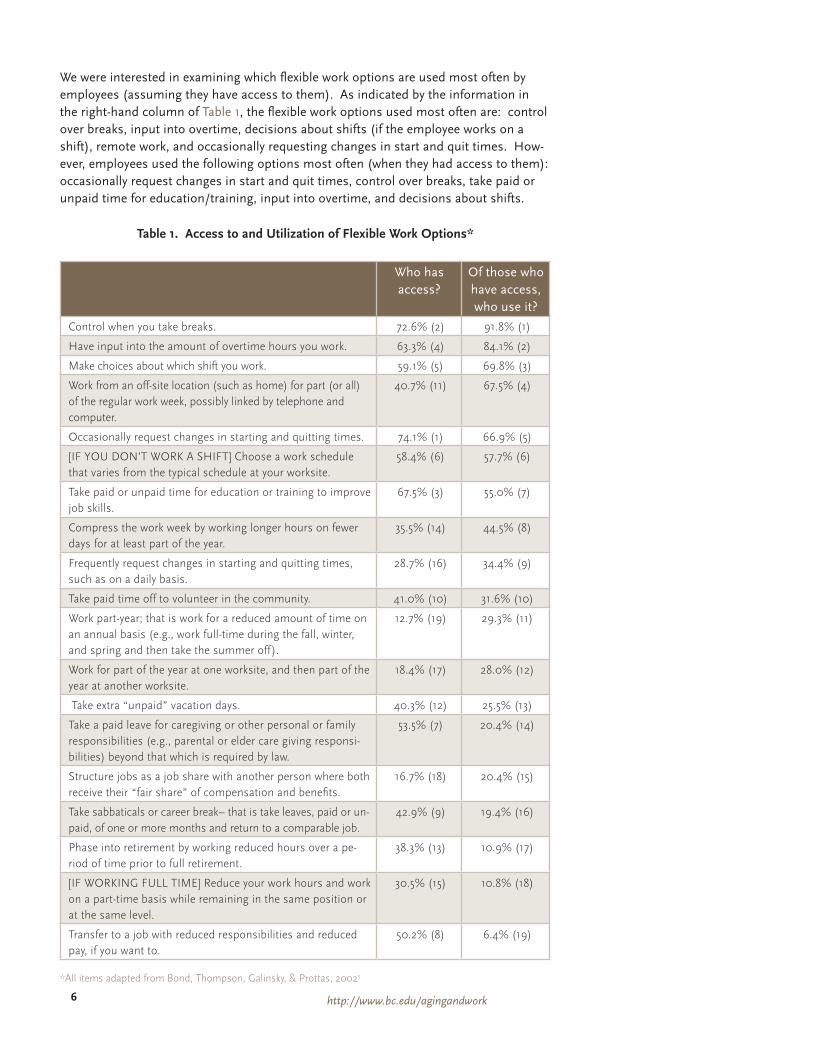
We were interested in examining which flexible work options are used most often by employees (assuming they have access to them). As indicated by the information in the right-hand column of Table 1, the flexible work options used most often are: control over breaks, input into overtime, decisions about shifts (if the employee works on a shift), remote work, and occasionally requesting changes in start and quit times. How-ever, employees used the following options most often (when they had access to them): occasionally request changes in start and quit times, control over breaks, take paid or unpaid time for education/training, input into overtime, and decisions about shifts.
issue brief 19january 2009
Forconsiderationbyemployers:Â It can be instructive to explore why some flexible work options are used more often than others. Employers could use focus groups to identify the reasons why some flexible work options are used more often than others.
Does utilization vary by age/generation?
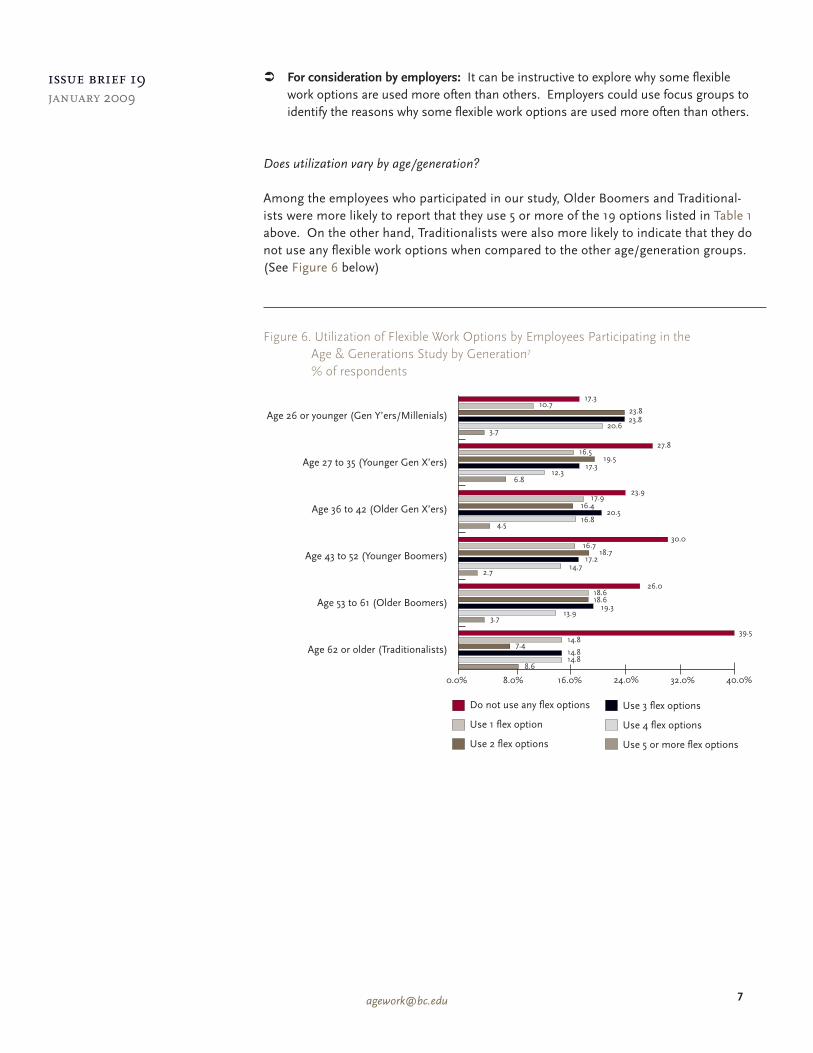
Among the employees who participated in our study, Older Boomers and Traditional-ists were more likely to report that they use 5 or more of the 19 options listed in Table 1 above. On the other hand, Traditionalists were also more likely to indicate that they do not use any flexible work options when compared to the other age/generation groups. (See Figure 6 below)
Figure 6. Utilization of Flexible Work Options by Employees Participating in the Age & Generations Study by Generation7
% of respondents
0.0% 8.0% 16.0% 24.0% 32.0% 40.0%
Do not use any flex options
Use 4 flex options
Age 26 or younger (Gen Y’ers/Millenials)
Age 27 to 35 (Younger Gen X’ers)
20.623.823.8
17.310.7
3.7
12.317.3
19.5
27.816.5
16.820.5
16.4
23.9
4.5
6.8
17.9
14.717.2
18.7
30.0
2.7
16.7
13.919.3
26.0
3.7
18.618.6
7.4
39.5
8.6
14.8
14.814.8
Age 62 or older (Traditionalists)
Age 53 to 61 (Older Boomers)
Age 43 to 52 (Younger Boomers)
Age 36 to 42 (Older Gen X’ers)
Use 3 flex options
Use 5 or more flex options
Use 1 flex option
Use 2 flex options
http://www.bc.edu/agingandwork8
why doesn’t “every” employee take advantage of flexible work options?
Understandably, a number of factors affect whether an employee uses one or more of the flexible work options available to them. The nature of some employees’ jobs might make it difficult to use specific types of flexible work options. It is impossible, for example, for bus drivers to telecommute!
When employees consider whether they should use different types of flexible work options, they tend to think about three basic questions:
1. Would my supervisor and work team be supportive of my use of flexible work options?
2. Do I anticipate that there might be any negative consequences if I use a particular type of flexible work option?
3. If I use a particular type of flexible work option, will it fit with my needs and help me to better manage my work and/or my family responsibilities?
Information gathered from the employees who participated in the Age & Generations Study provides some insight into these questions.
1. SupervisorandTeamSupport
As employees weigh the advantages and the disadvantages associated with using specific types of flexible work options, they may factor-in the attitudes of their supervisors and co-workers. Barnett, Gareis, Gordon, & Brennan (in press) refer to employees’ calculus of workplace attitudes as the “usability” of flexibility.8
Nearly two-thirds (61.7%) of the respondents agreed to a “moderate/great extent” that their team leaders/supervisors support the use of effective flexible work arrangements. When compared to the other age/generational groups (see Figure 7, page 9), Gen Y’ers/Millennnials were the least likely to indicate that their supervisors supported the use of flexible work options “to a great extent.”
As suggested by Figure 8 (page 9), approximately half of the employees who participated in our study agreed/strongly agreed that the members of their work teams were supportive of flexible work options.
When we combined the items listed in Figure 8 into an overall index of work team support for flexible work options, our analyses did not find any variation in the perceptions of work team support across the different age/generational groups.
Nearly two-thirds (64.2%) of the respondents agreed that their work team links workplace flexibility with overall business effectiveness to a “moderate/great extent.” As indicated by the information contained in Figure 9 (page 9), employees in the Traditionalist generational group were more likely to report that their organizations have linked flexibility to business effectiveness to a great extent (but also most likely to report “not at all”).

issue brief 19january 2009
Figure 7. Supervisor Support of Flexible Work Options by Generation 9
% of respondents
Figure 8. Perceptions of Work Team Support for Flexible Workplaces* % Agree/Strongly Agree
Figure 9. Extent to which Workplace has Linked Flexibility with Overall Business Effectiveness by Generation* 10
% of respondents
0.0% 10.0% 20.0% 30.0% 40.0% 50.0%
Not at all To a limited extent
Age 26 or younger (Gen Y’ers/Millenials)
Age 27 to 35 (Younger Gen X’ers)
5.326.7
24.044.0
9.229.7
34.027.1
7.630.1
36.325.9
7.629.1
38.524.8
9.828.7
39.222.2
9.028.4
44.618.0
Age 62 or older (Traditionalists)
Age 53 to 61 (Older Boomers)
Age 43 to 52 (Younger Boomers)
Age 36 to 42 (Older Gen X’ers)
To a great extent To a moderate extent
0% 10% 20% 30% 40% 50% 60%
The members of my work team are comfortablediscussing their needs for flexibility. (n=1,766)
The members of my work team understand the importance that working and managing flexibility has
for employees’ lives at work and at home. (n=1,769)
The members of my work team clearly recognize theimportance that working and managing flexibility has
for business success. (n=1,764)
The members of my work team are aware of the flexible work options available to them. (n=1,764)
55
50
51
51
0.0% 10.0% 20.0% 30.0% 40.0% 50.0% 60.0%
Not at all To a limited extent
Age 26 or younger (Gen Y’ers/Millenials)
Age 27 to 35 (Younger Gen X’ers)
16.716.7
36.130.6
7.533.7
38.620.3
6.830.3
40.722.2
6.332.0
40.821.0
5.824.5
51.218.5
5.025.3
48.421.3
Age 62 or older (Traditionalists)
Age 53 to 61 (Older Boomers)
Age 43 to 52 (Younger Boomers)
Age 36 to 42 (Older Gen X’ers)
To a great extent To a moderate extent
* Items developed by the Sloan Center on Aging & Work, 2007.
* Items developed by the Sloan Center on Aging & Work, 2007.

http://www.bc.edu/agingandwork10
2. UnintendedConsequences
Employees may consider both the intended and unintended consequences associated with using flexible work options. Employees might be reluctant to use flexible work options if they anticipate a negative impact on their careers.
In general, 40.6% of the respondents felt that there might be negative career consequences associated with the use of flexible work options (those responding “somewhat agree,” “agree,” or “strongly agree”). As the data depicted in Figure 10 (page 11) suggest, Younger Boomers and Traditionalists are more likely to strongly disagree/disagree that people who use flexible work options are viewed as being less serious about their career.
Rather than assuming that existing flexible work options are effective, employers may want to examine the extent to which employees’ access to flexible work options and their use of these options help them to succeed at the workplace as well as at home.
3. FlexibilityFit:TheExtenttoWhichFlexibleWorkOptionsPromoteEmployeeEffectivenessatWorkandatHome
Employers offer flexibility to promote business effectiveness and to help employees better manage their w0rk and personal lives.
Of course, the types of flexibility that might meet the needs of one worker could be very different than those that meet the needs of another worker. As a result, some employers adopt a comprehensive set of flexibility initiatives in an effort to give employees as much choice as possible, hoping that at least “some” of the options respond to the needs of most employees. Utilization of available flexible work options is bound to be low if the options are not a good fit with their needs and preferences.16
The only sure way to find out whether employers’ menu of flexible work options “fits” with employees’ needs is to ask them. A majority of the participants in the Age & Generations Study (58.7%) report that they have access to the flexible work options they need to fulfill their work and personal needs to a “moderate/great extent.” (See Figure 11, page 11)
Figure 12 (page 11) depicts flexibility fit by generation. On average, employees 26 years of age and younger who participated in our study were less likely to report that they have access to the flexible work options they need “to a great extent” when compared to the other age/generational groups.

issue brief 19january 2009
Figure 10. Perceptions that Employees Who Use Flexibility Are Viewed as Less Serious About Their Careers by Generation* 11
Figure 11. Access to the Flexible Work Options Needed to Fulfill Work and Personal Needs* 14 % of respondents
Figure 12. Access to the Flexible Work Options Needed to Fulfill Work and Personal Needs by Generation* 15 % of respondents
0.0% 10.0% 20.0% 30.0% 40.0% 50.0% 60.0%
strongly disagree/disagree
Age 26 or younger (Gen Y’ers/Millenials)
Age 27 to 35 (Late Gen X’ers)
53.533.7
12.8
46.033.7
20.3
40.442.6
17.0
38.241.2
20.6
34.646.8
18.6
41.542.9
15.6
Age 62 or older (Traditionalists)
Age 53 to 61 (Early Boomers)
Age 43 to 52 (Late Boomers)
Age 36 to 42 (Early Gen X’ers)
agree/strongly agree somewhat disagree/somewhat agree
0.0% 10.0% 20.0% 30.0% 40.0%
To a great extent
To a moderate extent
To a limited extent
Not at all 9.4
32.0
34.4
24.3
0.0% 10.0% 20.0% 30.0% 40.0% 50.0%
Not at all To a limited extent
Age 26 or younger (Gen Y’ers/Millenials)
Age 27 to 35 (Younger Gen X’ers)
14.123.923.9
38.0
12.233.2
28.226.3
11.927.9
34.425.8
5.034.234.9
26.08.9
30.040.0
21.1
8.038.7
38.215.1
Age 62 or older (Traditionalists)
Age 53 to 61 (Older Boomers)
Age 43 to 52 (Younger Boomers)
Age 36 to 42 (Older Gen X’ers)
To a great extent To a moderate extent
* Item developed by Thompson, Beauvais, & Lyness (1999). 12
* Item developed by Sloan Center on Aging & Work, 2008
* Item developed by the Sloan Center on Aging & Work, 2007
“Employees who make use of flexible work options are viewed as less serious about their careers than those who do not use these options”

http://www.bc.edu/agingandwork12
The Age & Generations Study used information about this concept of “flexibility fit” to explore two important questions:
Does it make a difference whether employees experience flexibility fit? π
If flexibility fit is related to positive outcomes that are important to employers, πwhat might employers do to promote flexibility fit among employees?
We address these questions in the next sections of this Issue Brief.
FlexibilityFitandBusiness/EmployeeOutcomes
Understandably, employers will want to know whether flexibility fit really matters.
We found that having flexibility fit is associated with outcomes that are connected to employees’ passion about their work, their perceptions of work pressures, their well-being, and their satisfaction with work-life balance (even when we account for the expected variations that result from gender, marital status, race/ethnicity, education, age, and employees’ sense of themselves). 16 Does flexibility fit matter?
Having access to the flexibility needed to fulfill work and personal needs was found to be predictive of greater employee engagement, lower perceptions of work overload, better physical health and mental health, and greater satisfaction with work-family balance. 16
Employers might consider any one of these outcomes a “plus,” and the findings present a strong business case for paying attention to flexibility fit.
But how much does flexibility fit matter?
When compared to those who do not have flexibility fit, those who do have flexibility fit scored:16
Higher• on the employee engagement scale (1.23 points higher on a scale which ranges from 1 to 7).
Lower• on the work overload scale (.19 points lower on a scale which ranges from 1 to 6).
Higher• on the physical health measure (10.9 points higher on a scale which ranges from 17 to 68).
Higher• on the mental health measure (11.29 points higher on a scale which ranges from 10 to 65).
Higher• on a measure of satisfaction with work-family balance (.37 points higher on a scale which ranges from 1 to 6).
issue brief 19january 2009
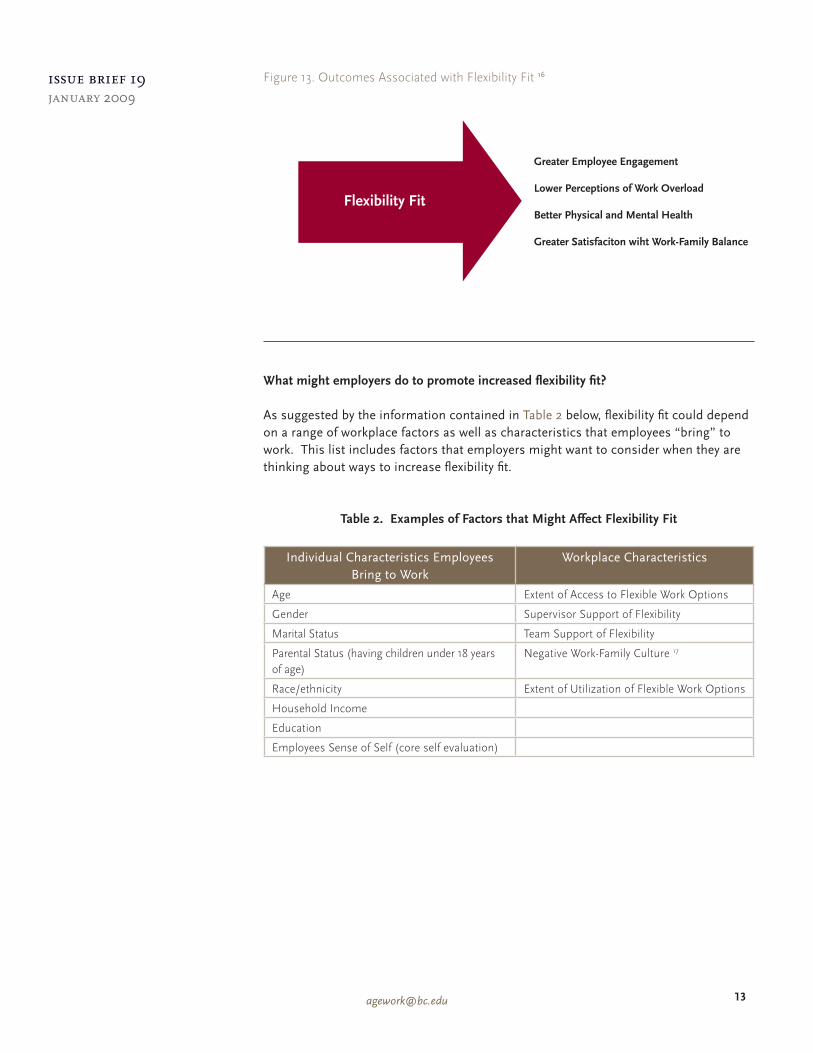
Figure 13. Outcomes Associated with Flexibility Fit 16
Whatmightemployersdotopromoteincreasedflexibilityfit?
As suggested by the information contained in Table 2 below, flexibility fit could depend on a range of workplace factors as well as characteristics that employees “bring” to work. This list includes factors that employers might want to consider when they are thinking about ways to increase flexibility fit.
Table2.ExamplesofFactorsthatMightAffectFlexibilityFit
Individual Characteristics Employees Bring to Work
Workplace Characteristics
Age Extent of Access to Flexible Work Options
Gender Supervisor Support of Flexibility
Marital Status Team Support of Flexibility
Parental Status (having children under 18 years of age)
Negative Work-Family Culture 17
Race/ethnicity Extent of Utilization of Flexible Work Options
Household Income
Education
Employees Sense of Self (core self evaluation)
Flexibility FitLower Perceptions of Work Overload
Better Physical and Mental Health
Greater Satisfaciton wiht Work-Family Balance
Greater Employee Engagement

http://www.bc.edu/agingandwork14
Our analyses found that seven sets of factors help explain variation in employees’ flexibility fit: employees’ age, education, access to flexible work options, supervisor support of workplace flexibility, team support of workplace flexibility, the lack of a negative work-family culture, and the extent of use of flexible work options. 18 Importantly, employers can take steps to leverage employees’ access to flexible work options and the extent of team support for workplace flexibility.
How much do these factors matter?
The odds of having flexibility fit are greater for those employees age 27 to 35 than for those age 53 or older and greater for those with a graduate degree than for those with less than a graduate degree.18 Specifically:
Compared to employees who are age 53 or older, the odds of having flexibility πfit are 74% higher for those who are age 27 to 35.
Compared to those who have a graduate degree, the odds of having flexibility πfit are 52% lower for those whose highest level of education is a high school degree or GED and 27% lower for those whose highest level of education is a bachelor’s degree or associate’s degree.
The odds of having flexibility fit increase when employees have greater access to workplace flexibility, feel that their supervisors and work teams are supportive of workplace flexibility, when there is not a negative culture in their workplace around flexibility, and when employees use workplace flexibility options available to them. 18 Specifically:
Using our measure of supervisor support of flexible work options, employees’ πodds of having flexibility fit were 243% higher when an employee’s supervisor was supportive of flexible work options.
Using our measure of access to workplace flexibility (an index which ranges πfrom 0-19), we found that employees’ odds of having flexibility fit were 125% higher with every 1-point increase from the average (7.94) in access to flexible work options.
Using our measure of employees’ use of those flexible work options that were πavailable to them (an index which ranged from 0-19) we found that the odds of having flexibility fit were 84% higher with every 1-point increase from the average (3.54) in utilization of flex.
Using our measure of work team support for workplace flexibility (a scale πwhich ranges from 1-6), we found that employees’ odds of having flexibility fit were 28% higher with every 1-point increase from the average (4.33) in team support for workplace flexibility.
Using the measure of negative work-family culture (a scale that ranges from π1-6), we found that employees’ odds of having flexibility fit were 22% lower with every 1-point increase from the average (3.18) in negative work-family culture.

issue brief 19january 2009
Figure 14. Factors that Explain Extent of Flexibility Fit 18
Flexibility Fit
AgeEducationExtent of Access to Flexible Work OptionsSupervisor Support of FlexibilityTeam Support of FlexibilityNegative Work-Family Culture Extent of Utilization of Flexible Work Options
http://www.bc.edu/agingandwork16
conclusions and implications for employers
These analyses have important implications for employers.
Employers expect positive outcomes when they invest time and resources Âinto their flexibility initiatives. It may seem obvious, but it is important to for employers to pay attention to the extent to which these initiatives actually fit the needs of their employees. Specific types of workplace flexibility that work for one company, might not be the most effective approach for another.
Flexibility fit matters. It matters at the workplace and at home. Â
Employers can take steps to enhance flexibility fit. These steps include: Â
1. Having access to a comprehensive range of flexible work options is important. Having different flexibility options creates the possibility that employees will be able to find at least one type of flexibility that works best for them. Employers might be reluctant to offer a comprehensive set of flexible work options if they think that a small percentage of employees might use a particular type. However, it may be that some of the options used less often are very important to those employees who use them.
2. In order to achieve a sense of “fit,” it may be necessary for employees to use more than a single type of flexible work option. Some employees might need to be able to reduce their work hours and occasionally work from home, for example, in order for them to achieve positive outcomes, such as enhanced engagement.
3. Work teams can be pivotal for reaching the successful outcomes that can be associated with workplace flexibility. Oftentimes, teams have to make adjustments when one employee uses flexible work options. For instance, if one employee works a compressed work schedule, that limits the options for team meetings because the individual employee is not working on one day. Involving teams in the structure of team work can go a long way toward team support for the utilization of workplace flexibility by individual team members. Employers should consider how teams could become involved in workplace flexibility rather than assuming that arrangements for flexibility should only be a private negotiation between a supervisor and an individual employee. This could mean that supervisors need to pay attention to the understanding that their teams have about workplace flexibility, whether or not most team members use available options at any particular point in time.
4. It is worth stating the obvious, many of the benefits of having flexibility initiatives depend on employees using them. Periodically, employers should consider new ways to “remind” employees of the availability of existing initiatives and sharing success stories of employees who use available flexible work options.

issue brief 19january 2009
about the age & generations study
The Age & Generations Study team collaborated with 9 organizations (12 departments) to collect three types of data: information about the organization (as a whole) from a key respondent (typically someone from HR), information about a selected department(s) in each organization from a key respondent (typically the department manger), and information about employees from the department(s).
We used surveys to gather the information from the employees. Most organizations elected to complete the surveys online, but some employees used written questionnaires.
The employee survey asked a series of questions about employees’ perceptions of their work, organization/ department as a whole, work group, supervisor/team leader, work style, and outlook on life.
In total, 2,210 employees from 12 departments participated in this study.19 Although the data we have collected are very rich and allow us to examine a range of experiences at the workplace, readers should keep in mind that the findings may not be representative of all employees, departments, or organizations in the United States, nor are the respondent employees from each organization necessarily representative of the overall organizations where they work. Therefore, in the section below, characteristics of the organizations who participated in the study are described, followed by characteristics of the employees who completed the survey. Readers should keep these characteristics in mind as they read this report and know that specific findings might not apply to other groups of employees.
OrganizationalCharacteristics:
The participating organizations are affiliated with a range of industry sectors: • 2 of the organizations are in the educational services industry; 2 are in health care and social assistance; 1 is in retail trade; 2 are in finance and insurance; 1 is in professional, scientific and technical services; and 1 is in the pharmaceutical industry.
Five of the participating organizations have a worksite located outside of the • U.S. and 4 do not.
All of the organizations in our sample were considered large businesses, each • having over 1,000 employees: 4 of the organizations had between 1,000 and 10,000 employees, 4 had between 10,000 and 50,000 employees, and 1 had over 50,000 employees.
While 4 of the participating organizations were for-profit, 5 were non-profit.•

http://www.bc.edu/agingandwork18
EmployeeCharacteristics:
Totalsample U.S.
% women 61.6% 46.4%1
% men 38.4% 53.6%1
% full-time 89.0% 76.9%2
% part-time 11.0% 23.1%2
% hourly employees 47.2% 60.0%3
% salaried employees 51.8% 40.0%3
Median wage for hourly employees $20/hour -
Median salary for salaried employees $71,000/year -
Average age of employees 42 years 414
% under age 25 7.1% 13.6%4
% age 25 to 39 37.2% 33.0%4
% age 40 to 54 38.1% 35.7%4
% age 55 or older 17.5% 17.6%4
% with supervisory responsibilities 34.7% -
% reporting that they have an additional job with a second employer
7.0% -
% temporary employees 4.9% -
% consultants 6.5% -
% reporting that they were “working in retirement”; that is, they had officially retired from a previous job
3.7% -
1 % of the U.S. Labor Force in 2007, See: Bureau of Labor Statistics, United States Department of Labor (2008). Current population survey [raw data] Retrieved from http://www.bls.gov/cps/home.htm
2 % of the U.S. Workforce in 2007, full-time was measured by working 35 hours or more at one job, See: Bureau of Labor Statistics, United States Department of Labor (2008). Current population survey [raw data] Retrieved from http://www.bls.gov/cps/home.htm
3 % of the U.S. Workforce in 2007, See: Bureau of Labor Statistics, United States Department of Labor (2008). Current population survey [raw data] Retrieved from http://www.bls.gov/cps/home.htm
4 U.S. Labor Force in 2007, See: Bureau of Labor Statistics, United States Department of Labor (2008). Current population survey [raw data] Retrieved from http://www.bls.gov/cps/home.htm

issue brief 19january 2009
references 1 See, for example:
Eaton, S. C. (2003). If you can use them: Flexibility policies, organizational commitment, and perceived
performance. Industrial Relations, 42(2), 145-167.
Galinsky, E., Bond, J. T., & Hill, E. J. (2004). When work works: A status report on workplace flexibility. New
York: Families and Work Institute. Retrieved from http://familiesandwork.org/3w/research/downloads/
status.pdf
Hill, E.J., Grzywacz, J.G., Allen, S., Blanchard, V.L., Matz-Costa, C., Shulkin, S., & Pitt-Catsouphes, M.
(2008). Defining and conceptualizing workplace flexibility. Community, Work, & Family, 11(2), 149-163.
Moen, P., & Kelly, E. L. (2007). Flexible work and well-being study: Final report. Minneapolis, MN: University
of Minnesota. Retrieved from http://www.flexiblework.umn.edu/FWWB_Fall07.pdf
Shockley, K. M., & Allen, T. D. (2007). When flexibility helps: Another look at the availability of flexible work
arrangements and work-family conflict. Journal of Vocational Behavior, 71(3), 479-493.
2 Randstad. (2008). The world of work 2008. Rochester, NY: Harris Interactive, Inc. Retrieved from http://www.
us.randstad.com/2008WorldofWork.pdf
3 1,731 employees answered this question. The results are statistically significant (X2 = 45.09, p <.01).
4 1,731 employees responded to this item. The results are statistically significant (X2= 43.73, p <.01).
5 1,796 employees responded to this item. Our statistical test suggests that the differences could have oc-
curred by chance; that is, the findings are not statistically significant.
6 Bond, J. T., Thompson, C., Galinsky, E., & Prottas, D. (2002). Highlights of the national study of the changing
workforce. New York, NY: Families and Work Institute. Retrieved from http://www.familiesandwork.org/
summary/nscw2002.pdf
7 1,702 employees responded to the relevant items. The results are statistically significant (X2= 53.77, p <.01).
8 Barnett, R. C., Gareis, K. C., Gordon, J. R., & Brennan, R. T. (in press). Usable flexibility, employees’ concerns
about elders, gender, and job withdrawal. The Psychologist-Manager Journal.
9 1,771 employee responded to this item. The results are statistically significant (X2= 28.52, p <.05).
10 1,760 employees responded to this item. The results are statistically significant (X2= 39.18, p <.01).
11 1,759 employees responded to this item. The results are statistically significant (X2= 22.78, p <.05).
12 Thompson, C. A., Beauvais, L. L., & Lyness, K. S. (1999). When work-family benefits are not enough: The
influence of work-family culture on benefit utilization, organizational attachment, and work-family conflict.
Journal of Vocational Behavior, 54(3), 392-415.
13 For more on the concept of “flexibility fit”, please see Pitt-Catsouphes, M. & Matz-Costa, C. (2008). The multi-
generational workforce: Workplace flexibility and engagement. Community, Work & Family, 11(2), 215-229.
14 2,123 employees responded to this item.
15 1,815 employees responded to this item. The results are statistically signigicant (X2= 51.59, p <.00).
16 Flexibility fit was found to be a statistically significant predictor of these factors in a multi-level regression
model that controlled for gender, marital status, race/ethnicity, education, age, and core self-evaluations.
17 The three items used to measure work-life culture were selected from a larger scale developed by Thompson,
Beauvais, & Lyness (1999). One of these items is, “In this organization, employees who make use of flex-
ible work options (e.g., flextime, job sharing, part-time work) are viewed as less serious about their careers
than those who do not make use of such options.” See: Thompson, C. A., Beauvais, L. L., & Lyness, K. S.
(1999). When work-family benefits are not enough: The influence of work-family culture on benefit utiliza-
tion, organizational attachment, and work-family conflict. Journal of Vocational Behavior, 54(3), 392-415.
18 These factors were found to be statistically significant predictors of flexibility fit in a multi-level Bernoulli
regression model that that contained all of the predictors listed in Table 2.
19 Although 2,210 employees responded to the survey, not all respondent completed every section. The results
presented in this report were based on the total number of people who responded to a particular question
or to a series of related items.
http://www.bc.edu/agingandwork20
Authors
Marcie Pitt-Catsouphes, Ph.D. directs the Sloan Center on Aging & Work. She is an Associate Professor at the Boston College Graduate School of Social Work and also holds appointments at the Boston College Carroll School of Management as well we the Middlesex University Business School in London. Dr. Pitt-Catsouphes received the 2006 Work-Life Legacy Award from the Families and Work Institute.
Christina Matz-Costa, MSW is a Research Associate at the Sloan Center on Aging & Work and a doctoral candidate in Social Work at Boston College. She was the Senior Project Manager for the Age & Generations Study. She has been a lead researcher for several of the Center’s studies, including the National Study of Business Strategy and Workforce Development. She has co-authored publications in the areas of work-family and employer response to the aging of the workforce.
Elyssa Besen is a Research Assistant at the Center on Aging & Work at Boston College and a 1st year doctoral student in the Applied Development Psychology Program in the Lynch School of Education at BC. Elyssa earned for BA in Psychology from Brandeis University. She is interested in studying the impact of work on adult development.
TheSloanCenteronAging&WorkatBostonCollege
The Sloan Center on Aging & Work at Boston College was founded in 2005. Working in partnership with workplace decision-makers, the Center promotes the quality of employment for the 21st century multi-generational workforce. The Center strives to put evidence into practice to improve employment experiences for both employers and employees. We place a particular emphasis on workplace flexibility that supports 21st century ways of getting work done and enhances employees’ work experiences. Our multi-tiered strategy includes combining employer engaged research and academic rigor with innovative communications. We engage multi-disciplinary teams of re-searchers from around the world to forward three research streams – the US National Initiatives, the State Initiatives, and the Global Initiatives.
The Sloan Center’s US National Initiatives partners with scholars and employers across the United States, placing a particular emphasis on workplace flexibility. To-gether we explore the intersection of employee preferences with employer practices, and chronicle emerging strategies as they evolve. Current projects include analyses of the Health and Retirement Study, Eldercare, Workplace Flexibility and Multi-Genera-tional Talent, and the Age & Generations Study.
The Center on Aging & Work is grateful for the continued support of the Alfred P. Sloan Foundation.
For more information about the Sloan Center on Aging & Work at Boston College, please visit: agingandwork.bc.edu.
Contactus: Sloan Center on Aging & Work 140 Commonwealth Avenue - 3 Lake Street Bldg. Chestnut Hill, MA 02467 Phone: 617.552.9195 • Fax: 617.552.9202 [email protected]

issue brief 19january 2009
For previous publications, visit our website at www.bc.edu/agingandwork
Issue Briefs
Issue Brief 1: Older Workers: What Keeps Them Working?
Issue Brief 2: Businesses: How Are They Preparing For the Aging Workforce?
Issue Brief 3: Getting the Right Fit: Flexible Work Options and Older Workers
Issue Brief 4: How Old Are Today’s Older Workers?
Issue Brief 5: One Size Doesn’t Fit All: Workplace Flexibility
Issue Brief 6: Down Shifting: The Role Of Bridge Jobs After Career Employment
Issue Brief 7: Civic Engagement: Volunteering Dynamics and Flexible Work Options
Issue Brief 8: Does Health Insurance Affect The Employment of Older Workers?
Issue Brief 9: The 21st Century Multi-Generational Workplace
Issue Brief 10: Today’s Multi-Generational Workforce: A Proposition of Value
Issue Brief 11: Responsive Workplaces for Older Workers: Job Quality, Flexibility and Employee Engagement
Issue Brief 12: Generational Differences in Perceptions of Older Workers’ Capabilities
Issue Brief 13: Quality of Employment and Life Satisfaction: A Relationship that Matters for Older Workers
Issue Brief 14: The Interlocking Careers of Older Workers and Their Adult Chlidren
Issue Brief 15: Self Employment As A Step in The Retirement Process
Issue Brief 16: Older And Out Of Work: Trend in Older Worker Displacement
Issue Brief 17: Older And Out Of Work: Employer, Government and Nonprofit Assistance
Issue Brief 18: Time Use Across the Life Course
Research Highlights
Research Highlight 1: Context Matters: Insights About Older Workers From the National Study of the
Changing Workforce
Research Highlight 2: The Diverse Employment Experiences of Older Men and Women in the Workforce
Research Highlight 3: The Benchmark Study, Phase I of The National Study of Business Strategy and
Workforce Development
Research Highlight 4: The National Study, Phase II of The National Study of Business Strategy and Work-
force Development
Research Highlight 5: The Citi Sales Study of Older Workers