WORKING PARTY ON STRUCTURAL ADJUSTMENT · WORKING PARTY ON STRUCTURAL ADJUSTMENT ... These...
17
GENERAL AGREEMENT ON TARIFFS AND TRADE WORKING PARTY ON STRUCTURAL ADJUSTMENT AND TRADE POLICY Exchange of Information on the Experience of all Contracting Parties with Regard to Structural Adjustment Addendum 1. At the meeting of the Working Party on Structural Adjustment and Trade Policy on 2 July 1981, it was agreed that the secretariat should invite all contracting parties to provide by the end of 1981 the information required in Paragraph 11(b) of the Annex to L/5120, taking into account the objectives outlined in Paragraph I of the Annex and the work already done (L/5177, paragraph 10). Paragraph 11(b) of the Annex to L/5120 states that one of the tasks to be undertaken is "consistent with the GATT and the results of the MTN, an exchange of information and discussion on the experience of all contracting parties with regard to structural adjustment, along with an overall analysis of the experience". 2. . Contracting parties were invited in GATT/AIR/1742 of 13 July 1981 to provide the requested information. The submission of Argentina is reproduced in the Annex to this document. 3. Some participants have underlined that, with a view to the usefulness of the exercise, they attach considerable importance to the fact that all members of the Working Party fulfil their obligation and make written contributions. These participants have also indicated that they would be prepared to participate in an examination of their contribution in the Working Party only when notifications of the other contracting parties participating in the Working Party have also been received. 4. Delegations which have not yet submitted information are requested to do so as soon as possible. RESTRICTED Spec(82)6/Add.7 9 March 1982
Transcript of WORKING PARTY ON STRUCTURAL ADJUSTMENT · WORKING PARTY ON STRUCTURAL ADJUSTMENT ... These...

GENERAL AGREEMENT ON
TARIFFS AND TRADE
WORKING PARTY ON STRUCTURAL ADJUSTMENT AND TRADE POLICY
Exchange of Information on the Experience of all Contracting Parties with Regard to
Structural Adjustment
Addendum
1. At the meeting of the Working Party on Structural Adjustment and Trade Policy on 2 July 1981, it was agreed that the secretariat should invite all contracting parties to provide by the end of 1981 the information required in Paragraph 11(b) of the Annex to L/5120, taking into account the objectives outlined in Paragraph I of the Annex and the work already done (L/5177, paragraph 10). Paragraph 11(b) of the Annex to L/5120 states that one of the tasks to be undertaken is "consistent with the GATT and the results of the MTN, an exchange of information and discussion on the experience of all contracting parties with regard to structural adjustment, along with an overall analysis of the experience".
2. . Contracting parties were invited in GATT/AIR/1742 of 13 July 1981 to provide the requested information. The submission of Argentina is reproduced in the Annex to this document.
3. Some participants have underlined that, with a view to the usefulness of the exercise, they attach considerable importance to the fact that all members of the Working Party fulfil their obligation and make written contributions. These participants have also indicated that they would be prepared to participate in an examination of their contribution in the Working Party only when notifications of the other contracting parties participating in the Working Party have also been received.
4. Delegations which have not yet submitted information are requested to do so as soon as possible.
RESTRICTED
Spec(82)6/Add.7 9 March 1982

Spec(82)6/Add.7 Page 2
ARGENTINA
I. Introduction
The Argentine delegation considers positive the Working Party's decision to examine the experience of contracting parties with regard to structural adjustment in recent years.
It seems necessary, nevertheless, to mention two fundamental aspects which, a priori, condition any evaluation in this respect, namely: (1) the particular characteristics of the country, and its insertion in the international context; (2) the conditions that the international context imposes, whether directly or indirectly, on the country concerned.
With reference to the first aspect to be taken into account, it is important to point out that Argentina, as a developing country, has for years past been engaged in the difficult process of developing its economy as a whole. It is difficult, therefore, at this moment in its economic history, to speak of structural adjustment; it is rather a matter of developing as harmoniously as possible all the various economic sectors that make up the nation.
Despite the foregoing, and within the development plans inherent to Argentina's particular situation, in recent years there has been some readjustment, whether through legislation or through the operation of market forces, to secure more efficient reallocation of resources in those sectors in which the country has comparative advantages.
It should also be taken into account that, where economic matters are concerned, Argentina's insertion in the world is effected through its trade. As a developing country, it is essential for it to have a comfortable trade-balance situation in order to be able to finance its imports and cover other external payments so as to offer an adequate standard of living to its population.
These considerations bring us to the second factor mentioned in the introduction, namely, the fundamental importance of the conditions and/or terms that the international market imposes on Argentina and on its export products.
In this respect, it is important to mention the harmful effect of increasing protectionist policies on the part of traditional importers of Argentine products which have not only substantially reduced their import levels but also - after Argentina's trade had shifted towards other markets - have stepped up competition in those markets on the basis of "disputable" practices, causing a.twofold and serious prejudice to Argentina's trade aspirations.
It is generally recognized that the world economy is currently passing through a difficult stage, and this fact has delayed or prevented the implementation of adjustment policies in countries or sectors where comparative advantages have already been lost for ever.

Spec(82)6/Add.7 Page 3
Notwithstanding the important condit ions mentioned which show that i n r e a l i t y the developing countries i n general are having to struggle fo r t h e i r economic ex is tence, in the past few years Argentina has launched a s t r i c t programme of economic improvement, the main features of which are described below.
I I . Argentina's economic policy
After encountering certain economic and financial difficulties in the period prior to 1976, in the past five years Argentina has carried forward a series of large-scale economic transformations based on liberalization of control systems, relaxation of State intervention procedures, and a programme of re-allocation of resources with a view to improving the production system.
The principal economic measures taken in this period have been:
(a) Opening of the economy;
(b) strengthening of the external sector;
(c) implementation of the principle of the State's subsidiary rôle, with emphasis on market mechanisms for resource allocation;
(d) reform of the financial sector through liberalization of interest rates and development of the capital market.
Some of the salient features of what has been done in the past five years are commented on below.
III. Developments in tariff structures
In the past, Argentina had maintained traditionally high tariffs. It seems unnecessary to recall that customs duty rates were for the most part in the vicinity of 100 per cent and on some items the rates were more than 200 per cent.
Since 1976, in the interest of adequate tariff treatment, the aim has been to differentiate between goods of which there is, or is not, sufficient domestic production. Accordingly, goods not produced locally have been subject to revenue duties of 5 to 10 per cent or even in certain cases have been exempted.
On goods of which there i s domestic product ion, import dut ies have come down from 210 per cent fo r cer ta in e l e c t r i c a l household appliances (" l ineablanca") and 80 per cent (more f requent ly ) i n October 1976 (not inc luding q u a s i - t a r i f f charges) to a maximum of 75 per cent fo r motor vehicles and, i n most cases, 43 per cent i n A p r i l 1981.

Spec(82)6/Add.7 Page 4
As this comparison shows, in four and a half years the tariff barrier on imports of goods produced domestically has been reduced to half.
At the end of December 1981 it was decided that imports of goods not produced in Argentina would be dutiable at the rate of 10 per cent and that the 48 per cent tariff on imports would be reduced to 43 per cent.
Given the structure of the Argentine tariff nomenclature and the structure of imports, while these measures have not significantly changed the average tariff barrier, they have reduced the degree of tariff dispersion.
Historical Development of Tariff Reform
TARIFF m
Minimum Maximum Mean
Before November 76
0 210
55
24 November 76 ÉDec. 3008/76)
0 100 41
A p r i l 78
0 100 33
A p r i l 79
0 83 24
June 80
0 85 20
February 81
0 75 23
A p r i l 81
0 75 22
June 81
0 75 27
September 81
0 75 27
Analysis of Tariff Distribution, by Economic Sectors, as at September 1981
Pr inc i pa l sectors
- Chemicals - Non-e lec t r i ca l machinery - A g r i c u l t u r a l products - E l e c t r i c a l machinery - Tex t i l es - Metals excluding machinery - Other - Vehicles
T a r i f f range
0-45 5-40
10-35 35-40 45-50 45-50 0-50
55-60
From the above statistical analysis, it can be concluded that although the differentiation is maintained between goods produced in Argentina and those which are not, the dispersion of nominal tariff protection is as follows:
Agricultural and chemical products, between 20 and 24 per cent of the tariff. Machinery and some chemicals, between 35 and 45 per cent. Textiles and some metals, between 45 and 50 per cent. Motor vehicles, between 55 and 80 per cent.

Spec(82)6/Add.7 Page 5
These results seem important in view of the fact that the sectors mentioned account for 89.42 per cent of aggregate tariff headings.
IV. Import Liberalization
In the same perspective of reducing tariffs and bringing down the degree of dispersion as from 1976, and with the exception of the motor vehicles and used goods sectors, government measures in the field of trade liberalization have also had an impact on non-tariff restrictions. Thus, except for the two sectors already mentioned, all imports are now free of restrictions on the basis of import licensing.
Similarly, Argentina has eliminated all the import surcharges that were in existence prior to 1976, i.e.:
- Statistical fee 3 per cent of c.i.f. value - Forestry fee 10 per cent of c.i.f. value - Iron and steel industry contribution 1 to 10 per cent of c.i.f. value - Consular duties 3 per cent
From all the foregoing, it can readily be inferred that Argentina is engaged in a process of liberalizing its economy and is pursuing a resolute policy of opening its international trade; having regard to the considerations expressed at the beginning of this document, these facts imply that a real structural adjustment effort is being made.
By way of illustration, the following statistical tables are attached:
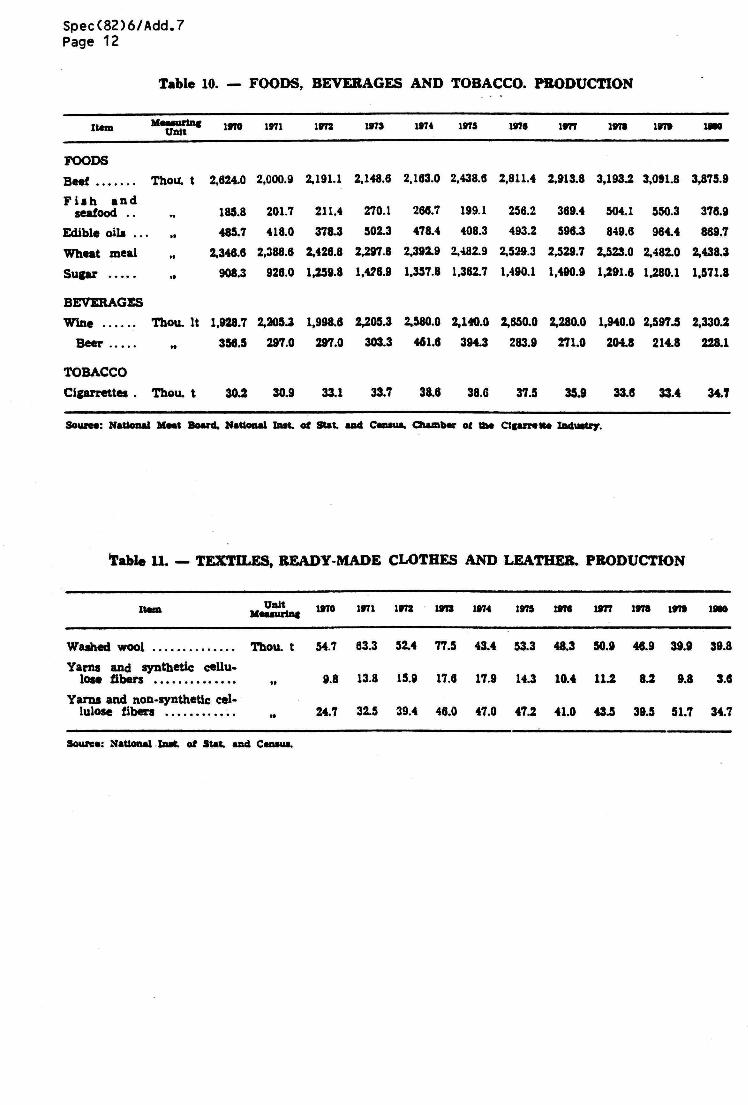
- Table 1 - Supply and use of goods and services - Table 2 - IGP - Agriculture, hunting, silviculture and fishing - Table 3 - Agricultural production - Table 6 - Fuels and minerals: production - Table 8 - IGP - Manufacturing industries - Table 9 - Production of the manufacturing industries - Table 10 - Foods, beverages and tobacco: production - Table 11 - Textiles, ready-made clothes and leather: production - Table 14 - Chemical products, oil, rubber, plastic by-products:
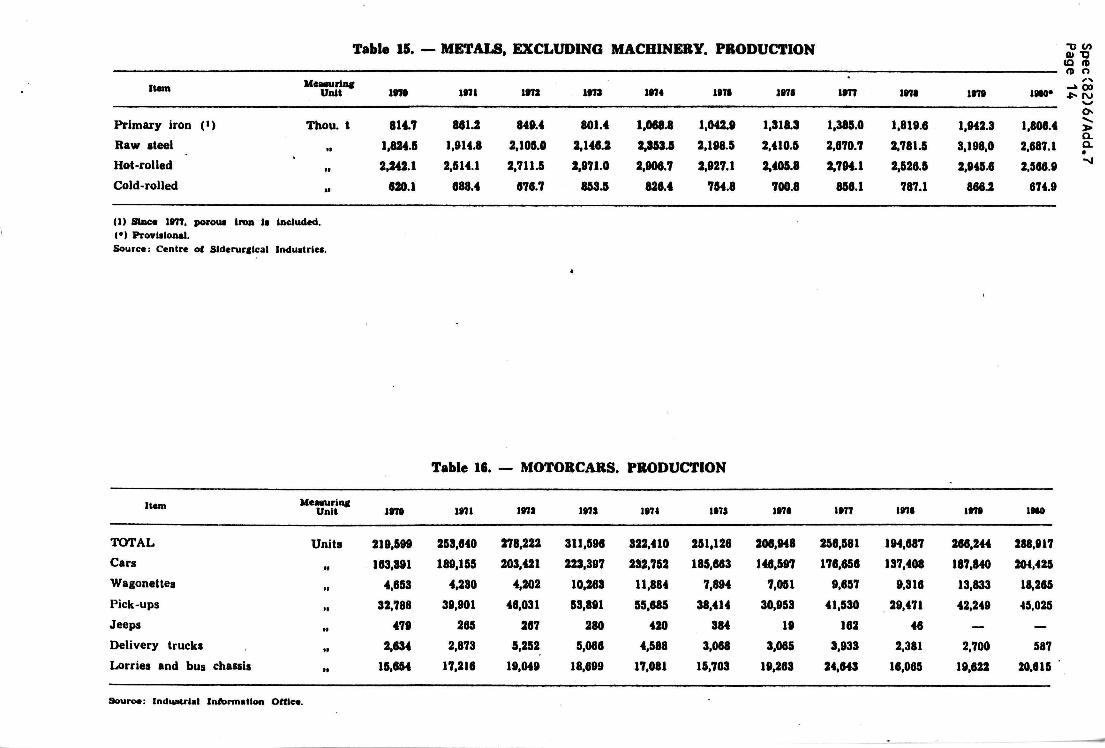
production - Table 15 - Metals, excluding machinery: production - Table 16 - Motor-ears: production - Table 17 - Machinery, excluding electric machines: production - Table 19 - IGP - Construction - Table 20 - Construction

Table 1. — SUPPLY AND USE OF GOODS AND SERVICES In millions of pesos at 1970 prices
"0 to at "o «a a m n o oo
l\>
3» a. a.
Item
GLOBAL OFFER
Grass internal product (•)
Agriculture, hunting, silviculture and fishing (*)
Exploitation of mines and quar-rries (*) ' . .
Manufacturing industries
Electric power, gas and water (?)
Building (s)
Retail and wholesale trade, restaurants and hotels (-)
Transportation, storage and communications (a)
Financial institutions, insurance and real estate (-')
Community, social and personal services (-')
Imports (goods and services) . . . .
GLOBAL DEMAND
Consumption
Gross interna) investment
Gross internal fixed investment .
Construction ,
Private
Public
Transportation equipment
Machinery, equipment and others
Stock variations
Exports (goods and services)
1*70 1971 1*72 1ST» 1OT4 I » » 1971 wn 1ST* 197» ISM
97,314
89,190
10,229
101,280
92,424
10,402
102,106
93,877
10,445
104,781
97.065
112,312
103,352
11,612 12,057
111,849
102,444
11,676
109,231
102,188
12,164
117.404
108,355
12,576
112,367
104,148
12,736
123.278
111,240
13,193
128,349
112.432
12,817
1,777
22,137
1,810
5,025
11,815
8,962
5,915
11,352
8.124
97,314
70,613
18,605
18,612
11,607
6,981
4,626
2,186
4.819
—6
8.096
1.916
23,408
1,979
5,342
12,146
9,085
5,982
11,626
8,856
101,280
73,436
20,551
20,040
12,445
7,290
5,155
2,393
5,200
511
7,292
1,972
24,250
2.174
5.291
12,173
9,083
5.850
11.934
8,230
102.106
74,041
20.655
20.152
12.213
6,919
5,294
2,710
5,229
503
7,410
1.916
25.015
2.338
4.671
12,327
9,588
6.112
12,419
7,716
104,781
76.746
19.742
18,746
10,895
6,494
4.401
2,776
5.075
996
8,293
1,962
26,715
2,477
5.041
13.294
10,178
6.918
12,927
8.960
112,312
83.931
20,069
19,814
11,720
7,028
4,692
2.477
5,418
455
8,313
1.932
25,925
2,627 ,
5.272
13,383
9.852
6,338
13.760
9,405
111,849
84,058
20,417
19.634
12,262
8,140
4,123
2,220
261
784
7,374
1,979
25,413
2,724
5,934
12,691
9.761
6,074
13,798
7,042
109,231
78,139
21,386
21.243
13.581
7.984
5.598
2,074
5,589
143
9,705
2,148
26,920
2,850
6.735
13.621
10333
6,915
13,904
9.049
117.404
79,517
25.610
25.432
14.968
7.407
7.560
2,911
7,554
•178
12,277
2,189
23,985
2,945
6,693
12,598
9,959
7,368
13,900
8,219
112,367
77,007
22,138
22.812
14,650
7,604
7.046
2,388
5,774
— 674
13,222
2,328
26.172
3.261
7.028
13.878
10.800
7.865
14.034
12.038
123.278
85.492
24,876
24,827
15.679
8.515
7.164
3.100
6.048
49
12.910
2,451
25,256
3,508
7.584
13,902
10,876
8,776
14.444
15,917
128,349
89,392
26,770
26,665
16.712
8,981
7.730
2,878
7,075
105
12,188
Source: Argentine Central Bank. (1) At market price (I) At factor cost.

Table 2. — IGP. AGRICULTURE HUNTING, SILVICULTURE AND FISHING In millions of pesos at 1970 prices
Item
IGP-AGRICULTURE
Cereals
Oil seeds
Industrial crops
Fruits and flowers
Vegetables and legumes
IGP-UVESTOCK
Beef cattle
Sheep
Swine
Equines
Wool
Milk
Farm products
IGP - HUNTING
IGP - AGRIC. CONST.
IGP - SILVICULTURE AND WOOD EXTRAC.
IGP-FISHING
TOTAL
1*10
5,345
2,137
503
1,198
759
088
4,519
3,265
118
79
54
279
590
134
1
214
110
39
10,229
m i
5,240
2,022
506
1,237
801
074
4,685
3,352
110
92
47
254
687
143
1
318
116
36
10.402
1»72
5,046
1,935
452
1,342
741
577
4.952
3.522
108
83
51
258
785
144
2
274
130
41
10.445
1973
6.026
2,418
563
1.577
719
748
5,114
3,716
109
102
36
261
745
146
1
301
120
51
11,612
1974
6,360
2.285
560
1,756
925
' 335
5,181
3.773
110
94
19
256
744
185
1
328
136
50
12,057
1B75
5.986
2.139
579
1,621
850
797
5,273
3,767
106
96
39
261
626
179
1
252
119
43
11,676
1971
6,389
2,386
752
1,641
833
778
5,332
3.869
123
31
57
265
815
171
3
256
136
47
12,164
1977
6,805
2.431
1.121
1.575
893
786
5.279
3.843
98
87
50
262
771
168
5
285
139
63
12.576
197S
7,004
2.509
1,311
1,503
878
302
5,279
3,896
91
80
31
258
745
180
6
218
132
96
12,736
1979
7,364
2.385
1.619
1.585
955
820
5,340
3,873
89
119
44
282
758
174
6
244
135
104
13,193
19SS
7,025
2,150
1.426
1.990
945
814
5.385
3.897
84
128
44
275
765
192
6
191
126
83
12,817
Source: Argentine Central Bank.
-rj t/> 0) n (O (0 «s n ->ioo
ro
a. a.

turn 10/11
CEREALS AND UNSEED
Wheat 4.820.0 Corn 0.930.0 Linseed 180.0 Oats M0.0 Barley SUS Rye ;. 180.7 Rice 288.0 Canary seed , 30.S Millet 183.0
FORAGE
. Alfalfa (grass) 5.045.3 Grain sorghum 4,860.0 Barley 48.3
OILSEED
Soybean S9.0 Sunflower 830.0 Peanuts 871.3 Spurge 2.8 Tung 110.0 Olive 86.3
INDUSTRIAL CROPS Sugar cane 10,260.0 Cotton 28S.0. Tobacco 61.7 Tea 128.0 Mate tea 86.7 Grape 2,864.0 Grains of Paradise 27.» Guinea grass 31.4
Table J. — AGRICULTURAL PRODUCTION la thousands of Ions
H A R V E S T S
11/11 11/11 11/14 14/1» 1S/M i i / n nm is/n W/M Si/81»
8.440.0 8,860.0
315.6 475.0 476.0 256.0 204.0 26.2
105.0
3.480.0 2.360.0
77.0
78.0 828.0 176.4
1.1 170.0 50.0
12.870.0 292.2
73.6 131.0 126.7
2,600.0 25.0 28.4
7.800.0 8.700.0
330.0 866.6* 760.0 800.0 260.0 85.0
227.0
3.255.0 4,980.0
120.0
2710 880.0 308.0
0.7 25.0
126.0
16.870.0 424.0
71.0 128.6 151.0
2.610.0 26.0 28.3
6.560.0 9.900.0
297.0 561.0 608.0 613.0 316.0 34.0
228.5
3.385.0 8.900.6
124.0
496.0 970.0. 203.0
0.6 136.8 82.2
1S.836.0 416.4
97.7 140.0 126.7
3.528.0 28.8 32.4
5.970.0 7.700.0
380.7 327.0 365.0 306.0 351.0 25.4
200.0
3.1S7.0 4.830.0
65.0
485.0 732.0 262.6
1.1 61.0 89.0
18.600.0 541.0 07.8
165.0 140.0
8,100.0 27.8 21.7
8.570.0 8.855.0
377.0 432.8 447.8 273.2 309.0 32.8
293.7
3,044.0 5,060.0
74.0
605.0 1.085.0
236.5 0.3
US.0 79.3
14,310.0 44S.0 94.6
133.0 133.0
9.760.0 31.9 36.2
11.000.0 8.300.0
617.0 830.0 670.0 330.0 320.0 30.0
340.0
2,600.0 * 6.600.0
90.0
.1.400.0 900.0
* 420.0 0.0
100.0 94.0
16.000.0 522.0 90.0
168.0 127.2
3.400.0 23.7 36.5
5.800.0 9.700.0
810.0 870.0 290.0 170.0 310.0 60.0
330.0
2.850.0 7.200.0
630
2,500.0 1.600.0
260.0 10.0 82.4
106.0
18.600.0 714.0 63.6
103.0 134.8
2.800.0 30.8 35.6
0.100.0 8.700.0
600.0 676.0 470.0 210.0 3110 51.0
3100
12720 6.200.0
840
3,700.0 1,430.0
470.0 0.01
88.0 112.0
14,120.0 878.5 70.0
125.0 137.7
3,500.0 201 23.7
8,100.0 6.410.0
743.0 522.0 286.0 202.0 266.0 42.0
188.0
2,1570 1960.0
83.0
8.500.0 1,650.0
206.0
56.0 112.0
17,200.0 485.4 62.0 153.0 127.5
3.250.0 16.7 20.3
7.782.0 18.150.0
585.0 433.0 170.0 155.0 280.0 32.3
251.0
7.583.0 680
3,852.0 1.410.0
226.0 . . 60.0 80.0
18.000.0 415.0 51.5 142.5
3,000.0
. . .
"O </>
(Û to
to o
oo oo
> a. a.
* Provisional. Source. Mlnli lry of Agriculture and Livestock and die Mate Taa Production and Trad* Control Conualealo*.

Table 6. — FUELS AND MINERALS. PRODUCTION
Item Measuring
Unit 1970 1071 1972 197J 1974 197S 197» 1977 197* 1979 I9M*
FUELS (»)
Oil Thou. m» 22,793.2 24.560.2
Natural gaa Mill, m» 4,818.5 5,198.6
Marketable coal Thou, t 615.5 631.8
METALIFEROUS
MINERALS (») „ 448.1 501.5
Lead ., 52.6 65.9
Zinc „ 77.7 87.7
Iron „ 239.4 282.1
Tin „ 5.1 4.6
Uranium ,. 32.4 38.0
Other ., 400 23.1
NON-METALIFEROUS
MINERALS (*) „ 4,665.5 4.312.4
Common Salt „ 957.6 821.0
Borates ,. 43.3 60.0
Pipe clay „ 1,209.3 1,255.9
Gypsum „ 4216 507.5
Other .. 2.033.7 1.668.0
STONES USED IN
CONSTRUCTION . . . . „ 44,080.8 45,844.5
Sand used in building „ 9,217.9 10,900.1
Rubble „ 8,956.4 8,413.9
Crushed granite „ 5,983.5 6,687.0
Spalled marble „ 75.1 82.3
Travertine marble . . . t 4,221 4,465
Onyx t 688 2.001
Other Miles t 19,842.7 19,754.7
25.200.7
5.997.3
675.4
475.5
62.8
89.5
259.3
4.6
37.0
22.3
4,072.6
819.3
52.4
840.3
513.1
1,8474
47.321.6
12.589.8
6.600.8
6,887.7
92.5
3,190
547
21.147.1
24,394.8
8.991.0
492.5
431.9
56.0
81.1
237.3
2.8
36.4
18.3
4,303.9
697.6
63.4
1.214.4
454.4
1,874.0
40,925.5
10,580.5
5,907.7
4,7898
88.8
3.907
906
19,553.9
23.995.6
7.506.4
637.2
621.3
554
80.1
4150
4.0
30.1
36.6
4,866.7
9549
78.0
1.481.7
510.9
1,861.1
45.387.9
12,776.6
5,639.2
5.296.3
95.3
843
2,129
. 21,377.5
22.979.5
7.794.6
502.1
501.7
40.1
76.0
286.3
3.6
31.6
64.2
5,728.5
1.566.4
76.6
1.386.6
612.7
2,086.1
44,538.4
13.866.1
6.381.6
4.935.8
48.8
12,457
4.645
19.289.0
23,452.4
8,243.1
614.2
843.3
43.7
81.8
506.4
3.0
141.5
66.9
4.488.1
659.9
81.8
1.465.3
507.1
1.773.9
45,875.5
14.893.3
5.989.6
4.342.5
65.7
13,102
4.505
20.566.7
24,994.3
8,608.6
533.3
1,433.3
44.3
78.8
1.030.4
2.7
1875
89.5
5,351.5
1.114 5
83.0
1,812.3
547.0
1,794.7
51,728.0
16,178.1
9,214.0
7,302.8
72.1
13,239
3.375
18,944.5
26,251.0
8,444.2
435.8
1,309.1
42.9
74.6
909.0
2.6
253.5
26.5
5,387.8
699.5
127.2
2,4413
311.1
1,808.6
55,969.9
14,772.8
11.320.0
5,5880
.25.9
5,227
2,926
24.255.0
27.423.5
9.269.8
727.0
1.078.6
48.2
75.8
610.5
3.4
3270
13.7
5,481.6
618.7
132.6
2.198.3
587.5
1.944.4
58,632.2
15,348.1
11,795.9
7.302.6
72.1
13,239
4.626
24.095.5
28,581.7
9.871.5
359.9
. . .
47.0
67.0
1.200.0
5.1
. . .
661.0
21.0
1,271.0
1.131.0
. . .
>..
• Provisional data. Source: (1) Orflce of the Under-Secretary for Hydroelectric and Thermal Power and (2) Office of the Under-Secretary for Mines.

Spec(82)6/Add.7 Page 10
Table 8. — IGP. MANUFACTURING INDUSTRIES In millions of pesos at 1970 prices
Item 1»70 1911 1072 1973 1*74 1979 UT« 1877 1978 1979 1990
Poods, Beverages and To-
bacco 5,696 5.609 5,787 5,728 6,430 6,327 6,518 6,108 5.783 5.871 5,837
Textiles, apparel and leather 2,769 2,874 2,896 2.950 3,255 3,105 2,936 3.045 2,613 2.896 2,557
Wood and furniture 439 457 463 466 534 489 400 419 414 460 457 Paper, printing and publish
ing 1,186 U10 1,261 1.333 1,415 1.425 1,248 1,249 1,289 1.312 1,208
Chemicals products and oil
by-products 2446 3,115 3,307 3,533 3,343 3,388 3.445 3.496 3,218 3,615 3,644
Non-Metallic minerals . . . . 1,176 1,263 1,303 1,225 1,320 1,345 1,298 1,281 1.286 1,377 1,328
Basic mctallics 1,049 1,174 1,259 1,314 1.349 1.294 1,170 1,344 1,270 1.486 1,343
Machinery and equipment . 5,527 6,172 6,381 6326 7,325 6.851 6,726 8,220 6,552 7.438 7,227
Other industries 1,450 1.532 1,592 1.641 1,745 1,701 1,672 1,760 1,560 1,716 1.656
TOTAL 22,137 23,408 24,250 25,015 26,715 25,925 25.413 26,920 23,985 26472 25,256
Source: Argentina Central Bank.

Spec(82)6/Add.7 Page 11
Table 9. — PRODUCTION OF THE MANUFACTURING INDUSTRIES Basic Index 1970 = 100
Item
Food products
Beverages
Tobacco
Textiles
Apparel
Leather
Shoes
Wood and by-products
Furniture and accessories
Paper and by-products
Printing and Publishing houses
Industrial chemical agents
Other chemical products
Oil refineries
Oil and coal derivatives
Rubber products
Plastic products
Clay, delft and porcelaine articles
Glass and by-products
Other mineral products
Basic steel and iron industries
Basic non-ferrous metal industries
Metallic products
Machinery, excl. electric machines
Machinery and electrical appliances
Transportation material
Equipment for professionals
TOTAL INDUSTRY
1970
100
100
100
100
100
100
100
100
100
100
100
100
100
100
100
100
100
100
100
100
100
100
100
100
100
100
100
100
1971
99.1
95.6
101.9
104.5
106.9
97.8
45.2
110.4
90.3
106.3
99.4
115.2
110.7
105.2
89.3
112.5
109.9
104.8
97.2
109.9
113.8
119.1
113.7
112.8
114.2
114.6
108.0
106.9
1972
110.4
95.4
109.4
104.6
115.8
117.6
73.0
110.4
91.9
112.9
101.9
124.5
114.3
108.3
90.7
127.5
141.1
110.8
99.6
114.0
131.5
125.6
120.4
117.8
115.7
118.6
149.8
112.8
1973
110.6
90.3
108.2
111.6
111.2
107.7
76.1
108.3
91.2
122.5
104.6
137.4
128.2
110.1
93.1
132.9
152.5
114.8
89.9
106.6
133.5
127.9
116.1.
143.5
117.5
130.4
164.9
116.8
1974
113.1
125.3
122.7
119.8
133.0
99.5
85.4
120.9
112.8
133.3
109.0
140.2
116.7
104.3
35.2
128.2
139.5
119.8
98.5
115.6
128.5
135.5
126.7
156.6
124.6
129.8
238.8
122.7
1975
114.6
121.0
129.2
114.2
125.0
104.1
74.9
115.8
97.1
125.2
115.6
130.1
139.4
95.1
75.6
133.3
127.8
109.7
119.7
113.4
115.9
119.2
126.9
139.1
124.2
108.0
206.6
118.4
197B
119.4
103.0
123.5
110.5
116.0
115.5
62.3
101.7
87.9
108.7
102.2
132.0
135.8
101.8
74.7
160.6
112.1
109.5
103.6
111.2
108.7
96.5
118.7
176.3
94.9
98.8
218.9
114.9
1977
116.5
97.3
121.8
118.2
109.4
124.5
57.7
100.4
83.7
115.1
97.4
140.0
126.4
107.0
92.7
149.1
121.0
91.3
95.6
117 2
119.9
109.3
135.0
215.1
111.4
118.3
219.7
121.4
1971
111.7
95.9
123.2
102.0
85.2
129.3
49.8
94.8
93.0
118.7
100.4
120.2
112.2
108.1
76.1
130.7
109.3
81.5
105.4
115.8
101.3
95.9
115.0
149.4
95.8
93.3
227.1
108.1
1979
116.4
117.6
131.2
114.2
99.8
114.1
49.8
97.7
116.7
133.0
93.2
152.7
120.8
113.3
90.0
162.2
138.2
95.4
117.6
121.9
185.0
129.8
131.4
162.1
99.0
128.6
249.6
125.1
1980
110.6
139.5
126.9
94.7
89.0
93.5
48.2
92.8
117.0
108.9
98.5
131.8
127.0
119.9
89.7
151.2
136.4
94.7
106.9
118.4
180.2
139.0
123.4
140.0
96.9
144.0
168.0
122.2
Source: National Inst, of Stat, and Census.
Spec(82)6/Add.7 Page 12
Table 10. — FOODS, BEVERAGES AND TOBACCO. PRODUCTION
Item M * U n « n C 1910 1971 1ST» 1979 IS74 1879 1878 19TT 1*» 187» ISM
FOODS Beef Thou, t 2,624.0 2,000.9 2,191.1 2,148.6 2.163.0 2,438.6 2,811.4 2,913.8 3,193.2 3,091.8 3,879.9
seafood . . .. 185.8 201.7 211.4 270.1 266.7 199.1 2S6.2 369.4 504.1 550.3 376.9
Edible oils 485.7 418.0 378.3 502.3 478.4 408.3 493.2 596.3 849.6 964.4 869.7
Wheat meal „ 2,346.6 2,388.6 2,428.8 2,297.8 2.392.9 2,482.9 2.529.3 2,529.7 2,523.0 2,482.0 2,438.3
Sugar 908.3 926.0 1,259.8 1.426.9 1.357.8 1,382.7 1,490.1 1,490.9 1,291.6 1.280.1 1,571.8
BEVERAGES
Wine Thou.l t 1,928.7 2,2052 1,998.6 2^05.3 2,580.0 2,140.0 2,650.0 2,280.0 1,940.0 2.597.5 2,330.2
Beer 356.5 297.0 297.0 303.3 461.6 394.3 283.9 271.0 204.8 214.8 228.1
TOBACCO
Cigarrettes . Thou, t 30.2 30.9 33.1 33.7 38.6 38.6 37.5 35.9 33.6 33.4 34.7
Source: National Meat Board. National Inst, at Stat, and Census. Chamber of the ClgarreMe Industry.
Table 11. — TEXTILES, READY-MADE CLOTHES AND LEATHER. PRODUCTION
Itom Melsurtai U T 0 m i l m 1918 M M i m vgn vrn l v n l9n l n o
Washed wool Thou, t 54.7 63.3 52.4 77.5 43.4 53.3 48.3 50.9 48.9 39.9 39.8
Yarns and synthetic cellulose fibers ., 9.8 13.8 15.9 17.8 17.9 14.3 10.4 11.2 8.2 9.8 3.6
Yarns and non-synthetic cellulose fibers 24.7 32.5 39.4 46.0 47.0 47.2 41.0 43.5 39.5 51.7 34.7
Soureo: National Inst of Stat, and Census.

T a b l a 14. — C H E M I C A L . P R O D U C T S , OIL., R U B B E R , P L A S T I C B Y - P R O D U C T S . P R O D U C T I O N
Item Measuring
Unit 1970 1*71 1972 1OTS 1»14 1*73 197» 1977 1979 1979 19W*
OrL BY-PRODUCTS (»)
Common gasoline Thou, m* Special gasoline „ Gas oil „ Fuel oil Diesel oil „ Kerosene „ Lubricants „
PLASTIC PRODUCTS (*)
Polyethylene Thou, t Polystyrene „
V i n y l H e p o l y c h l o r i d e (PVC)
AGROCHEMICAL PRODUCTS (*)
Urea Sulphate of ammonia . . . „
3,245.8
2,079.5
3,641.2
8,350.0
1,884.3
1,093.0
157.4
28,648
17,000
3,375.4
2,476.8
4,385.6
8,613.7
2,196.4
923.3
144.6
32,415
21,290
3,379.5
2,627.1
4,371.8
8,846.0
2,244.2
928.3
231.5
33,427
24,000
3,805.9
2,541.5
4,598.0
8,345.8
2,188.4
950.8
284.1
32,757
18,830
3,373.5
2,601.6
4,964.9
8,640.3
1,447.8
1,053.3
291.7
29,011
17,500
2.778.5
2,407.6
5,545.0
8,114.5
731.5
969.9
271.4
26,340
21,900
2,635,4
2,696.2
5,974.0
8.559.0
787.1
978.5
256.2
28,124
17,860
2,565.3
3,130.7
6,639.3
9,258.5
900.2
934.0
315.0
32,300
19,100
2,844.2
3,185.3
6,526.0
9.026.6
954.4
812.0
285.2
30,634
18,792
3.075.4
3,250.4
6.892.8
9,106.2
984.5
663.0
327.1
32,865
25,625
3,206.5
3,901.5
7,518.9
8,223.1
1,114.1
726.9
316.8
33,241
14,905
26,324 29,374 31,517 36,157 36,998 35,777 30,118 39,199 29,704
58,544 51,805
39,317
49,177
42,394
58,893
51,640
51,410
54,602
36,716 45,182
34,038
34,910
37,682
38,971
48,000
40,650
41,888 35,500
65,488 59,670
BASIC CHEMICAL PRODUCTS (»)
Sulfuric acid Hydrochloric acid Tartaric acid Lamp black Synthetic rubber Ammonia Wax Carbon sulfide . . Toluene Benzene Caustic soda
191,593
43,631
5,705
25,142
37,402
52,023 12,201
6,800
13,324
40,956
94,685
204,492
57,274
5,562
29,546
42,240
53,894
13,184
6,679
12,805
40,657
112,922
242,165
58,205
5,065
36,529
46,994
62,481
13,207
7,945
15,812
44,673
124,507
234,726
63,310
6,197
40,101
56,152
61,697
13,217
9,944
15.569
42,312
122,127
240,109
68.047
5,155
44,092
51,402
50,008
11,734
11,642
21,566
70,648
121,313
222,308
63,801
5,024
36,048
39.240
49,091
12,852
10,643
20,081
102,940
118,189
226,907
62,593
5,032
35,283
39,746
49,380
11,502
8,876
18,799
126,196
114,380
243,948
67.289
4,750
36,243
32,960
58,750
13,185
9,250
27,100
141,735
128,070
244,780
5,385
31,730
31.606
66,490
13,625
6,924
29,843
145,864
106.403
278,002
4.530
37,456
39,119
66,669
13,210
8,294
33,205
129,543
114.951
249.820
5.510
37.780
34.187
64,290
10,550
6,192
23,511
143,100
106,000
T) in 1 01 TJ <Q (D n o _» 00 Oi ro
/Ad
d
Source: Office of the Undersecretary tor Power and Fuels, Argentine, Central Bank, and Chemical Industriel Chamber. Source: (1) Office of the Undersecretary tor Power and Fuels. (3) Argentine Central Bank, and Chemical Industries Chamber.
Item
Primary iron (')
Raw steel
Hot-rolled
Cold-rolled
Table 15. —
Measuring Unit 1010
Thou, t 814.7
1,824.5
2.242.1
620.1
METALS,
Mil
881.2
1,914.8
2,514.1
688.4
, EXCLUDING MACHINERY. PRODUCTION
187*
840.4
2,105.0
2,711.5
876.7
I»73
801.4
2,148.2
2,971.0
853.5
in*
1,068.8
2,353.5
2,906.7
826.4
m»
1.042.9
2,198.5
2,927.1
754.8
197*
1,318.3
2.410.5
2,405.8
700.8
1977
1,385.0
2,670.7
2,794.1
856.1
ma
1,819.6
2,781.5
2,526.5
787.1
1*79
1,942.3
3,198,0
2,945.6
866.2
19*0*
1,806.4
2,687.1
2.566.9
674.9
Spec<82)
Page 14
o > Q. Q.
-Nl
(1) Sines 1977. porous Iron la Included. (*) Provisional. Source: Centre of Slderurgical Industries.
Table 16. — MOTORCARS. PRODUCTION
Item Measuring Unit 1979 1971 1971 1973 1974 197J 1979 1977 1971 1979 1990
TOTAL
Cars
Wagonettes
Pick-ups
Jeeps
Delivery trucks
Lorries and bus chassis
Units 219,599
163,391
4,653
32,788
479
2,634
15,654
253,640
189,155
4,230
39,901
265
2,873
17,216
278,222
203,421
4,202
46,031
267
5,252
19,049
311.596
223,397
10.263
53,891
280
5,066
18,699
322,410
232,752
11,884
55,685
420
4,588
17,081
251,128
185,663
7,894
38,414
384
3,088
15,703
206,948
146,597
7,051
30,953
19
3,065
19,263
256,581
176,656
9,657
41,530
162
3,933
24,643
194,687
137,408
9,316
29,471
46
2,381
16,065
266,244
187,840
13,833
42,249
—
2,700
19,622
288,917
204,425
18,265
45.025
—
587
20.615
Source: Industrial Information Office.

Table 17. — MACHINERY, EXCLUDING ELECTRIC MACHINES. PRODUCTION
Item Measuring
Unit 1970 1*71 ma 1973 1974 1975 197* 1977 1979 1979 1990
Tractors
From 35 to 45 HP
From 46 to 65 HP
From 66 to 75 HP
From 76 to 85 HP
Over 65 HP
Road-building equipment
Front loader
Motor grader
Dredger
Internal combustion engines
Up to 30 HP
From 30 to 100 HP
From 101 to 200 HP
From 201 to 400 HP
From 401 to 1000 HP
From 1001 a 4000 HP
Over de 4000 HP
Units 19.9900)
2,660
4,370
653
2,904
403
697
167
468
62
54.180
26,300
12,546
15,272
16
37
6
3
13.822
3.184
4.657
1,848
3.756
377
929
367
491
71
63.867
33.817
15.578
14.384
24
47
14
3
15,412
4,153
4.474
2,333
3,482
970
909
422
403
84
70,155
39,398
15,592
14.959
109
79
18
21,306 (i)
6,312
3,900
5,342
3.650
2.103
691
382
235
74
69.667
34,514
22,294
12,676
115
41
25
2
24,573
7.529
4,474
6,249
3,819
2,502
734
405
206
123
74.612
35,018
25,763
13,690
44
75
22
18,828
5,690
3.341
4.092
3.027
2.676
753
384
157
212
66,884
31.368
24,135
11.101
213
35
32
23,923
3,081
4,764
6,393
2,761
6,924
632
406
110
116
74.437
27.868
30.778
15,320
376
43
52
__
25,845
2.307
5,882
4.817
3,273
9,566
1.027
643
216
169
82,592
31,658
30.554
19,907
329
67
77
5,939
347
1,729
689
468
2.706
1,465
810
330
325
54.225
31,300
11,709
10,734
314
106
58
4
10.625
731
2,425
1.273
977
4.859
1,143
720
275
148
65,432
34.428
17.121
13.536
188
62
37
3.619
152
657
279
448
2,083
674
394
186
94
-0 to 0) TJ CO to
a o -» oo cnru
o > a a
(1) The total does not coincide with the added partial figure*, since unit with Source: Industrial Information Office.
and HP lower than 39 are Included which were manufactured only during those years.

Spec(82)6/Add.7
Page 16
Table 19. — IGP. CONSTRUCTION
In millions of pesos at 1970 prices
Item 1970 1071 1972 1973 1974 1975 1978 1977 1979 197» 1980
Private construction
Public construction .
TOTAL
2,639 2,673 2.S60 2,385 2,589 3.127 3.027 2,766 2,931 3,304 3,566
2.387 2.669 2.732 2,286 2,452 2.145 2,907 3,969 3,662 3,724 4.018
5.025 5.342 5.291 4,671 5,041 5.272 5.934 6,735 6,593 7,028 7,584
fouree: Argentine Central Bank.

Table 20. — CONSTRUCTION
Measuring Item Unit 1970 1971 1972 1*71 1974 1979 1979 1977 1979 1979 1990
Deliveries of Cement Thou, t 4,542.7 5,515.6 5,398.3 5,105.4 5,409.5 5,481.1 5,673.2 5,844.6 6,255.5 6.609.8 7,050.6
Public works „ 1,242.2 1,532.7 1,490.1 1,301.6 1,4094 1.462.6 1,434.3 1,317.1 1,479.1 1,635.1 1,891.4
Private works „ 3,500.5 3.982.8 3,908.2 3,893.6 4,000.1 4,018.5 4,238.9 4,527.5 4,776.4 4,974.7 5,159.2
Building licenses granted:
Federal Capital
• Number of licences Unit 7,785 7.053 6,825 7,048 7,620 6.939 5.177 6,249 4.278 3.625 3,612
• Surface area Thou, m» 5,557.2 4.159.0 2,890.5 2,803.9 3,699.2 4,078.5 2,488.0 7,036.8 4,720.9 1,442.3 1.633.5
Greater Buenos Aires
• Number of licenses Unit 46,282 42,502 42,669 34.798 58.384 67.700 38,649 47,949 30,817 Ô->
• Surface area Thou, m* 4,857.5 4.582.1 4,379.4 3,699.1 5,332.1 5,480.9 4,105.9 5,056.0 3,334.6 g; . -g
Source: National Inst, of Stat, and Censisj, Sidérurgie Industrial Centre.
T)C/>
ÛITD
n o -» oo