Working Paper Series Early Academic Outcomes of
40
MELBOURNE INSTITUTE Applied Economic & Social Research Working Paper No. 29/17 October 2017 Working Paper Series Early Academic Outcomes of Funded Children with Disability John Haisken-DeNew Cain Polidano Chris Ryan
Transcript of Working Paper Series Early Academic Outcomes of

MELBOURNE INSTITUTEApplied Economic & Social Research
Working Paper No. 29/17October 2017
Working Paper SeriesEarly Academic Outcomes of Funded Children with Disability
John Haisken-DeNewCain PolidanoChris Ryan
Early Academic Outcomes of Funded Children with Disability*
John Haisken-DeNew, Cain Polidano and Chris Ryan Melbourne Institute: Applied Economic and Social Research
The University of Melbourne
Melbourne Institute Working Paper No. 29/17 October 2017
* The research in this paper was commissioned by the Victorian Department of Education and Training (VDET). Data for this study is from the Australian Early Developmental Census 2012, administered by the Australian Department of Education and Training (ADET), linked at the student level to information on disability funding under the Victorian Department of Education and Training’s (VDET) Program for Students with Disability 2012-2015 and academic assessment information from the National Assessment Program for Literacy and Numeracy 2015, administered by the Australian Curriculum and Assessment and Reporting Authority (ACARA). We thank VDET for making the data available, for linking the data and for helping with its use. All research findings and opinions are those of the authors and should not be attributed to ADET, VDET or ACARA. Contact: <[email protected]>.
Melbourne Institute: Applied Economic and Social Research
The University of Melbourne
Victoria 3010 Australia
Telephone +61 3 8344 2100
Fax +61 3 8344 2111
Email [email protected]
WWW Address melbourneinstitute.unimelb.edu.au
2
Abstract
People with disability face considerable difficulty participating fully in work and the wider
community, due in part to poor schooling outcomes. To enable students with disability to
meet their potential, the governments provide extra funding to schools to help them meet
their special learning needs. Such funding includes extra funding for meeting diverse student
needs under formula-based block grant arrangements, funding for specific programs and
funding that is targeted at the individual level. In this study, we take a first-step in examining
outcomes from targeted funding, over and above outcomes from other funding sources, in
mainstream public schools in Victoria under the Program for Student with Disability (PSD).
We use information on disability and child development in the first year of school from the
Australian Education and Development Census (AEDC), linked to Year 3 NAPLAN and
information on PSD receipt from Year 1 to Year 3. We find that only around 17% of
mainstream public-school students with disability who are in the bottom quarter of the state
developmentally receive ongoing targeted funding under the PSD between 2012 and 2015.
Using multivariate regression and rich administrative student data to control for differences
between students with disability who do and do not receive targeted funding, we find that the
receipt of PSD is strongly associated with being exempt from sitting NAPLAN, which
obstructs any proper examination of the educational outcomes from funding. These results
raise the prospect of extending existing funding according to developmental need, but caution
that any such change should be accompanied with measures that ensure funding outcomes
can be assessed.
JEL classification: I22, I24, I28
Keywords: School funding, disability, standardized test scores

3
1. Introduction
It is well known that people with disability are much less likely to participate in work, which
limits their independence and life prospects. In Australia, despite favourable labour market
conditions and strong economic growth over the last twenty years, the employment rates of
working-age people with disability remain much lower than for those without a disability.
Data from the Household Income and Labour Dynamics Australia (HILDA) shows that in
2014, 35% of people aged 18 to 64 were out of work, compared to 14% for the population
without a disability. There are several reasons for the low rates of employment, including the
impacts of their condition on their functioning, discrimination in the workplace, disrupted
work history associated with the management of their condition, low self-esteem, inferior
employment networks and poor school and post-secondary education outcomes (Polidano and
Mavromaras 2010).
While there are many potential barriers to employment faced by people with disability, from
a policy perspective, closing education gaps is often emphasised as an area where
governments can make real difference. Other areas of public policy focus, such as regulations
to limit discrimination, have proven to have limited effects (Schumacher and Baldwin 2000
and Hotchkiss 2004) and in some cases, negative effects on employment (DeLeire 2000;
Acemoglu and Angrist 2001 and Bell and Heitmueller 2005). Given the role of schooling in
laying the foundations for higher-level study and the low rates of school completion among
children with disability, it makes sense for governments to concentrate on supporting children
with disability in their early years of schooling.1
However, it is clear that government efforts must recognise that children with disability start
school at a considerable developmental disadvantage compared to their peers. Data from the
Australian Early Development Census (AEDC), a population-based evaluation of child
development, shows that among Victorian public-school Preparatory (Prep) students, almost
half of those with disability are in the bottom quarter in language and cognitive skills,
compared to around a fifth of those without disability.2 Longer-term, in the absence of any
1 36% of working-age people with a disability in Australia completed school, compared to 60% overall (ABS
2012).
2 Excluding students in special schools.
4
intervention, evidence suggests that initial developmental gaps tend to widen over time
because of the cumulative nature of education, or “skills beget skills” (Heckman 2006). This
underlines the importance of early educational investments targeted at minimising any
disparity in initial outcomes, which have the potential to reduce the risk of costlier outcomes
down the track, such as welfare dependence and social exclusion (Chiu and Khoo 2005;
Caldwelll and Spinks 2008; Gonski et al. 2011; OECD 2011).
While there are a range of early school measures with an aim of supporting children with
disability, a key element of government efforts has been to provide extra funding to cater for
the special learning needs of children with disability. Extra funding can take many forms,
including formula-based adjustments to block funding grants to allow schools to meet the
diverse learning needs that include the needs of children with disability; program based, such
as funding for allied health professional services (for example, speech pathologists,
physiotherapists, psychologists, occupational therapists), and targeted funding that aims to
meet individual student needs.
In this study, we take first steps in trying to understand the outcomes of targeted funding over
and above the benefits that are provided by extra school-level funding that is made available
through block grants for children with disability in mainstream schools.3 We do this by
examining NAPLAN outcomes of children who receive targeted funding under the Program
for Students with Disabilities (PSD) in mainstream Victorian public schools (excluding
special schools). A feature of this study is the linking of 2012 Victorian public-school student
development information from the AEDC to administrative records of PSD funding and
Year 3 NAPLAN. The specific outcomes examined are the rate at which students who are
continually funded (at level 1 to 4) from their first year of school participate in Year 3
NAPLAN and whether, having sat NAPLAN, they attain the national minimum score.4 As a
comparison group, against which to measure outcomes of children who receive targeted
funding, we use children with an identified disability in AEDC 2012 data that received no
targeted funding up to the time they were in Year 3. The study is clearly not an evaluation of
targeted PSD funding or anything like it, since it deals with just one group who receive
3 We exclude students with disability in specialist schools.
4 This excludes students funded at levels 5 and 6 who have relatively high functioning limitations and
educational needs.

5
targeted funding at the outset of their school careers. But it does point to the type of work that
can done with suitable data to assess aspects of the operation of funding programs for
students with disabilities.
This study fills an important gap in evidence on the effectiveness of targeted funding in
improving the educational outcomes of children with disability. Evidence to date is restricted
to qualitative studies by the National People with Disabilities and Carer Council (2009) and
the Victorian Equal Opportunity and Human Rights Commission (VEOHRC) (2012), which
raise concerns about the adequacy of existing funding and point to the need for more
professional development and specialist supports. While these views are informative, they
cannot be used to draw conclusions about the effectiveness of existing funding arrangements.
Although there is little on the outcomes of targeted funding for students with disability, there
is related evidence on the efficacy of early interventions in improving the outcomes of
children with autism and other developmental conditions (see Swanson, Lee and Hoskyn
1998, Eldevik et al. 2009, Reichow 2012 for reviews).
A key challenge when comparing outcomes between the two groups is that differences are
likely to be partly related to the impact of the PSD and partly due to differences in student
characteristics, especially differential capabilities, between the two groups. To get a better
sense of differences that may be due to the receipt of funding, we adjust for differences in
outcomes related to student characteristics available in the AEDC and NAPLAN using
multivariate econometric techniques. The factors that we control for include those related to
assessment of child development in the first year of school; identified disability type; teacher
identification of special needs; student school-level factors and student socio-economic
backgrounds. However, we stress that despite the richness of the factors we control for, there
remains a risk that there are unobserved factors that explain differences in outcomes between
the groups. While we cannot address this issue with the data available, we discuss in the
conclusions how this issue may be addressed through future data extensions.
In the following sections, we outline objectives and criteria for receipt of targeted funding
under the PSD program; we then describe the data and the linking process; discuss results and
conclude with implications and directions for further research.

6
2. Targeted PSD funding program
Extra funding in Victoria to support the special learning needs of children in mainstream
public schools with disability is delivered through three main channels. The first is through a
formula-based block funding grant, known as the Student Resource Package (SRP) that takes
into account the diverse learning needs of students, including those with disability.5 Second,
the PSD provides school-level funding for specific programs, such as the Language Support
Program (LSP) that provides extra resources to support students with language problems. The
third is targeted PSD funding, the focus of this study, which is designed to support individual
children with moderate to high educational adjustment needs. For students with disability
who do not receive targeted funding, schools are expected to make reasonable adjustments
under the Disability Discrimination Act 1992 to cater for their special needs using funding
from the other two sources. However, we note that programmatic funding to mainstream
public schools represents only a fraction of targeted funding — $44 million compared to
$460 million in 2015 (VDET 2016a). As a result, our analysis on the outcomes from targeted
PSD funding represents outcomes over and above any benefits from the receipt of funding
from the alternative sources of funding.
There are three broad objectives of targeted PSD funding. They are to help schools in:
1. Student learning: support and improve the learning of students, as measured by
performance in NAPLAN, the Victorian Curriculum framework and school based
assessment.
2. Student engagement and wellbeing: support the access and participation of students in
an inclusive schooling system; as measured by attendance, retention and student
school satisfaction surveys.
3. Student pathways and transitions: support transitions for students, into, through and
post school as measured through attendance, retention and On Track data.
Students can be funded under one of seven categories: autism spectrum disorder, hearing
impairment, intellectual disability, physical disability, severe behaviour disorder, severe
language disorder with critical educational needs and vision impairment. Eligibility for
funding depends on meeting specific diagnostic-criteria that are based on guidelines set by
5 From 2016, it also includes an extra equity component.

7
the World Health Organisation (see Table A1, appendix A). For example, to be funded under
intellectual disability, a student must have score two standard deviations below the mean on
tests of general intelligence and adaptive behaviour and a history and evidence that the
problem can be expected to persist during school years. Although there are seven categories
of disability funding, the overwhelming majority of funded students (85% in 2015 (VDET
2016a)) were under intellectual or autism spectrum disorder.
Targeted PSD funding is provided at six levels depending on the level of support needed and
schools are given autonomy to decide how the funding is used. These may include, but are
not limited to, funding of a specialist teacher or allied health professional, teacher training,
education support staff (aid) and/or staff training.
To access targeted PSD funding, schools must submit an application containing evidence that
addresses the PSD eligibility criteria by February in the year of commencing school. Before
an application is made, schools arrange for a professional screening to establish whether the
criteria for funding are met and complete an Educational Needs Questionnaire (ENQ), which
is used to determine the level of funding needed. The application will not proceed if
eligibility cannot be established from the initial screening, but the Principal is required to
make other provisions for support from other available resources. If an application is made,
verification of eligibility is determined by Victorian Department of Education and Training
(VDET) and independent professionals. Funding under the PSD is made available to schools
for professional screening and administering applications.
In 2012, the first year of funding available to students examined in this study, the targeted
funding amounts (in 2012 terms) were: $6095 (level 1); $14,095 (level 2); $22,250 (level 3);
$30,366 (level 4); $38,421 (level 5) and $46,519 (level 6).6
3. Data
The main data source for analysis is 2012 Victorian public-school (excluding special school)
entrants from the Australian Early Childhood Census (AEDC) linked to 2012-2015 PSD
funding information from the Victorian Department of Education and Training (VDET) and
NAPLAN 2015 assessment data. The linking of the data sources was carried out by VDET.
To conduct the linking exercise, Victorian public-school (excluding special schools) entrants
6 www.education.vic.gov.au/management/srp/budget/ref015/psd1-6.htm.

8
from AEDC 2012 was used as the base population and targeted PSD and NAPLAN
information was linked-in. For targeted PSD, linking was done using a unique student
identifier common to both datasets; while for NAPLAN, identifying information common to
both datasets was used (name, date of birth, gender and school number) in a probabilistic
matching algorithm. Data presented in Table 1 show an 88% match between AEDC and
NAPLAN. In the latter case, there may be a number of reasons for the less than perfect
match, but the most likely explanation is that some students who commence schooling in a
public school move to the private system.7 More importantly for this study, we find no
difference in the proportion of AEDC students who are matched to NAPLAN by targeted
PSD funding status.
Table 1. Overview of the AEDC 2012 match with NAPLAN outcomes by targeted PSD funding status
Any receipt of Targeted PSD
No receipt of targeted PSD
AEDC 1,409 46,548 AEDC matched with NAPLAN 1,238 41,144 88% 88% Sat NAPLAN reading testa 428 38,775 35% 94% Exempt 563 138 45% 0% Absent 52 1,279 4% 3% Withdrawn 195 952 16% 2% Note: AEDC 2012 is for Victorian public school entrants and NAPLAN 2015 data is for public school students, excluding special school students. AEDC and NAPLAN data are matched using unique postcode and date of birth combinations. aThe proportion who sits the reading test is almost identical to the proportion who sits the tests of the other NAPLAN domains.
3.1 The Australian Early Development Census (AEDC)
The AEDC is a triennial national population-based evaluation of individual child
development in the first year of full-time schooling. The evaluation is completed by teachers
and contains around 100 questions on each child’s development in five key domains: physical
health and wellbeing; social competence; emotional maturity; language and cognitive skills
7 There was also a small, but disproportionate number of the base population with targeted PSD funding who
appeared in 2014 NAPLAN. To avoid any bias in the sample, these were also linked-in.

9
(school-based); and communication skills and general knowledge. For each domain,
responses to relevant questions are combined to produce an overall score from 0 to 10, where
a higher score indicates a higher level of development. Domain scores have been developed
and validated for use as a population measure at a group level, but have not been
psychometrically tested for application in relation to individual children (Australian
Department of Education and Training (ADET) 2016). For each domain, there are a series of
sub-domains over which students are assessed, also on a scale of 0 to 10. For example for the
language and cognitive skills domain, there are sub-scales for basic literacy, interest in
numeracy and literacy, advanced literacy and basic numeracy, although these have not as yet
been validated (AEDT 2016).
Importantly, the AEDC also includes a battery of questions regarding child
disability/impairment that are known to the school. To prepare for the AEDC, teachers are
asked to access all student details held by the school, including information on diagnosed
medical conditions and special needs that are collected upon enrolment.8 Disability is
identified by whether the teacher reports the child has a condition/impairment that influences
their ability to do school work in a regular classroom, where condition/impairment is either a
physical disability; visual impairment; hearing impairment; speech impairment; learning
disability; emotional problem; behavioural problem or whether they have an enduring
neurological condition.9 It is important to stress that this definition is based on whether the
teacher identifies the presence of a condition that affects the student’s ability to work in a
regular classroom, rather than whether or not the student has a diagnosed medical condition.
We chose this definition over the diagnosis of a medical condition because it better aligns
with the World Health Organisation definition of disability being associated with a condition
that limits an activity, which is appropriate given the objectives of PSD.
As well as questions related to impairments, there are also questions on whether the child has
any enduring problems including a chronic illness; neurodevelopmental disorder (e.g. Foetal
Alcohol Syndrome) or other enduring problem. Finally, teachers are asked whether the
student has any special needs or special assistance because of chronic medical, physical or
8 Visit the website https://www.aedc.gov.au/Websilk/Handlers/ResourceDocument.ashx?id=f3912564-db9a-
6d2b-9fad-ff0000a141dd for more information on teacher preparation.
9 Represent responses to variables D1-D7 and D10B in the AEDC.
10
intellectually disabling conditions (e.g. autism, cerebral palsy, Down syndrome), based on a
medical diagnosis or medical diagnoses. Teachers are also asked whether they believe the
child needs further assessment (e.g. medical or physical, behaviour management, emotional
or cognitive development).
3.2 Targeted funding under the Program for Students with Disabilities (PSD)
The PSD data from the Victorian Department of Education and Training (VDET) contains
three fields — a flag for receipt of targeted PSD funding and two categorical variables for
level of funding (Level 1 to Level 6) and condition that the student is being funded for
(autism spectrum disorder (ASD); intellectual impairment; physical disability; visual
impairment; hearing impairment; severe language disorder and severe behaviour disorder).
These three fields are provided for both 2012 and 2015.
3.3 National Assessment Program of Literacy and Numeracy (NAPLAN)
NAPLAN is an annual national assessment of students in Years 3, 5, 7 and 9 that aims to
track student progress through school in the domains of reading, writing, language
conventions (spelling, grammar and punctuation) and numeracy. At the time of analysis, only
information on Year 3 NAPLAN data was available for our 2012 AEDC students. NAPLAN
is designed to test student skill levels for their age, including whether students meet minimum
national standards that are deemed essential for continued learning. As well as NAPLAN test
scores for the AEDC 2012 cohort, the NAPLAN data also contains student socio-economic
information, such as parents’ education, student country of birth, confidentialised unique
school identifier and school region.
While everyone is expected to sit NAPLAN, there are several reasons why students may not
sit the test. First, students with significant or complex disability (and those from a non-
English speaking background who have arrived in Australia less than a year ago) may be
exempted by the school from sitting the test. However, exemptions are not automatic; a
parent/carer is required to sign a consent form and adjustments are available to reasonably
accommodate their condition. Students can also be withdrawn from NAPLAN by their
parents on the basis of religious beliefs or due to philosophical objections to testing. Finally,
students may be absent during the period of testing.
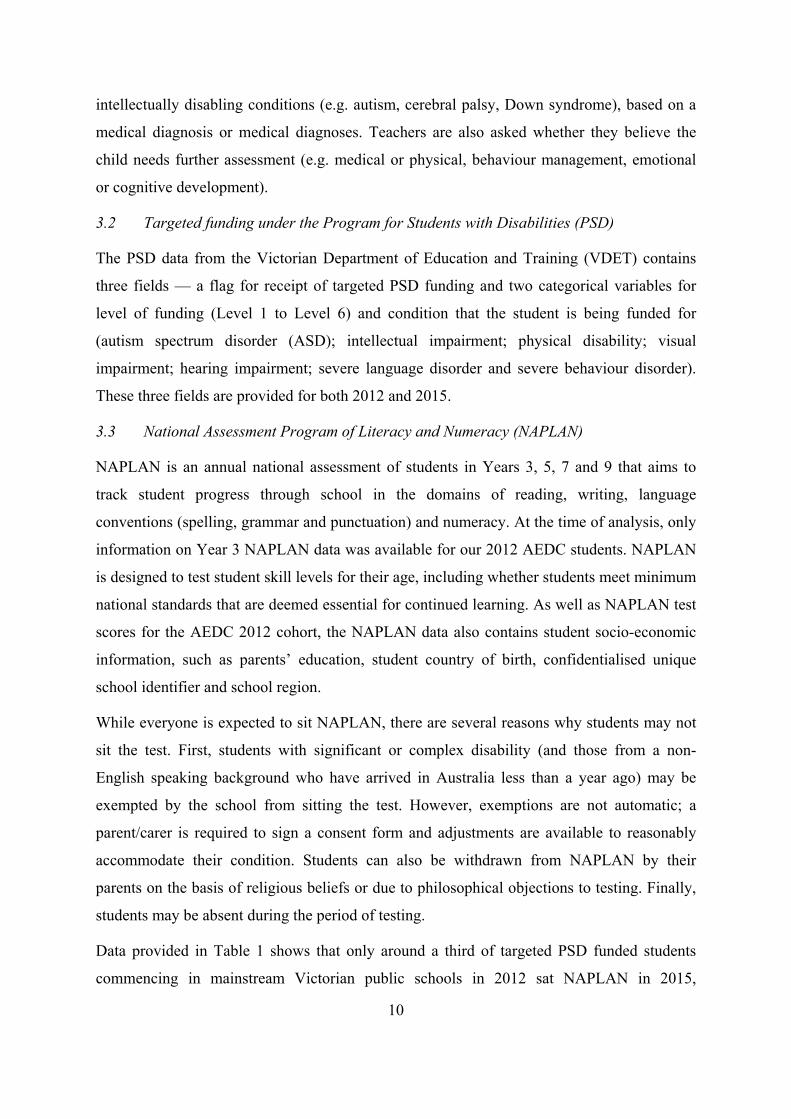
Data provided in Table 1 shows that only around a third of targeted PSD funded students
commencing in mainstream Victorian public schools in 2012 sat NAPLAN in 2015,
11
compared to 94% of those who receive no targeted funding. Of the 1,115 funded student who
were matched to NAPLAN data, only 265 sat NAPLAN. The remaining 850 are mostly
exempted by the schools (715) or are withdrawn by parents (103).
3.4 Sample for analysis
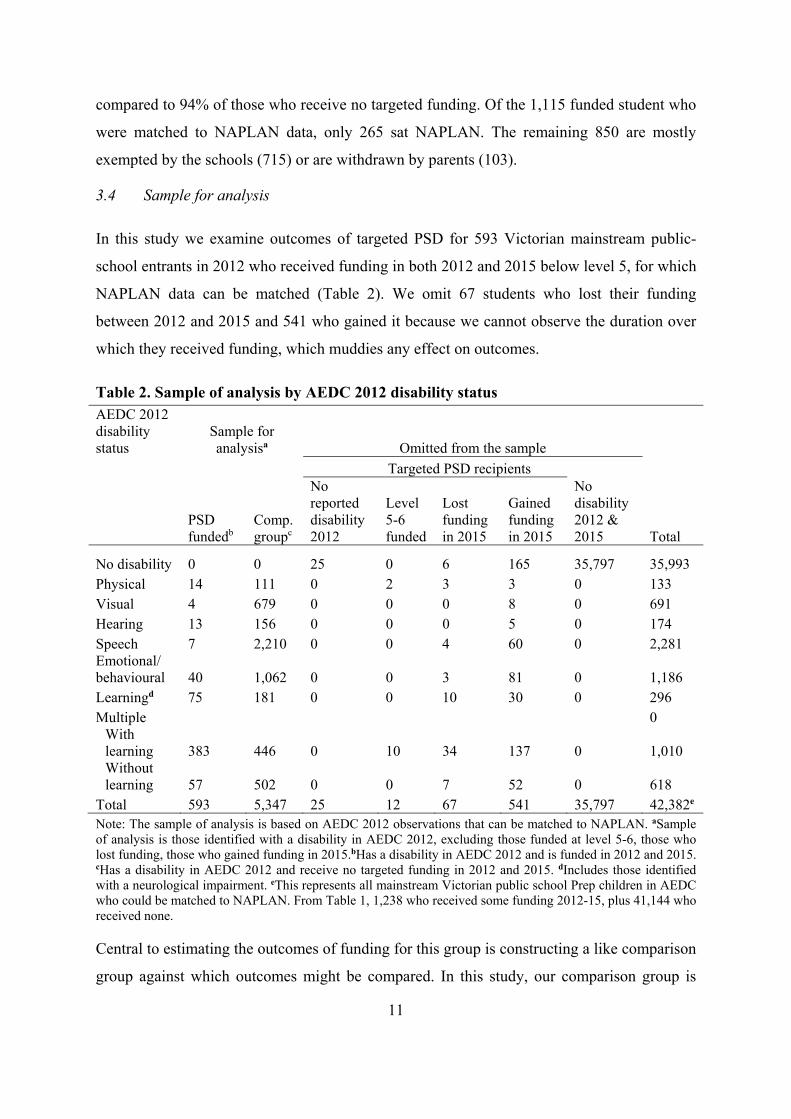
In this study we examine outcomes of targeted PSD for 593 Victorian mainstream public-
school entrants in 2012 who received funding in both 2012 and 2015 below level 5, for which
NAPLAN data can be matched (Table 2). We omit 67 students who lost their funding
between 2012 and 2015 and 541 who gained it because we cannot observe the duration over
which they received funding, which muddies any effect on outcomes.
Table 2. Sample of analysis by AEDC 2012 disability status AEDC 2012 disability status
Sample for analysisa Omitted from the sample
Targeted PSD recipients
PSD fundedb
Comp. groupc
No reported disability 2012
Level 5-6 funded
Lost funding in 2015
Gained funding in 2015
No disability 2012 & 2015 Total
No disability 0 0 25 0 6 165 35,797 35,993 Physical 14 111 0 2 3 3 0 133 Visual 4 679 0 0 0 8 0 691 Hearing 13 156 0 0 0 5 0 174 Speech 7 2,210 0 0 4 60 0 2,281 Emotional/ behavioural 40 1,062 0 0 3 81 0 1,186 Learningd 75 181 0 0 10 30 0 296 Multiple 0
With learning 383 446 0 10 34 137 0 1,010 Without learning 57 502 0 0 7 52 0 618
Total 593 5,347 25 12 67 541 35,797 42,382e Note: The sample of analysis is based on AEDC 2012 observations that can be matched to NAPLAN. aSample of analysis is those identified with a disability in AEDC 2012, excluding those funded at level 5-6, those who lost funding, those who gained funding in 2015.bHas a disability in AEDC 2012 and is funded in 2012 and 2015. cHas a disability in AEDC 2012 and receive no targeted funding in 2012 and 2015. dIncludes those identified with a neurological impairment. eThis represents all mainstream Victorian public school Prep children in AEDC who could be matched to NAPLAN. From Table 1, 1,238 who received some funding 2012-15, plus 41,144 who received none.
Central to estimating the outcomes of funding for this group is constructing a like comparison
group against which outcomes might be compared. In this study, our comparison group is

12
Victorian mainstream public-school entrants in 2012 who receive no targeted funding, but
who are identified by their teacher in the AEDC as having a disability. To make the
comparison group as close as possible in attributes to the PSD-funded group, we restrict the
definition of disability to AEDC disability types that are comparable to those that are funded
under targeted PSD — learning difficulty or neurological impairment; physical disability;
visual impairment; hearing impairment; speech difficulty; emotional or behavioural problem.
To reduce differences between the funded and comparison group further, we also omit 12
students who are funded at the Level 5 and 6 because they have severe and complex disability
that makes them very different.10
From statistics reported in Table 2, there are 6,389 mainstream public school Prep students
with disability identified in the AEDC (with matching NAPLAN results), or 16% of
Victorian mainstream public school Prep students in 2012.11 This is consistent with the 15%
of public-schools students that VDET has identified have a disability that needs some level of
‘reasonable adjustment’ (VDET 2016a). Among the AEDC disability categories, the most
commonly identified conditions are speech impairments (5%), learning impairment
(including those combined with other conditions) (3%), behavioural/emotional problems
(3%) and visual (2%).
Of the 6,389 with disability in 2012, 672 received targeted PSD funding or 11%. From data
presented in Table 2, targeted PSD funding appears to be concentrated among children with a
learning impairment. Of the 672 students who receive targeted funding, 512 or 76%, have a
learning or neurological impairment. Among the 1,306 children in the sample that are
identified as having a learning impairment, this represents a funding rate of 39%. In contrast,
the funding rates for other conditions are relatively low — 14% for physical, 10% for
multiple conditions that do not include learning impairments, 7% hearing, 4% emotional
behavioural and 1% for visual.12
10 None of these students sit NAPLAN in 2015.
11 Which is consistent with the rate for the entire Victorian public school population in ADEC 2012.
12 These rates are calculated for students who do not have a learning or neurological impairment or any other
impairment.
13
It is important to stress that the low rates of funding among mainstream public-school
entrants may represent both a large proportion of children with disability who do not meet the
targeted PSD criteria for funding and difficulties demonstrating eligibility under the criteria.
There may be a range of reasons why students may not apply or be unable to demonstrate that
they meet the criteria. These include: difficulty identifying certain conditions early on; school
administrative difficulties in co-ordinating an application for funding; and a reluctance of
parents to have their child assessed, especially if they believe that funding will lead to their
child being stigmatised. The relative importance of school and student-level factors
associated with the receipt of targeted PSD funding is examined using econometric
techniques (section 4).
3.5 Defining outcomes
As outlined in the PSD guidelines, there are three main objectives of targeted PSD
(VDET 2016b). In this study, we focus only on outcomes related to one objective — to
support and improve learning. Despite the limited number of funded students who sit the
tests, we choose to examine NAPLAN outcomes because it is identified in the PSD
guidelines as a key measure of student learning (VDET 2016b). Also, other measures of
learning, such performance in the Victorian Essential Learning Standards (VELS), could not
be linked to AEDC 2012 at the time of analysis. Analysis is focussed on the NAPLAN
domain of reading, but results for numeracy are much the same.
We use two measures from NAPLAN: whether or not the student sat NAPLAN; and,
conditional upon sitting NAPLAN, scoring above the national minimum reading standards. In
terms of raw statistics, 83% of the sample for analysis is observed to sit NAPLAN, but with
stark differences in the rate at which the funded and comparison group participate — 34%
compared to 89% (Table 3). However, such stark differences are not observed in attainment
of minimum national standards among those who participate — 92% compared to 94%.
It is important to point out that the raw differences in NAPLAN participation rates between
the targeted PSD recipients and comparison group are likely to be partly due to student
differences, such as differences in student capabilities, and not due to the receipt of PSD. We
attempt to adjust for student differences using multivariate analysis techniques that are
discussed in the next section. The other point of note is that the funded students who sit
NAPLAN are a select group and their NAPLAN scores are likely to be well above those of
other funded students had they participated in NAPLAN. This must be born in mind when

14
making interpreting any estimated differences in the attainment of national standards between
the two groups.
Table 3. NAPLAN outcomes for the sample for analysisa Recipients of targeted PSDb
Comparison groupc Total
Participated in NAPLAN reading test
Yes 204 4,734 4,938 34% 89% 83%
No 389 613 1,002 66% 11% 17%
Total 593 5,347 5,940
Attained national minimum standards in NAPLAN reading, given participation
Yes 188 4,445 4,633 92% 94% 94%
No 16 289 305 8% 6% 6%
Total 204 4,734 4,938 aSample of analysis is those identified with a disability in AEDC 2012, excluding those funded at level 5-6, those who lost funding, those who gained funding in 2015 .bHas a disability in AEDC 2012 and is funded in 2012 and 2015. cHas a disability in AEDC 2012 and receives no targeted funding in 2012 and 2015.
4. Econometric method
The main challenge in examining the outcomes from targeted PSD funding is to adjust for
differences in student characteristics between funded students and their comparators
(observed in Table 3) that may also affect outcomes. In the absence of any information on
random variation in the receipt of targeted PSD, such as random differences in assessment of
eligibility for students on the margin of meeting the eligibility criteria,13 we rely on the
richness of observed student characteristics in our data to make these adjustments. We
employ two standard multivariate techniques — regression and Kernel propensity score
matching.
In the context of this study, propensity score matching adjusts for the effects of group
differences by using information in the data to construct a 'like' or 'matched' comparison
13 For example, because their tested IQ is just above or just below the threshold for funding under the
intellectual impairment category.

15
group for each targeted PSD recipient. Such comparison groups are generated for all funded
students and the average difference represents the effect that can be assigned to the receipt of
targeted PSD funding. Rather than explicitly constructing like groups using information in
the data, regression techniques calculate the difference in outcomes that can be attributed to a
student characteristic, separate from any effects that other student characteristics exert on the
outcome. Under regression analysis, the estimated coefficient for targeted PSD funding
represents the average outcome across all targeted PSD recipients that is not related to any
other observed differences between the groups, such as differences in observed student
capabilities.
In practice, these approaches provide similar results in most circumstances because they both
rely on the richness of the data to adjust for differences in student characteristics. In
particular, to adjust outcomes properly for differences in the characteristics of students in the
funded and comparison groups, both techniques rely on information in the data that is
associated with both group assignment and student outcomes. Such information is likely to
be, but not necessarily limited to, student capability, socio-economic disadvantage and
school-level factors. The choice and construction of such information in this study is
discussed in section 4.1 below. An advantage of matching is that it restricts analysis to
observations where there is overlap in the characteristics of treatment and comparison group
(Blundell and Costa Dias 2009), although because we already restrict our sample of analysis
(as discussed section 3.5), this is not likely to be much of an advantage in this setting.
4.1 Estimating the relationship between receipt of targeted PSD funding and student
characteristics
As discussed in the preceding section, the use of multivariate techniques to adjust for group
differences relies heavily on the use of information in our data that explains both group
assignment and student outcomes. To identify the importance of such factors in our data, we
first run regression (binary probit) models that measure the relationship between the receipt
of funding and a range of factors among students in our sample of analysis. As well as
pointing to the relative importance of various student characteristics in the multivariate
adjustment process, the results from this model may point to variation in receipt that is not
related to student capacity or impairment, such as school-level factors. Such variation may
represent barriers to the receipt of funding, for example, hurdles in identifying children who
are eligible, gaining support from parents and co-ordinating applications for funding.

16
Table 4. Mean characteristics for the sample for analysisa Recipients of targeted PSDb
Comparison groupc
Outcomes NAPLAN participation 34% 88% Attained minimum national standards, given NAPLAN participation 92% 94%
Student capabilities and impairments Rank in AEDC language and cognitive skills domain score among mainstream public-school Preps in Victoriad Bottom 10% 46% 16% 11-25% 24% 22% 26-50% 18% 27% Top 50% 12% 35%
AEDC impairment/condition Physical 2% 2% Visual 1% 13% Hearing 2% 3% Speech 1% 41% Emotional/behavioural 7% 20% Learning impairmente 13% 3% Multiple, with learning impairment 65% 8% Multiple, without learning impairment 10% 9%
AEDC special needs identifier 96% 11%
Student school-cohort characteristics AEDC percentage of school cohort with disability 0-25% 74% 70% 26-50% 24% 28% 51-75% 2% 1% More than 75% 1% 0%
AEDC percentage of funded disability within school cohort 0-25% 57% 92% 26-50% 35% 7% 51-75% 2% 0% More than 75% 6% 0%
AEDC size of school cohort Less than 30 entrants 23% 19% 31-60 entrants 33% 31% 61-80 18% 19% 81-100 11% 12% More than 100 entrants 15% 19%
Continued

17
Student socio-economic background Mother's highest education qualification (NAPLAN) Less that Year 12 27% 24% Year 12 12% 13% VET qualification 24% 28% Diploma/Advanced Diploma 13% 12% Degree or higher qualification 24% 23%
AEDC non-English speaking background 20% 13%
AEDC Aboriginal or Torres Strait Islander (ATSI) 4% 3%
AEDC country of birth Australia 95% 96% Other English-speaking country 2% 2% Non-English-speaking country 4% 2%
AEDC female 26% 35%
AEDC indicator for lives in Melbourne 69% 67% Number 593 5,347 aSample of analysis is those identified with a disability in AEDC 2012, excluding those funded at level 5-6, those who lost funding, those who gained funding in 2015. bHas a disability in AEDC 2012 and is funded in 2012 and 2015. cHas a disability in AEDC 2012 and receives no targeted funding in 2012 and 2015. dRank is based on all domain scores available on Victorian Preps in the data, including those without disability and those who are not matched to NAPLAN, but excluding students from special schools. This measure is generated by the authors and is not consistent with standard AEDC reporting and should not be attributed to the Australian Department of Education and Training. eIncludes those identified with a neurological impairment.
We generate a range of variables under three major categories that are related to both the
receipt of funding and student outcomes — student capacity and impairments; student school-
cohort characteristics and student socio-economic background. These ‘control’ variables are
presented in Table 4 together with their mean values for the funded and comparison group.
Table 4 also includes the mean outcome values for the two groups.
There are some key points to take away from Table 4. First, although the comparison group
does not receive targeted funding, on average, their language and cognitive development is
well below those without disability. Specifically, 38% of the comparison group have a
language and cognitive skills domain score in the bottom quarter of mainstream public-school
Preps, compared to 18% of those without disability. Second, as far behind as the comparison
group is compared to those without disability, the group that receive targeted funding are
further behind. We estimated that 70% of the recipients of targeted funding have a language
and cognitive skills domain score in the bottom quarter among mainstream public-school
Preps. The main reason for the lower language and cognitive domain scores of funded

18
students relative to the comparison group students is a higher rate of learning impairment —
77% compared to 12%.
A second point of note is that among the comparison group, 11% (604 students) are reported
to have special needs or require special assistance due to a diagnosed chronic disabling
condition. The main conditions these students are reported to have are a learning disability
(306), emotional/behavioural problem (107) or speech impairment (86). However, this result
should not be interpreted as meaning that only 11% of the comparison group would benefit
from targeted funding. The teacher response to this question needs to be considered within
the wider context of the AEDC. Given that teachers are responding to the question on the
basis of medical diagnosis of a chronic condition, it may under-represent any true assessment
of need because it ignores need associated with temporary conditions or undiagnosed
conditions.
Third, there appears to be large differences in the rate of receipt of targeted funding among
children with disability across schools. Out of 1,152 schools in the sample, 518 have at least
6 Prep children with an identified disability. Of the 518, 202 receive no targeted funding for
any of their Preps, 255 receive targeted funding for up to a quarter and 164 receive targeted
funding for more than a quarter (Table A2 in appendix A). In terms of our sample, those who
receive targeted funding are much more likely to be concentrated in schools that have higher
rates of targeted funding. Specifically, 43% of schools attended by recipients have a targeted
funding rate of over a quarter, compared to 7% of schools attended by the comparison group
(Table 4). This is a large discrepancy in targeted funding rates, but it does not necessarily
mean that schools attended by recipients of targeted funding are better at attaining funding for
their students with disability. Differences in the characteristics of students in schools attended
by the two groups may also explain the discrepancy. More specifically, it could be related to
the concentration of funded students with more complex learning difficulties (that have a
higher funding rate). We attempt to disentangle the relationship between the receipt of
targeted funding and school and student-level factors in the regression analysis.
Finally, compared to differences in student capabilities and impairments and school-level
factors, the differences in socio-economic characteristics between the two groups are minor.

19
5. Results
In what follows, we discuss results from multivariate regression models that measure the
importance of student and school-level factors related to the receipt of targeted PSD funding
and NAPLAN outcomes. All results presented in bar graphs are average probabilities, or
average rates, of an outcome (measured in percentage terms on the y-axis) associated with the
presence of student personal or school-level trait (represented by the category on the x-axis).
When interpreting the results, it is important to keep in mind that they represent partial
estimates, that is average rates of an outcome in the sample associated with a particular trait,
irrespective of the levels of all other traits.
5.1 Receipt of targeted PSD funding
In this study, we measure receipt of targeted funding as a binary outcome of whether a
Victorian mainstream public-school Prep with disability in 2012 received targeted PSD
funding in 2012 and 2015. We remind the reader that those who gain or lose targeted PSD
finding and those who receive level 5 or 6 funding are omitted from the analysis unless
otherwise stated. Below we present the probabilities, or rates of receipt, of targeted PSD
funding associated with student personal and school-level traits.
Across the three categories of explanatory variables, results from Figures 1 to 3 show that
while student capabilities and impairments and school characteristics are important factors in
the receipt of targeted PSD funding, student socio-economic background is not (Figure 3).
This provides some comfort that family background does not influence the rate at which
parents are willing to support targeted funding applications or influence which students are
targeted for funding. In the following sub-sections, we discuss results under each of the three
main variable categories.

20
Student capabilities and impairments
Figure 1. Estimated receipt rate of targeted PSD funding in 2012-15 associated with levels of student development, impairment and special needs among Victorian public school children with AEDC identified disability in Prep
*Excludes scores of students from special schools. Note: each bar represents the estimated average rate of funding for children with AEDC identified disability that is associated with the presence of a particular trait, independent of the levels of all other traits that are included in the regression model (student capacity and impairments, attended school traits and traits related to student socio-economic background).
Results presented in Figure 1 highlight that the nature of the child’s condition plays a much
more important role in determining targeted PSD funding receipt than their language and
cognitive development when they first start school. On average across our sample, teacher
identified special needs is associated with a 23% chance of receipt of targeted funding
compared to a 2% rate special needs was not identified. Taken together, being identified as
having special needs is associated with a 21 percentage point increase in the chances of
attaining targeted PSD funding on average across the sample. However, we caution that the
strong association between teacher identified special needs and receipt of targeted funding
may be due in part because of reverse causation; specifically, teachers are making
assessments of special needs based on previously made allocations of targeted funding.
0%
5%
10%
15%
20%
25%
AEDC Disability type Rank in AEDC languageand cognitive
development scores in Victoria*
Avearage
21
Impairment type in Prep is also important in explaining the receipt of targeted PSD. On
average across our sample, having a learning impairment is associated with a 12% chance of
receiving targeted funding and a 14% chance if the condition is combined with one or more
conditions from the other impairment categories. The rate of receipt of targeted funding
associated with hearing conditions is also above average at 16%. Receipt rates associated
with physical of multiple disabilities without a learning impairment are around the sample
average receipt rate average of 10%. At the lower end, receipt rates associated with
emotional/behavioural, speech and visual are 7%, 3% and 4% respectively. Differences in
receipt rates associated with impairment type reflect the nature of the targeted PSD criteria.
In particular, as the appropriate funding category names imply, funding for speech and
emotional/behavioural problems is only for severe and ongoing problems, while funding
criteria for visual impairment is consistent with that for being legally blind. Although there is
a low rate of targeted funding for children with speech impairments, PSD programmatic
funding is provided to the Language Support Program to assist teachers in developing
programs for students with language difficulties.
AEDC language and cognitive development is relatively unimportant in influencing receipt
of targeted funding (Figure 1). At the extremes, being in the bottom 10% in language and
cognitive skills across the state in mainstream public schools is associated with a 12% chance
of receiving targeted PSD funding, compared to 7% for being classified as being in the top
50%. This represents a 5 percentage point difference in receipt rates associated with student
development in Prep, which is a statistically significant difference (at 95% confidence). It is
important to keep in mind that the partial relationship between language and cognitive
development and the receipt of targeted funding may have been somewhat stronger if we had
not excluded those funded at levels 5 and 6.
Student’s school characteristics
While the nature of a child’s condition is important, results presented in Figure 2 suggest that
school practices may also play an important role in influencing the receipt of targeted
funding. Possible interpretations are that the school environment is important in identifying
early signs of disability and/or that there are differences in the efficacy of schools in initiating
and co-ordinating applications for funding. Estimates from Figure 2 suggest that irrespective
of school size, student capabilities and impairments and family background, on average
attending a mainstream public school with a higher rate of targeted funding in Prep is

22
associated with a higher individual chance of receipt of targeted funding. Attending a
mainstream public school where three quarters or more of Prep students with disability
receive targeted funding is associated with a 37% chance of individual receipt of targeted
funding, irrespective of student capabilities, impairments and school size. At the other
extreme, attending a mainstream public school where the rate of receipt of targeted funding is
up to a quarter is associated with an 8% chance of individual receipt.
Figure 2. Estimated chances of receipt of targeted PSD receipt in 2012-15 associated with characteristics of the school Prep cohort among Victorian public school children with AEDC identified disability in Prep
Note: each bar represents the estimated average rate of funding for children with AEDC identified disability that is associated with the presence of a particular trait, independent of the levels of all other traits that are included in the regression model (student capacity and impairments, attended school traits and traits related to student socio-economic background).
A potential problem with these results is that in schools where there are few Prep students,
individual student’s own funding status has a large bearing on the prep cohort funding rate.
This will tend to bias the results upwards. To test the sensitivity of our results to such bias,
we also omit observations from schools that admit less than 20 Preps. The nature of these
alternative results is the same, but their magnitude of the estimates is smaller, especially for
0%
5%
10%
15%
20%
25%
30%
35%
40%
Proportion of Preps with
disability who are funded
Proportion of Preps with a
disablitySize of school
Prep cohort
Avearage

23
schools with a funding rate greater than three-quarters — 8%, 17%, 20% and 26%
respectively.14
The positive relationship between school Prep funding rates and individual chances of
funding suggest that there are administrative differences among schools that influence the
individual chances of receiving funding. Findings from the recent VDET review of PSD
(VDET 2016a) suggest that differences may be related to differences in schools in complying
with the application process:
“The current approach to assessing eligibility for funding through the targeted PSD
component is costly, inconsistently understood and applied by schools, and results in
inequitable funding outcomes”, (Finding 17, p. 122).
An alternative explanation is that students who meet the criteria may concentrate in certain
schools. However, we stress that the concentration of disability is controlled for in our
regression models, so that any concentration effect would have to be because students sort
into schools on the basis of targeted funding criteria that are not controlled for in this study.
One possibility is that students with learning impairments who meet the criteria for targeted
funding concentrate in the same schools, but that AEDC domain score of language and
cognitive skills does not adequately control for differences in IQ, which is used determine
eligibility. Parents of these children may select the same schools because they offer more
supportive environments. Regression models of receipt of targeted funding estimated on
separate samples of Preps with and without a learning impairment do not support this
alternative interpretation. Both sets of results from these models (depicted in Figure A1 in
appendix A) show higher individual chances of targeted funding receipt for students in
schools that have higher rates of disability funding. This relationship appears to be even
stronger for funding of conditions that do not involve a learning impairment.
14 We also estimate results where observations from schools with less than 30 Preps is omitted and the results
are close to those when we omit observations from schools with less than 20. Results are also generated for a
model where we leave out the student’s own funding and disability status from school estimates (leave out
means). These results are again similar to those produced by omitting the smaller observations, although only
funding rates above half are associated with greater than average chances of receiving funding.

24
The rates of disability within the school Prep cohort only matter to the individual chances of
receipt if more than three quarters have a disability. Results from Figure 2 show that on
average, having more than three quarters of peers with disability is associated with a 14%
chance of individual student receipt of targeted funding. For levels less than this, the rates are
around the sample average of 10% with no significant differences in the levels.
We find no evidence that school size matters to the chances of individual funding receipt.
Therefore, any difference in effectiveness of schools in attracting funding is likely to do with
procedural differences that are unrelated to the economies of size.
Student’s socio-economic background
Figure 3. Estimated chances of receipt of targeted PSD funding in 2012-15 associated with student socio-economic background among Victorian public school children with AEDC identified disability in Prep
Note: each bar represents the estimated average rate of funding for children with AEDC identified disability that is associated with the presence of a particular trait, independent of the levels of all other traits that are included in the regression model (student capacity and impairments, attended school traits and traits related to student socio-economic background).
None of the student socio-economic factors used in this study have any significant
association with the receipt of targeted PSD funding. This is depicted in Figure 3 by bars that
all sit along the sample average receipt rate. It is important to note that we also experimented
0%
5%
10%
15%
20%
Mother's highest
education qualification
Country of birth
Speaks a language other than English at
home
Indigenousstatus
Avearage

25
with other controls for socio-economic background, including socio-economic of student’s
postal area (socio-economic indexes for areas (SEIFA)), whether or not the student
participates in a breakfast club (a measure of child deprivation) and whether or not the child
attending pre-school. None of these alternative measures had any statistically significant
association with the receipt of targeted funding.
5.2 NAPLAN outcomes from PSD funding
Results in this section measure the relationship between the receipt of targeted PSD funding
and two NAPLAN outcomes; participation in NAPLAN reading and attainment of minimum
national reading standards if the NAPLAN reading test was sat. All results are from the
multivariate regression model, with the same control variables used in estimating models for
targeted funding receipt; that is, those related to student capacity and impairments, attended
school traits and traits related to student socio-economic background. Results estimated using
propensity score matching are much the same as those reported here (see Figure A2 in
appendix A).
Students with disability
Overall, the results presented in Figures 4 and 5 below suggest that the receipt of targeted
funding is strongly linked to exemption from NAPLAN testing for students with disability.
Results in Figure 4 show that independent of a range of other student traits, the receipt of
targeted PSD funding is associated with a 58% chance of participating in NAPLAN,
compared to 87% chance with no targeted funding. In net terms, the receipt of targeted PSD
is associated with a 28 percentage point lower chance of sitting NAPLAN among students
with identified disability. This means that around half of the raw 55 percentage point gap in
the rates of sitting the test in Table 4 is explained by differences in the student, school and
family characteristics of the two groups, leaving half that cannot be explained by observed
differences.

26
Figure 4. Estimated Year 3 NAPLAN participation rate and national standard attainment rate associated with the receipt of targeted PSD funding among Victorian public school children with AEDC identified disability in Prep, multivariate regression
Note: the bars for PSD 2012-15 and No PSD 2012-15 represent the estimated average NAPLAN participation rate and national standard attainment rate associated with the receipt of targeted PSD and no receipt of targeted PSD respectively, controlling for differences in student capacity and impairments, attended school traits and traits related to student socio-economic background between the two groups.
*Not statistically difference from zero.
Figure 5. Estimated Year 3 NAPLAN participation rate associated with the receipt of targeted PSD funding among Victorian public school children with AEDC identified disability in Prep
Note: each bar represents the estimated average rate of NAPLAN participation associated with the level of PSD funding for a students with identified disability in Prep in the AEDC 2012 that have otherwise average disability types, special needs status, AEDC language and cognitive development in Prep, school characteristics and socio-economic background. The estimates for targeted PSD level are from a separate regression model to estimates for receipt of any targeted PSD funding.
58%
96%87%
94%
-28ppt
2ppt*
-40%
-20%
0%
20%
40%
60%
80%
100%
Participated in NAPLAN Attained minimu score, given NAPLANparticipation
PSD 2012-15 No PSD 2012-15 Difference
0%
20%
40%
60%
80%
100%

27
Importantly, estimates in Figure 5 show that the level of targeted funding, which is linked to
the condition severity, does not make much of a difference to the rate of exemption from
NAPLAN. While there is a 22 percentage point difference in the rate of participation between
those funded at levels 1 and 2 and those who receive no targeted funding (83% participation
rate compared to 61%), there is only a 10 percentage point difference between those funded
at level 1 and 2 and those funded at 3 and 4. This suggests that while those with more severe
conditions are exempted at a higher rate, the bulk of the overall impact on NAPLAN
participation rates is observed at the margin between receipt of targeted funding and not.
Results estimated according to changes in targeted funding between 2012 and 2015 add
further weight to our interpretation that targeted PSD is a flag for exemption from NAPLAN
(Figure 5). When we extend the sample to include those who lost and gained funding between
2012 and 2015, we find that gaining funding is associated with a similar exemption rate as
having been funded throughout the entire period (49%). In contrast, the participation rates
associated with loosing targeted funding are much more like those who never had it (71%). If
those who loose and gain targeted funding over the period have functional limitations that put
them on the margin of funding receipt, then it is highly likely that their funding status
explains the differences in NAPLAN participation and not unobserved differences in their
ability to sit NAPLAN.
Among students who sit NAPLAN, we find no significant relationship between receipt of
targeted funding and attaining minimum national NAPLAN standards (Figure 4). However,
the select nature of the funded group who sits NAPLAN makes it difficult to make any
conclusions about the effectiveness of targeted funding in improving academic outcomes.
Model results by level of targeted funding yield similar results as does using NAPLAN scores
rather than attainment of minimum standards as the outcome variable.
Students without disability
We are also able to estimate an equation like that of the previous section for students without
a disability. In this case, the relationship between outcomes and funding is based on
proportion of disability in the school Prep cohort that receives funding, other than the student.
We find no evidence that the school-level rate of receipt of targeted PSD funding among Prep
students with disability impacts on the participation or academic achievement of students

28
without disability. Results in Figure 6 show consistently high rates of participation and
attainment of national standards associated with different rates of targeted funding. These
results also hold when we estimate regression models using in individual student NAPLAN
scores instead of a binary measure of attainment of minimum national standards.
Figure 6. Estimated Year 3 NAPLAN outcomes associated with targeted PSD funding rates among Victorian public school children without an identified AEDC disability in Prep
6. Conclusions
The educational outcomes of people with disability are known to fall short of those without
disability, which compounds the difficulties they face in participating in the workforce and
more broadly in the community. Given that their cognitive and language skills are, on
average, more than twice as likely to be in the bottom quarter in the state when commencing
school, efforts to support their learning should be directed early-on in their schooling. In this
study, we provide the first quantitative evidence on the allocation of targeted funding and
outcomes of students who receive targeted funding under the Victorian government’s
Program for Students with Disability (PSD).
Our results suggest that any move to an alternative model of funding that is based on learning
needs, as defined by student capabilities when in their first year of school, is likely to be
associated with a large expansion of students who receive targeted funding. Based on the
95% 95% 94% 94%98% 97% 96% 99%
0%
20%
40%
60%
80%
100%
NAPLAN participation
Attainment of minimum national reading standards, given participation

29
language and cognitive development of Victorian mainstream public-school Preps, we find
that while most of those who receive ongoing funding (levels 1-4) are in the bottom quarter in
the state (415 out of 593), they represent only 17% of all Preps (415 out of 2,442) with
disability who are developmentally in the bottom quarter in the state. This reflects the use of
diagnostic criteria to determine eligibility for targeted PSD funding, rather than criteria based
on learning needs. The rates of ongoing targeted funding for those in the bottom quarter with
behavioural/emotional problems, visual and speech impairments are particularly low — 15
out of 391; 1 out of 481; 3 out of 822 are funded respectively. This compares with 351 out of
714 children with learning impairments who are developmentally in the bottom quarter in the
state.15
As well as scope for extension, we also find evidence that administrative complexities may
impede the receipt of targeted PSD funding. In particular, we observe large differences in the
rate of receipt for children with disability across schools. We find that attending a school
where more than a quarter of the first year students have targeted funding increases the
individual chances of receiving targeted funding by around 10% on average (but can be as
high as 29%), regardless of the student’s capabilities and impairments and other school
factors. While we cannot rule out an alternative explanation that funded students are
concentrated in particular schools because of unobserved differences related to the criteria for
targeted funding, sensitivity tests suggest that this is unlikely. Further investigations into the
reasons for the apparent differences in school-level funding rates may be warranted,
especially differences in funding in the first year of school, a period where it likely to make
the most difference.
Results presented in this study suggest that the exemptions granted to children with disability
from sitting NAPLAN is an impediment to evaluating the effectiveness of targeted PSD
funding. We estimate that the continual receipt of targeted funding from Prep is associated
with a 28% lower chance of sitting NAPLAN in Year 3, independent of observed student
capabilities and impairments. When we consider the rates of NAPLAN participation
associated with loosing and gaining targeted funding between 2012 and 2015, states that are
likely to be associated with being on the margin of funding, those who gain targeted funding
15 It should be born in mind that programmatic PSD funding supports the Language Support Program to assist
teachers in meeting the needs of students with language difficulties.

30
exhibit a 22 percentage point lower participation rate than those who lose it. A possible
interpretation is that the receipt of targeted funding acts as a highly visible label of disability,
which principals use to exclude students to boost their school’s average NAPLAN scores.
As well as limiting the accountability of targeted funding, such actions may harm student
learning in a number of ways. First, by exempting students who receive targeted funding,
principles emphasise student impairments over their capacity to learn, which may affect their
self-efficacy and motivation to learn. Second, exempting students with disability from
NAPLAN may reduce the incentive to use targeted funding effectively to improve the
learning outcomes of students with disability. Finally, exempting students also limits the
opportunity for teachers to compare funded student progress against the trajectories of
similarly disadvantaged students nationally, which is important for evaluating school
programs.
A possible response might be to remove the NAPLAN exemption, but with accompanying
measures to prevent schools from responding by excluding students with disability from
enrolment. Such a measure may be reporting NAPLAN scores as average trajectories
according to different starting points in the distribution.
Given the highly selective nature of funded students who sit NAPLAN (204 out of 593), it is
difficult to make any firm conclusions about the relationship between targeted funding and
academic achievement. Among those who sit NAPLAN, we find no difference in the
attainment of minimum national NAPLAN standards in reading associated with the receipt of
targeted funding, controlling differences in a range of observable student characteristics. This
result is difficult to interpret because recipients of targeted funding who sit NAPLAN are
likely to be different to students from the comparison group who sit NAPLAN in ways that
we cannot observe in our data, but which are likely to impact upon their achievement. For
example, recipients of targeted funding who are not exempted may be from schools where
there is little between-school competition and impetus to improve NAPLAN scores, which in
itself may impact upon NAPLAN scores of those who sit the test. Given that NAPLAN was
the only outcome variable available at the time of analysis, we are unable to conclude
whether targeted funding has improved the academic outcomes of students or whether
extending funding would improve the outcomes of new recipients.
As discussed in the introduction, when comparing outcomes between those who do and do
not receive targeted funding, it is possible that differences in outcomes may be partly related

31
to differences in student characteristics, especially differential capabilities. While we are able
to use rich data and multivariate econometric techniques to control for these differences, there
remains a risk that some of the differences in outcomes remain uncontrolled for. This may be
because the controls that we use, such as the AEDC language and cognitive skills domain
score, do not fully control for differences in severity of disability or because there are other
factors that affect outcomes, such as school-level factors, that are not observed in our data. To
the extent that there are differences in outcomes related to uncontrolled-for factors between
the two groups, then our findings may not be completely accurate. It is impossible to know
the extent to which our results may be biased. For this reason, results presented in this study
represent a first-step in understanding the outcomes from targeted funding.
For the future, to estimate true causal estimates, we recommend analysis based on a
comparison between groups that are at the margin of funding; that is, a comparison of
outcomes of those who just met the targeted funding criteria and those who applied and just
missed out, known as regression discontinuity design (RDD). This would require the linking
of initial assessment information for those who did and did not receive funding. An issue with
this approach is that it only estimates causal impacts for students on the margin of funding,
which is not necessarily indicative of outcomes for all funded students. To compliment RDD,
another approach would be to examine differences in the individual Year 7-9 trajectories of
students who gain or lose funding at the Year 6-7 review compared to those who maintain
funding. This would require linking of academic performance measures between primary and
secondary school with PSD information, including initial assessment information, funding
levels and outcomes of the Year 6-7 review. We also recommend the linking of other
measures (besides NAPLAN) to PSD information to better gauge outcomes from targeted
funding. These include performance in AUSVELS and student engagement as measured in
student satisfaction surveys, attendance records, school completion and post-school
transitions observed in On Track.

32
Appendix A: Supporting material
Table A1. Criteria for funding under the PSD 2016
Category Criteria
1. Physical disability A A significant physical disability;
AND/OR
B A significant health impairment;
AND
C Requires regular paramedical support.
2. Visual impairment A Visual acuity less than 6/60 with corrected vision;
OR
B That visual fields are reduced to a measured arc of less than 10 degrees.
3. Hearing impairment
A A bilateral sensori-neural hearing loss that is moderate/severe/profound;
AND B The student requires intervention or assistance to communicate
4. Severe behaviour disorder
A Student displays disturbed behaviour to a point where special support in a withdrawal group or special class/unit is required;
AND
B Student displays behaviour so deviant and with such frequency and severity that they require regular psychological or psychiatric treatment;
AND
C The severe behaviour cannot be accounted for by: Intellectual Disability, Sensory (vision, hearing), Physical and/or Health issues, Autism Spectrum Disorder or Severe Language Disorder;
AND
D A history and evidence of an ongoing problem with an expectation of continuation during the school years.
5. Intellectual disability
A Sub-average general intellectual functioning which is demonstrated by a full-scale score of two standard deviations or more below the mean score on a standardised individual test of general intelligence;
AND
B Significant deficits in adaptive behaviour established by a composite score of two standard deviations or more below the mean on an approved standardised test of adaptive behaviour;
AND
C A history and evidence of an ongoing problem with an expectation of continuation during the school years.
6. Autism Spectrum Disorder
A A diagnosis of Autism Spectrum Disorder;
AND
B Significant deficits in adaptive behaviour established by a composite score of two standard deviations or more below the mean on an approved standardised test of adaptive behaviours;
AND
C Significant deficits in language skills established by a comprehensive speech pathology assessment demonstrating language skills equivalent to a composite score of two standard deviations or more below the mean.

33
7. Severe language disorder with critical educational needs
A A score of three or more standard deviations below the mean for the student’s age in expressive and/or receptive language skills on TWO of the recommended tests
AND
B The severity of the disorder cannot be accounted for by hearing impairment, social emotional factors, low intellectual functioning or cultural factors;
AND
C A history and evidence of an on-going problem with the expectation of continuation during school years;
AND
D A non-verbal score not lower than one standard deviation below the mean on one comprehensive intellectual test, with a statistically significant (p‹0.05) difference between verbal (VCI) and non-verbal (VSI/PRI) functioning (VCI‹VSI/PRI);
AND
E Demonstrated critical educational needs equating to Program for Students with Disabilities funding levels three and above as determined by the validated results of the Educational Needs Questionnaire.
Source: Victorian Department of Education and Training (2016). Program for students with disabilities — operational guidelines for schools 2017. www.education.vic.gov.au/Documents/about/programs/needs/psdguidelines.docx (accessed May 2016).
Table A2. School Prep disability funding rate by disability counta PSD funding rate among students with disability
Number of 2012 Prep students in a school that are identified in AEDC as having a disability
1-5 students 6-10 students 11-15 students 16-20 students More than 20
0% 357 131 48 12 11 1-25% 60 112 76 45 22 26-50% 66 37 15 3 4 51-75% 2 0 1 0 0 More than 75% 35 1 0 0 0 Total 520 281 140 60 37
aThere are 114 schools out of 1,152 without any Preps with disability.

34
Figure A1. Estimated chances of individual receipt of targeted PSD receipt in 2012-15 associated with the school Prep cohort rate of receipt amongst Victorian public school Preps with an AEDC disability
Note: include both those who have a learning impairment, regardless of whether they have any other condition. No estimate is available for the chance of PSD receipt for those with learning impairments in schools where three-quarters of more of children are funded because no cases are observed in the data.
0%
10%
20%
30%
40%
50%
60%
70%
None 1-25% 26-50% 51-75% More than 75%
Other conditions Learning impairments
Avearage, other conditions (3%)
Proportion of Prep cohort with disability that is funded
Avearage learning impairments (42%)
Proportion of Prep cohort with disability that is funded

35
Figure A2. Estimated Year 3 NAPLAN participation rate and attainment rate of national minimum standards associated with the receipt of PSD funding among Victorian public school children with AEDC identified disability in Prep, propensity score matching
Note: the bars for PSD 2012-15 and No PSD 2012-15 represent the estimated average NAPLAN participation rate and national standard attainment rate associated with the receipt of PSD and no receipt of PSD respectively, controlling for differences in student capacity and impairments, attended school traits and traits related to student socio-economic background between the two groups. *Not statistically different from zero.
36%
92%
76%
90%
-39ppt
2ppt*
-60%
-40%
-20%
0%
20%
40%
60%
80%
100%
Participated in NAPLAN Attained minimu score, given NAPLANparticipation
PSD 2012-15 No PSD 2012-15 Difference

36
References
Acemoglu, D. and Angrist, J. (2001) Consequences of employment protection? The case of
the Americans with Disabilities Act, Journal of Political Economy, vol. 19(5), p. 915-50.
Australian Department of Education and Training (2016). Australian Early Development
Census (AEDC) Data Guidelines, https://www.aedc.gov.au/resources/detail/aedc-data-
guidelinesv2.2 (accessed May 2016).
Australian Bureau of Statistics (ABS) 2012. Disability, Ageing and Carers Australia:
Summary of Findings 2012, cat. no. 4430.0, ABS, Canberra.
Bell, D. and Heitmueller, A. (2005) The Disability Discrimination Act in the UK: helping or
hindering employment amongst the disabled? Institute for the Study of Labor (IZA)
Discussion Paper No. 1476, IZA, Bonn.
Blundell, R. and Costa Dias, M. (2009). Alternative approaches to evaluation in empirical
microeconomics. Journal of Human Resources 44(3): 565-640.
Caldwell, BJ & Spinks, JM 2008, Raising the stakes: From improvement to transformation in
the reform of schools, Routledge, London & New York.
Chiu, MM & Khoo, L 2005, ‘Effects of resources, inequality and privilege bias on
achievement: Country, school and student level analyses’, American Educational Research
Journal, vol. 42(4), winter, pp. 575–603.
DeLeire, T. (2000) The wage and employment effects of the Americans with Disabilities Act,
Journal of Human Resources, vol. 35(4), p. 693-715.
Department of Education and Workplace Relations (DEEWR) 2011. Review of Funding for
Schooling Final Report, DEEWR, Canberra.
Eldevik, S., Hastings, R., Hughes, J., Jahr, E., Eikeseth, S., & Cross, S. 2009. Meta-analysis
of early intensive behavioral intervention for children with autism. Journal of Clinical Child
& Adolescent Psychology, 38(3): 439-450.
Gonski, David, Ken Boston, Kathryn Greiner, Carmen Lawrence, Bill Scales and Peter
Tannock (2011) Review of Funding for Schooling: Final Report, Department of Education,
Employment and Workplace Relations, Commonwealth Government (ISBN 978-0-642-
78223-6 [PDF]), p103-146
37
Heckman, J. 2006. Skill formation and the economics of investing in disadvantaged
children, Science 312(5782): 1900-1902.
Hotchkiss, J. (2004) A closer look at the employment impact of the Americans with
Disabilities Act, Journal of Human Resources, vol. 39(4), p. 887-911.
National People with Disabilities and Carer Council (NPDCC) 2009. SHUT OUT: The
Experience of People with Disabilities and their Families in Australia National Disability
Organisation for Economic Co-operation and Development (2011), Overcoming school
failure: Policies that work, comparative draft report, OECD, Paris.
Polidano, C. and Mavromaras, K. 2010. The role of vocational education and training in the
labour market outcomes of people with disabilities, National Centre for Vocational Education
Research (NCVER), Adelaide.
Reichow, B. 2012. Overview of meta-analyses on early intensive behavioral intervention for
young children with autism spectrum disorders. Journal of autism and developmental
disorders, 42(4): 512-520.
Schumacher, E. and Baldwin, M. (2000), The Americans with Disabilities Act and the labor
market experience of workers with disabilities: evidence from the SIPP, JCPR Working
Paper 178, Northwestern University/University of Chicago Joint Centre for Poverty
Research.
Strategy Consultation Report. Department of Families, Housing, Community Services and
Indigenous Affairs, Canberra.
Swanson Lee, H. & Hoskyn, M. 1998. Experimental intervention research on students with
learning disabilities: A meta-analysis of treatment outcomes. Review of Educational
Research 68(3): 277-321.
Victorian Department of Education and Training (VDET) (2016a). Review of the Program
for Students with Disabilities, VDET, Melbourne.
VDET (2016b). Program for students with disabilities — operational guidelines for schools
2017.www.education.vic.gov.au/Documents/about/programs/needs/psdguidelines.docx
(accessed May 2016).
Victorian Equal Opportunity and Human Rights Commission (VEOHRC) 2012. Held back:
The experiences of students with disabilities in Victorian schools, VEOHRC, Melbourne.

38
Wellbeing Health and Engagement Division, Department of Education and Training (2017)
Program for Students with Disabilities – operational guidelines for schools, Melbourne,
Victoria