Early Outcomes Study Report
60
Early Outcomes Study Report Evaluation of the TechHire and Strengthening Working Families Initiative Grant Programs Submitted to: U.S. Department of Labor, ASP/CEO 200 Constitution Avenue, NW Washington, DC 20210 Submitted by: Westat An Employee-Owned Research Corporation ® 1600 Research Boulevard Rockville, Maryland 20850 In Partnership with: MDRC 200 Vesey Street 23rd Floor New York, NY 10281 Contract #: DOL-OPS-16-U-00136 September 2021
Transcript of Early Outcomes Study Report

Early Outcomes Study ReportEvaluation of the TechHire and Strengthening Working Families Initiative Grant Programs
Submitted to:U.S. Department of Labor, ASP/CEO200 Constitution Avenue, NWWashington, DC 20210
Submitted by:WestatAn Employee-Owned Research Corporation®
1600 Research BoulevardRockville, Maryland 20850
In Partnership with:MDRC200 Vesey Street23rd FloorNew York, NY 10281
Contract #: DOL-OPS-16-U-00136September 2021
Evaluation of the TechHire and Strengthening Working Families Initiative Grant Programs
Early Outcomes Study Report
September 2021
Joseph Gasper and Kevin Baier
Submitted to: U.S. Department of Labor, ASP/CEO 200 Constitution Avenue, NW Washington, DC 20210
Contract Number: DOL-OPS-16-U-00136
Project Director: Joseph Gasper 1600 Research Boulevard Rockville, Maryland 20850
Disclaimer This report was prepared for the U.S. Department of Labor (DOL), Chief Evaluation Office (CEO) by Westat, under contract number DOL-OPS-16-U-00136. The views expressed are those of the authors and should not be attributed to DOL, nor does mention of trade names, commercial products, or organizations imply endorsement of same by the U.S. Government

Table of Contents
Acknowledgements vi
Executive Summary vii
Research Questions viii Key Findings viii Summary xi
Chapter 1. Introduction 1-1
1.1 Research Questions 1-2 1.2 Data Sources 1-2 1.3 Limitations 1-3
Chapter 2. Participant Characteristics 2-1
Chapter 3. Training Participation 3-1
3.1 Overview of Training Participation 3-1 3.2 Training Enrollment 3-2 3.3 Training Completion 3-4 3.4 Credential Receipt 3-5 3.5 Relationship between Training Completion and Credential Receipt and
Occupation 3-5 3.6 Relationship between Training Completion and Credential Receipt and
Participant Characteristics 3-6
Chapter 4. Employment 4-1
4.1 Employment Outcomes for Participants Not Employed at Entry 4-1 4.2 Employment Outcomes for Incumbent Workers 4-2 4.3 Relationship between Employment and Training Occupation 4-3 4.4 Relationship between Employment and Participant Characteristics 4-4
Chapter 5. Supportive Services Received 5-1
Early Outcomes iii

Table of Contents (continued)
Chapter 6. Program Strategies and Participant Outcomes 6-1
6.1 Variation Across Grantees 6-1 6.2 Training Completion and Credential Receipt 6-2 6.3 Employment and Training-Related Employment 6-4
Chapter 7. Conclusions 7-1
7.1 Key Findings 7-1 7.2 Comparison of Outcomes to Other Programs 7-2 7.3 Looking Forward 7-5
References R-1
Appendixes
A PIRL Data A-1 B Additional Exhibits B-1 C Sensitivity Analysis C-1 D Technical Appendix on Regression Analysis D-1
Exhibits
1 Summary of training participation vii 2 Employment and training-related employment among training
completers viii 2-1 Demographic characteristics of participants 2-3 3-1 Summary of training participation 3-2 3-2 Occupation of training 3-3 3-3 Length of training 3-4 3-4 Training completion and credential receipt, by training
occupation 3-6 3-5 Training enrollment, training completion, and credential receipt
by participant characteristics 3-8 4-1 Employment and training-related employment among training
completers not employed at entry 4-1 4-2 Participants by length of time between training completion and
employment among training completers not employed at entry 4-2
Early Outcomes iv

Table of Contents (continued)
Exhibits
4-3 Employment by training occupation 4-3 4-4 Relationship between participant characteristics and employment
among training completers 4-5 5-1 Participants’ receipt of supportive services, by low-income status 5-2 6-1 Variation in outcomes across grantees 6-2 6-2 Change in regression-adjusted mean training completion and
credential attainment associated with grantees’ use of program strategies 6-3
6-3 Change in regression-adjusted mean employment and training-related employment associated with grantees’ use of program strategies 6-5
7-1 Summary of training participation in other sector programs 7-4
Early Outcomes v

Acknowledgements
The authors gratefully acknowledge the efforts of the many individuals who contributed to this report. We would not have been able to complete this report without the ongoing support of Chief Evaluation Office (CEO) staff, including Jennifer Daley, Deborah Martierrez, and Christina Yancey. We are also grateful to the members of our technical working group—Gina Adams, David Berman, Mindy Feldbaum, Kevin Hollenbeck, and Jeffrey Smith—for their feedback throughout the project. At Westat, Joseph Gasper served as Project Director. At MDRC, Rick Hendra served as Principal Investigator. Many individuals at Westat contributed to this report. Yong Lee provided SAS programming support for the analysis. Donna Bennett coordinated editing and production of the report. Frank Bennici provided many helpful comments on an earlier draft of this report. Our research partners at MDRC were also essential to the completion of this report. Barbara Goldman, Betsy Tessler, and Kelsey Schaberg reviewed a draft of the report and provided many helpful comments.
Early Outcomes vi

Executive Summary
The TechHire and Strengthening Working Families Initiative (SWFI) grant programs are designed to provide a range of training and supportive services that address the unique and varied challenges facing individuals who face barriers to employment while providing the skills to develop careers in H-1B industries.1 The TechHire program provides accelerated skills training, whereas the SWFI initiative provides flexible training and childcare supports to help adults obtain high-tech skills. The common element of these programs is an effort to help make training more accessible and an effort to connect disadvantaged populations to high-growth sectors of the labor market.
This report describes the characteristics of participants, participation in services, training enrollment, training completion, credential receipt, and employment. It also examines how outcomes vary by participant characteristics. The data come from the Participant Individual Record Layout (PIRL).2 Because outcomes such as training completion and employment can take some time to realize, this report focuses on participants who enrolled in the programs at least 18 months prior to the end of the grant period in June 2020. This includes 11,584 TechHire and 3,101 SWFI participants who enrolled between July 2016 and December 2018. Outcomes are assessed through June 2020. This report does not address the question of whether the outcomes would have occurred in the absence of the program. This question will be addressed in a separate report on the impact study.
Overview of the Evaluation In 2016, the Chief Evaluation Office (CEO) of the U.S. Department of Labor (DOL) contracted with Westat and MDRC to conduct an evaluation of strategies used in the TechHire and SWFI grant programs. The evaluation includes implementation, outcomes, and impact studies. The impact study involves a randomized controlled trial (RCT) with five grantees to estimate the effects of their programs on outcomes such as skill attainment, employment, and earnings. The implementation study examines how all 53 TechHire and SWFI grantees implemented their programs, successes, challenges, and lessons learned. This report examines the short-term outcomes of participants. Beyond this report, the evaluation will also produce: • A report on implementation across all
grantees • A report on employment and earnings
outcomes at 24 months after program entry for all grantees
• A report on impacts on training enrollment at 6 months after random assignment and implementation in the RCT grantees
• A report on impacts on training completion, employment, and earnings at 18 to 24 months after random assignment in the RCT grantees
1 For more information about the grant programs, see the Funding Opportunity Announcements at
https://www.dol.gov/sites/dolgov/files/ETA/grants/pdfs/FOA-ETA-16-01.pdf and https://www.dol.gov/sites/dolgov/files/ETA/grants/pdfs/FOA-ETA-16-05.pdf.
2 For more information about the PIRL and DOL performance reporting, see https://www.dol.gov/agencies/eta/performance/reporting.
Early Outcomes vii
Research Questions The outcomes study addresses the following research questions:
1. What are the characteristics of participants?
2. At what rates do participants engage in and complete training and receive credentials?
3. What are participants’ employment outcomes?
4. How do outcomes differ by participant characteristics?
5. What percentage of participants receive supportive services? How do supportive service participation patterns differ by participant characteristics?
6. How do outcomes differ by program strategies?
Key Findings TechHire grantees were required to serve one of two types of populations with barriers to training and employment: (1) youth and young adults between the ages of 17 and 29, or (2) special populations including individuals with disabilities, individuals with limited English proficiency, or individuals with criminal records. SWFI grantees were required to serve low- and middle-skilled parents with job training needs and training barriers including childcare barriers. All participants must be out of secondary school.
• TechHire participants tended to be male, younger than age 30, and White. SWFI participants were typically female, ages 30 and older, Black or Hispanic, and low income.3
The majority of TechHire participants were male (65%) and ages 17 to 29 (73%). Forty-one percent of TechHire participants were White, 32 percent were Black, and 18 percent were Hispanic. SWFI participants were predominantly female (86%) and age 30 and older (55%). Fifty-four percent of SWFI participants were Black, 23 percent were Hispanic, and 18 percent were White. Most (86%) were low income. This is not surprising given the SWFI grantees were required to have participants who were qualified or prequalified for programs such as Temporary Assistance for Needy Families (TANF), Supplemental Nutrition Assistance Program (SNAP), Head Start, and childcare development block grants.
3 According to the PIRL, low income is defined as participants who (a) receive or in the 6 months prior to application to
the program have received, or is a member of a family that is receiving or in the past 6 months prior to application to the program has received assistance through SNAP, TANF, Supplemental Security Income (SSI), or state or local income-based public assistance; (b) are in a family with total family income that does not exceed the higher of the poverty line or 70 percent of the lower living standard income level; (c) youths who receive or are eligible to receive free or reduced price school lunches; (d) are foster children on behalf of whom state or local Government payments are made; (e) are participants with a disability whose own income is the poverty line but who is a member of a family whose income does not meet this requirement; and (f) are homeless participants or homeless children or youth or runaway youth, or are youths living in a high-poverty area.
Early Outcomes viii
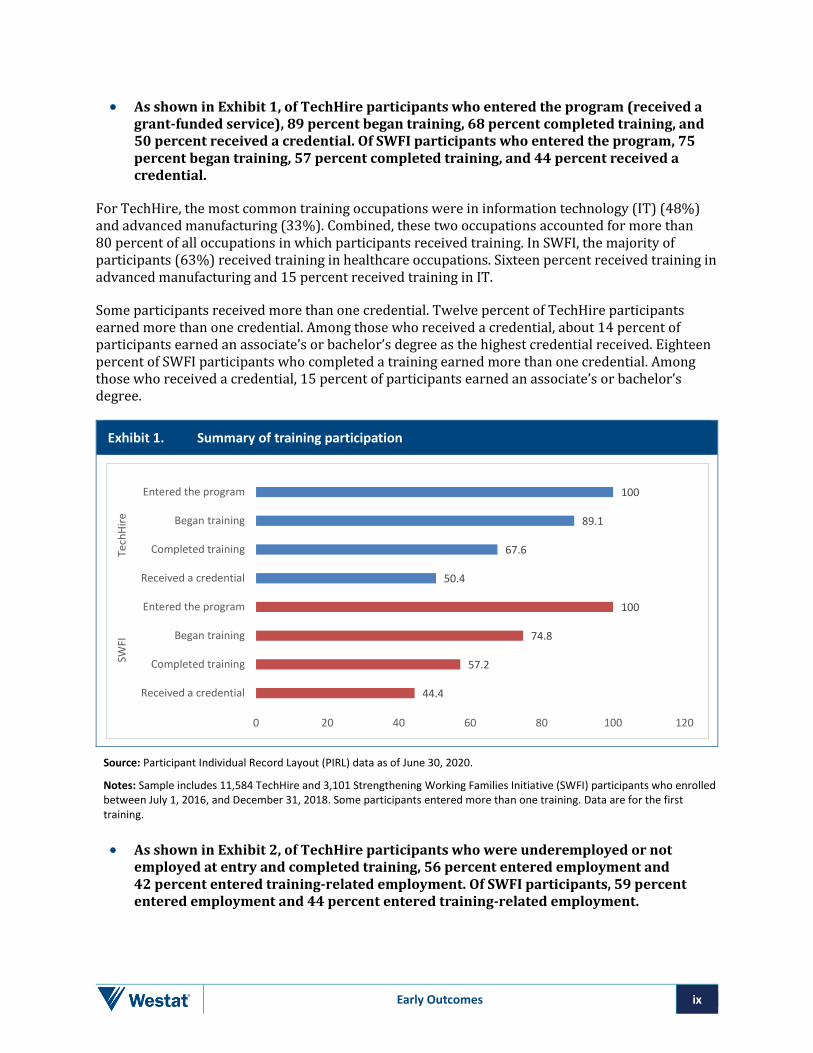
• As shown in Exhibit 1, of TechHire participants who entered the program (received a grant-funded service), 89 percent began training, 68 percent completed training, and 50 percent received a credential. Of SWFI participants who entered the program, 75 percent began training, 57 percent completed training, and 44 percent received a credential.
For TechHire, the most common training occupations were in information technology (IT) (48%) and advanced manufacturing (33%). Combined, these two occupations accounted for more than 80 percent of all occupations in which participants received training. In SWFI, the majority of participants (63%) received training in healthcare occupations. Sixteen percent received training in advanced manufacturing and 15 percent received training in IT.
Some participants received more than one credential. Twelve percent of TechHire participants earned more than one credential. Among those who received a credential, about 14 percent of participants earned an associate’s or bachelor’s degree as the highest credential received. Eighteen percent of SWFI participants who completed a training earned more than one credential. Among those who received a credential, 15 percent of participants earned an associate’s or bachelor’s degree.
Exhibit 1. Summary of training participation
100
89.1
67.6
50.4
100
74.8
57.2
44.4
0 20 40 60 80 100 120
Entered the program
Began training
Completed training
Received a credential
Entered the program
Began training
Completed training
Received a credential
Tech
Hire
SWFI
Source: Participant Individual Record Layout (PIRL) data as of June 30, 2020.
Notes: Sample includes 11,584 TechHire and 3,101 Strengthening Working Families Initiative (SWFI) participants who enrolled between July 1, 2016, and December 31, 2018. Some participants entered more than one training. Data are for the first training.
• As shown in Exhibit 2, of TechHire participants who were underemployed or not employed at entry and completed training, 56 percent entered employment and 42 percent entered training-related employment. Of SWFI participants, 59 percent entered employment and 44 percent entered training-related employment.
Early Outcomes ix

Employment in well-paying, middle- to high-skilled H1-B industries and occupations is the primary goal of the grant programs. Employment and training-related employment were higher among participants who entered training for healthcare or advanced manufacturing occupations than among those who entered training for IT occupations. However, it is possible that participants who received IT credentials may have used them in fields other than IT and, if not recorded in the data, the rate of employment among this group could be underestimated.
Exhibit 2. Employment and training-related employment among training completers
Source: Participant Individual Record Layout (PIRL) data as of June 30, 2020.
Note: Sample includes 6,007 TechHire and 1,623 SWFI participants who enrolled between July 1, 2016, and December 31, 2018, and who were unemployed or underemployed at enrollment and completed training. The denominator for percentages is the number of participants who completed training.
• In both programs, supportive service receipt was higher among females than males and among participants with low incomes than those without low incomes.
Twenty-eight percent of TechHire participants and 78 percent of SWFI participants received supportive services. The higher percentage receiving these services among SWFI is consistent with the focus on providing childcare assistance among SWFI grantees. In both programs, receipt of supportive services was higher among participants who had low incomes, limited English proficiency, criminal records, and were females. These findings suggest that staff targeted supportive services in a manner consistent with program goals.
• In both programs, several participant characteristics were correlated with starting training, completing training, and receiving credentials.
While the goal of the TechHire and SWFI programs was to increase access to and completion of training in in-demand occupations, not all participants achieved these goals. Training enrollment, training completion, and credential receipt were lower for participants with lower levels of education and low incomes.
Early Outcomes x

• Several program strategies were correlated with training and employment outcomes.
Program strategies positively correlated with training completion and/or credential receipt included assessment for soft skills, use of multiple entry/exit points, and employer involvement in work-based learning. Program strategies negatively correlated with training completion and/or credential receipt included use of online training, use of accelerated training, and provision of child care assistance. Program strategies positively correlated with employment and/or training-related employment included employer involvement in curriculum development, assessment of social skills, use of multiple entry/exit points, and referral to child care assistance. Use of accelerated training was negatively correlated with employment and training-related employment.
Summary While the percentage of TechHire participants that started and completed training were similar to those of participants in other sector programs, the percentage of SWFI participants that started and completed training were somewhat lower. These include Per Scholas IT training, Year Up, Project QUEST, and the Health Profession Opportunity Grants (HPOG) programs.4 The largest drop-off point in both programs was between starting training and completing training. The lower percentages of SWFI participants that started and completed training may be due to the unique childcare needs of the target population.
Despite the focus of the programs on individuals with barriers to employment, 17 percent of TechHire participants had a bachelor’s degree. In both programs, higher levels of education were positively correlated with starting training, completing training, and receiving credentials. Three of four grantees offered basic skills instruction to participants, either directly or by referral. This suggests that participants with lower levels of education may need bridge programs to increase skills necessary to transition to training.
While supportive services were appropriately targeted, the receipt of supportive services by TechHire participants was also lower than in the other sector programs above, in which about 50 percent or more of participants received supportive services. In addition, participants with low incomes had lower rates of starting training, completing training, receiving credentials. To increase training enrollment and completion, programs may wish to increase the supportive services available to participants, especially those with low incomes.
Future reports will expand on the findings in this report. One report will use administrative employment and earnings data from the National Directory of New Hires (NDNH) to provide longer term data on employment and earnings of participants and to examine changes before and after program entry. These analyses will allow us to examine whether the interim outcomes translate into increased earnings and continued employment and advancement in H-1B occupations. Additional reports will document findings from the impact study on whether the programs in the five RCT grantees increased training completion, employment, and earnings.
4 We compared the percentage of participants who began training, completed training, and received credentials to four
other programs that have been shown to have impacts on employment and earnings in recent evaluations. These comparisons are discussed in detail in Chapter 6 of this report.
Early Outcomes xi

1. Introduction
The H-1B visa program, established in 1990 by Congress, allows employers to hire foreigners to work in “specialty occupations,” such as science, technology, engineering, and mathematics (STEM) fields, healthcare, business, financial services, and life sciences industries, on a temporary basis. In 1998, a user fee was added to fund scholarship and training programs that develop the skills of the existing U.S. workforce in high-demand fields that employ large numbers of H-1B workers. Those fees have funded over $1 billion of U.S. Department of Labor (DOL)-managed technical skills training programs designed to reduce or replace the need for foreign-skilled labor. Two programs funded through this authority in 2016 are the TechHire and the Strengthening Working Families Initiative (SWFI) grants. In September 2016, the Employment and Training Administration (ETA) competitively awarded 39 TechHire grants and 14 SWFI grants.
Program Goals
TechHire • Provide training to youth and young adults as well
as individuals with disabilities, limited English proficiency, and criminal records in in-demand H1-B industries
• Improve training completion and employment through accelerated training and supportive services
• Connect those who have received training or who already have the skills required for employment to employment, paid internships, or Registered Apprenticeship
• Design programs and services to reflect the needs of employers and participants
• Ensure broader change and sustainability and a strategy for adapting to changing market needs after the grant
Strengthening Working Families Initiative (SWFI) • Provide low- to middle-skilled parents
opportunities to advance in in-demand H1-B industries
• Address barriers to accessing training and employment faced by those with childcare responsibilities through activities such as colocation of training and childcare or unconventional training delivery times or locations
• Help parents navigate complex systems by strengthening partnerships between workforce training providers and childcare providers
Source: TechHire and SWFI Funding Opportunity Announcements, 2015.
The TechHire and SWFI programs are designed to provide a range of training and supportive services that address both the unique and varied challenges facing individuals who face barriers to employment as well as the skills deficits in H-1B industries. The TechHire program provides accelerated skills training, whereas the SWFI initiative provides flexible training and childcare supports to help adults obtain high-tech skills. The common element of these programs is an effort to help make training more accessible and an effort to connect disadvantaged populations to high-growth sectors of the labor market.
DOL’s Chief Evaluation Office (CEO) contracted with Westat and MDRC to conduct the Evaluation of Strategies Used in the TechHire and Strengthening Working Families Initiative Grant Programs. The evaluation includes three major analytic components: implementation, outcomes, and impact. The implementation study includes an in-depth examination of grantee program design and implementation. The impact study includes a randomized controlled trial (RCT) with five grantees
Early Outcomes 1-1

(3 TechHire and 2 SWFI). This report presents early findings from the outcomes study and describes the characteristics of participants, participation in training, receipt of services, and outcomes—in particular, completion of training, credential receipt, employment, and employment in a training-related job. It also examines whether outcomes vary by participant characteristics.
1.1 Research Questions The outcomes study addresses the following research questions:
1. What are the characteristics of participants?
2. At what rates do participants engage in and complete training and receive credentials?
3. What are participants’ employment outcomes?
4. How do outcomes differ by participant characteristics?
5. What percentage of participants receive supportive services? How do supportive service participation patterns differ by participant characteristics?
6. How do outcomes differ by program strategies?
Findings for the first research question will provide information on whether the target populations are being served by the programs. Findings for the second and third research questions will provide an overall description of any positive outcomes occurring in the program. It is important to note that this report does not include a control group and therefore cannot attribute these outcomes to the program. The impact component of the evaluation includes control groups and will provide information about the impacts of the programs on outcomes for a subset of grantees. Findings for the fourth research question will provide information about which participants benefit most from the programs as well as those that may require more supports to be successful. The results can help programs design strategies to increase training enrollment, training completion, and credential receipt. Findings for the fifth research question will provide information on the receipt of supportive services and if supportive services are targeted in a manner consistent with program goals. Finally, findings for the sixth research question will provide information on how outcomes vary by program strategies. Although these analyses are not causal, they can still be informative. As explained below, they can provide information about which program strategies should be examined more closely in future research.
1.2 Data Sources H1-B grantees are required to report information on all participants served with grant funds on a quarterly basis through the H1-B Participant Individual Record Layout (PIRL). 5 These data are aggregated to produce a Quarterly Performance Report (QPR) for each grantee. This report uses an extract from July 1, 2016 through June 30, 2020, that includes 36 TechHire and 12 SWFI grantees.6 A summary of the data elements in the PIRL is in Appendix A. Two different samples of program
5 Grantees began submitting data for the quarter ending in December 2017. 6 Three TechHire and two SWFI grantees ended their grant programs and are excluded from this report.
Early Outcomes 1-2

participants are used in this report. Chapter 2, which focuses on the characteristics of participants, uses all participants who enrolled from the beginning of the programs on July 1, 2016 to the end of the programs on June 30, 2020 (19,937 TechHire and 5,433 SWFI participants).7 To provide a more complete picture of the outcomes of participants, most of the report uses a narrower sample of participants for whom at least 18 months has elapsed since enrollment. This sample includes participants who enrolled from July 1, 2016, to December 31, 2018 (11,584 TechHire and 3,101 SWFI participants). This allows for 18 months of post-enrollment follow-up.
1.3 Limitations The results in this report should be interpreted in light of the following limitations:
• Outcomes do not provide information about program impacts. The purpose of this report is to document the outcomes achieved by participants. It is not possible to determine whether these outcomes would have occurred in the absence of the programs because the report does not include a control group. The results of the impact study, which includes five grantees, will be the subject of future reports.
• Data elements have missing data on training completion. We treat missing data on training completion as not having completed training because it is impossible to distinguish missing data from not having completed training.8
• Employment is reported by program staff. One limitation of these data is that employment may be underestimated if participants did not report a job to program staff or found a job on their own. A future report will use administrative employment and earnings data from the National Directory of New Hires (NDNH) to allow for a more accurate and complete analysis of employment and earnings over a longer period than is possible with PIRL data. In addition, the future report will include participants who enrolled through the end of the grant period in June 2020 to increase the sample size.
• Data on supportive service receipt is limited. The data do not indicate the specific types of supportive services received or the intensity. For example, if a participant received supportive services, it is impossible to know whether they received transportation, childcare, or housing services.
7 The grants covered a 4-year period of performance from July 2016 to June 2020 but many grantees received up to a
12-month no-cost extension. Specifically, 29 TechHire and 11 SWFI grantees received no-cost extensions. Although these grantees will continue to submit participant data, these data are not included in this report due to insufficient time to conduct the analysis.
8 It seems unlikely that participants who are missing data on training completion status completed training because grantees are required to report the number of participants who completed training to DOL each quarter and have an incentive to capture all training completers.
Early Outcomes 1-3

2. Participant Characteristics
TechHire grantees were required to serve one of two types of populations with barriers to training and employment: out-of-secondary-school youth and young adults between the ages of 17 and 29, or special populations including individuals with disabilities, individuals with limited English proficiency, or individuals with criminal records.9 Strengthening Working Families Initiative (SWFI) grantees were required to serve low- and middle-skilled parents with job training needs and training barriers, including the need for childcare and other supportive services. Grantees in both programs could also serve up to 25 percent of their participants as incumbent workers in need of upskilling. Beyond these requirements, grantees had considerable flexibility in how they defined barriers to training and employment. This section examines the extent to which grantees met the targets for the number of individuals served that they established in their grant applications, the characteristics of participants served under the grants, and how the participants served compare to the target populations.
By July 2020, TechHire grantees had cumulatively enrolled 19,937 participants, and SWFI grantees had enrolled 5,433 participants.10 The demographic profiles of TechHire and SWFI participants follow from the differences in the target populations served by the two programs.11 As shown in Exhibit 2-1, TechHire participants were predominantly male (65%), whereas SWFI participants tended to be female (86%). As expected, the majority of TechHire participants (73%) were youth ages 17 to 29, whereas the majority of SWFI participants (55%) were ages 30 and older. Forty-one percent of TechHire participants were White, compared to only 18 percent of SWFI participants. Greater proportions of SWFI participants were Black (54%) and Hispanic (23%) than TechHire participants (32% and 18%, respectively).
Key Findings TechHire participants tended to be male, younger than age 30, and white. In contrast, SWFI participants tended to be female, age 30 or older, African American or Hispanic, and low income. Many participants in both programs worked while in training.
9 Grantees that chose youth and young adults as the target population were required to have 75 percent of participants be
youth and young adults and the other 25 percent of participants be individuals with barriers to employment, including underemployed, dislocated, and incumbent workers. Grantees that chose special populations as the target population were required to have 50 percent of participants be special populations and 50 percent of participants be underemployed, dislocated, and incumbent workers.
10 The U.S. Department of Labor (DOL) required grantees to set goals for outcome measures and report progress toward each goal on a quarterly basis. These goals were set by grantees in their grant applications but could subsequently be modified by approval from DOL. One of the outcome measures captured progress toward the number of participants served. By the end of the fourth year of the grant in June 2020, many grantees had not met their targets for the number of individuals served. Overall, 23 TechHire grantees and 3 SWFI grantees met their targets for the number of individuals served. Another three TechHire grantees and two SWFI grantees came within 90 to 99 percent of their targets. However, because DOL gave no-cost extensions to grantees, some grantees may meet their targets for the number of individuals served in the future.
11 Unfortunately, the Participant Individual Record Layout (PIRL) does not collect information on whether SWFI participants were parents or details on the ages of the children.
Early Outcomes 2-1

TechHire participants had higher levels of education than SWFI participants. While the modal education level for TechHire was a high school diploma or equivalent (51%), 17 percent of participants had a bachelor’s degree or higher. The prevalence of bachelor’s degrees among participants is higher than in other sectoral employment programs but consistent with TechHire’s focus on information technology (IT).12 Only 7 percent of TechHire participants had less than a high school diploma or equivalent. SWFI participants had somewhat lower levels of education. Eight percent of SWFI participants had a bachelor’s degree or higher.
SWFI served a higher percentage of low-income participants (86%) than TechHire (48%).13 This is not surprising given that the SWFI grantees were required to have participants who were qualified or prequalified for programs such as Temporary Assistance for Needy Families (TANF), Supplemental Nutrition Assistance Program (SNAP), Head Start, and childcare development block grants.
Many participants in both programs were employed at entry (46% of TechHire participants and 45% of SWFI participants), suggesting that participants continue to work while in training. SWFI had a higher percentage of workers who were underemployed at entry than TechHire (33% vs. 24%, respectively). 14 TechHire served a higher percentage of incumbent workers than SWFI (15% vs. 3%).15
12 Participants in sectoral employment programs that target IT are more likely to have 4-year college degrees than those
in programs that target other sectors. For example, in the WorkAdvance evaluation, 20 percent of participants in Per Scholas’s IT training program had a 4-year college degree or higher (Hendra et al., 2016). In contrast, 5 and 7 percent of participants in the Health Profession Opportunity Grants (Werner, Loprest, Schwartz, Koralek, & Sick, 2018) and Project QUEST (Roder & Elliott, 2019) evaluations, respectively, had 4-year degrees. Both of these programs target the healthcare industry. Consistent with this observation, TechHire participants who began training in IT were more likely to have bachelor’s degrees (27%) than those who began training in healthcare (15%) or advanced manufacturing (8%).
13 Low income is defined as participants who (a) receive or in the 6 months prior to application to the program have received, or is a member of a family that is receiving or in the past 6 months prior to application to the program has received assistance through SNAP, TANF, Supplemental Security Income (SSI), or state or local income-based public assistance; (b) are in a family with total family income that does not exceed the higher of the poverty line or 70 percent of the lower living standard income level; (c) youths who receive or are eligible to receive free or reduced price school lunches; (d) are foster children on behalf of whom state or local Government payments are made; (e) are participants with a disability whose own income is the poverty line but who is a member of a family whose income does not meet this requirement; and (f) are homeless participants or homeless children or youth or runaway youth, or are youths living in a high-poverty area.
14 Underemployed participants are those who were not employed full-time in a job commensurate with their level of education, skills, or wage and/or salary earned previously, or who have obtained only episodic, short-term, or part-time employment at the time of enrollment in the program.
15 H-1B grants have a unique definition of incumbent workers. Incumbent workers are individuals who are employed in lower skilled or entry level positions and in need of training to advance to middle- and high-skilled occupations. Grantees partner with the individuals’ current employers to provide training to incumbent workers. Some participants are employed at entry but not considered incumbent workers because they did not receive training provided in partnership with their current employer.
Early Outcomes 2-2

Exhibit 2-1. Demographic characteristics of participants
Characteristic TechHire Strengthening Working Families
Initiative (SWFI) Number Percentage Number Percentage
Gender Male 12,914 65.2 750 13.8 Female 6,884 34.8 4,675 86.2 Race and ethnicity White, non-Hispanic 7,585 41.1 950 18.0 Black, non-Hispanic 5,950 32.2 2,832 53.7 Hispanic, any race 3,312 17.9 1,217 23.1 Any other race, non-Hispanic 1,621 8.8 279 5.3 Age 17 to 29 14,474 72.6 2,457 45.2 30 and older 5,463 27.4 2,976 54.8 Education Less than high school 1,283 6.5 323 6.0 High school diploma or equivalent 10,130 51.0 3,260 60.0 Some college or technical 5,074 25.5 1,429 26.3 Bachelor’s degree or higher 3,384 17.0 419 7.7 Individual with a disability Yes 1,260 6.9 174 3.4 No 16,935 93.1 4,943 96.6 Individual with limited English proficiency Yes 1,507 7.9 385 7.3 No 17,472 92.1 4,873 92.7 Individual with a criminal record Yes 1,439 8.7 483 9.5 No 15,154 91.3 4,618 90.5 Eligible veteran or spouse Yes 873 4.4 133 2.5 No 19,029 95.6 5,299 97.6 Low income Yes 8,883 47.5 4,616 86.3 No 9,813 52.5 734 13.7 Employed at entry Yes 9,217 46.2 2,419 44.5 No 10,720 53.8 3,014 55.5 Underemployed Yes 4,496 24.1 1,766 33.4 No 14,125 75.9 3,525 66.6 Long-term unemployed Yes 2,828 14.2 980 18.0 No 17,109 85.8 4,453 82.0 Incumbent worker Yes 2,981 15.0 145 2.7 No 16,956 85.1 5,288 97.3 Dislocated worker Yes 742 4.4 106 2.2 No 16,024 95.6 4,691 97.8
Source: Participant Individual Record Layout (PIRL) data as of June 30, 2020.
Note: Sample includes all 19,937 TechHire and 5,433 SWFI participants who enrolled by June 30, 2020. Percentages are out of nonmissing data.
Early Outcomes 2-3
3. Training Participation
The primary goal of TechHire and Strengthening Working Families Initiative (SWFI) is to help participants access jobs in high-growth H1-B occupations. TechHire grantees accomplish this through tracks which emphasize direct placement into jobs, short-term, accelerated training, or long-term training along a career pathway. The programs also emphasize and encourage industry-recognized credentials. This section examines the extent to which TechHire and SWFI participants enroll in and complete training and receive credentials.
Program staff could record participation for up to three trainings, including enrollment, completion, and credential information. Among participants in both programs who entered training, more than 80 percent participated in only one training during the 18 months. For this reason, in this section, we focus on the first training in which participants enrolled.16
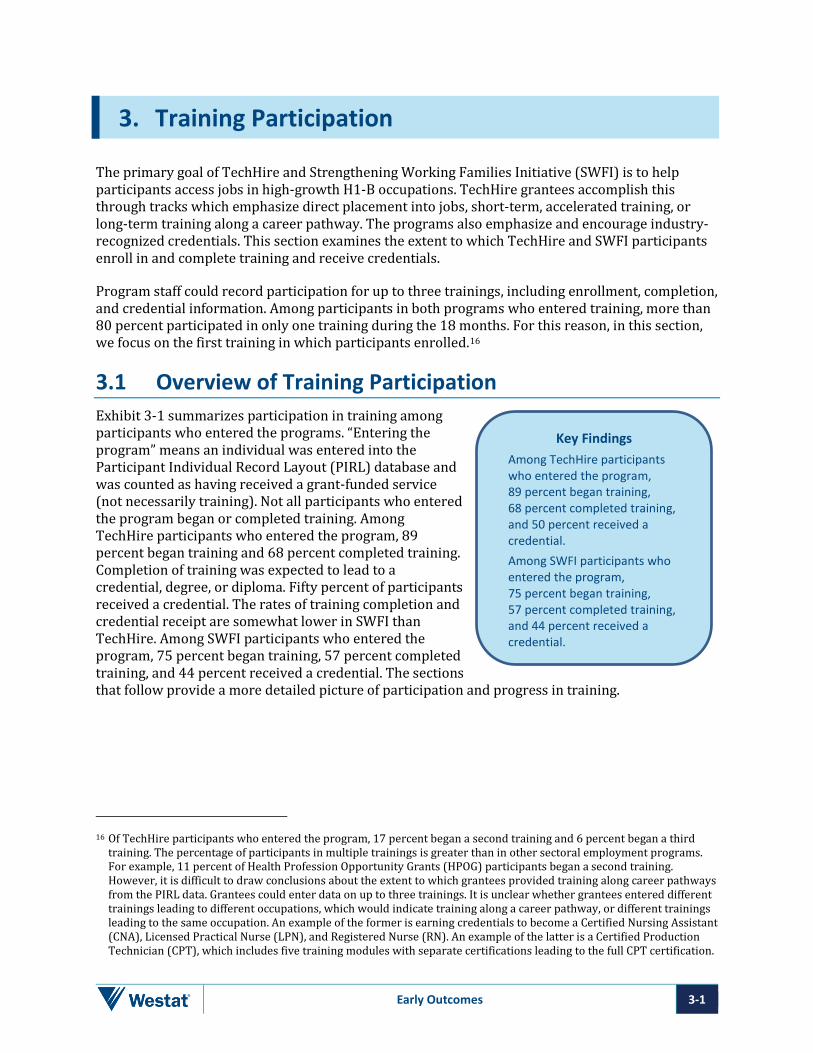
3.1 Overview of Training Participation Exhibit 3-1 summarizes participation in training among participants who entered the programs. “Entering the program” means an individual was entered into the Participant Individual Record Layout (PIRL) database and was counted as having received a grant-funded service (not necessarily training). Not all participants who entered the program began or completed training. Among TechHire participants who entered the program, 89 percent began training and 68 percent completed training. Completion of training was expected to lead to a credential, degree, or diploma. Fifty percent of participants received a credential. The rates of training completion and credential receipt are somewhat lower in SWFI than TechHire. Among SWFI participants who entered the program, 75 percent began training, 57 percent completed training, and 44 percent received a credential. The sections that follow provide a more detailed picture of participation and progress in training.
Key Findings Among TechHire participants who entered the program, 89 percent began training, 68 percent completed training, and 50 percent received a credential. Among SWFI participants who entered the program, 75 percent began training, 57 percent completed training, and 44 percent received a credential.
16 Of TechHire participants who entered the program, 17 percent began a second training and 6 percent began a third
training. The percentage of participants in multiple trainings is greater than in other sectoral employment programs. For example, 11 percent of Health Profession Opportunity Grants (HPOG) participants began a second training. However, it is difficult to draw conclusions about the extent to which grantees provided training along career pathways from the PIRL data. Grantees could enter data on up to three trainings. It is unclear whether grantees entered different trainings leading to different occupations, which would indicate training along a career pathway, or different trainings leading to the same occupation. An example of the former is earning credentials to become a Certified Nursing Assistant (CNA), Licensed Practical Nurse (LPN), and Registered Nurse (RN). An example of the latter is a Certified Production Technician (CPT), which includes five training modules with separate certifications leading to the full CPT certification.
Early Outcomes 3-1

Exhibit 3-1. Summary of training participation
TechHire Strengthening Working
Families Initiative (SWFI) Number Percentage Number Percentage
Participants who started training Yes 10,326 89.1 2,320 74.8 No 1,258 10.9 781 25.2 Participants who completed training Yes 7,830 67.6 1,775 57.2 No 3,754 32.4 1,326 42.8 Participants who received a credential Yes 5,834 50.4 1,376 44.4 No 5,750 49.6 1,725 55.6
Source: Participant Individual Record Layout (PIRL) data as of June 30, 2020.
Notes: Sample includes 11,584 TechHire and 3,101 SWFI participants who enrolled between July 1, 2016, and December 31, 2018. Data are for the first training.
3.2 Training Enrollment Enrolling students in job training as soon as possible is important to prevent attrition. Most participants entered training soon after they enrolled in the program. The vast majority (85%) of TechHire participants who enrolled in training began training within less than 1 month of entering the program, and another 7 percent began training within 2 months. However, the remaining 8 percent began training 2 months or later after enrollment. These longer times may reflect the fact that some grantees operated in cohorts or on a semester schedule and students need to wait to enroll in classes. Just over half (56%) of SWFI participants began training within less than 1 month of entering, and 18 percent began training within 2 months. Approximately 26 percent of SWFI participants began training 2 months or later after enrollment. The longer time to enter training in SWFI may reflect the fact the need to secure childcare for participants before training can begin.
Exhibit 3-2 shows that, among TechHire participants who began training, the most common training occupations for the first training were in information technology (IT) (48%) and advanced manufacturing (33%). Combined, these two occupations accounted for 81 percent of all occupations for which participants received training.17 Only 16 percent of participants received training in healthcare occupations and 4 percent in financial services or business occupations. In
Most Common Training Occupations Information technology: Computer User Support Specialists; Web Developers; Information Security Analysts; Computer Programmers; Computer Information Systems Managers Healthcare: Registered Nurses; Phlebotomists; Nursing Assistants; Medical Assistants; Licensed Practical and Licensed Vocational Nurses; Health Aides; Pharmacy Technicians Advanced manufacturing: Engineering Technologists and Technicians; Engineers; Electrical and Electronics Repairers; Welders; Electro-Mechanical and Mechatronics Technologists and Technicians; Industrial Machinery Mechanics Source: Participant Individual Record Layout (PIRL) data
17 Appendix A, Exhibit A-1 shows data for the top 20 training occupations.
Early Outcomes 3-2

SWFI, the majority of participants (63%) received training in healthcare occupations. Fewer participants received training in other occupational fields—16 percent in advanced manufacturing, 15 percent in IT, and 6 percent in financial services or business.18
Exhibit 3-2. Occupation of training
48.1
32.6
15.6
3.7
62.9
16.0
14.8
6.3
0.0 10.0 20.0 30.0 40.0 50.0 60.0 70.0
IT
Advanced Manufacturing
Healthcare
Financial Services
Healthcare
Advanced Manufacturing
IT
Financial Services
Tech
Hire
SWFI
Percent of Participants
Source: Participant Individual Record Layout (PIRL) data as of June 30, 2020.
Notes: Sample includes 10,326 TechHire and 2,320 Strengthening Working Families Initiative (SWFI) participants who began training by December 31, 2018. Occupation is based on Standard Occupational Coding (SOC) at the six-digit level. Some participants entered more than one training. Data are for the first training. Percentages include nonmissing data.
IT = information technology.
18 Occupations are based on the six-digit Standard Occupational Coding (SOC) codes. Occupations were categorized into
information technology, advanced manufacturing, healthcare, and financial services/business based on grantee statements of work.
Early Outcomes 3-3
3.3 Training Completion The primary goal of the grant programs is to support participants to complete training.19 Among TechHire participants who entered the program, 68 percent completed training. Among SWFI participants who entered the program, 57 percent completed training.20 Completed training refers to having completed the first training course, not necessarily having completed all of the training that was planned.
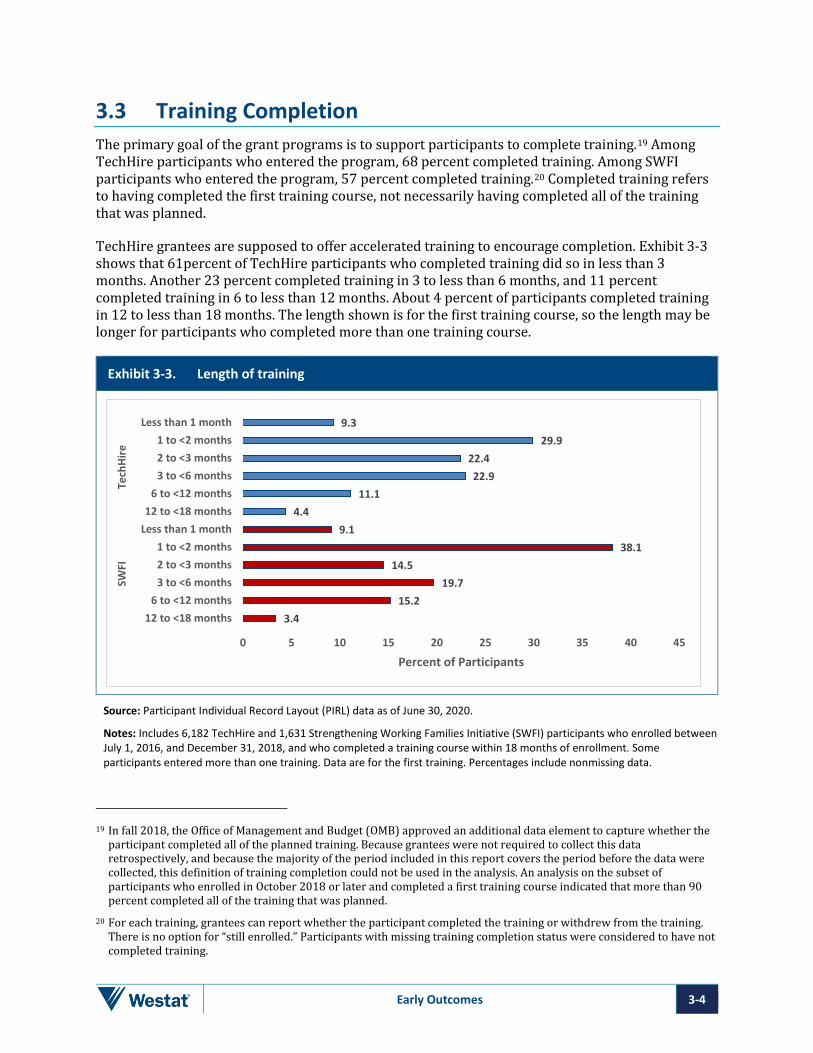
TechHire grantees are supposed to offer accelerated training to encourage completion. Exhibit 3-3 shows that 61percent of TechHire participants who completed training did so in less than 3 months. Another 23 percent completed training in 3 to less than 6 months, and 11 percent completed training in 6 to less than 12 months. About 4 percent of participants completed training in 12 to less than 18 months. The length shown is for the first training course, so the length may be longer for participants who completed more than one training course.
Exhibit 3-3. Length of training
9.329.9
22.422.9
11.14.4
9.138.1
14.519.7
15.23.4
0 5 10 15 20 25 30 35 40 45
Less than 1 month1 to <2 months2 to <3 months3 to <6 months
6 to <12 months12 to <18 months
Less than 1 month1 to <2 months2 to <3 months3 to <6 months
6 to <12 months12 to <18 months
Tech
Hire
SWFI
Percent of Participants
Source: Participant Individual Record Layout (PIRL) data as of June 30, 2020.
Notes: Includes 6,182 TechHire and 1,631 Strengthening Working Families Initiative (SWFI) participants who enrolled between July 1, 2016, and December 31, 2018, and who completed a training course within 18 months of enrollment. Some participants entered more than one training. Data are for the first training. Percentages include nonmissing data.
19 In fall 2018, the Office of Management and Budget (OMB) approved an additional data element to capture whether the
participant completed all of the planned training. Because grantees were not required to collect this data retrospectively, and because the majority of the period included in this report covers the period before the data were collected, this definition of training completion could not be used in the analysis. An analysis on the subset of participants who enrolled in October 2018 or later and completed a first training course indicated that more than 90 percent completed all of the training that was planned.
20 For each training, grantees can report whether the participant completed the training or withdrew from the training. There is no option for “still enrolled.” Participants with missing training completion status were considered to have not completed training.
Early Outcomes 3-4

3.4 Credential Receipt A goal of the TechHire and SWFI programs is to provide industry-recognized credentials and degrees. Among TechHire participants who entered the program, 50 percent obtained a credential.21 Some participants received more than one credential: among those who completed training, 7 percent earned two credentials and 5 percent earned three credentials.22 Among those who received a credential, about 14 percent of participants received a college degree (including an associate’s degree or bachelor’s degree) as the highest credential received.23
Key Findings In both programs, training completion rates were highest among participants who entered training in healthcare. Credential receipt rates were highest among participants who entered training in healthcare and advanced manufacturing.
In TechHire, the occupations that accounted for the most college degrees were in advanced manufacturing and healthcare. Among those who received a college degree, 35 percent completed a training in advanced manufacturing and 38 percent completed a training in healthcare. In contrast, only 27 percent of the college degrees were received by participants who completed a training in IT. Looking at the data differently, among those who completed a training in advanced manufacturing, 13 percent received a college degree, while 26 percent of those who completed a training in healthcare and 6 percent of those who completed a training in IT received a college degree.
Fewer SWFI participants received credentials. Of those who entered the program, 44 percent received a credential. Among those who completed training, 8 percent earned two credentials and 10 percent earned three credentials. Among those who received a credential, about 15 percent of participants earned a college degree (including an associate’s degree or bachelor’s degree) as the highest credential received. Those participants earning a college degree were almost exclusively earning degrees in healthcare occupations (99%).
3.5 Relationship between Training Completion and Credential Receipt and Occupation
Rates of training completion and credential receipt varied by occupation of training. Among TechHire participants who began training, those in healthcare had higher training completion and credential receipt rates than those in IT and those in advanced manufacturing had a higher credential receipt rate than those in IT. Exhibit 3-4 shows that 77 percent of participants who began training in healthcare completed training compared to 74 percent of those who began training in IT. Similarly, 70 percent of those who began training in healthcare and 62 percent of those who began training in advanced manufacturing received a credential compared to 51 percent
21 This number is slightly higher than the 75 percent of training completers who received a credential, reported in Exhibit
4-1. This is because some participants who completed the first training without receiving a credential completed a second or third training and received a credential.
22 The maximum number of credentials that could be recorded is three credentials. 23 Five percent of TechHire participants and 12 percent of SWFI participants who received credentials were recorded as
having received a graduate degree as the highest credential. We are not aware that any programs offer graduate degrees. In fact, the H-1B PIRL was modified to remove the response choice of graduate degree. We count these participants as having received a college degree.
Early Outcomes 3-5

of those who began training in IT. A similar pattern of training completion and credential attainment was observed among SWFI grantees.
Exhibit 3-4. Training completion and credential receipt, by training occupation
73.6
51.1
68.6
32
77.2*69.6*
80.4*
62.3*71.2
61.6*
73.8 71.6*
0102030405060708090
Completed training Received credential Completed training Received credential
TechHire SWFI
Perc
enta
ge o
f Par
ticip
ants
IT Healthcare Advanced Manufacturing
Source: PIRL data as of June 30, 2020.
Notes: Sample includes 10,326 TechHire and 2,320 Strengthening Working Families Initiative (SWFI) participants who began training by December 31, 2018. Occupation is based on Standard Occupational Coding (SOC) at the six-digit level. Some participants entered more than one training. Data are for the first training. Percentages include nonmissing data.
IT = information technology.
*Difference between occupation and IT is significant at the .05 level.
3.6 Relationship between Training Completion and Credential Receipt and Participant Characteristics
Participant characteristics may influence training program outcomes and have implications for service targeting. Program staff may wish to target the program to participants for whom it is most likely to be effective, while at the same time identifying subgroups that may need more supports to complete training.
We examined rates of training completion and credential attainment by participant characteristics. Because the sample size is large, small differences were statistically significant in most cases. Therefore, we only discuss in the text those differences which are both statistically significant and greater than 5 percentage points as these are likely to be most relevant to practice and policy. The results are in Exhibit 3-5.
Key Findings In both programs, in general, having some college or technical school and being employed at entry were associated with higher rates of training enrollment, training completion, and credential receipt, whereas having a low income was related to lower rates of these outcomes.
Early Outcomes 3-6

We highlight some of the largest and most consistent differences here:24
• In both programs, higher levels of education at entry were related to better training and credential outcomes. Rates of training enrollment, training completion, and credential receipt were higher among those with some college or technical school than those with less than a high school diploma or equivalent.
• In TechHire, low income was negatively correlated with training enrollment, training completion, and credential receipt. There were fewer differences by income in SWFI. Low income was negatively correlated with credential receipt but there were no differences in entering or completing training by low income.
• In both programs, rates of training completion were lower among participants with criminal records than among those without criminal records. In SWFI, a criminal record was associated with lower rates of training enrollment and credential receipt.
• In both programs, incumbent workers had higher rates of training enrollment, training completion, and credential receipt than other participants. In SWFI, underemployed workers had higher rates of training enrollment, training completion, and credential receipt than other participants. There were no differences between underemployed workers and other workers in TechHire.
24 The FOA for TechHire defined the target population of “youth and young adults” as individuals ages 17 to 29. A
considerable literature has focused on programs for “youth” defined as those under age 25 (Treskon, 2016). Although rates of training completion and credential receipt between those ages 17 to 29 and ages 30 and older were similar, rates of training completion and credential receipt were lower among those ages 17 to 24 than among those ages 25 to 29 and ages 30 and older. Participants ages 17 to 29 were 9 percentage points less likely to complete training than those ages 25 to 29 and those ages 30 and older and 5 percentage points less likely to receive a credential than older participants.
Early Outcomes 3-7

Exhibit 3-5. Training enrollment, training completion, and credential receipt by participant characteristics
Characteristics TechHire
Strengthening Working Families Initiative (SWFI)
Began Training
Completed Training
Received Credential
Began Training
Completed Training
Received Credential
Gender Male 90.1 67.8 50.9 71.3 53.2 31.6 Female 87.3* 67.3 49.4 75.4 58.0 46.6*
Race White 90.1 66.1 53.5 67.0 49.6 45.4 Black, non-Hispanic 85.6† 63.6† 43.7† 77.0† 58.3 44.1 Hispanic 93.2† 75.4† 56.7† 76.7† 61.4† 45.0 Other race, non-Hispanic 88.2 71.1 51.2 73.2 57.9 43.3 Age 30+ 91.1 71.3 52.9 74.8 56.8 42.0 Ages 17 to 29 88.3* 66.1* 49.4* 74.8 57.8 47.1*
Education Less than high school 79.9 63.4 42.5 52.4 33.1 32.5 High school diploma or equivalent
88.0† 64.0 48.2 76.1† 58.3† 44.8†
Some college or technical 92.4† 71.2† 57.3† 74.9† 58.7† 47.9†
Bachelor’s degree or higher 90.5† 74.5† 48.8 80.5† 61.1† 36.7 Disabled No 88.7 66.7 49.7 76.2 59.4 45.9 Yes 90.4 70.8* 52.9 62.1* 43.7* 31.1*
Limited English proficiency No 88.5 67.0 49.8 74.4 56.8 43.4 Yes 94.4* 70.8* 49.6 81.0* 67.6* 58.1*
Criminal record No 88.2 69.1 49.7 77.0 60.0 46.3 Yes 87.6 63.3* 52.3 66.8* 45.4* 31.8*
Low income No 94.8 71.1 56.6 76.4 60.4 50.4 Yes 82.7* 62.9* 45.0* 74.5 56.8 43.5*
Underemployed No 89.9 69.1 51.2 71.7 54.8 41.5 Yes 91.9 66.1 53.7* 78.6* 60.3* 48.0*
Incumbent worker No 87.8 65.7 48.4 74.5 54.5 56.9 Yes 97.0* 78.9* 61.9* 100.0* 60.3* 88.9*
Source: Participant Individual Record Layout (PIRL) data as of June 30, 2020.
Notes: Sample includes 11,584 TechHire and 3,101 SWFI participants who enrolled between July 1, 2016, and December 31, 2018. Data are for the first training. Percentages include nonmissing data.
*Difference between the subgroup category and the subgroup category listed previously is significant at p < .05.
†Difference between the subgroup category and the subgroup listed first is significant at p < .05.
Early Outcomes 3-8
4. Employment
According to the funding opportunity announcements, employment in well-paying, middle- to high-skilled H1-B industries and occupations is the primary goal of TechHire and Strengthening Working Families Initiative (SWFI). This section explores the employment outcomes of participants. Employment outcomes are considered separately for participants who were unemployed at enrollment and those who were employed at enrollment.
4.1 Employment Outcomes for Participants Not Employed at Entry
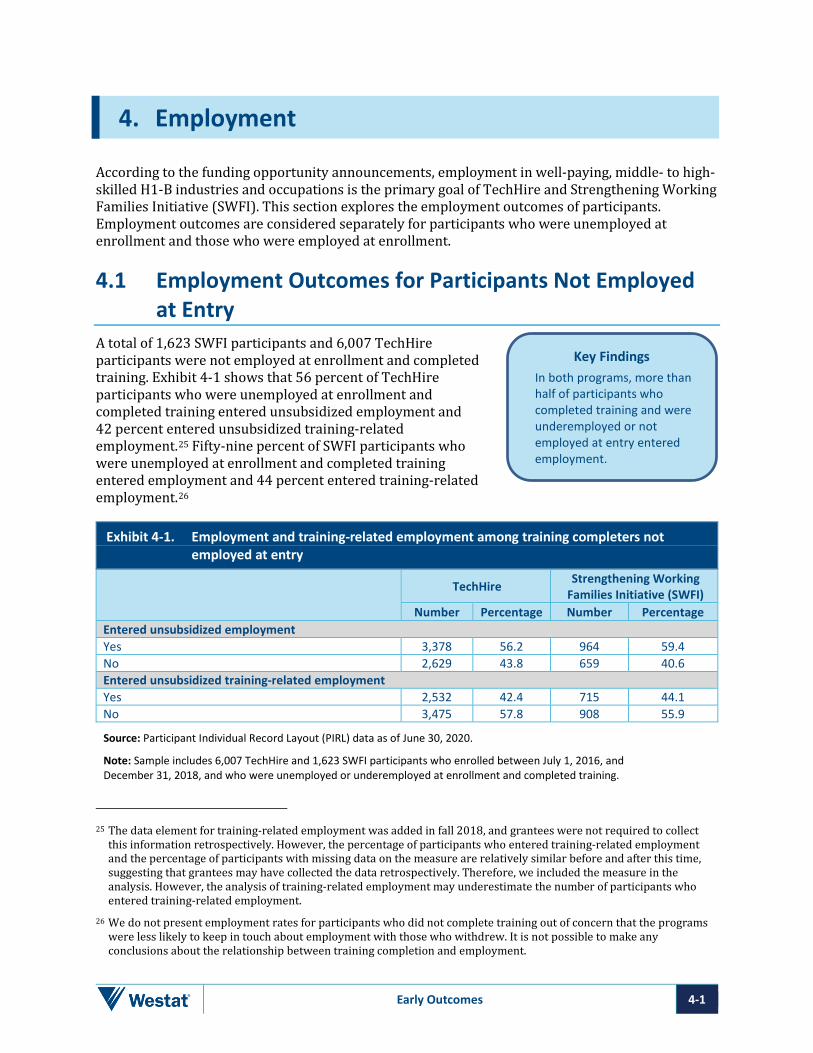
A total of 1,623 SWFI participants and 6,007 TechHire participants were not employed at enrollment and completed training. Exhibit 4-1 shows that 56 percent of TechHire participants who were unemployed at enrollment and completed training entered unsubsidized employment and 42 percent entered unsubsidized training-related employment.25 Fifty-nine percent of SWFI participants who were unemployed at enrollment and completed training entered employment and 44 percent entered training-related employment.26
Key Findings In both programs, more than half of participants who completed training and were underemployed or not employed at entry entered employment.
Exhibit 4-1. Employment and training-related employment among training completers not employed at entry
TechHire Strengthening Working
Families Initiative (SWFI) Number Percentage Number Percentage
Entered unsubsidized employment Yes 3,378 56.2 964 59.4 No 2,629 43.8 659 40.6 Entered unsubsidized training-related employment Yes 2,532 42.4 715 44.1 No 3,475 57.8 908 55.9
Source: Participant Individual Record Layout (PIRL) data as of June 30, 2020.
Note: Sample includes 6,007 TechHire and 1,623 SWFI participants who enrolled between July 1, 2016, and December 31, 2018, and who were unemployed or underemployed at enrollment and completed training.
25 The data element for training-related employment was added in fall 2018, and grantees were not required to collect
this information retrospectively. However, the percentage of participants who entered training-related employment and the percentage of participants with missing data on the measure are relatively similar before and after this time, suggesting that grantees may have collected the data retrospectively. Therefore, we included the measure in the analysis. However, the analysis of training-related employment may underestimate the number of participants who entered training-related employment.
26 We do not present employment rates for participants who did not complete training out of concern that the programs were less likely to keep in touch about employment with those who withdrew. It is not possible to make any conclusions about the relationship between training completion and employment.
Early Outcomes 4-1

There was considerable variation in the time it took participants to enter employment. Exhibit 4-2 shows that, in TechHire, the modal length of time between completion of training and job placement was 20 or more weeks (42 percent). However, 30 percent of participants entered employment within 0 to 4 weeks after completing training. Overall, half of participants entered employment within less than 15 weeks of completing training. Results were similar for SWFI, with the modal length of time being 20 or more weeks.
Exhibit 4-2. Participants by length of time between training completion and employment among training completers not employed at entry
29.211.6
8.78.4
42.123.9
17.314.8
8.935.2
0.0 5.0 10.0 15.0 20.0 25.0 30.0 35.0 40.0 45.0
Less than 5 weeks5 to 10 weeks
10 to 15 weeks15 to 20 weeks
More than 20 weeksLess than 5 weeks
5 to 10 weeks10 to 15 weeks15 to 20 weeks
More than 20 weeks
Tech
Hire
SWFI
Percentage of participants
Source: Participant Individual Record Layout (PIRL) data as of June 30, 2020.
Note: Includes 2,978 TechHire participants and 846 Strengthening Working Families Initiative (SWFI) participants who enrolled between July 1, 2016, and December 31, 2018, who completed training, were unemployed or underemployed at enrollment, and entered unsubsidized employment. Percentages include nonmissing data.
4.2 Employment Outcomes for Incumbent Workers Grantees reported the total number of incumbent workers who (1) retained their current position with their current employer within the first three quarters after training completion, and (2) advanced into a new position requiring a higher level of skills with their current employer or a new employer within the first three quarters after training completion. In TechHire, the percentages of incumbent workers who retained their current positions or advanced into a new position are relatively modest—22 percent and 32 percent, respectively. However, it is important to note that some incumbent workers may still have been in training or have yet to complete training. In addition, it is uncertain the extent to which grantees are able to track incumbent workers to ascertain employment outcomes, especially if the worker leaves the employer for which they were working when they were in training. Because SWFI served only 36 incumbent workers, we do not report employment outcomes of incumbent workers for SWFI.
Although one of the goals of the TechHire and SWFI programs is to support high-wage employment, the Participant Individual Record Layout (PIRL) does not collect information on wages. However, we are collecting this data through the National Directory of New Hires (NDNH). This data will be included in a future report.
Early Outcomes 4-2

4.3 Relationship between Employment and Training Occupation
There was variation in employment outcomes by training occupation. Exhibit 4-3 shows that in TechHire, employment and training-related employment were higher among participants who completed training in healthcare than among those who completed training in information technology (IT). Seventy percent of participants who completed training in healthcare entered employment and 51 percent entered training-related employment compared to 52 and 40 percent in IT, respectively. Among SWFI participants, those in healthcare (63%) and advanced manufacturing (56%) had higher employment than those in IT (47%) and those in advanced manufacturing (53%) had higher training-related employment than those in IT (39%).
Key Findings In both programs, rates of employment and training-related employment were generally higher among participants who completed training in healthcare and advanced manufacturing than among those who completed training in IT.
Exhibit 4-3. Employment by training occupation
52.2
39.546.7
39
70.2*
51*
62.7*
42.951.2
40.4
56.1* 52.9*
01020304050607080
Entered employment Entered training-relatedemployment
Entered employment Entered training-relatedemployment
TechHire SWFI
Perc
ent o
f Par
ticip
ants
IT Healthcare Advanced Manufacturing
Source: Participant Individual Record Layout (PIRL) data as of June 30, 2020.
Note: Sample includes 6,007 TechHire participants and 1,623 Strengthening Working Families (SWFI) participants who enrolled between July 1, 2016, and December 31, 2018, and who were unemployed or underemployed at enrollment and completed training.
IT = information technology.
*Difference between occupation and IT is significant at the .05 level.
Early Outcomes 4-3

4.4 Relationship between Employment and Participant Characteristics
Exhibit 4-4 shows that several participant characteristics were related to employment and training-related employment. We highlight the largest and most consistent differences:27
• In both programs, employment and training-related employment were higher among females than males. The gender differences in employment were 11 and 9 percentage points in TechHire and SWFI, respectively. The gender differences in training-related employment were 5 and 8 percentage points in TechHire and SWFI, respectively. Additional analysis suggested that the more positive employment outcomes of females were due to the fact that they were more likely to train in healthcare occupations and receive supportive services.28
• In both programs, there were differences in employment and training-related employment by race/ethnicity, although these differences were not consistent. In TechHire, black participants had the highest employment rate, whereas in SWFI there were no differences in employment by race/ethnicity. In TechHire, training-related employment was lower among Hispanic participants than among white participants. In SWFI, training-related employment was lower among black participants than among white participants.
• Education level was related to employment outcomes in both programs. In TechHire, 66 percent of participants with a bachelor’s degree or higher entered employment versus 56 percent of those with no high school diploma or equivalent. Fifty-six percent of those with a bachelor’s degree or higher entered training-related employment compared to 42 percent of those with no high school diploma or equivalent. Participants with a high school diploma or equivalent and some college or technical education did not have an advantage in employment or training-related employment over those with no high school diploma or equivalent. In contrast, in SWFI, having any education above high school did confer an employment advantage. Participants with a high school diploma or equivalent (60%), some college or technical (62%), and a bachelor’s degree or higher (56%) had higher rates of employment than those without a high school diploma (32%).
Key Findings In both programs, being female and having a bachelor’s degree or higher was positively associated with employment and training-related employment.
27 Although employment between those ages 17 to 29 and ages 30 and older was similar, employment was 8 percentage
points lower among those ages 17 to 24 than among those ages 25 to 29. Similarly, training-related employment was lower among those ages 17 to 24 than among those ages 25 to 30 and those ages 30 and older by 7 and 6 percentage points, respectively.
28 In both programs, females were more likely than males to train in healthcare occupations and receive supportive services. We conducted a staged regression analysis to examine this issue more closely. In the first stage, we included only gender. In the second stage, we added demographic characteristics. In the third stage, we added training occupation and supportive services receipt. In both programs, the addition of training occupation and supportive services receipt rendered the gender difference in employment nonsignificant and reduced the gender difference in training-related employment by more than 50 percent. These findings suggest that females’ more positive employment outcomes are largely explained by their choice to train in healthcare fields and greater receipt of supportive services.
Early Outcomes 4-4

• In TechHire, employment was 9 percentage points higher among participants with low incomes than among those without low incomes. In SWFI, training-related employment was 8 percentage points lower among participants with low incomes than among those without low incomes.29
• Limited English proficiency was negatively correlated with employment and training-related employment. In TechHire, 45 percent of participants with limited English proficiency entered employment and 32 percent entered training-related employment versus 58 percent and 44 percent of participants without limited English proficiency. In SWFI, limited English proficiency was positively correlated with training-related employment. Fifty-nine percent of participants with limited English proficiency entered training-related employment compared to 43 percent of other participants.
• In TechHire, training-related employment was lower among participants with criminal records than among those without criminal records (36% versus 45%).
Exhibit 4-4. Relationship between participant characteristics and employment among training completers
TechHire Strengthening Working Families Initiative (SWFI)
Entered employment
(%)
Entered training-related
employment (%) Entered
employment (%)
Entered training-related
employment (%) Gender Male 52.4 40.4 51.7 36.9 Female 63.5* 45.5* 60.5* 45.1*
Race White 55.7 44.5 58.3 51.6 Black, non-Hispanic 59.4† 41.7 60.3 40.9†
Hispanic 53.5 37.3† 59.5 45.1 Other race, non-Hispanic 53.3 44.0 51.1 46.7
Age 30 and older 55.4 44.7 57.4 43.3 17 to 29 56.5 41.4* 61.5 44.9 Disabled No 56.2 41.3 59.2 43.5 Yes 52.7 40.2 65.1 55.8 Limited English proficiency No 57.9 43.9 59.4 43.1 Yes 44.7* 31.7* 64.0 58.6*
Criminal record No 58.1 44.5 59.3 43.3 Yes 61.8 35.8* 54.5 38.2 Low income No 50.9 39.2 60.3 51.4 Yes 59.8* 42.6* 59.4 43.2*
29 The overall associations between low income and employment and training-related employment were similar when
examined separately by gender and race/ethnicity.
Early Outcomes 4-5

Exhibit 4-4. Relationship between participant characteristics and employment among training completers (continued)
TechHire Strengthening Working Families Initiative (SWFI)
Entered employment (%)
Entered training-related
employment (%) Entered
employment (%)
Entered training-related
employment (%) Education Less than high school 56.2 41.7 32.0 32.0 High school diploma or
equivalent 53.2 38.1 60.1† 42.1
Some college or technical
56.1 41.5 62.0† 49.8†
Bachelor’s degree or higher
65.9† 55.6† 55.6† 45.2
Source: Participant Individual Record Layout (PIRL) data as of June 30, 2020.
Notes: Sample includes 6,007 TechHire and 1,623 Strengthening Working Families (SWFI) participants who enrolled between July 1, 2016, and December 31, 2018, and who completed a training course and were unemployed or underemployed at entry. Percentages include nonmissing data.
*Difference between the subgroup category and the subgroup category listed previously is significant at p < .05.
†Difference between the subgroup category and the subgroup listed first is significant at p < .05.
Early Outcomes 4-6

5. Supportive Services Received
Since the TechHire and Strengthening Working Families Initiative (SWFI) programs targeted individuals with barriers to employment and training, such as individuals with disabilities, limited English, and criminal records, or parents in need of childcare, a key component of each program is an array of supportive services designed to help participants overcome those barriers. Supportive services could include but were not limited to: assistance with transportation, childcare, dependent care, and housing and needs-related payments. This section describes participants’ receipt of these services for all grantees.
Key Findings Twenty-eight percent of TechHire and 78 percent of SWFI participants received supportive services. In both programs, supportive service receipt was higher among females than males and among participants with low incomes than those without low incomes.
There are two limitations to this analysis. First, the data capture receipt of broad categories of services and do not provide information on the specific services received. Second, the analysis does not address the issue of variation across grantees in provision of services or how services were provided. Future analyses will circumvent these limitations in two ways. First, the 18-month followup survey, which was in the field at the time of this report, will provide information on the specific services received by participants in the randomized controlled trial (RCT) grantees. Second, the implementation report will provide information on the variation in services provided across all grantees.
Twenty-eight percent of TechHire participants and 78 percent of SWFI participants received supportive services. The higher percentage receiving these services among SWFI may be due to the focus on providing childcare assistance among SWFI grantees.30
We examined the extent to which receipt of supportive services was related to participant characteristics. This analysis can help determine whether supportive services are being targeted in a way that is consistent with program goals. Our analysis suggests that in both programs staff targeted training and supportive services in a manner consistent with the goals of the programs. For example, as seen in Exhibit 5-1, supportive service receipt was higher among low-income participants in both programs than among non-low income participants. About 37 percent of low-income TechHire participants received supportive services, while about 21 percent of non-low-income TechHire participants did so. In SWFI, more participants received supportive services overall supportive service receipt was higher among participants with low incomes than those without low incomes (79% vs. 68%).
30 Some services are recorded by entering a date. It is not possible to know, where there is no date, whether the person
did not participate or whether the data are missing. We have no choice than to count them as not participating because we do not have the information.
Early Outcomes 5-1

Exhibit 5-1. Participants’ receipt of supportive services, by low-income status
36.9*
79.4*
20.7
68.2
0
20
40
60
80
100
TechHire SWFIPerc
enta
ge o
f Par
ticip
ants
Low income Not low income
Source: Participant Individual Record Layout (PIRL) data as of June 30, 2020.
Notes: Includes 11,584 TechHire and 3,101 Strengthening Working Families Initiative (SWFI) participants who enrolled by December 31, 2018. Percentages include nonmissing data.
*Difference between low income and not low income is significant at the .05 level.
Additional analyses on the receipt of supportive services by participant characteristics can be found in Appendix B, Exhibit B-2. For TechHire, we highlight some of the largest differences here:
• Supportive service receipt was higher among females than males. Over one-third (34%) of females received supportive services compared to 25 percent of males. Women may have a greater need for supportive services such as childcare, emergency financial assistance, and housing (Hess, Williams-Baron, Gault, & Hegewisch, 2016). An evaluation of Workforce Innovation Opportunity Act (WIOA) services found that women were more likely than men to receive supportive services (Maxwell, Hock, Verbitsky-Savitz, & Reed, 2012).
• Thirty-six percent of participants with English proficiency received supportive services versus 28 percent of other participants.
• Thirty-nine of participants with criminal records received supportive services compared to 29 percent of other participants.
• Thirty-four percent of Black participants and 36 percent of Hispanic participants received supportive services compared to 22 percent of White participants.
• Supportive service receipt was lower among participants without a high school diploma or equivalent than those with a high school diploma or some college. Twenty-two percent of those without a high school diploma received supportive services versus 29 and 28 percent of those with a high school diploma or some college, respectively.
In SWFI, there were fewer differences between groups of participants in the receipt of supportive services. The largest difference was by gender—supportive service receipt was higher among females (80%) than males (69%). The lack of differences may be, in part, due to a ceiling effect owing to most SWFI participants (78%) receiving these services.
Early Outcomes 5-2

6. Program Strategies and Participant Outcomes
We used multivariate regression analysis to examine how outcomes vary by program strategies. Multivariate regression analysis allows the exploration of the relationship between a variable and outcomes while controlling for or holding constant other variables. The models help identify the relationships while controlling for other factors, such as local unemployment rate. There are several limitations to this analysis. First, relationships identified through this analysis do not imply causal relationships. Second, data on program features was measured based on surveys and semi-structured interviews in the fourth year of the grant. If program features changed over time, this would attenuate the relationships between program strategies and outcomes. Third, the small number of grantees limits the precision of the analysis and the ability to detect associations between program strategies and outcomes. Despite these limitations, the analysis is still informative it can identify strategies that may be worthy of further investigation to understand why the correlations have been observed.
Data on program strategies were collected in a web survey conducted with grantees in the fourth year of the grant and confirmed in semi-structured interviews. Only a limited number of program strategies could be examined due to the small number of grantees. We focused on strategies that were encouraged by DOL in the Funding Opportunity Announcement, or that theory and/or research suggest may be related to outcomes. The outcomes included: training completion, credential receipt, employment, and training-related employment. We included only TechHire grantees in the analysis. We did not combine the two grant programs in this analysis because of differences in the populations served and strategies used, and it was not possible to conduct a separate analysis for SWFI grantees because of the small number of grantees.
We describe variation in outcomes across grantees and examine the relationship between program strategies and outcomes. Because the analysis includes the population of grantees and participants, we do not use statistical significance to interpret the results. While we present all of the findings, we highlight those differences that are greater than 5 percentage points as they are likely to be relevant to practice. Because all of the results are presented, readers can use different thresholds to judge the importance of the findings. Appendix D provides further details on the methodology.
6.1 Variation Across Grantees Regression analysis requires variation in outcomes. There was considerable variation in outcomes across grantees (Exhibit 6-1). For example, while the median training completion rate was 71 percent, the bottom 10 percent of grantees had training completion rates at or below 44 percent and the top 10 percent of grantees had training completion rates at or above 92 percent. Credential receipt, employment, and training-related employment outcomes showed similar differences across grantees. This variation may be explained by differences in participant characteristics, grantee characteristics, and program strategies across grantees.
Early Outcomes 6-1

Exhibit 6-1. Variation in outcomes across grantees
10th Percentile grantee
Median grantee
90th Percentile grantee
Percent completed training 44.2 71.4 92.3 Percent received a credential 15.5 51.4 80.8 Percent entered unsubsidized employment
(among participants not employed at entry) 16.9 39.0 73.6
Percent entered training-related unsubsidized employment (among participants not employed at entry) 12.3 24.6 52.9
Note: Sample includes 36 TechHire grantees and participants who enrolled between July 1, 2016 and December 31, 2018.
6.2 Training Completion and Credential Receipt Exhibit 6-2 shows the association between program strategies and training completion and credential attainment. Each bar shows the difference in percentage points in training completion (or credential attainment) between grantees that used the strategy and those that do not. Positive values indicate that the use of a strategy is associated with an increase in the outcome when participant and grantee characteristics are controlled, whereas negative values indicate that the strategy is associated with a decrease in the outcome when the strategy is used.
Key Findings Program strategies positively correlated with training completion and/or credential receipt included assessment for soft skills, use of multiple entry/exit points, and employer involvement in work-based learning (5 percentage point standard) Program strategies negatively correlated with training completion and/or credential receipt included use of online training, use of accelerated training, and provision of child care assistance (5 percentage point standard)
Results indicate that several program strategies are positively associated with training completion and/or credential attainment of 5 percentage points or more when participant and grantee characteristics are controlled:31
• Participants served by grantees that included soft skills assessment were more likely to complete training than those served by grantees that did not include soft skills assessment.
• Participants served by grantees that offered multiple entry and exit points—an indicator of career pathways approaches—were more likely to receive credentials than participants served by grantees that did not offer multiple entry and exit points.
• Participants served by grantees where employers were very involved in delivery of work-based learning were more likely to earn credentials than other participants.
31 Two program strategies were included that were unrelated to any of the outcomes—whether a grantee offered training
in the evening and/or weekends and whether basic skills instruction was integrated into the training curriculum.
Early Outcomes 6-2

However, several strategies were related to lower outcomes (of 5 percentage points or more):
• Participants served by grantees that offered accelerated training were less likely to complete training and receive a credential than those served by grantees that did not offer accelerated training.
• Participants served by grantees that offer online training were less likely to complete training and receive a credential than grantees that did not offer online training.
• Participants served by programs that offer child care assistance, whether directly or by referral were less likely to earn credentials than those served by grantees that did not offer child care assistance.32 This finding may reflect the fact that such programs serve adults with greater child care barriers that where not fully addressed, a possibility which could not be assessed with the available data.
Exhibit 6-2. Change in regression-adjusted mean training completion and credential attainment associated with grantees’ use of program strategies
Source: Participant Individual Record Layout (PIRL) data as of June 30, 2020.
Notes: Sample includes 36 TechHire grantees and participants who enrolled between July 1, 2016 and December 31, 2018. Each percentage is the difference between the regression adjusted means for participants served by grantees that used and did not use each program strategy. Regression adjusted means are calculated holding all other variables at their mean values.
32 “Child care assistance” typically means helping participants to locate affordable child care and apply for child care
subsidies. No programs provide care to participants’ children.
Early Outcomes 6-3

6.3 Employment and Training-Related Employment Exhibit 6-3 shows the association between program strategies and employment and training-related employment. We highlight the program strategies that were associated with 5 percentage-point or greater differences in employment:
• Participants served by grantees that included soft skills in assessment were more likely to enter employment and training-related employment than those served by grantees that did not include soft skills in assessment.
• Participants served by grantees who reported employers were very involved in the curriculum development were more likely to enter employment and training-related employment than other participants.
• Participants served by grantees who reported employers were very involved in work-based learning delivery were more likely to enter training-related employment than those served by grantees that were not involved or involved in work-based learning.
• Participants served by grantees that offered multiple entry/exit points were more likely to enter employment than those served by grantees that did not offer multiple entry/exit points.
• Participants served by programs that offer child care assistance by referral were more likely to enter employment than those served by grantees that offered it directly or not at all. One possible explanation is that relying on referral to existing childcare subsidies may be a more successful approach to long-term care child needs of participants to cover employment.
• Participants served by grantees that offered accelerated training were less likely to enter employment and training-related employment than other participants.
Key Findings Program strategies positively correlated with employment and/or training-related employment included employer involvement in curriculum development, employer involvement in work-based learning, assessment of social skills, use of multiple entry/exit points, and referral to child care assistance (5 percentage points) Use of accelerated training was negatively correlated with employment and training-related employment (5 percentage points)
Early Outcomes 6-4

Exhibit 6-3. Change in regression-adjusted mean employment and training-related employment associated with grantees’ use of program strategies
Source: Participant Individual Record Layout (PIRL) data as of June 30, 2020.
Notes: Sample includes 36 TechHire grantees and participants who enrolled between July 1, 2016 and December 31, 2018. Each percentage is the difference between the regression adjusted means for participants served by grantees that used and did not use each program strategy. Regression adjusted means are calculated holding all other variables at their mean values.
Early Outcomes 6-5
7. Conclusions
This report described the characteristics of participants, participation in services, participation in training, and outcomes across TechHire and Strengthening Working Families Initiative (SWFI) grantees. This chapter summarizes the results of the study, compares the outcomes of participants to those in other sector programs, and discusses next steps to evaluate the programs.
7.1 Key Findings The analysis of Participant Individual Record Layout (PIRL) data provides a glimpse into the outcomes of participants. This report could not address the question of whether these outcomes would have occurred in the absence of the programs. This question is the subject of the impact evaluation.
The programs served a diverse group of participants. TechHire participants tended to be male, younger than age 30, and White. The fact that TechHire participants tended to be younger than age 30 is consistent with the first target population of youth and young adults ages 17 to 29. SWFI participants were typically female, age 30 and older, Black or Hispanic, and low income. The fact that SWFI participants were typically low income is not surprising given that SWFI grantees were required to have participants who were qualified or prequalified for programs such as Temporary Assistance for Needy Families (TANF), Supplemental Nutrition Assistance Program (SNAP), Head Start, and childcare development block grants.
The programs achieved positive training outcomes for participants, but not all participants started training, completed training, or received credentials. Of TechHire participants who entered the program (received a grant-funded service), 89 percent entered training, 68 percent completed training, and 50 percent received a credential. Of SWFI participants who entered the program, 75 percent began training, 57 percent completed training, and 44 percent received a credential. In both programs, the largest point of drop-off was between entering training and completing training.
Lower levels of education were negatively correlated with starting training, completing training, and receiving credentials. Despite the focus of the programs on individuals with barriers to employment, some participants had a bachelor’s degree. Across both programs, 27 percent of participants who started training in IT had a bachelor’s degree and another 26 percent had some college or technical training. Training enrollment, training, completion, and credential receipt were higher among those with higher levels of education. Other analyses of training completion have found similar correlations between education level and retention in training programs among Workforce Innovation and Opportunity Act (WIOA) participants (Rotz & Mastri, 2017) and Health Professions Opportunity Grants (HPOG) program participants (Sick and Loprest, 2020). It is possible that the skills requirements of the programs did not match the skills and experiences of participants. Three out of four grantees offered basic skills instruction to participants. This suggests that bridge programs may be needed to help participants gain the skills needed to transition to training.
While supportive services were targeted appropriately, some participants may require additional supports. Supportive service receipt was higher for females and participants with low incomes. However, receipt of supportive services was much lower than in other similar programs.
Early Outcomes 7-1
For example, in the Work Advance evaluation, 64 percent of participants across all four sites received supportive services. Similarly, in the HPOG program, 53 percent of participants received a supportive service and half received transportation assistance at 18 months after enrollment. The 28 percent of TechHire participants that received supportive services at 18 months is much lower than these programs. One explanation of this difference is that the funding opportunity announcement for both programs stipulated that no more than 10 percent of the grant funds could be used for supportive services. The fact that training enrollment, training completion, and credential receipt were lower among low income participants suggests that more supportive services may be required for this group.
7.2 Comparison of Outcomes to Other Programs It is useful to benchmark the outcomes of TechHire and SWFI participants to those of participants in other sector programs that train less skilled workers for well-paying jobs in industries and occupations that are in demand locally and offer opportunities for advancement. We identified four programs to make rough comparisons:
• Per Scholas is an IT training provider in the Bronx, New York, that participated in the WorkAdvance evaluation. The program targeted unemployed and low-wage working adults (Hendra et al., 2016).
• Year Up provides 6 months of training and a 6-month internship, as well as a variety of supports including individual counseling and a weekly stipend to young adults to prepare them for jobs in the IT and financial operations fields (Fein & Hamadyk, 2018).
• Project QUEST, located in San Antonio, Texas, provides comprehensive support to help low-income adults earn postsecondary credentials and access well-paying jobs in strong sectors of the local economy (Roder & Elliott, 2019).
• The HPOG program provided mostly short-term trainings in healthcare fields to TANF recipients and other low-income individuals (Werner et al., 2016; Werner et al., 2018).
While these programs have differences with both grant programs, comparing the outcomes is still informative because it illustrates the range of outcomes that programs can achieve for low-wage job seekers. As shown in Exhibit 7-1, the outcomes of TechHire participants were similar to the outcomes of participants served by these four sector programs. The outcomes of TechHire participants were in the middle of the range of outcomes for these four programs. The percentage of participants who began training ranged from 85 to 96 percent across the four programs, and was 89 percent for TechHire. The percentage of TechHire participants who completed training (68%) was in the middle of the range across the four programs (60% to 79%). The percentages of TechHire participants who a credential (50%) was also in the middle of the range across the four programs (37% to 73%). However, outcomes for SWFI participants were somewhat lower than for other programs. The percentages of participants who began training (75%) was lower than the lowest of the four programs (85%). The percentage of participants who completed training (57%) was also lower than the lowest of the four programs (60%). However, the percentage of SWFI participants, that received a credential (44%) was higher than two of the programs. One possible explanation for the poorer outcomes of SWFI compared to TechHire and other sector programs is the childcare and other supportive service needs of this population.
Early Outcomes 7-2
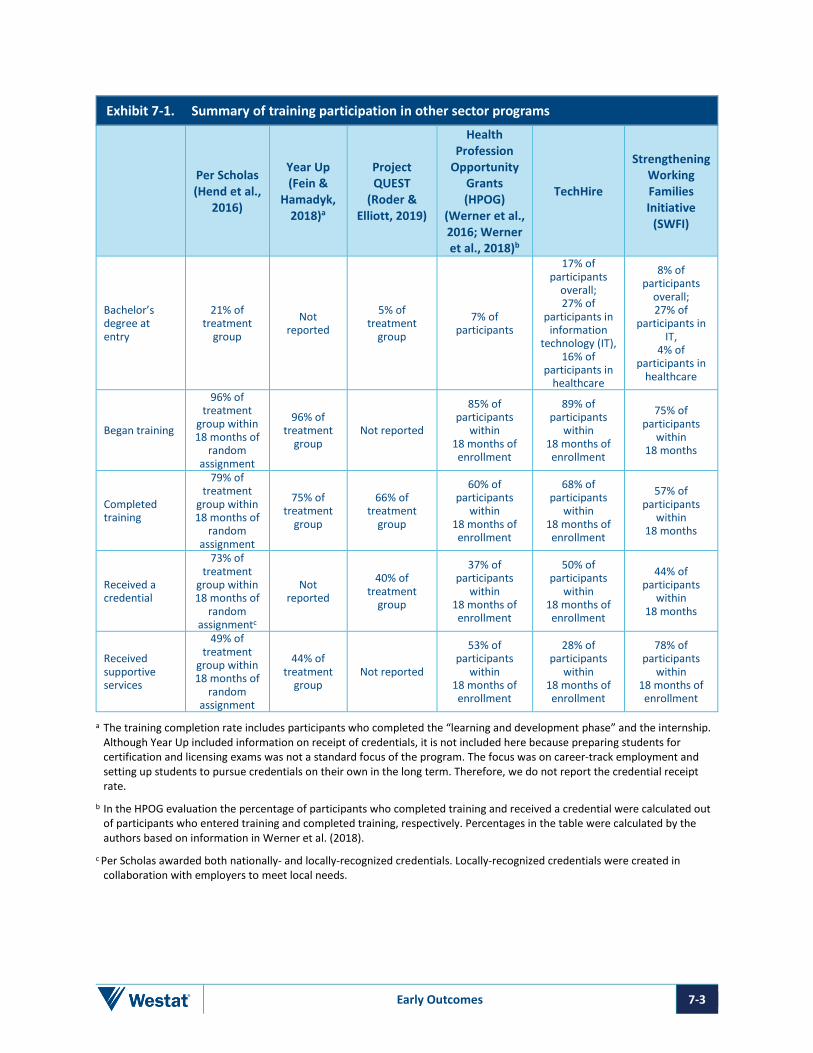
Exhibit 7-1. Summary of training participation in other sector programs
Per Scholas (Hend et al.,
2016)
Year Up (Fein &
Hamadyk, 2018)a
Project QUEST
(Roder & Elliott, 2019)
Health Profession
Opportunity Grants (HPOG)
(Werner et al., 2016; Werner et al., 2018)b
TechHire
Strengthening Working Families Initiative
(SWFI)
Bachelor’s degree at entry
21% of treatment
group
Not reported
5% of treatment
group
7% of participants
17% of participants
overall; 27% of
participants in information
technology (IT), 16% of
participants in healthcare
8% of participants
overall; 27% of
participants in IT,
4% of participants in
healthcare
Began training
96% of treatment
group within 18 months of
random assignment
96% of treatment
group Not reported
85% of participants
within 18 months of enrollment
89% of participants
within 18 months of enrollment
75% of participants
within 18 months
Completed training
79% of treatment
group within 18 months of
random assignment
75% of treatment
group
66% of treatment
group
60% of participants
within 18 months of enrollment
68% of participants
within 18 months of enrollment
57% of participants
within 18 months
Received a credential
73% of treatment
group within 18 months of
random assignmentc
Not reported
40% of treatment
group
37% of participants
within 18 months of enrollment
50% of participants
within 18 months of enrollment
44% of participants
within 18 months
Received supportive services
49% of treatment
group within 18 months of
random assignment
44% of treatment
group Not reported
53% of participants
within 18 months of enrollment
28% of participants
within 18 months of enrollment
78% of participants
within 18 months of enrollment
a The training completion rate includes participants who completed the “learning and development phase” and the internship. Although Year Up included information on receipt of credentials, it is not included here because preparing students for certification and licensing exams was not a standard focus of the program. The focus was on career-track employment and setting up students to pursue credentials on their own in the long term. Therefore, we do not report the credential receipt rate.
b In the HPOG evaluation the percentage of participants who completed training and received a credential were calculated out of participants who entered training and completed training, respectively. Percentages in the table were calculated by the authors based on information in Werner et al. (2018).
c Per Scholas awarded both nationally- and locally-recognized credentials. Locally-recognized credentials were created in collaboration with employers to meet local needs.
Early Outcomes 7-3
7.3 Looking Forward Several future reports are planned from this study. Most directly relevant, the Final Outcomes Report will examine employment and earnings outcomes using National Directory of New Hires (NDNH) data. This analysis of data will overcome limitations of the PIRL employment data and allow for employment and earnings to be examined over several years after enrollment, rather than just initial job placement. The report will examine changes in employment and earnings before and after program entry overall and for subgroups of participants. We will also conduct an analysis to compare the consistency of the data collected in the PIRL with data collected from the NDNH. Additional reports will document findings from the implementation and impact studies. An implementation report will include implementation findings for all grantees. The impact study will examine impacts on service receipt, training enrollment, training completion, and employment and earnings using both survey and NDNH data. The impact study findings will be disseminated in two reports: one that examines impacts on training enrollment, and another that examines impacts on training completion and economic outcomes. As such, the impact study will provide evidence on the effectiveness of the TechHire and SWFI programs and what participants’ outcomes would have been in the absence of these programs.
Early Outcomes 7-4
References
Fein, D., and Hamadyk, J. (2018). Bridging the opportunity divide for low-income youth: Implementation and early impacts of the Year Up program (OPRE Report No. 2018-65). Washington, DC: Office of Planning, Research, and Evaluation, Administration for Children and Families, U.S. Department of Health and Human Services. Available at: https://www.yearup.org/sites/default/files/2019-03/Year-Up-PACE-Full-Report-2018.pdf.
Hendra, R., Greenberg, D.H., Hamilton, G., Oppenheim, A., Pennington, A., Schaberg, K., and Tessler, B.L. (2016). Encouraging evidence on a sector-focused advancement strategy – Two-year impacts from the WorkAdvance demonstration. New York, NY: MDRC. Available at: https://www.mdrc.org/sites/default/files/WorkAdvance_2016.pdf.
Hess, C., Williams-Baron, E., Gault, B., and Hegewisch, A. (2016). Supportive services in workforce development programs: Administrator perspectives on availability and unmet needs. Washington, DC: Institute for Women’s Policy Research. Available at: https://www.issuelab.org/resources/26072/26072.pdf.
Maxwell, N., Hock, H., Verbitsky-Savitz, N., and Reed, D. (2012). How are women served by the WIA adult and dislocated worker programs? Findings from administrative data (for the U.S. Department of Labor). Oakland, CA: Mathematica Policy Research. Available at: https://www.dol.gov/sites/dolgov/files/OASP/legacy/files/FINAL_REPORT_women_served_via_adult_dislocated_worker_programs.pdf.
Roder, A., and Elliott, M. (2019). Nine year gains: Project QUEST’s continuing impact. New York, NY: Economic Mobility Corporation. Available at: https://economicmobilitycorp.org/wp-content/uploads/2019/04/NineYearGains_web.pdf.
Rotz, D., and Mastri, A. (2017). What predicts training completions and credential receipt? (issue brief). Princeton, NJ: Mathematica Policy Research.
Sick, N., and Loprest, P. (2020, November). Who doesn’t start or complete training? Factors linked to persistence in HPOG (panel paper). Association for Public Policy Analysis and Management 42nd Annual Fall Research Conference, virtual.
Treskon
U.S. Department of Labor. “Notice of Availability of Funds and Funding Opportunity Announcement for Grant Applications for H-1B TechHire Partnership Grants” (FOA-ETA-16-01). Washington, DC: DOL, March 2016.
U.S. Department of Labor. “Notice of Availability of Funds and Funding Opportunity Announcement for the Strengthening Working Families Initiative” (FOA-ETA-16-05). Washington, DC: DOL, March 2016.
Early Outcomes R-1

Werner, A., Koralek, R., Roy, R., Schwartz, D., Collins, A., Loprest, P., and Stolte, A. (2016). Descriptive implementation and outcome study report: National implementation evaluation of the Health Profession Opportunity Grants (HPOG) to serve TANF recipients and other low-income individuals (OPRE Report No. 2016-30). Washington, DC: Office of Planning, Research and Evaluation, Administration for Children and Families, U.S. Department of Health and Human Services. Available at: https://www.acf.hhs.gov/sites/default/files/documents/opre/final_nie_di_and_outcome_study_report_clean_b508.pdf.
Werner, A., Loprest, P., Schwartz, D., Koralek, R., and Sick, N. (2018). Final report: National implementation evaluation of the first round Health Profession Opportunity Grants (HPOG 1.0) (OPRE Report No. 2018-09). Washington, DC: Office of Planning, Research, and Evaluation, Administration for Children and Families, U.S. Department of Health and Human Services. Available at: https://www.acf.hhs.gov/opre/report/final-report-national-implementation-evaluation-first-round-health-profession.
Early Outcomes R-2

Appendix A
PIRL Data

Appendix A PIRL Data
Exhibit A-1. Data elements in PIRL data
Data Element Values Participant Information – Identifying Data
OBS Number 9-digit integer Unique Individual Identifier Identification number Special Project ID - 1 7-digit alpha-numeric ID Special Project ID - 2 7-digit alpha-numeric ID Special Project ID - 3 7-digit alpha-numeric ID ETA-Assigned 1st Local Workforce Board Code 5-digit ETA-assigned Local Board/Statewide code Social Security Number 9-digit SSN
Demographics Date of Birth YYYYMMDD Sex Male/Female State Code of Residence 2-letter state code (e.g., “AL”=Alabama) County Code of Residence 3-digit county code Zip Code of Residence 5-digit zip code Ethnicity: Hispanic / Latino Yes/No American Indian / Alaska Native Yes/No Asian Yes/No Black / African American Yes/No Native Hawaiian / Other Pacific Islander Yes/No White Yes/No
Socioeconomic Variable Individual with a Disability Yes/No
Category of Disability
1 = Physical/Chronic Health Condition 2 = Physical/Mobility Impairment 3 = Mental or Psychiatric Disability 4 = Vision-related disability 5 = Hearing-related disability 6 = Learning Disability 7 = Cognitive/Intellectual disability 9 = Participant did not disclose type of disability 0 = No disability
Individual With A Disability SDDA Services Yes/No Individual With A Disability LSMHA Services Yes/No Individual With A Disability Medicaid HCBS Services Yes/No
Individual With A Disability Work Setting
1 = Competitive Integrated Employment 2 = Individual Supported Employment 3 = Group Supported Employment 4 = Sheltered workshop 5 = Combination of two or more settings 0 = Not Employed
Early Outcomes A-1

Exhibit A-1. Data elements in PIRL data (continued)
Data Element Values Socioeconomic Variable (continued)
Individual With A Disability Type of Customized Employment Services Received
1 = Discovery assessment services 2 = Developed a customized employment search plan 3 = Employer negotiation services 4 = Secured employment as a result of receiving customized employment services and received extended support services 0 = No CES services
Individual With A Disability Financial Capability (services received)
1 = Benefit planning services 2 = Financial capability/asset development services 3 = Benefit planning services and financial capability/asset development services 0 = No
Veteran Status Yes/No
Eligible Veteran Status
1 = Yes <=180 days. 2 = Yes, Eligible Veteran 3 = Yes, Other Eligible Person 0 = No
Employment Status at Program Entry
1 = Employed 2 = Employed, but received notice of termination of employment or military separation is pending 3 = Not in labor force 0 = Unemployed
Long-Term Unemployed at Program Entry 1 = Yes, unemployed ≥ 27 consecutive weeks 0 = No
Highest School Grade Completed at Program Entry 1 – 12 = Number of school grades completed 0 = No school grades completed
Highest Educational Level Completed at Program Entry
1 = Attained secondary school diploma 2 = Attained a secondary school equivalency 3 = The participant with a disability receives a certificate of attendance/completion as a result of successfully completing an Individualized Education Program (IEP) 4 = Completed one of more years of postsecondary education 5 = Attained a postsecondary technical or vocational certificate (non-degree) 6 = Attained an associate’s degree 7 = Attained a bachelor’s degree 8 = Attained a degree beyond a bachelor’s degree 0 = No educational level completed
Ex-Offender Status at Program Entry Yes/No Low-Income Status at Program Entry Yes/No English Language Learner at Program Entry Yes/No
Early Outcomes A-2

Exhibit A-1. Data elements in PIRL data (continued)
Data Element Values Job Services
Underemployed Worker
1 = participant is a person who lost their job during or after the recent recession and has obtained only episodic, short-term, or part-time employment for 27 consecutive weeks, but has not reconnected with a full-time job commensurate with the participant’s loss of permanent employment. 0 = participant does not meet any of the conditions described above.
Date of Program Entry YYYYMMDD Date of Program Exit YYYYMMDD Date of First Case Management and Employment Service YYYYMMDD
Participant Recipient of Incumbent Worker Training Services
1 = Statewide 15% only 2 = Local Formula only (20%) 3 = Both 15% and Local Formula 4 = H-1B funded grant 5 = DWG funded grant 0 = No
Other Reasons for Exit (why participant exited program)
01 = Institutionalized 02 = Health/Medical 03 = Deceased 04 = Reserve Forces called to Active Duty 05 = Foster Care 06 = Ineligible 07 = Criminal Offender 00 = No
Registered Apprenticeship Program 1 = Yes, participant entered into Registered Apprenticeship Program or was already enrolled 2 = No
Accountability Exit Status
1 = Participant either disclosed an invalid social security number (SSN) or chose not to disclose a SSN. 2 = Participant retired from employment. 0 = Neither
H-1B (grant that participant received services from) 14-digit grant number Most Recent Date Received Internship or Work Experience opportunities YYYYMMDD
Type of Work Experience (participant received)
1 = Summer employment/Internships during the summer (WIOA Youth) 2 = Employment opportunities, including internships, not limited to summer months 3 = Pre-apprenticeship programs 4 = Job shadowing 5 = On-the-job training (WIOA Youth) 6 = Transitional job (WIOA Adult, Dislocated Worker, and Dislocated Worker Grants) 7 = Other work experience activities 0 = Did not participate in these activities
Early Outcomes A-3

Exhibit A-1. Data elements in PIRL data (continued)
Data Element Values Job Services (continued)
Date Received Financial Literacy Services YYYYMMDD
Previous Quarter Received Case Management Service
1 = Participant received case management services in the previous quarter. 0 = Participant did not receive case management services in the previous quarter.
Most Recent Date Received Assessment Services Most recent date on which the participant received assessment services funded by the program.
Previous Quarter Received Assessment Services
1 = Participant received Assessment Services in the previous quarter. 0 = Participant did not receive Assessment Services in the previous quarter.
Previous Quarter Received Supportive Services
1 = Participant received Support Services in the previous quarter. 0 = Participant did not receive Support Services in the previous quarter.
Most Recent Date Received Specialized Participant Services
Most recent date on which the participant received specialized participant services, which include, but are not limited to, financial counseling, behavioral health counseling, mentoring, assistance with relocation, job coaching, networking, and job search assistance.
Previous Quarter Received Specialized Services
1 = Participant received Specialized Services in the previous quarter. 0 = Participant did not receive Specialized Services in the previous quarter.
Previous Quarter Participated in Work Experience
1 = Participant participated in Work Experience in the previous quarter. 0 = Participant did not participate in Work Experience in the previous quarter.
Training Services Received Training Yes/No Date Entered Training YYYYMMDD
Type of Training Service
01 = On the Job Training 02 = Skill Upgrading 03 = Entrepreneurial Training (non-WIOA Youth) 04 = ABE or ESL (contextualized or other) in conjunction with Training (non-TAA funded) 05 = Customized Training 06 = Other Occupational Skills Training 07 = Remedial Training (ABE/ESL – TAA only) 08 = Prerequisite Training 09 = Registered Apprenticeship 10 = Youth Occupational Skills Training 11 = Other Non-Occupational-Skills Training 00 = No Training Service
Occupational Skills Training Code 8-digit code O*Net 4.0 code that best describes the training occupation for which the participant received training services
Early Outcomes A-4

Exhibit A-1. Data elements in PIRL data (continued)
Data Element Values Training Services (continued)
Training Completed Yes/No Date Completed, or Withdrew from, Training YYYYMMDD
Distance Learning 1 = Yes, participant received training through distance learning 0 = No
Participated in Postsecondary Education During Program Participation Yes/No
Primary Type of Training Service for Training Activity Use the appropriate code to indicate the primary type of training being provided to the participant.
Secondary Type of Training Service for Training Activity
Use the appropriate code to indicate the secondary type of training being provided to the participant.
Tertiary Type of Training Service for Training Activity Use the appropriate code to indicate the tertiary type of training being provided to the participant.
Date Entered Employment (Discretionary Grants) Record the date of employment (when the participant first began a job)
Outcomes
Employment Related to Training (2nd Quarter After Exit)
1 = Participant received training services and obtained employment directed related to the training services received. 0 = Participant received training services and did not obtain employment directly related to the training services received.
Occupational Code 8-digit occupational code that best describes the participant’s employment (O*Net 4.0 classification)
Industry Code of Employment 1st Quarter After Exit Quarter
4- to 6-digit industry code that best describes the participant’s employment using the North American Industrial Classification System (NAICS)
Type of Recognized Credential (received by participant)
1 = Secondary School Diploma/or equivalency 2 = AA or AS Diploma/Degree 3 = BA or BS Diploma/Degree 4 = Graduate/Post Graduate 5 = Occupational Licensure 6 = Occupational Certificate 7 = Occupational Certification 8 = Other Recognized Diploma, Degree, or Certificate 0 = No recognized credential
Date Attained Recognized Credential YYYYMMDD
Date of Most Recent Measurable Skill Gains: Training Milestone
Most recent date that the participant had a satisfactory or better progress report toward established milestones from an employer/training provider who is providing training
Date of Most Recent Measurable Skill Gains: Skills Progression
Most recent date the participant successfully completed an exam that is required for a particular occupation, or progress in attaining technical or occupational skills as evidenced by trade-related benchmarks such as knowledge-based exams.
Early Outcomes A-5

Exhibit A-1. Data elements in PIRL data (continued)
Data Element Values Outcomes (continued)
Date Enrolled During Program Participation in an Education or Training Program Leading to a Recognized Postsecondary Credential or Employment
Most recent date the participant was enrolled during program participation in an education or training program that leads to a recognized postsecondary credential or an education, including a secondary education program, or training program that leads to employment as defined by the core program in which the participant participates.
Incumbent Workers Retained Current Position in the [1st, 2nd, 3rd] Quarter after Completion
1 = Participant was employed at the start of participation (incumbent worker) and retained their current position in the [1st, 2nd, 3rd] quarter after program completion. 0 = Participant was employed at the start of participation (incumbent worker) and did not retain their current position in the [1st, 2nd, 3rd] quarter after program completion.
Incumbent Workers Advanced into a New Position with Current or New Employer in the [1st, 2nd, 3rd] Quarter after Training Program Completion
1 = Participant was employed at the start of participation (incumbent worker) and advanced into a new position requiring a higher skill level either with their current employer or a new employer, as a result of grant-funded activities in the [1st, 2nd, 3rd] quarter after training program completion. 0 = Participant was employed at the start of program participation (incumbent worker) and did not advance into a new position as a result of the grant-funded activities, in the [1st, 2nd, 3rd] quarter after training program completion.
Early Outcomes A-6

Appendix B
Additional Exhibits

Appendix B Additional Exhibits
Exhibit B-1. Top 20 training occupations
TechHire Strengthening Working Families Initiative (SWFI) Occupation Number Percentage Occupation Number Percentage
Computer User Support Specialists 1,107 11.7 Nursing Assistants 512 22.1 Computer Occupations, All Other 670 7.1 Helpers, Construction
Trades, All Other 260 11.2 Web Developers 537 5.7 Medical Assistants 228 9.9 Information Security Analysts 394 4.2 Licensed Practical and
Licensed Vocational Nurses 169 7.3
Computer Programmers 375 4.0 Computer User Support Specialists 134 5.8
Registered Nurses 370 3.9 Computer Network Support Specialists 99 4.3
Engineering Technologists and Technicians, Except Drafters, All Other
324 3.4 Registered Nurses 73 3.2
Computer and Information Systems Managers 265 2.8 Phlebotomists 61 2.6
Engineers, All Other 264 2.8 Engineering Technologists and Technicians, Except Drafters, All Other
61 2.6
Training and Development Specialists 238 2.5 Medical Records and Health
Information Technicians 58 2.5 Electrical and Electronics Repairers, Commercial and Industrial Equipment
232 2.5 Health Aides 53 2.3
Welders, Cutters, Solderers, and Brazers 232 2.5 Medical Equipment
Preparers 50 2.2 Phlebotomists 213 2.3 Tellers 47 2.0 Occupational Health and Safety Technicians 208 2.2 Pharmacy Technicians 46 2.0 Computer Network Support Specialists 200 2.1 Dental Assistants 37 1.6 Network and Computer Systems Administrators 197 2.1 Home Health Aides 34 1.5 Electro-Mechanical and Mechatronics Technologists and Technicians
197 2.1 Information Security Analysts 33 1.4
Telecommunications Line Installers and Repairers 196 2.1
Hand Laborers and Freight, Stock, and Material Movers, Hand
30 1.3
Industrial Machinery Mechanics 188 2.0 Emergency Medical
Technicians and Paramedics 25 1.1
Computer Occupations, All Other 177 1.9
Secretaries and Administrative Assistants, Except Legal, Medical, and Executive
24 1.0
Source: Participant Individual Record Layout (PIRL) data as of June 30, 2020.
Notes: Sample includes 10,326 TechHire and 2,320 SWFI participants who began training by December 31, 2018. Occupation is based on Standard Occupational Coding (SOC) at the six-digit level. Some participants entered more than one training. Data are for the first training. Percentages include nonmissing data.
Early Outcomes B-1
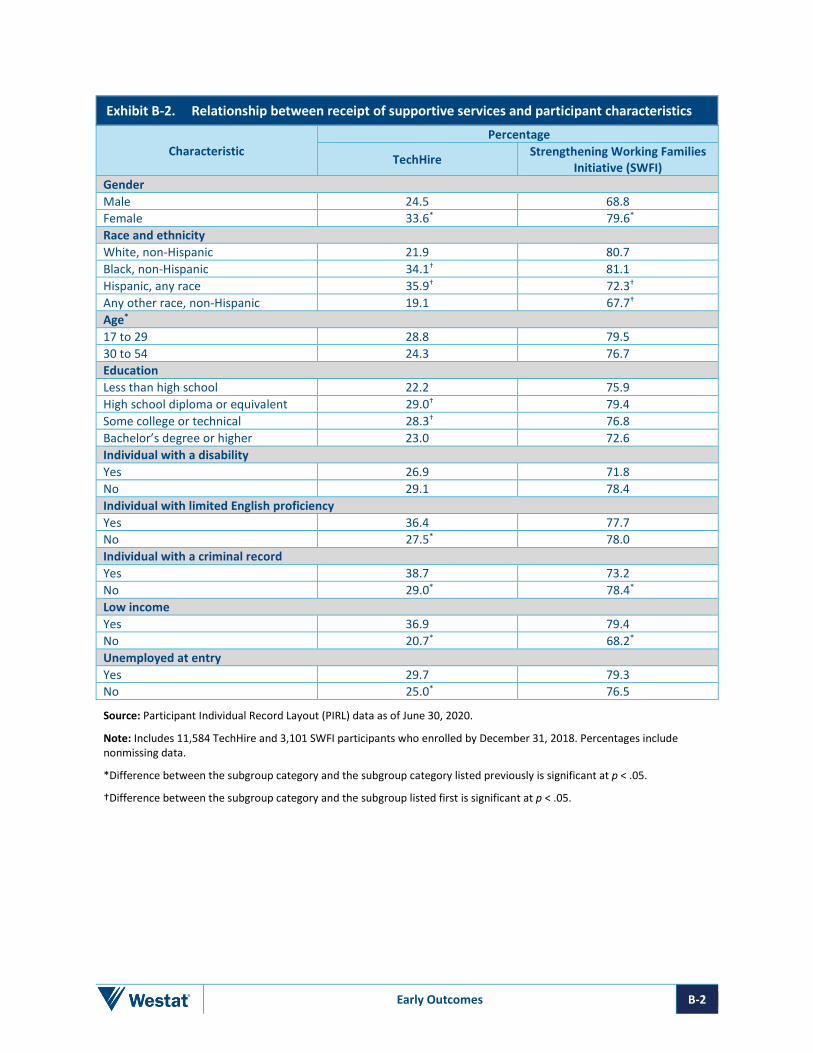
Exhibit B-2. Relationship between receipt of supportive services and participant characteristics
Characteristic Percentage
TechHire Strengthening Working Families Initiative (SWFI)
Gender Male 24.5 68.8 Female 33.6* 79.6*
Race and ethnicity White, non-Hispanic 21.9 80.7 Black, non-Hispanic 34.1† 81.1 Hispanic, any race 35.9† 72.3†
Any other race, non-Hispanic 19.1 67.7†
Age*
17 to 29 28.8 79.5 30 to 54 24.3 76.7 Education Less than high school 22.2 75.9 High school diploma or equivalent 29.0† 79.4 Some college or technical 28.3† 76.8 Bachelor’s degree or higher 23.0 72.6 Individual with a disability Yes 26.9 71.8 No 29.1 78.4 Individual with limited English proficiency Yes 36.4 77.7 No 27.5* 78.0 Individual with a criminal record Yes 38.7 73.2 No 29.0* 78.4*
Low income Yes 36.9 79.4 No 20.7* 68.2*
Unemployed at entry Yes 29.7 79.3 No 25.0* 76.5
Source: Participant Individual Record Layout (PIRL) data as of June 30, 2020.
Note: Includes 11,584 TechHire and 3,101 SWFI participants who enrolled by December 31, 2018. Percentages include nonmissing data.
*Difference between the subgroup category and the subgroup category listed previously is significant at p < .05.
†Difference between the subgroup category and the subgroup listed first is significant at p < .05.
Early Outcomes B-2

Appendix C
Sensitivity Analysis

Appendix C Sensitivity Analysis
In this report, we included participants who enrolled between July 2016 and December 2018. Training and employment outcomes were measured through June 2020. Since the followup period includes several months impacted by the COVID-19 pandemic, we conducted a sensitivity analysis on a different sample that enrolled in the programs at least 18 months prior to December 2019. The sample included participants who enrolled between July 2016 and June 2018. Outcomes were assessed through December 2019. Exhibit C-1 shows that the percentages of participants in the sensitivity analysis that achieved each of the training and employment outcomes are very similar to the percentages in the main analyses.
Exhibit C-1. Training and employment outcomes on two different samples
89.1
67.6
50.4
56.2
42.2
74.8
57.2
44.4
59.4
44.1
88.1
68.3
51.2
56.7
42.6
73.6
56.8
44.4
60.1
44.9
0 10 20 30 40 50 60 70 80 90 100
Began training
Completed training
Received a credential
Entered employment
Entered training-related employment
Began training
Completed training
Received a credential
Entered employment
Entered training-related employment
Tech
Hire
SWFI
Percentage of Participants
Enrolled by December 2018 Enrolled by June 2018
Source: Participant Individual Record Layout (PIRL) data as of June 30, 2020.
Notes: Sample enrolled by December 2018 includes 11,584 TechHire and 3,101 Strengthening Working Families Initiative (SWFI) participants who enrolled by December 31, 2018. Outcomes for this sample are assessed through June 2020. Sample enrolled by June 2018 includes 9,238 TechHire and 2,306 SWFI participants who enrolled by June 30, 2018. Outcomes for this sample are assessed through December 2019.
Early Outcomes C-1

Appendix D
Technical Appendix on Regression Analysis

Appendix D Technical Appendix on Regression Analysis
This appendix describes the data sources and methods used for the analyses in Chapter 6 of the association between program strategies and participant outcomes.
D.1 Data Sources The analysis is based on data drawn from the H1-B Participant Individual Record Layout (PIRL), a survey of grantees, semi-structured interviews with grantees, and review of program management documents.
As described earlier in this report, the PIRL measures participant outcomes. The analysis used an extract through June 30, 2020, that includes 36 TechHire grantees. To provide a more complete picture of the outcomes of participants, most of the analysis used a narrower sample of participants for whom at least 18 months has elapsed since enrollment. This sample includes participants who enrolled from July 1, 2016, to December 31, 2018. This allows for 18 months of post-enrollment follow-up.
Measures of program strategies were drawn from a web survey of grantees operating their programs at the time of data collection. It was fielded between June and October 2019, halfway through implementation. The survey collected data on program organization, partnerships, screening and assessment, training, supportive services, job development, sustainability, and challenges and successes. Grantees’ reports of the program strategies used were confirmed in 90-minute telephone interviews with grantees between October and November 2019. Grantee applications provided information on grantee characteristics.
Finally, we used data on unemployment from the BLS Local Area Unemployment Statistics (LAUS). These data will were linked to each grantee based on the local labor market(s) from which they drew participants.
D.2 Multilevel Regression Model The outcomes analysis was not designed to identify causal relationships between program strategies and participant outcomes. However, we used regression analysis to examine associations between program strategies and participant outcomes controlling for grantee and participant characteristics and local economic conditions.
In particular, we used regression analysis to examine the relationship between participant outcomes and the following program strategies:
• Assessment included soft skills/job readiness
• Basic skills instruction is integrated into the training program
• Offered accelerated training (bootcamps)
Early Outcomes D-1

• Offered training with multiple entry and exit points
• Offered training in evenings or on weekends
• Offered online training
• Employers very involved in curriculum development
• Employers very involved in work-based learning
• Child care assistance: Provided directly, makes referrals (not provided omitted from model)
We used multilevel models because the data are collected at two levels (the grantee level and the participant level). The dependent variables are measured at the participant level and will be regressed on independent variables measured at the participant and grantee level. Individual participants will be labeled as level-1 variables and grantee characteristics as level 2 variables. These models have both a methodological and substantive justification. First, the fact that participants are clustered in grantees violates the assumption of independent observations of single-level regression models. The use of multilevel models allows the standard errors to take into account this clustering. Second, the use of multilevel models allows us to examine how individual and grantee level characteristics simultaneously effect the outcomes.
Different types of regression models are appropriate for different types of outcomes. Because all of the outcomes are binary and take on only two values, we used a logistic regression model.
As described above, our regression model included grantee characteristics, participant characteristics, and local unemployment. The grantee characteristics were derived from grantee applications and included:
• Type of organization: education or training provider, business-related nonprofit (workforce development system omitted from model)
• Urban33
• Region: Regions 2 to 6 (Region 1 omitted from model)
33 Grantees were considered urban if all of the areas served by the grant were urban. Grantees were considered not urban
if one or more of the areas served by the grant were rural.
Early Outcomes D-2

The participant characteristics were derived from the PIRL and included:
• Female
• Age
• Race
• Employed at entry
• Education level at entry
• Disabled
• Limited English proficiency
• Criminal record
Finally, local unemployment rate included a series of dummy variables for the local unemployment rate. The model also included a control for quarter of program entry.
Early Outcomes D-3