Working Paper 99-2: Famine in Korea: Causes and Cures
51
FAMINE IN NORTH KOREA: Causes and Cures Marcus Noland 1 Institute for International Economics Sherman Robinson International Food Policy Research Institute Tao Wang Institute for International Economics Abstract In this paper we start from incomplete data ridden with gross measurement errors to construct the underlying data base for a computable general equilibrium model (CGE) of the North Korean economy using cross-entropy estimation techniques. This model incorporates fragmentary information in a rigorous way and allows us to examine the implications of a number of alternative scenarios. First, we model a production-oriented recovery program as the restoration of flood-affected lands. We then model an external assistance program as the acquisition of all food aid necessary to attain the United Nations organizations’ estimates of minimum human needs. The trade-oriented recovery program is modeled as a relaxation of agricultural import quotas and the importation of food on commercial terms. Finally, we model a systemic reform program as the elimination of quantitative restrictions on all external trade. We find that only the trade- and reform-centered strategies are likely to provide a sustainable solution to North Korea’s problems. Because of North Korea’s lack of comparative advantage in the production of grains, the production-oriented strategy fails to attain the country’s minimum human needs target. The target could be obtained through international assistance, but it appears that this assistance has been motivated by donors’ non-famine-related foreign policy goals and may not be sustainable. Higher levels of assistance depress agricultural prices (and domestic production), rural wages, and the wages of the low skill urban workers, contributing to income inequality. In contrast, not only minimum human needs, but also normal human demands are met under the trade-oriented strategy. However, total normal demand is met only through systemic reform. Under both of the trade- and reform-oriented strategies, GDP rises and wages for all labor groups increase, offering the possibility of a recovery strategy where everyone gains. 1 We would like to thank seminar participants at the International Food Policy Research Institute and US Forces Korea for helpful comments on an earlier draft. Mina Kim provided useful research assistance.
Transcript of Working Paper 99-2: Famine in Korea: Causes and Cures
FAMINE IN NORTH KOREA:Causes and Cures
Marcus Noland1
Institute for International Economics
Sherman RobinsonInternational Food Policy Research Institute
Tao WangInstitute for International Economics
AbstractIn this paper we start from incomplete data ridden with gross measurement errors to constructthe underlying data base for a computable general equilibrium model (CGE) of the NorthKorean economy using cross-entropy estimation techniques. This model incorporatesfragmentary information in a rigorous way and allows us to examine the implications of anumber of alternative scenarios. First, we model a production-oriented recovery program as therestoration of flood-affected lands. We then model an external assistance program as theacquisition of all food aid necessary to attain the United Nations organizations’ estimates ofminimum human needs. The trade-oriented recovery program is modeled as a relaxation ofagricultural import quotas and the importation of food on commercial terms. Finally, we modela systemic reform program as the elimination of quantitative restrictions on all external trade.
We find that only the trade- and reform-centered strategies are likely to provide asustainable solution to North Korea’s problems. Because of North Korea’s lack of comparativeadvantage in the production of grains, the production-oriented strategy fails to attain thecountry’s minimum human needs target. The target could be obtained through internationalassistance, but it appears that this assistance has been motivated by donors’ non-famine-relatedforeign policy goals and may not be sustainable. Higher levels of assistance depress agriculturalprices (and domestic production), rural wages, and the wages of the low skill urban workers,contributing to income inequality. In contrast, not only minimum human needs, but also normalhuman demands are met under the trade-oriented strategy. However, total normal demand ismet only through systemic reform. Under both of the trade- and reform-oriented strategies,GDP rises and wages for all labor groups increase, offering the possibility of a recoverystrategy where everyone gains.
1 We would like to thank seminar participants at the International Food Policy Research Instituteand US Forces Korea for helpful comments on an earlier draft. Mina Kim provided usefulresearch assistance.

Table of Contents
Introduction ................................................................................................................ 1
The Slow-Motion Famine ............................................................................................... 3The Food Balance ............................................................................................... 7Food Diplomacy ................................................................................................. 8
Modeling Alternative Recovery Strategies ......................................................................... 12The Loss and Recovery of Arable Land ................................................................... 14Modeling Quantity Controls in Trade ..................................................................... 15
Data….... ................................................................................................................. 16
Policy Experiments ..................................................................................................... 18
Conclusion................................................................................................................ 22References ................................................................................................................ 23
Appendices
1. A SAM for North Korea ................................................................................. 28
2. Model Description......................................................................................... 29
3. Parameterization ........................................................................................... 36

INTRODUCTION
As well as can be ascertained, North Korea is now into its eighth year of economic decline. It has been
facing food shortages at least since the early 1990s, and is experiencing a famine of unknown severity. US
Congressional staffers who visited the country concluded that from 1995 to 1998 between 900,000 and 2.4
million people had died from starvation or hunger-related illnesses with deaths peaking in 1997 (Kirk
1998). Non-governmental organizations, extrapolating from interviews with refugees in China and
observations on the ground, have produced estimates of famine-related deaths on the order of 2.8-3.5
million. Eberstadt (1998) observes that the number of delegates at the 1998 Supreme People’s Assembly
implied a mid-1998 population more than three million fewer than demographic projections made on the
basis of the 1989 census. If these estimates are accurate, they imply that a double-digit share of the pre-
crisis population of roughly 22 million has succumbed.
Table 1 presents the official North Korean figures on the composition of output. What the data
suggest is that the economy has collapsed around agriculture—that is, the fall in agricultural output has
been actually less dramatic than the decline in output in other sectors. Nevertheless, agriculture has been
adversely affected by the decline in the non-agricultural part of the economy. The two primary fertilizers
used in North Korea, urea and ammonium sulfate, are both petroleum-based, and shortages of petroleum
feedstocks have adversely effected domestic production of fertilizer. A shortage of coal has shut down a
coal-fired fertilizer plant. Periodic blights have been worsened by a shortage of agricultural chemicals.
Fuel shortages and a lack of spare parts have impeded the use of agricultural machinery, forcing the
reintroduction of draught animals. Electrical shortages have interfered with irrigation, which is based
heavily on electrically powered water pumps.
Problems in production have been compounded by difficulties in distribution and in the use of
output. Shortages of fuel and spare parts for vehicles have hampered distribution. At the same time, some
outside observers have questioned the uses to which output has been put: scarce cereals appear to continue
to be used to produce luxury products such as noodles, urban areas with high concentrations of Korean
Workers Party (KWP) members and government officials have received preferential allocations, and it has
been claimed that military stockpiling continues. The end result of these difficulties has been a secular
deterioration in food production and, in the absence of additional imports, a deterioration in the food
balance.
Despite the desperate situation internally, the government maintains the most militarized society on
earth, with more than one million men (and increasingly women) under arms, and estimated 25 percent of
GDP devoted to military expenditures (US ACDA 1997). This point is reinforced if one believes that
certain military or military-related expenditures are hidden in the economic development budget. Estimates

2
of North Korean military manpower and equipment do not reveal anything like this economic decline over
the relevant period. Indeed, US and South Korean defense ministry figures show a slight increase in North
Korean military deployment during this period. This suggests that the non-military part of the economy is
being severely squeezed.
In this highly distorted economy, reform could have enormous benefits, especially in light of the
country’s dire situation. Yet, at the same time, the effects of reform—a significant increase in exposure to
international trade and investment (much of this with South Korea and Japan, two countries with which
North Korea maintains problematic relations), and huge changes in the composition of output, involving
literally millions of workers changing employment—could be expected to have enormous political
implications, and possibly present large, perhaps insurmountable, obstacles to reform under the current
regime.
In this paper we start from incomplete data ridden with gross measurement errors to construct the
underlying data base for a computable general equilibrium model (CGE) of the North Korean economy
using cross-entropy estimation techniques.1This approach is powerful and flexible, allowing us to make full
use of what information we have in whatever form. CGE modeling forces internal consistency. The end
product is a model that incorporates fragmentary information in a rigorous way and allows us to examine
the implications of a number of alternative scenarios. First, starting from the post-shock base, we model a
production-oriented recovery program as the restoration of flood-affected lands. As an alternative to this
production-oriented program, we model an external assistance program as the acquisition of all food aid
necessary to attain the United Nations Development Program (UNDP), World Food Programme (WFP),
and Food and Agricultural Organisation (FAO) estimates of minimum human needs. The trade-oriented
recovery program is modeled as a relaxation of agricultural import quotas and the importation of food on
commercial terms. Finally, we model a systemic reform program as the elimination of quantitative
restrictions on all external trade, which allows the economy to align domestic production according to
comparative advantage. We examine the implications for domestic food availability (as well as other
indicators of welfare) with an eye toward the distribution of income between urban and rural residents. We
do not consider the likelihood of the current regime undertaking
any of these actions, or, indeed, any significant policy changes at all. Rather we simply examine the
possible implications of various alternative actions.
1 Coles and Hammond (1995) develop a rigorous general equilibrium model of famine and demonstrate thatfamine is possible even in a perfectly competitive Walrasian economy, and that all of the classical existenceand efficiency theorems apply. Our paper is, to our knowledge, the first application of CGE modeling to anactual famine.
3
To preview our conclusions, we find that only the trade- and reform- centered strategies are likely
to provide a sustainable solution to North Korea’s problems. Because of North Korea’s lack of
comparative advantage in the production of grains, the production-oriented strategy fails to attain the
country’s minimum human needs target. The target could be obtained through international assistance, but
it appears that this assistance has been motivated by donors’ non-famine-related foreign policy goals. As a
consequence, one cannot be confident that this is a sustainable famine-relief strategy. In addition, higher
levels of assistance depress agricultural prices (and domestic production), rural wages, and the wages of
the low skill urban workers, contributing to income inequality. Higher levels of assistance also crowd out
food imported on commercial terms and, in effect, amount to balance of payments support. How that
support is used depends on government preferences.
In contrast, not only minimum human needs, but also normal human demands are met under the
trade-oriented strategy. However, total normal demand is met only through systemic reform. Under both
of the trade- and reform-oriented strategies, GDP rises and wages for all labor groups increase, offering
the possibility of a recovery strategy where everyone gains (a Pareto improvement).
THE SLOW-MOTION FAMINE
Prior to the partition of the Korean peninsula in 1948, the colder and more industrialized North imported
food from the more fertile South. After the partition, North Korea sought food security through self-
sufficiency, encouraging the production of rice in the southern most provinces, while maize, potatoes, and
other staples were grown in the northern provinces.2
Although as with everything else North Korean, some controversy surrounds the precise timing
and magnitude of North Korea’s agricultural decline, the consensus is that production peaked around 1989
and has fallen significantly since (table 2).3This decline in agricultural production occurred in the context
of an economy-wide crisis. By the late 1980s, North Korea had exhausted its possibilities for extensive
development and defaulted on its international debts, effectively foreclosing its access to international
capital markets. It had fallen out with its primary patron, the Soviet Union, and the value of repayments on
past aid exceeded the inflow of new assistance. The subsequent collapse of the Soviet Union and the break-
up of the Eastern Bloc precipitated an enormous macroeconomic shock. Eberstadt, Rubin, and Tretyakova
2 Eventually the goal of complete self-sufficiency was abandoned. Indeed, in recognition of the deterioratingsituation, agriculture was identified as one of the oxymoronic “three first” priorities in the 21st Plenary sessionof the 6-term Party Central Committee in December 1993, which was repeated in Kim Il Sung’s 1994 NewYear’s Day speech and reaffirmed in the Rodong Sinbum’s 1995 New Year's Day editorial following his death. 3 See H. S. Lee (1994), Lee, Nakano, and Nobukuni (1995), O (1995), and Smith (1998) for discussions ofNorth Korean agriculture.

4
(1995) estimate that in 1991 North Korea suffered a trade shock equivalent to 40 percent of total imports
due to disengagement with the Newly Independent States, and by 1993 Russian exports had fallen to less
than a tenth of their earlier levels.4
With regard to agriculture, in 1991, the government launched a “let’s eat only two meals a day”
campaign which was subsequently intensified; by 1993 persistent, though unconfirmable, reports emerged
of food riots (The Economist, 18 December 1993). By 1994 North Korean radio broadcasts had admitted
the existence of hunger (The Economist, 28 May 1994).5 In May 1995, South Korean President Kim
Young Sam made a public offer of unconditional food assistance to the North. Later that month the North
Korean government admitted that the country was experiencing a food shortage and asked the government
of Japan for assistance. In June, the North Korean government in Pyongyang reached agreements with the
governments of Japan and South Korea to procure emergency food aid, and in July, the Pyongyang
government announced to its public that it was receiving external assistance, though it failed to mention the
South Korean role.
In July and August 1995, North Korea suffered catastrophic floods. The government announced
that 5.4 million people had been displaced, 330,000 hectares of agricultural land had been destroyed, and
1.9 million tons of grain had been lost. The government put the total cost of the flood damages at $15
billion.6 Although outside organizations ultimately formulated far lower estimates of these damages, in
December 1995 the FAO and the WFP issued a issued joint statement that 2.1 million children and
500,000 pregnant women were on the verge of starvation, and the WFP mission warned that “starvation
could possibly affect millions of people in the summer.” In January 1996, the International Committee of
the Red Cross (ICRC) issued a statement that 130,000 people were on the brink of starvation, and 500,000
could be affected by the time of the autumn harvest.
The floods of 1995 were followed by more, though less severe, floods in July 1996, and renewed
appeals for help. These appeals took the form of statements that North Korea was on the brink of a
4 For a more complete description of these shocks see Noland (1996). 5 For examples of the anecdotal evidence emerging on hunger prior to the 1995 floods, see The Economist16 July 1994 and 22 October 1994. At the same time, it should be noted that eyewitness accounts did not painta uniformly grim picture of the situation. Reporting on a May 1995 visit to North Korea, Financial Timescorrespondent John Burton described the people he encountered as looking “adequately fed” (Financial Times,8 May 1995). 6 The most heavily affected areas were the corn growing provinces of Chagang, and North P'yongan in thenorthwest of the country, and the rice producing area of North Hwanghae, south of Pyongyang. The consensusof outside observers is that the damage, while extensive, was not as severe as the government initially claimed.For example, a UN survey concluded that the flooding displaced 500,000 people, not the 5.4 million thegovernment initially claimed. We make use of information on the geographical incidence of the floods in ourmodeling work.
5
famine, though it was not until March 1997 that the WFP provided eyewitness accounts of malnourishment
(WFP, 19 March 1997). By April 1997 the WFP was characterizing North Korea as being “on the knife
edge of a major famine” (WFP, 18 April 1997). Again, these assessments were disputed by independent
observers (Flake 1997). Assessment of the true extent of distress was complicated by the widespread belief
that the North Korean government maintains substantial stockpiles of grain.7
Given the relative scarcity and low fecundity of North Korean arable land, the drive to maximize
output has involved the use of environmentally unsustainable techniques. Continuous cropping has led to
soil depletion and the overuse of ammonium sulfate as nitrogen fertilizer has contributed to acidification of
the soil and a reduction in yields. The need to bring more and more marginal land into production has
caused deforestation which in turn has increased the rapidity of run-off, soil erosion, and river bed silting,
and ultimately to flooding.
In addition to these structural problems, North Korean agriculture is beset by organizational
problems including overcentralization of decision-making and an emphasis on large state farms. Although
there have been anecdotal reports that there has been some introduction of more incentive compatible
systems such as fixed-rent tenancies, in response to the crisis, the extent of these changes is unclear.8
Although flooding precipitated the food crisis in North Korea, agriculture, like the rest of the
7 Estimates of stockpiling range as high as 1-2 years difference between demand and supply (H. S. Lee 1994),and some have questioned the need for external assistance in the presence of government controlled stockpiles.Indeed, South Korean President Kim Young Sam stated that most of the 150,000 tons of rice South Koreadonated to North Korea had been distributed to the military (Korean Newsreview, 29 June 1996). During the1996 US presidential campaign, Republican candidate Bob Dole criticized the Clinton Administration’sdecision to provide aid, claiming that this was “rewarding the enemy” and that the food would go to themilitary (Washington Post, 8 June 1996). Niksch (1996) reports that unnamed US intelligence officials estimatethat the North Korean military has enough food stockpiled to sustain offensive military operations for 90 days,while their ROK counterparts estimate that the North Korean military has stockpiled 1.2 million tons—enoughfor four months during wartime. Military stockpiling has been confirmed by visiting Russian officials, andaltogether an estimated 15-20 percent of annual supplies go into military stockpiles.A slightly higher figure of 1.2-1.5 million tons has been given by an official at the South Korean government’sunification think tank (Park, 1996). An unnamed South Korean official put the level of stocks as enough forten months and South Korean Foreign Minister Gong Ro Myung asserted that these stockpiles were not beingcounted in estimates of North Korea’s shortfall and that the problems in North Korea had been exacerbatedby the regimes unwillingness to release these stocks (Japan Times, 18 January 1996). 8 Agricultural operations are organized into state farms and peasant cooperatives. On the state farms, peasantsare paid fixed salaries. In the case of the cooperatives, which are theoretically owned by the members,members receive equal shares paid in cash and in kind, with bonuses going to work units overfulfilling targets.“In reality, the peasants are reduced to employees in either case” (H. S. Lee, 1994, p. 511). The recenttendency has been to increase the importance of state farms (which are considered ideologically moreadvanced) and to integrate the agricultural sector more firmly into the central plan. However, under the stressof the ongoing crisis, reports have emerged of introduction of limited innovations such as family or subteamresponsibility systems in which families or subteams are granted responsibilities for particular subplots subject

6
economy, has been in secular decline since the beginning of the decade. Even without flooding, North
Korea would have entered the mid-1990s with a substantial apparent food deficit.
Yet while there has been a decline in food production, famine in North Korea is more due to
systemic crisis and a decline in income. It reflects an “entitlement failure” that Sen (1981) argues is
characteristic of many famines. Sen identified the problem as a catastrophic decline in incomes or
entitlements of vulnerable groups, who then face starvation, rather than a failure to produce or supply
enough food.
One could argue that in North Korea vulnerable groups initially lost their entitlement to food due
to political decisions regarding rationing through the government-run Public Distribution System (PDS)
rather than through market forces. Historically, the PDS, a system through which approximately 13.5
million North Koreans (around 62 percent of the population) receive subsidized food rations, has been the
primary mechanism for the distribution of food in North Korea. The main groups outside the PDS are the
workers on state farms, who receive only six months’ rations through the PDS, and workers on
cooperative farms who must depend on on-site production. This latter group appears to have born the brunt
of the losses due to flooding, and has been the main recipient of humanitarian assistance (WFP 1996a).
A government decree promulgated in 1952 stipulates a standard ration that all participants in the
PDS are to receive. However, it is unclear to what extent this promise was ever fulfilled. Over the years
the ration has been reduced ostensively as part of various stockpiling schemes (table 3). In the course of
the current crisis, consumption has been compressed further, and according to one source the standard
adult grain ration has been reduced to around 450 grams per day (WFP 1996b). All eyewitness accounts
(including the personal observations of one of the present authors) indicate that the distribution of hardship
is highly uneven, with those outside the PDS in the flood-affected areas bearing the brunt of the burden.
Some groups and locales appear to be entirely unaffected by the crisis, while widespread reports of
significant famine-related deaths have emerged from other areas. The North Korean government continues
to deny or circumscribe access by outside observers (including humanitarian aid workers). As a
consequence, it is impossible to ascertain with any degree of certainty the magnitude of hardship currently
faced by the population of North Korea.
As the famine has intensified and the PDS mechanism has failed, food is increasingly allocated
through informal markets, and the situation has come more closely to resemble past famines in market
economies described by Ravallion (1987).
to a fixed-rent tenancy. It is impossible to determine how widespread these new institutional arrangements are.

7
The Food Balance
The food balance is a product of the demand for and the supply of food.9 Demand is a function of the
direct, final demand for food by the human population; indirect demand for seed, feed, and industrial uses
(including the manufacture of alcohol); and finally, losses and spoilage. Supply consists of production,
imports, and any drawdown on accumulated stocks. In the case of North Korea, measures of each of these
components are subject to considerable uncertainty.
Consider demand. The major component of demand is direct final consumption by humans. There
are no reliable data on this demand for North Korea. Instead, analysts estimate demand by imputing a
certain degree of consumption or caloric intake per capita and multiplying by the population to obtain
aggregate demand. However, different population groups (children, sedentary adults, manual workers,
etc.) need or desire different amounts of food. So not only does one need information on the population
size, demographic data are essential as well.
Unfortunately, these data do not exist. The most recent population census data, which were
transmitted to the UN in 1997, pertain to 1993. Prior to the release of these data, analysts and relief
agencies had based their calculations on the previous census, done in 1989.10 Two US demographers
analyzed these data and prepared population projections on that basis (Eberstadt and Bannister 1992). It is
telling to note that the raw population estimates used by the WFP, the South Korean National Unification
Board (NUB), and a team of independent researchers, all differ from each other and from the Eberstadt-
Bannister projections. The outside world (and perhaps the North Korean government itself) does not know
how many North Koreans there are, much less their distribution across different demographic categories.
Suppose for a moment that we did have good information on the North Korean population. The
next step would be to estimate caloric intake and assign the sources of caloric intake to different food
groups. Again, there are no data. The estimates of the NUB and WFP apparently use South Korean data as
a starting point and then make speculative adjustments to fit the North Korean case. In practice, differing
assumptions regarding caloric needs and nutritional sources generate significantly different estimates of
demand.11Smith (1998), for example, argues that “the share of rice and maize in total cereal intake has
9 This specification of “needs” or “demands” in physical terms without reference to prices or opportunitycosts may strike economists as odd. This is the normal methodology used by relief agencies however, and wewill subsequently use these figures to calibrate our experiments without further comment. 10 To cite one example, the WFP cites a population estimate around 500,000 lower than the Bannister-Eberstadt projection. One is left with the impression that either by the mid-1990s North Korea had alreadyexperienced serious demographic shocks, or that the only existent demographic model of North Korea isseriously flawed. 11 See Drèze and Sen (1989) for a general discussion of this issue, and H. S. Lee (1994), Lee, Nakano, andNobukuni (1995), and Smith (1998) for applications to the specific case of North Korea.

8
historically been much lower than assumed by international agencies in assessing North Korean per capita
grain consumption (p.57).
Likewise there are no data on indirect demand for seed, livestock feed, and industrial uses such as
the manufacture of alcohol, so these demands are imputed. To recap, every datum needed to estimate
demand—from population to indirect demand for seed—cannot be observed directly and must be
constructed.
How about supply? Again, every relevant datum is missing. The biggest single component of
supply is domestic production. Since production cannot be measured directly, outside observers impute it
by combining estimates of planted acreage and yields. Setting aside the issue of land damaged by flooding,
one could expect that experts could come up with tolerably accurate estimates of planted acreage. Yields
are a different matter, however. The NUB, for example, estimates yields by operating experimental farms
in South Korea and China in which North Korean agricultural techniques are mimicked. The WFP
combines data review on estimated planted acreage and selective field sampling to generate estimates of
yields (WFP 1996). The potential for gross misestimation is substantial. Likewise, no hard data exist for
losses from spoilage, though there are estimates (FAO 1997).
The other major component of supply is imports. In principle one could construct reasonably
accurate estimates of North Korean food imports using export statistics of North Korea’s trade partners.
Unfortunately, this effort faces several difficulties. Most of North Korea’s food imports apparently now
come from China, which has notoriously inaccurate statistics. Moreover, food aid may be misclassified in
the trade statistics of China and other countries. Barter trade is not reported at all, especially barter that
may involve arms or military technology. So there is even uncertainty about supply from external sources.
Lastly, North Korea could be adding to, or more likely, running down, accumulated stocks. As
previously noted, there is considerable disagreement as to the size of these putative stocks and to the extent
to which North Korea may be building or drawing upon inventories.
To conclude, there is fundamental uncertainty about each subcomponent of North Korea’s food
balance. Widely cited figures unfortunately imply a degree of precision and understanding of the situation
wholly unsupported by hard evidence. The outside world does not know how much food North Korea has
nor how much it needs (table 2).
Despite this lack of certainty at the aggregate level, the consensus among virtually all observers is
that at least some population groups in North Korea are being adversely affected by the shortage.
Food Diplomacy
While the ultimate responsibility for North Korea’s predicament lies in Pyongyang, it is abundantly clear

9
that the outside world has played politics with food. The North Korean crisis has been treated as an
opportunity to extract political concessions from the North Koreans. Thus the food crisis, while having a
technical component, has also been a diplomatic issue.
By 1994 North Korea had publicly admitted a food shortage, and in February 1995, World Vision
International, a California-based Christian relief organization, had secured permission from the US and
South Korean governments to raise funds for humanitarian food shipments to the North.12 North Korea had
reportedly concluded an agreement with Thailand to obtain 100,000 tons of rice in 1993, and reached a
second agreement at this time to obtain additional rice in exchange for steel.13
As the situation worsened, North Korea turned to Japan, its former colonial master, presumably
because Japan had substantial reserves in its grain stocks, and it would be less humiliating to accept
assistance from Japan (which could be portrayed as a kind of reparations) than from rival South Korea
(which had smaller reserves, in any event).14 This overture was opposed by the Kim Young Sam South
Korean administration, whose Deputy Prime Minister Woong Bae Rha warned Japan of “soured relations”
if Japan were to provide aid in the absence of South Korean participation—a position not universally held
by South Korean National Assembly members.15
Eventually agreement was reached that South Korea and Japan would jointly provide assistance to
North Korea. According to the plan, South Korea would provide North Korea with 150,000 tons of rice in
unmarked bags, while Japan would provide 150,000 tons gratis and another 150,000 tons on concessional
terms.16 Observers expected this deal to improve relations between not only among North Korea and the
donors, but also between North Korea and the US, which had made improved North-South ties a condition
of closer diplomatic relations. South Korean President Kim Young Sam predicted that the rice deal would
pave the way for the planned summit meeting which had been shelved by the death of Kim Il Sung the
12 Korea Newsreview, 11 February 1995. 13 In the end, the Thais delivered roughly 160,000 tons of rice, but refused to deliver the rest after the NorthKoreans defaulted on their obligations. North Korean also apparently concluded a rice for cement swap withVietnam. A zinc for wheat exchange with the US firm Cargill fell through in June 1997. 14 At the same time, North Korea began accepting donations from United Nations agencies such as UNICEFand the WFP, as well as a wide range of private charities. However the mandate of the UN agencies is fairlynarrowly drawn and the volumes of assistance through these channels has been dwarfed by bilateral assistance.Even fate seemed to conspire against the North Koreans: in March 1996, a vessel bearing the second shipmentof WFP assistance (including all $2 million of US aid) sank en route to the North. Although the cargo wasinsured and could be replaced, the mishap delayed the distribution of emergency supplies. 15 See Korea Times, 31 May 1995 and 9 June 1995. 16 In one of the many strange twists in this strange saga, around this time the government of Japan also beganproviding assistance to the Palestine Liberation Organization around this time. It was the first time Japan hadprovided aid to a quasi-governmental entity with which it did not have formal diplomatic relations. Someobservers interpreted this as paving the way for aid to North Korea, which, like the PLO, does not enjoy

10
previous year.17
This optimism was soon put to rest with the delivery of the first shipload of South Korean rice.
The North Korean authorities, in contravention of the agreement, forced the ship upon entering the harbor
to fly a North Korean flag, and later detained the crew of another relief vessel, charging them with spying.
The outrage in South Korea was predictable, and the Kim Young Sam administration, which had earlier
indicated a willingness to purchase rice on the international market if additional assistance were necessary,
now spoke instead of the impossibility of providing additional rice until the government purchase of the
domestic crop was completed for the year.18 The North Koreans quickly apologized for the incident, which
was interpreted in at least some quarters as an indication of their state of desperation, but already the
damage had been done—the South Koreans began trying to persuade other countries not to provide
additional assistance, and conditioned any further assistance to the North on the opening of bilateral talks.19
Progress was made on this front in the summer of 1997, when South Korea reversed its stance and began
providing additional aid as it became apparent that the seriousness of the situation in North Korea was not
abating. This approach was intensified following the election of Kim Dae Jung in December 1997, and in
1998, South Korea continued to supply North Korea with food.
A similar evolution was occurring in the United States (table 4). As concern about the situation
grew going into 1996, and with no diplomatic breakthroughs in sight, the United States began to adopt a
slightly more assertive posture than South Korea. In June, Secretary of State Warren Christopher
announced that the United States would make a small ($6.2 million) additional contribution to the WFP
appeal.20 This move was widely interpreted as an attempt to induce North Korean participation in a
briefing in preparation for the Four Way Talks, a multilateral diplomatic negotiation on the future of the
Korean peninsula, and adherence to the Agreed Framework, a 1994 accord with the United States on the
diplomatic relations. 17 See Korea Times, 24 June 1995; Korean Newsreview, 1 July 1995. 18 See Korea Times, 23 June 1995 and 11 July 1995. 19 On the first point see John Burton and Edward Luce, Financial Times, 4 July 1995. On the latter point seeWall Street Journal, 14 December 1995. 20 The source of these funds was the storied PL-480 (“Food for Peace”) account. The ability of the US tomake larger bilateral contributions, should it decide to do so, is constrained by North Korea’s membership onthe list of nations sponsoring international terrorism.In the midst of the June 1996 WFP call for additional aid, and diplomatic maneuvering regarding theappropriate response, press reports emerged in South Korea that North Korea received $130 million ininsurance compensation for crop damage in 1994 (see, for example, Washington Post, 13 June 1996 and KoreaTimes, 16 June 1996). If true, this would have dwarfed the amount of the WFP appeal and undercut the casefor providing humanitarian assistance. US State Department officials expressed skepticism regarding themagnitude of the insurance payment, and in the end a consensus of sorts seemed to emerge that the NorthKoreans had only received $13-25 million in compensation (Washington Post, 13 June 1996; Reuters, 14 June

11
North Korean nuclear program. Although the Clinton Administration denied this intention, public
statements by Representative Bill Richardson (D-NM), subsequently UN Ambassador and now Energy
Secretary, who had a series on contacts with the North Koreans seemed to bolster this interpretation.21 The
decision was publicly lambasted by then Republican Presidential nominee apparent Bob Dole and other
prominent Republicans.22 With the crisis continuing into 1997, the US made another, larger, $25 million
donation to the WFP in the spring. In July 1997, former Senator Sam Nunn and former ambassador to
Seoul James Laney visited Pyongyang to pave the way for the anticipated August start of preliminary
discussions to set the agenda for the Four Way Talks. After the Nunn-Laney trip, the US announced a $27
million (100,000 ton) donation of grain, inaugurating a policy of “food for meetings” that would continue
to the present.23 Under this policy, the US provides food aid in exchange for North Korean participation in
a variety of diplomatic negotiations. So, for example, on 10 September 1998, the same day the US and
North Korea announced resumption of suspended missile proliferation and Four Party talks, the New York
Times reported that the US had agreed to send 300,000 tons of grain to North Korea, a report that US
officials were forced to publicly confirm that day.
Looming in the background of this maneuvering has been China. When the Soviet Union withdrew
support for North Korea, China emerged as its major patron, supplying in the early 1990s nearly three-
quarters of its food imports (Flake 1995a; Eberstadt 1995). China had reportedly been providing North
Korea 500,000 tons of grain for free and an additional 200,000-300,000 tons on a concessional basis (Y.
H. Park 1996). After the Chinese government indicated in 1994 that they would demand payment for
future shipments, and exports to North Korea, subsequently dwindled.24 However, apparently concerned
about the worsening situation in the North and growing numbers of North Koreans illegally crossing into
1996; and Financial Times, 27 July 1996). 21 Similarly, Japanese Foreign Ministry officials denied any linkage between Japan's decision to follow theUS lead and offer more aid and the Four Way Talks. Private analysts in Tokyo asserted that this was indeedthe case, however (Reuters, 11 June 1996). South Korean officials, on the other hand, were more explicitabout the linkage between aid and the four-way talks. See Korea Times, 12 June 1996. For its part, NorthKorea commemorated the 46th anniversary of the beginning of the Korean war by blaming the United Statesfor the war and pledging that the country would “annihilate all potential aggressors.” 22 Former Ambassador to South Korea and to China James R. Lilley characterized the Clinton policy aspouring money into a “black hole” in an opinion piece titled “Underwriting a Dictatorship” (Washington Post,19 July 1996). 23 Nevertheless, while the US and South Korea were softening their stance towards the North, Japanmaintained its distance. In July 1997 North Korea made a diplomatic concession to Japan—allowing thespouses of North Koreans to return to Japan to visit their families, in an apparent attempt to soften the Japanesestance. The Japanese had previously announced that such visits were a precondition to assistance. The Japaneseresponded by donating approximately 60,000 tons of rice. 24 Government budget pressures and a declining ability to jawbone state firms into unprofitable operationswere given as the official justification for this policy change.

12
China’s Jilin province, in 1996 the Chinese government announced that it would send 100,000 tons of
grain, and unconfirmed reports indicated that the Chinese would resume shipping 500,000 tons annually.25
If these reports are true, this would make China North Korea’s prime
benefactor. What is known is that food is entering into North Korea from China on concessional,
commercial, and barter terms.26
North Korea, for its part, responded to the crisis in a variety of ways. The regime tacitly removed
some restrictions on mobility to facilitate foraging, and acquiesced in the growth of farmers’ markets.
Local officials took a more assertive role in procuring food supplies, and there were reports of changes in
the organization of agricultural production in some local areas. Increased effort was put into developing
high yield varieties, and the North Korean government, ever masters of the grand gesture, invited Norman
Borlaug, father of the “Green Revolution,” to Pyongyang. Kim Jong Il, the country’s putative leader, was
reported to have visited a military farming complex and urged that they grow more vegetables “in order to
boost combat power” (Reuters, 27 June 1995). The government also appealed to the Group of 7
industrialized countries for assistance prior to the Lyon summit. The rather paltry response elicited from
these appeals reportedly undercut reformist technocrats in the government.27
MODELING ALTERNATIVE RECOVERY STRATEGIES
As noted earlier, natural disasters have reduced arable land in North Korea, exacerbating the food
shortage. Although land recovery could be expected to lead to increased agricultural output and
employment, one can easily question whether a production-oriented recovery strategy would be best for a
country with North Korea’s high ratio of population to arable land, northerly latitude, and short growing
seasons. One could imagine alternative famine recovery and food security strategies based on access to
25 The renewal of aid was announced in July 1996 by the Secretary General of the State Council of China,Luo Gan, during a visit to Pyongyang to commemorate the 35th anniversary of the Sino-North Korean Treatyof Friendship, Cooperation and Mutual Assistance. Observers also pointed to worsening relations betweenChina and South Korea, as evidenced by disputes over the development of a passenger jet and fishing rightsin the Yellow Sea. See Reuters, 13 July 1996, and Financial Times, 16 July 1996. At the same time, Chinawas announcing the provision of aid, North Korea sent its highest ranking delegation to Taiwan to try andprocure assistance from that quarter (Reuters, 25 June 1996). See Snyder (1997) for more discussion ofChina’s relations with North Korea and the food issue. 26 Multiple eyewitness accounts describe North Korean local officials attempting to secure food supplies inChina’s Jilin province. Much of this is apparently barter trade, with the North Koreans bartering scrap metal,marine products, and trees for grain. The cutting down of trees has worsened the deforestation problem andmay contribute to future flooding. However, the freelancing by local officials could be interpreted as systemicdecentralization which could be hard to reverse if and when the crisis abates. 27 See, for example, Financial Times, 12 December 1995. More broadly, the future course of economicpolicy in North Korea is highly uncertain. See Noland (1998) for discussion.

13
imports on commercial terms.
The economy-wide repercussions of production-, aid-, trade-, and reform-centered strategies have
been analyzed using a CGE model. This model starts from a standard neoclassical specification, but then
incorporates disequilibrium in grain markets and severe quantity controls in international trade in all
products, with concomitant distortions in domestic product and factor markets. The markets for goods,
factors, and foreign exchange are assumed to respond to changing demand and supply conditions, which
are affected by government policies, the external environment, and other exogenous influences. The model
can be considered medium-to-long run in that all factors are assumed to be intersectorally mobile. It is
Walrasian in that only relative prices matter. Sectoral product prices, factor prices, and the exchange rate
are determined relative to an aggregate consumer price index, which defines the numeraire.28
The model has eleven sectors: rice, maize, other agriculture/forest/fisheries, mining, light
manufacturing, industrial intermediates, capital goods, construction, public administration, the military,
and services. There are three “demanders”: a single aggregate household which buys consumer goods,
government which spends on goods and public administration, and an aggregate capital account which
purchases investment goods. The government is the sole, and completely price inelastic, demander of
military services. All goods and services are traded internationally with the exceptions of construction,
public administration, and the military. Domestically produced and traded goods are specified as imperfect
substitutes, which provides for a realistic continuum of “tradability” and allows for two-way intersectoral
trade.
To account for the current famine conditions, we assume that there is an infinite demand for grains
at the base price up to the WFP/FAO/UNDP minimum human needs target of 3.7 million metric tons (Q*
in figure 1). (These organizations put “normal” human demand at 4.8 million metric tons and total demand
including seed, livestock, and industrial uses at 7.8 million metric tons.) Beyond this human minimum,
demand is elastic and the market-clearing price falls. This approach implies that production up to 3.7
million metric tons could be absorbed by the economy without a fall in prices received by farmers and any
possible adverse supply response.29 This specification also provides us the benchmark for concessional
assistance in the aid-oriented scenario.
Primary factors of production are three types of land, capital, agricultural labor, high-skill urban
labor, and low-skill urban labor. Aggregate production functions were estimated for aggregate capital and
28 The exchange rate variable in the model can be seen as a price level deflated (PLD) real exchange rate,deflating by the numeraire cost of living index. 29 Technically we model this as an increase in government (PDS) demand which leaves prices unchanged asthe supply curve shifts. In the North Korean context, one could imagine this as simply an increase in PDS

14
labor using data reported in Hwang (1993) and Y. S. Lee (1994). The results are remarkably robust and
plausible given the quality of the underlying data. Constant elasticity of substitution (CES) specifications
yielded estimates of the aggregate substitutability between capital and labor of around unity. In most
specifications, North Korea exhibited slightly negative total factor productivity growth, which is typical of
many pre-reform socialist economies. In the CGE model, sectoral production technology is represented by
a set of CES functions of the primary factors, to account for lower elasticities of substitution in sectors
such as agriculture, mining, and the military. Intermediate inputs are demanded according to Leontief,
fixed input-output coefficients. Labor and capital are intersectorally mobile; land is specific to agriculture,
but mobile within the three agricultural sectors. Migration is permitted between rural and urban low-skill
labor markets.
The Loss and Recovery of Arable Land
Total arable land in North Korea is 1.85 million hectares. Following the FAO (1997) and UNDP (1998),
we distinguish three types of land: high quality land (0.4 million hectares) that is permanently irrigated,
medium quality land (0.65 million hectares) that is not permanently irrigated but capable of supporting rice
production, and non-irrigated lower quality land (0.8 million hectares) suitable only for the production of
other cereals. Since the late 1980’s, rice and maize have been produced on 0.58 million and 0.6 million
hectares of land, respectively. The remaining arable land has been used in the production of other
agricultural produce. All rice production occurs on irrigated, high quality, or medium quality land. Of the
0.6 million hectares allocated for maize, only one third is irrigated. Most of the rest is grown on medium
quality or low quality land that does not have permanent irrigation.
By using the county data from the UNDP (1998), we estimate land lost in the 1995-96 floods
county by county and class by class. About 15 percent of arable land was destroyed, with the incidence of
flooding being higher on high quality land (28 percent) than on medium and low quality land (13 percent).
We use the post-flood land distribution as the base in our simulation, then costlessly restore land in the
“land recovery” scenario. It should be noted that the land recovery is not evenly distributed across the
three types, and, to the extent that different crops use the three types of land in differing intensities, the
Rybczynski effects on the three types of crops will also be unequal.30
deliveries back toward some previous survival ration. 30 The Rybczynski effects refer to the impact of a change in a factor endowment on output quantities. In an“even” international trade model where the number of goods equals the numbers of factors, an increase in afactor endowment will lead to an increase in the production of at least one good and a decrease in theproduction of at least one other. This simple version of the theorem breaks down when the model is “uneven,”includes nontradables, and/or differentiated products, as in the case at hand. Nevertheless, as an empirical

15
Modeling Quantity Controls in Trade
The major distortion in the economy is assumed to be quantitative controls on both imports and exports.31
(The calibration of this distortion is summarized in appendix A.) Demanders are assumed to treat imports
and domestically produced goods as imperfect substitutes (the Armington assumption), and have a sectoral
import demand function that depends on the relative prices of imports and domestically produced goods on
the domestic market. These demand functions are parameterized according to the “normal” levels of
sectoral imports that one would expect North Korea to have without any rationing, given the results from a
gravity model (Noland, Robinson, and Scatasta 1997). Then, we assume the difference between desired
imports and observed imports is due to the imposition of quantity rationing by the government. That is:
where M is imports, D is domestic supply, qr is the quantity rationing rate, and the subscript I refers to the
sector.32
The model also specifies sectoral export supply functions, where the export supply ratio depends
on the ratio of the export price to the price on the domestic market. The supply functions are also
parameterized so that the desired sectoral export ratios are consistent with the results from the gravity
model. Symmetric with the treatment of imports, quantity controls are specified so that actual sectoral
exports are less than desired.
The result is that demanders are forced off their import demand curves and producers are forced
off their export supply curves.33 The distortions are quite large, indicating large potential gains
from liberalizing trade and allowing markets to clear. The trade rationing contributes to major distortions
in the domestic price system, on top of explicit internal taxes.
matter, one may still obtain the counterintuitive result that at constant prices an increase in an endowment cancause a decrease in an output quantity. 31 The major source of revenue for the North Korean government is turnover taxes. But since these areassessed on the basis of the legal status of the transacting enterprises (i.e., the tax on an exchange between twostate enterprises is different than the tax on an exchange between a state enterprise and a social cooperative)sectoral tax rates per se do not exist. In our modeling work we have allocated these receipts more or lessevenly across the industrial sector, with a mild degree of escalation by degree of processing as typically hasbeen the case in other CPEs. 32 This approach to modeling import rationing was first used by Dervis, de Melo, and Robinson (1982), whodiscuss the properties of this approach, including questions of incentive compatibility.
•
D
M qri
i
desired
i = D
M i
i
rationed

16
DATA
The model utilizes two main databases: macroeconomic national accounts and a microeconomic Social
Accounting Matrix (SAM) of North Korea for 1996, the most recent year for which data are available.
The SAM, described in appendix 1, is a consistent array of economic transactions among agents that
reconciles the input-output and national accounts. In estimating the SAM, we had to draw on a variety of
sources, including incomplete national accounts, sectoral production and trade data, and estimates of
government accounts. These data are not only incomplete, but also probably replete with serious
measurement errors.
For the modeling exercise, we need various share coefficients from the SAM, such as sectoral
intermediate-input and value added shares (for production functions) and expenditure shares (for
consumption functions). Our problem is to estimate these coefficients, which requires estimating a
consistent SAM for the base-year of the model, using scarce data measured with unknown error. Using
standard econometric methods, the problem is essentially hopeless—there are not enough data to provide
enough degrees of freedom to estimate the parameters, even if we were willing to make very strong
assumptions about the error generation process—which we are not. However, in contrast to the usual
situation in econometrics, we have a great deal of prior information about the parameters to be estimated.
The structure of the SAM imposes powerful adding-up constraints, and we have information about the
likely values of the various coefficients from a variety of sources, including comparative data from past
periods and from other similar countries. The issue is how to use this information efficiently.
In this situation, we use an estimation approach, which Golan, Judge, and Miller (1996) call
“maximum entropy econometrics”, that draws on information theory. The estimation philosophy is to use
all the information available, including information about the coefficients to be estimated, but not to
assume any information that is unavailable. Our particular estimation approach applied to the SAMs is
described in Golan, Judge, and Robinson (1994) and Robinson, Cattaneo, and El-Said (1998) and
incorporates assumptions of estimation error (errors in variables) and prior knowledge about parts of the
SAM (such as various macro aggregates). We incorporate prior information about the structure of the
SAM by specifying an initial SAM which serves as a prior in the estimation, and reflects all the
information we have (even if inconsistent). We then estimate a new SAM that is not only “close” to the old
SAM—minimizing a “cross entropy” measure of the deviation between the two � but one that also: (1)
satisfies all the adding-up constraints inherent in the definition of a SA; (2) includes any other constraints
33 The degree of sectoral quantity rationing is given in appendix table A.1.

17
such as knowledge about parts of the SAM (e.g., some of the national accounts or other aggregates); and
(3) incorporates stochastic information about constraints involving measurement error. The method is both
flexible and powerful in dealing with scattered and inconsistent data.
With respect to the macroeconomic SAM, we retained the assumption that the North Korean
government makes all investments, but introduced a more elaborate revenue-generating system consistent
with the North Korean data. However, the North Korean data is internally inconsistent and the macro
SAM does not balance. We estimate that base GDP is roughly 32 billion won, higher than the officially
reported 23 billion won. The reason is two-fold. First, the officially reported figure appears to exclude the
military. Second, the officially reported data do not appear to be internally consistent when entered into a
consistent SAM. Even assuming that little investment has occurred and that the capital stock has actually
shrunk, the 1996 figures imply a tremendous decline in output relative to the 1990 SAM constructed by
Noland, Robinson, and Scatasta. This result suggests that either there were very big reductions in factor
supplies or that much of the economy was operating at 10 to 15 percent of capacity. The simplest way to
generate a consistent macro SAM was to assume higher output. While it may well be the case that floods,
famine, and the practice of scrapping capital and bartering it for food have reduced factor supplies, and
utilization of remaining capacity is low, there are also reasons to believe that the actual output is higher
than reported by the authorities.34
With respect to the microeconomic SAM, the inter-industry relations from the Noland, Robinson,
and Scatasta 1990 micro SAM were used as a starting point (or prior), with some adjustments to reflect the
apparent reduction in the capacity utilization rate (or, alternatively, decline in the value of the North
Korean capital stock) and to obtain aggregate consistency with the macro SAM.35
Urban workers are divided into high-skilled (professional, technical, and managerial) and low-
skilled (the remainder). The initial starting point for industry employment structure was taken from pre-
reform Chinese data. The wage premium is calculated on the basis of South Korean data. While one might
expect a priori that wage dispersion in the North would be less than in the South, at this level of sectoral
34 First, they have an incentive to understate output to increase international aid flows. Second, as mentionedin the text, the official data appear to refer only to output or resources controlled by the central planners.Evidence indicates that the military economy and economic activity outside the plan have increased, or at leasthave not decreased as rapidly as formal activity under the plan. Finally, aid flows which account for aconsiderable share of food consumption, do not appear to be included in the official figures. 35 The input-output coefficients contained in the 1990 prior SAM were in turn derived from a pre-reform(1979) Chinese input-output table compiled by the World Bank. This table was constructed using standardnational accounts (SNA) conventions, expanding on the material product accounts (World Bank 1985). Theassumption is that a starting point (or prior) for the inter-industry input-output relations in North Korea is pre-reform China, reflecting their common links to 1970s vintage Soviet manufacturing technology. See Noland,

18
aggregation, the skilled wage premium obtained from the South Korean data is within the dispersion
observed in fragmentary data on North Korean wages.
Land is allocated across the three agricultural activities as described in the previous section. The
share of land in value-added is initially estimated from cross-country comparisons, yielding reasonable
starting estimates of “rental rates” for different types of land.
POLICY EXPERIMENTS
The model is used to run four basic scenarios and the analysis is carried out in ten incremental steps or
experiments.36 In the first scenario, North Korea (costlessly) recovers land and agricultural capital
damaged in the 1995-96 floods. In the second, we inject grains into the economy until domestic availability
reaches the UNDP/WFP/FAO 3.7 million metric ton minimum human needs target. We then augment aid
until the domestic consumption reaches the 4.8 million metric tons “normal human needs” target. In the
third scenario, we remove quantity rationing of agricultural imports. In the fourth scenario, we remove the
quantity rations of all international trade and the economy experiences the static gains from trade
associated with specialization according to comparative advantage.37 As a final variant on this scenario, we
additionally increase agricultural yields to their pre-crisis levels, reflecting the increased availability of
intermediate inputs.
In scenario 1, North Korea costlessly rehabilitates flood-affected lands in 10 successive steps. As
can be seen in figure 2, the impact on GDP is minimal, increasing it by less than 2 percent. Domestic
production of rice and other agricultural commodities increases by around 4 percent and corn production
rises by 24 percent. Domestic food availability remains below the WFP/FAO minimum human needs
target, however (figure 3). (In terms of figure 1, this is the shift in the supply curve from S to S�.)
Employment in agriculture rises, as labor is drawn into the agricultural sectors to complement the increase
Robinson, and Scatasta (1996) for sensitivity analyses. 36 In the figures these experiments are labeled EXP1 through EXP10. They are alternative static equilibria—they do not represent changes over time. 37 The static reallocation effect would certainly not be the only response of the economy to a relaxation ofcontrols on international trade. Noland, Robinson, and Scatasta (1997) and Noland, Robinson, and Wang(1999) analyze the implications of an “obsolescence shock” when the capital stock accumulated under thecentral planning regime is exposed to internationally available technologies and world prices. These two studiesalso investigate the possibility of increases in total factor productivity (TFP) associated with the adoption ofnew technologies and management techniques. Noland, Robinson, and Liu (1997) examine the possibility ofsectorally non-uniform increases in TFP associated with technological convergence between North and SouthKorea. Quantitatively these studies find that the “obsolescence shock” and TFP effects roughly offset eachother, and, in the interests of clarity, these issues are set aside for the purposes at hand.

19
in the land endowment (figure 4).38 The agricultural wage rises slightly (and pulls up the urban low-skilled
wage), while the urban high-skilled wage actually falls slightly as complementary low-skilled workers are
drawn into agriculture (figure 5). There is a modest shift in the distribution of income toward agricultural
labor and capital, and away from urban skilled labor.
The UNDP/WFP/FAO target is attained (by construction) in scenario 2, the aid-oriented strategy.
(In figure 1 the supply curve shifts to S��.) The provision of aid has no direct impact on GDP, though one
could imagine a positive indirect impact through enhanced work effort due to better nutrition and higher
caloric intake. This aid is also non-fungible, by construction.39 Aid above the human minimum needs target
would put the economy on the downward sloping part of the demand curve and affect both domestic
production and the demand for commercial imports.
To investigate this further, we ran an simulation in which we injected aid until domestic
consumption reached the UNDP/WFP/FAO “normal human needs” target of 4.8 million metric tons, i.e.,
so that the supply curve (S���) intersects the demand curve on the downward sloping segment to the right of
Q* in figure 1.
In this scenario, producer prices for agricultural products fall, and aid crowds out both domestic
production and imports on commercial terms. As a consequence, nearly 4 million metric tons of aid are
required to reach the target. As domestic agricultural output declines, rural labor migrates to the cities
putting downward pressure on the wages of low skill urban workers. Nominal wages for urban skilled
labor rise due to the increased supply of complementary factors of production, and the real wages of high
skill workers rises even further due to the decline in the price of food. This result reflects the modeling
assumption that rural and urban low skill labor are substitutes and cross-sectoral migration is possible. It is
also possible that, with sufficient means of social control, a government that wished to maintain the
38 One can think of at least two possible channels by which the impact of the floods could be underestimated.First, if one assumes high substitutability among primary inputs, labor and capital could simply substitute forland. Second, some of the capital stock in the agricultural sector was destroyed in the floods. As a mentalexperiment and check on robustness, a variant of the first experiment was run in which the agricultural capitalstock was augmented as land was recovered. The addition of capital along with land did indeed increase theoutput response, but the impact on GDP was still only around two percent. 39 An issue which could be relevant in North Korea is that the local intermediary (the PDS) could act as arent-extracting monopolist rather than a competitive supplier of aid. Coate (1989) discusses the role ofintermediaries in the context of a formal model of famine relief, focusing solely on the efficiency of alternativefamine relief policies. In the case of North Korea, concerns have been expressed among donors that the NorthKorean government might expropriate rents to support additional military expenditure, and this has been usedas an argument in favor of in-kind food aid. Also of relevance is McGregor (1998), which analyses bothtargeted and non-targeted food distribution and public works famine relief strategies in a general equilibriumcontext without reaching robust analytical conclusion. Donors, who apparently expect targeting, haveexpressed concern that the North Korean government might divert humanitarian aid to the military and other

20
sectoral distribution of labor could impede this process.
Imports of all non-agricultural products increase as aid crowds out imports on commercial terms,
reflecting the fact that money is fungible and aid is a form of balance of payments support. Again, the
specific response reflects the underlying modeling assumptions, in this case that the demand for military
services by the government has been held constant. If military demand were allowed to increase (and
capture some of the rents associated with aid) this would affect the composition of production and trade.
The minimum human needs target is exceeded in the trade-oriented strategy (scenario 3), despite
the fact that agricultural output and employment fall. Indeed, the UNDP/WFP/FAO total demand target of
7.8 million metric tons is nearly met under this strategy, In the trade-oriented strategy, domestic grain
production falls to 1.9 million metric tons, but this decline is offset by an increase in imports to 6.0 million
metric tons. GDP rises by nearly seven percent, as more than one million workers leave agriculture,
primarily for employment in the light manufacturing sector. Wage rates rise for labor groups as well as
capital. Within labor there is a modest shift in the income distribution toward the high-skilled as a
consequence of the increased supply of complementary low-skilled urban workers.
In scenario 4, all quantitative restrictions on international trade in all products are removed. As
indicated previously, this will capture only the static reallocation effect; more subtle impacts of
comprehensive trade reform on the value of the capital stock, the level of TFP, and the degree of internal
distortions are discussed elsewhere.40 As shown in figure 2, this systemic reform increases GDP by more
than 50 percent, indicating the extraordinarily distorted nature of the North Korean economy.41 Domestic
availability of rice and maize on commercial terms more than doubles relative to the base—an increase far
larger than in any of the previous scenarios.
The composition of output changes enormously as light manufacturing, construction, and services
expand, while agriculture, industrial intermediates, and capital goods contract. Within agriculture, the
output of maize increases, as the highly inefficient production of rice is abandoned and land is increasingly
devoted to maize production. Light manufacturing experiences an export explosion, increasing more than
30-fold, and mining exports more than quadruple. Imports rise in all traded goods categories, led by more
than 10-fold increases in rice and capital goods imports.
favored groups. 40 See Noland, Robinson, and Scatasta (1997), Noland, Robinson, and Liu (1997), and Noland, Robinson,and Wang (1999). The latter paper also analyzes the possible “peace dividend” associated with militarydemobilization. 41 In some sense this result is reminiscent of Stewart (1986) who argues that cash relief may be preferableto direct provision of food aid, in that cash relief may have the desirable benefit of sustaining the economicinfrastructure of the famine-affected region.

21
These changes in composition have profound effects on factor usage and returns (figures 4 and 5) .
More than two million workers leave the agricultural sector, and most are re-employed in the light
manufacturing sector. The real wages of agricultural labor and urban low-skill labor nearly double, and the
urban high-skilled wage more than doubles. The rate of return on capital also nearly doubles. The rate of
return on land falls, however, as the increased availability of imported agricultural goods reduces domestic
scarcity, and with it the implicit returns to land. The distribution of income shifts in favor of the urban
high-skilled.
As a final experiment, we estimated the impact of a “complete recovery” scenario in which the
opening to international trade and the increased availability of all kinds of produced intermediates such as
fertilizer and fuel permits North Korea to reattain pre-crisis agricultural yields. In this scenario North
Korean GDP rises more than 70 percent. The main difference between this and the previous “systemic
reform” scenario is that, due to the increased yields, rice production in North Korea actually rises,
increasing 20 percent from the base. Maize production more than doubles. (The production increase is
tilted toward maize, because North Korea’s comparative disadvantage is less intense in maize production.
Under free trade some land formerly used to grow rice is converted to maize production.) The increase in
grain yields boosts the agricultural wage, thus moderating some of the rural-urban migration and reducing
the increase in income inequality that arises, though it should be emphasized that this increase in inequality
occurs as all three categories of labor more than double their wage rates relative to the base.
These results are speculative and subject to a certain degree of spurious precision. Nevertheless,
the modeling work conveys several important points. An aid-oriented strategy could have a variety of
unintended consequences from both the standpoint of the donors and recipient. Since high levels of aid
crowd out domestic production, it depresses the wages of low skill workers and exacerbates income
inequality. And, since high levels of aid also crowd out food imports on commercial terms, this implicit
balance of payments support can be used to finance higher levels of other activities, including military
activities.
Even defined narrowly in terms of domestic food availability, the pay-offs to reform dwarf the
impact of more narrow efforts to raise productivity in agriculture. In other words, far more food could be
procured indirectly through systemic reform than could be obtained directly through international
assistance. The underlying process that generates these gains—massive shifts in the composition of output,
and a tremendous increases in international trade exposure—may or may not be politically acceptable to the
current regime.
22
CONCLUSION
A famine of unknown magnitude is underway in North Korea. In this paper we use a CGE model to
analyze the impact of four recovery strategies: production-oriented, aid-oriented, trade-oriented, and
reform-oriented. We find that only the trade- and reform-centered strategies are likely to provide a
sustainable solution to North Korea’s problems. Because of North Korea’s lack of comparative advantage
in the production of grains, the production-oriented strategy fails to attain the country’s minimum human
needs target. The target could be obtained through international assistance, but it appears that this
assistance has been motivated by donors’ non-famine-related foreign policy goals, and as a consequence,
one cannot be confident that this is a sustainable famine-relief strategy. Moreover, an aid oriented strategy
may have unintended consequences from the standpoints of both the donor and the recipient: high levels of
aid could crowd out domestic production with deleterious internal implications, while the same aid could
crowd out commercial imports, freeing resources for military activities.
In contrast, not only minimum human needs, but also the more ambitious normal human demand
target for grains are met under both the more narrow trade-oriented strategy and the broader reform
strategy. However, the normal total demand (human and non-human uses) target is only achieved through
systemic reform (though the trade-oriented strategy comes close). In both the trade- and reform-oriented
strategies, domestic output of grains actually falls, but this decline is more than offset by increases in
imports on commercial terms. In both cases, there are significant changes in the composition of output and
employment, and greatly increased exposure to international trade. Sectors such as light manufacturing
expand to absorb labor released by the contracting agricultural sector, and wages for both agricultural
labor and urban low skilled labor increase. Even larger wage increases are experienced by urban high-skill
workers as a result of the increase in the supply of complementary low-skill workers.
The current North Korean regime might regard these changes as potentially politically
destabilizing, especially since much of the increase in trade would be with South Korea and Japan, two
countries with which North Korea maintains problematic diplomatic relations.42 As a consequence, the
North Korean regime may prefer a mixed strategy in which attempts to boost domestic food production are
supplemented by the acquisition of external assistance. Since domestic production alone is unlikely to meet
even minimum human needs, such a strategy appears quite limiting. Escape from the famine will almost
surely require at least some liberalization of trade policies.
42 See Noland (1996) for a gravity model analysis of the geographical incidence of trade under reform.
23
References
Coate, Stephen. 1989. Cash Versus Direct Food Relief. Journal of Development Economics 30: 199-224.
Coles, Jeffrey L. and Peter J. Hammond. 1995. Walrasian Equilibrium Without Survival: Existence,Efficiency, and Remedial Policy. In Choice, Welfare, and Development: a Festschrift in Honor ofAmartya Sen, ed. by K. Basu, P. Pattanaik, and K. Suzumura. Oxford: Clarendon Press.
Dervis, Kemal, Jaime de Melo, and Sherman Robinson. 1982. General Equilibrium Models forDevelopment Policy. New York: Cambridge University Press.
Devarajan, Shanta, Jeffrey D. Lewis, and Sherman Robinson. 1994. Getting the Model Right: The GeneralEquilibrium Approach to Adjustment Policy. Forthcoming.
Drèze, Jean, and Amartya Sen. 1989. Hunger and Public Action. Oxford: Clarendon Press.
Eberstadt, Nicholas. 1995. China’s Trade With the DPRK, 1990-1994. Korea and World Affairs 19, no. 4(Winter): 665-85.
Eberstadt, Nicholas. 1998. Development, Structure, and Performance of the DPRK Economy: EmpiricalIndications. Paper presented at the conference Developing Social Infrastructure in North Korea forEconomic Cooperation between the North and the South, Seoul, Korea, 9-10 November.
Eberstadt, Nicholas, and Judith Bannister. 1992. The Population of North Korea. Berkeley, CA: Instituteof East Asian Studies.
Eberstadt, Nicholas, Marc Rubin, and Albina Tretyakova. 1995. The Collapse of Soviet and RussianTrade with the DPRK, 1989-1993. The Korean Journal of National Unification 4: 87-104.
Flake, L. Gordon. 1995. The DPRK External Economy. Paper presented at the Sixth Annual Conventionof the Congress of Political Economists (COPE), International, Seoul, 5-10 January.
Food and Agriculture Organisation. 1997. Special Report: FAO/WFP Crop and Food Supply AssessmentMission to the Democratic People’s Republic of Korea (25 November).
Golan, Amos, George Judge, and Douglas Miller. 1996. Maximum Entropy Econometrics: RobustEstimation with Limited Data. New York: Wiley.
Golan, Amos, George Judge, and Sherman Robinson. 1994. Recovering Information from Incomplete orPartial Multisectoral Economic Data. The Review of Economics and Statistics 76, no. 3: 541-49.
Hwang, Eui-Gak. 1993. The Korean Economies. Oxford: Clarendon Press.
International Monetary Fund, 1997. Democratic People’s Republic of Korea Fact Finding Report (12November).
Kirk, Mark. 1998. Mission to North Korea and China August 11-23, 1998. International RelationsCommittee, US House of Representatives, Washington, processed.

24
Lee, Chan-Woo, Tsutomu Nakano, and Makoto Nobukuni. 1995. Estimate of the Supply and Demand forGrain in the Democratic People’s Republic of Korea: 1995. Niigata, Japan: Economic ResearchInstitute for Northeast Asia (ERINA), Research Division (July). Manuscript.
Lee, Hy-Sang. 1994. Supply and Demand for Grains in North Korea. Korea and World Affairs 18, no. 3:509-54.
Lee, Young Sun. 1994. Economic Integration of the Korean Peninsula: A Scenario Approach to the Costof Unification. In The Korean Economy at a Crossroad, ed. by Sung Yeung Kwack. Westport,CT: Praeger.
McGregor, Pat. 1998. Famine: A Simple General Equilibrium Model. Oxford Economic Papers 50: 623-43.
Niksch, Larry. 1996. North Korean Food Shortages: U.S. and Allied Responses. CRS Report toCongress, Washington, 11 April.
Noland, Marcus. 1996. The North Korean Economy. Joint U.S.-Korea Academic Studies 6: 127-78.
Noland, Marcus. 1998. North Korea in Global Perspective. Paper presented at the conference DevelopingSocial Infrastructure in North Korea for Economic Cooperation between the North and the South,Seoul, Korea, 9-10 November.
Noland, Marcus, Sherman Robinson, and Ligang Liu. 1997. The Economics of Korean Unification.Journal of Policy Reform. Forthcoming.
Noland, Marcus, Sherman Robinson, and Monica Scatasta. 1997. Modeling North Korean EconomicReform. Journal of Asian Economics 8, no.1: 15-38.
Noland, Marcus, Sherman Robinson, and Tao Wang. 1999. Rigorous Speculation: The Collapse andRevival of the North Korean Economy. Working Paper Series No. 99-1. Washington: Institute forInternational Economics.
O, Wonchol. 1995. A Response to North Korea’s Food Crisis. Revised and edited English translation of“Ssalboda Nonsabop Wonjo P’ilyo,” Sin Dong-A (September): 460-76. Canberra: AustralianNational University.
Park, Young-ho. 1996. North Korea’s Food Supply Situation. Korea Focus 4, no. 1: 36-45.
Pyatt, G., and J. I. Round, eds. 1985. Social Accounting Matrices: A Basis for Planning. Washington:World Bank.
Ravallion, Martin. 1987. Markets and Famines. Oxford: Clarendon Press.
Robinson, Sherman, Andrea Cattaneo, and Moataz El-Said. 1998. Estimating a Social Accounting MatrixUsing Cross-Entropy Methods. Trade and Macroeconomics Division Discussion Paper No. 33.Washington: International Food Policy Research Institute.
Sen, A. K. 1981. Poverty and Famines: An Essay on Entitlement and Depression. Oxford: Clarendon

25
Press.
Smith, Heather. 1998. The Food Economy: Catalyst for Collapse? In Economic Integration of the KoreanPeninsula. SPECIAL REPORT 10, ed. by Marcus Noland. Washington: Institute for InternationalEconomics.
Snyder. Scott. 1997. North Korea’s Decline and China’s Strategic Dilemmas. Special Report. Washington:United States Institute for Peace (October).
Stewart, Frances. 1986. Food Aid: Pitfalls and Potential. Food Policy 11: 311-22.
Stone, R., 1986. Nobel Memorial Lectures 1984: The Accounts of Society. Journal of AppliedEconometrics 1: 5-28.
United Nations Development Program. 1998. Thematic Roundtable on Agricultural Recovery andEnvironmental Protection in DPR Korea, Geneva, 28-29 May, processed.
United States Arms Control and Disarmament Agency. 1997. World Military Expenditures and ArmsTransfers 1995-1996. Washington: Department of State.
World Bank, 1985. China: Economic Structure and International Perspective. Washington: InternationalBank for Reconstruction and Development.
World Food Programme. 1996. Special Report: FAO/WFP Crop and Food Supply Assessment Mission tothe Democratic People’s Republic of Korea, Rome, 6 December.

1992 1993 1994 1995 1996
TOTAL 20,875 20,935 15,421 12,802 10,588
Agriculture 7,807 8,227 6,431 5,223 4,775
Industry 4,551 4,689 3,223 2,228 1,556
Construction 1,315 1,256 910 819 508
Other 7,160 6,762 4,858 4,532 6,748
Source: North Korean submission to the IMF
Table 1. COMPOSITION OF OUTPUT, 1992 - 1996
(Millions of US dollars at US$1 = won 2.15)

Table 2 Food balance estimates (million metric tons)
Source: 1989 1990 1991 1992 1993
NUB1 production2 5.48 (5.48) 4.81 (4.86) 4.43 (4.42) 4.27 (4.26) 3.88 (3.88)demand 6.00 6.50 6.47 6.50 6.58imports 0.69 0.86 1.27 0.92 1.09uncovered requirement -0.10 0.14 -0.32 -1.15 -1.22
LNN1 production 5.66 5.79 5.72 5.84 5.82demandimports 0.66 0.60 1.29 0.83 1.09uncovered requirement 0.22 0.29 0.38 -0.58 -0.46
WFP1 productiondemandimportsuncovered requirement
North Korea productiondemandimportsuncovered requirement
EDCC productiondemandimports1 0.52 1.26 0.92 1.35uncovered requirement
USDA/FAS1 production 5.08 4.30 3.90 3.72demandimportsuncovered requirement
H. Smith1 production 5.21 5.48 4.81 4.43 4.27demand2 6.00 6.20 6.40 6.50 6.58imports3 0.69 0.86 1.27 0.92 1.09uncovered requirement
P.W. Lim1 production2 4.81 4.43 4.27demand min. 460 g per personimports3 1.29 0.83 1.09uncovered requirement
Roundtable production1 7.58 7.26 7.27 7.06 7.5demandimports2
uncovered requirement
FAO production1 4.94 4.55 4.24 3.91demandimportsuncovered requirement
IMF1 productiondemand2
importsuncovered requirement
FAO/WFP1 productiondemandimportsuncovered requirement

Source: 1994 1995 1996 1997
NUB1 production2 4.13 (4.12) 3.45 (3.45) 3.70 (3.68) 3.48 3
demand 6.67 6.72imports 0.60 0.89uncovered requirement -2.19 -1.70
LNN1 production 5.85 5.90 2.84demandimports 0.36 0.75 5.55uncovered requirement -1.61 -1.02 -1.04
WFP1 production 4.08 2.84demand 5.99 5.55 5.36importsuncovered requirement -1.91 -1.04 -1.83
North Korea production 7.64demand 5.76importsuncovered requirement 3.88
EDCC productiondemandimports1 0.40 0.89 0.97uncovered requirement
USDA/FAS1 production 3.42 3.82 3.38 3.18 3.10 (est)demandimportsuncovered requirement
H. Smith1 production 3.88 4.13 4 3.76/3.45/4.08 5 2.84/2.87 6,7
demand2 6.67 6.72 7.64/5.78(6.73)/5.55 5 5.36/4.97 6
imports3 0.60 0.89 8 ?/1.02/1.02 5,9 0.53/0.75 6
uncovered requirement
P.W. Lim1 production2 3.88 4.13 4 3.45 3.69 5
demandimports3 0.49 0.96 1.05 1.44 6
uncovered requirement
Roundtable production1 5.73 2.77 1.81 2.11demandimports2
uncovered requirement
FAO production1 4.20 3.56 3.74 2.94demandimportsuncovered requirement
IMF1 production 2.50demand2 7.80imports 0.60uncovered requirement 3.80
FAO/WFP1 production 4.10 2.90 2.66demandimportsuncovered requirement
Table 2.Continued

Notes:NUB - (1) Milled equivalents.
(2)Numbers in parentheses as reported by H. Smith. NUB/RDA estimates include rice, maize, other cereals, beans, and potatoes.
(3) North Korea Grain Summary , USDA/FAS (Mar 1998)LNN - (1) Milled equivalents. Uses NUB for production data.WFP - (1) Milled equivalents. Reports estimated production for one calendar year and demand and uncovered imports for following year.North Korea - (1) Milled equivalents.EDCC - (1) Grain and flour, including rice, corn, wheat, and barley. Figures for before 1994 in Asia and Pacific Rim Report WRS-94-6,
USDA/ERS (1994). Figures for 1994 and beyond from John Dyck at USDA, who was also responsible for construction of data in USDA./ERS report.
USDA/FAS - (1) Total grains, including rice, corn, and wheat/barley.Smith - (1) Table 1, Chun (1996)
(2) Estimates by Rural Development Agency (RDA). Total demand includes demand for food and demand for other uses. (3) Kim (1995)(4) Loss of grain stock due to floods is not considered.(5) Assessment of Damage and Immediate Relief Requirements Following Floods , UN Dept of Humanitarian Affairs (12 Sept 95) /
NUB/RDA (based on actual food rationing) / Special Alert 267 and 270 , FAO/WFP (May and Sept 96)(6) FAO/WFP (Dec) / FAO/WFP (June)(7) Net of flood losses. Assumes advance consumption of 50% maize and potato crop and grain imports of 500,000 MT. (8) United Nations (1995)(9) Adjusted by author on basis of final import data for 95/96.
Lim - (1) Includes pulses and tubers.(2) Previous year. Estimates of North Korea's Grain Output , RDA.(3) Current year. North Korea's Trade in 1996 , KOTRA (1997). (4) Not accounting for storage losses due to flooding (626,000 tonnage according to Pyongyang).(5) Not accounting for prematurely consumed maize.(6) Preliminary: commercial imports of 660,000 tons plus food aid of 780,000 tons.
Roundtable - (1) Rice (milled equivalent) and corn. DPRK Agricultural Commission.FAO - (1) Rice milled equivalents. Includes wheat, rice, barley, maize, rye, oats, millet, and sorghum. IMF - (1) As reported by authorities.
(2) Normal demand estimate (human consumption, animal feed, industrial use, see, and other). 4.8 MT for human consumption.FAO/WFP - (1) North Korea Grain Summary , USDA/FAS (Mar 1998)
Table 2.Continued
Table 3 Standard rations
Daily Ration (grams)
official net of official standard reductions
Children under 6 300 234Children 7-15 500 390Adult worker 700 546Soldier 800 694Elderly 300 234
Note: WFP reports that standard adult daily ration has been unofficially to 450 grams.
Source: NUB, as reported by Yoo Young Ock, ANorth Korean Economic Situation,and the Possibilities for South-North Economic Cooperation,@ East Asian Review 8,no. 1: 69.
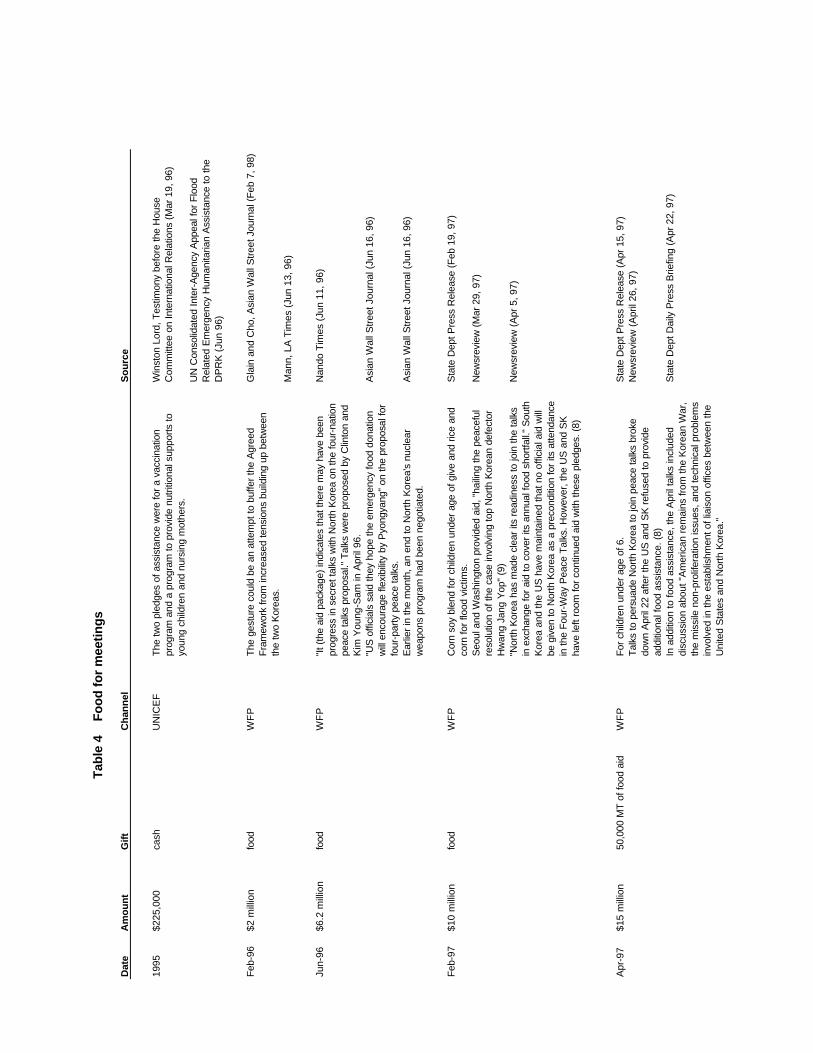
Tab
le 4
F
oo
d f
or
mee
tin
gs
Dat
eA
mo
un
tG
iftC
han
nel
So
urc
e
1995
$225
,000
cash
UN
ICE
FT
he tw
o pl
edge
s of
ass
ista
nce
wer
e fo
r a
vacc
inat
ion
prog
ram
and
a p
rogr
am to
pro
vide
nut
ritio
nal s
uppo
rts
to
youn
g ch
ildre
n an
d nu
rsin
g m
othe
rs.
Win
ston
Lor
d, T
estim
ony
befo
re th
e H
ouse
C
omm
ittee
on
Inte
rnat
iona
l Rel
atio
ns (
Mar
19,
96)
UN
Con
solid
ated
Inte
r-A
genc
y A
ppea
l for
Flo
od
Rel
ated
Em
erge
ncy
Hum
anita
rian
Ass
ista
nce
to th
e D
PR
K (
Jun
96)
Feb
-96
$2 m
illio
nfo
odW
FP
The
ges
ture
cou
ld b
e an
atte
mpt
to b
uffe
r th
e A
gree
d F
ram
ewor
k fr
om in
crea
sed
tens
ions
bui
ldin
g up
bet
wee
n th
e tw
o K
orea
s.
Gla
in a
nd C
ho, A
sian
Wal
l Str
eet J
ourn
al (
Feb
7, 9
8)
Man
n, L
A T
imes
(Ju
n 13
, 96)
Jun-
96$6
.2 m
illio
nfo
odW
FP
"It (
the
aid
pack
age)
indi
cate
s th
at th
ere
may
hav
e be
en
prog
ress
in s
ecre
t tal
ks w
ith N
orth
Kor
ea o
n th
e fo
ur-n
atio
n pe
ace
talk
s pr
opos
al."
Tal
ks w
ere
prop
osed
by
Clin
ton
and
Kim
You
ng-S
am in
Apr
il 96
.
Nan
do T
imes
(Ju
n 11
, 96)
"US
offi
cial
s sa
id th
ey h
ope
the
emer
genc
y fo
od d
onat
ion
will
enc
oura
ge fl
exib
ility
by
Pyo
ngya
ng"
on th
e pr
opos
al fo
r fo
ur-p
arty
pea
ce ta
lks.
Asi
an W
all S
tree
t Jou
rnal
(Ju
n 16
, 96)
Ear
lier
in th
e m
onth
, an
end
to N
orth
Kor
ea's
nuc
lear
w
eapo
ns p
rogr
am h
ad b
een
nego
tiate
d.A
sian
Wal
l Str
eet J
ourn
al (
Jun
16, 9
6)
Feb
-97
$10
mill
ion
food
WF
PC
orn
soy
blen
d fo
r ch
ildre
n un
der
age
of g
ive
and
rice
and
corn
for
flood
vic
tims.
Sta
te D
ept P
ress
Rel
ease
(F
eb 1
9, 9
7)
Seo
ul a
nd W
ashi
ngto
n pr
ovid
ed a
id, "
haili
ng th
e pe
acef
ul
reso
lutio
n of
the
case
invo
lvin
g to
p N
orth
Kor
ean
defe
ctor
H
wan
g Ja
ng Y
op"
(9)
New
srev
iew
(M
ar 2
9, 9
7)
"Nor
th K
orea
has
mad
e cl
ear
its r
eadi
ness
to jo
in th
e ta
lks
in e
xcha
nge
for
aid
to c
over
its
annu
al fo
od s
hort
fall.
" S
outh
K
orea
and
the
US
hav
e m
aint
aine
d th
at n
o of
ficia
l aid
will
be
giv
en to
Nor
th K
orea
as
a pr
econ
ditio
n fo
r its
atte
ndan
ce
in th
e F
our-
Way
Pea
ce T
alks
. How
ever
, the
US
and
SK
ha
ve le
ft ro
om fo
r co
ntin
ued
aid
with
thes
e pl
edge
s. (
8)
New
srev
iew
(A
pr 5
, 97)
Apr
-97
$15
mill
ion
50,0
00 M
T o
f foo
d ai
dW
FP
For
chi
ldre
n un
der
age
of 6
. S
tate
Dep
t Pre
ss R
elea
se (
Apr
15,
97)
Tal
ks to
per
suad
e N
orth
Kor
ea to
join
pea
ce ta
lks
brok
e do
wn
Apr
il 22
afte
r th
e U
S a
nd S
K r
efus
ed to
pro
vide
ad
ditio
nal f
ood
assi
stan
ce. (
8)
New
srev
iew
(A
pril
26, 9
7)
In a
dditi
on to
food
ass
ista
nce,
the
Apr
il ta
lks
incl
uded
di
scus
sion
abo
ut "
Am
eric
an r
emai
ns fr
om th
e K
orea
n W
ar,
the
mis
sile
non
-pro
lifer
atio
n is
sues
, and
tech
nica
l pro
blem
s in
volv
ed in
the
esta
blis
hmen
t of l
iais
on o
ffice
s be
twee
n th
e U
nite
d S
tate
s an
d N
orth
Kor
ea."
Sta
te D
ept D
aily
Pre
ss B
riefin
g (A
pr 2
2, 9
7)

Mis
sile
talk
s w
ill b
e he
ld b
etw
een
Nor
th K
orea
and
the
US
in
New
Yor
k in
May
. S
tate
Dep
t Dai
ly P
ress
Brie
fing
(Apr
22,
97)
Jul-9
7$2
7 m
illio
n10
0,00
0 M
T o
f foo
d ai
dW
FP
Tar
gete
d to
chi
ldre
n an
d th
e el
derly
. S
tate
Dep
t Dai
ly P
ress
Brie
fing
(Jul
14,
97)
On
June
30,
Nor
th K
orea
acc
epte
d th
e pr
opos
al b
y th
e U
S
and
Sou
th K
orea
for
Fou
r-P
arty
pea
ce n
egot
iatio
ns.
Pre
pato
ry ta
lks
will
be
held
in N
ew Y
ork
on A
ugus
t 5.
Sta
te D
ept P
ress
Rel
ease
(Ju
n 30
, 97)
Bila
tera
l mee
tings
will
be
held
in N
YC
in p
repa
ratio
n fo
r th
e F
our-
Par
ty p
lena
ry s
essi
on in
Gen
eva
on S
ept 1
8 an
d 19
. N
orth
Kor
ea in
its
offic
ial a
nnou
ncem
ent t
hat i
t was
ac
cept
ing
men
tione
d so
me
sort
of a
gree
men
t with
the
US
.
Sta
te D
ept D
aily
Pre
ss B
riefin
g (S
ep 1
1, 9
7)
"The
US
dec
isio
n co
mes
thre
e w
eeks
bef
ore
a cr
ucia
l m
eetin
g in
New
Yor
k of
Nor
th K
orea
, Sou
th K
orea
n,
Chi
nese
and
US
offi
cial
s to
dec
ide
the
timin
g, lo
catio
n an
d ag
enda
for
futu
re n
egot
iatio
ns o
n a
perm
anen
t pea
ce tr
eaty
en
ding
the
1950
-53
Kor
ea W
ar -
a n
egot
iatio
n th
at N
orth
K
orea
has
freq
uent
ly li
nked
to th
e pr
ovis
ion
of a
dditi
onal
fo
od a
id."
(A
15)
Sm
ith, W
P (
Jul 1
5, 9
7)
FT
(Ju
l 15,
97)
Oct
-97
$5 m
illio
ngr
ant
UN
ICE
FN
K a
gree
d to
adm
it 10
food
rel
ief m
onito
rs in
add
ition
to
the
seve
n m
onito
rs a
lread
y th
ere.
Ear
lier,
the
US
AID
had
w
arne
d, "
we
will
not
pro
vide
ass
ista
nce
unle
ss th
ere
is
effe
ctiv
e m
onito
ring.
"
AP
(O
ct 1
2, 9
7)
Sta
te D
ept D
aily
Pre
ss B
riefin
g (O
ct 1
4, 9
7)
Feb
-98
$75
mill
ion
200,
000
MT
WF
PO
n F
eb 6
, Sou
th a
nd N
orth
Kor
ea, t
he U
nite
d S
tate
s an
d C
hina
dec
ided
"to
ope
n an
ad
hoc
com
mitt
ee m
etin
g in
G
enev
a ne
xt m
onth
in p
repa
ratio
n fo
r a
four
-par
ty d
ialo
gue
on K
orea
affa
irs."
(4)
New
srev
iew
(F
eb 1
4, 9
8)
Sta
te D
ept D
aily
Pre
ss B
riefin
g (F
eb 5
, 98)
Sep
-98
300,
000
MT
of w
heat
WF
PD
PR
K h
as a
gree
d to
res
ume
mis
sile
talk
s on
Oct
1. D
PR
K
has
agre
ed to
atte
nd a
third
ple
nary
of t
he F
our
Par
ty T
alks
in
Oct
ober
. DP
RK
has
agr
eed
to c
ontin
ue d
iscu
ssio
n ab
out
US
con
cern
s of
und
ergr
ound
con
stru
ctio
n in
Nor
th K
orea
. D
PR
K a
lso
agre
ed to
res
tart
talk
s on
bei
ng r
emov
ed fr
om
US
list
of s
tate
-spo
nsor
s of
terr
oris
m.
Sta
te D
ept P
ress
Rel
ease
(S
ept 1
0, 9
8)
"Whi
le A
mer
ican
offi
cial
s ro
utin
ely
insi
st th
at fo
od a
id is
de
cide
d on
hum
anita
rian
grou
nds,
and
is n
ever
use
d as
a
barg
aini
ng c
hip,
dip
lom
ats
from
oth
er c
ount
ries
mon
itorin
g th
e ta
lks
say
the
cont
ainm
ent o
f the
nuc
lear
mat
eria
l was
a
key
cond
ition
." (
?)
San
ger,
NY
T (
Sep
t 10,
98)
Sta
te D
ept P
ress
Rel
ease
(S
ept 2
1, 9
8)ht
tp://
ww
w.s
tate
.gov
/ww
w/r
egio
ns/e
ap/k
orea
_nor
th_f
ood_
aid_
1997
.htm
l
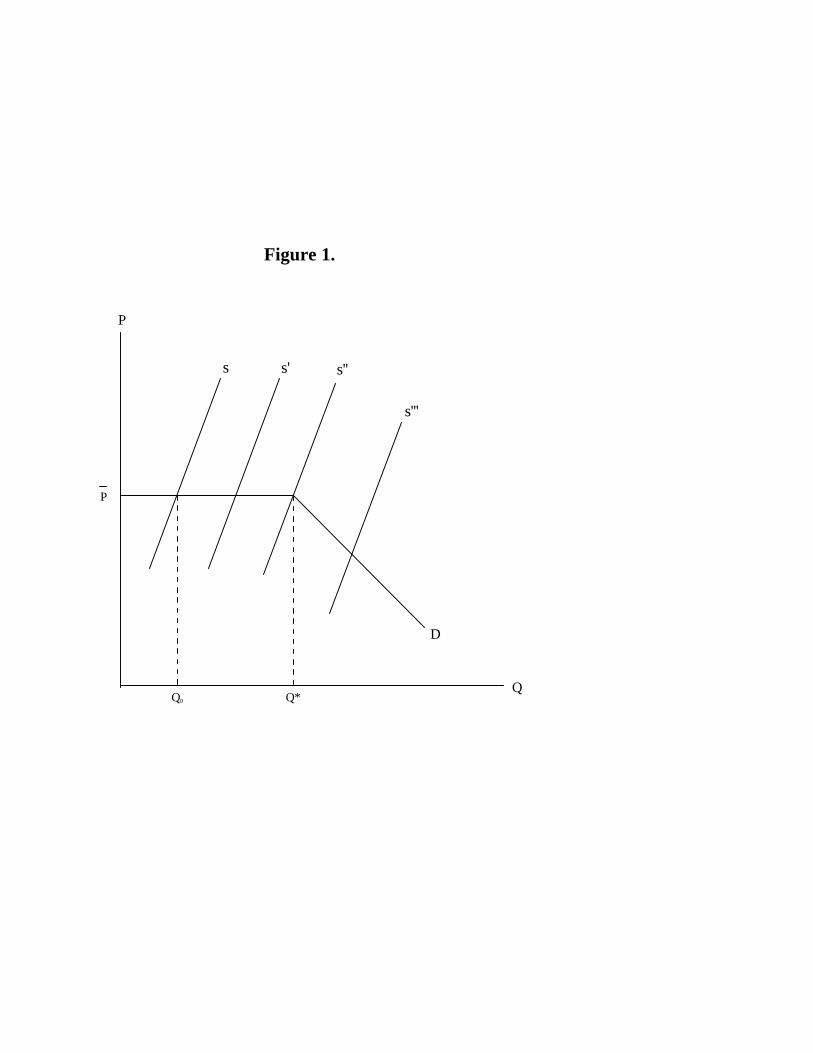
s s' s''
s'''
D
P
QQ*Q0
P
Figure 1.

Fig
ure
2.
RE
AL
GD
P
30354045505560
12
34
56
78
910
1112
Exp
erim
ents
Real GDP (Billions of N.K. Won)
Sce
nario
1: L
and
Rec
over
yS
cena
rio 2
: Foo
d A
idS
cena
rio 3
: AG
Sec
tor
Tra
de L
iber
aliz
atio
nS
cena
rio 4
: Sys
tem
ic R
efor
m

Fig
ure
3.
GR
AIN
AV
AIL
AB
ILIT
Y
0.00
2.00
4.00
6.00
8.00
10.0
0
12.0
0
14.0
0
Bas
eS
cena
rio 1
: Lan
d R
ecov
ery
Sce
nario
2: F
ood
Aid
Sce
nario
3: A
G S
ecto
rT
rade
Lib
eral
izat
ion
Sce
nario
4: S
yste
mic
Ref
orm
Grain Availability (Millions of Metric Tons)
Out
put
Impo
rts
Aid
Min
imum
Hum
an N
eed
= 3
.7 M
MT
Nor
mal
Hum
an D
eman
d =
4.8
MM
T
Nor
mal
Tot
al D
eman
d =
7.8
MM
T

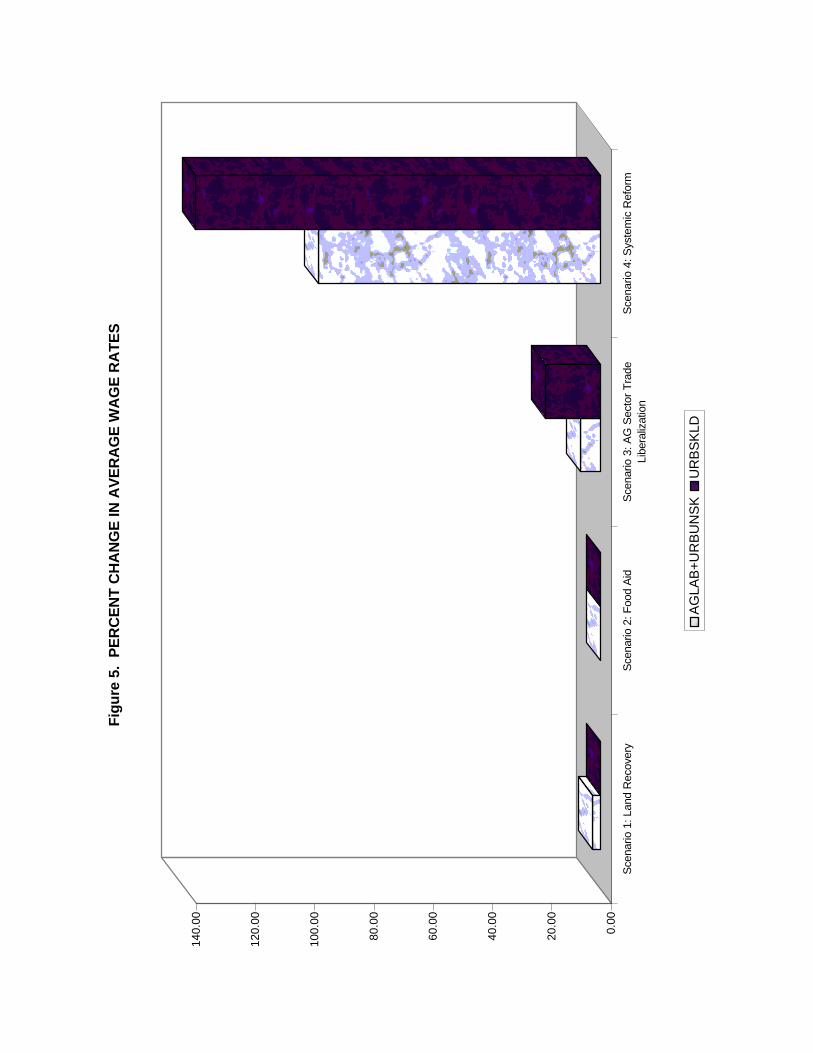
0.00
20.0
0
40.0
0
60.0
0
80.0
0
100.
00
120.
00
140.
00
Sce
nario
1: L
and
Rec
over
yS
cena
rio 2
: Foo
d A
idS
cena
rio 3
: AG
Sec
tor
Tra
deLi
bera
lizat
ion
Sce
nario
4: S
yste
mic
Ref
orm
Fig
ure
5.
PE
RC
EN
T C
HA
NG
E IN
AV
ER
AG
E W
AG
E R
AT
ES
AG
LAB
+U
RB
UN
SK
UR
BS
KLD
28
Appendix 1
A SAM for North Korea
A Social Accounting Matrix (SAM) provides a tabular snapshot of the economy at one point in time.
Each non-zero cell in the SAM represents the value of an economic transaction between actors. The
accounts of the SAM define the transactions and income flows among five basic actors in the economy:
producers/enterprises, households, government, capital account and the rest of the world. The input-
output notion of inter-industry linkages is generalized to the idea that each actor’s purchase is another
actor’s sale. Any flow of money from one actor to another is recorded in the SAM as a payment by
some actor (the column) to some other actor (the row). The SAM also generalizes the national income
accounting notion that income equals expenditure. The SAM must in fact be balanced: the sum of each
column must equal the sum of each row, so that a budget constraint is imposed on each productive
sector, labor category, household type, and so forth. This means that (1) costs (plus distributed
earnings) exhaust revenues for products, (2) expenditure (plus taxes and savings) equals income for
each agent, and (3) demand equals supply for each commodity.
The SAM is divided into a number of blocs. The Activities bloc describes the costs and
revenues for domestic producers. In the columns, the producers buy intermediate inputs, make value-
added payments to primary factors and transfer indirect, value-added, and export taxes to (or receive
subsidies from) the government. In the rows they sell goods on domestic and foreign markets. The
Commodities bloc describes markets for final products. The row describes sales on the domestic
market, distinguishing between intermediate, consumption and investment demand. The column
identifies absorption, which equals the value of domestic products sold on the domestic markets plus
imports (valued at world prices), consumption taxes, value-added taxes, and tariffs. The Factors bloc
describes value-added payments to primary factors (in the row) and their distribution to specific
institutions (enterprises, households, and government) plus the payment of direct factor taxes (in the
column). The remaining blocs describe transfers among institutions.
For a detailed treatment of Social Accounting Matrices see Pyatt and Round (1985), Stone
(1986), or Devarajan, Lewis and Robinson (1994).


29
Appendix 2Model Description
Six equation “blocks” are distinguished.
Price Equations
On the import side the model incorporates the “small-country” assumption: equation 1 gives the
domestic price of sectoral imports in terms of exogenous world prices, the exchange rate and tariff
rates. North Korea is also assumed to be small on the export side; equation 2 shows that the domestic
price of sectoral exports is determined by world prices, exchange rate, and any applicable export
subsidy or tax, depending on the sign of parameter te. Trade distortions are modeled as quantitative
restrictions and affect the quantity equations (see next section). The major form of internal distortion is
assumed to be indirect turnover taxes.
Consumers buy a composite consumption good and producers sell a composite production
good. Their sectoral prices are the weighted averages of the domestic prices of their components, as
shown in equations 3 and 4.
A value added (or net) price is defined in equation 5 as the unit value of output minus the cost
of intermediate inputs. These are priced on the basis of PC, the consumption price of composite goods,
defined in equation 6 as the adjustment of the composite consumption good price by final consumption
tax rates.
Finally, in equation 7 a cost of living index, defined as a weighted average of sectoral
commodity prices, is fixed as the numeraire.1
Quantity Equations
Sectoral production technology is represented in equation 8 by a set of constant elasticity of substitution
(CES) functions of the primary factors—the three types of land, capital and the three types of labor
(rural, urban high skill and urban low skill). Equation 9 shows the sectoral demand for primary factors.
Their remuneration is set equal to the value added price (net of both indirect taxes and intermediate
input costs) times the partial of the production function with respect to each factor. Equation 9 therefore
also represents the first-order conditions for profit maximization. Factor demand equations assume that
primary factors are paid the same average rental rate (WF) , but the model allows for distortions in
1 The weights being equal to the share of each sector in total consumption.
30
factor markets through sector-specific parameter (wfdist) which measures the extent to which the
sectoral marginal revenue product of the factor deviates from its average return. Equation 10 specifies
the Leontief intermediate input demand function, based on fixed input-output coefficients.
Each sector is assumed to produce differentiated goods for the domestic and export markets.
Equation 11 shows that producers decide how to subdivide their total sectoral output as a constant
elasticity of transformation (CET) function of the amounts sold in the two markets. Subject to this
transformation function, producers maximize revenue from sales. The first-order conditions yield
equation 12, which expresses the ratio of exports to domestic sales in terms of the ratio of their prices.
Similarly, imported and domestic products are differentiated at the sectoral level, equation 13 indicating
the composite (consumption) good as a CES aggregate. Consumers minimize the cost of obtaining a
given amount of composite good, resulting in a relationship between the ratio of the amounts imported
and domestically produced and the ratio of their prices (equation 14). Such product differentiation
permits two-way trade and provides some autonomy to the domestic price system not found in models
that assume perfect substitutability between domestic products and imports in consumption and between
domestic and export markets in production.
Initially, the economy’s market equilibrium is computed with parameters which are
benchmarked on the basis of the analysis presented earlier. The central planners impose a rationing
solution which implicitly puts the economy on a lower transformation function than would be attainable
in the absence of rationing.2 The gravity model results provide an indication of the extent to which
rationing reduces aggregate trade. The commodity analysis of North Korea’s competitiveness was used
to parameterize the measure in which rationing was binding at the sectoral level. Finally, the curvatures
of the CET functions were parameterized along the lines of previous studies as to the degree of intrinsic
differentiation of the commodity aggregates.
For the specific case of North Korea, equations 12 and 14 are modified to introduce restrictions
to free trade in the form of export and import quantity rationing ratios. Such rationing greatly distorts
the composition production and demand, but does not involve direct spillovers in other markets through
wedges in relative prices. Still, the rationing of exports and imports distorts producers’ and consumers’
decisions on both domestic and external markets. Therefore, this formulation enables us to model
economy-wide distortions by introducing quantitative restriction only on the external side of the
economy.
2 See Noland, Robinson, and Scatasta (1997) for more detail and a diagramatic exposition.

31
Income and Expenditure Equations
Equation 15 combines the incomes, across production sectors, accruing to each of the primary factors.
Equation 16 represents a compact formulation of three equations which simultaneously
determine real government expenditure, nominal private consumption, and nominal investment demand.
The three expenditure aggregates are derived from the distribution of total factor income to the
economy’s institutions (households and enterprises) and finally from its allocation to the three
expenditure categories. This set of equations simply reproduces the flows which are represented in the
macroeconomic Social Accounting Matrix (SAM).
In the closure section of the model—not entirely shown to avoid clutter—non-grain government
expenditure is held constant at the base value, while investment and household consumption adjust in
response to changes in income induced by the policy experiments. The trade balance is fixed and the
real exchange rate is allowed to adjust endogenously.3
The next three equations specify the sectoral composition of the expenditure aggregates.
Sectoral private consumption is based on a Cobb-Douglas utility function, with constant expenditure
shares (equation 17). Government demand by non-grain sectors is given by constant shares of real
government non-grain spending (equation 18). Real fixed investment by sector of origin is determined
in equation 19. The CGE model is static. Investment is only a category of final demand, with no effect
on the capital stock in the period, and so has no role in the supply side of the model.
Market-Clearing Conditions
The remaining equation block presents the market-clearing conditions. Equilibrium in product markets
is represented in equation 20, equating supply of the composite good in each sector to the sum of
product demands. Equation 21 specifies equilibrium in each factor market; total factor supply is fixed
and the equilibrating variable is the average factor price (WFf). External balance is portrayed in
equation 22, which specifies a fixed aggregate balance of trade.
Altogether, the model has 277 endogenous variable and 278 equations. However, the model
satisfies Walras’ Law, and the number of independent equations is equal to the number of endogenous
variables.
3 Alternatively one could fix the real exchange rate and allow the trade balance to adjust. In point offact, the results of the policy experiments are quite similar under this alternative closure.

32
Appendix 2Equations of the North Korea CGE model
Price Equations
1. EXR )tm + (1 pwm = PM iii •• Import prices
2. EXR )te - (1 pwe = PE iii •• Export prices
3.Q
M PM + D PD = PQi
iiiii
••Composite good prices net of cons. taxes
4.X
E PE + D PD = PXi
iiiii
••Average producer prices
5. a PC - )tx-(1 PX = PV jijj
iii •• Σ Value added prices net of indirect taxes
6. )tc + (1 PQ = PC iii • Consumption prices of composite good
7. )PC( = PINDEX pwcsi
i
i∏ Numeraire consumer price index
Quantity Equations
8. )FDSC( CESP = X fi,i CES Production function
9. FDSC a ])FDSC a([ ad PV = wfdist WF 1-p-fi,fi,
1-overp-1p-fi,fi,
fiifi,f
iii •••••• ΣDemand function for primary factors (Firstorder condition for profit maximiz.)
10. X a = TIN jjij
i •Σ Total intermediate uses
11. ) E ,D ( CET = X iii Exports transformation frontier
12.
•
PD
PE CET ratex = D
E
i
i*i
i
i Export supply
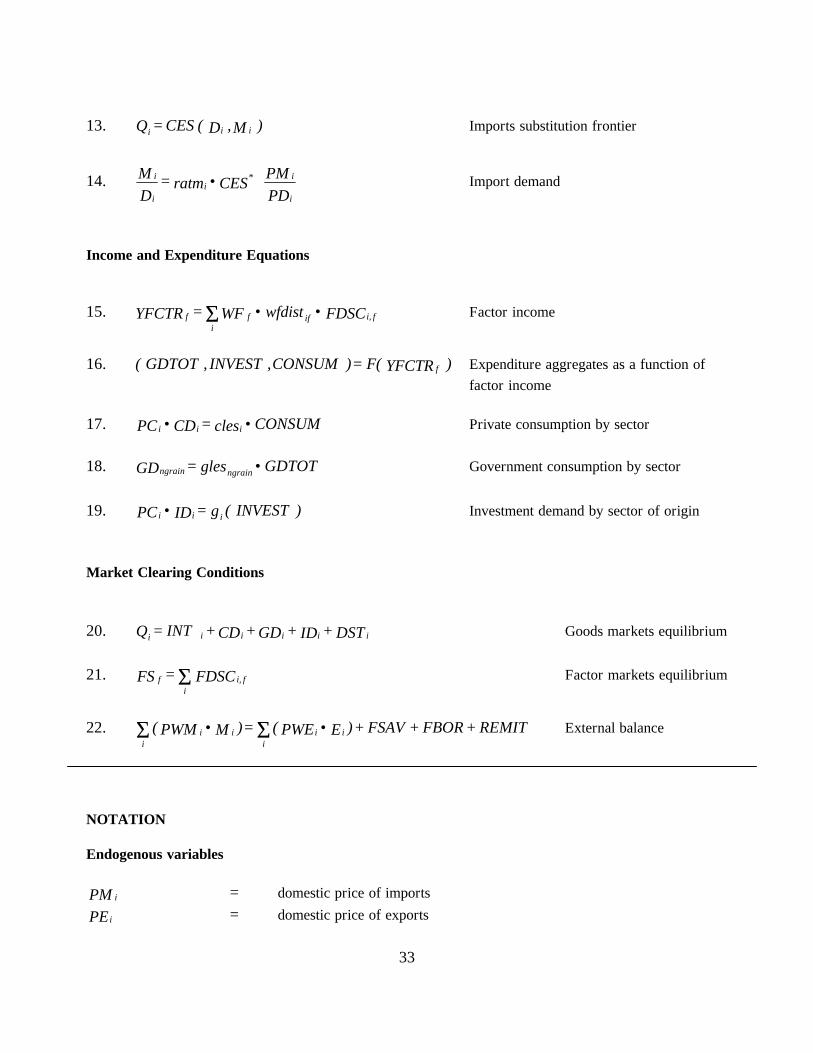
33
13. ) M ,D ( CES = Q iii Imports substitution frontier
14.
•
PD
PM CES ratm = D
M
i
i*i
i
i Import demand
Income and Expenditure Equations
15. FDSC wfdist WF = YFCTR fi,iffi
f ••Σ Factor income
16. ) YFCTR F( = ) CONSUM ,INVEST ,GDTOT ( f Expenditure aggregates as a function offactor income
17. CONSUM cles = CD PC iii •• Private consumption by sector
18. GDTOT gles = GD ngrainngrain • Government consumption by sector
19. ) INVEST ( g = ID PC iii • Investment demand by sector of origin
Market Clearing Conditions
20. DST + ID + GD + CD + INT = Q iiiiii Goods markets equilibrium
21. FDSC = FS fi,i
f Σ Factor markets equilibrium
22. REMIT + FBOR + FSAV + )E PWE( = )M PWM( iii
iii
•• ΣΣ External balance
NOTATION
Endogenous variables
PM i = domestic price of imports
PE i = domestic price of exports

34
PC i = composite good price to consumers
PQi = composite good price net of consumption taxes
PDi = price of domestically produced good for domestic market
PX i = average producer price
PV i = value added (net of indirect taxes) price
EXR = foreign exchange rateX i = gross domestic output
FDSC if = factor demand by sector
WF f = nominal average factor wages
M i = imports
E i = exports
Qi = demand for composite good
Di = domestic demand for domestically produced good
YFCTR f = factor income
CONSUM = total private consumption
INVEST = total investment demand
GDTOT = total government current expenditure excluding military spending
INT i = intermediate demand
CDi = private consumption by sector
GDngrain = government consumption by non-grain sectors
IDi = investment demand by sector of origin
Exogenous variables
PINDEX = numeraire consumer price indexREMIT = foreign remittances to householdsFBOR = net foreign borrowingFSAV = current account balance (or foreign savings)FS f = aggregate factor supply
Parameters
pwmi = world prices of imports
pwei = world prices of exports
pwcs i = weights in composite price index
a fi, = CES production function share parameters
a ji = input-output coefficients

35
ad i = CES production function shift parameters
pi = CES production function exponents
ratexi = export rationing ratios by sector
ratmi = import rationing ratios by sector
wfdist fi, = factor price proportionality constant
tmi = import tariff rates
tei = export tax rates
txi = indirect tax rates
tci = consumption tax rates
clesi = household expenditure shares
glesngrain = government expenditure shares
Functions
CESP = CES production function
CET = Constant elasticity of transformation function
CET* = Relation derived from revenue maximization in a CET
CES = Constant elasticity of substitution function
CES* = Relation derived from cost minimization in a CES
F = Mapping from factor income to expenditure aggregates
g i = Derivation of investment demand by sector of origin
Indexes
j i, = production sectors (rice; maize; other agricultural goods, forestry andfisheries; mining; light manufacturing; intermediate products; capital
goods; construction; public administration; military; services)
ngrain = production sectors excluding rice and maize sector
f = factors (three types of land; rural labor, urban high sk. labor, urban lowsk. labor, capital)
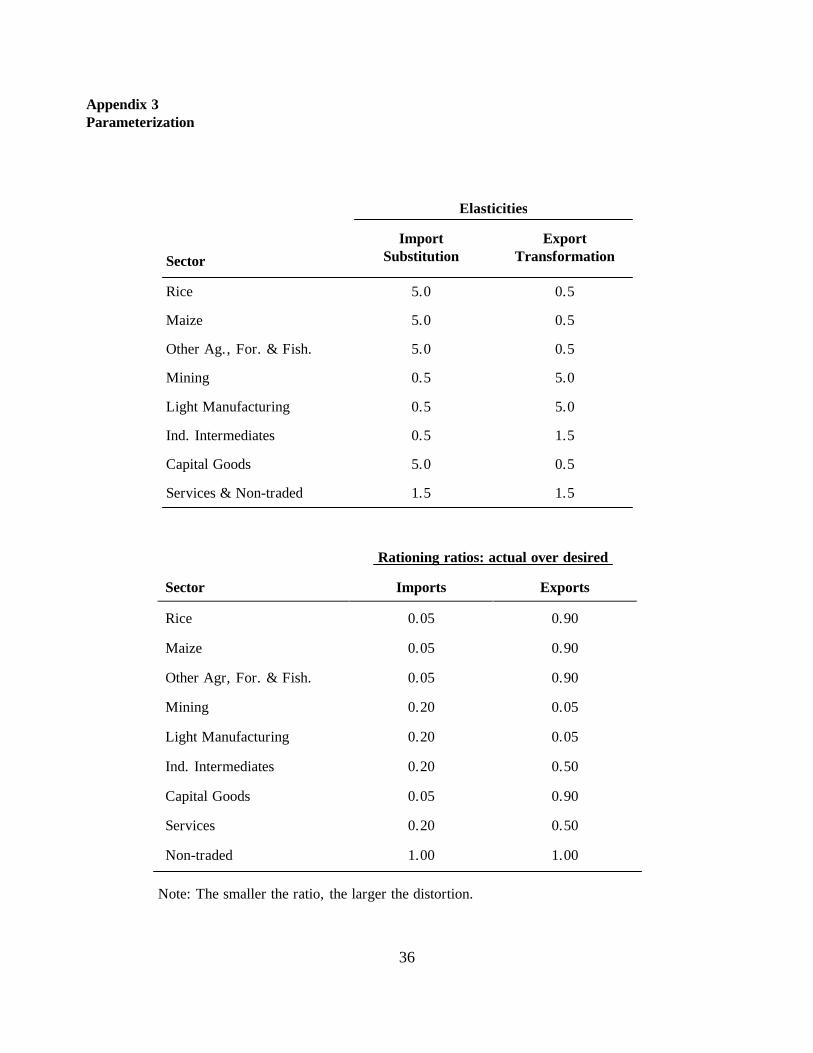
36
Appendix 3Parameterization
Elasticities
Sector
ImportSubstitution
ExportTransformation
Rice 5.0 0.5
Maize 5.0 0.5
Other Ag., For. & Fish. 5.0 0.5
Mining 0.5 5.0
Light Manufacturing 0.5 5.0
Ind. Intermediates 0.5 1.5
Capital Goods 5.0 0.5
Services & Non-traded 1.5 1.5
Rationing ratios: actual over desired
Sector Imports Exports
Rice 0.05 0.90
Maize 0.05 0.90
Other Agr, For. & Fish. 0.05 0.90
Mining 0.20 0.05
Light Manufacturing 0.20 0.05
Ind. Intermediates 0.20 0.50
Capital Goods 0.05 0.90
Services 0.20 0.50
Non-traded 1.00 1.00
Note: The smaller the ratio, the larger the distortion.


![[Challenge:Future] Famine](https://static.fdocuments.in/doc/165x107/55d6e745bb61eb724e8b4714/challengefuture-famine.jpg)