Working Paper 439 - opendocs.ids.ac.uk
60
Working Paper 439 DIVERSIFICATION IN RURAL LIVELIHOOD STRATEGIES: A MACRO-LEVEL EVIDENCE FROM JAMMU AND KASHMIR Rajeev Sharma December 2010
Transcript of Working Paper 439 - opendocs.ids.ac.uk

Working Paper
439
DIVERSIFICATION IN RURAL LIVELIHOOD
STRATEGIES: A MACRO-LEVEL EVIDENCE
FROM JAMMU AND KASHMIR
Rajeev Sharma
December 2010

Working Papers can be downloaded from the
Centre’s website (www.cds.edu)

DIVERSIFICATION IN RURAL LIVELIHOOD
STRATEGIES: A MACRO-LEVEL EVIDENCE FROM
JAMMU AND KASHMIR
Rajeev Sharma
December 2010
This paper forms part of an ongoing research on “Rural Developmentand Livelihood Diversification: An Empirical Investigation of theconditions in Jammu and Kashmir” and was presented in the seminar atCentre for Development Studies, Trivandrum (Kerala). I obtainedimmense benefit from discussions with Dr. K.N. Nair (Prof. and Director,Centre for Development Studies) on the earlier draft of the paper. I amthankful to the discussant, Dr. Arindam Banerjee (Lect., Centre forDevelopment Studies), for his valuable suggestions. I am also gratefulto external referee, Prof. H.R. Sharma, (Division of Food Resources andEnvironmental Economics, College of Natural Sciences, KonkukUniversity, Korea). Discussions with Indervir Singh (PhD Scholar, Centrefor Development Studies) proved constructive for me at various stagesof the preparation of the paper. Thanks are also due to the painstakingefforts by anonymous referee. Usual disclaimers apply.
4
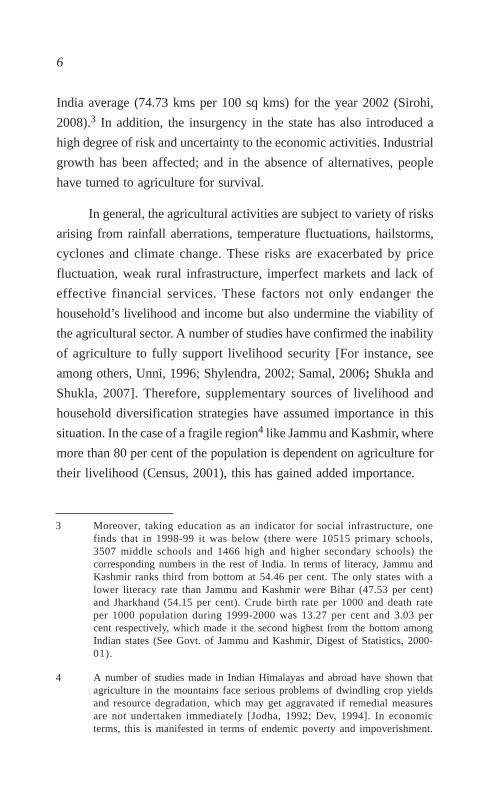
ABSTRACT
Agricultural sector is predominant in the economy of Jammu and
Kashmir and provides livelihood to the majority of the population. The
overall economic growth of the state depends largely on the progress of
agricultural sector, since only a very nominal progress has been achieved
in the secondary as well as in the tertiary sectors. It is well recognized
that the livelihood of those dependent on agricultural sector is
unsustainable which necessitates the creation of supplementary sources
to raise it to a sustainable level. Household livelihood diversification is
a strategy to minimize risk and uncertainty. In the case of fragile region
like Jammu and Kashmir, this strategy is especially important. This
paper attempts to understand broadly the dynamics of rural livelihood
diversification in the state of Jammu and Kashmir. The paper makes use
of secondary sources of information to realize the objectives of the
study. The findings are that agriculture remains as a dominant livelihood
strategy among workers in the state despite the shift to manufacturing
and tertiary activities over the period, that is, 1983 to 2004-05. So, it
becomes necessary to organize state agriculture in such a manner that
the limited land resource is made to yield maximum returns through the
application of modern technology. This would increase the well-being
of those dependent on agricultural sector for their livelihood. This paper
also throws up some issues, which one can delineate further at micro-
level.
Key Words: Livelihood Diversification, Coping Strategies, Capital
Assets, Occupational Structure, Jammu and Kashmir.
Jel Classification: Q, Q 00

5
I. Introduction
Jammu and Kashmir state is situated on the northern extremity of
the country covering a total geographical area of 2,416 thousand
hectares. It lies between 32º-17´ and 36º-58´ North and 73º-26´ and
80º-30´ East. It is divided into three divisions, viz., Jammu, Kashmir and
Ladakh comprising a total of 22 districts1. Major portion of the state is
hilly, and the height from sea level varies from 1000 feet to 28,500 feet.
The temperature also varies across the year. This, coupled with the
highly undulating topography, has conditioned the agricultural and
other livelihood practices of the people. Nevertheless, the findings of
my earlier work2 indicated that agriculture had been able to respond
positively with impressive growth rate to meet the requirements of the
people. The tourism sector had been a major driver of growth of the
Jammu and Kashmir economy till the late 1980s. The dependence on
agriculture became absolute due to the subsequent decline witnessed in
it. The available evidence indicates that the state of Jammu and Kashmir
is also lagging behind in terms of infrastructure. For instance, it has low
road density in relation to its geographical area (10.54 kms per 100 sq
kms) when compared to other states; and it is much below even the all-
1 It is to be noted that, very recently eight new districts were created, foureach in Jammu and in Kashmir divisions.
2 Sharma, R. (2007), ‘Agricultural Development and Crop Diversification inJammu and Kashmir: A District Level Study, Pattern, Processes andDeterminants’, Review of Development and Change, 12(2): 217-251.
6
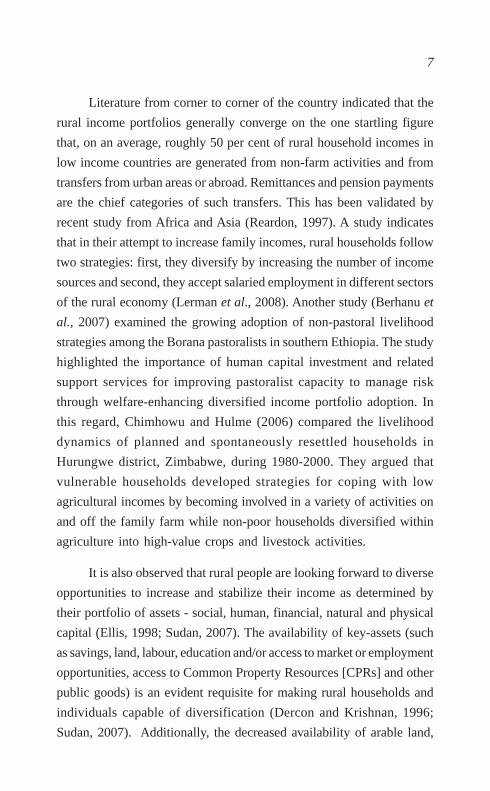
India average (74.73 kms per 100 sq kms) for the year 2002 (Sirohi,
2008).3 In addition, the insurgency in the state has also introduced a
high degree of risk and uncertainty to the economic activities. Industrial
growth has been affected; and in the absence of alternatives, people
have turned to agriculture for survival.
In general, the agricultural activities are subject to variety of risks
arising from rainfall aberrations, temperature fluctuations, hailstorms,
cyclones and climate change. These risks are exacerbated by price
fluctuation, weak rural infrastructure, imperfect markets and lack of
effective financial services. These factors not only endanger the
household’s livelihood and income but also undermine the viability of
the agricultural sector. A number of studies have confirmed the inability
of agriculture to fully support livelihood security [For instance, see
among others, Unni, 1996; Shylendra, 2002; Samal, 2006; Shukla and
Shukla, 2007]. Therefore, supplementary sources of livelihood and
household diversification strategies have assumed importance in this
situation. In the case of a fragile region4 like Jammu and Kashmir, where
more than 80 per cent of the population is dependent on agriculture for
their livelihood (Census, 2001), this has gained added importance.
3 Moreover, taking education as an indicator for social infrastructure, onefinds that in 1998-99 it was below (there were 10515 primary schools,3507 middle schools and 1466 high and higher secondary schools) thecorresponding numbers in the rest of India. In terms of literacy, Jammu andKashmir ranks third from bottom at 54.46 per cent. The only states with alower literacy rate than Jammu and Kashmir were Bihar (47.53 per cent)and Jharkhand (54.15 per cent). Crude birth rate per 1000 and death rateper 1000 population during 1999-2000 was 13.27 per cent and 3.03 percent respectively, which made it the second highest from the bottom amongIndian states (See Govt. of Jammu and Kashmir, Digest of Statistics, 2000-01).
4 A number of studies made in Indian Himalayas and abroad have shown thatagriculture in the mountains face serious problems of dwindling crop yieldsand resource degradation, which may get aggravated if remedial measuresare not undertaken immediately [Jodha, 1992; Dev, 1994]. In economicterms, this is manifested in terms of endemic poverty and impoverishment.
7
Literature from corner to corner of the country indicated that the
rural income portfolios generally converge on the one startling figure
that, on an average, roughly 50 per cent of rural household incomes in
low income countries are generated from non-farm activities and from
transfers from urban areas or abroad. Remittances and pension payments
are the chief categories of such transfers. This has been validated by
recent study from Africa and Asia (Reardon, 1997). A study indicates
that in their attempt to increase family incomes, rural households follow
two strategies: first, they diversify by increasing the number of income
sources and second, they accept salaried employment in different sectors
of the rural economy (Lerman et al., 2008). Another study (Berhanu et
al., 2007) examined the growing adoption of non-pastoral livelihood
strategies among the Borana pastoralists in southern Ethiopia. The study
highlighted the importance of human capital investment and related
support services for improving pastoralist capacity to manage risk
through welfare-enhancing diversified income portfolio adoption. In
this regard, Chimhowu and Hulme (2006) compared the livelihood
dynamics of planned and spontaneously resettled households in
Hurungwe district, Zimbabwe, during 1980-2000. They argued that
vulnerable households developed strategies for coping with low
agricultural incomes by becoming involved in a variety of activities on
and off the family farm while non-poor households diversified within
agriculture into high-value crops and livestock activities.
It is also observed that rural people are looking forward to diverse
opportunities to increase and stabilize their income as determined by
their portfolio of assets - social, human, financial, natural and physical
capital (Ellis, 1998; Sudan, 2007). The availability of key-assets (such
as savings, land, labour, education and/or access to market or employment
opportunities, access to Common Property Resources [CPRs] and other
public goods) is an evident requisite for making rural households and
individuals capable of diversification (Dercon and Krishnan, 1996;
Sudan, 2007). Additionally, the decreased availability of arable land,
8
increased producer/consumer ratio in agriculture, credit delinquency
and environmental deterioration can indeed be important drivers towards
diversification. However, the ownership of assets, such as land and
livestock, helps reduce vulnerability of households and allows them to
exploit income-generating opportunities. Indeed, a diverse body of
literature provides evidence that poor people in developing countries
use social networks and connections as insurance to manage risk
(Fafchamps and Lund 2003; Fafchamps and Gubert 2006).
The results emanating from Indian micro-level studies [see Papola,
2005; Nair and Menon, 2007; Nair and Ramakumar, 2007; Sujithkumar,
2007] are discussed here. Firstly, most of the households attempt to cope
with distress situation by reducing household expenditure, diversifying
their household incomes, their cropping pattern and searching for jobs
in other places. Further, the strategies vary across households depending
on the extent of their asset ownership. Secondly, the villages in which
household income were more diversified and social networks were much
stronger, the distress conditions did not result in suicides. Thirdly, in
fragile environments, the diversification from subsistence-oriented food
production into high value products in the farm and non-farm sectors
improves the livelihood of the farmers. It is also worth mentioning that
by diversification of their livelihood, people become more productive
on account of more application of inputs which may be due to increase
in their purchasing power.
Establishment of WTO provides opportunities for trade with other
countries and need for careful monitoring of imports. Globalization
impacts rural areas in all the sectors viz., agriculture, industry and services.
Of course, for rural areas, the impact on agriculture is much more important
as livelihoods of the majority depend on this sector. The argument that
globalization affects the poor adversely is based on the notion that the
poor are not equipped to take advantage of whatever opportunities may
be created by growing trade and capital flows as a consequence of it.
9
One of the main criticisms of globalization and economic reforms has
been that they have not achieved inclusive growth despite the impressive
development of Indian economy. The number of people below poverty
line in the Jammu and Kashmir was only 3.48 per cent in 1999-00
(Planning Commission estimate)5; this does not reflect the dismal
progress in terms of social indicators due to which Jammu and Kashmir
state is considered as one of the most backward amongst Indian states6.
As rural households derive their livelihoods from different sources,
globalization is expected to affect them in a variety of ways in which it
affects those different sources. Very little literature that captures the
dynamics of livelihood diversification is available and I have not come
across any study for the state of Jammu and Kashmir about this topic.
Given the impressive performance of agriculture in Jammu and
Kashmir during the last one and half decades, it is pertinent to address
the following questions. How far has the dependency on agriculture for
livelihood been undergoing change? What has happened to the access
of agriculturists to important livelihood assets such as land, livestock,
financial assets, human assets, etc.? It is in this context that the main
focus of the paper is on understanding the rather dynamic rural livelihood
strategies which are not static over time. This might be attributed to
various factors; such as economic, social, political, and natural factors.
The specific objectives are as follows: first, to understand the processes
5 The latest poverty figure worked out by planning commission for the stateof Jammu and Kashmir based on uniform recall period is 5.40 per cent(2004-05) and 4.20 per cent based on mixed recall period for the sameyear.
6 In this regard, Rai et al. (2008) developed a composite integrated livelihoodindex for different agro-climatic zones of India. It depicts that most of thetribal regions in Bihar, Madhya Pradesh, Orissa, North-Eastern States andJ&K fall under the category of low livelihood status. Further, 103 out oftotal 127 low agricultural productivity districts also fall under the lowlivelihood status region. Among districts of different states, three districts ofJ&K; namely, Doda, Kupwara and Jammu, fall under low livelihood statusregions.
10
and patterns of livelihood diversification over a period of time in the
state; and, second, to assess the sources of household income, distribution
of land, livestock and other assets among different categories of rural
households.
The rest of the paper is organized as follows. The concept of
livelihoods is introduced in Section II. It is followed by an analytical
framework, which is explained in the Section III. Results are discussed
in the Section IV; and, finally, Section V sums up the discussion.
II. Concept of Livelihoods
Livelihoods are the ways in which people satisfy their needs, or
gain a living (Chambers and Conway, 1992). How rural people make a
living and whether their livelihood is secure or vulnerable over time are
issues covered in livelihood literature. Livelihoods turn up from a variety
of sources and activities, which vary over time. They comprise several
different activities for each given household - more often than not even
for each working member, which may change even within a year.
Flexibility of households’ livelihoods determines the type of strategies
that rural households adopt to make it secure and how they respond to
changes. Although some households adopt strategies relying mainly on
few activities, most of them adopt strategies that are complex, diverse
and versatile (Chambers, 1989). The livelihood strategies are the sum of
all different activities that people do in the context of their livelihood,
and are based on the access to and combination of five forms of capital
assets, namely, human capital, natural capital, financial capital, social
capital, and physical capital (Sconner, 1998; Bebbington 1999).
III. Analytical Framework
Why should the households attempt to diversify their livelihood
strategies? The purpose of diversification is two-fold: first, to increase
household incomes; and second, to minimize risks of livelihood failure.
Diversification reduces the risk of livelihood failure by spreading it
11
across more than one income source. It also helps to overcome the uneven
use of assets caused by seasonality. Diversification assists to reduce
vulnerability, to generate financial resources in the absence of credit
markets, and confers a host of other advantages in the presence of
widespread market failures and uncertainties. Broadly, the rationale for
diversification emanates from the opportunities for more employment
and generation of higher incomes through more efficient use of resources
and through exploitation of comparative advantage (World Bank, 1990).
Diversification is a core strategy of contemporary rural livelihood systems
in developing countries (Ellis, 2000). In reality, rural household’s
resource allocation decisions are fundamentally constrained by
conditions of livelihood asset endowments and related socio-political
and institutional factors. Households may choose to adopt various
strategies to secure their livelihood. They may be classified as: the ex
ante risk coping mechanisms adopted by the households like crop
diversification, varietal diversification, income diversification,
livelihood diversification, etc; and, the ex post mechanisms such as
reduction in consumption expenditure, selling of animals, implements
and other assets, increase in use of family labour and distress sale of
assets to cope with losses. Thus, it is worth mentioning that the adoption
of coping mechanism leads to the improvement in the standard of living
of the households.
The present paper did not look into different strategies of
livelihood. It focuses on livelihood diversification7 which is recognized
7 It is defined as the process by which rural families construct more diverseportfolio of activities and social support capabilities in their struggle forsurvival and in order to improve their standard of living (Ellis, 1998). Thisargument is based on the premise that livelihood is not just income, butencompasses social institutions, gender relations, and property rights requiredto support and sustain a given standard of living. Livelihood includesaccess to, and benefits derived from the social and public services providedby the state such as education, health services, roads, water supplies, sanitation,electricity, etc. Thus, livelihood diversification is not synonymous withincome diversification.
12
by many as a strategy to overcome risk and uncertainties or to minimize
cost or to accumulate wealth. Diversification of economic activities at
the household level can occur through two processes. Firstly, the
household may diversify its activities by increasing the number of
workers engaged in different economic activities in the household.
Secondly, it may diversify by letting each member to participate in
more than one economic activity. In the micro-context, diversification
of economic activity by an individual worker/household can be analyzed
as: first, an occupational shift from one sector to the other over a period
of time; and second, participation in more than one economic activity
in either sector at a point in time (Unni, 1996). In the macro-context, the
process of livelihood diversification of the employment structure or
growth of non-agricultural employment can be analyzed as consisting
of two components: first, new entrants to the labour force entering the
non-agricultural sector; and second, a shift of workers from agriculture
to non-agriculture (Unni, 1996). This paper studied the second
component to understand the livelihood diversification at macro-level
in the state. The analysis, in this paper, is restricted to provide macro-
evidence only.
It is in this background that this paper is making a modest attempt
to understand broadly the dynamics of rural livelihood diversification
of the state of Jammu and Kashmir. The issue is approached by looking
into the occupational structure of the workers for rural areas in the state
since 1961 to 2001. Further, this paper sheds some light on the sources
of income, which helps the researchers to understand the new
opportunities that have come up in the era of globalization for state as a
whole. Broadly, the trends in the changes in the value of different assets,
and the changes in the incidence of borrowing as well as indebtedness
have also been observed at different points of time.
This paper has utilized secondary information which is gathered
from different sources. The main secondary sources include: NSSO,
13
Employment and Unemployment Situation in India (various rounds),
used for collection of data for different points of time to study the changes
in the occupation of workers across the sectors; different volumes of
Sarvekshna for data from past three decades regarding land holdings,
ownership holdings, operational holdings, sources of irrigation,
livestock and implements, which are assembled in the paper; various
rounds of All-India Debt and Investment Survey, to understand the
changes in assets and cash borrowings of the households, which was
provided by the Reserve Bank of India prior to 1990’s; thereafter, the
same information is given by NSSO and earlier volumes of Sarvekshna.
The results are discussed in the next section.
IV. Results and Discussion
IV.1: Trends in the Occupation of Workers
This section tries to answer the first question - how far has the
dependency on agriculture for livelihood changed? - by looking into
the occupational structure of workers across different sectors. In
agriculture, labourers are the principal factor of production. The
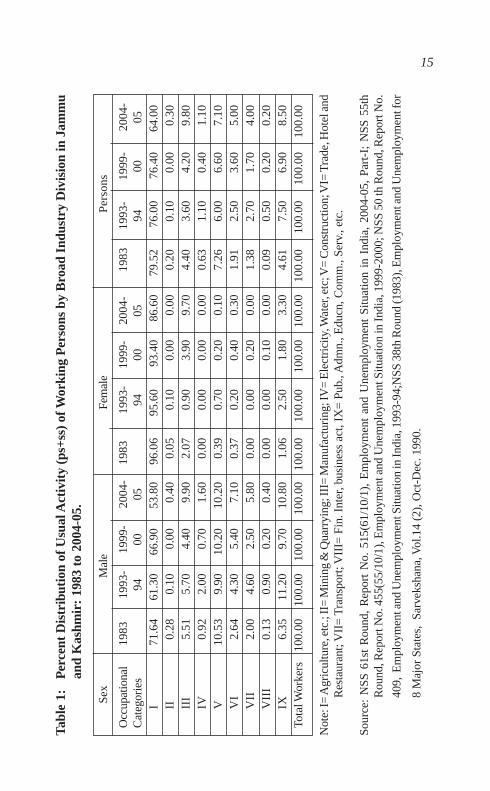
occupational structure of workers for the state of Jammu and Kashmir is
presented in the Table 1. The figures are arrived at by adding data of
both principal status and subsidiary status (ps+ss). It is seen that the
total workers engaged in agriculture were around 79.52 per cent of all
total workers in 1983, came down to 76.00 per cent in 1993-94, remained
around 76.00 per cent up to 1999-00, and thereafter fell substantially to
64.00 per cent in 2004-05. Coming to male workers, 71.64 per cent of
the workers were engaged in agriculture in 1983; the figure declined to
61.30 per cent in 1993-94; rose to 66.90 per cent in 1999-00 and then
again fell to 53.80 per cent during 2004-05. However, female workers
declined significantly to 86.60 (2004-05) per cent from 96.06 per cent
(1983). This decline in agriculture sector is accompanied by marginal
increase in employment of workers in rest of the sectors, especially in
the manufacturing and services sectors. The services sector includes
14
trade, hotel and restaurants, transport, public administration and defense,
education, health and social work, other community, social & personal
service activities, private households with employed persons and extra-
territorial organization and bodies. The construction sector was
exceptional since the percentage of workers remained nearly constant,
around 7 per cent from 1983 to 2004-05.
When looked from the gender perspective, the fall in male
agricultural workers was double (18 per cent points) that of female
workers, that is, 9 per cent points in 2004-05 over 1983 (refer Table 1).
Both male and female workers have shifted to manufacturing and services
sectors between 1983 to 2004-05; however, the shift was more
pronounced in case of male workers than in case of female workers.
In short, Table 1 brings to the fore the fact that the structure of
work force has undergone pronounced change. The shift is away from
agriculture mainly to manufacturing and tertiary activities. This is true
for total rural workers as well as for male and female workers when
disaggregated separately. As is clearly evident from the Table 1, the
state has experienced a much more steep fall in the agricultural workers
during the post-reform period (12 per cent points) than in the pre-reform
period (3.52 per cent points). Sharper fall is observed for female
agricultural workers during the post-reform period (9 per cent points)
than during the pre-reform period (0.46 per cent points). But in the case
of male workers, the reverse is true, that is, 7.5 per cent points and 10.3
per cent points, respectively. The figures indicate that the excessive
dependence on agriculture as a source of livelihood has been steadily
melting down and that the worker’s employment base has clearly
witnessed a modest degree of diversification.
IV.2: Distribution of Households by Income Sources
After looking into the occupational structure of the workers, it is
appropriate to see the distribution of households by income sources.
15Ta
ble
1:P
erce
nt D
istr
ibut
ion
of U
sual
Act
ivit
y (p
s+ss
) of
Wor
king
Per
sons
by
Bro
ad I
ndus
try
Div
isio
n in
Jam
mu
and
Kas
hmir
: 19
83 t
o 20
04-0
5.
Sex
Mal
eFe
mal
eP
erso
ns
Occ
upat
iona
l19
8319
93-
1999
-20
04-
1983
1993
-19
99-
2004
-19
8319
93-
1999
-20
04-
Cat
egor
ies
9400
0594
0005
9400
05I
71.6
461
.30
66.9
053
.80
96.0
695
.60
93.4
086
.60
79.5
276
.00
76.4
064
.00
II0.
280.
100.
000.
400.
050.
100.
000.
000.
200.
100.
000.
30II
I5.
515.
704.
409.
902.
070.
903.
909.
704.
403.
604.
209.
80IV
0.92
2.00
0.70
1.60
0.00
0.00
0.00
0.00
0.63
1.10
0.40
1.10
V10
.53
9.90
10.2
010
.20
0.39
0.70
0.20
0.10
7.26
6.00
6.60
7.10
VI
2.64
4.30
5.40
7.10
0.37
0.20
0.40
0.30
1.91
2.50
3.60
5.00
VII
2.00
4.60
2.50
5.80
0.00
0.00
0.20
0.00
1.38
2.70
1.70
4.00
VII
I0.
130.
900.
200.
400.
000.
000.
100.
000.
090.
500.
200.
20IX
6.35
11.2
09.
7010
.80
1.06
2.50
1.80
3.30
4.61
7.50
6.90
8.50
Tota
l Wor
kers
100.
0010
0.00
100.
0010
0.00
100.
0010
0.00
100.
0010
0.00
100.
0010
0.00
100.
0010
0.00
Not
e: I=
Agr
icul
ture
, etc
.; II
= M
inin
g &
Qua
rryi
ng; I
II=
Man
ufac
turi
ng; I
V=
Ele
ctri
city
, Wat
er, e
tc; V
= C
onst
ruct
ion;
VI=
Tra
de, H
otel
and
Res
taur
ant;
VII
= T
rans
port
; VII
I= F
in. I
nter
, bus
ines
s ac
t, IX
= Pu
b., A
dmn.
, Edu
cn, C
omm
., Se
rv.,
etc.
Sour
ce:
NSS
61s
t R
ound
, R
epor
t N
o. 5
15(6
1/10
/1),
Em
ploy
men
t an
d U
nem
ploy
men
t Si
tuat
ion
in I
ndia
, 20
04-0
5, P
art-
I; N
SS 5
5th
Rou
nd, R
epor
t No.
455
(55/
10/1
), E
mpl
oym
ent a
nd U
nem
ploy
men
t Situ
atio
n in
Indi
a, 1
999-
2000
; NSS
50
th R
ound
, Rep
ort N
o.
409,
Em
ploy
men
t and
Une
mpl
oym
ent S
ituat
ion
in In
dia,
199
3-94
;NSS
38t
h R
ound
(198
3), E
mpl
oym
ent a
nd U
nem
ploy
men
t for
8 M
ajor
Sta
tes,
Sar
veks
hana
, Vol
.14
(2),
Oct
-Dec
. 199
0.
16
Table 2 shows the percentage of income from different sources received
by the households. It is evident that more than 60 per cent of the
households received income from different sources in self-employed
category of households in agriculture. The exceptions are those who are
in wage/salaried employment, or who run non-agricultural enterprises
or who derive their income from agriculture as rent.
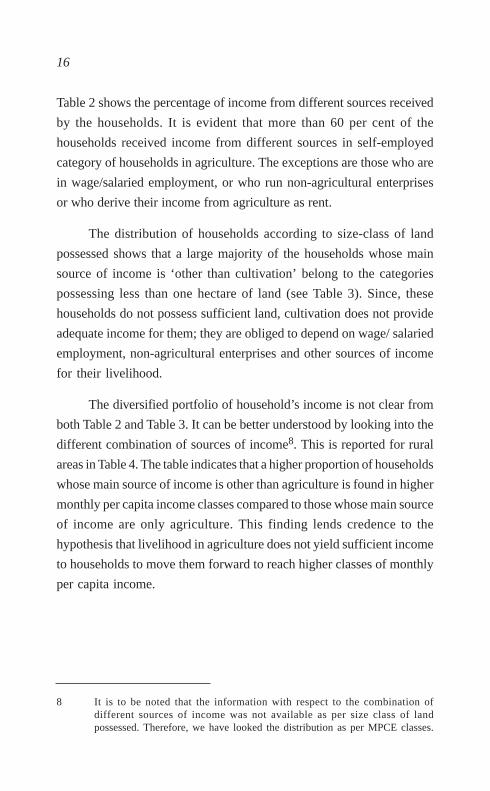
The distribution of households according to size-class of land
possessed shows that a large majority of the households whose main
source of income is ‘other than cultivation’ belong to the categories
possessing less than one hectare of land (see Table 3). Since, these
households do not possess sufficient land, cultivation does not provide
adequate income for them; they are obliged to depend on wage/ salaried
employment, non-agricultural enterprises and other sources of income
for their livelihood.
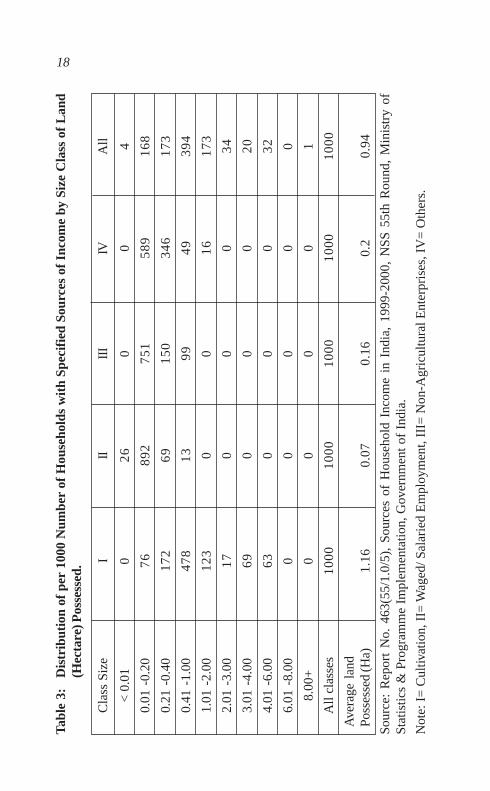
The diversified portfolio of household’s income is not clear from
both Table 2 and Table 3. It can be better understood by looking into the
different combination of sources of income8. This is reported for rural
areas in Table 4. The table indicates that a higher proportion of households
whose main source of income is other than agriculture is found in higher
monthly per capita income classes compared to those whose main source
of income are only agriculture. This finding lends credence to the
hypothesis that livelihood in agriculture does not yield sufficient income
to households to move them forward to reach higher classes of monthly
per capita income.
8 It is to be noted that the information with respect to the combination ofdifferent sources of income was not available as per size class of landpossessed. Therefore, we have looked the distribution as per MPCE classes.

17Ta
ble
2:N
umbe
r pe
r 10
00 o
f Rur
al H
ouse
hold
s Rep
orti
ng R
ecei
pt o
f Inc
ome
from
Dif
fere
nt S
ourc
es fo
r 19
99-0
0 in
J&K
.
Sour
ces
ofH
ouse
hold
Typ
eA
ll
Inco
me
Self
-E
mpl
oyed
in
Agr
icul
tura
lO
ther
Self
-Em
ploy
edO
ther
sTy
pes
Non
-Agr
icul
ture
Lab
our
Lab
our
in A
gric
ultu
re
I10
545
6264
014
810
00
II14
064
6666
565
1000
III
1893
9930
948
110
00
IV44
029
8828
415
910
00
V81
209
599
292
1000
VI
295
00
327
379
1000
VII
189
080
317
010
00
VII
I94
2721
581
277
1000
IX74
108
4672
250
1000
Sour
ce:
Rep
ort
No.
463
(55/
1.0/
5),
Sour
ces
of H
ouse
hold
Inc
ome
in I
ndia
, 19
99-2
000,
NSS
55t
h R
ound
, M
inis
try
ofSt
atis
tics
& P
rogr
amm
e Im
plem
enta
tion,
Gov
ernm
ent o
f In
dia.
Not
e: I=
Cul
tivat
ion,
II=
Fis
hing
/ Oth
er A
gric
ultu
ral E
nter
pris
es, I
II=
Wag
es/ S
alar
ied
Em
ploy
men
t, IV
= N
on-A
gric
ultu
ral
Ent
erpr
ises
, V=
Pen
sion
, VI=
Ren
t, V
II=
Rem
ittan
ces,
VII
I= In
tere
st &
Div
iden
ds, I
X=
Oth
ers.
18Ta
ble
3:D
istr
ibut
ion
of p
er 1
000
Num
ber
of H
ouse
hold
s w
ith
Spec
ifie
d So
urce
s of
Inc
ome
by S
ize
Cla
ss o
f L
and
(Hec
tare
) Pos
sess
ed.
Cla
ss S
ize
III
III
IVA
ll
< 0
.01
026
00
4
0.01
-0.
2076
892
751
589
168
0.21
-0.
4017
269
150
346
173
0.41
-1.
0047
813
9949
394
1.01
-2.
0012
30
016
173
2.01
-3.
0017
00
034
3.01
-4.
0069
00
020
4.01
-6.
0063
00
032
6.01
-8.
000
00
00
8.00
+0
00
01
All
clas
ses
1000
1000
1000
1000
1000
Ave
rage
lan
dPo
sses
sed
(Ha)
1.16
0.07
0.16
0.2
0.94
Sour
ce:
Rep
ort
No.
463
(55/
1.0/
5),
Sour
ces
of H
ouse
hold
Inc
ome
in I
ndia
, 19
99-2
000,
NSS
55t
h R
ound
, M
inis
try
ofSt
atis
tics
& P
rogr
amm
e Im
plem
enta
tion,
Gov
ernm
ent o
f In
dia.
Not
e: I
= C
ultiv
atio
n, I
I= W
aged
/ Sal
arie
d E
mpl
oym
ent,
III=
Non
-Agr
icul
tura
l Ent
erpr
ises
, IV
= O
ther
s.
19
Table 4: Distribution of Rural Households Receiving Income fromDifferent Combination of Sources by Monthly Per CapitaExpenditure (MPCE) Class for 1999-00 in J&K.
MPCE Class I II III IV (Rs.)
225-300 2 (0.2) 16 (1.6) 7 (0.7) 7 (0.7)
300-420 32 (3.2) 166 (16.6) 61 (6.1) 67 (6.7)
420-615 474 (47.4) 334 (33.4) 356 (35.6) 272 (27.2)
615-950 341 (34.1) 336 (33.6) 440 (44.0) 640 (64.0)
950 & above 151 (15.1) 149 (14.9) 138 (13.8) 15 (1.5)
All classes 1000 1000 1000 1000
Source: Same as Table 5.
Note: (i) I= Only Agriculture, II= Both Agriculture and Waged/ SalariedEmployment, III= Agriculture; and IV= Both Wage/ Salary and Non-Agricultural Enterprise.
(ii) Figures in brackets are percentages.
Thus far, we have seen the shift of workers away from agriculture
to other sectors mainly in the manufacturing and the tertiary activities.
It is also seen that the households having low MPCE have generated
more income from multiple sources than one source of income. It
indicates that more vulnerable households probably require supplement
sources of income to cope up with risk and uncertainties in their
livelihood. Apart from looking into the sources of income, it is imperative
to look into the distribution of various assets across different categories
of households. Moreover, it would be of interest to see the trends in the
households of those who possessed no land, who neither own nor operate
any land and those who own but not operate any land from the
perspective of livelihood. In this respect, we have made a modest attempt
in the next section.

20
IV.3: Changes in Access to important Livelihood Assets
Rural livelihood strategies are shaped by various causes. Apart
from natural causes, others that affect rural household’s decision are:
access and control of physical, human, financial and social capital
(Sconner, 1998; Bebbington, 1999); markets, institutions, and the
political environment (Ellis, 1993). These capital enable the households
to negotiate for their betterment through diversifying their portfolios in
the context of vulnerability. They can be transformed into livelihood
strategies and finally into livelihood outcomes.
The NSSO provides information with respect to the ownership of
different assets; such as land, buildings, livestock, durable assets, etc.
Possession of such assets could help reduce vulnerability of households
and allow them to exploit income-generating opportunities. It would be
of interest to study the relative importance of different items of assets
during 1981 to 2002. The percentage shares of different items in the
total assets have been presented in the Table 5.
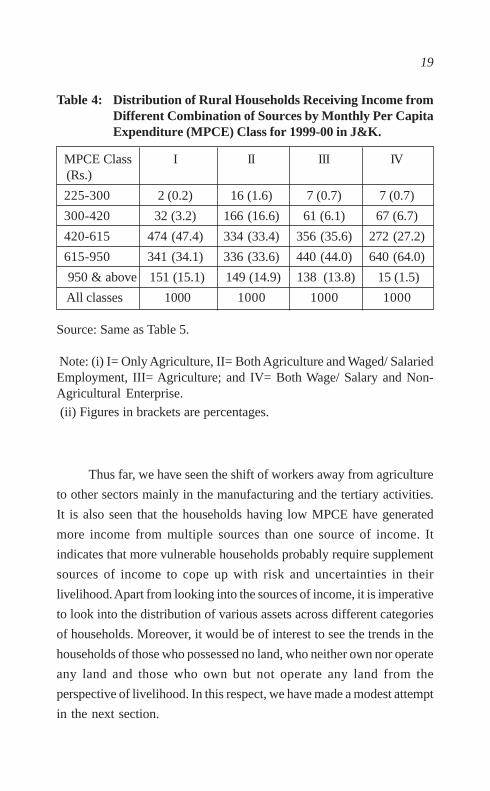
Land and building have remained the most important components
of assets owned by households. The percentage of the value of land and
building to the value of total assets varied between 83 and 86 during
1981 to 2002. These two components were quite significant and
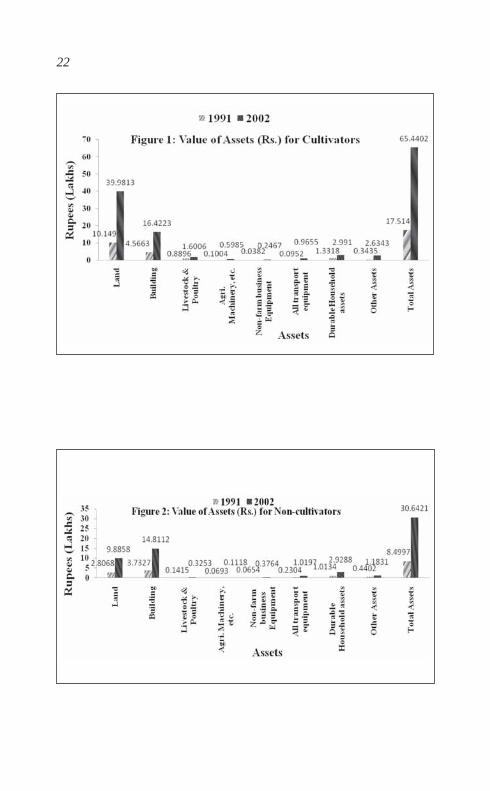
dominant in both cultivator and non-cultivator categories. However,
reduction in the value of land was observed in the case of non-cultivators
which came down to 32.3 per cent (2002) from 44.0 per cent (1981) as
compared to buildings that showed increase in value over the same
period of time. In brief, it shows that since cultivation requires land, it is
natural that the cultivators have a higher proportion of land and
buildings in their total assets compared to those who are non-cultivators.
The average value of the important categories of assets per household
is depicted separately for each occupational category in the rural areas for
the state of Jammu and Kashmir (See Figure 1 and Figure 2)

21Ta
ble
5: P
erce
ntag
e Sh
are
of D
iffe
rent
Ite
ms
of A
sset
s in
Tot
al H
ouse
hold
Ass
ets
by O
ccup
atio
nal
Cat
egor
y of
Hou
seho
lds
in R
ural
Are
as o
f Jam
mu
and
Kas
hmir
.
Hou
seho
ld T
ype
Cul
tiva
tors
Non
-Cul
tiva
tors
All
Hou
seho
lds
Ass
ets
1981
1991
2002
1981
1991
2002
1981
1991
2002
Lan
d59
.057
.961
.144
.033
.032
.358
.356
.259
.5
Bui
ldin
g25
.426
.125
.135
.143
.948
.326
.427
.426
.4
Liv
esto
ck &
Pou
ltry
6.4
5.1
2.4
3.6
1.7
1.1
6.2
4.8
2.4
Agr
i. M
achi
nery
, etc
.0.
70.
60.
90.
30.
80.
40.
60.
60.
9
Non
-far
m b
usin
ess
Equ
ipm
ent
0.3
0.2
0.4
1.6
0.8
1.2
0.4
0.3
0.4
All
tran
spor
t eq
uipm
ent
0.2
0.5
1.5
0.3
2.7
3.3
0.4
0.7
1.6
Dur
able
Hou
seho
ld a
sset
s8.
77.
64.
610
.911
.99.
66.
57.
94.
9
Oth
er A
sset
s0.
02.
04.
06.
06.
05.
02.
02.
04.
0
Tota
l Ass
ets
100
100
100
100
100
100
100
100
100
Sour
ce: A
ll In
dia
Deb
t and
Inve
stm
ent S
urve
y 19
81-8
2, R
eser
ve B
ank
of In
dia;
Rep
ort N
o. 4
19, D
ebt a
nd In
vest
men
t Sur
vey
(NSS
48t
h R
ound
); R
epor
t No.
500
(59
/18.
2/1)
, Hou
seho
lds
Ass
ets
and
Lia
bilit
ies
in I
ndia
(N
SS 5
9th R
ound
).
22
23
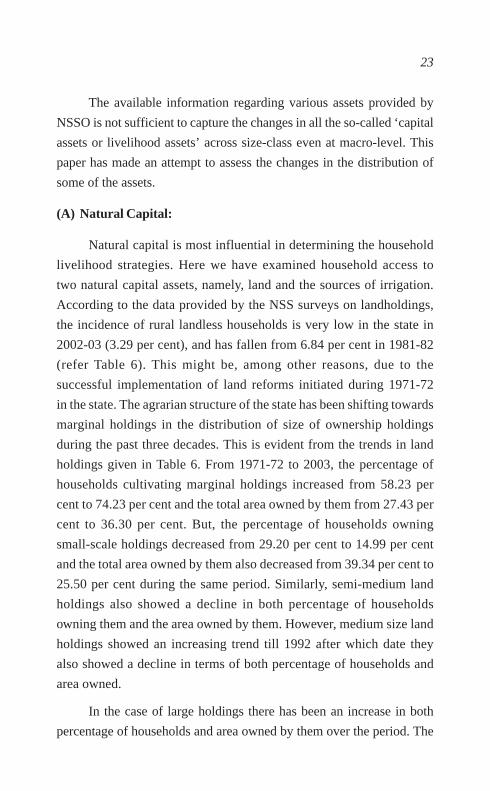
The available information regarding various assets provided by
NSSO is not sufficient to capture the changes in all the so-called ‘capital
assets or livelihood assets’ across size-class even at macro-level. This
paper has made an attempt to assess the changes in the distribution of
some of the assets.
(A) Natural Capital:
Natural capital is most influential in determining the household
livelihood strategies. Here we have examined household access to
two natural capital assets, namely, land and the sources of irrigation.
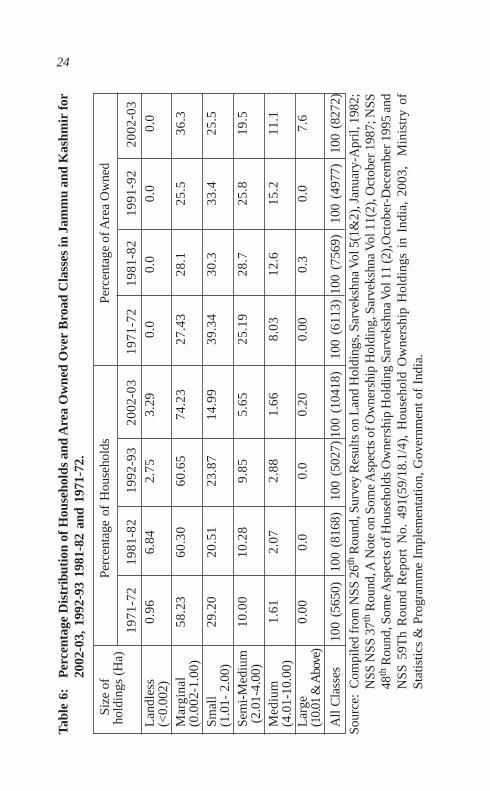
According to the data provided by the NSS surveys on landholdings,
the incidence of rural landless households is very low in the state in
2002-03 (3.29 per cent), and has fallen from 6.84 per cent in 1981-82
(refer Table 6). This might be, among other reasons, due to the
successful implementation of land reforms initiated during 1971-72
in the state. The agrarian structure of the state has been shifting towards
marginal holdings in the distribution of size of ownership holdings
during the past three decades. This is evident from the trends in land
holdings given in Table 6. From 1971-72 to 2003, the percentage of
households cultivating marginal holdings increased from 58.23 per
cent to 74.23 per cent and the total area owned by them from 27.43 per
cent to 36.30 per cent. But, the percentage of households owning
small-scale holdings decreased from 29.20 per cent to 14.99 per cent
and the total area owned by them also decreased from 39.34 per cent to
25.50 per cent during the same period. Similarly, semi-medium land
holdings also showed a decline in both percentage of households
owning them and the area owned by them. However, medium size land
holdings showed an increasing trend till 1992 after which date they
also showed a decline in terms of both percentage of households and
area owned.
In the case of large holdings there has been an increase in both
percentage of households and area owned by them over the period. The
24Ta
ble
6:P
erce
ntag
e D
istr
ibut
ion
of H
ouse
hold
s an
d A
rea
Ow
ned
Ove
r B
road
Cla
sses
in J
amm
u an
d K
ashm
ir fo
r20
02-0
3, 1
992-
93 1
981-
82 a
nd 1
971-
72.
Size
of
Perc
enta
ge o
f H
ouse
hold
sPe
rcen
tage
of A
rea
Ow
ned
ho
ldin
gs (
Ha)
1971
-72
1981
-82
1992
-93
2002
-03
1971
-72
1981
-82
1991
-92
2002
-03
Lan
dles
s0.
966.
842.
753.
290.
00.
00.
00.
0(<
0.00
2)M
argi
nal
58.2
360
.30
60.6
574
.23
27.4
328
.125
.536
.3(0
.002
-1.0
0)Sm
all
29.2
020
.51
23.8
714
.99
39.3
430
.333
.425
.5(1
.01-
2.0
0)Se
mi-
Med
ium
10.0
010
.28
9.85
5.65
25.1
928
.725
.819
.5 (
2.01
-4.0
0)M
ediu
m1.
612.
072.
881.
668.
0312
.615
.211
.1(4
.01-
10.0
0)L
arge
0.00
0.0
0.0
0.20
0.00
0.3
0.0
7.6
(10.
01 &
Abo
ve)
All
Cla
sses
100
(565
0)10
0 (8
168)
100
(502
7)10
0 (1
0418
)10
0 (6
113)
100
(756
9)10
0 (4
977)
100
(827
2)
Sour
ce:
Com
pile
d fr
om N
SS 2
6th R
ound
, Sur
vey
Res
ults
on
Lan
d H
oldi
ngs,
Sar
veks
hna
Vol
5(1
&2)
, Jan
uary
-Apr
il, 1
982;
NSS
NSS
37th
Rou
nd, A
Not
e on
Som
e A
spec
ts o
f Ow
ners
hip
Hol
ding
, Sar
veks
hna
Vol
11(
2), O
ctob
er 1
987;
NSS
48th
Rou
nd, S
ome
Asp
ects
of H
ouse
hold
s O
wne
rshi
p H
oldi
ng S
arve
kshn
a V
ol 1
1 (2
),O
ctob
er-D
ecem
ber 1
995
and
NS
S 5
9Th
Rou
nd R
epor
t N
o. 4
91(5
9/18
.1/4
), H
ouse
hold
Ow
ners
hip
Hol
ding
s in
Ind
ia,
2003
, M
inis
try
ofSt
atis
tics
& P
rogr
amm
e Im
plem
enta
tion,
Gov
ernm
ent o
f In
dia.
25Ta
ble
7:P
erce
ntag
e D
istr
ibut
ion
of H
ouse
hold
s and
Are
a O
pera
ted
Ove
r B
road
Cla
sses
in J
amm
u an
d K
ashm
ir fo
r20
02-0
3, 1
992-
93,
1981
-82
and
1971
-72.
Size
of
Perc
enta
ge o
f H
ouse
hold
sPe
rcen
tage
of A
rea
Ope
rate
dO
pera
tion
alH
oldi
ngs
(Ha)
1971
-72
1981
-82
1992
-93
2002
-03
1971
-72
1981
-82
1991
-92
2002
-03
Not
Ope
rate
6.64
11.7
76.
397.
390.
000.
000.
000.
00(<
0.00
2)M
argi
nal
51.0
855
.93
54.6
770
.33
25.0
328
.60
24.5
631
.07
(0.0
02-1
.00)
Smal
l28
.71
20.5
924
.96
14.7
637
.38
31.3
034
.07
21.6
4(1
.01-
2.0
0)Se
mi-
Med
ium
11.5
09.
6911
.52
5.72
28.0
227
.50
29.1
216
.86
(2.
01-4
.00)
Med
ium
2.07
2.01
2.30
1.62
9.58
12.3
012
.25
9.22
(4.
01-1
0.00
)L
arge
0.00
0.03
0.00
0.20
0.00
0.33
0.00
21.2
1(1
0.01
& A
bove
)A
ll C
lass
es10
0 (5
650)
100
(816
8)10
0 (5
027)
100
(104
18)
100
(635
7)10
0 (7
754)
100
(518
7)10
0 (9
648)
Sour
ce: C
ompi
led
from
NSS
26th
Rou
nd, S
urve
y R
esul
ts o
n L
and
Hol
ding
s, S
arve
kshn
a V
ol 5
(3&
4), J
anua
ry-A
pril,
198
2;N
SS 3
7th R
ound
, E
stim
ates
of
Liv
esto
ck a
nd A
gric
ultu
ral
Impl
emen
ts C
lass
ifie
d by
Hou
seho
ld O
pera
tiona
l H
oldi
ng,
Sarv
eksh
na V
ol 1
3(3)
, Jan
uary
-Mar
ch, 1
990;
NSS
48th
Rou
nd, R
epor
t No.
408
, Liv
esto
ck a
nd A
gric
ultu
ral I
mpl
emen
ts in
Hou
seho
lds
Ope
ratio
nal
Hol
ding
s, J
anua
ry-D
ecem
ber,
1992
and
NSS
59t
h R
ound
Rep
ort
No.
492
, So
me
Asp
ects
of
Ope
ratio
nal L
and
Hol
ding
s in
Ind
ia, 2
002-
03,
Min
istr
y of
Sta
tistic
s &
Pro
gram
me
Impl
emen
tatio
n, G
over
nmen
t of
Indi
a.
26
decreasing trends in the case of small and semi-medium holdings may
be attributed to the increase in population and the consequent decrease
in their holding size as the land of the households getting divided into
several shares. But the percentage of medium size holdings remains
nearly constant or increasing. The area owned by them and large farmers
registers continuous increase. It may be because of their higher levels of
income which enable them to acquire more land and counterbalance
any adverse effect caused by division of land among heirs. Also,
households belonging to this category are better educated and have
smaller number of children per household.
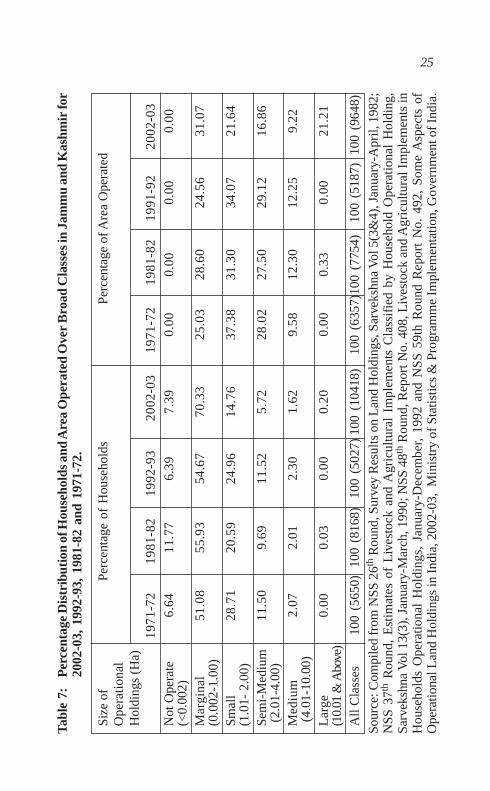
The marginal holdings have shown an increasing trend in the past
three decades compared to small, semi-medium, medium and large
operational holdings (see Table 7). For instance, it rose significantly to
70.33 per cent in 2002-03 from 51.08 per cent in 1971-72 and the total
area operated by them from 25.30 per cent to 31.07 per cent over the
same period. Moreover, the percentage of households who do not operate
land increased to 11.77 (1981-82) from 6.64 in 1971-72 and then
declined to 7.39 in 2002-03.
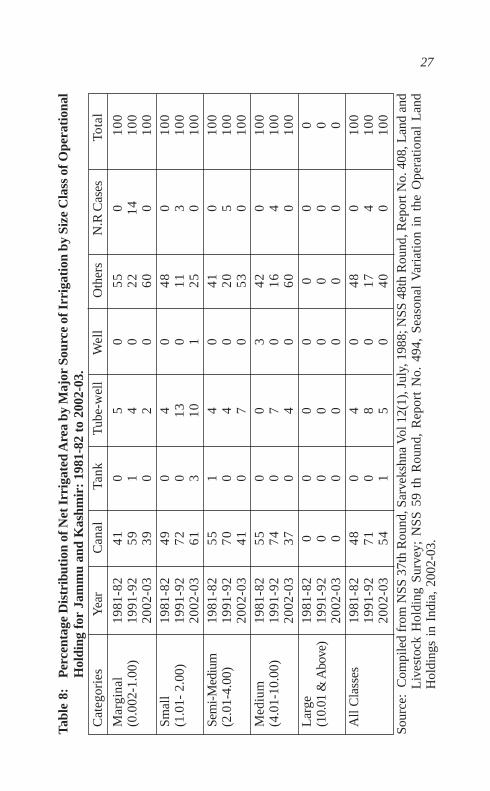
The estimates of the proportion of irrigated operated area and its
distribution by sources are given in Table 8. Judging by their shares in
the total irrigated area, canals were reported as the main source of
irrigation. Besides the canals, ‘others’ too were an equally important
source of irrigation in the state for a major part of the irrigated area
across all the categories. Though there is no substantial change seen
in the sources of irrigation, yet a positive relationship, though not
strong, is observed in case of canal irrigation with land holding size
between 1981-82 and 1991-92 and a negative relationship between
1991-92 and 2002-03. Whereas, no clear relationship is found for
others between size of holding and the other sources of irrigation as is
evident in Table 8.
27Ta
ble
8:P
erce
ntag
e D
istr
ibut
ion
of N
et I
rrig
ated
Are
a by
Maj
or S
ourc
e of
Irr
igat
ion
by S
ize
Cla
ss o
f Ope
rati
onal
Hol
ding
for
Jam
mu
and
Kas
hmir
: 19
81-8
2 to
200
2-03
.C
ateg
orie
sY
ear
Can
alTa
nkT
ube-
wel
lW
ell
Oth
ers
N.R
Cas
esTo
tal
Mar
gina
l19
81-8
241
05
055
010
0(0
.002
-1.0
0)19
91-9
259
14
022
1410
020
02-0
339
02
060
010
0Sm
all
1981
-82
490
40
480
100
(1.0
1- 2
.00)
1991
-92
720
130
113
100
2002
-03
613
101
250
100
Sem
i-M
ediu
m19
81-8
255
14
041
010
0(2
.01-
4.00
)19
91-9
270
04
020
510
020
02-0
341
07
053
010
0M
ediu
m19
81-8
255
00
342
010
0(4
.01-
10.0
0)19
91-9
274
07
016
410
020
02-0
337
04
060
010
0L
arge
1981
-82
00
00
00
0(1
0.01
& A
bove
)19
91-9
20
00
00
00
2002
-03
00
00
00
0A
ll C
lass
es19
81-8
248
04
048
010
019
91-9
271
08
017
410
020
02-0
354
15
040
010
0So
urce
: C
ompi
led
from
NSS
37t
h R
ound
, Sar
veks
hna
Vol
12(
1), J
uly,
198
8; N
SS 4
8th
Rou
nd, R
epor
t No.
408
, Lan
d an
dL
ives
tock
Hol
ding
Sur
vey;
NS
S 5
9 th
Rou
nd,
Rep
ort
No.
494
, S
easo
nal
Var
iati
on i
n th
e O
pera
tion
al L
and
Hol
ding
s in
Ind
ia,
2002
-03.
28
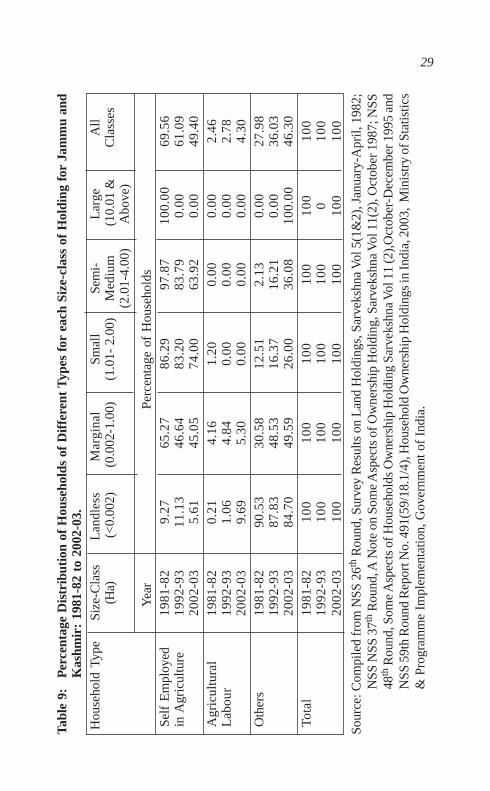
It is interesting to know about the changes in the nature of work of
those who do not own any land; it is natural that these households will
be engaged in ancillary and other non-agricultural activities. This is
clearly evident from the Table 9. The point needs to be noted that the
landless agricultural labour in terms of percentages increased
considerably from just 0.21 per cent (1981-82) to 9.69 per cent (2002-
03) as compared to rest of the household categories across holding size
during the similar point of time.
The trends of households which neither own nor operate any land
and those which own land but do not operate are reported in the
Table 10. It is evident that the percentage of households in both the
categories increased significantly during the past three decades. Those
who own land but do not operate have increased in terms of percentage
which indicates that cultivation is not remunerative for them; so they
require some other sources of income to supplement earnings for their
livelihood. As we have seen earlier, the increasing trend in the case of
landless agricultural labour may be due to the increase in the households
of those who neither own land nor operate which is discernible from the
Table 10.
(B) Physical Capital:
Like natural capital, physical capital too is very influential in
determining the household livelihood strategies. Physical capital
includes - type of house owned, agricultural implements, livestock, etc.
In recent years, more attention is given to promotion of diversified
agricultural growth for income augmentation and employment
generation. Animal husbandry and poultry farming are expected to play
an important role in supplementing the limited income and employment
opportunities in crop-production sub-sector of agriculture, particularly
for the small and marginal holdings. It is in this context that we note that
the state has a precious wealth of livestock in form of cattle-buffalo,
sheep, goats, poultry, etc. The cattle and poultry, amongst all the
29Ta
ble
9:P
erce
ntag
e D
istr
ibut
ion
of H
ouse
hold
s of
Dif
fere
nt T
ypes
for
eac
h Si
ze-c
lass
of
Hol
ding
for
Jam
mu
and
Kas
hmir
: 19
81-8
2 to
200
2-03
.H
ouse
hold
Typ
eSi
ze-C
lass
Lan
dles
sM
argi
nal
Smal
lSe
mi-
Lar
geA
ll(H
a) (
<0.
002)
(0.
002-
1.00
)(1
.01-
2.0
0)M
ediu
m (
10.0
1 &
Cla
sses
(2.0
1-4.
00)
Abo
ve)
Y
ear
Perc
enta
ge o
f H
ouse
hold
sSe
lf E
mpl
oyed
1981
-82
9.27
65.2
786
.29
97.8
710
0.00
69.5
6in
Agr
icul
ture
1992
-93
11.1
346
.64
83.2
083
.79
0.00
61.0
920
02-0
35.
6145
.05
74.0
063
.92
0.00
49.4
0A
gric
ultu
ral
1981
-82
0.21
4.16
1.20
0.00
0.00
2.46
Lab
our
1992
-93
1.06
4.84
0.00
0.00
0.00
2.78
2002
-03
9.69
5.30
0.00
0.00
0.00
4.30
Oth
ers
1981
-82
90.5
330
.58
12.5
12.
130.
0027
.98
1992
-93
87.8
348
.53
16.3
716
.21
0.00
36.0
320
02-0
384
.70
49.5
926
.00
36.0
810
0.00
46.3
0To
tal
1981
-82
100
100
100
100
100
100
1992
-93
100
100
100
100
010
020
02-0
310
010
010
010
010
010
0
Sour
ce: C
ompi
led
from
NSS
26th
Rou
nd, S
urve
y R
esul
ts o
n L
and
Hol
ding
s, S
arve
kshn
a V
ol 5
(1&
2), J
anua
ry-A
pril,
198
2;N
SS N
SS 3
7th R
ound
, A N
ote
on S
ome
Asp
ects
of O
wne
rshi
p H
oldi
ng, S
arve
kshn
a V
ol 1
1(2)
, Oct
ober
198
7; N
SS48
th R
ound
, Som
e A
spec
ts o
f Hou
seho
lds
Ow
ners
hip
Hol
ding
Sar
veks
hna
Vol
11
(2),
Oct
ober
-Dec
embe
r 199
5 an
dN
SS 5
9th
Rou
nd R
epor
t No.
491
(59/
18.1
/4),
Hou
seho
ld O
wne
rshi
p H
oldi
ngs
in In
dia,
200
3, M
inis
try
of S
tatis
tics
& P
rogr
amm
e Im
plem
enta
tion,
Gov
ernm
ent o
f In
dia.

30
livestock, are considered the most important asset for the development
of the rural economy. The details in this regard are explained below.
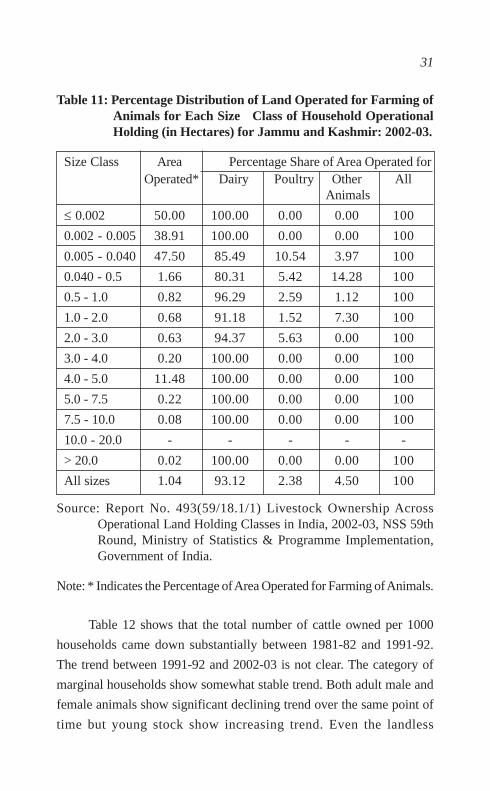
In the class size of household operational holdings, there is
variation in the percentage distribution of land operated for farming of
animals. It is evident that majority marginal holdings employ their
operated area under farming of animals in relation to their counterparts
(See Table 11). This might be attributed to the fact that cultivation is not
viable for marginal and small holders who have very limited capital for
investment. As they require some supplementary sources of income to
sustain their livelihood, they have taken up animal rearing. Dairy farming
has spread across all the classes of households compared to other
categories of farming.
Table 10: Changes in the Percentage of Households which neitherOwn nor Operate any Land and Households which OwnLand but do not Operate for Jammu and Kashmir: 1981 to2003 (Per cent).
Household Categories 1971-72 1981-82 1992-93 2002-03
Neither Own nor
Operate any Land 0.39 NA 45.14 38.23
Own Land but do not
Operate 6.07 NA 54.81 61.77
Source: Compiled from NSS 26th Round, Survey Results on LandHoldings, Sarvekshna Vol 5(3&4), January-April, 1982; NSS48th Round, Report No. 408, Livestock and AgriculturalImplements in Households Operational Holdings, January-December, 1992 and NSS 59th Round Report No. 492, SomeAspects of Operational Land Holdings in India, 2002-03,Ministry of Statistics & Programme Implementation,Government of India.
Note: NA= Not available
31
Table 11: Percentage Distribution of Land Operated for Farming ofAnimals for Each Size Class of Household OperationalHolding (in Hectares) for Jammu and Kashmir: 2002-03.
Size Class Area Percentage Share of Area Operated for Operated* Dairy Poultry Other All
Animals
≤ 0.002 50.00 100.00 0.00 0.00 100
0.002 - 0.005 38.91 100.00 0.00 0.00 100
0.005 - 0.040 47.50 85.49 10.54 3.97 100
0.040 - 0.5 1.66 80.31 5.42 14.28 100
0.5 - 1.0 0.82 96.29 2.59 1.12 100
1.0 - 2.0 0.68 91.18 1.52 7.30 100
2.0 - 3.0 0.63 94.37 5.63 0.00 100
3.0 - 4.0 0.20 100.00 0.00 0.00 100
4.0 - 5.0 11.48 100.00 0.00 0.00 100
5.0 - 7.5 0.22 100.00 0.00 0.00 100
7.5 - 10.0 0.08 100.00 0.00 0.00 100
10.0 - 20.0 - - - - -
> 20.0 0.02 100.00 0.00 0.00 100
All sizes 1.04 93.12 2.38 4.50 100
Source: Report No. 493(59/18.1/1) Livestock Ownership AcrossOperational Land Holding Classes in India, 2002-03, NSS 59thRound, Ministry of Statistics & Programme Implementation,Government of India.
Note: * Indicates the Percentage of Area Operated for Farming of Animals.
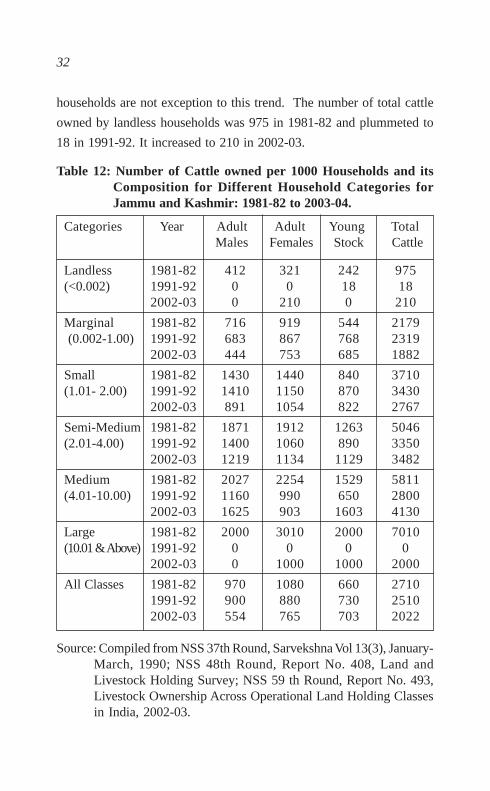
Table 12 shows that the total number of cattle owned per 1000
households came down substantially between 1981-82 and 1991-92.
The trend between 1991-92 and 2002-03 is not clear. The category of
marginal households show somewhat stable trend. Both adult male and
female animals show significant declining trend over the same point of
time but young stock show increasing trend. Even the landless
32
households are not exception to this trend. The number of total cattle
owned by landless households was 975 in 1981-82 and plummeted to
18 in 1991-92. It increased to 210 in 2002-03.
Table 12: Number of Cattle owned per 1000 Households and itsComposition for Different Household Categories forJammu and Kashmir: 1981-82 to 2003-04.
Categories Year Adult Adult Young TotalMales Females Stock Cattle
Landless 1981-82 412 321 242 975(<0.002) 1991-92 0 0 18 18
2002-03 0 210 0 210
Marginal 1981-82 716 919 544 2179 (0.002-1.00) 1991-92 683 867 768 2319
2002-03 444 753 685 1882
Small 1981-82 1430 1440 840 3710(1.01- 2.00) 1991-92 1410 1150 870 3430
2002-03 891 1054 822 2767
Semi-Medium 1981-82 1871 1912 1263 5046(2.01-4.00) 1991-92 1400 1060 890 3350
2002-03 1219 1134 1129 3482
Medium 1981-82 2027 2254 1529 5811(4.01-10.00) 1991-92 1160 990 650 2800
2002-03 1625 903 1603 4130
Large 1981-82 2000 3010 2000 7010(10.01 & Above) 1991-92 0 0 0 0
2002-03 0 1000 1000 2000
All Classes 1981-82 970 1080 660 27101991-92 900 880 730 25102002-03 554 765 703 2022
Source: Compiled from NSS 37th Round, Sarvekshna Vol 13(3), January-March, 1990; NSS 48th Round, Report No. 408, Land andLivestock Holding Survey; NSS 59 th Round, Report No. 493,Livestock Ownership Across Operational Land Holding Classesin India, 2002-03.
33
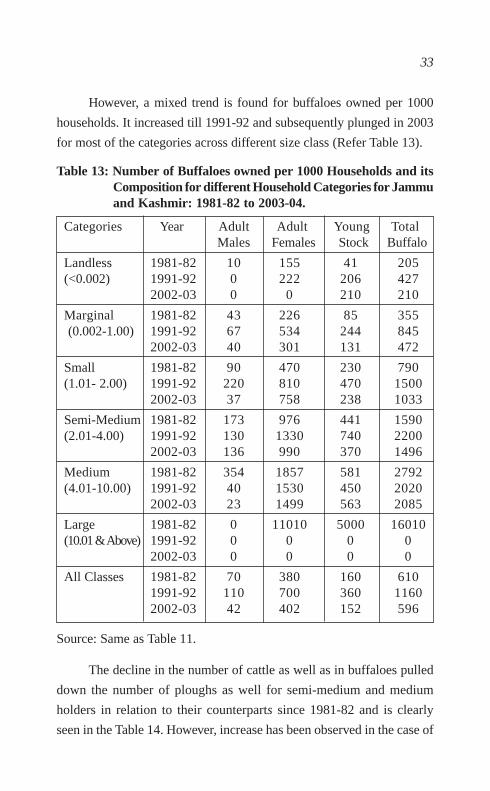
However, a mixed trend is found for buffaloes owned per 1000
households. It increased till 1991-92 and subsequently plunged in 2003
for most of the categories across different size class (Refer Table 13).
Table 13: Number of Buffaloes owned per 1000 Households and itsComposition for different Household Categories for Jammuand Kashmir: 1981-82 to 2003-04.
Categories Year Adult Adult Young TotalMales Females Stock Buffalo
Landless 1981-82 10 155 41 205(<0.002) 1991-92 0 222 206 427
2002-03 0 0 210 210
Marginal 1981-82 43 226 85 355 (0.002-1.00) 1991-92 67 534 244 845
2002-03 40 301 131 472
Small 1981-82 90 470 230 790(1.01- 2.00) 1991-92 220 810 470 1500
2002-03 37 758 238 1033
Semi-Medium 1981-82 173 976 441 1590(2.01-4.00) 1991-92 130 1330 740 2200
2002-03 136 990 370 1496
Medium 1981-82 354 1857 581 2792(4.01-10.00) 1991-92 40 1530 450 2020
2002-03 23 1499 563 2085
Large 1981-82 0 11010 5000 16010(10.01 & Above) 1991-92 0 0 0 0
2002-03 0 0 0 0
All Classes 1981-82 70 380 160 6101991-92 110 700 360 11602002-03 42 402 152 596
Source: Same as Table 11.
The decline in the number of cattle as well as in buffaloes pulled
down the number of ploughs as well for semi-medium and medium
holders in relation to their counterparts since 1981-82 and is clearly
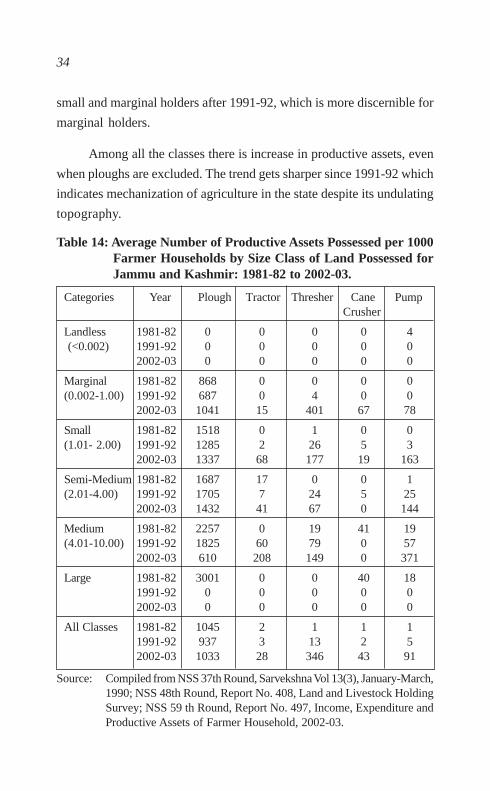
seen in the Table 14. However, increase has been observed in the case of
34
small and marginal holders after 1991-92, which is more discernible for
marginal holders.
Among all the classes there is increase in productive assets, even
when ploughs are excluded. The trend gets sharper since 1991-92 which
indicates mechanization of agriculture in the state despite its undulating
topography.
Table 14: Average Number of Productive Assets Possessed per 1000Farmer Households by Size Class of Land Possessed forJammu and Kashmir: 1981-82 to 2002-03.
Categories Year Plough Tractor Thresher Cane PumpCrusher
Landless 1981-82 0 0 0 0 4 (<0.002) 1991-92 0 0 0 0 0
2002-03 0 0 0 0 0
Marginal 1981-82 868 0 0 0 0(0.002-1.00) 1991-92 687 0 4 0 0
2002-03 1041 15 401 67 78
Small 1981-82 1518 0 1 0 0(1.01- 2.00) 1991-92 1285 2 26 5 3
2002-03 1337 68 177 19 163
Semi-Medium 1981-82 1687 17 0 0 1(2.01-4.00) 1991-92 1705 7 24 5 25
2002-03 1432 41 67 0 144
Medium 1981-82 2257 0 19 41 19(4.01-10.00) 1991-92 1825 60 79 0 57
2002-03 610 208 149 0 371
Large 1981-82 3001 0 0 40 181991-92 0 0 0 0 02002-03 0 0 0 0 0
All Classes 1981-82 1045 2 1 1 11991-92 937 3 13 2 52002-03 1033 28 346 43 91
Source: Compiled from NSS 37th Round, Sarvekshna Vol 13(3), January-March,1990; NSS 48th Round, Report No. 408, Land and Livestock HoldingSurvey; NSS 59 th Round, Report No. 497, Income, Expenditure andProductive Assets of Farmer Household, 2002-03.

35
(C) Financial Capital
After examining the ownership of natural and physical capitals, it
is imperative to assess the ownership of financial capital which consists
of savings, credit and investments (assets and liabilities). The information
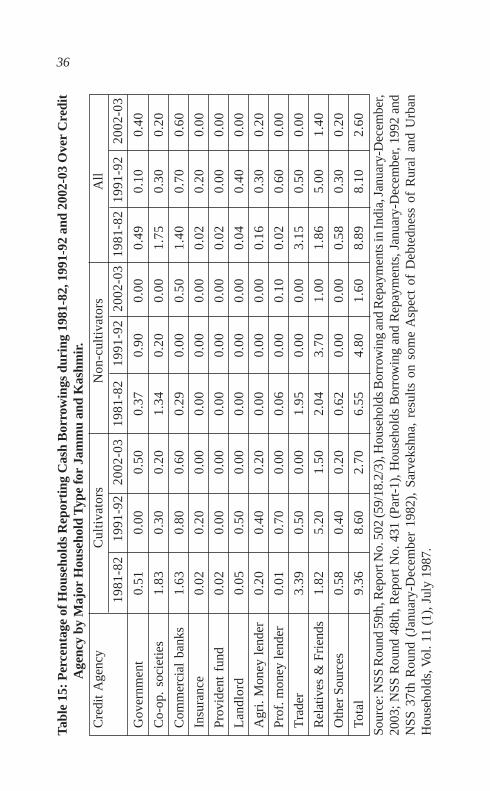
with respect to households reporting cash borrowings is reported in the
Table 15. The table displays the incidence of borrowing, that is,
percentage of households reporting cash loans, by occupational
categories from 1981 to 2003 for the state of Jammu and Kashmir. Very
little change in the levels of incidence of borrowings for all the
households is noticed between 1981-82 and 1991-92, which remained
around 8 per cent over the period and then declined to 2.60 per cent in
2002-03. Similar trend has been observed in case of cultivators and
non-cultivators. However, throughout the 80s and 90s, incidence of
borrowings for cultivator households was distinctly higher than that of
non-cultivator households.
The dynamics of credit agencies for imparting cash loans to the
households in the last two decades is interesting. 3.15 per cent of
households borrowed cash from traders in 1981-82 and the figure came
down to 0.50 per cent in1991-92. Whereas the highest proportion of all
households borrowed cash from relatives and friends during 1991-92 (5
per cent), thereafter the figure substantially declined to 1.40 per cent.
Still it remained the dominant agency in 2002-03 amongst all the credit
agencies. This characterization is true for cultivators also. Relatives and
friends remained the dominant lending agency amongst all the credit
agencies in case of non-cultivators also in the last two decades (see
Table 15).
It is seen from Table 16 that throughout 80s and 90s, the maximum
amount of institutional borrowings of rural households was from
commercial banks, whereas in 2002-03 it was from government
departments. Among non-institutional credit agencies, the households
borrowed highest amount from traders in 1981-82. Relatives and friends
36Ta
ble
15: P
erce
ntag
e of
Hou
seho
lds
Rep
orti
ng C
ash
Bor
row
ings
dur
ing
1981
-82,
199
1-92
and
200
2-03
Ove
r C
redi
tA
genc
y by
Maj
or H
ouse
hold
Typ
e fo
r Ja
mm
u an
d K
ashm
ir.
Cre
dit
Age
ncy
Cul
tiva
tors
Non
-cul
tiva
tors
All
1981
-82
1991
-92
2002
-03
1981
-82
1991
-92
2002
-03
1981
-82
1991
-92
2002
-03
Gov
ernm
ent
0.51
0.00
0.50
0.37
0.90
0.00
0.49
0.10
0.40
Co-
op.
soci
etie
s1.
830.
300.
201.
340.
200.
001.
750.
300.
20
Com
mer
cial
ban
ks1.
630.
800.
600.
290.
000.
501.
400.
700.
60
Insu
ranc
e0.
020.
200.
000.
000.
000.
000.
020.
200.
00
Prov
iden
t fu
nd0.
020.
000.
000.
000.
000.
000.
020.
000.
00
Lan
dlor
d0.
050.
500.
000.
000.
000.
000.
040.
400.
00
Agr
i. M
oney
len
der
0.20
0.40
0.20
0.00
0.00
0.00
0.16
0.30
0.20
Prof
. mon
ey le
nder
0.01
0.70
0.00
0.06
0.00
0.10
0.02
0.60
0.00
Tra
der
3.39
0.50
0.00
1.95
0.00
0.00
3.15
0.50
0.00
Rel
ativ
es &
Fri
ends
1.82
5.20
1.50
2.04
3.70
1.00
1.86
5.00
1.40
Oth
er S
ourc
es0.
580.
400.
200.
620.
000.
000.
580.
300.
20
Tota
l9.
368.
602.
706.
554.
801.
608.
898.
102.
60
Sour
ce: N
SS R
ound
59t
h, R
epor
t No.
502
(59/
18.2
/3),
Hou
seho
lds
Bor
row
ing
and
Rep
aym
ents
in In
dia,
Jan
uary
-Dec
embe
r,20
03; N
SS R
ound
48t
h, R
epor
t No.
431
(Pa
rt-1
), H
ouse
hold
s B
orro
win
g an
d R
epay
men
ts, J
anua
ry-D
ecem
ber,
1992
and
NSS
37t
h R
ound
(Ja
nuar
y-D
ecem
ber
1982
), S
arve
kshn
a, r
esul
ts o
n so
me
Asp
ect
of D
ebte
dnes
s of
Rur
al a
nd U
rban
Hou
seho
lds,
Vol
. 11
(1),
Jul
y 19
87.

37Ta
ble
16:
Cha
nges
in
the
Per
cent
age
Shar
e of
Am
ount
of
Cas
h B
orro
win
gs d
urin
g 19
81-8
2, 1
991-
92 a
nd 2
002-
03O
ver
Cre
dit A
genc
y by
Maj
or H
ouse
hold
Typ
e fo
r Ja
mm
u an
d K
ashm
ir.
Cre
dit
Age
ncy
Cul
tiva
tors
Non
-cul
tiva
tors
All
1981
-82
1991
-92
2002
-03
1981
-82
1991
-92
2002
-03
1981
-82
1991
-92
2002
-03
Gov
ernm
ent
5.21
0.00
48.4
00.
434.
400.
004.
890.
1043
.00
Co-
op.
soci
etie
s7.
664.
202.
304.
553.
100.
007.
454.
202.
00
Com
mer
cial
ban
ks32
.87
36.7
031
.60
6.80
0.00
76.6
031
.12
35.8
036
.70
Insu
ranc
e0.
002.
700.
000.
000.
000.
000.
002.
700.
00
Prov
iden
t fu
nd0.
080.
000.
000.
000.
000.
000.
070.
000.
00
Lan
dlor
d0.
134.
300.
000.
000.
000.
000.
124.
200.
00
Agr
i. M
oney
len
der
1.26
0.50
0.70
0.00
0.00
0.00
1.17
0.50
0.60
Prof
. mon
ey le
nder
0.56
3.50
0.00
0.61
0.00
12.6
00.
563.
401.
40
Tra
der
24.0
72.
300.
1073
.91
0.00
0.00
27.4
12.
300.
10
Rel
ativ
es &
Fri
ends
12.9
444
.90
12.5
011
.71
92.5
07.
0012
.86
46.0
011
.90
Oth
er s
ourc
es15
.23
0.90
4.40
1.98
0.00
3.80
14.3
40.
804.
30
Tota
l10
010
010
010
010
010
010
010
010
0
Sour
ce: N
SS R
ound
59t
h, R
epor
t No.
502
(59/
18.2
/3),
Hou
seho
lds
Bor
row
ing
and
Rep
aym
ents
in In
dia,
Jan
uary
-Dec
embe
r,20
03;
NSS
Rou
nd 4
8th,
Rep
ort
No.
431
(Pa
rt-1
), H
ouse
hold
s B
orro
win
g an
d R
epay
men
ts,
Janu
ary-
Dec
embe
r,19
92 a
nd N
SS 3
7th
Rou
nd (
Janu
ary-
Dec
embe
r 19
82),
Sar
veks
hna,
resu
lts o
n so
me
Asp
ect o
f D
ebte
dnes
s of
Rur
alan
d U
rban
Hou
seho
lds,
Vol
. 11
(1),
Jul
y 19
87.
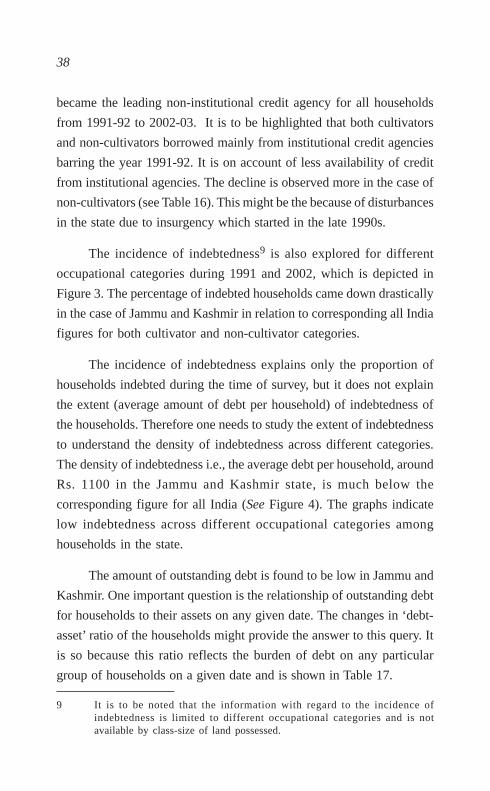
38
became the leading non-institutional credit agency for all households
from 1991-92 to 2002-03. It is to be highlighted that both cultivators
and non-cultivators borrowed mainly from institutional credit agencies
barring the year 1991-92. It is on account of less availability of credit
from institutional agencies. The decline is observed more in the case of
non-cultivators (see Table 16). This might be the because of disturbances
in the state due to insurgency which started in the late 1990s.
The incidence of indebtedness9 is also explored for different
occupational categories during 1991 and 2002, which is depicted in
Figure 3. The percentage of indebted households came down drastically
in the case of Jammu and Kashmir in relation to corresponding all India
figures for both cultivator and non-cultivator categories.
The incidence of indebtedness explains only the proportion of
households indebted during the time of survey, but it does not explain
the extent (average amount of debt per household) of indebtedness of
the households. Therefore one needs to study the extent of indebtedness
to understand the density of indebtedness across different categories.
The density of indebtedness i.e., the average debt per household, around
Rs. 1100 in the Jammu and Kashmir state, is much below the
corresponding figure for all India (See Figure 4). The graphs indicate
low indebtedness across different occupational categories among
households in the state.
The amount of outstanding debt is found to be low in Jammu and
Kashmir. One important question is the relationship of outstanding debt
for households to their assets on any given date. The changes in ‘debt-
asset’ ratio of the households might provide the answer to this query. It
is so because this ratio reflects the burden of debt on any particular
group of households on a given date and is shown in Table 17.
9 It is to be noted that the information with regard to the incidence ofindebtedness is limited to different occupational categories and is notavailable by class-size of land possessed.
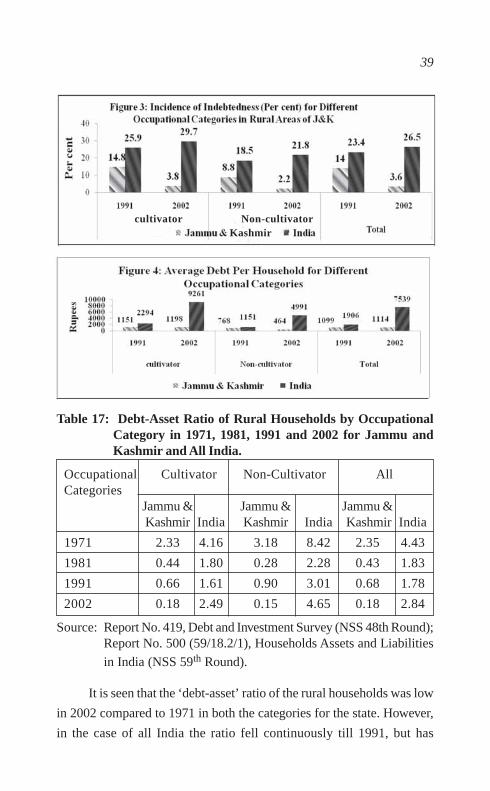
39
Table 17: Debt-Asset Ratio of Rural Households by OccupationalCategory in 1971, 1981, 1991 and 2002 for Jammu andKashmir and All India.
Occupational Cultivator Non-Cultivator AllCategories
Jammu & Jammu & Jammu &Kashmir India Kashmir India Kashmir India
1971 2.33 4.16 3.18 8.42 2.35 4.43
1981 0.44 1.80 0.28 2.28 0.43 1.83
1991 0.66 1.61 0.90 3.01 0.68 1.78
2002 0.18 2.49 0.15 4.65 0.18 2.84
Source: Report No. 419, Debt and Investment Survey (NSS 48th Round);Report No. 500 (59/18.2/1), Households Assets and Liabilities
in India (NSS 59th Round).
It is seen that the ‘debt-asset’ ratio of the rural households was low
in 2002 compared to 1971 in both the categories for the state. However,
in the case of all India the ratio fell continuously till 1991, but has
cultivatorKashmir
Non-cultivator

40
increased since then. The burden of debt was lower for households
belonging to cultivator against non-cultivator households both in the state
as well as in All India situation. This finding is consistent with what we found
earlier in the case of value of assets, that they accrued more to the cultivators
than to non-cultivators. This may partly be the reason for the low debt
among cultivator households in the state. The important issue here is:
why the extent of indebtedness in the state of Jammu and Kashmir is
lower than in All India? One possible explanation may be the non-
availability of adequate credit in the state. It is seen from the study by
Narayanamoorthy and Kalamkar (2005) that the agricultural credit
availability per hectare of net sown area is very low in the state, that is, Rs.
438 as compared to the national average of Rs. 5340. Moreover, the study
found positive and significant relationship between the availability of
credit per hectare of net sown area and the extent of indebtedness.
The information provided, by NSS 59th round, in the Table 18
suggests that small and marginal farmers are heavily dependent on the
institutional credit as compared to medium farmer households who took
loan from relatives and friends. The point to be underlined here is that
those who do not have access to land are not getting loan from any of
the specified institutional sources. Therefore, it would be more useful to
examine how these households sustain their livelihood while coping
up with the lack of access to credit.
A shift has been observed away from agricultural activities in the
state. Yet, on the whole, the dependency of workers on this sector for
their livelihood is still dominant in the past two decades. Here, it is
necessary to find an answer to the following question- why the
dependency of workers is more on agricultural sector? To find an answer
to this question, we tried to look into the educational level of the workers,
across different industrial categories. Literacy levels available within
the households fall under the category of human capital which is also
one of the important livelihood assets. The data regarding literacy level
given here is limited to occupational categories.
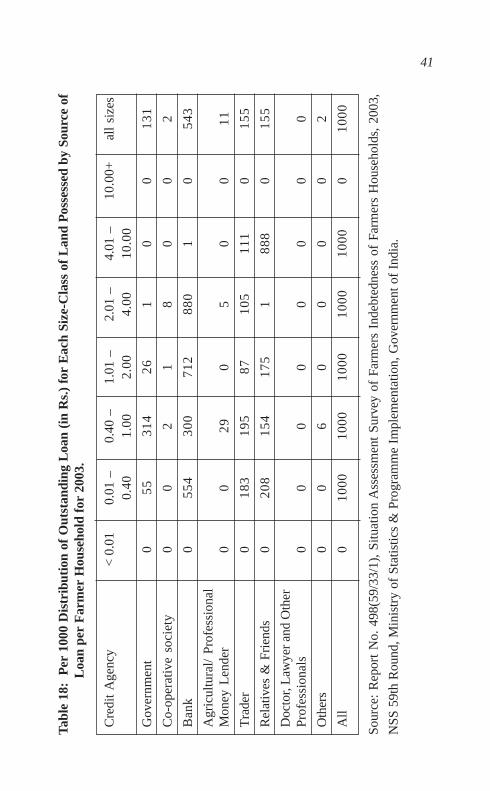
41Ta
ble
18:
Per
100
0 D
istr
ibut
ion
of O
utst
andi
ng L
oan
(in
Rs.
) fo
r E
ach
Size
-Cla
ss o
f L
and
Pos
sess
ed b
y So
urce
of
Loa
n pe
r F
arm
er H
ouse
hold
for
200
3.
Cre
dit
Age
ncy
< 0
.01
0.01
–0.
40 –
1.01
–2.
01 –
4.01
–10
.00+
all
size
s0.
401.
002.
004.
0010
.00
Gov
ernm
ent
055
314
261
00
131
Co-
oper
ativ
e so
ciet
y0
02
18
00
2
Ban
k0
554
300
712
880
10
543
Agr
icul
tura
l/ Pr
ofes
sion
alM
oney
Len
der
00
290
50
011
Tra
der
018
319
587
105
111
015
5
Rel
ativ
es &
Fri
ends
020
815
417
51
888
015
5
Doc
tor,
Law
yer
and
Oth
erPr
ofes
sion
als
00
00
00
00
Oth
ers
00
60
00
02
All
010
0010
0010
0010
0010
000
1000
Sour
ce:
Rep
ort
No.
498
(59/
33/1
), S
ituat
ion
Ass
essm
ent
Surv
ey o
f Fa
rmer
s In
debt
edne
ss o
f Fa
rmer
s H
ouse
hold
s, 2
003,
NSS
59t
h R
ound
, Min
istr
y of
Sta
tistic
s &
Pro
gram
me
Impl
emen
tatio
n, G
over
nmen
t of
Indi
a.
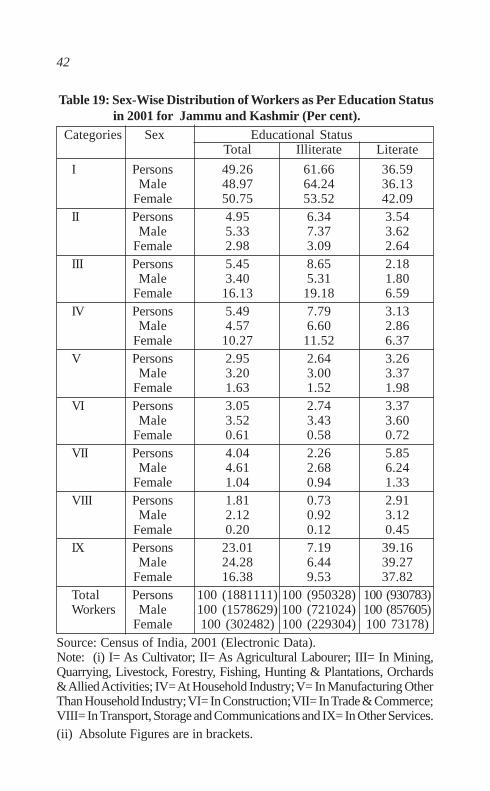
42
Table 19: Sex-Wise Distribution of Workers as Per Education Statusin 2001 for Jammu and Kashmir (Per cent).
Categories Sex Educational StatusTotal Illiterate Literate
I Persons 49.26 61.66 36.59Male 48.97 64.24 36.13
Female 50.75 53.52 42.09II Persons 4.95 6.34 3.54
Male 5.33 7.37 3.62Female 2.98 3.09 2.64
III Persons 5.45 8.65 2.18Male 3.40 5.31 1.80
Female 16.13 19.18 6.59IV Persons 5.49 7.79 3.13
Male 4.57 6.60 2.86Female 10.27 11.52 6.37
V Persons 2.95 2.64 3.26Male 3.20 3.00 3.37
Female 1.63 1.52 1.98VI Persons 3.05 2.74 3.37
Male 3.52 3.43 3.60Female 0.61 0.58 0.72
VII Persons 4.04 2.26 5.85Male 4.61 2.68 6.24
Female 1.04 0.94 1.33VIII Persons 1.81 0.73 2.91
Male 2.12 0.92 3.12Female 0.20 0.12 0.45
IX Persons 23.01 7.19 39.16Male 24.28 6.44 39.27
Female 16.38 9.53 37.82Total Persons 100 (1881111) 100 (950328) 100 (930783)Workers Male 100 (1578629) 100 (721024) 100 (857605)
Female 100 (302482) 100 (229304) 100 73178)Source: Census of India, 2001 (Electronic Data).Note: (i) I= As Cultivator; II= As Agricultural Labourer; III= In Mining,Quarrying, Livestock, Forestry, Fishing, Hunting & Plantations, Orchards& Allied Activities; IV= At Household Industry; V= In Manufacturing OtherThan Household Industry; VI= In Construction; VII= In Trade & Commerce;VIII= In Transport, Storage and Communications and IX= In Other Services.(ii) Absolute Figures are in brackets.
43
(D) Human Capital:
The sex-wise percentages of different categories of workers to
total main workers, as per education status, are presented in Table 19.
Majority of total illiterate workers are engaged in cultivation (category
I) as is evident in Table 19. It is interesting to note that the females
engaged in cultivation are less illiterate than males, that is, 53.53 per
cent and 64.24 per cent, respectively. Correspondingly the percentage
of literate males (36.13) is less than females (42.09) dependent on
cultivation amongst total literate workers. Further, more literate workers
are engaged in other services (category IX) irrespective of sex. It is also
noticed that in categories such as; mining, quarrying, livestock, forestry,
fishing, hunting & plantations, orchards & allied activities; household
industry and other services females are found to be more illiterate in
relation to other categories and their counterparts (See Table 19).
After category I – cultivators, the percentage of literate male
workers were more in category IX - other services sector. Total male
literate workers remained under 7 per cent in other sectors. These findings
indicate the importance of education, which enables the workers,
regardless of sex, to avail the opportunities arising in the non-agricultural
sector. As a result, the workers with low education level were forced to
remain in the agricultural sector. This, among others, is reinforced by
militancy, limited scope in secondary & tourism sectors and lack of
other avenues for employment.
V. Summing Up
The foregoing discussion brings out some interesting patterns,
which are summarized in this section. The main points are as follows:
Firstly, in the occupational structure of the workers, there is a shift
away from agricultural sector to other sectors. Interestingly, those
households which have low MPCE (monthly per capita expenditure)
have diversified their sources of income to multiple avenues than one

44
source of income. This is not an unexpected result; because the
marginalized households are bound to spread the risk and uncertainty
for their survival by availing every opportunity without waiting for
specific well paid tasks.
Secondly, cultivation still remains the dominant livelihood
strategy among workers in the state notwithstanding the shift especially
to manufacturing and tertiary activities over the period. This may partly
be attributed to high percentages of rural illiterate workers among those
engaged in the cultivation and partly to fewer opportunities in other
sectors due to insurgency in the state. This issue needs to be looked into
in more detail across households to see what role literacy has played
among workers to attain various kind of skills to avail the opportunities
in other non-agricultural sectors.
Thirdly, the relative position of land, building or any other item
of assets in the total value of assets did not change considerably between
1981 and 2002. Amongst various assets, the land and building have
remained the most important components of assets owned by the (both
cultivators and non-cultivators) households. Moreover, all categories
of households by and large possessed varying number of cattle and
buffalo to supplement their income to withstand risk and uncertainty. In
other words, the accumulation of assets is helpful to reduce the
vulnerability of households and allow them to exploit income-generating
activities. It makes them capable of diversification from cultivation to
other activities.
Fourthly, the different reports of NSSO pointed out that the
agrarian structure of the state has been shifting towards marginal farms
with respect to both ownership and operational holdings during the
past three decades. The incidence of landless households is very low in
the state as against the all-India situation. In addition, households which
do not operate as well as those which neither own nor operate any land
45
have fallen substantially over the same period of time. These data direct
to the tentative conclusion that these are vulnerable households and
that their livelihood is more at risk than that of better-off categories of
households. Since they are indebted, they are less capable to cope up
with risk by diversifying their livelihood activities. This is corroborated
by the increase in landless agricultural labour. Further, it also came out
during the discussions that those who own land but do not operate are
increasing in terms of percentage. This indicates that cultivation is not
remunerative for them; they require some other sources of income to
supplement their earning for their livelihood. Therefore, an attempt has
been made to examine the livelihood portfolios and level of incomes of
these types of households in comparison with well-off households using
survey data.
The state also has maintained the value of assets for both
cultivators and non-cultivators, the two occupational categories. The
value of assets is found more in case of cultivators as against non-
cultivators. Further, the number of households belonging to the
categories of landless labourers, marginal or smallholdings has only
low levels of indebtedness. This is attributed to the lack of availability
of credit for most households in the state. Against this background, it
would be more useful to see how these households sustain their
livelihood despite coping up with the lack of access to credit.
Finally, the percentage distribution of land operated for farming
of animals, as per class size of household operational holding, suggests
that dairy farming retained its importance across all the classes. However,
the distribution is skewed towards marginal and small holdings. The
total number of cattle owned per 1000 households substantially came
down since 1981-82 to 1991-92 but increased slightly by 2002-03.
Reverse is true in the case of number of buffaloes per 1000 for all the
size classes during the same period.
46
In short, these trends indicate that a rapid process of marginal
farming in agriculture is taking place. Consequently, those marginal
holdings may not be viable to sustain the livelihoods of those depending
on them for their livelihood. In this context, one can expect more shift
of the population towards the ancillary activities. Therefore, an effort is
made to understand the livelihood strategies adapted by them to sustain
their livelihood.
A shift in occupational pattern from the primary sector to the
secondary & tertiary sectors or a shift in the origination of income from
agriculture to industry & the tertiary sector is considered to be a natural
process of economic development. Thus, diversification is undertaken
to move to a better state than the existing one. In fact, each household
has its own strategy of decision-making on the allocation of resources
among different income-generation activities. Sometimes, a member
also finds multiple sources of income during a particular time or at
different times of the year.
In addition, a large number of studies, mentioned in the
introductory part, argued that livelihood strategies differ across the
households. The rationale behind this is that the poor households do
not have other options, other than diversification - by taking up whatever
opportunities available for their survival as compared to their
counterparts, which diversify as per expected pay-offs in other activities.
In other words, poor households diversify for their survival and rich
households diversify for accumulation of wealth (Marschke and Berkes,
2006). Information is not available to clarify this aspect at the micro
level, which limits us to understand diversification process at macro-
level. There is immense scope to fill this gap and to establish a link
between macro and micro policies on the subject. This subject has
gained importance recently. One moot point came out from the discussion
is that low education level of the workers coupled with insurgency has
imposed constraints over their entry into other sectors. Therefore, that
47
forced the workers to remain in the agricultural sector which is a serious
cause of concern. This has happened despite the state having immense
potential to diversify due to its richness in variety, conducive
environment for cultivation of multiplicity of crops, etc.
Moreover, lack of information across households by size-
categories did not allow us to see the correlation among various assets
and livelihood outcomes, as varying possession of assets among
households are responsible for differences in the livelihood outcomes
(say for example, monthly per capita income/expenditure, literacy rate,
etc.). The available micro-level evidence suggests that there is significant
correlation between all types of assets; that it is the highest between
land and investment, and land and education. It is obvious that those
with larger landholdings have better access to finance and education.
Naturally their consumption expenditure, which is considered one of
the main livelihood outcomes, is also on the higher side (Nair et al.,
2007). Also, it is important to explore the characteristics of households
engaged in different types of diversification because we are unable to
determine whether the assets identified are necessary for a particular
diversification strategy. This would require much more quantitative
data as well as more in-depth qualitative analysis. Different combinations
of assets may be the reason why some households diversify and others
do not; again, it is something that is difficult to conclude definitively
from the present analysis. Not knowing whether households chose a
particular diversification strategy because of distress, growth or distress
mitigation further limits the interpretation.
However, by looking at the data and complementary secondary
sources, we are able to get a good idea of the possible reasons for
diversification and are able to form some tentative hypotheses. In the
state of Jammu and Kashmir, a majority of people depend on agriculture
for their survival. Given the inability of this sector to impart secure
livelihoods, it would be of interest to study the livelihoods of the
48
households and to understand their survival strategies at ground level.
In this vein, some of the possible research questions are raised below. A
few of them one could be taken up for investigation at micro-level.
• What are household’s current livelihood activities? From where
do they derive income/food? What strategies are employed in
meeting basic household needs? What are the coping mechanisms
used by different households in response to different shocks?
How diversification impacts on livelihood security? Under what
circumstances does diversification lead to a decrease in inequality
and poverty?
• What critical external factors (markets, policies, institutions) shape
livelihoods? Which internal factors play a vital role in shaping
the outcome of people’s livelihoods? What are the characteristics
of households that diversify? Have small, resource-poor
households diversified more or less than their larger, resource-
rich counterparts?
• In what ways is diversification a response to the sources of
uncertainty that people face? Has diversification allowed small
and marginal farmers to cope better with the shocks/vulnerability
or has it exaggerated problems?
• Is diversification a strategic approach to an expanded opportunity
(i.e. ‘thriving’) set, or a constrained response to a diminished set
of opportunities (i.e. coping)? Has diversification offered the
freedom and choice to move out of entrenched and dependent
caste, class or gender based activities?

49
Rajeev Sharma is a Doctoral Scholar at the Centre for
Development Studies, Thiruvananthapuram, Kerala. His
area of interest is in the field of Agriculture and Rural
Development. Presently, he is working on the topic entitled
"Livelihood Diversification and Rural Development : An
Empirical Investigation of the conditions in Jammu and
Kashmir."
E mail: [email protected]; [email protected]
50
References
Berhanu, W; Coleman, D., and Fayissa B. (2007), ‘Diversification and
Livelihood sustainability in a Semi-Arid Environment: A Case
Study from Southern Ethiopia’, Journal of Development Studies,
43(5): 871-889.
Bebbington, A. (1999), ‘Capitals and Capabilities: A Framework for
analyzing Peasant Viability, Rural Livelihoods and Poverty’,
World Development, 27(12): 2021-2044.
Chambers, R., and Gordon, R.C. (1992), ‘Sustainable Rural Livelihoods:
Practical Concepts for the 21st Century, Institute of Development
Studies, Discussion Papers, 296, Cambridge.
Chambers, R. (1989), ‘Editorial Introduction: Vulnerability, Coping and
Policy’, IDS Bulletin, 20 (2): 1-7.
Chimhowu, A., and Hulme, D. (2006), ‘Livelihood Dynamics in Planned
and spontaneous Resettlement in Zimbabwe: Converging and
Vulnerable’, World Development, 34 (4):728-750.
Dev, M.S. (1994), ‘Indicators of Unsustainability in the Indian
Himalayas: A Survey’, MFS series No.37, ICIMOD, Kathmandu,
Nepal.
Dercon, S., and Krishnan, P. (1996), ‘Income portfolios in rural Ethiopia
and Tanzania: Choices and constraints’, Journal of Development
Studies, 32 (6): 850–75.
Ellis, F. (1998), ‘Household Strategies and Rural Livelihood
Diversification’, Journal of Development Studies, 35(1): 1-38.
Ellis, F. (2000), ‘Rural Livelihoods and Diversity in Developing
Countries’, Oxford University Press.
Fafchamps, M., and Gubert, F. (2006), ‘The Formation of Risk Sharing
Networks,’ Journal of Development Economics, 83(2): 326–50.

51
Fafchamps, M., and Lund, S. (2003), ‘Risk-Sharing Networks in Rural
Philippines,’ Journal of Development Economics, 71:
261–87.
Jodha, N.S. (1992), ‘Agricultural Growth and Sustainability: Perspectives
and Experiences from the Himalayas’, MFS Series No.25,
ICIMOD, Kathmandu, Nepal.
Lerman, Z; Serova E., and Zvyagintsev, D. (2008), ‘Diversification of
Rural Incomes and Non-Farm Rural Employment: Survey
Evidence from Russia’, The Journal of Peasant Studies, 35(1):
60-79.
Marschke, M. J., and Berkes, F. (2006), ‘Exploring strategies that build
livelihood resilience: a case from Cambodia’, Ecology and
Society, 11(1): 42.[Online] URL: http://www.
ecologyandsociety.org/vol11/iss1/art42/.
Nair, K.N., and Menon V. (2007), ‘Distress Debt and Suicides among
Agrarian Households: Findings from Three Village Studies in
Kerala’, CDS Working Paper No. 397. Centre for Development
Studies, Thiruvanathapuram.
Nair, K.N., and Ramakumar, R. (2007), ‘Agrarian Distress and Livelihood
Strategies: A Study in Upputhara Panchayat, Idukki District,
Kerala. CDS Working Paper No. 392. Centre for Development
Studies, Thiruvanathapuram.
Nair, K.N.; Vinod, C.P and Menon, V. (2007), ‘Agrarian Distress and
Livelihood Strategies: A Study in Pulpalli Panchayat, Wayanad
District, Kerala. CDS Working Paper No. 396. Centre for
Development Studies, Thiruvanathapuram.
Narayanamoorthy, A. and Kalamkar, S.S. (2005), ‘Indebtedness of Farmer
Households Across States: Recent Trends, Status and
Determinants’. Indian Journal of Agricultural Economics, 60(3):
289-301.
52
Papola, T.S. (2005), ‘Development and Livelihood in Sikkim: Towards
a Comparative Advantage Based Strategy. UNDP, Human
Resource Development Centre; Discussion Paper Series-14.
Rai, A.; Sharma, S.D.; Shahoo, P.M., and Malhotra, P.K. (2008),
‘Development of Livelihood Index for Different Agro-Climatic
Zones of India’, Agricultural Economics Research Review, 21(2):
173-182.
Reardon, T. (1997), ‘Using Evidence of Household Income
Diversification to Inform Study of the Rural Non-Farm Labour
Market in Africa’, World Development, 25(5): 735-47.
Scooner, I. (1998), ‘Sustainable Rural Livelihoods: A Framework for
Analysis’, IDS Working Paper No. 72.
Shylendra, H. S. (2002), ‘Environmental Rehabilitation and Livelihood
Impact: Emerging Trends from Ethiopia and Gujarat’, Economic
and Political Weekly, 37(31): 3286-3292.
Samal, C.K. (2006), ‘Remittances and Sustainable Livelihoods in Semi-
arid Areas’, Asia-Pacific Development Journal, 13(2):73-92.
Shukla, N.D., and Shukla, K.C. (2007), ‘Scope and Limitations of Crop
Diversification in Indian Agriculture’, Agricultural Situation in
India, LXIV (8): 357-365.
Sujithkumar, P.S. (2007), ‘Livelihood Diversification: A Case Study in
Rural Tamil Nadu. Indian Journal of Labour Economics’, 50 (4):
715-722.
Sudan, F. K. (2007), ‘Livelihood Diversification and Women
Empowerment through Self-Help Micro Credit Programme:
Evidence from Jammu and Kashmir’, Indus Journal of
Management & Social Sciences, Vol. 1, No. 2:90-106.
Sirohi, S. (2008), ‘Agricultural Infrastructure in India: Current Situation,
Challenges and Potential for Expansion’, (eds.) Mittal, S and

53
A. Mukherjee, in Food for Policy: Reforming Agriculture,
Cambridge University Press, India.
Unni, J. (1996), ‘Diversification of Economic Activities and Non-
Agricultural Employment in Rural Gujarat’, Economic and
Political Weekly, 31(33): 2243- 2251.
World Bank. (1990), ‘Agricultural Diversification Policies and Issues
from East Asian Experience’, Policy and Research Series 11,
Agriculture and Rural Development, World Bank, Washington,
D.C., U.S.A.
54
PUBLICATIONS
For information on all publications, please visit the CDS Website:www.cds.edu. The Working Paper Series was initiated in 1971. WorkingPapers from 279 can be downloaded from the site.
The Working Papers published after April 2007 are listed below:
W.P. 438 APARNA NAIR, The Indifferent many and the Hostile few:
An Assessment of Smallpox Vaccination in the ‘Model NativeState’ of Travancore 1804-1941. November 2010.
W.P. 437 VINOJ ABRAHAM, The Effect of Information Technologyon Wage Inequality: Evidence from Indian ManufacturingSector. September 2010.
W.P. 436 S. IRUDAYA RAJAN, D. NARAYANA, The Financial Crisisin the Gulf and its Impact on South Asian Migrant Workers.August 2010.
W.P. 435 ANUP KUMAR BHANDARI, Total Factor ProductivityGrowth and its Decomposition: An Assessment of the IndianBanking Sector in the True Liberalised Era. August 2010
W.P. 434 BEENA SARASWATHY, Cross-Border Mergers andAcquisitions in India: Extent, Nature and Structure.July 2010
W.P. 433 VIJAY KORRA, Nature and Characteristics of SeasonalLabour Migration: A Case Study in Mahabubnagar Districtof Andhra Pradesh. July 2010
W.P. 432 K.C. ZACHARIAH S. IRUDAYA RAJAN, Impact of theGlobal Recession on Migration and Remittances in Kerala:New Evidences from the Return Migration Survey (RMS)2009. June 2010.
W.P. 431 GARGI SANATI, Integration of India’s FinancialMarkets on the Domestic and International Fronts: AnEmpirical Analysis of the Post-Liberalisation Period,June 2010.

55
W.P. 430 SUNIL MANI, Has China and India Become moreInnovative Since the onset of Reforms in theTwo Countries?May 2010.
W.P. 429 T. R. DILIP, School Educational Attainment in Kerala:
Trends And Differentials. April 2010.
W.P. 428 SUNIL MANI, The Flight from Defence to Civilian Space:Evolution of the Sectoral System of Innovation of India’sAerospace Industry. April 2010.
W.P. 427 J. DEVIKA, V. J. VARGHESE, To Survive or to Flourish?
Minority Rights and Syrian Christian Community Assertions
in 20th Century Travancore/Kerala. April 2010.
W.P. 426 ANUP KUMAR BHANDARI, Global Crisis, Environmental
Volatility and Expansion of the Indian Leather Industry.March 2010.
W.P. 425 P L. BEENA, HRUSHIKESH MALLICK, Exchange Rateand Export Behaviour of Indian Textiles & Clothing Sector:An Enquiry for Major Destination Countries. March 2010.
W.P. 424 K. C. ZACHARIAH, S. IRUDAYA RAJAN, MigrationMonitoring Study, 2008 Emigration and Remittancesin the Context of Surge in Oil Prices. March 2010.
W.P. 423 VIJAYAMOHANAN PILLAI N, Loss of Load Probabilityof a Power System: Kerala. February 2010.
W.P. 422 JAYASEKHAR S, C. NALIN KUMAR, Compliance,Competitiveness and Market Access: A Study on IndianSeafood Industry. February 2010.
W.P. 421 S. IRUDAYA RAJAN, V.J. VARGHESE, M.S. JAYAKUMAROverseas Recruitment in India: Structures, Practices andRemedies. December 2009.
W.P. 420 V.J. VARGHESE, Land, Labour and Migrations:Understanding Kerala’s Economic Modernity, December 2009.
W.P. 419 R.MOHAN, D. SHYJAN Tax Devolution and GrantDistribution to States in India Analysis and Roadmap forAlternatives, December 2009.
56
W.P. 418 WILLIAM JOE & U. S. MISHRA Household Out-of-Pocket
Healthcare Expenditure in India Levels, Patterns and Policy
Concerns, October 2009.
W.P. 417 NEETHI P Globalisation Lived Locally: New Forms of
Control, Conflict and Response Among Labour in Kerala,
Examined Through a Labour Geography Lens. October 2009.
W.P. 416 SUNIL MANI High skilled migration from India, An analysisof its economic implications, September 2009.
W.P. 415 SUNIL MANI Has India Become more Innovative Since1991? Analysis of the Evidence and Some DisquietingFeatures, September 2009.
W.P. 414 WILLIAM JOE, PRIYAJIT SAMAIYAR, U. S. MISHRAMigration and Urban Poverty in India Some PreliminaryObservations, September 2009.
W.P. 413 K. N. NAIR, T.P. SREEDHARAN, M. ANOOPKUMAR, AStudy of National Rural Employment Guarantee Programmein Three Grama Panchayats of Kasaragod District,August 2009
W.P. 412 B.S. SURAN, D. NARAYANA, The Deluge of Debt: Under-standing the Financial Needs of Poor Households. July 2009
W.P. 411 K. NAVANEETHAM , M. KABIR , C.S. KRISHNAKUMAR
Morbidity Patterns in Kerala: Levels and Determinants.April 2009.
W.P. 410 ARINDAM BANERJEE, Peasant Classes, Farm Incomesand Rural Indebtedness: An Analysis of HouseholdProduction Data from two States. March 2009.
W.P. 409 SUNIL MANI, The Growth of Knowledge-intensiveEntrepreneurship in India, 1991-2007 Analysis of itsEvidence and the Facilitating Factors. February, 2009
W.P. 408 M. S. HARILAL, Home to Market: Responses, Resurgenceand Transformation of Ayurveda from 1830s to 1920.November 2008

57
W.P. 407 HRUSHIKESH MALLICK, Do Remittances Impact theEconomy ? Some Empirical Evidences from a DevelopingEconomy. October 2008.
W.P. 406 K.C.ZACHARIAH, S.IRUDAYA RAJAN, Costs of BasicServices in Kerala, 2007, Education, Health, Childbirth andFinance (Loans) September 2008.
W.P. 405 SUNIL MANI Financing of industrial innovations in IndiaHow effective are tax incentives for R&D? August 2008.
W.P. 404 VINOJ ABRAHAM Employment Growth in Rural India:Distress Driven? August 2008.
W.P. 403 HRUSHIKESH MALLICK, Government Spending, TradeOpenness and Economic Growth in India: A Time SeriesAnalysis. July 2008.
W.P. 402 K. PUSHPANGADAN, G. MURUGAN, Dynamics of RuralWater Supply in Coastal Kerala: A Sustainable DevelopmentView, June 2008
W.P. 401 K. K. SUBRAHMANIAN, SYAM PRASAD, Rising InequalityWith High Growth Isn't this Trend Worrisome? Analysis ofKerala Experience, June 2008
W.P. 400 T.R. DILIP, Role Of Private Hospitals in Kerala: AnExploration, June 2008
W.P. 399 V. DHANYA, Liberalisation of Tropical Commodity Marketand Adding-up Problem: A Bound Test Approach,March 2008
W.P. 398 P. MOHANAN PILLAI, N. SHANTA, ICT and EmploymentPromotion Among Poor Women: How can we Make itHappen? Some Reflections on Kerala's Experience.February 2008.
W.P. 397 K.N.NAIR, VINEETHA MENON, Distress Debt and Suicidesamong Agrarian Households: Findings from three VillageStudies in Kerala. December 2007

58
W.P. 396 K.N.NAIR, C.P. VINOD, VINEETHA MENON,Agrarian Distress and Livelihood Strategies: A Studyin Pulpalli Panchayat, Wayanad District , KeralaDecember 2007
W.P. 395 K.C. ZACHARIAH, S.IRUDAYA RAJAN, Migration,Remittances And Employment Short-term Trends and Long-term Implications. December 2007
W.P. 394 K.N.NAIR, ANTONYTO PAUL, VINEETHA MENON,Livelihood Risks and Coping strategies: A Case Study in theAgrarian Village of Cherumad, Kerala. November 2007
W.P. 393 S. IRUDAYA RAJAN, U.S.MISHRA, Managing Migrationin the Philippines: Lessons for India. November 2007.
W.P. 392 K.N. NAIR, R. RAMAKUMAR Agrarian Distress and RuralLivelihoods, a Study in Upputhara Panchayat Idukki District,Kerala. November 2007.
W.P. 391 PULAPRE BALAKRISHNAN, Visible hand: Public policyand economic growth in the Nehru era. November 2007.
W.P. 390 SUNIL MANI, The Growth Performance of India’sTelecommunications Services Industry, 1991-2006 Can itLead to the Emergence of a Domestic Manufacturing Hub?September 2007.
W.P. 389 K. J. JOSEPH, VINOJ ABRAHAM, Information Technologyand Productivity: Evidence from India's ManufacturingSector. September 2007.
W.P. 388 HRUSHIKESH MALLICK, Does Energy Consumption FuelEconomic Growth In India? September 2007.
W.P. 387 D. SHYJAN,Public Investment and Agricultural Productivity:A State-wise Analysis of Foodgrains in India. July 2007.
W.P. 386 J. DEVIKA, 'A People United in Development':Developmentalism in Modern Malayalee Identity.June 2007.
W.P. 385 M. PARAMESWARAN, International Trade, R&D Spilloversand Productivity: Evidence from Indian ManufacturingIndustry. June 2007.
59
W.P. 384 K. C. ZACHARIAH, S. IRUDAYA RAJAN Economic andSocial Dynamics of Migration in Kerala, 1999-2004 Analysisof Panel Data. May 2007.
W.P. 383 SAIKAT SINHA ROY Demand and Supply Factors in theDetermination or India's Disaggregated Manufactured Exports :A Simultaneous Error-Correction Approach. May 2007.

This work is licensed under a Creative Commons Attribution – NonCommercial - NoDerivs 3.0 Licence. To view a copy of the licence please see: http://creativecommons.org/licenses/by-nc-nd/3.0/