Derib Woldeyohanes 2010 - opendocs.ids.ac.uk
119
i Mekelle University College of Business and Economics Department of Cooperative Studies “DETERMINANTS OF PASTORALISTS’ LIVESTOCK INCOME IN THE MIDDLE AWASH, SOUTHERN AFAR, ETHIOPIA” By Derib Woldeyohanes Benti, (Id. No. FDA/PS0018/2000) A Thesis Submitted in partial fulfillment of the requirements for Master of Arts Degree In Cooperative Marketing Advisor: R. Dayanandan (PhD) September, 2010 Mekelle Ethiopia
Transcript of Derib Woldeyohanes 2010 - opendocs.ids.ac.uk
i
Mekelle University
College of Business and Economics
Department of Cooperative Studies
“DETERMINANTS OF PASTORALISTS’ LIVESTOCK INCOME
IN THE MIDDLE AWASH, SOUTHERN AFAR, ETHIOPIA”
By
Derib Woldeyohanes Benti, (Id. No. FDA/PS0018/2000)
A Thesis
Submitted in partial fulfillment of the requirements for Master of Arts Degree
In
Cooperative Marketing
Advisor:
R. Dayanandan (PhD)
September, 2010
Mekelle
Ethiopia

ii
This work isThis work isThis work isThis work is dedicated to the dedicated to the dedicated to the dedicated to the late Kalkidan Tamene (late Kalkidan Tamene (late Kalkidan Tamene (late Kalkidan Tamene (1977197719771977 ––––
1997 EC), 1997 EC), 1997 EC), 1997 EC), whom I lost by a car accident. May Gowhom I lost by a car accident. May Gowhom I lost by a car accident. May Gowhom I lost by a car accident. May God d d d placeplaceplaceplace your your your your
soul soul soul soul inininin the Heaventhe Heaventhe Heaventhe Heaven, Amen, Amen, Amen, Amen!!!!

iii
Declaration
This is to certify that this thesis entitled "Determinants of Pastoralists’ Livestock Income in the
Middle Awash, Southern Afar, Ethiopia" submitted in partial fulfillment of the requirements for
the award of the Degree of Master of Arts, in Cooperative Marketing to the Collage of Business
and Economics, Mekelle University, through the Department of Cooperative Studies, done by Mr.
Derib Woldeyohanes Benti, Id. No. FDA/PS0018/2000 is an authentic work carried out by him
under my guidance. The matter embodied in this project work has not been submitted earlier for
award of any degree or diploma to the best of my knowledge and belief.
Name of the student: Derib W/Yohanes Benti Signature and Date ………………................
Name of the Advisor: Dr. R. Dayanandan Signature and Date ……………………………

iv
Biography
The author, Mr. Derib W/Yohanes was born on June 12, 1980 in Guraghae Zone of Southern
Nations Nationalities and Peoples Regional State to his mother Mrs. Alemnesh Endale and his
father Mr. W/Yohanes Benti. He attended his elementary and junior secondary education in Kotter
Gedra Elementary and Junior Secondary School and secondary education in Emdibir
Comprehensive Secondary School, both in Guraghae Zone. Then he joined Alemaya University in
1999/2000 academic year and graduated with Bachelor of Agriculture in Agricultural Extension.
Since his graduation in July 2003, he was employed by Ministry of Agriculture and Rural
Development as instructor of agricultural extension in Gewane Agricultural Technical and
Vocational Training College, Afar region. After five years of services in the college, he has joined
School of Graduate Studies at Mekelle University in July 2008 to pursue Master of Arts Degree in
Cooperative Marketing in the Department of Cooperative Studies, College of Business and
Economics.

v
Table of Contents
Declaration ..................................................................................................................................... iii
Table of Contents ............................................................................................................................ v
Acknowledgements ...................................................................................................................... viii
Abbreviations ................................................................................................................................. ix
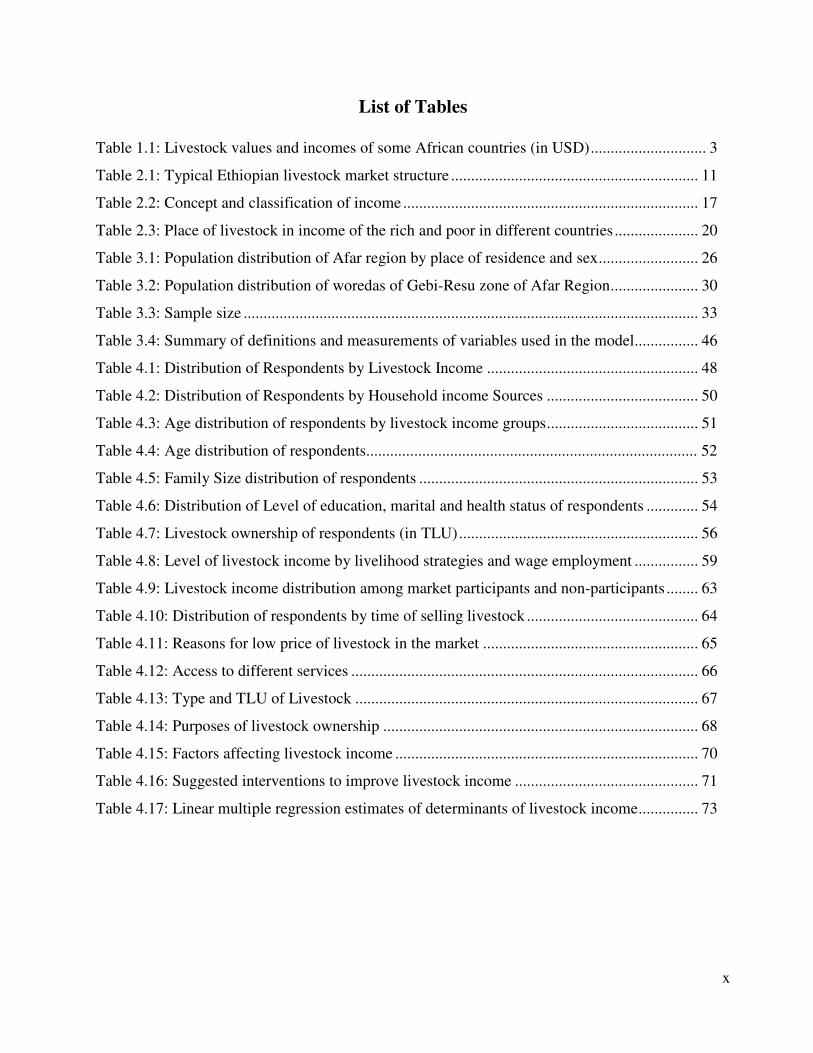
List of Tables .................................................................................................................................. x
List of Figures ................................................................................................................................ xi
List of Appendices ........................................................................................................................ xii
Abstract ........................................................................................................................................ xiii
INTRODUCTION .......................................................................................................................... 1
1.1. Background ............................................................................................................................. 1
1.2. Statement of the Problem ........................................................................................................ 4
1.3. Objectives of the Study ........................................................................................................... 5
1.3.1. General Objective ............................................................................................................ 5
1.3.2. Specific Objectives .......................................................................................................... 6
1.4. Hypothesis............................................................................................................................... 6
1.5. Scope of the Study .................................................................................................................. 6
1.6. Significance of the Study ........................................................................................................ 6
1.7. Limitations of the study .......................................................................................................... 7
1.8. Organization of the thesis ....................................................................................................... 7
LITERATURE REVIEW ............................................................................................................... 8
2.1. Theoretical Background .......................................................................................................... 8
2.1.1. Concepts and Definitions ................................................................................................. 8
2.1.1.1. Livestock ................................................................................................................... 8
2.1.1.2. Livestock Production Systems .................................................................................. 8
2.1.1.3. Livestock Marketing Features and Structures........................................................... 9

vi
2.1.1.4. Livestock and Pastoralists ....................................................................................... 11
2.1.1.5. Role of Livestock .................................................................................................... 13
2.1.1.6. Constraints for Sustainable Livestock Production .................................................. 14
2.1.1.7. Definition of income and its classification ............................................................. 16
2.1.1.8. Sources of Household Income and Share of Livestock Income ............................. 18
2.2. Empirical Studies on Determinants of Household Income ................................................... 21
2.3. Conceptual Framework ......................................................................................................... 24
MATERIALS AND METHODS .................................................................................................. 26
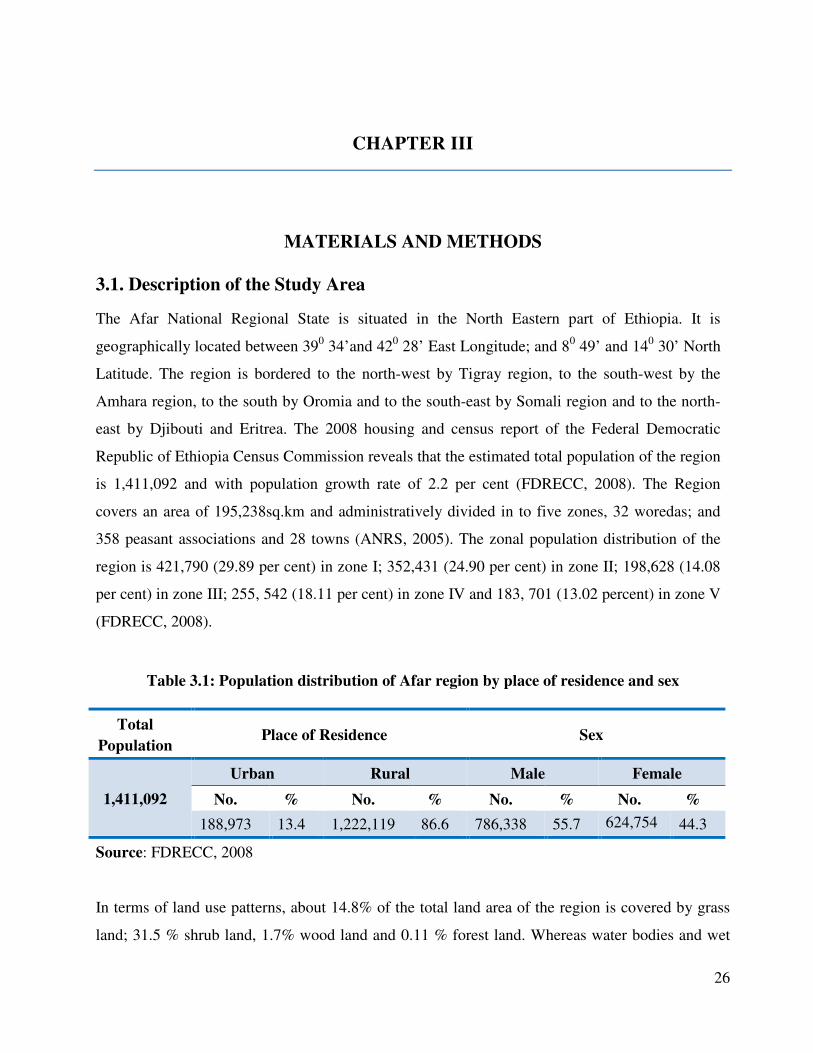
3.1. Description of the Study Area ............................................................................................... 26
3.1.1. Overview of Gebi-Resu Zone and the Sample Woredas ............................................... 28
3.1.1.1. Description of Gewane Woreda .............................................................................. 30
3.1.1.2. Description of Amibara Woreda ............................................................................. 31
3.2. Methodology ......................................................................................................................... 32
3.2.1. Sampling and Data Collection Procedures .................................................................... 32
3.2.1.1. Sampling Design and Sampling Size ...................................................................... 32
3.2.2. Method of Data Collection............................................................................................. 33
3.2.2.1. Focus Group Discussions ........................................................................................ 33
3.2.3. Data Analysis ................................................................................................................. 34
3.2.3.1. Descriptive Analysis ............................................................................................... 34
3.2.3.2. Econometric Model Selection and Specification .................................................... 34
3.3. Operational Definition of Variables...................................................................................... 38
3.3.1. The Dependent variable ................................................................................................. 38
3.3.2. The Independent Variables ............................................................................................ 39
RESULTS AND DISCUSSIONS ................................................................................................. 47
4.1. Descriptive Statistics Results ................................................................................................ 47
4.1.1. Income Derived from Livestock by the Respondents .................................................... 47
4.1.2. Sources of Income for Households ................................................................................ 49
4.1.3. Demographic and Socio-economic Profiles of Respondents ......................................... 50
4.1.3.1. Age: ......................................................................................................................... 50
4.1.3.2. Family size: ............................................................................................................. 52
4.1.3.3. Level of Education, Health and Marital Status: ...................................................... 53
4.1.3.4. Total Livestock Holding ......................................................................................... 55
4.1.3.5. Livelihood Strategies .............................................................................................. 57
vii
4.1.3.6. Occupation .............................................................................................................. 59
4.1.3.7. Land Ownership ...................................................................................................... 60
4.1.3.8. Market Participation................................................................................................ 61
4.1.3.9. Access to Different Services ................................................................................... 65
4.1.4. Purpose of Livestock Keeping ....................................................................................... 66
4.1.5. Factors Affecting Livestock Income and Suggested Interventions ............................... 68
4.2. Results from Regression Econometric Model ...................................................................... 72
4.2.1. Determinants of Household Livestock Income .............................................................. 72
4.2.1.1. Total Livestock Holding (TLSH_TLU): ................................................................. 75
4.2.1.2. Access to Farm Credit for the Household (CRDT_AC): ........................................ 75
4.2.1.3. Livestock Mobility (LS_MOB): ............................................................................. 76
4.2.1.4. Livestock Breed Type (LS _BRT): ......................................................................... 76
4.2.1.5. Availability of Grazing Land (AV_GL): ................................................................ 76
4.2.1.6. Risk of Predators in the Pastoral Areas (PRD_RISK): ........................................... 77
4.2.2. Conclusion from Results of Econometric model analysis ............................................. 77
CONCLUSIONS AND RECOMMENDATIONS ....................................................................... 78
5.1. Conclusion ............................................................................................................................ 78
5.2. Recommendations ................................................................................................................. 80
Bibliography ................................................................................................................................. 83
Appendix ....................................................................................................................................... 91

viii
Acknowledgements
First and foremost, I praise the Almighty God who helped me to reach at this end. Then, I would
like to record a special note of thanks to my research advisor Dr. R. Dayanandan, who generously
devoted his time, giving me valuable suggestions and tirelessly and repeatedly commented on the
draft. His professional and genuine supervision and follow-up made the thesis to have such an end!
Therefore, time and again, I say he deserves my special thanks.
I also would like to thank Gewane ATVET College management bodies specially (the late) Ato
Ibrahim Ahmed (the former dean of the college) and Ato Getahun Girma (administrative and
development vice dean of the college), who made vehicle and financial arrangements simple so
that I could successfully complete my study.
Data collection for the study in the harsh environment of the study area would not be the reality
without genuine assistance of Ogolisa Adem. Therefore, I am very much thankful of him for his
help. Together with him, I would also like to thank Endris Ali, Habtamu Seid, Werkie Sete and
Sisay Fekadu, for their assistance in data collection process. BPARD experts and pastoralist
agriculture and rural development agents of Amibara and Gewane woredas also deserve my thanks
for giving me professional information during FGD.
My particular thanks will go to my colleagues Wondimu Teshome, Birook Teshome and Dr.
Zerihun Yemaneberhan for their constructive comments on the proposal and draft of the thesis;
Seifemichael Mamo for he allow me to use his CDMA for long time and my friends Nega Endale
and Tegegn Argaw with whom I shared valuable information throughout the study time. My
friends Dr. H/Mariam Bekele, Yared Gezahegn and Gedion Tesfaye shall share my thanks for their
help in filtering the data. Furthermore, all my class mates specially Shimelis Nigussie and
Alemseged Girmay (my physician) will deserve my deepest gratitude for their brotherly
approaches throughout my stay in Mekelle.
Last but not least, my special thanks will go to my special friend Birhanu Debebe (Birish) for his
priceless all round support; and my younger sister Yeweyneshet W/Yohanes for her patience to
home serve me throughout the thesis write-up.
Derib Woldeyohanes
ix
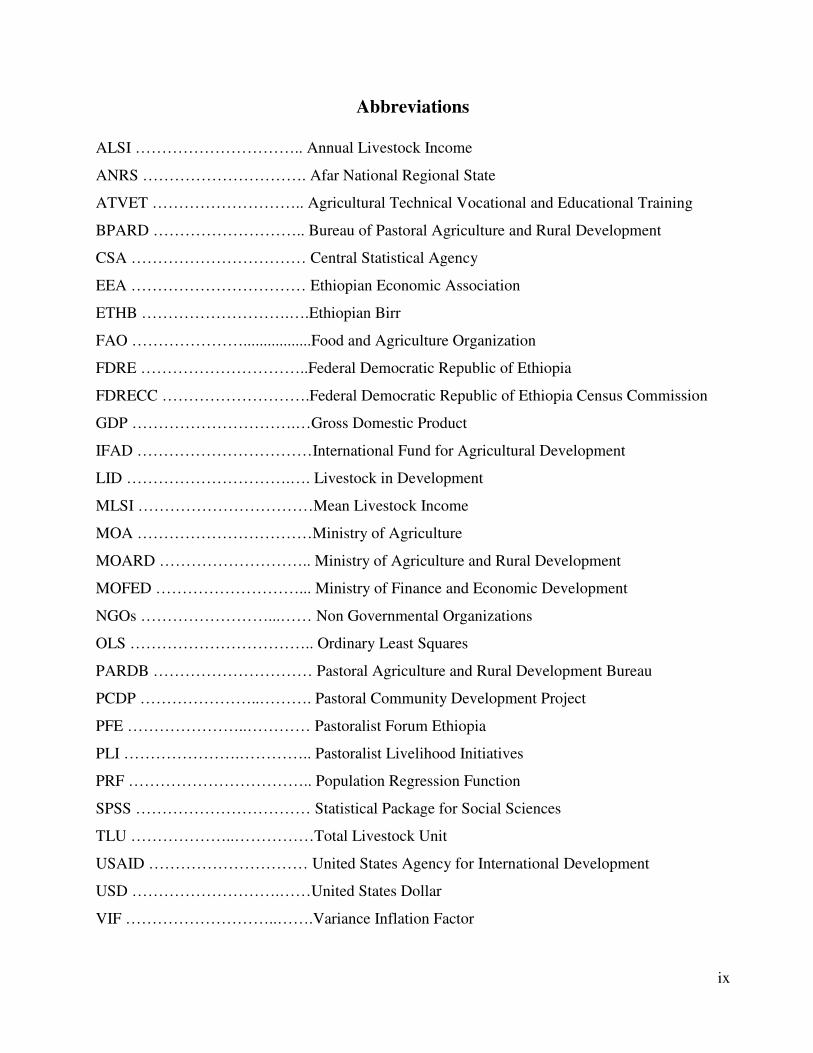
Abbreviations
ALSI ………………………….. Annual Livestock Income
ANRS …………………………. Afar National Regional State
ATVET ……………………….. Agricultural Technical Vocational and Educational Training
BPARD ……………………….. Bureau of Pastoral Agriculture and Rural Development
CSA …………………………… Central Statistical Agency
EEA …………………………… Ethiopian Economic Association
ETHB ……………………….….Ethiopian Birr
FAO ………………….................Food and Agriculture Organization
FDRE …………………………..Federal Democratic Republic of Ethiopia
FDRECC ……………………….Federal Democratic Republic of Ethiopia Census Commission
GDP ………………………….…Gross Domestic Product
IFAD ……………………………International Fund for Agricultural Development
LID ………………………….…. Livestock in Development
MLSI ……………………………Mean Livestock Income
MOA ……………………………Ministry of Agriculture
MOARD ……………………….. Ministry of Agriculture and Rural Development
MOFED ………………………... Ministry of Finance and Economic Development
NGOs ……………………...…… Non Governmental Organizations
OLS …………………………….. Ordinary Least Squares
PARDB ………………………… Pastoral Agriculture and Rural Development Bureau
PCDP …………………..………. Pastoral Community Development Project
PFE …………………..………… Pastoralist Forum Ethiopia
PLI ………………….………….. Pastoralist Livelihood Initiatives
PRF …………………………….. Population Regression Function
SPSS …………………………… Statistical Package for Social Sciences
TLU ………………..……………Total Livestock Unit
USAID ………………………… United States Agency for International Development
USD ……………………….……United States Dollar
VIF ………………………..…….Variance Inflation Factor
x
List of Tables
Table 1.1: Livestock values and incomes of some African countries (in USD) ............................. 3
Table 2.1: Typical Ethiopian livestock market structure .............................................................. 11
Table 2.2: Concept and classification of income .......................................................................... 17
Table 2.3: Place of livestock in income of the rich and poor in different countries ..................... 20
Table 3.1: Population distribution of Afar region by place of residence and sex ......................... 26
Table 3.2: Population distribution of woredas of Gebi-Resu zone of Afar Region ...................... 30
Table 3.3: Sample size .................................................................................................................. 33
Table 3.4: Summary of definitions and measurements of variables used in the model ................ 46
Table 4.1: Distribution of Respondents by Livestock Income ..................................................... 48
Table 4.2: Distribution of Respondents by Household income Sources ...................................... 50
Table 4.3: Age distribution of respondents by livestock income groups ...................................... 51
Table 4.4: Age distribution of respondents................................................................................... 52
Table 4.5: Family Size distribution of respondents ...................................................................... 53
Table 4.6: Distribution of Level of education, marital and health status of respondents ............. 54
Table 4.7: Livestock ownership of respondents (in TLU) ............................................................ 56
Table 4.8: Level of livestock income by livelihood strategies and wage employment ................ 59
Table 4.9: Livestock income distribution among market participants and non-participants ........ 63
Table 4.10: Distribution of respondents by time of selling livestock ........................................... 64
Table 4.11: Reasons for low price of livestock in the market ...................................................... 65
Table 4.12: Access to different services ....................................................................................... 66
Table 4.13: Type and TLU of Livestock ...................................................................................... 67
Table 4.14: Purposes of livestock ownership ............................................................................... 68
Table 4.15: Factors affecting livestock income ............................................................................ 70
Table 4.16: Suggested interventions to improve livestock income .............................................. 71
Table 4.17: Linear multiple regression estimates of determinants of livestock income ............... 73

xi
List of Figures
Figure 2.1: Main livestock problems of selected three countries ................................................. 15
Figure 2.2: Ranks of household income sources in selected three countries ................................ 19
Figure 2.3: Conceptual framework ............................................................................................... 25
Figure 3.1: Map of Afar National Regional State and location of the study area ......................... 29
Figure 4.1: Distributions of respondents by livestock income categories .................................... 49
Figure 4.2: Distribution of respondents by age group and livestock income group ..................... 52
Figure 4.3: Herd size by livestock income groups ........................................................................ 57
Figure 4.4: Livelihood choices of respondents ............................................................................. 58
Figure 4.5: Occupation of respondents ......................................................................................... 60
Figure 4.6: Market participation of respondents ........................................................................... 62
Figure 4.7: Pastoralists participation in livestock products selling............................................... 64

xii
List of Appendices
Appendix 1: Average Daily Milk Production (Litres/Animal) and Average Lactation Period
(Months) for cows and camels of Ethiopia ................................................................................... 91
Appendix 2: Average Producers' Prices of Livestock in Rural Areas by Zone, Afar Region ...... 91
Appendix 3: Conversion Factors to Estimate Tropical Livestock Unit equivalents ..................... 92
Appendix 4: Goats herd size of a respondent ............................................................................... 92
Appendix 5: Discussion with pastoralists (Amibara) ................................................................... 93
Appendix 6: Summary results of FGD on purposes and current market prices of livestock ........ 93
Appendix 7: VIF of continuous variables ..................................................................................... 94
Appendix 8: Contingency Coefficient for discrete variables ........................................................ 95
Appendix 9: Interview Schedule for pastoral income survey ....................................................... 97
Appendix 10: FGD checklists with Pastoralist Agriculture and Rural Development Officers .. 104
Appendix 11: FGD checklists with Pastoralist Agriculture and Rural Development Agents .... 105

xiii
Abstract
Ethiopia is among the first ten nations in the world with respect to the livestock population.
However, the benefit obtained from the sector is low compared to other African countries and the
world standard. The economic gain for the pastoralists, who predominantly live on rearing
livestock for their livelihood, is below the national average. Therefore, identifying the major
determinant factors affecting income from livestock is needed to device appropriate development
interventions to improve livestock income and thereby living standard of pastoralists.
This study was conducted in Amibara and Gewane woredas of Afar Region with major objective
of analyzing determinant factors affecting pastoralists’ livestock income. A random sampling
procedure is used to select 10 PAs and 100 sample respondents. Primary data are collected from
sample respondents and focussed groups through personal interview and discussions using
structured interview schedule and checklists, respectively. Data on demographic and
socioeconomic characteristics of the sample respondents are presented and discussed using
various tools of descriptive statistics. The survey result reveals that 66% of sample respondents
receive ALSI below the average livestock income [less than ETHB 10,839.40] in the study area.
Among four major sources of household income identified for the study area, livestock income
contributes 73.30% of the total household income followed by employment (18.09%), crops
cultivation (5.28%) and land rentals (3.33%).
Multiple Regression Model is used to identify variables capable of affecting the livestock income.
The model results reveal that among 15 explanatory variables included in the model, 6 are found
to be significant at the conventional levels of significance. Those variables which are important
determinants of livestock income are a) total livestock holding, b) access to credit, c) availability
of grazing land, d) risk of predators, e) livestock breed type and f) livestock mobility. Improving
livestock production and productivity, organizing pastoralists into cooperatives, market oriented
livestock production, improving pastoralists’ access to and participation in the markets, managing
associated risks of mobility and proper management and control of the invasive species from
grazing lands are the recommendations forwarded.
Derib Woldeyohanes
October, 2010

1
CHAPTER I
INTRODUCTION
1.1. Background
Ethiopia is among the first ten nations in the world with respect to the livestock population and
takes the lead in Africa. The lead is both in terms of number and diversity of livestock, with an
estimated 41 million cattle, 26 million sheep, 23 million goats, 41 million chicken, 5.7 million
equines and 2.3 million camels (CSA, 2010). Though not proportional to the volume, the livestock
sub sector contributes considerably to the country’s economy. A study indicated that the livestock
sector contributes an estimated 16 percent to the national GDP and over 40 percent to the
agricultural GDP (Berhanu G. et al., 2007). Its functions take the form of provision of food, cash
income, input for crop production and soil fertility management, raw materials for industry,
energy/fuel, social values (specially for pastoralists) as well as promotes saving and creates
employment opportunities to both highland and lowland inhabitants. More clearly put, the
livestock subsector provides wide and year-round employment opportunities for surplus family
labour in rural Ethiopia. Cash income from livestock production is especially important for the
poor and landless Ethiopian households, particularly women. Income from livestock production is
also used for income diversification investment activities. For the average rural farm household
with limited investment alternatives, livestock are used as store of wealth and hedge against
inflation (CSA, 2010).
The livestock subsector creates livelihood for 65% of the rural population and accounts for about
12–15% of the export earnings of the country in terms of live animals, meat and hides and skins
exports (EEA, 2005). Excluding values of draught power and manure for fertilizer, of the total
household cash income from crops and livestock, the livestock sector accounts for 37–87% in
different parts of the country and the higher the cash income the higher is the share of livestock,

2
indicating that increased cash income come primarily from livestock, particularly in the pastoral
areas (Ayele et al., 2003).
As far as the overall contribution of livestock to the economy is concerned, it is concluded that
throughout Ethiopia with some regional variations, livestock are valuable (essential in the pastoral
areas) in providing food for subsistence, essential in many areas for the cultivation of crops
(draught power), essential for the transportation of goods, and in some areas transporting people,
the most important source of cash income for the people living in the rural areas, the most
significant and widespread form of asset accumulation for the rural residents and used to invest in
traditional security systems (Halderman, 2004).
In regard to poverty reduction policies and strategies, the same author states that it is useful to
recognize for Ethiopian households, livestock serves as: productive assets that allow households to
be self-provisioning; critical safeguards against falling into what is usually unremitting poverty;
and springboards that usually enable some households to advance to relative wealth by the
standards of contemporary Ethiopia.
However, the benefit obtained from the sector is low compared to other African countries and the
world standard. For instance, the 2004 statistical report of FAO (quoted in SOS-Sahel Ethiopia,
2007) revealed that the average beef yield per animal of 108.4kg for Ethiopia is by far less than
121kg for the Sudan, 130kg for Eastern Africa, 146kg for Africa, 163kg for Kenya, and 200kg for
the whole world. Low productivity of the sector coupled with poor performance of livestock
marketing system and low prices in the market made it so (Ayele et al., 2003). Moreover, the study
conducted in 9 African countries on values and revenues of livestock showed that Ethiopia derives
the least income (USD 383 per household; where for Kenya and Republic of South Africa are 6155
and 18593, respectively) from livestock (Niggol S. Seo et al., 2008).

3
Table 1.1: Livestock values and incomes of some African countries (in USD)
Country Value of Livestock
(in USD)
Income from Livestock
(in USD)
Burkina Faso 3952 2900
Cameroon 4356 3009
Egypt 7483 6731
Ethiopia 2367 383
Ghana 3274 412
Kenya 16095 6155
Senegal 3547 388
South Africa 38986 18593
Zambia 10722 2709
Source: Niggol S. Seo and Mendelsohn R., 2008
Livestock population in Ethiopia is distributed over the highland and lowland areas. Of the total
livestock population of the country, pastoralists own about 27% of cattle, 26% of sheep and nearly
two-third of the goats’ population; and all the camels (SOS-Sahel Ethiopia, 2007); livestock in
pastoral regions accounts for an estimated 40% or so of the country’s total livestock population
(Sara Pantuliano et al., 2008). In terms of distribution across administrative regions, the
predominantly pastoral regions of Afar and Somali have the highest densities per capita. In the
lowlands of the country where pastoral management system is practiced, livestock are the principal
source of subsistence, providing milk and cash income to cover family expenses for food grains
and other essential consumer goods and are the main form of financial and social assets (Yakob A.
et al., 2010).
Pastoral areas in Ethiopia, which cover about 0.7 million sq km, support about 12 - 15% (some 15
– 20 million people) of total population of the country (EEA, 2005; Sara Pantuliano and Mike
Wekesa, 2008).
The Afar National Regional State is predominantly pastoral where over 90% of the population
relies on livestock for their livelihood. Moreover, the region is characterized by extensive range
land, huge livestock resources and pastoralists with best traditional knowledge in extensive
livestock production systems. Despite the huge livestock population in the region, pastoralists’

4
income from livestock is not proportional to the volume (Afar Atlas, 2006). This mainly is
attributed to wide ranging problems of underdevelopment and lack of market-oriented production,
lack of adequate information on livestock resources, inadequate permanent animal route and other
facilities like water and holding grounds, lack or non-provision of transport, ineffective and
inadequate infrastructural and institutional set-ups; together with the prevalence of diseases, illegal
trade and inadequate market information. Moreover, the wide ranging and complicated social,
cultural and economic factors and absence of proper processing and marketing facilities are
mentioned contributing to low income from livestock farming in Afar region in particular
(Mohamed, 2009). Therefore, improving livestock productivity and their respective marketing
activities may improve the sector’s contribution to the GDP in general and increase the
pastoralists’ income and lead better livelihood, in particular.
1.2. Statement of the Problem
The current levels of contributions of the livestock sub sector in Ethiopia, at either the national or
regional level is below the potential. The level of foreign exchange earnings from livestock and
livestock products are also much lower than would be expected, given the size of population and
diversification (Niggol S. Seo et al., 2008).
The level of contribution of livestock production for the pastoralists, who predominantly live on
rearing livestock for their livelihood, is below the national average. Pastoralists could not be
benefited as expected from the animals they rear. The most food insecure areas in the country are
reported to be pastoral; the condition in Afar pastoralists is the worst regardless of its huge
livestock resource (PLI, 2008).
Pastoral households depend primarily on livestock to generate their incomes and food consumption
needs. The most important and leading income generating activities for the Afar pastoral
communities is animal husbandry. Mainly rearing of cattle, camel as well as sheep and goats for
cash income and for the daily subsistence need for milk and milk products, meat, hide and skin
(Farm Africa, 2009). However, currently there is a dramatic decline in livestock holdings per
household associated with shrinkage and degradation in grazing lands and an increase in frequency
of recurrent droughts due to which the income sources of pastoral livelihood are adversely affected
and the income level from livestock farming is sharply going down; and pastoralists are found to
leading impoverished life. Regardless of the huge livestock resources, the household cash income

5
for the pastoralists from sale of livestock and livestock products is declining and they are
becoming more dependants on external assistances (PLI, 2008).
Therefore at this juncture, one may appreciate the paradox (huge livestock resources against
absolute poverty and impoverished life) and it is natural and rational thinking to posing questions
as “why the contribution of livestock production to the livelihood of pastoralists is not as
expected? What has happened to the income from the livestock to move out the pastoralist
households from poverty and secure household food needs? Why the pastoralists in Afar are
becoming relief dependant and many use imported powdered milk (PLI, 2008)?” These are
currently pressing and critical to the region in particular and need to be researched and measures
have to be taken to help the innocent pastoralists assume a fair income from the livestock they
keep and improve their living standard and ensure that ‘pastoralists deserve a fair income from the
sale of their animals’. In the severe and widespread drought of 2000, outside observers concluded
that, except in extreme pockets of isolation or insecurity, there was no significant problem of food
availability, and ‘if satisfactory ways could be found of increasing pastoralists’ cash income, there
would be no separate food crisis’ (Sandford et al., 2000 in Sara Pantuliano et al., 2008). Moreover,
it is argued that market participation can be an effective route for pastoralists to reduce poverty and
increase income (Mohamed, 2009). It is however, widely seen that thousands of pastoral
households in Afar Region seem to fail to deserve fair income from participation in livestock
markets which is attributed to controllable and uncontrollable factors. Therefore, it demands that
the social, cultural, institutional and other factors that determine the level of income from livestock
for the pastoralists have to be identified and analyzed to devise solutions for the aforementioned
questions.
1.3. Objectives of the Study
1.3.1. General Objective
The overall objective of this study is to explore those factors most closely associated with
pastoralists’ household income from livestock in the Middle Awash area, Afar Region and to draw
recommendations that will help to improve pastoralists’ livestock income.
6
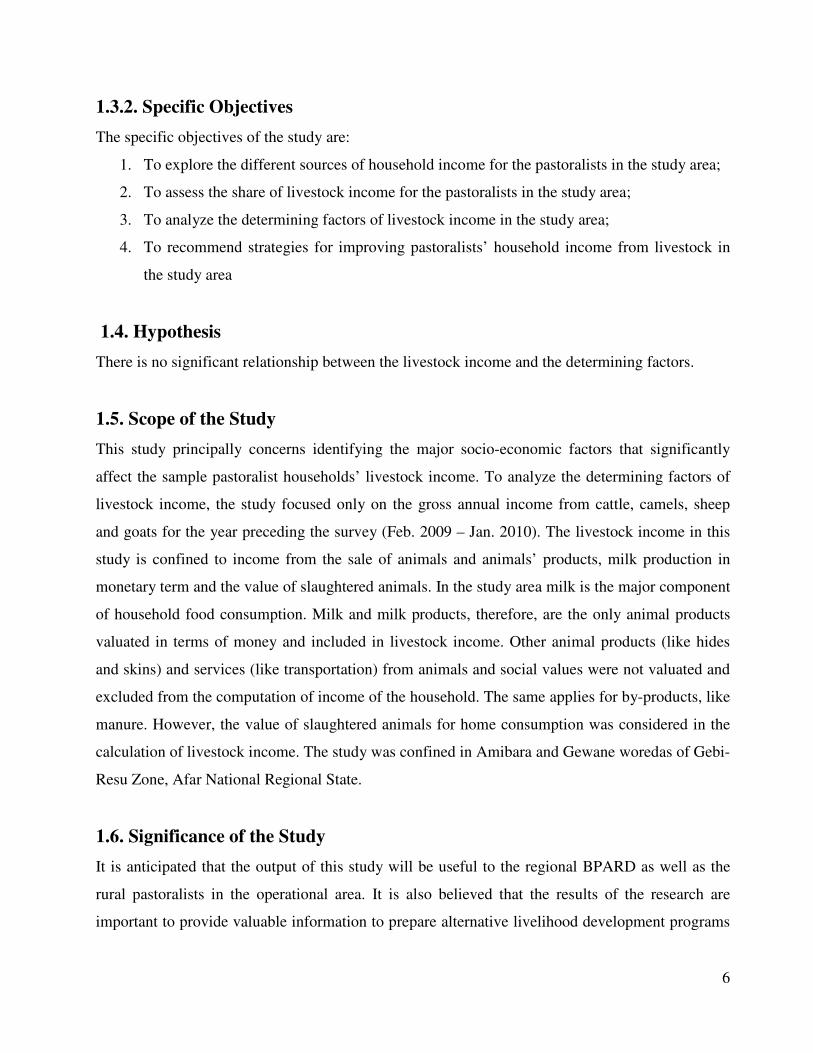
1.3.2. Specific Objectives
The specific objectives of the study are:
1. To explore the different sources of household income for the pastoralists in the study area;
2. To assess the share of livestock income for the pastoralists in the study area;
3. To analyze the determining factors of livestock income in the study area;
4. To recommend strategies for improving pastoralists’ household income from livestock in
the study area
1.4. Hypothesis
There is no significant relationship between the livestock income and the determining factors.
1.5. Scope of the Study
This study principally concerns identifying the major socio-economic factors that significantly
affect the sample pastoralist households’ livestock income. To analyze the determining factors of
livestock income, the study focused only on the gross annual income from cattle, camels, sheep
and goats for the year preceding the survey (Feb. 2009 – Jan. 2010). The livestock income in this
study is confined to income from the sale of animals and animals’ products, milk production in
monetary term and the value of slaughtered animals. In the study area milk is the major component
of household food consumption. Milk and milk products, therefore, are the only animal products
valuated in terms of money and included in livestock income. Other animal products (like hides
and skins) and services (like transportation) from animals and social values were not valuated and
excluded from the computation of income of the household. The same applies for by-products, like
manure. However, the value of slaughtered animals for home consumption was considered in the
calculation of livestock income. The study was confined in Amibara and Gewane woredas of Gebi-
Resu Zone, Afar National Regional State.
1.6. Significance of the Study
It is anticipated that the output of this study will be useful to the regional BPARD as well as the
rural pastoralists in the operational area. It is also believed that the results of the research are
important to provide valuable information to prepare alternative livelihood development programs

7
that will serve as a guideline for interventions to improve pastoralists’ household income. This
research project is also significant in creating baseline information that may be extrapolated to
other woredas and zones of the region. Moreover, the findings of the study will pave the way for
other researchers who want to conduct a detailed research on the issue.
1.7. Limitations of the study
Due to constraints arising from poor infrastructure, security problems, harsh climatic conditions
and other logistics related problems, the researcher couldn’t cover all woredas of the zone. Hence,
the research results are primarily based on data collected from randomly selected sample of 100
respondents (livestock owner household heads) from ten pastoral associations in two woredas. For
the study, gross annual livestock income was used because of biased expenditure information
obtained from herders. Moreover, gross annual livestock income is limited to income from sale of
livestock and livestock products, milk production in monetary term and value of slaughtered
animals for consumption, due to difficulty of valuating other livestock products, byproducts,
services and social values. However, recommendations and policy implications drawn out of this
study could be used in other locations in Gebi-Resu zone of Afar National Regional State.
1.8. Organization of the thesis
The report of the study has been spread over five chapters. The first chapter deals with the
introduction, background of the study, statement of the problem, objectives of the study, research
questions, hypothesis of the study, scope of the study, significance of the study, limitations of the
study and organization of the thesis. The second chapter covers review of theoretical and empirical
literatures related to the investigation. This is followed by the methodology used in the research in
chapter three. The fourth chapter presents the results and discussion part of the study. In the fifth
chapter, the conclusion and recommendations are given.

8
CHAPTER II
LITERATURE REVIEW
2.1. Theoretical Background
2.1.1. Concepts and Definitions
In this part definitions and concepts related to livestock, livestock production, pastoralists,
pastoralism, household income and livestock income are explained.
2.1.1.1. Livestock
Livestock usually represent domesticated animals, including cattle, sheep and goats, horses, mules,
camels, donkeys, pigs and others, which are often used to help cultivate fields, harvest crops, and
transport farm products to buyers and provide protein to human beings. Animal husbandry not only
refers to the breeding and raising of animals for meat or to harvest animal products (like milk,
eggs, or wool) on a continual basis, but also to the breeding and care of species for work and
companionship (Wikipedia, the free encyclopaedia).
2.1.1.2. Livestock Production Systems
Livestock production systems can be defined based on feed sources, as grassland - based, mixed,
and landless. Grassland based livestock production system relies upon plant material such as shrub
land, rangeland, and pastures for feeding ruminant animals. Outside nutrient inputs may be used,
however manure is returned directly to the grassland as a major nutrient source. This system is
particularly important in areas where crop production is not feasible due to climate or soil,
representing 30-40 million pastoralists. Mixed production systems use grassland, fodder crops and
grain feed crops as feed for ruminant and mono-gastric (one stomach; mainly chickens and pigs)
livestock. Manure is typically recycled in mixed systems as a fertilizer for food crops. Landless

9
systems rely upon feed from outside the farm, representing the de-linking of crop and livestock
production (Wikipedia, the free encyclopaedia).
2.1.1.3. Livestock Marketing Features and Structures
A market is the set of or an aggregate of people who, as individuals or as organizations, have a
need for certain products and the ability, willingness and authority to purchase such products
(Kotler et al., 2004). It can be described as simple arrangements to facilitate exchange of one thing
for another. The most observable features of a market are its pricing and exchange processes. This
investigation adopts the product definition of market. A market is also defined to include people,
money and willingness to buy. In this context, market is another name for demand.
Marketing projects different impressions to different groups of people in a society, like farmers,
traders and consumers. According to the American Marketing Association in McDaniel C., et al.,
(2006), marketing is an organizational function and a set of processes for creating, communicating
and delivering value to customers and for managing customer relationships in ways that benefit the
organization and its stakeholders. On the other hand, Kotler and Armstrong point out that
marketing should not be understood in the old sense of making a sale, but in the new sense of
satisfying customer needs. Accordingly, they define marketing as a social and managerial process
whereby individuals and groups obtain what they need and want through creating and exchanging
products and value with others (Kotler et al., 2004). Kohls and Uhl (1985) described agricultural
marketing as the performance of all business activities involved in the flow of food products and
services from the point of initial agricultural production until they are in the hands of consumers.
Unlike other agricultural products, marketing of livestock and livestock products involves risks
and high maintenance and transport costs. In moving animals from place of origin to marketplaces
and from one market to another and end users, the animals will lose weight, could be sources of
disease transmissions or could be exposed to diseases, and could pollute environments. Livestock
also requires special market facilities, including market places, water and feed supply, shades,
health posts, etc. Under strict movement controls, there is a need for movement permits, which
incurs costs and consumes time in search of veterinary officers. In cases of export, stringent health
requirements are also another burden on livestock marketing (PFE, 2004). Marketing of animals by
pastoralists is basically a function of their basic needs, such as food grains, clothing, health care
and fallback during periods of drought.
10
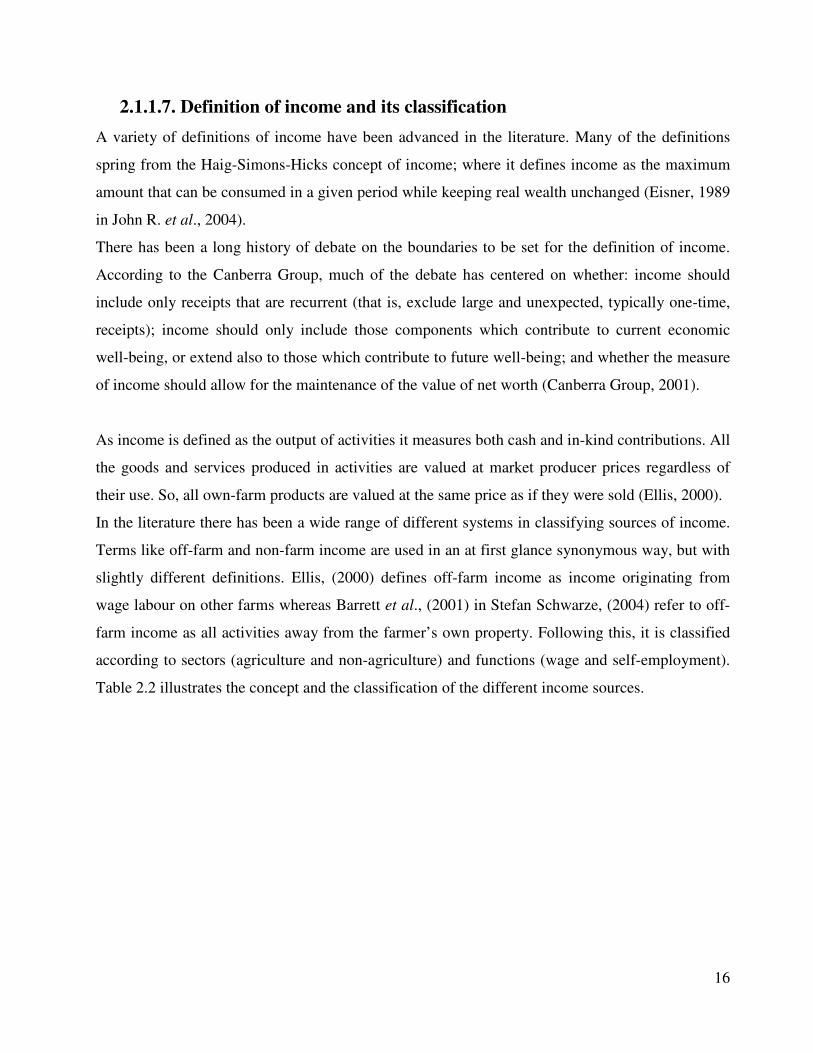
Livestock markets in Ethiopia function at three levels consisting of primary, secondary; and
terminal markets. Some also include a nominal forth tier at the farm gate level, which could hardly
be considered to function as a market (Ayele et al., 2003). Primary markets have been identified as
village level markets with a supply of less than 500 head of cattle/week where primary producers
(farmers and pastoralists) sell small number of animals to small traders, other farmers (replacement
animals), farmer or pastoralist-traders and in some cases to consumers and local butchers. Such
markets are not fenced, have no scales, and no feeds and watering facilities. Purchasing is done
through ‘eye ball’ negotiations. A good majority of the livestock markets in Ethiopia belong to this
group.
Secondary markets are trader and to some extent butcher dominated markets, with an average
volume of 500 – 1,000 heads per week consisting of finished, breeding and draught stocks and
located mainly in regional capitals. Secondary markets serve the local consumers to some extent
but mainly feed the terminal markets. These markets also supply live animals to exporters and
meat processors.
The terminal markets are located in large urban centres. Medium to large-scale traders and
butchers dominate these markets. Average volume of cattle brought to these markets may exceed
over a 1,000 heads/week.
The decision to sell animals by the primary producers (both farmers and pastoralists) is usually
based on urgent cash requirements (Ayele et al., 2003; PFE, 2004). Producers come to the markets
with no information beforehand on the going price of the day and farmers may take back their
animal(s) if the price offered is too low to try their luck next time in the same or in another market
nearby. Pastoralists take the same measure if the market happens to be close to where they graze
their animals. But, if the market is of some considerable distance from where they reside, then they
will be forced to sell their animals, however low the price is on the day, as they cannot afford to
return empty handed without buying grain and other necessities for their families. Profit becomes a
motive for sale only at farmer-trader level and above (PFE, 2004).

11
Table 2.1: Typical Ethiopian livestock market structure
Variables
Market structures
Farm-gate sales Local/Primary
markets
Secondary
markets
Terminal
markets
Players Farmers/pastoralists
and rural traders
Farmers and rural
traders
Small traders and
farmers (sellers);
Bigger traders
and butchers
(buyers)
Big traders
(sellers);
Butchers (buyers)
Animals Cattle, sheep and
goats
Heifers, young bulls,
replacement for
breeding and draft;
Minimal local
consumption
Slaughter,
breeding and
draft stock
Slaughter types;
culled for age,
oxen and barren
cows
Volume Usually 1-2 <500heads/week 500-1000
heads/week
>1000 heads/week
Location Farms and
rangelands
Market centers in
rural areas
Regional towns Principal cities
Source: Ayele et al., 2003
2.1.1.4. Livestock and Pastoralists
According to Antonio R. et al. (2009), pastoralists are people who derive more than 50 per cent of
their incomes from livestock and livestock products. Pastoralists are people who live mostly in dry,
remote areas, whose livelihoods depend on their intimate knowledge of the surrounding ecosystem
and on the wellbeing of their livestock.
Pastoral systems take many forms, adapted to particular natural, political and economic
environments. The types of livestock kept by pastoralists vary according to climate, environment,
water and other natural resources, and geographical area, and may include camels, goats, sheep,
yaks, horses, llamas, alpacas, reindeer and vicunas (Antonio R. et al., 2009).

12
Mobility is a key feature qualifying pastoralism. Pastoralism is a cultural and economic system that
incorporates and defines social structure, resource management, productivity, trade, and social and
welfare mechanisms in communities founded on livestock rearing as the primary economic activity
(PLI, 2008). The term nomadic is used when mobility is high and in irregular patterns;
transhumant when there are regular back and-forth movements between relatively fixed locations
and sedentary for the rest.
Pastoralists inhabit zones where the potential for crop cultivation is limited due to low and highly
variable rainfall conditions, steep terrain or extreme temperatures. Within this unpredictable,
vulnerable and dynamic environment, they have developed successful mechanisms of adaptation to
maintain an ecological balance between themselves and the natural environment. According to
International Fund for Agricultural Development IFAD, 2004, today there are nearly 200 million
pastoralists in the world generating income where conventional farming is limited or not possible.
However, pastoral communities are marginalized and generally not given due consideration in
wider socio-political analysis.
Pastoralists constitute 12-15% of the population of Ethiopia and occupy about 60% of the total
landmass of the country. They highly depend on livestock for their living. They live in arid and
semi-arid, peripheral areas of the country. In Ethiopia, pastoralists are victims of unusually large
number of myths and misconceptions contributing immensely to the generation of inadequate,
often hostile, development policies and interventions which in turn, create major barriers for
sustainable pastoral development. According to the Pastoralist Forum Ethiopia (2004), the most
notable myths and the barriers they engender are the following:
• Mobility is inherently backward, outdated, chaotic and disruptive;
• Provision of services for mobile pastoral community is impossible;
• Pastoralists cannot be trusted enough for provision of financial services;
• Poor access to services (veterinary services, credit, markets, training and inputs),
technologies and innovations.
Moreover, this livelihood is highly vulnerable to drought, animal disease outbreaks or other
shocks.
In pastoral areas livestock are considered as a means of wealth accumulation and as indicators of
status in the societal hierarchy. Thus, livestock sales decision-making usually depends on family
needs for cash income, which is used to buy food grains and other essential commodities, such as

13
clothing, and to cover social expenses, including weddings, funerals; human and animal health
care, etc. Occasionally, seasonal shortage of rainfall, due to its impact on feed availability, forces
higher supply to the market. This forced supply is constrained by the inability of the pastoralists to
plan sales in accordance with market needs (Belachew and Jamberu, 2002).
2.1.1.5. Role of Livestock
As far as role of livestock to the livelihood of livestock keepers is concerned, it is viewed as a form
of financial, social and natural capital (McLeod et al., 2001 in IFAD, 2004). Furthermore,
livestock can enhance human capital and play a critical role in reducing malnutrition.
Livestock is first and foremost financial capital. For many poor households, livestock is the
primary form of savings. As an investment, few other resources can match livestock as a means of
capital growth. Animal sales may allow poor households to generate cash quickly during times of
need.
Livestock is also social capital. Livestock is important in supporting social relationships. Loans
and gifts of livestock contribute to bonding, bridging and linking in social capital relationships,
and livestock is one means by which family and household social capital may be measured,
(Woodcock et al., 2000 in IFAD, 2004). In many poor households, livestock is shared or loaned
among relatives and friends or reared for absentee owners (Heffernan et al., 2000 in IFAD, 2004).
These arrangements can vary widely, from straightforward rental agreements to more complex
loan arrangements in which the duration of the payback may be intergenerational. Animals may
also be given as gifts, and, in this manner, livestock can help cement social networks and
community-level obligations among households. From own experiences in most rural parts of
Ethiopia, most livestock credit-in-kind systems are based on a commercial principle of giving one
or more animal offspring to other members of the community.
In Eastern Africa pastoralist societies, livestock loans are generally less common than livestock
gifts. Moreover, both loans and gifts tend to be less commercially oriented and more dependent on
social capital arrangements. As such, gifts and loans are transacted both formally and informally.
For example, in many societies, dowry and bride wealth are paid in livestock, and livestock is
often given in direct response to the emergency needs of friends and neighbours (Heffernan et al.,
2000 in IFAD, 2004).

14
However, the use of livestock as social capital may become less frequent as the role of livestock
slowly becomes a more productive-oriented and commercial one, common practice in many parts
of Ethiopia today. In a study among pastoralists in Kenya, for example, Heffernan et al., (2000) in
IFAD (2004) found that the formal role of livestock in inheritance, bride wealth and other
ceremonies is now much more important than the informal role in gift giving.
Livestock can help maintain natural capital. The integration of livestock in crop production can
enhance the sustainability of farming systems because the use of livestock provides draught power
and transport, improves soil fertility and increases the productivity and income opportunities for
poor households, while helping households finance the purchase of farm inputs. Recent studies
report examples in which the integration of livestock and crop production has improved farm
productivity and income by from 50 to over 100% (IFAD, 2004).
Livestock production can enhance human capital in several ways. In a study of the impact of a
smallholder livestock development project in Bangladesh, it is found that all participating women
had increased their incomes. The extra income was used to buy more food, send children to school
and augment assets such as land. The women also enhanced their participation in decision-making
at the household level (Nielsen, 1996 in IFAD, 2004).
Livestock can also improve the nutritional status of poor families. Malnutrition often results from a
combination of a lack of access to food, a lack of nutritional knowledge and inequality in the
distribution of resources within families. The extra regular income derived from livestock
production therefore has the potential to increase access to food within the family. At the same
time, enhanced knowledge and status among women significantly reduce malnutrition among the
women and their children.
2.1.1.6. Constraints for Sustainable Livestock Production
The livestock keepers face a variety of constraints to sustainable livestock production, which in
turn affect the income they derive from the livestock. LID (1999) classifies the problems of the
poor livestock keepers into three basic categories: herd and infrastructure acquisition; herd and
flock maintenance and marketing of livestock products. Herd and infrastructure acquisition require
that households have access to capital and credit facilities so that they can purchase the livestock
and pay for the infrastructure. Herd maintenance requires that households maintain the health of
their animals and have access to animal production services. To market their livestock and

15
livestock products, they need to have access to reliable markets for off-take; where in all cases
challenging to pastoralists. These needs are also recognized in Heffernan et al. (2002) in IFAD
(2004), who carried out an open-ended ranking exercise among over 1,700 households in Bolivia,
India and Kenya. The study illustrated that the majority of households ranked a lack of access to
fodder and water as their most serious problem in the maintenance of livestock. Livestock diseases
were the most significant problem for approximately 20% of the producers.
However, aside from these major constraints, the other problems identified differed widely among
the countries and the districts involved in the study. For example, theft was considered a serious
problem among pastoralist communities in Kenya. Urban producers in India were concerned about
access to sufficient space to keep livestock and the low production levels, whereas accidents –
mainly involving cattle becoming snared in barbed wire – ranked quite high in Bolivia.
Additionally, a number of participants believed that their knowledge of animal husbandry and
health was insufficient (Heffernan et al., 2002 in IFAD, 2004).
Figure 2.1: Main livestock problems of selected three countries
0
10
20
30
40
50
60
Pe
rce
nt
of
Re
spo
nse
s
Problems
India Bolivia Kenya
Source: Adapted from Heffernan et al. (2002) in IFAD (2004)
16
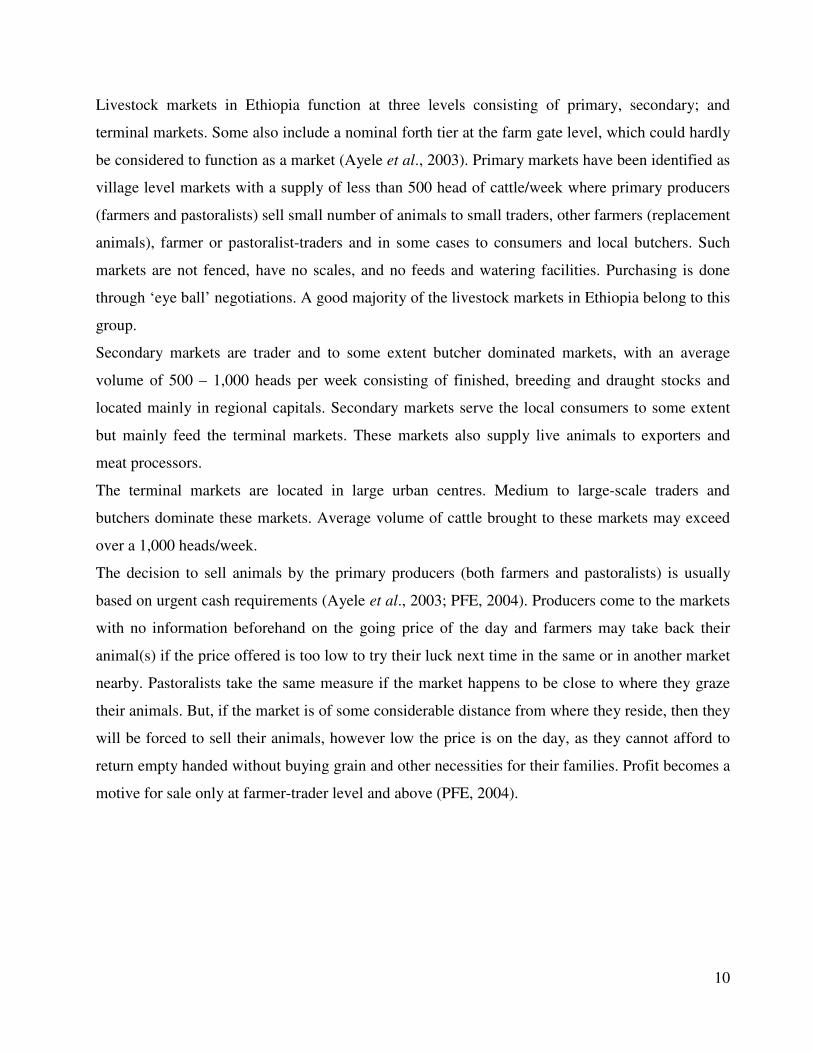
2.1.1.7. Definition of income and its classification
A variety of definitions of income have been advanced in the literature. Many of the definitions
spring from the Haig-Simons-Hicks concept of income; where it defines income as the maximum
amount that can be consumed in a given period while keeping real wealth unchanged (Eisner, 1989
in John R. et al., 2004).
There has been a long history of debate on the boundaries to be set for the definition of income.
According to the Canberra Group, much of the debate has centered on whether: income should
include only receipts that are recurrent (that is, exclude large and unexpected, typically one-time,
receipts); income should only include those components which contribute to current economic
well-being, or extend also to those which contribute to future well-being; and whether the measure
of income should allow for the maintenance of the value of net worth (Canberra Group, 2001).
As income is defined as the output of activities it measures both cash and in-kind contributions. All
the goods and services produced in activities are valued at market producer prices regardless of
their use. So, all own-farm products are valued at the same price as if they were sold (Ellis, 2000).
In the literature there has been a wide range of different systems in classifying sources of income.
Terms like off-farm and non-farm income are used in an at first glance synonymous way, but with
slightly different definitions. Ellis, (2000) defines off-farm income as income originating from
wage labour on other farms whereas Barrett et al., (2001) in Stefan Schwarze, (2004) refer to off-
farm income as all activities away from the farmer’s own property. Following this, it is classified
according to sectors (agriculture and non-agriculture) and functions (wage and self-employment).
Table 2.2 illustrates the concept and the classification of the different income sources.

17
Table 2.2: Concept and classification of income
Function
Sector
Agriculture Non-agriculture
Self-employment
Annual crops
Perennial crops
Livestock
Forrest products
Enterprises
Rentals
Wage employment
Agricultural wage labour Non-agricultural wage labour
Source: Barrett et al., 2001 in Stefan Schwarze, 2004
A household income survey conducted in rural Egypt by André Croppenstedt (2006) states that
household incomes are disaggregated into six categories:
• Wage income, both formal and informal, origination in either the non-agricultural or the
agricultural sector;
• Crop and livestock income includes revenues from crops
and livestock (sale of live
animals, sale of animals for slaughter, sale of animal products)
production as well as rental
income from ploughing and machinery services;
• Household enterprise income, includes enterprises in the agricultural and non-agricultural
sector;
• Financial income, includes returns on financial assets;
• Transfer income, includes remittances and transfers sent to the household as well as income
from pensions, and;
• Real estate income, includes rent from agricultural (and other) land as well as rent from
household dwelling (renting out part of own dwelling) and rent from other assets.
Another study made in Mozambique states household income defined to include food retained for
own consumption, all crop and livestock sales, livestock slaughter, cash and in-kind payments
received off the farm, and remittances, net of cash and in-kind payments made to hired labor,
(1992).

18
2.1.1.8. Sources of Household Income and Share of Livestock Income
A household baseline survey conducted by Farm Africa (2009) in Afar region found that the
major source of household income for pastoralists is sale of animals. The study adds that the
livelihood of inhabitants is predominantly pastoralism, although agro-pastoralism is practiced.
Furthermore, charcoal production, petty-trade and employment in local government and NGOs
also constitute the means of living mainly for urban dwellers. The entire community livelihood in
the rural areas is based on livestock production. Livestock represents the most important
economic activity in the area and the sector provides a significant proportion of the overall
livelihoods asset base and activities of the inhabitants.
The livelihood survey by Farm Africa (2009) showed that 89% of the households in Gewane
woreda of administrative zone III of Afar region rely on livestock and livestock-products as their
main source of income followed by non-farm employment (wages, salary, business etc); and crop
and fruit cultivation. According to the survey result of Farm Africa, natural resource based
activities, mainly, production and sell of charcoal and fuel wood were found to be the least
important means of income. Accordingly, livestock income receives the highest share of the
household income.
Other countries’ experiences on household income sources revealed that livestock is first and
foremost important financial capital for the household. For many poor households, livestock is the
primary form of savings. As an investment, few other resources can match livestock as a means of
capital growth. Animal sales may allow poor households to generate cash quickly during times of
need. Moreover, livestock by-product, including manure, is often a key source of income. In a
comparative study of poor livestock keepers in Bolivia, India and Kenya, Heffernan, Nielsen and
Misturelli, (2001) in IFAD, (2004) found that livestock outranked the other means in the responses
in all the three countries (Figure 2.2). As can be seen from the figure 2.2 below, livestock ranked
first in terms of household income among the majority of households in India and Kenya.
However, despite the benefits, livestock rearing is also risky for the poor. Because poor households
have limited disposable incomes for the purchase of inputs, the production risks are greater among
poorer producers, especially because they are unable to control mortality. Furthermore, some
livestock-related income has seasonal peaks, which may negatively affect the poor. Poorer
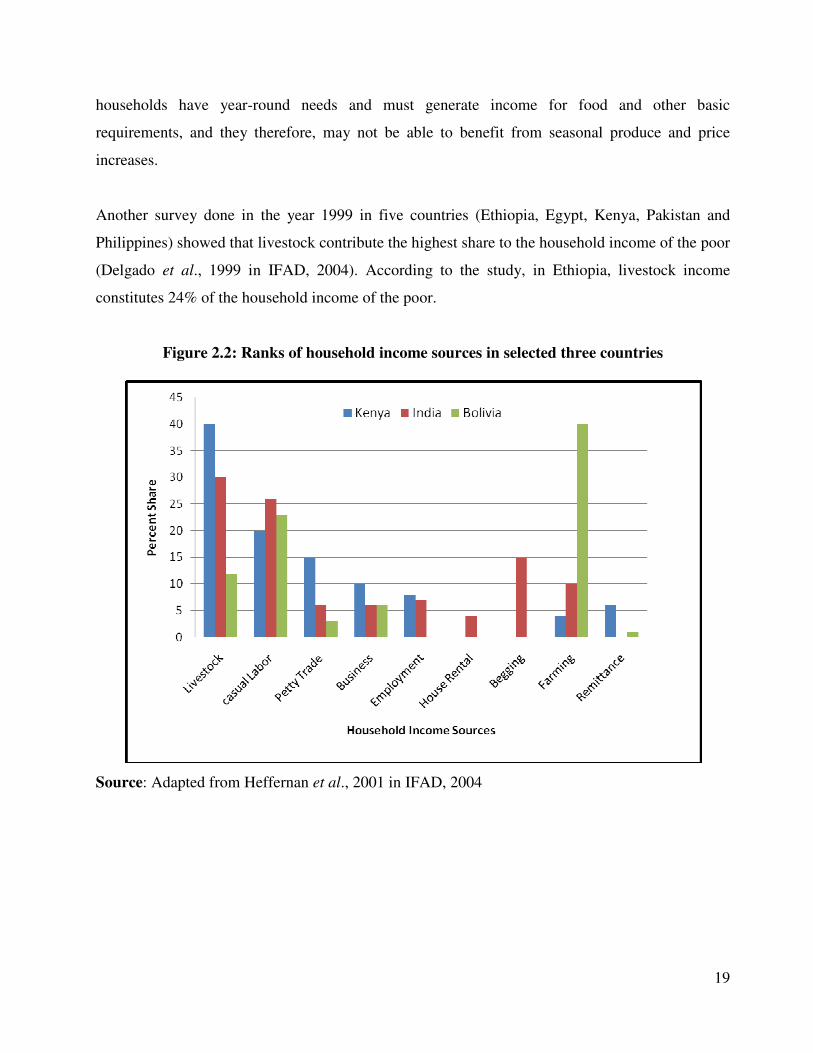
19
households have year-round needs and must generate income for food and other basic
requirements, and they therefore, may not be able to benefit from seasonal produce and price
increases.
Another survey done in the year 1999 in five countries (Ethiopia, Egypt, Kenya, Pakistan and
Philippines) showed that livestock contribute the highest share to the household income of the poor
(Delgado et al., 1999 in IFAD, 2004). According to the study, in Ethiopia, livestock income
constitutes 24% of the household income of the poor.
Figure 2.2: Ranks of household income sources in selected three countries
Source: Adapted from Heffernan et al., 2001 in IFAD, 2004
20
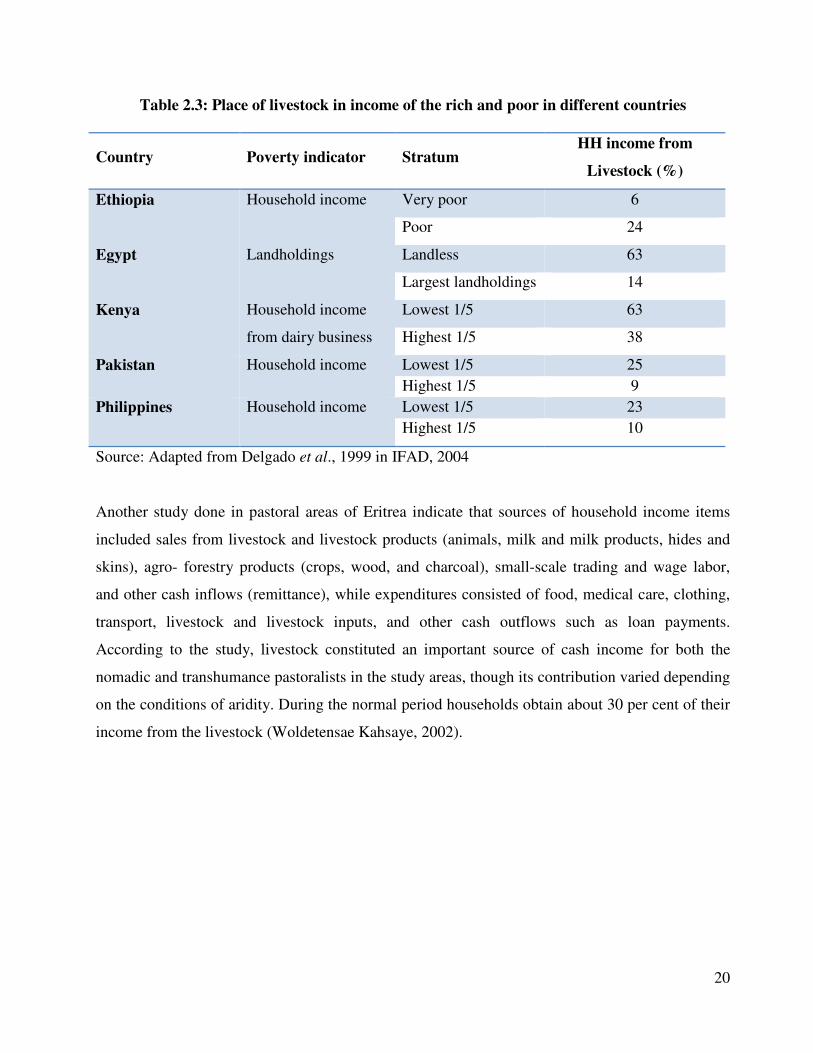
Table 2.3: Place of livestock in income of the rich and poor in different countries
Country Poverty indicator Stratum HH income from
Livestock (%)
Ethiopia Household income Very poor 6
Poor 24
Egypt Landholdings Landless 63
Largest landholdings 14
Kenya Household income
from dairy business
Lowest 1/5 63
Highest 1/5 38
Pakistan Household income Lowest 1/5 25
Highest 1/5 9
Philippines Household income Lowest 1/5 23
Highest 1/5 10
Source: Adapted from Delgado et al., 1999 in IFAD, 2004
Another study done in pastoral areas of Eritrea indicate that sources of household income items
included sales from livestock and livestock products (animals, milk and milk products, hides and
skins), agro- forestry products (crops, wood, and charcoal), small-scale trading and wage labor,
and other cash inflows (remittance), while expenditures consisted of food, medical care, clothing,
transport, livestock and livestock inputs, and other cash outflows such as loan payments.
According to the study, livestock constituted an important source of cash income for both the
nomadic and transhumance pastoralists in the study areas, though its contribution varied depending
on the conditions of aridity. During the normal period households obtain about 30 per cent of their
income from the livestock (Woldetensae Kahsaye, 2002).

21
2.2. Empirical Studies on Determinants of Household Income
Under this section, summary results of previously done studies on factors affecting household
and/or farm household income in different countries are summarized.
Permanent household income for a given household is a factor of many variables. Despite the huge
livestock population in the Afar region (Afar Atlas, 2006), pastoralists’ income from livestock is
not proportional to the volume. This mainly is attributed to wide ranging problems of
underdevelopment and lack of market-oriented production, lack of adequate information on
livestock resources, inadequate permanent animal route and other facilities like water and holding
grounds, lack or non-provision of transport, ineffective and inadequate infrastructural and
institutional set-ups; together with the prevalence of diseases, illegal trade and inadequate market
information (Mohamed, 2009; Tesfaye, 2008).
According to the survey result made in rural Ethiopia, the determining factors affecting the
household income and consumption include the following: household size, farming systems, sex of
household head, education level of household head, age of the household head, land size, livestock
number, dependency ratio, wage employment, and access to credit (Alemayehu Reda et al., 2006).
Another study conducted in pastoral areas of Oromia region by PCDP also shares the same idea
with the above study result in that some continuous and dummy variables determine the rural
household income negatively or positively. The study found that the continuous variables that
influence livestock income are livestock holding, family size, and age of head of the household;
and dummy variables refer to pastoral system such as mobility, nature of housing, involvement in
farming and trade, sex of the household head (PCDP, 2005).
Study conducted in Yemen showed that incomes of farmers were found to be influenced by
education, area of land, livestock holding, family size, and whether coffee is grown, but not
farmer’s age (Mohammed S, 2007).
A study conducted in selected rural districts of Malawi show that household income is influenced
positively by whether the household involves in growing rain fed food crops, cultivating tobacco
and groundnut, whether the household is a member of farmers club (cooperative), has access to
farm loans and uses irrigation schemes. There are significant positive correlations between

22
agricultural income and rain fed food crops, groundnuts, tobacco, farmers’ club, loan access and
with two exceptions the variables show a strong positive relationship which means that districts
with a high share of households involved in these productions and institutions have a higher
income (Andreas Bohne, 2008).
Another study done in Indonesia revealed that access to physical and human capital has a
significant influence on total household income. The area owned by the family, the value of other
assets possessed, as well as the number of livestock and family labourers positively influence
household income. The physical capital endowment turned out to be an important determinant of
total household income. An additional hectare of land owned raises income by 8% and an
additional livestock unit by 16%. The value of other assets owned also has a positive and
statistically significant, but very small influence on income. The dependency ratio, which measures
the ratio of children and elderly household members to adults, has a statistically significant
negative influence. This means that the more children and elderly in relation to adults are members
of a household the less the household income. An increase in the ratio by one unit increases
income by 25%. The influence of education is weak and not statistically significant. An additional
year spent in school by the head of the household increases average income by 1%. Although not
statistically significant, ethnicity and participation in formal credit markets have a strong influence
on total household income. Belonging to a non-indigenous ethnicity increases total income by 24%
and borrowing from formal sources increased income by 33% (Stefan Schwarze, 2004).
According to a study conducted in Mozambique the factors explaining variations in farm and off–
farm income are described as household characteristics such as gender, household size and age,
education; assets (land, machinery, livestock); and remittances; community and regional factors
such as market access and infrastructure development; institutional factors such as access to credit,
government policy, extension; bio-physical factors such as climatic, diseases; and economic
factors such as markets, inputs (Thomas Walker et al., 2004). This study also analyzed
determinants of income by sources. Accordingly, the livestock income is found to be significantly
influenced by gender of the household head, age (age groups of 15 – 64 deserve higher livestock
income), land size, number of traction animals; belong to association, drought risk, and number of
family members wage employed.
Still another study result shows that the household economic status (which is measured in terms of
level of income of the household) is influenced by some household characteristics. Accordingly,

23
the explanatory variables that are statistically significant are level of education of the household
head, age of household head, occupation, and techniques of farms management practices. Each
explanatory variable is associated with family economic status (level of income) (Mehdi
Yadollahi, et al., 2009).
A study was done in two coastal villages of Tanzania on determinants of total household income.
In the study the determinants of total income at household level in order to understand the factors
responsible for total income variation among households were analyzed. Accordingly, entitlements
to fishing assets such as possession and/or access to fishing gears, fishing boats and social capital,
agricultural land ownership, and the age of adult members of household were important
determinants of total household income (Sesabo J. K. et al., 2005).
Another study conducted in Northern Kenyan agro-pastoral area on livelihood choices among the
agro-pastoralists puts forward the determinants of household income. Based on the results of the
analysis of the factors influencing overall income levels the results of the best performing OLS
model with natural log of annual net income as the dependent variable, herd size (TLU) was the
principal factor explaining variation in levels of annual net income. Moreover, Education of the
household head and diversification of household income sources, measured as the number of
income earning activities pursued, significantly influence income level. Only two spatial factors
(distance to the nearest livestock market town and pasture potential) showed up as significant in
terms of explaining variation in net incomes across households (Radeny M. et al., 2006).
In the same study, similar regressions on livestock incomes were ran to see if the driving factors
differed significantly. The results show that herd size (in TLU) alone is able to explain over half
(52%) of the variation in livestock income. Households with larger herds earn significantly more
than households with smaller herds of livestock. The results suggest that a 10% increase in TLU
per household would increase livestock returns by 7.5 percent. Of the spatial variables, distance to
the nearest permanent water source was marginally significant (p<0.1) and negatively correlated
with livestock returns, implying households located closer to water points earn more from
livestock than those living farther from permanent water sources (Radeny M. et al., 2006).
24
According to the study conducted on livelihoods diversification patterns among households in
Kenya, it is likely that there is a linkage between the types of livelihood diversification patterns
and income level through differences in economic returns of livelihood components. Therefore,
effects of particular livelihood diversification portfolios along with variables representing
household and homestead characteristics on the total gross income through ordinary least squares
(OLS) estimation was estimated. The significant variables are age and education years of the head,
participation years in farmers group, adult equivalent, and specialisation in casual off-farm
activities (Miyuki Iiyama, 2006).
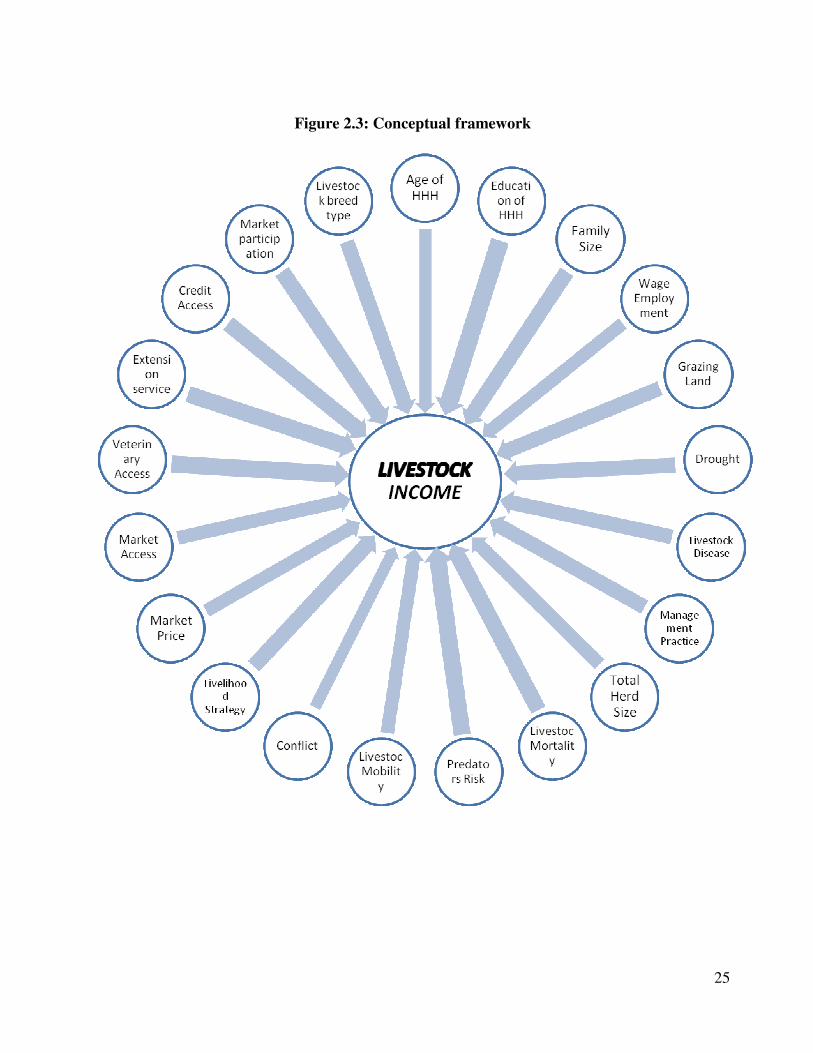
2.3. Conceptual Framework
After exploring literatures, independent variables for the study were identified. For the sake of
simplicity, a conceptual frame work of some 21 factors (variables) was depicted (Figure 2.3).
However, these are not the only factors affecting livestock income; nor it is affected by a single
factor but combinations of factors exert impact either positively or negatively.
25
Figure 2.3: Conceptual framework
26
CHAPTER III
MATERIALS AND METHODS
3.1. Description of the Study Area
The Afar National Regional State is situated in the North Eastern part of Ethiopia. It is
geographically located between 390 34’and 42
0 28’ East Longitude; and 8
0 49’ and 14
0 30’ North
Latitude. The region is bordered to the north-west by Tigray region, to the south-west by the
Amhara region, to the south by Oromia and to the south-east by Somali region and to the north-
east by Djibouti and Eritrea. The 2008 housing and census report of the Federal Democratic
Republic of Ethiopia Census Commission reveals that the estimated total population of the region
is 1,411,092 and with population growth rate of 2.2 per cent (FDRECC, 2008). The Region
covers an area of 195,238sq.km and administratively divided in to five zones, 32 woredas; and
358 peasant associations and 28 towns (ANRS, 2005). The zonal population distribution of the
region is 421,790 (29.89 per cent) in zone I; 352,431 (24.90 per cent) in zone II; 198,628 (14.08
per cent) in zone III; 255, 542 (18.11 per cent) in zone IV and 183, 701 (13.02 percent) in zone V
(FDRECC, 2008).
Table 3.1: Population distribution of Afar region by place of residence and sex
Total
Population Place of Residence Sex
1,411,092
Urban Rural Male Female
No. % No. % No. % No. %
188,973 13.4 1,222,119 86.6 786,338 55.7 624,754 44.3
Source: FDRECC, 2008
In terms of land use patterns, about 14.8% of the total land area of the region is covered by grass
land; 31.5 % shrub land, 1.7% wood land and 0.11 % forest land. Whereas water bodies and wet

27
land together account for 1.37% of the total land, the vast area of the region, 49.6%, is an exposed
soil, sand or rock. 7% of the region’s land is also estimated to be cultivable.
As far as the livelihood system of the region is concerned, pastoralism and agro-pastoralism are the
two dominant modes of livelihood systems. Approximately, 90 per cent of the people depend on
subsistence pastoral production system while the remaining 10 per cent pursue agro-pastoralism
(CARE, 2007). The woredas where agro-pastoralism is common are located along the Awash
valley in zone I and III and those woredas located adjacent to Oromia, Amhara and Tigray regions,
which include Argoba special, Afambo, Assayita, and parts of Aba’ala, Megale and Koneb
woredas. The inhabitants also involve in some other off-farm activities such as charcoal making
for income.
The Afar Region is both the hottest and driest part of the country. The major part of the region falls
within the arid agro ecological zone below 500masl.The mean annual temperature of the region as
a whole is 35OC. Rainfall is rather sparse and erratic. The mean annual rainfall varies from 500mm
in the south-west to less than 200mm in the north-eastern part of the region. The coolest and
wettest parts of the region are those in the root hills of escarpment on the banks of the rivers.
The major livestock species raised by the Afar pastoralists are cattle, camel, sheep and goats.
Large number of donkeys and relatively small number of mules and horses are also kept.
According to the regional bureau of finance and economic development (regional atlas) in general,
there are about 3.4 million TLU of livestock in the region; of which about 1.6 million TLU of
cattle, 0.25 million TLU of sheep, 0.43 million TLU of goats, and 1.1 million TLU of camels, with
zonal variation (Afar Atlas, 2006).
The existence of high temperature and low rainfall creates high evapotranspiration in the region.
This situation removes the limited water from the soil. In addition to this, low soil fertility, rocky
and sandy nature of the land, crop production and land covered by crop is very limited. The major
crops cultivated in the region are cotton, maize, sorghum, fruits, vegetables and date palm. Most
of the region’s investment is in the agriculture sector, mainly in cotton production. According to
the investment office data, the regional investment activity is concentrated in 6 woredas; namely
Amibara, Gewane, Assayita, Dubti, Mile and Awash Fentale. There are abundant and diverse man-
made and natural tourism resources in the region, and could probably rank among the top most
tourist attracting regional states in the country. These comprise very astonishing and contrasting
landforms, wildlife, vegetation, historical and archaeological sites, mountains, rivers, lakes and hot

28
springs, etc. In the study area some remarkably mentioned tourist attraction sites are available:
part of Awash National Park, Yangudi Rasa Wildlife Reserve, Meteka hot springs and mount
Azelo can be mentioned.
Since the livelihood of the region is based mainly on livestock development and crops production
is minimal, the pastoralists are subjected to sell their livestock to buy food grains and other
industrial products. Due to lack of market in nearby, the pastoralists are forced to trek their
livestock to neighboring woredas in search of market. This condition creates significant impact on
the body weight of the animals and results in low price of animals in the market. Most of the
woredas of the region have no livestock market centers.
The major market centers in the region are Dubti, Asaiyta, Yalo, Chifra, Berhale, Dulecha, Melka
Werer, Dibino, Kuneba, Logiya and Shehet. Amhara, Tigray, Oromiya and Djibouti towns are
also big market centers for the region.
3.1.1. Overview of Gebi-Resu Zone and the Sample Woredas
The study was conducted in Administrative zone III (Middle Awash), otherwise known as Gebi-
Resu zone of Afar National Regional State which is found in between Upper and Lower Awash
River basins. Its altitude ranges from 500 to 820 meters above sea level and it is located between
90
30' and 100
20'N and 400
30' and 400
50'E. The main stays of local people to the region are
pastoral and agro-pastoral. It is administratively divided between six woredas namely Awash-
Fentale, Gewane, Dulecha, Amibara, Buremudaytu, and Argoba special. With regard to the
topography, the zone can generally be described as plain.
Based on CSA population and census result in 2008, this zone has an estimated total population of
198,628. It is bordered on the south by Oromia region, on the southwest by Amhara region, on the
west by administrative zone V of Afar region, on the north by administrative zone I of Afar region,
and on the east by the Somali region. Accordingly, it has three national boundaries with Oromia,
Amhara and Somali regions of Ethiopia and no international boundary. Based on the information
obtained from regional atlas, the zone had 806,189.1 TLU of livestock in 2005 (Afar Atlas, 2006).

29
Figure 3.1: Map of Afar National Regional State and location of the study area
.
Source: Afar Atlas, 2008
N

30
Table 3.2: Population distribution of woredas of Gebi-Resu zone of Afar Region
Woreda Population Urban Rural
Amibara 63,280 32,086 31,194
Awash 29,775 16,844 12,931
Buremudaytu 31,786 - 31,786
Gewane 31,313 5,982 25,331
Dulecha 20,683 1,189 19,494
Argoba special 21,791 2,166 19,625
Zone total 168,628
Source: CSA, 2008
3.1.1.1. Description of Gewane Woreda
Gewane is one of the six woredas of the Gebi-Resu zone. The wereda is bordered on the south by
Amibara, on the west by Buremudaytu wereda, on the north-west by administrative zone V, on
the north by the administrative zone I, on the east by the Somali Region and on the south-east by
the Oromia Region. The Awash River defines parts of the boundary with Administrative Zones
III and V.
The woreda consists of 9 pastoral Associations of which two urban and seven rural (five pastoral
and two agro-pastoral). It covers a total area of 59,640 ha. Based on the CSA report of 2008, in
Gewane woreda 31,313 people reside; of which 5,982 are urban and 25,331 are rural dwellers.
Therefore, more than 80% of the population of the wereda lives in rural areas.
The wereda is generally semi-arid with a temperature level that falls between 28 and 420c, with an
average temperature of 350c. Seasonal variations reveal that the temperature is moderate in the
months between September and November and also in the months of December through January.
The highest temperature is in the months between March and May. It is generally low from June
through August. The wereda receives an average annual rainfall of 320mm. Most of the rain is
concentrated in the months of July and August. The land use pattern shows that out of the total
area coverage of the woreda according to information from the livelihood survey result of Farm

31
Africa, 35.0% used for grazing, 6.6% is covered with crops, 15% is arable land, 25.4 % covered
with shrubs and the rest 18.36% either, barren or rocky and for settlement (Farm Africa, 2009).
Concerning livestock composition it has a total livestock population (cattle, shoat and camels) of
194,818.2 TLU (Farm Africa, 2009). The woreda has no livestock market place other than small
daily village markets for only small ruminants.
Gewane Agricultural Technical Vocational Training College is found in this wereda. Furthermore,
there are 33 cooperatives currently functioning in the woreda.
3.1.1.2. Description of Amibara Woreda
Amibara is one of the six woredas included in administrative zone-III of the Afar region. It is
bordered on the south by Awash Fentale Wereda, on the west by the Awash River which separates
it from Dulecha to the south-west then on the north-west by the administrative zone V, on the
north by Gewane wereda, and on the east by Oromia region; and administratively, it is structured
into 18 PAs.
Based on the CSA report of 2008, in Amibara woreda 63,280 people reside; of which 32,086 are
urban and 31,194 are rural dwellers. As can be seen from the previous table, unlike the low level of
urbanization in the Afar region, 51% of the population in Amibara is urban dwellers.
Agro-ecologically the weather condition of the wereda is generally semi-arid with a temperature
level that falls between 25 and 350c, with an average temperature of 30
0c. The altitude of the
wereda ranges between 720 and 1100masl. Seasonal variations reveal that the temperature is
moderate in the months between September and January while it is the highest in the months of
February and May. Temperature is generally low in the months of July and August. The wereda
receives an average annual rainfall of 360mm.
The livelihood of inhabitants in Amibara wereda is predominantly pastoralism, although agro-
pastoralism is also practiced. Furthermore, charcoal production, petty-trade and employment in
local government and NGOs also constitute the means of living mainly for urban dwellers. In
general, the main sources of food in the wereda are own livestock production, and some crop
production, and also purchase of cereals from the market.
32
3.2. Methodology
3.2.1. Sampling and Data Collection Procedures
Taking all the necessary cares while using the different techniques of sampling into consideration,
in this study, probability sampling techniques had been applied.
3.2.1.1. Sampling Design and Sampling Size
The study was conducted in two woredas (Gewane and Amibara) of Gebi-Resu zone of Afar
Region. For the study, Middle Awash (Administrative Zone III) is randomly selected.
From six woredas in Administrative Zone III (Gewane, Buremudaytu, Amibara, Awash-Fentale,
Dulecha, and Argoba Special), Gewane and Amibara are selected randomly for the study. For the
purpose of data collection from the randomly selected two woredas, livestock owners are taken as
the main targets. A total of ten Pastoral Associations are selected at random. The number of PAs
for each woreda is proportional to total number they have. Accordingly, from 9 PAs of Gewane
wereda, 4 (Beeda, Biriforo, Urafita and Yigle); and from 18 PAs of Amibara wereda, 6 (Andido,
Angelele, Badulale, Serkamo, Sidihafaghe and Kelatburi) are selected randomly. Then, by taking
into account the infrastructural availability, financial capacity, time availability and other logistics
requirements, ten households are selected randomly from each sample PAs for the study, totaling
100 households. Therefore, the sample size used in the study is 100.
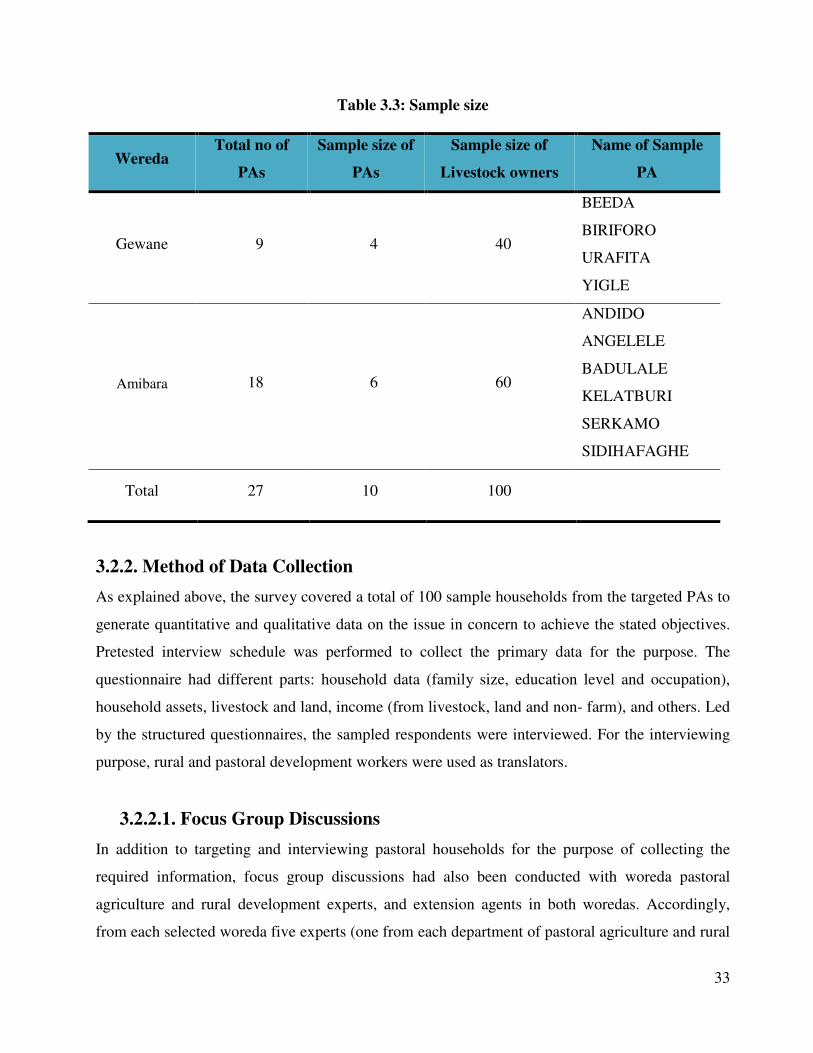
33
Table 3.3: Sample size
Wereda Total no of
PAs
Sample size of
PAs
Sample size of
Livestock owners
Name of Sample
PA
Gewane 9 4 40
BEEDA
BIRIFORO
URAFITA
YIGLE
Amibara
18 6 60
ANDIDO
ANGELELE
BADULALE
KELATBURI
SERKAMO
SIDIHAFAGHE
Total 27 10 100
3.2.2. Method of Data Collection
As explained above, the survey covered a total of 100 sample households from the targeted PAs to
generate quantitative and qualitative data on the issue in concern to achieve the stated objectives.
Pretested interview schedule was performed to collect the primary data for the purpose. The
questionnaire had different parts: household data (family size, education level and occupation),
household assets, livestock and land, income (from livestock, land and non- farm), and others. Led
by the structured questionnaires, the sampled respondents were interviewed. For the interviewing
purpose, rural and pastoral development workers were used as translators.
3.2.2.1. Focus Group Discussions
In addition to targeting and interviewing pastoral households for the purpose of collecting the
required information, focus group discussions had also been conducted with woreda pastoral
agriculture and rural development experts, and extension agents in both woredas. Accordingly,
from each selected woreda five experts (one from each department of pastoral agriculture and rural

34
development); and one pastoral extension worker from each selected PA were selected for the
purpose. Therefore, in the discussions a total of 20 individuals were involved.
3.2.3. Data Analysis
In order to achieve the stated objectives of the study the survey data were first debugged (sorted-
out), edited, and coded, organized, summarized and analyzed using statistical package for social
sciences (SPSS version 15.0). Both descriptive statistics and econometrics model had been
employed to address the specific objectives of the study. Using descriptive statistics, specifically,
statistical tools like percentages, mean, standard deviation, correlation coefficient and cross-
tabulation were employed during analysis and interpretation of the household quantitative
characteristics. Besides, statistical tests such as tests of significance and correlation were used for
interpretation of data and drawing conclusions.
3.2.3.1. Descriptive Analysis
In this study, the first two objectives (to identify sources of household income and to compute
share of livestock income) were analyzed using descriptive analysis; and econometric model was
employed to analyze the socio-economic factors affecting livestock income of sampled
respondents. The descriptive analysis was made using frequencies, means, and maximum and
minimum values of some important variables. Econometric model was used to estimate the
relationship between the variables of our concern and the hypothesis regarding these variables was
tested.
3.2.3.2. Econometric Model Selection and Specification
The core objective of this study is to identify the major socio-economic factors that have a positive
or negative impact on the level of the pastoralists’ livestock annual income in the study area and
critically analyzing level of impact of the factors on livestock income. It is hypothesized that
livestock income of a given household is determined by a wide variety of factors; economic, social
or cultural. In this study, following the conceptual framework some 21 independent variables
hypothesized to affect livestock income were analyzed statistically.
To select a proper model of statistical analysis basically follows, among other criteria to consider,
the nature of the dependent and independent variables. In this case the dependent variable, the

35
livestock income, obviously is a continuous variable measured in Ethiopian Birr (ETHB).
However, it can also be made discrete (classifying as very low, low, medium, high and very high
using some references as income quintiles or deciles); or even it can be made dummy variable
specifying as high or low income groups for the analysis purpose (European Journal of
Comparative Economics, 2007). Following this, either multiple regression model or logit models
can be applied. On the other hand, the nature of the regressors (independent/explanatory) variables
also dictates the type of statistical model for analysis. In this study some continuous and some
dummy variables were included. Models in which the dependent variable, or regressand, Y
depends on two or more explanatory variables, or regressors are referred to as multiple regression
models. Following Gujarati, regressors containing both quantitative and qualitative variables are
called analysis of covariance models (Gujarati, 2004).
Thus, the income analysis in this study has been done following the regression technique in linear
form; and the following multiple regression model was employed to estimate the determinants of
household livestock income.
Yi = ββββ0 + ββββ1x1i + ββββ2x2i + … + ββββnxni + ui ………………….. (1)
Where;
Yi = is the annual household income in monetary term from livestock;
X1, X2, …, Xn = are the explanatory (or the regressors) variables containing both quantitative and
dummies,
β0 = is the intercept gives the mean or average effect on Y of all the variables excluded from the
model;
β1, β2, … βn = are the partial regression coefficients of parameters; and
i = the ith
observation
Ui = is the stochastic disturbance or the error term

36
Or more expressively, the following multiple regression model can be specified for we have both
quantitative and qualitative (dummies) explanatory variables, (Gujarati, 2004). This model is more
expressive in that it clearly shows the continuous explanatory variables and the dummies.
Yi = ββββ0 + ββββ1Axi + ββββ2(FS)xi +ββββ3(TLU)xi + ββββ4(ED)xi + ββββ5D5xi + ββββ6D6xi + … + ββββnDnxni + ui .. (2)
Where;
A = is age of the household head;
FS = is family size of the household;
TLU = is the total herd size of the household in TLU;
ED = is the educational status of the household head;
D5, D6, …, Dn = are dummies where 1 = existence and 0 = otherwise
Eventually, it is statistically desirable to sort out problem of multicollinearity among the
continuous variables and check the association among discrete variables before estimating a
model. The term multicollinearity refers to a situation where two or more explanatory variables
can be highly linearly related.
If multicollinearity is perfect, the regression coefficients of the X variables are indeterminate and
their standard errors are infinite. If multicollinearity is less than perfect, the regression coefficients,
although determinate, possess large standard errors (in relation to the coefficients themselves),
which means the coefficients cannot be estimated with great precision or accuracy (Gujarati,
2004).
Multicollinearity is essentially a sample (regression) phenomenon in the sense that even if the X
variables are not linearly related in the population (i.e., population regression function), they can
be so related in particular sample. When we postulate the population regression function (PRF), we
believe that all X variables included in the model have a separate or independent effect on the
dependent variable Y. But it can happen that in any given sample that is used to estimate the
Population Regression Function some or all X variables are so highly collinear that we cannot
isolate their individual influences on Y.

37
Some authors use the variance inflating factor (VIF) – which defines the speed with which
variances and co-variances increase - as an indicator of multicollinearity. The larger the value of
VIF, the more collinear the explanatory variables will be. As a rule of thumb, if the VIF of a
variable exceeds 10, which will happen if (R2) exceeds 0.90, that variable is said be highly
collinear (Adem Kedir, 2009).
Therefore, in this study the contingency coefficients (C) and a variance inflating factor techniques
were employed to detect the problem of multicollinearity. VIF shows how the variance of an
estimator is inflated by the presence of multicollinearity. As R2 approaches 1, the VIF approaches
infinity. That is, as the extent of collinearity increases, the variance of an estimator increases,
and
in the limit it can become infinite. If there is no collinearity between the explanatory variables, VIF
will be 1.
For this, in the case of the variance inflating factor technique, each selected explanatory (Xi)
variable was regressed on all other explanatory variables, the coefficient of determination (R2)
constructed in each case was evaluated to detect whether multicollinearity is a serious problem.
VIF (βi) is defined as follows:
VIF …………………………………… (3)
Where, is the squared multiple correlation coefficient between Xi and the other explanatory
variables. A VIF value greater than 10 is used as a signal for a strong multicollinearity (Adem
Kedir, 2009; Gujarati, 2004).
Likewise, there may also be interaction between two qualitative variables, which can lead to the
problem of multicollinearity or association. To detect this problem, coefficients of contingency
were computed from the survey household data. The contingency coefficients are computed as
follows:

38
…………………………………………………. (4)
Where;
C = is the contingency coefficient;
χ2 = is chi-square random variable; and
N = is total sample size
3.3. Operational Definition of Variables
3.3.1. The Dependent variable
Livestock Income (INC_LS): The level of income that the pastoralists derive from livestock is
the dependent variable. Income by its very nature is a continuous variable. The annual households’
livestock income is considered to be a function of numerable socio-economic variables. Based on
the experiences, the respondents in the study area found to keep mainly cattle, shoat and camels.
The income from different types of livestock may be affected by different socio-economic factors
differently; however, assuming that the overall effect of the variables on the overall livestock
income likely to be similar, it is dealt for livestock income as a whole (aggregate effect on
livestock income).
Livestock income for this research purpose refers to the gross monetary income that the pastoral
households derive from the animals they keep mainly from cattle, small ruminants (sheep and
goats) and camel during the year before the survey. This income is equivalent to the income earned
from sale of animals, sale of animal products, and food for home consumption from the animals
mainly milk which is valuated to monetary form based on the current milk price in the study area.
Moreover, the value of slaughtered animals for home consumption was considered in the
calculation of livestock income. Pastoral households in the study area used to slaughter animals
only occasionally; i.e. especially in times of holydays, wedding ceremonies, when the spouse gives

39
birth, and when family member gets sick (especially when shot and wounded during conflicts).
The value of slaughtered animals for different purposes during the year before the survey was
valuated using the 2010 livestock price indices for the study area (CSA, 2010). Other animal
products (like hides and skins) and services (like transportation) from animals and social values
were not valuated and excluded from the computation of income of the household; because any
other animal products, other than milk and milk products are not used in terms of money in the
study area. The same applies for by-products, like manure. Following this, income from livestock
is expressed as:
INC_LS = INC_SA + INC_SAP + INC_MV + INC_VSA ……………. (5)
Where;
INC_LS = is annual income from livestock;
INC_SA = is income from sale of animals;
INC_SAP = is income from sale of animal products; and
INC_MV = is income from annual milk production valuated to ETHB
INC_VSA = is value of slaughtered animals in terms of ETHB
3.3.2. The Independent Variables
Based on the review of literature, the researcher’s personal experience of working in the pastoral
areas and consultation with experts, totally 21 independent variables were identified. As to the
scale of measurement of the variables, most of them are classified as categorical and few as
continuous in nature.
� Age of the Household Head (AGE_H): Age refers to the number of years from the birth
of the respondent to the time of the interview. Age by its nature is a continuous variable.
Age of the household head is assumed to have a direct relation with experience of keeping
livestock, in which case young aged respondents are hypothesized to be disadvantaged. On

40
the other hand, livestock production needs physical strength. In the pastoral areas livestock
owners are expected to travel long distances in search of grazing pasture and water for their
animals. Moreover, the herder needs to be strong enough to fight against predators and the
competing clans in times of conflict over resources. In these cases, old aged respondents
are hypothesized to be disadvantaged against income they earned from livestock. So the
effect of age on income is two directional. In both cases, mid aged (25 - 45) heads are
assumed to be advantageous, for they have average physical strength and experience of
livestock production. Therefore, it is hypothesized that mid aged (25 - 45) heads have a
positive impact on livestock income of the household.
� Educational Status of the Household Head (EDU_H): Education refers to the level of
schooling but a discrete number of years. Therefore, it is treated as discrete variable where
score “1" represents illiterates, "2" represents read and write “3” represents primary
education and "4" represents above primary education. It was hypothesized that education
to have a positive impact on the level of income from livestock for the household.
� Family Size (FAM_SIZ): It is a continuous variable, defined in terms of adult
equivalences, the availability of active labour force in the household, which affects
livestock owners’ income from livestock. Since production is the function of labour,
availability of labour is assumed to have positive relation with income. Therefore, family
size is expected to have a positive impact on annual livestock income. On the other hand,
the more dependant (children and old age) family members are in the household the more
will be the consumption in which case family size influences livestock income negatively.
� Total Livestock Holding (TLSH_TLU): It is a continuous independent variable measured
in terms of tropical livestock unit (TLU). Total livestock holding by the respective
household is referred to as the number of livestock species (in this case, cattle, shoats, and
camels) owned per household during the survey period. Ownership of more number of
livestock is expected to have positive relationship with pastoralist households’ annual
livestock income.

41
� Mobility (LS_MOB): It is a dummy variable where value ‘1’ is assigned to those
respondents who move their animals in search of feed and water, and ‘0’ otherwise. It
refers to the movement of the pastoralists with their livestock to distant areas far away from
their residences in search of grazing pasture and water for their animals; in which case risks
of animals theft by conflicting clans and risk of animals being eaten by predators is high,
which in turn decreases the total herd size, thereby affecting the income from livestock.
Therefore, it is hypothesized that mobility has a negative impact on the annual livestock
income.
� Risk of Predators (PRD_RISK): It is a dummy variable taking a value of ‘1’ for
responding ‘yes’ to the risk of occurrence of loss of animals through predators, and ‘0’
otherwise. It refers to likelihood of animals eaten by beasts in times of herding. It was
assumed to have a negative effect on the total TLU of livestock and thereby on the total
annual livestock income.
� Drought (DR_RISK): It is a dummy variable ‘1’ for affected by drought, and ‘0’,
otherwise. It is assumed that the possibility of a danger which results in lack or shortage of
grazing, water and other related resources due to the absence of rainfall. It is directly
related to the lack of grazing pasture and water for livestock. In times of drought loss of
stock is high due to death of animals for hunger. Animals lose body weight resulting in
lower price in the market for the herders. Pastoralists are forced to sell their livestock at
low price because they have no chance of keeping for next good time and waiting for fair
price. Therefore, it is hypothesized that occurrence of drought has a negative impact on
livestock income.
� Livestock price in the market (PR_LS); It is measured as a dummy variable which takes
the value “1” if the pastoral household head receives fair price for the sale of his livestock
and ‘‘0‘‘ otherwise. It is assumed that livestock price in the market has a positive effect on
the livestock income.

42
� Livestock Mortality (MOR_LS); Mortality is a dummy variable where it takes a value of
‘1’ for the respondents responding ‘yes’ for losing animals through mortality in any case
during the year preceding the survey and ‘0’, otherwise. Herders usually lose animals due
to varying reasons including lack of feed and water during the times of drought, infected by
different diseases, injury by thorns of Prosopis Juliflora and etc. Mortality results in small
herds from which fewer animals would be available for sale and minimum income derived
from animals. It is hypothesized that the higher the rate of mortality the lower will be the
annual household income derived from livestock.
� Access to credit (CRDT_AC): It is measured as dummy variable taking a value “1” if the
pastoralist household responded for having access to credit, and “0”, otherwise. Pastoralists
will pass the bad times if they have access to credit. They will have bargaining power to
wait for good times and receiving good prices for their animals. Moreover, access to credit
for the herders helps them to purchase concentrates (alternative feed) for their animals.
Herders can improve the livestock production and productivity by adopting different
production technologies. Credit access eases access and use of all these production inputs.
It is hypothesized that access to farm credits affects livestock income positively.
� Access to Veterinary Services (VET_AC): It is a dummy variable assigned “1” for
having access to veterinary services and “0”, otherwise. It refers to the availability of
animal health centers and adequate animal health services near the residences of
respondents. Animal health extension workers assist herders to have continuous animal
health care which prevents their animals die of easily curable diseases. It is expected to
affect livestock income positively.
� Market Participation (PPT_MKT): Market participation refers to the involvement of the
respondents in selling their livestock (cattle, shoats, camels) in the market once or more
times in the year preceding the survey. It is measured as a dummy variable in which “1”
representing the respondents’ participation and “0”, otherwise. It is expected that market
participation affects annual livestock income positively.

43
� Conflict (CON_RE): It is measured as a dummy variable takes the value “1” if replied yes
for involving in any type of conflict over resources resulting in loss of livestock and “0”,
otherwise. It refers to the clashes among competent clans over resources. Occurrence of
conflict in pastoral areas causes loss of life of herders and animals, which in turn results in
decrease in the labor force, an input to livestock production and decrease in the total TLU
of livestock. Consequently, it is expected to influence livestock income negatively.
� Choice of Livelihood Strategy (LH_STGY): It is a dummy variable referring to whether
the respondent lives on pastoralism or agro-pastoralism; in which case the value “1”
represents involving in food crops cultivation (agro-pastoral way of livelihood) and “0”,
otherwise. Involvement of the respondents in crops farming may serve as an input for
livestock farming by using the crop residues as livestock feed; on the other hand, it may
compete for resources like labor and land. Therefore, it is difficult to hypothesize the effect
of choice of livelihood between pastoralism and agro-pastoralism.
� Employment (EMPT_WAGE): It is measured as a dummy variable which assumes a
value “1” for respondents’ involvement in any paid work and “0”, otherwise. It refers to the
engagement of the respondents in any form of paid labor or skill activities such as working
as civil servant or work for investors. Employment may add capital on the livestock
production and thereby improvement in the production system where the effect is positive
or may compete for labor resource in which case affects negatively. It is impossible to
make a priori assumption about the effect of wage employment on the annual livestock
income.
� Grazing Land Availability (AV_GL): It refers to the availability of grazing land in
required quantity and quality in nearby areas. It is measured as a dummy variable which
takes a value “0” for those respondents having problem of grazing land and “1”, otherwise.
Grazing pasture and water are the major inputs for healthy livestock production. Livestock
produced with sufficient grazing land will be more productive and cost well in the market
resulting in boost in output (production). It is expected to influence livestock income
positively.

44
� Livestock Disease (LS_DIS): It is dummy variable taking “0” for livestock disease risk
and “1”, otherwise. It is defined as the occurrence of any form of livestock diseases during
the production year preceding the survey. Livestock diseases are the likely causes of
animals’ death. It is hypothesized that occurrence of livestock disease outbreak has a
negative impact on the annual livestock income.
� Livestock Breed Type (LS_BRT): It is measured as a dummy variable, “1” representing
for the respondents adopting improved livestock breed types and “0”, otherwise. Breed
type here refers to the adoption of improved livestock breed types by the households.
Improved breeds are more productive and bringing additional incomes to the household.
On the other hand, from years of adaptation, the existing breed type may be tolerant to the
harsh environment and some endemic diseases than the cross breeds. It is unlikely to make
priori assumption whether the effect of livestock breed type on livestock income is positive
or negative.
� Access to Livestock Market (ACC_LSM): It refers to the availability of livestock market
center in the vicinity area to the livestock owners. It is a dummy variable where “1”
represents for access to livestock market and “0” otherwise. Generally, those respondents
with least walking hours to market are advantageous as they are more likely to cover
production and marketing costs. Access to livestock market is expected to influence
livestock income positively.
� Livestock Management Practice (MGT_LS): It is measured as a dummy variable, “1”
representing for the respondents adopting modern management practices in their livestock
production systems and “0”, otherwise. It refers to carrying out of all activities in livestock
production tradition in a way so as to receive maximum possible output. Improved/modern
livestock management practice is likely to boost production. It is hypothesized that
pastoralists’ involvement in modern management practice has a positive impact on
livestock income.
45
� Access to extension services (ACC_EXT): It is a dummy variable taking a value of “1” if
the pastoral household has access to extension service and “0” otherwise. The provision of
extension services to the pastoralists directly affects their knowledge, productivity and
income; mainly because they have a tendency of using production technologies and learn to
practice modern production techniques and are prone to change. It is expected to influence
livestock income positively.

46
Table 3.4: Summary of definitions and measurements of variables used in the model
Variables Definitions Units of
Measurement
Expected
signs
AGE_H Age of the household head Number of
Years
EDU_H Educational status of household head Discrete +
FAM_SIZ Family size Number +
TLSH_TLU Total livestock holding TLU +
LS_MOB Livestock mobility Dummy +
PRD_RISK Risk of predators Dummy _
DR_RISK Drought Dummy _
PR_LS Price of livestock in the market Dummy +
MOR_LS Livestock mortality Dummy _
CRDT_AC Access to credit Dummy +
VET_AC Access to veterinary service Dummy +
PPT_MKT Market participation Dummy +
CON_RE Conflict Dummy _
LH_STGY Choice of Livelihood strategy Dummy
EMPT_WAGE Wage employment Dummy
AV_GL Availability of grazing land Dummy +
LS_DIS Livestock disease Dummy _
LS_BRT Livestock breed type Dummy +
ACC_LSM Access to livestock market Dummy +
MGT_LS Livestock management practice Dummy +
ACC_EXT Access to extension service Dummy +
47
CHAPTER IV
RESULTS AND DISCUSSIONS
This part consists of the overall findings of the study presented under different sections. The first
section presents the results of descriptive statistics followed by econometric analysis results of the
study. The descriptive analyses are done to describe the socio-economic characteristics of sample
livestock owners. The econometric analysis delivers factors that affect livestock owners’
(Pastoralists) annual livestock income.
4.1. Descriptive Statistics Results
This section presents the findings from descriptive statistical analysis. The description is made
using percentages, mean, minimum as well as maximum values and standard deviations. In
addition, mean difference for continuous variables and frequencies of discrete variables are tested
using T-test and chi-square test, respectively.
4.1.1. Income Derived from Livestock by the Respondents
The process of collecting information on the herders’ income is complicated for several reasons. It
needs relying on the memory of the respondents, resulting in some degree of error during
reporting; and the respondents most often underestimated their cash income, thinking about the
relief aid they receive. With regard to this, Woldetensae agrees that these are typical problems
faced by researchers working among the pastoral groups on their income in East Africa
(Woldetensae, 2002). Usually herders receive cash income from sale of animals and animal
products (milk and milk products, hides and skins). However, respondents may not sell animals or
animal products for the whole season before the survey which may result in zero livestock income
for some respondents. Therefore in this particular study, livestock products used for home
consumption (milk and meat) are valuated to ETHB and included in the livestock income data
other than the cash income received from sale of animals and animal products.
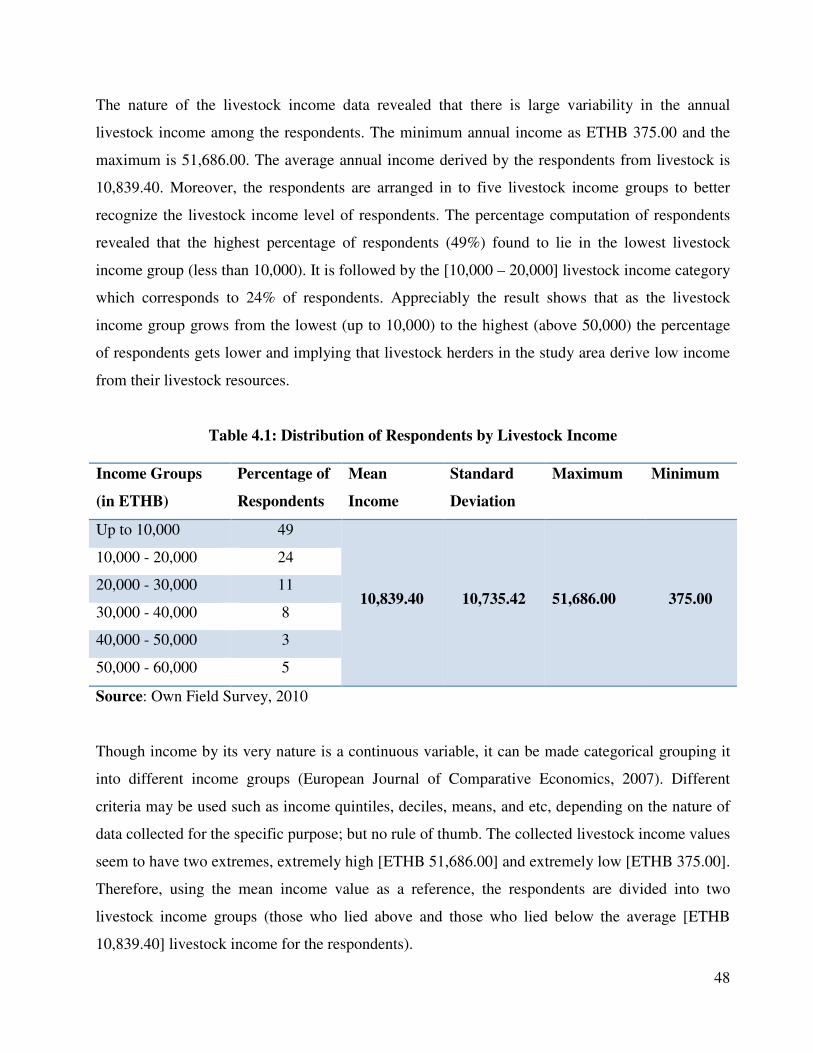
48
The nature of the livestock income data revealed that there is large variability in the annual
livestock income among the respondents. The minimum annual income as ETHB 375.00 and the
maximum is 51,686.00. The average annual income derived by the respondents from livestock is
10,839.40. Moreover, the respondents are arranged in to five livestock income groups to better
recognize the livestock income level of respondents. The percentage computation of respondents
revealed that the highest percentage of respondents (49%) found to lie in the lowest livestock
income group (less than 10,000). It is followed by the [10,000 – 20,000] livestock income category
which corresponds to 24% of respondents. Appreciably the result shows that as the livestock
income group grows from the lowest (up to 10,000) to the highest (above 50,000) the percentage
of respondents gets lower and implying that livestock herders in the study area derive low income
from their livestock resources.
Table 4.1: Distribution of Respondents by Livestock Income
Income Groups
(in ETHB)
Percentage of
Respondents
Mean
Income
Standard
Deviation
Maximum Minimum
Up to 10,000 49
10,839.40 10,735.42 51,686.00 375.00
10,000 - 20,000 24
20,000 - 30,000 11
30,000 - 40,000 8
40,000 - 50,000 3
50,000 - 60,000 5
Source: Own Field Survey, 2010
Though income by its very nature is a continuous variable, it can be made categorical grouping it
into different income groups (European Journal of Comparative Economics, 2007). Different
criteria may be used such as income quintiles, deciles, means, and etc, depending on the nature of
data collected for the specific purpose; but no rule of thumb. The collected livestock income values
seem to have two extremes, extremely high [ETHB 51,686.00] and extremely low [ETHB 375.00].
Therefore, using the mean income value as a reference, the respondents are divided into two
livestock income groups (those who lied above and those who lied below the average [ETHB
10,839.40] livestock income for the respondents).

49
As per the survey results, large numbers of sampled pastoralist households in the study area found
to earn annual livestock income below average [ETHB 10,839.40] livestock income; this
corresponds 66 per cent of the respondents in the study area. From this it can be concluded that
majority of livestock owners receive low income [below ETHB 10,839.40] from their livestock
resources, which is attributed to many social, economic and cultural factors. These factors are well
identified, analyzed and dealt with in the preceding sessions of the discussion.
Figure 4.1: Distributions of respondents by livestock income categories
Above MLSI
34%34%34%34%
Below MLSI 66%66%66%66%
Source: Own Field Survey, 2010
4.1.2. Sources of Income for Households
Household income may come from different sources. According to the Canberra Group Report
(2001), total household income is an aggregate which is composed of income from employment,
rentals, transfers, livestock, crop, remittance. In this research, four major sources of household
income are identified in the study area; livestock, wage employment, crop and rentals. The result
of descriptive analysis shows that majority of pastoralists’ household income in the study area is

50
from livestock. Almost all (98%) of the respondents use livestock as a source of household
income. 61 per cent of the respondents depend on income from employment in combination with
income from livestock. Whereas, 22% of the respondents found to use crops, 7% use land rent and
6% use other sources like remittances and petty trade (mainly charcoal make and trade) as a source
of household income to support the livestock income. The shares of each sources of household
income are computed. Accordingly, livestock income contributes 73.30% of the total household
income in the study area followed by employment (18.09%) and crops cultivation (5.28%).
Table 4.2: Distribution of Respondents by Household income Sources
Sources of
Income
Mean
Income
Per cent of
Households
Maximum Minimum Share
in per cent
Livestock 10,839.40 98 51,686.00 375.00 73.30
Employment 2,676.40 61 10,800.00 - 18.09
Crop 781.00 22 10,000.00 - 5.28
Rentals 475.20 7 10,720.00 - 3.21
Others* 19.36 6 1,636.00 - 0.13
Source: Own Field survey, 2010
*Note: Include petty trade, remittances
4.1.3. Demographic and Socio-economic Profiles of Respondents
4.1.3.1. Age:
The average age of the sampled pastoralists’ household head is computed to be 40.60 years, with
11.9, 20 and 80 years standard deviation, minimum and maximum ages, respectively.
As described in the previous section, the respondents are grouped in to above and below mean
livestock income groups, those who receive annual livestock income (in ETHB) above the average
annual livestock income of [ETHB 10,839.40] and those who receive below average livestock
income groups. Accordingly, the average age is computable for the two livestock income groups as
42.06 and 37.76 years for below and above average income groups, respectively. The descriptive
statistics result implies that as the age of the household head increases the income derived from the
livestock declines. The independent samples t-test revealed that there is highly significant

51
relationship between livestock income and age of the household head at less than 1% level of
significance.
Table 4.3: Age distribution of respondents by livestock income group
Variable Below Mean LSI
[10,839.40]
N = 66
Above Mean LSI
[10,839.40]
N = 34
t-value Total
N = 100
Mean Age 42.06 37.76
- 10.077*
40.60
Standard Deviation 11.86 11.72 11.93
Maximum 80 61 80.00
Minimum 20 20 20.00
Source: Own Survey data, 2010
* Significant at 1% level of significance
* *Significant at 5% level of significance
* **Significant at 10% level of significance
However, mean, maximum and minimum age values do not help to tell which age group is
correlated to what level of livestock income, but to make statistical inference. Therefore, to more
expressively see the relationship between livestock income and age of respondents; dividing
respondents into age groups (age between 21 and 30, between 31 and 40, between 41 and 50,
between 51 and 60 and above 60) is worthwhile. Accordingly, it is observed that 44.44 per cent of
the respondents who lied in the age group of between 20 and 30 found to assume annual livestock
income of above mean livestock income [ETHB 10,839.40]. Whereas per cents of respondents
assuming annual livestock income of above mean livestock income in the age groups between 31
and 40, 41 and 50, 51 and 60 and above 60 are 41.67, 9.09, 33.33 and 33.33 per cent, respectively;
implying that as age increases per cent of respondents in the above livestock income group
decreases. Moreover, 27 respondents [about 80% of above MLSI groups] found to lie in the age
groups of 20-40; against only 7 respondents [about 20% of above MLSI groups] lied in age groups
of 41 and above.

52
Table 4.4: Age distribution of respondents
Age group No. of
Respondents
Per cent of
Respondents
Cumulative Per cent
20-30 27 27.0 27.0
31-40 36 36.0 63.0
41-50 22 22.0 85.0
51-60 12 12.0 97.0
>60 3 3.0 100.0
Total 100 100.0
Source: Own Field survey, 2010
Figure 4.2: Distribution of respondents by age group and livestock income group
0
5
10
15
20
25
20-30 31-40 41-50 51-60 >60
Pe
rce
nt
of
Re
spo
nd
en
ts
Age Group of Respondents
Above MLSI
Below MLSI
Source: Own Field survey, 2010
4.1.3.2. Family size:
As can be seen from table 4.5 below, the average family size of the sampled households in the
study area is 7.00 persons, with 2 and 16 being the minimum and the maximum family size,
respectively. The standard deviation is computed to be 2.81. Family size is analyzed for the above

53
and below mean annual livestock income [ETHB 10,839.40] categories of the respondents with
average family sizes of 6.95 and 7.01 persons for below and above mean livestock incomes,
respectively. The independent samples t-test shows that statistically there is significant relationship
between livestock income level and number of persons in the household at less than 10% level of
significance. The result shows that as the number of persons in the household increases the income
that the household derives from the livestock slightly increases. This can be justifiable as the
income increment is as a result of more labour input contributed from more number of family
members; as livestock income is a function of labour force.
Table 4.5: Family Size distribution of respondents
Variable Below Mean LSI
[10,839.40]
N = 66
Above Mean LSI
[10,839.40]
N = 34
t-value Total
N = 100
Mean family size 6.95 7.01
10.094***
7.00
Standard Deviation 2.57 3.29 2.81
Maximum - - 16
Minimum - - 2
Source: Own Field survey, 2010
* Significant at 1% level of significance
* *Significant at 5% level of significance
* **Significant at 10% level of significance
4.1.3.3. Level of Education, Health and Marital Status:
The survey result shows that from the total of sampled pastoralist household heads, 92 percent
were illiterate, 1% can read and write, 3% had primary education and the remaining 4% had
attended above primary education. To see if level of education has impact on the income that the
pastoral household earns from the livestock, computing and comparing level of education for the
two livestock income categories (above and below ETHB 10,839.40) is worthwhile. The
computation reveals that from above mean livestock income category, 94.1% are illiterate, 5.9%
attended primary cycle education and none attended above primary cycle education. However,
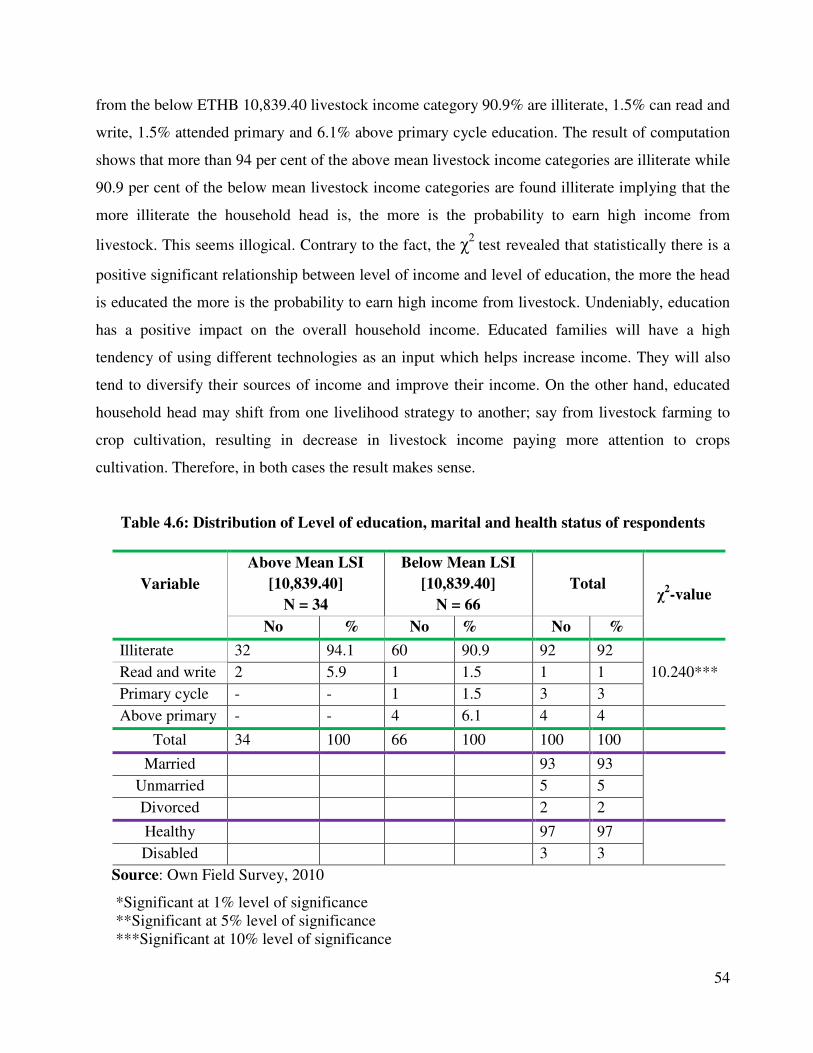
54
from the below ETHB 10,839.40 livestock income category 90.9% are illiterate, 1.5% can read and
write, 1.5% attended primary and 6.1% above primary cycle education. The result of computation
shows that more than 94 per cent of the above mean livestock income categories are illiterate while
90.9 per cent of the below mean livestock income categories are found illiterate implying that the
more illiterate the household head is, the more is the probability to earn high income from
livestock. This seems illogical. Contrary to the fact, the χ2
test revealed that statistically there is a
positive significant relationship between level of income and level of education, the more the head
is educated the more is the probability to earn high income from livestock. Undeniably, education
has a positive impact on the overall household income. Educated families will have a high
tendency of using different technologies as an input which helps increase income. They will also
tend to diversify their sources of income and improve their income. On the other hand, educated
household head may shift from one livelihood strategy to another; say from livestock farming to
crop cultivation, resulting in decrease in livestock income paying more attention to crops
cultivation. Therefore, in both cases the result makes sense.
Table 4.6: Distribution of Level of education, marital and health status of respondents
Variable
Above Mean LSI
[10,839.40]
N = 34
Below Mean LSI
[10,839.40]
N = 66
Total χ
2-value
No % No % No %
Illiterate 32 94.1 60 90.9 92 92
10.240*** Read and write 2 5.9 1 1.5 1 1
Primary cycle - - 1 1.5 3 3
Above primary - - 4 6.1 4 4
Total 34 100 66 100 100 100
Married 93 93
Unmarried 5 5
Divorced 2 2
Healthy 97 97
Disabled 3 3
Source: Own Field Survey, 2010
*Significant at 1% level of significance
**Significant at 5% level of significance
***Significant at 10% level of significance

55
With regard to marital status, most of the sampled pastoral respondents (93.0%) are married. 5%
were not yet married (single) and the remaining 2% are divorced.
As far as the health status of the sampled respondents is concerned, almost all (97%) are found
physically healthy and fit to the existing situation. Though health status has impact on the income
level of the household, with the exiting analysis result it is unlikely to see the effect of the health
condition of respondents on their livestock income. In the same manner, all (100%) the
respondents are male and here sex, just like health status could not be taken as factor affecting
income, even though it has effect on income.
4.1.3.4. Total Livestock Holding
Total herd size is measured in a standard unit called Tropical Livestock Unit (TLU), where 1 TLU
is equivalent to 250kg of livestock. In this study, total size of cattle, shoat and camel were
computed into TLU using factors 0.7, 0.1 and 1.25, respectively, (International Livestock Centre
for Africa, 1990).
It is observed from the analysis that the average TLU that the sampled respondents in the study
area have is 15.57. The standard deviation is 17.82. The value of standard deviation clearly implied
that there is a large variation in the herd size of the sampled respondents, in turn, implying that
there is high wealth difference and income inequalities, as income is a function of total TLU in
pastoral areas. In pastoral areas total TLU holding is used as a measure of wealth and used to
indicate income level. However, measuring income inequality and wealth difference is not the
objective of this research.
Average TLU is also computed for the two livestock income categories which help to see if there
is any significant relationship between the two income categories and TLU. Accordingly, the
mean, maximum and minimum TLU of the respondents who earn above mean annual livestock
income are computed as 30.60, 108 and 7, respectively; whereas for those who earn below mean
annual livestock income categories are 7.82, 21.9 and 0, respectively. The standard deviations for
the high and low livestock income groups are 23.42 and 5.10, respectively. From the result it can
be concluded that the higher TLU the household owns, the higher will be the livestock income.
The t-test statistic also revealed that significantly there is a high significant relationship between
the two group means and livestock income.
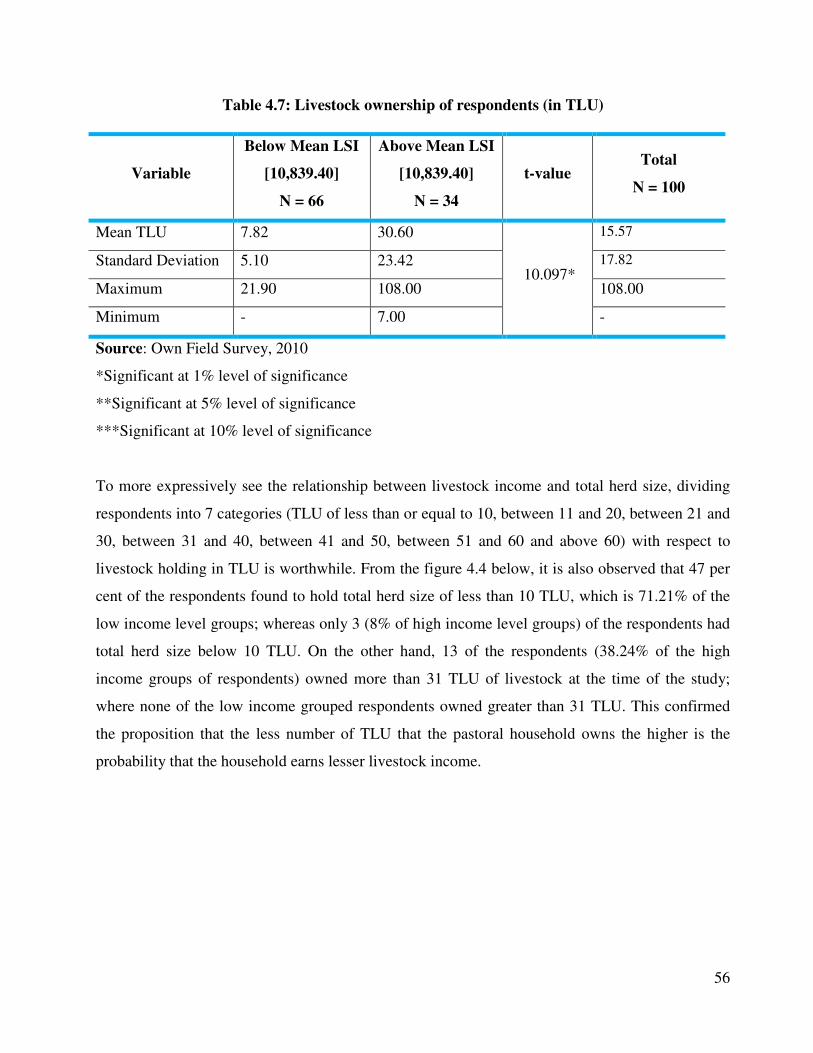
56
Table 4.7: Livestock ownership of respondents (in TLU)
Variable
Below Mean LSI
[10,839.40]
N = 66
Above Mean LSI
[10,839.40]
N = 34
t-value Total
N = 100
Mean TLU 7.82 30.60
10.097*
15.57
Standard Deviation 5.10 23.42 17.82
Maximum 21.90 108.00 108.00
Minimum - 7.00 -
Source: Own Field Survey, 2010
*Significant at 1% level of significance
**Significant at 5% level of significance
***Significant at 10% level of significance
To more expressively see the relationship between livestock income and total herd size, dividing
respondents into 7 categories (TLU of less than or equal to 10, between 11 and 20, between 21 and
30, between 31 and 40, between 41 and 50, between 51 and 60 and above 60) with respect to
livestock holding in TLU is worthwhile. From the figure 4.4 below, it is also observed that 47 per
cent of the respondents found to hold total herd size of less than 10 TLU, which is 71.21% of the
low income level groups; whereas only 3 (8% of high income level groups) of the respondents had
total herd size below 10 TLU. On the other hand, 13 of the respondents (38.24% of the high
income groups of respondents) owned more than 31 TLU of livestock at the time of the study;
where none of the low income grouped respondents owned greater than 31 TLU. This confirmed
the proposition that the less number of TLU that the pastoral household owns the higher is the
probability that the household earns lesser livestock income.
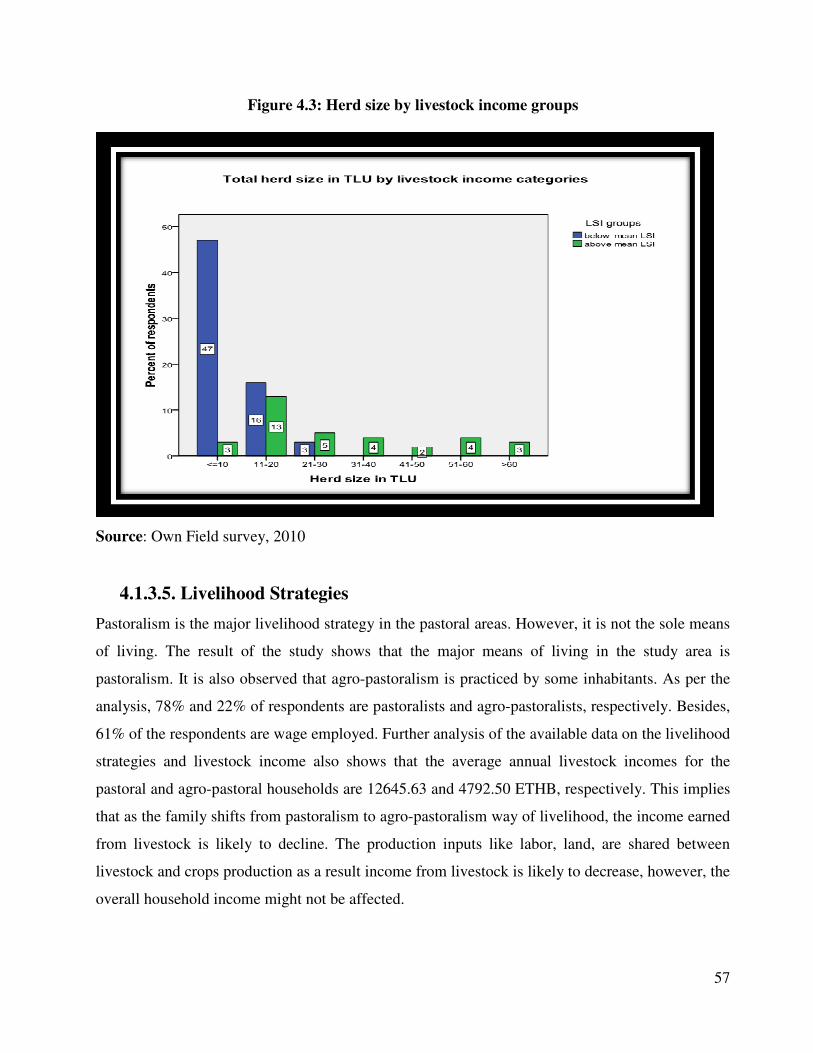
57
Figure 4.3: Herd size by livestock income groups
Source: Own Field survey, 2010
4.1.3.5. Livelihood Strategies
Pastoralism is the major livelihood strategy in the pastoral areas. However, it is not the sole means
of living. The result of the study shows that the major means of living in the study area is
pastoralism. It is also observed that agro-pastoralism is practiced by some inhabitants. As per the
analysis, 78% and 22% of respondents are pastoralists and agro-pastoralists, respectively. Besides,
61% of the respondents are wage employed. Further analysis of the available data on the livelihood
strategies and livestock income also shows that the average annual livestock incomes for the
pastoral and agro-pastoral households are 12645.63 and 4792.50 ETHB, respectively. This implies
that as the family shifts from pastoralism to agro-pastoralism way of livelihood, the income earned
from livestock is likely to decline. The production inputs like labor, land, are shared between
livestock and crops production as a result income from livestock is likely to decrease, however, the
overall household income might not be affected.

58
Whether the household head is wage employed or not is also observed to affect the level of income
that the family gets from the livestock. The study shows that the mean annual livestock income for
wage employed and unemployed head of the family are computed as 9,882.10 and 12,336.69,
respectively. Obviously, the wage employed household head shares the labor force and attention,
thereby getting lower income from livestock. The t-test values also show that statistically there is
high relationship among livestock income and choices of livelihoods at less than 1% level of
significance.
Figure 4.4: Livelihood choices of respondents
Agropastoral
22%Pastoral
78%
Source: Own Field survey, 2010

59
Table 4.8: Level of livestock income by livelihood strategies and wage employment
Variable Pastoral
N = 78
Agro-pastoral
N = 22 t-value
Total
N = 100
Mean annual LSI 12645.63 4792.50 -10.097*
10839.40
Standard Deviation 11351.52 4881.80 10735.40
Variable Head-employed
N = 61
Unemployed
N = 39 t-value
Total
N = 100
Mean annual LSI 9882.10 12336.69 -10.097*
10839.40
Standard Deviation 9772.10 12070.72 10735.40
Source: Own Field Survey, 2010
* Significant at 1% level of significance
* *Significant at 5% level of significance
* **Significant at 10% level of significance
4.1.3.6. Occupation
The survey data reveal that the respondents are observed to involve in different occupations to
make their living. Accordingly, five categories of occupations are identified. These include
pastoral (solely livestock farming), agro-pastoral (combination of livestock and crop farming),
livestock farming and employment, agro-pastoral and employment (livestock farming, crops
farming, and employment) and others (combinations of pastoral and agro-pastoral with trade).
Based on the result of the descriptive analysis, more than half (54%) of the respondents are
involved in livestock rearing and wage employment; followed by agro-pastoralism (22%). This
implies that in the study area the inhabitants are observed to support the traditional way of
livestock farming by other ways of living mainly wage employment and crops farming.
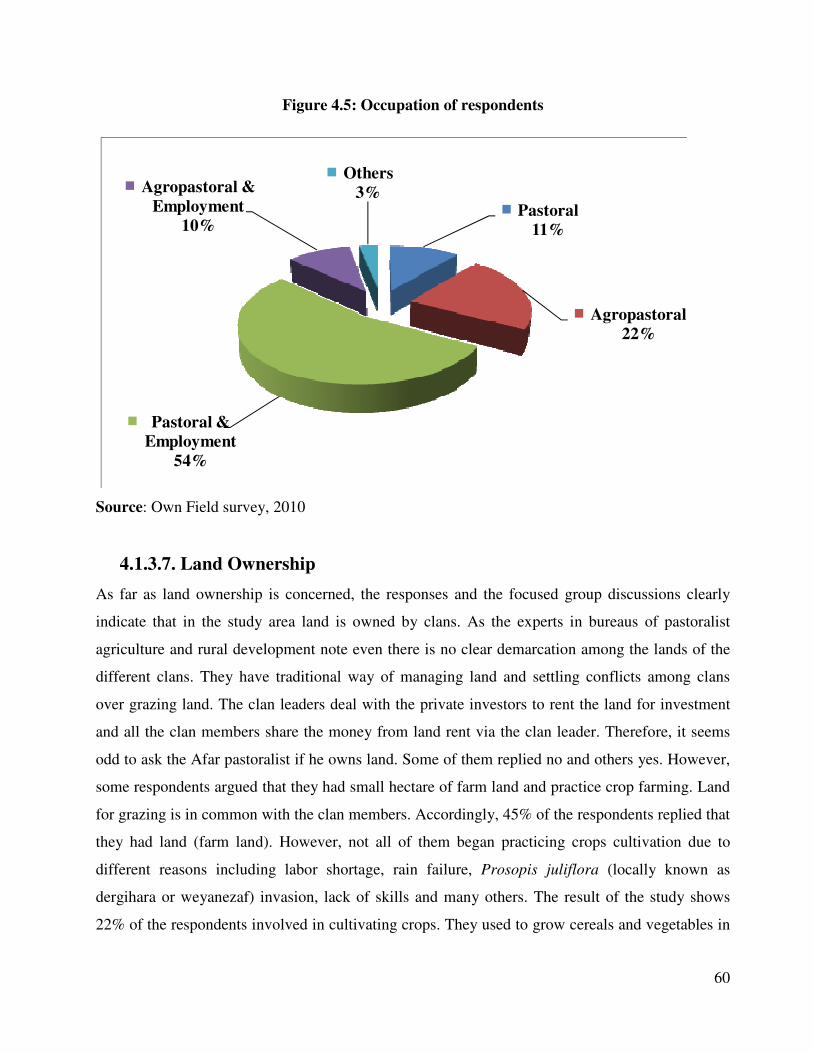
60
Figure 4.5: Occupation of respondents
Pastoral
11%
Agropastoral
22%
Pastoral &
Employment
54%
Agropastoral &
Employment
10%
Others
3%
Source: Own Field survey, 2010
4.1.3.7. Land Ownership
As far as land ownership is concerned, the responses and the focused group discussions clearly
indicate that in the study area land is owned by clans. As the experts in bureaus of pastoralist
agriculture and rural development note even there is no clear demarcation among the lands of the
different clans. They have traditional way of managing land and settling conflicts among clans
over grazing land. The clan leaders deal with the private investors to rent the land for investment
and all the clan members share the money from land rent via the clan leader. Therefore, it seems
odd to ask the Afar pastoralist if he owns land. Some of them replied no and others yes. However,
some respondents argued that they had small hectare of farm land and practice crop farming. Land
for grazing is in common with the clan members. Accordingly, 45% of the respondents replied that
they had land (farm land). However, not all of them began practicing crops cultivation due to
different reasons including labor shortage, rain failure, Prosopis juliflora (locally known as
dergihara or weyanezaf) invasion, lack of skills and many others. The result of the study shows
22% of the respondents involved in cultivating crops. They used to grow cereals and vegetables in

61
small scales. Few also grow cash crops like sisal and cotton. They involved in growing crops
mainly for home consumption.
The land tenure system was described as communal. Land in the study area is rented to investors
communally via the respective clans. The survey data analysis result shows that only 7% of the
respondents are found receiving income from land rentals. The average number of hectare of land
they owned is 3.67. The standard deviation is 11.93. Moreover, with regard to land ownership and
tenure system, the results of the focused group discussions with the rural development experts of
the woredas show that land is not privately owned, it is in the hands of clans. Clan leaders used to
rent the land to investors and divide the collected sum to the clan members based on their tradition.
The wereda finance office collects tax from the investors. In addition the investors pay 30% to the
clans. The pastoralists do not pay land tax.
4.1.3.8. Market Participation
Market participation is perceived as one of the major factors determining level of livestock
income. For pastoralists market participation is crucial to improve their household income
basically from livestock. In this study market participation refers only to selling livestock and
livestock products. Based on the results of the study 78% of the sampled respondents involved in
selling (sold) livestock in the market for the past 12 months (the year before the survey) for
different purposes. The respondents replied that they mainly sold livestock to get cash income to
purchase food grains, clothing for the family, and expenses for children’s education and health
care. When mean annual livestock income is computed for those who involved in selling livestock
and for those who did not involve, the results point out that participation of pastoralists in the
market has direct relation with their livestock income.
Accordingly, the average annual livestock income for the participant and non-participant groups
are ETHB 12,018.94 and 6,657.39, respectively. Moreover, the t-test values reveals that
statistically there is highly significant relationship between market participation and livestock
income.

62
Figure 4.6: Market participation of respondents
Source: Own Field survey, 2010
With regard to participation in selling livestock products, the study shows that majority (84%) of
the sampled respondents did not involve in selling products due to different reasons. Only 16% of
the sampled respondents received income from selling livestock products (mainly milk). The
underlining reasons for not selling livestock products in the market as the respondents responded
include short of milk production, i.e., what they produced did not go beyond home consumption,
and cultural reasons (in the Afar tradition milk- specially camel milk)- is not sold, even in times of
surplus production. Hides and skin are used to make home materials such as sleeping sheet, pillow,
luggage, vessels; but not sold in the market; therefore, not included in livestock income calculation
in this study.

63
Table 4.9: Livestock income distribution among market participants and non-participants
Variable Participants
N = 78
Non-participants
N = 22
t-value Total
N = 100
Mean LS Income 12018.94 6657.39
10.096*
10839.40
Standard Deviation 11183.51 7825.25 10735.40
Maximum - - 51,686.00
Minimum - - 375.00
Source: Own Field survey, 2010
* significant at less than 1% level of significance
** significant at less than 5% level of significance
*** significant at less than 10% level of significance
As to the time of selling livestock, majority of (77.3%) the sampled pastoralists sold their animals
not by their preference of time of selling but forced by different forces mainly cash shortage to
purchase food grains and drought (animal feed shortage). Therefore, a good number of respondents
replied that they sold livestock in times in the year when they need cash income to cover home
food consumption expenditure. The remaining 22.8% of the respondents sold livestock at their best
preference; they prefer to sell at the end of rainy seasons. According to their reply they prefer this
time because as there is availability of good pasture animals will have good price in the market.
Moreover, supply in the market is short due to grazing pasture availability. Among the participants
of selling livestock 79.7% sold their animals at village (small daily) markets, 19% at neighboring
wereda markets (large weekly markets) and 1.3% sold on the farm. They used the wereda markets
to sell mainly large ruminants while small ruminants are sold mainly at the village markets.
Accordingly, 96.6% of the respondents sold their livestock to traders, 2.5% to cooperatives and
1.3% to abattoirs.
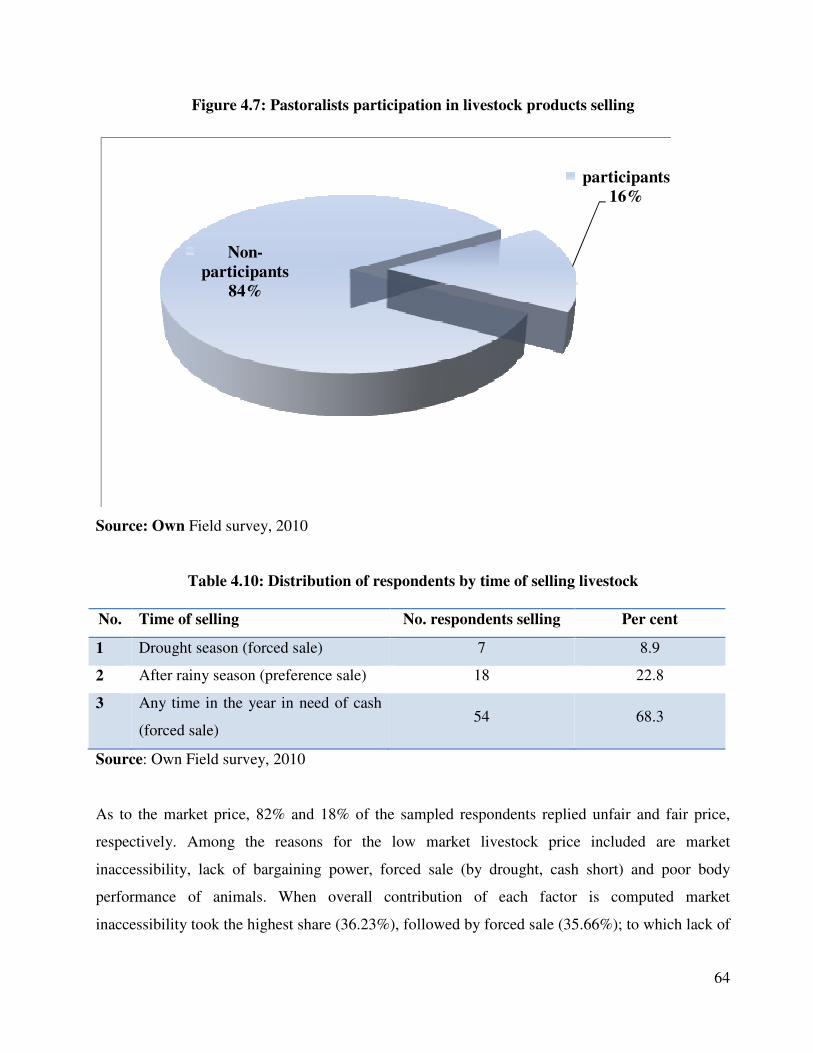
64
Figure 4.7: Pastoralists participation in livestock products selling
participants
16%
Non-
participants
84%
Source: Own Field survey, 2010
Table 4.10: Distribution of respondents by time of selling livestock
No. Time of selling No. respondents selling Per cent
1 Drought season (forced sale) 7 8.9
2 After rainy season (preference sale) 18 22.8
3 Any time in the year in need of cash
(forced sale) 54 68.3
Source: Own Field survey, 2010
As to the market price, 82% and 18% of the sampled respondents replied unfair and fair price,
respectively. Among the reasons for the low market livestock price included are market
inaccessibility, lack of bargaining power, forced sale (by drought, cash short) and poor body
performance of animals. When overall contribution of each factor is computed market
inaccessibility took the highest share (36.23%), followed by forced sale (35.66%); to which lack of

65
bargaining power (19.58%) and poor body performance of animals (8.54%) are precedent.
Therefore, much has to be done on market infrastructure for household income improvement.
Table 4.11: Reasons for low price of livestock in the market
Reasons for low price Responses Relative per cent
Yes No
No market access 76.8% 23.2% 36.23
No bargaining power 41.5% 58.5% 19.58
Poor body performance 18.1% 81.9% 8.54
Forced sale 75.6% 24.4% 35.66
Source: Own Field survey, 2010
4.1.3.9. Access to Different Services
It was hypothesized that analyzing respondents’ access to services such as livestock markets;
veterinary services, credit etc. would indicate some factors affecting livestock income. Therefore,
the respondents’ access to different services that have direct or indirect impacts on the wellbeing of
the sampled pastoralists had been analyzed.
The survey data show that among the sampled respondents only 34% have access to livestock
market near to their residents. The rest 66% cross other adjacent woredas or even regions (korenti
market in Amhara and metehara market in Oromia) to get market for selling large animals (cattle
and camels), which is costly in terms of time and labor. They used to travel long distances; on the
way losing animals through hunger, theft by the competing Issa clan. Finally, the remaining
animals reach at market losing weight and prices adversely going down. However, sheep and goats
are sold at the small daily village markets losing the advantages of multiple buyers and thereby
lacking bargaining powers. In all cases they are disadvantaged.
With regard to market information and extension services, 18% have access to extension services
and almost all (97%) receive information about the price prior to sale. However, the information
source is not the formal one; it is local information exchange system (locally called dagu). 81.4%
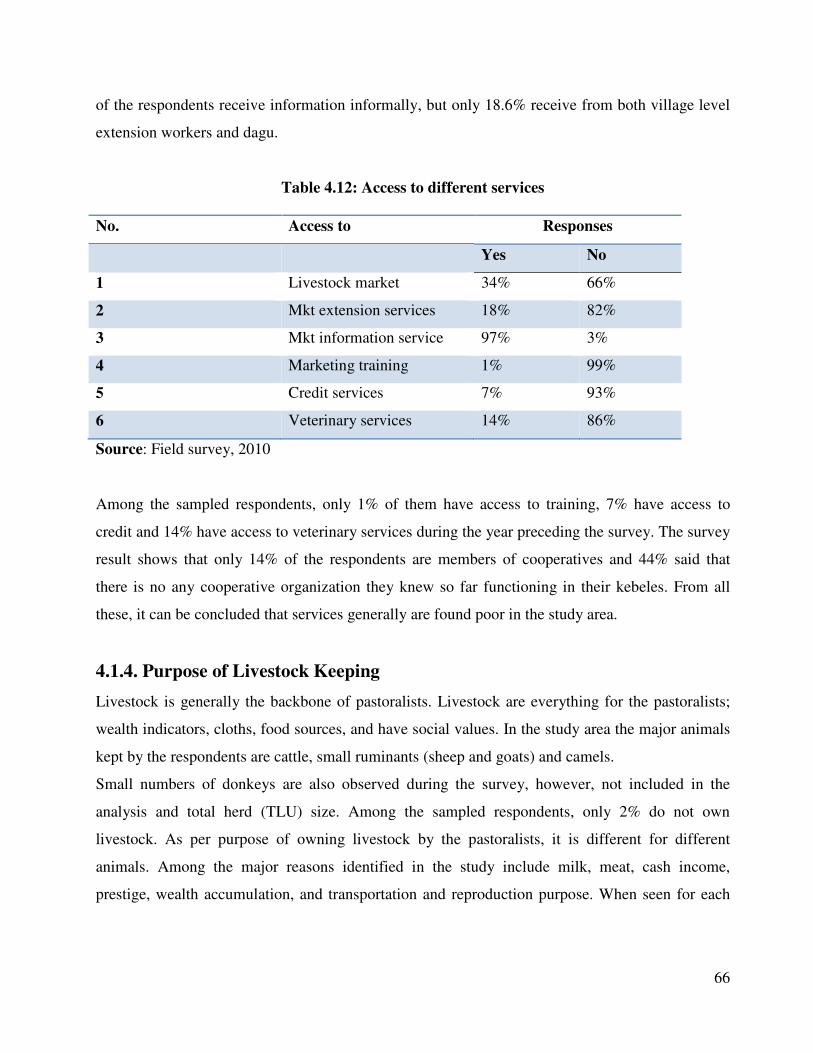
66
of the respondents receive information informally, but only 18.6% receive from both village level
extension workers and dagu.
Table 4.12: Access to different services
No. Access to Responses
Yes No
1 Livestock market 34% 66%
2 Mkt extension services 18% 82%
3 Mkt information service 97% 3%
4 Marketing training 1% 99%
5 Credit services 7% 93%
6 Veterinary services 14% 86%
Source: Field survey, 2010
Among the sampled respondents, only 1% of them have access to training, 7% have access to
credit and 14% have access to veterinary services during the year preceding the survey. The survey
result shows that only 14% of the respondents are members of cooperatives and 44% said that
there is no any cooperative organization they knew so far functioning in their kebeles. From all
these, it can be concluded that services generally are found poor in the study area.
4.1.4. Purpose of Livestock Keeping
Livestock is generally the backbone of pastoralists. Livestock are everything for the pastoralists;
wealth indicators, cloths, food sources, and have social values. In the study area the major animals
kept by the respondents are cattle, small ruminants (sheep and goats) and camels.
Small numbers of donkeys are also observed during the survey, however, not included in the
analysis and total herd (TLU) size. Among the sampled respondents, only 2% do not own
livestock. As per purpose of owning livestock by the pastoralists, it is different for different
animals. Among the major reasons identified in the study include milk, meat, cash income,
prestige, wealth accumulation, and transportation and reproduction purpose. When seen for each

67
types of livestock (for this study the purposes of milking cows, oxen, sheep, goats and camels were
regarded), the result of the analysis is depicted as follows in the table.
Table 4.13: Type and TLU of Livestock
Type and TLU of Livestock
Variables Cows Oxen Sheep Goats Camels
No. respondents
owning livestock
90 23 54 85 49
Mean TLU 3.61 0.51 0.61 1.38 5.12
Standard deviation 3.40 1.63 0.84 1.23 10.74
Minimum TLU 0.00 0.00 0.00 0.00 0.00
Maximum TLU 21.00 14.00 3.00 5.90 75.00
Source: Own Field survey, 2010
Accordingly, numbers of sampled respondents owning cows, oxen, sheep, goats and camels are 90,
23, 54, 85 and 49, respectively. The major purposes for which cows are reared by the sampled
livestock owners were reported as milk (44.56%), cash income earning from sale of live cows
(28.21%) and meat (27.23%), in the order of importance. For oxen the purpose is reproduction
(43.49%), cash income earning (30.14%) and wealth accumulation or prestige (26.37%); for sheep,
cash incomes earning (54.18%) and meat (45.82%); for goats, cash earning (35.27%), milk
(34.44%) and meat (30.29%); whereas for camels the purpose is transportation (39.19%), milk
(38.41%) and wealth accumulation or prestige (23.40%), all in the orders of importance.
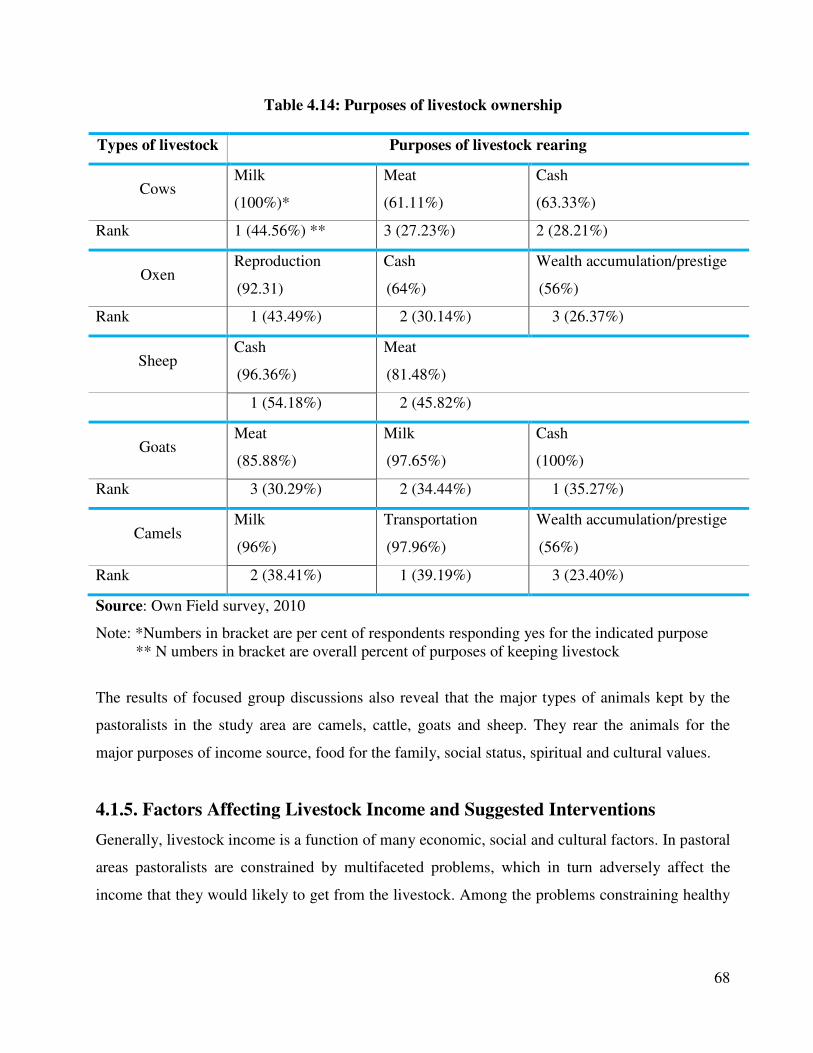
68
Table 4.14: Purposes of livestock ownership
Types of livestock Purposes of livestock rearing
Cows Milk
(100%)*
Meat
(61.11%)
Cash
(63.33%)
Rank 1 (44.56%) ** 3 (27.23%) 2 (28.21%)
Oxen Reproduction
(92.31)
Cash
(64%)
Wealth accumulation/prestige
(56%)
Rank 1 (43.49%) 2 (30.14%) 3 (26.37%)
Sheep Cash
(96.36%)
Meat
(81.48%)
1 (54.18%) 2 (45.82%)
Goats Meat
(85.88%)
Milk
(97.65%)
Cash
(100%)
Rank 3 (30.29%) 2 (34.44%) 1 (35.27%)
Camels Milk
(96%)
Transportation
(97.96%)
Wealth accumulation/prestige
(56%)
Rank 2 (38.41%) 1 (39.19%) 3 (23.40%)
Source: Own Field survey, 2010
Note: *Numbers in bracket are per cent of respondents responding yes for the indicated purpose
** N umbers in bracket are overall percent of purposes of keeping livestock
The results of focused group discussions also reveal that the major types of animals kept by the
pastoralists in the study area are camels, cattle, goats and sheep. They rear the animals for the
major purposes of income source, food for the family, social status, spiritual and cultural values.
4.1.5. Factors Affecting Livestock Income and Suggested Interventions
Generally, livestock income is a function of many economic, social and cultural factors. In pastoral
areas pastoralists are constrained by multifaceted problems, which in turn adversely affect the
income that they would likely to get from the livestock. Among the problems constraining healthy
69
livestock production system, according to the focused group discussion results are summarized as
follows:
a) Practicing traditional and backward system of livestock production
b) Grazing land degradation – poor management, unwise use of grazing resource, Prosopis
juliflora (locally known as dergihara or weyanezaf) invasion, private crop farms expansion
c) Shortage of water for their animals – trek long ways to get water
d) Drought
e) Animals diseases
f) Breed type – no improvement has been made on the existing breed type
g) Lack of market infrastructure
h) Price fluctuation in the market (highly seasonal) – good price times are holidays and the
few days following the short rainy seasons
i) Lack of market oriented production system – they do it so just for prestige, are not market
minded
From literatures and own experiences, for this study some socio-economic factors were identified
as check list for the pastoralists. The result implies that the major factors are unavailability of
grazing pasture, conflict in the area, recurrent and long lasting drought occurrences, and livestock
disease. The analysis results shows that predators, conflict, poor market infrastructure,
unavailability of grazing pasture, livestock disease, lack of market demand and drought are
computed to be 1st to 7
th major factors determining the livestock income. Referring to the focused
group discussions and the researcher’s personal observation during the survey and his experience
of working with the pastoralists, shortage of grazing pasture is still the major problem in the study
area affecting the income from livestock. The recurrent drought is mentioned foremost for causing
shortage of grazing pasture. The other factor resulting in short of grazing pasture is the invasion of
the grazing land by the invasive species- Prosopis juliflora (locally known as dergihara or
weyanezaf). Literatures revealed that the study woredas are the most invaded areas of the region
(Farm Africa, 2009).

70
Table 4.15: Factors affecting livestock income
Factors affecting livestock
income
Responses Relative per
cent
Rank
Yes (%) No (%)
Breed 19 81 3.48 12
Mortality 22 78 4.03 11
Water 22 78 4.29 10
Management practice 47 53 8.61 9
Mobility 52 48 9.52 8
Drought 55 45 10.07 7
Mkt demand 60 40 10.99 6
Disease 61 39 11.17 5
Grazing 65 35 11.90 4
Infrastructure 66 34 12.09 3
Conflict 68 32 12.45 2
Predators 78 22 14.29 1
Source: Own Field survey, 2010
For the underlying problems constraining livestock production system and there by indirectly
affecting income from livestock, the remedy is in the hands of the government, as the sampled
respondents replied. The sole responsible body to alleviate the problems is the government.
However, the focused group discussions with different experts of the woredas indicated that other
bodies are included besides the government. This include the following
• The community - shall be prone to change, accept innovations
• Government offices at all levels – development agents, experts, policy makers
• Cooperatives (especially livestock marketing cooperatives, livestock products marketing
cooperatives, credits and saving cooperatives)
• Non-governmental organizations
• Investors
• Traders (livestock)

71
For the problems, lists of interventions had been forwarded by the sampled respondents and
focused groups. Accordingly, the remedies or possible interventions to be implemented in the long
and short run included conflict resolution, alternative livestock feed sources, provision of
veterinary services regularly, market infrastructure development, control of the invasive species,
provision of livestock market extension services and promoting sedentary life. The responses of
the sampled respondents towards the indicated interventions are shown in the table below.
Table 4.16: Suggested interventions to improve livestock income
Interventions to improve
livestock income
N Responses Overall per
cent
Ranks
Yes No
Conflict resolution 97 75.6% 24.4% 27.36 1
Alternative livestock feed 96 72.9% 27.1% 26.38 2
Provision of veterinary service 97 64.9% 35.1% 23.49 3
Market infrastructure 97 23.7% 76.3% 8.58 4
Control of invasive species 97 22.7% 77.3% 8.22 5
Market extension services 97 10.3% 89.7% 3.73 6
Promote sedentary life 97 6.2% 93.8% 2.24 7
Source: Own Field survey, 2010
Moreover, the results of the group discussions imply that the possible interventions against
livestock income factors are summarized as follows:
• Awareness, intensive training for pastoralists on modern livestock production systems
• Alternative sources of household income
• Proper land policy formulation and implementation
• Market infrastructure development
• Establishing modern market centres
• Diseases protection mechanism (vaccination)
• Well equipped and facilitated animal health centers
• Trained manpower at all levels and sectors (livestock production, marketing, cooperatives,
veterinary services)

72
4.2. Results from Regression Econometric Model
4.2.1. Determinants of Household Livestock Income
The income of a household generally is determined by wide ranges of factors. The ranges of
factors may vary between the different sources of household income. When speaking to the
determining factors affecting household income from livestock, appreciably different factors can
be observed. In addition to the descriptions given above, the income analysis in this sub-section
was estimated using the linear multiple regression model. The study has tried to address the
objective and give empirical analysis. A multiple linear regression analysis is carried out using
software called Statistical Package for Social Sciences (SPSS) version 15.0. The dependent
variable considered in the analysis is the total (gross) annual household income derived solely
from livestock.
As it is already discussed, Multiple Regression Model (MRM) is selected to identify the
determinants of livestock income in the study area. Before running the model, however, the
independent variables are checked for exhibiting multicollinearity effect using variance inflation
factor (VIF) and Contingency Coefficients (C). Accordingly, for the computed values of VIF, all
by far below 10, all the hypothesized continuous independent variables are included in the model
for estimation of parameters. Similarly contingency coefficients are calculated for the discrete
variables. Contingency coefficient ranges between 0 and 1. The computed values of contingency
coefficients for some discrete independent variables reveal that they are highly correlated and so
multicollinearity effect observed. Therefore, conflict, livestock mortality, drought, access to
veterinary services, choices of livelihood strategy and livestock diseases have been excluded from
the model for exhibiting multicollinearity effect (significant at 1% level of significance).
Consequently, the remaining 15 explanatory variables are used to estimate the model.

73
Table 4.17: Linear multiple regression estimates of determinants of livestock income
Explanatory
variables
Unstandardized
Coefficients
Standardized
Coefficients t Sig.
95% Confidence Interval
for B
Beta
Lower
Bound
Upper
Bound B Std. Error
(CONSTANT) -20311.018 15516.677 -1.309 0.194 -51167.631 10545.596
AV_GL 11767.699 2392.062 0.263 4.919 0.000*** 7010.821 16524.577
LS_MOB 3735.412 2104.622 0.087 1.775 0.080* -449.861 7920.685
PR_LS -52.255 3682.336 -0.001 -0.014 0.989 -7374.983 7270.473
PRD_RISK -5037.958 2614.554 -0.098 -1.927 0.057* -10237.286 161.370
ACC_LSM -2698.350 2402.608 -0.060 -1.123 0.265 -7476.200 2079.499
LS_BRT 4913.851 2707.121 0.090 1.815 0.073* -469.557 10297.258
MGT_LS -566.458 498.259 -0.056 -1.137 0.259 -1557.300 424.384
AGE_H -138.449 94.774 -0.077 -1.461 0.148 -326.917 50.018
EDU_H -1712.920 1641.956 -0.054 -1.043 0.300 -4978.129 1552.289
FAM_SIZ -93.733 392.420 -0.012 -0.239 0.812 -874.103 686.636
EMPT_WAGE -2454.297 2199.594 -0.056 -1.116 0.268 -6828.430 1919.837
TLSH_TLU 880.865 65.625 0.731 13.423 0.000*** 750.363 1011.367
PPT_MKT -4984.663 3318.342 -0.097 -1.502 0.137 -11583.551 1614.224
ACC_EXT 3769.627 3027.798 0.068 1.245 0.217 -2251.481 9790.736
CRDT_AC 9242.286 4292.914 0.110 2.153 0.034** 705.356 17779.217
R2
value 0.824
Adjusted R2
value 0.793
Source: Own Field survey, 2010
* Significant at less than 1% level of significance
** Significant at less than 5% level of significance
*** Significant at less than 10% level of significance

74
Hence, family size, educational status of household head, total livestock holding, age of the
household head, livestock mobility, risk of predators, price of livestock in the market, access to
credit, market participation, employment, availability of grazing land, livestock breed type, access
to livestock market, livestock management practice and access to extension services are the
independent variables assumed to explain the dependent variable using the specified model.
However, it doesn't mean that the variables included are exhaustive.
As indicated in Table 4.16, the coefficient of determination (R2) and the adjusted R
2 values are
0.824 and 0.793, respectively. It means that about 80% of the variation in the dependent variable is
explained by the independent variables, indicating relatively high explanatory power (goodness of
fit) of the model.
The regression analysis result reveals that most of the coefficients of the explanatory variables
included in the model have negative sign. The negative sign of the coefficients indicates that the
explanatory variables influence the dependent variable negatively. However, the level of
significance varies from one independent variable to the other.
Out of these 15 explanatory variables, only 6 variables are found to be significantly affecting
pastoralists’ household livestock income. Those variables which are considered as important
determinants of livestock income as per the analysis result are a) total livestock holding
(TLSH_TLU), b) access to credit (CRDT_AC), c) availability of grazing land (AV_GL), d) risk of
predators (PRD_RISK), e) livestock breed type (LS _BRT) and f) livestock mobility (LS_MOB).
Total livestock holding (TLSH_TLU) and availability of grazing land (AV_GL) are statistically
significant at less than 1 per cent probability level, access to credit (CRDT_AC) is statistically
significant at less than 5 per cent probability level and the remaining significant variables, risk of
predators (PRD_RISK), livestock breed type (LS _BRT) and livestock mobility (LS_MOB) are
found to be statistically significant at less than 10 percent probability level of significance,
respectively; whereas the coefficients of the remaining explanatory variables are not statistically
different from zero at the conventional levels of significance. Discussions on the statistically
significant independent variables are as under.

75
4.2.1.1. Total Livestock Holding (TLSH_TLU):
As hypothesized and expected, total herd size exerts a positive impact on the level of income from
livestock for the household and significantly at less than 1% level of significance. This means, a
unit increase in the number of herd size in TLU leads to an (73.1%) increase in level of livestock
income. The implication is that, livestock are sources of cash income for pastoralist households.
They receive cash from the sale of livestock and/or livestock products. Moreover, when all other
contributions of livestock such as transportation, stock replacement, reproduction, manure,
prestige, social values and etc are valuated, add to the total household income from livestock.
Therefore, pastoralists who owned more livestock are able to assume more income for their
families.
4.2.1.2. Access to Farm Credit for the Household (CRDT_AC):
The result of the regression analysis shows that the pastoral household’s access to farm credit
observed to have a positive relationship with the income that the household derives from the
livestock (camels, cattle and small ruminants). The impact of credit access on the level of livestock
income to the household is significant at less than 5% level. The positive relation implies that the
more the household is likely to get credit access from any source, the higher is the probability that
the family’s income from livestock improved. This is justifiable from many angles. In rural areas
farm families mostly challenged by production failures which leads them to loss of assets (most
probably livestock). This results in decline in stock and thereby small income from livestock. The
result will be the worst if not supported by credit availability to back store the stock and pass the
bad days. Pastoralists will pass the bad times if they have access to credit. They will have
bargaining power to wait for good times and receiving good prices for their animals. Moreover,
access to credit for the herders helps them to purchase concentrates (alternative feed) for their
animals. Herders can improve the livestock production and productivity by adopting different
production technologies such as improved livestock breeds. Obviously adoption and wise use of
different production inputs helps herders boost production, hence, surplus for the market resulting,
in turn in rise in income from livestock resources. Availability of credit for the pastoralist
households eases access and adoption of all the production inputs thereby, contributing to increase
in income from livestock for the households.

76
4.2.1.3. Livestock Mobility (LS_MOB):
It is common for the pastoralists to move their animals in search of pasture and water. The
regression analysis shows that livestock mobility impacts livestock income significantly at less
than 10% level of significance. However, the impact is found to be positive as the coefficient is
computed as a positive value which is contradictory to the hypothesized proposition. The
justifications for the positive relationship between livestock income and herd movement might be
when the pastoralists move their animals they get access to pasture and water for the animals.
Leaving the risks associated with movement like predators, diseases, theft and others aside, access
to pasture and water help the animals be more productive. Obviously, the more productive are the
animals the more will be the household income derived from the animals for the family.
Otherwise, the positive relation may be interpreted as it happened by chance.
4.2.1.4. Livestock Breed Type (LS _BRT):
Breed type here refers to adoption of improved livestock breed types by the households. It is
assumed that improved breeds are more productive and bringing additional incomes to the
households. As hypothesized, the regression model analysis reveals that livestock breed type in the
study area found to have a positive relationship with livestock income. The influence was
significant at less than 10% level. Therefore, the implication of the result of the analysis is that as
the pastoralists adopt improved livestock breed types the more will be their probability to assume
high income from the livestock.
4.2.1.5. Availability of Grazing Land (AV_GL):
Availability of grazing land is one of the most figurative constraints of pastoralists in the study
area. The study showed that 61 per cent of the sampled respondents responded that they have a
problem of grazing land availability and perceive that the problem affects their income from
livestock. According to the results of focused group discussions and the researcher’s personal
observation grazing land in the study area is administered and allotted by the clan leaders and the
pastoralists use by communal mode. Moreover, pastoralists used to cross long distances in search
of grazing pasture.
More appreciably, the result of regression model coincided with the above result from descriptive
analysis. The econometric model analysis result reveals that availability of grazing land as

77
hypothesized has a positive relationship with the level of income from livestock. The relationship
between livestock income and availability of grazing land is significant at less than 1% level of
significance. The implication of the analysis result is that grazing pasture and water are the major
inputs for healthy livestock production. Livestock produced with sufficient grazing resources will
be more productive and cost well in the market resulting in boost in output (production). In such a
case, pastoralists will have surplus for the market which in turn brings additional income to the
household.
4.2.1.6. Risk of Predators in the Pastoral Areas (PRD_RISK):
Risk of predators refers to likelihood of animals eaten by beasts in times of herding, which results
in herd loss. According to the result of the regression analysis, predators affect livestock income
significantly at less than 10% level of significance. As expected, risk of predators found to affect
income negatively. Obviously, predators near to the residents of pastoralists eat animals which in
turn result in decline in stock. As level of income derived from livestock is a function of level of
stock (herd size), the overall result will then be assuming livestock income less than the actual
potential.
4.2.2. Conclusion from Results of Econometric model analysis
As indicated earlier, the major concern of this study is to analyse the determining factors affecting
livestock income in the study area. To achieve the stated objective, first some 21 factors are
identified and tested for exhibiting multicollinearity using VIF for continuous and Contingency
Coefficient for discrete variables before running the model. Based on the result, six of the variables
are excluded from the model for exhibiting multicollinearity effect and the remaining 15 variables
are used to estimate the livestock income of the respondents. Out of these 15 explanatory variables,
only 6 variables are found to be significantly affecting pastoralists’ household livestock income.
Those variables which are important determinants of livestock income as per the analysis result
were a) total livestock holding, b) access to credit, c) availability of grazing land, d) risk of
predators, e) livestock breed type and f)livestock mobility.
Total livestock holding and availability of grazing land are statistically significant at less than 1 per
cent, access to credit at less than 5 per cent and the remaining significant variables, risk of
predators, livestock breed type and livestock mobility are found to be statistically significant at less
than 10 percent probability level of significance.

78
CHAPTER V
CONCLUSIONS AND RECOMMENDATIONS
5.1. Conclusion
The study is conducted in the Middle Awash area (Amibara and Gewane woredas of Gebi-Resu
zone) of Afar National Regional State. It focused mainly on the determinant factors affecting
pastoralists’ livestock income. Primary data are gathered by individual interviews and focus group
discussions using structured interview schedule and check list, respectively.
From the Afar region of Ethiopia, Gebi-Resu zone (administrative zone III) is randomly selected
for the present study. From six woredas in Gebi-Resu zone, two woredas namely Amibara and
Gewane are selected at random for the study. From the total of 27 PAs in these two woredas, ten
PAs were selected at random (six from Amibara and four from Gewane). A random sample of 100
household heads (ten heads from each PA) is selected for the study.
Data are collected mainly on sources of household income and the levels of livestock income for
the respondent households; and on determining factors affecting the livestock income. Using the
mean livestock income value as a reference, the respondents are divided into two livestock income
groups (those who lied above and those who lied below the average livestock income [ETHB
10,839.40] for the respondents).
As per the survey results, large numbers of sampled pastoralist households in the study area lies
below average livestock income (66 per cent of the respondents are observed to earn annual
livestock income from their livestock resources below ETHB 10,839.40).
In this research four major sources of household income are identified for the study area; these are
livestock, wage employment, crop and rent of land. The result of descriptive analysis shows that
majority of pastoralists’ household income in the study area is from livestock. Livestock income
contributes 73.30% of the total household income in the study area; followed by employment
(18.09%) and crops cultivation (5.28%).

79
The descriptive analysis results shows that risk of predators, conflict, poor market infrastructure,
unavailability of grazing pasture, livestock disease, lack of market demand for livestock and risk of
drought were ranked as 1st to 7
th major factors determining the livestock income. Referring to the
focused group discussions and the researcher’s personal observation during the survey and his
experience of working with the pastoralists, shortage of grazing pasture is still the major problem
in the study area affecting the income from livestock. The recurrent drought is mentioned foremost
for causing shortage of grazing pasture. The other factor resulting in short of grazing pasture is the
invasion of the grazing land by the invasive species- Prosopis juliflora (locally known as dergihara
or weyanezaf).
In addition to the descriptive analysis, the livestock income is estimated using the linear multiple
regression model. A multiple linear regression analysis is carried out using software called
Statistical Package for Social Sciences (SPSS) version 15.0. The dependent variable considered in
the analysis is the total (gross) annual household income derived solely from livestock. Family
size, educational status of household head, total livestock holding, age of the household head,
livestock mobility, risk of predators, price of livestock in the market, access to credit, market
participation, wage employment, availability of grazing land, livestock breed type, access to
livestock market, livestock management practice and access to extension service are the
independent variables assumed to explain the dependent variable using the specified model.
The regression analysis result reveals that most of the coefficients of the explanatory variables
included in the model have negative sign. The negative sign of the coefficients indicate that the
explanatory variables influence the dependent variable negatively. However, the level of
significance varies from one independent variable to the other.
Out of these 15 explanatory variables, only 6 variables are found to be significantly affecting
pastoralists’ household livestock income. Those variables which are important determinants of
livestock income as per the analysis result are a) total livestock holding, b) access to credit, c)
availability of grazing land, d) risk of predators, e) livestock breed type and f) livestock mobility.
Total livestock holding and availability of grazing land are statistically significant at less than 1 per
cent probability level, access to credit is statistically significant at less than 5 per cent probability
level and the remaining significant variables, risk of predators, livestock breed type and livestock
mobility are found to be statistically significant at less than 10 percent probability level.
80
5.2. Recommendations
Based on the results and findings of the study, to improve pastoralist households’ income from
livestock, some recommendations are suggested to be addressed by the pastoral societies
themselves, concerned different government sectoral bodies and non-governmental funding
agencies. Those variables which are most important determinants of livestock income as per the
analysis result are total livestock holding, access to credit, availability of grazing land, risk of
predators, livestock breed type and livestock mobility. Sticking to the significant factors affecting
livestock income, the following has been suggested;
� Improving livestock production and productivity: Livestock sub sector plays a great role
contributing to household income. Its contribution to the total household income is significant.
The highest proportion of the household income in the study area comes from livestock.
Hence, necessary effort should be made to improve the production and productivity of the
sector so as to benefit much from the sector. Higher production and productivity can be
achieved through the use of improved breeds (introduction of timely and effective artificial
insemination services to up-grade the existing breeds), introduction of alternative feed sources
(like concentrates, cut and carry system and etc.) other than the natural grazing pasture, modern
livestock production techniques (strategic feeding, feed storage, housing and etc.); and better
management of communal grazing resources and risks management. Furthermore, provision of
adequate veterinary services, improved water supply points, launching sustainable and
effective forage development program, provision of training for the livestock holders on how
to improve their production and productivity, improving the marketing conditions, etc. by the
local community, NGOs and the local government are needed so as to derive the maximum
possible income and thereby secure food consumption needs at household level.
� Organizing pastoralists into cooperatives: The existing situation of Afar region with respect
to cooperatives promotion is poor. Currently, only 239 cooperatives of different operational
areas are functioning in the region. Out of which 11 and 10 are working in the areas of savings
and credits and livestock marketing, respectively (Martha T, personal information from the
region’s cooperative promotion bureau, April 2010). The livestock owners have over many
years suffered to access financial support due to factors such as lack of financial institution and
81
collateral systems fit to their situation. Therefore, organizing the pastoralists in to saving and
credit cooperatives solves the problem as these organizations are ideal in serving as one of the
funding mechanisms that aim at broadening access by pastoralists to finance through credit.
The role of credit in the household economic portfolio can be interpreted as when credit is
received, it creates an addition to the financial resources available in the current time period for
support of the household incomes; enabling herders use production inputs and technologies.
The cooperative promotion offices in the study area should work hard in creating awareness
among pastoral families towards objectives, values, principles and importance of cooperatives
and help them organize in to cooperatives of their own. Furthermore, livestock marketing
cooperatives, milk and milk products marketing cooperatives are needed to be initiated at least
at woreda level so as to help herders bargain in the market.
� Market oriented livestock production: Livestock production in the study area is subsistence
with limited or no market orientation and poor institutional support and infrastructural
development. Pastoralists produce and keep animals for various valid reasons, with little
market-orientation. However, producing for the market requires re-orientation of the
production system and development of a knowledge based and responsive institutional support
services. Institutional support services of extension, research, input supply, rural finance and
marketing are key areas of intervention that can play central role in the transformation of
subsistence mode of production in to market orientation with market infrastructure
development. Markets and roads networking the pastoral woredas with other woredas and with
neighboring regions are crucially important so as to milk the available market advantages.
Moreover, training of the livestock owners is an important aspect of commercialization of the
small-scale livestock sector. Training will significantly increase their probability of
participation in the livestock markets. There are various methods which can be used to transfer
marketing knowledge and skill to the pastoral households. A product demand-led type of
training will be very crucial as it will attempt to balance what the livestock owners are
currently producing and what the market requires. It is fundamental that the BOPARD should
play a leading role by supporting pastoralists training programs in an effort to orient pastoral
households market minded.

82
� Improving pastoralists’ access to and participation in the markets: The ability of
pastoralists to market their livestock and/or livestock products in a timely fashion and at a fair
price is essential to improve their income at the household level. It fosters monetization,
savings and investment. If prices of livestock in the market are relatively stable, attractive and
predictable over space and time, marketing efficiency can be enhanced, in which case
pastoralists will be motivated. Therefore, it demands to improve their access to markets
through construction of modern markets and access roads, provision of water along stock
routes and improved security along market routes. Moreover, strengthening pastoralists’ access
to markets and livestock trade through better linkages between pastoralists and traders is
particularly important.
� Managing associated risks of mobility: Mobility is a primary way of managing livestock
related risks in pastoral areas. However, there are multiple risks associated with moving along
with livestock in search of better grazing rangeland and water. In the study area, ethnic
conflicts and predators risks are mentioned foremost challenging mobility. Therefore, while
mobility is a lasting tradition to pass bad times of the year in pastoral areas, managing
associated risks is worthwhile. Sustainable conflicts management and peacemaking schemes
led by elders of rivalry ethnicities are need to be promoted by the regional government.
Participatory range resources demarcation or allocation among the ethnicities is another option
to bring them into harmony in using range resources. Working on the control of the invasive
Prosopis juliflora species, which invades the grazing land and harbours predators, is also
needed. Clear demarcation between communal grazing range lands and wildlife reserves will
also decrease the predators’ risks.
� Control of the invasion rate of Prosopis juliflora species: Most land in the study area is used
for pastoral purposes, although much of the land in the Awash valley in the riverine zone has
been turned over to large irrigated farms. The damage that the current expansion of crop farms
causes shortage of grazing range resources to pastoral livelihoods. This would be worsened
when it has been compounded by the encroachment of the invasive Prosopis juliflora species
from the farms into the surrounding rangelands; consequently, affecting healthy livestock
farming system. Eradication has not been that easy. Thus, proper management and control of
the invasion rate of the invasive species from grazing lands is urgent using the control methods
like economic exploitation of the species.
83
Bibliography
Abraham Getachew (2004), Determinants of Wage Labor Participation among the Afar
Pastoralists: The Case of Amibara District. Unpublished thesis, Addis Ababa University,
Ethiopia
Adem Kedir (2009), Introduction to Statistics and its Applications, 2nd
edition. Khale Printing
Press, Dire Dawa, Ethiopia
Afar National Regional State: Second Five-Year (2000/01-2004/05), Development, Peace and
Democracy Programme.
Afar Regional State Bureau of Finance and Economic development (BoFED) (2006), Afar
Atlas, unpublished Regional Profile, Semera, Ethiopia
Alemayehu Geda, Abebe Shimeles and Daniel Zerfu (2006), Finance and Poverty in Ethiopia:
A Household Level Analysis. Research Paper No. 2006/5, United Nations University-World
Institute for Development Economics Research
André Croppenstedt (2006), Household Income Structure and Determinants in Rural Egypt,
ESA Working Paper No. 06-02, Agricultural and Development Economics Division, Food
and Agriculture Organization of the United Nations
Andreas Bohne (2008), Agriculture, agricultural income and rural poverty in Malawi – Spatial
analysis of determinants and differences, University of Berlin
Andrew Ridgewell, Getachew Mamo and Fiona Flintan (2007), Gender and Pastoralism:
Rangeland and Resource Management in Ethiopia; Vol 1: SOS Sahel Ethiopia, Addis
Ababa, Ethiopia
Antonio R. and Silvia S. (2009), Livestock and pastoralists. International Fund for Agricultural
Development (IFAD), Rome, Italy
Assefa Abegaz (2005), Farm Management in mixed Crop-Livestock systems in the Northern
Highlands of Ethiopia. Tropical Resource Management Papers No. 70, Wageningen
University, the Netherlands
Ayele Solomon, Assegid Workalemahu, M.A. Jabbar M.M. Ahmed and Belachew Hurissa
(2003), Livestock marketing in Ethiopia: A review of structure, performance and
development initiatives. Socio-economic and Policy Research Working Paper 52. ILRI,
Nairobi, Kenya.
Azage Tegegne, Berhanu Gebremedhin and Dirk Hoekstra (2006), Input Supply System and
84
Services for Market-oriented Livestock Production in Ethiopia, IPMS Project, ILRI, Addis
Ababa, Ethiopia
Bekele Hundie, Martina Padmanabhan (2008), The Transformation of the Afar Commons in
Ethiopia: State Coercion, Diversification, and Property Rights Change among Pastoralists.
CAPRi Working Paper No. 87
Berhanu Gebremedhin, Hoekstra D and Samson Jemaneh (2007), Heading towards
commercialization? The case of live animal marketing in Ethiopia. Improving Productivity
and Market Success (IPMS) of Ethiopian Farmers Project Working Paper 5. ILRI
(International Livestock Research Institute), Nairobi, Kenya.
Belachew Hurissa and Jemberu Eshetu (2002), Challenges and opportunities of livestock
trade in Ethiopia. Paper presented at the 10th annual conference of Ethiopian Society of
Animal Production (ESAP), Addis Ababa, Ethiopia, 22–24 August 2002.
Beruk Yemane (2003), Food Security Situation in the Pastoral Areas of Ethiopia (unpublished)
Beruk Yemane and Taffesse Mesfin (1998), Traditional Resource Management and Proposed
Interventions with Particular Emphasis to the Livestock Sub-sector of the Nuer Community,
Jikow Woreda, Gambella Region.
CARE International in Ethiopia (2007), Review of animal health service in Afar region
(unpublished)
Cervantes-Godoy, D. and J. Dewbre (2010), Economic Importance of Agriculture for Poverty
Reduction, OECD Food, Agriculture and Fisheries Working Papers, No. 23, OECD
Publishing.
Coppock D. Layne (1994), The Borana Plateau of Southern Ethiopia. Synthesis of Pastoral
Research, Development and Change, 1980-91, ILCA, Addis Ababa, Ethiopia.
Cranfield J.A.L., Hertel T.W., Preckel P.V., Reimer J.J. and Ehui S. (2002), Assessing the
distributional impact of technical change in livestock and grains production in developing
countries. Socio-economic and Policy Research Working Paper 34. ILRI (International
Livestock Research Institute), Nairobi, Kenya.
CSA (2008), Summary and Statistical Report of the 2007 Population and Housing Census
Results, Addis Ababa, Ethiopia
CSA (2010), Agricultural Sample Survey 2009/10 Volume II Report on Livestock and Livestock
Characteristics, (Private Peasant Holdings) Statistical Bulletin no 468, Addis Ababa,
85
Ethiopia
David L.Tschirley, Michael T. Weber (1994), Food Security Strategies under Extremely
Adverse Conditions: The Determinants of Household Income and Consumption in Rural
Mozambique, Michigan State University, East Laming
Demissie Damtie (2003), The Determinants and Impacts of Income Diversification in Rural
Ethiopia: The Case of Communities in Southern Nations, Nationalities, and Peoples
Regional State, Addis Ababa University
Desta Beyera (2004), Impact of Community Managed Irrigation on Farm Production Efficiency
and Household Income: The Cases of Weliso and Wenchi Districts of Oromiya Regional
State, Alemaya University
Ellis, F. (2000), Rural Livelihoods and Diversity in Developing Countries. Oxford University
Press, Oxford
Ephrem T. (2010), Determinants of Household Food Security Status of Members of Multi-
purpose Cooperatives in Asaita Woreda, unpublished thesis, Mekelle, Ethiopia
Ethiopian Economic Association (2004/05), Transformation of the Ethiopian Agriculture:
Potentials, Constraints and Suggested Intervention Measures. Report on the Ethiopian
Economy. Volume IV 2004/05. Addis Ababa.
Ethiopian Wildlife Conservation Organisation, (1993), Compendium of Wildlife Conservation
Information.
Farm Africa (2009), A Livelihood Baseline Survey in Amibara and Gewane Woredas of Afar
Region
Farm Africa (2009), Participatory rangeland resource assessment in Amibara and Gewane
Woredas of Afar National Regional State
Federal Democratic Republic of Ethiopia (FDRE) and Ministry of Finance and Economic
Development (MOFED) (2002), Ethiopia: Sustainable Development and Poverty
Reduction Program. Addis Ababa, Ethiopia
Federal Democratic Republic of Ethiopia Census Commission (2008), Summary and
Statistical Report of the 2007 Population and Housing Census Results, Addis Ababa,
Ethiopia
Federal Democratic Republic of Ethiopia Central Statistical Agency (2010), Agricultural
Sample Survey 2009/10 Volume II Report on Livestock and Livestock Characteristics,

86
(Private Peasant Holdings) Statistical Bulletin no 468, Addis Ababa, Ethiopia
Federal Democratic Republic of Ethiopia, (2002), Food Security Strategy, Addis Ababa.
Gillespie, James R. (2004), Modern livestock and poultry production, seventh edition, Delmar
Learning, USA
Gufu Oba (1998), Assessment of Indigenous Range Management Knowledge of the Boran
Pastoralists of Southern Ethiopia, GTZ, Borana Lowland Pastoral Development
Programme.
Gujarati, D.N., (2004), Basic Econometrics 4th
Edition. McGraw-Hill, New York. USA.
Holloway G. and Ehui S. (2002). Expanding market participation among smallholder livestock
producers: A collection of studies employing Gibbs sampling and data from the Ethiopian
highlands, 1998-2001. Socio-economic and Policy Research Working Paper 48. ILRI
(International Livestock Research Institute), Nairobi, Kenya.
Holt R. and Duke Richards (1993), Emerging Agro-pastoral Practices and their Relevance for
the Viability of Pastoralism, South-East Rangeland Project.
Hoshmand, A. Reza (1988), Statistical methods for agricultural sciences, Timber Press, USA
ILCA (International Livestock Centre for Africa) (1990), Livestock systems research
manual. Working Paper 1, Vol. 1. ILCA, Addis Ababa, Ethiopia.
International Fund for Agricultural Development (2004), Livestock services and the poor
Printed in Italy by Ugo Quintily S.p.A Rome,
John Ruser; Adrienne Pilot; Charles Nelson (2004), Alternative Measures of Household
Income, United States of America
Kejela Gemtessa, Bezabih Emana (Ph.D), Waktole Tiki (2000), Livelihood Diversification in
Borana: Pastoral Communities of Ethiopia – Prospects and Challenges
Kitalyi, A., Mwebaze, S., Muriuki, C.M Mutagwaba, Mgema, M., and Lungu, O. (2006),
The role of livestock in integrated land management: RELMA’s experiences in Eastern and
Southern Africa. Working Paper No. 25. World Agroforestry Centre
Kohl, R.L. and Uhl, J.N. (1985), Marketing of Agricultural Product, 5th
Edition, Collier
Macmillan, USA.
Kotler P. and Armstrong G. (2004), Principles of Marketing (10th
ed.), Pearson Education,
Inc., Upper Saddle River, New Jersey, United States of America
Lapar M.L., Holloway G. and Ehui S. (2002), Policy options market participation of

87
smallholder livestock producers: A case study from The Philippines. Socio-economic and
Policy Research Working Paper 47. ILRI (International Livestock Research Institute),
Nairobi, Kenya.
Livestock In Development (1999), Livestock In Poverty-Focused Development. Crewkerne:
Livestock In Development
Luis Rodriguez, Economist (2008), A Global Perspective on the Total Economic Value of
Pastoralism: Global synthesis report based on six country valuations The International
Livestock research Institute, For the World Initiative for Sustainable Pastoralism (WISP) A
project of the Global Environment Facility, Implemented by UNDP and executed by IUCN,
Nairobi
McDaniel C., Lamb C. and Hair J. (2006), Introduction to Marketing, (8th
ed.), Thomson
South- Western, China
Mehdi Yadollahi, Laily Hj Paim, Mumtazah Othman and Turiman Suandi (2009), Factors
Affecting Family Economic Status. European Journal of Scientific Research, Vol.37 No.1,
EuroJournals Publishing, Inc.
Michael Halderman (2004), The political economy of the pro poor livestock policy making in
Ethiopia, PPLPI working paper no. 19, FAO
Miyuki Iiyama (2006), Livelihoods Diversification Patterns among Households and their
Implications on Poverty and Resource Use: A Case Study from a Kerio River Basin
Community Land Use Change Impacts and Dynamics (LUCID) Project Working Paper No.
51. Nairobi, Kenya: International Livestock Research Institute.
MOA/MSU/UA (1992), The Determinants of Household Income and Consumption in Rural
Nampula Province, Mozambique: Implications for Food Security and Agricultural Policy
Reform. Research Team Working Paper No. 6, Mozambique
MoFED (2006), Ethiopia: Building in Progress a Plan for Accelerated and Sustained
Development to end Poverty (PASDEP). 2005/06 – 2009/10, Volume I Main Text. Addis
Ababa, Ethiopia.
Mohammed Mussa (2004), A Comparative Study of Pastoralist Parliamentary Groups: Case
Study on the Pastoral Affairs Standing Committee of Ethiopia, for the NRI/PENHA
Research Project on Pastoralist Parliamentary Groups, funded by DFID’s Livestock
Production Programme and the CAPE Unit, AU-IBAR, Addis Ababa, Ethiopia

88
Mohammad Samaun Safa (2007), Socio-economic factors affecting the income of small-scale
agroforestry farms in hill country areas in Yemen: A comparison of OLS and WLS
determinants, Springer Netherlands
Mohammed, Sirage (2009), Determinants of participation in livestock marketing in Awsi Resu
zone, Afar region. Unpublished thesis, Mekelle, Ethiopia
Niggol S. Seo and Mendelsohn R. (2010), Animal husbandry in Africa: Climate change impacts
and adaptations,
Pastoral Community Development Project, PCDP (2005), Participatory Research and Social
Analysis with Special Emphasis on Gender in Pastoral Communities of Ethiopia, Addis
Ababa
Pastoral Community Development Project, PCDP (2005), Social Differentiations and
Traditional Livelihood Strategies in Oromia Pastoral Communities, Addis Ababa
Pastoralist Forum Ethiopia (PFE) (2004), Pastoralism and sustainable pastoral development,
the Third National Conference on Pastoral Development from December 23-24, 2004. Addis
Ababa, Ethiopia
Pastoralist Forum Ethiopia (2008), Millennium Development Goals and Pastoral
Development: Opportunities and Challenges in the new Ethiopian Millennium, Proceedings
of the Fourth National Conference on Pastoral Development in Ethiopia; UN ECA
Conference Hall August 29-30, 2007, Addis Ababa, Ethiopia
Pastoralist Livelihoods Initiative-Livestock Marketing (PLI-LM) – Ethiopia (2008), Project
Profile
Pastoral Oriented Development and Extension concept (PODEC) for Borana zone (1998),
Proceedings and major results of the PODEC workshop 25-30 May, Negelle Borena.
Radeny M., D. Nkedianye, P. Kristjanson and M. Herrero (2006), Livelihood Choices and
Returns among Agro-Pastoralists in southern Kenya: Paper presented at an international
conference entitled “Pastoralism and Poverty Reduction in East Africa: A Policy Research
Conference”, International Livestock Research Institute, 27-28 June 2006, Nairobi.
Richard H. Adams, Jr. (1996), Livestock Income, Male/Female Animals, and Inequality in
Rural Pakistan. International Food Policy Research Institute. Washington DC, USA
Sara Pantuliano and Mike Wekesa (2008), Improving drought response in pastoral areas of
Ethiopia Somali and Afar Regions and Borena Zone of Oromiya Region. Humanitarian

89
Policy Group Overseas Development Institute, London; Prepared for the CORE group
(CARE, FAO, Save the Children UK and Save the Children US)
Sesabo J. K., Tol R. S. J. (2005) Factors affecting Income Strategies among households in
Tanzanian Coastal Villages: Implications for Development-conservation initiatives, working
paper no 70.
SID (2008) Agricultural Marketing in Ethiopia: The Case of Arrero, Goro and Dehana Districts.
(DCA) Dan Church Aid. Addis Ababa, Ethiopia
SOS-Sahel Ethiopia (2007), Pastoralism in Ethiopia: its total economic values and
development challenges. A knowledge management study implemented by SOS Sahel,
Ethiopia
Stefan Schwarze (2004), Determinants of Income Generating Activities of Rural Households: A
Quantitative Study in the Vicinity of the Lore-Lindu National Park in Central
Sulawesi/Indonesia
Stephen Devereux and IDS Sussex (2000), Food Insecurity in Ethiopia, A discussion paper for
DFID
Susanne Wymann von Dach, Rosmarie Sommer, Ruth Wenger (2007), InfoResources Focus
No 1/07
Tesfahun Fenta and Ousman Ali (2004), Proceedings of the Food Security Conference 2003:
Challenges and Prospects of Food Security in Ethiopia. August 13 – 15, 2003 UNCC, Addis
Ababa, Ethiopia
Tesfaye Berhanu (2008), Performance Efficiency Analysis of Livestock Marketing in Afar
Region. Unpublished thesis, Mekelle, Ethiopia.
The Canberra Group (2001), Expert Group on Household Income Statistics: Final Report
The European Journal of Comparative Economics (2007), Determinants of Soviet Household
Income
Thomas Walker, D. Tschirley, J. Low, M. Pequenino Tanque, D. Boughton, E.
Payongayong, and M. Weber (2004), Determinants of Rural Income, Poverty, and
Perceived Well-Being in Mozambique in 2001-2002, Research Report No 57E, Mozambique
Woldetensae Kahsaye (2002), The Cultural Ecology of Pastoralism in Eritrea: A Geographical
Inquiry: A Dissertation in partial fulfillment of the requirements for the degree of Doctor of
Philosophy, Louisiana State University,
90
Yacob Aklilu and Andy Catley (2010), Livestock Exports from Pastoralist Areas: An Analysis
of Benefits by Wealth Group and Policy Implications, IGAD LPI Working Paper No. 01 –
10, Feinstein International Center Tufts University
Yacob Aklilu, Patrick Irungu, and Alemayehu Reda (2002), An Audit of the Livestock
Marketing Status in Kenya, Ethiopia and Sudan (Volume I) Nairobi, Kenya
Zeray, Mehari (2007), Invasion of Prosopis juliflora (SW.) DC and Rural Livelihoods: The
Case of Afar Pastoralists at Middle Awash Area of Ethiopia, Norwegian University of Life
Sciences
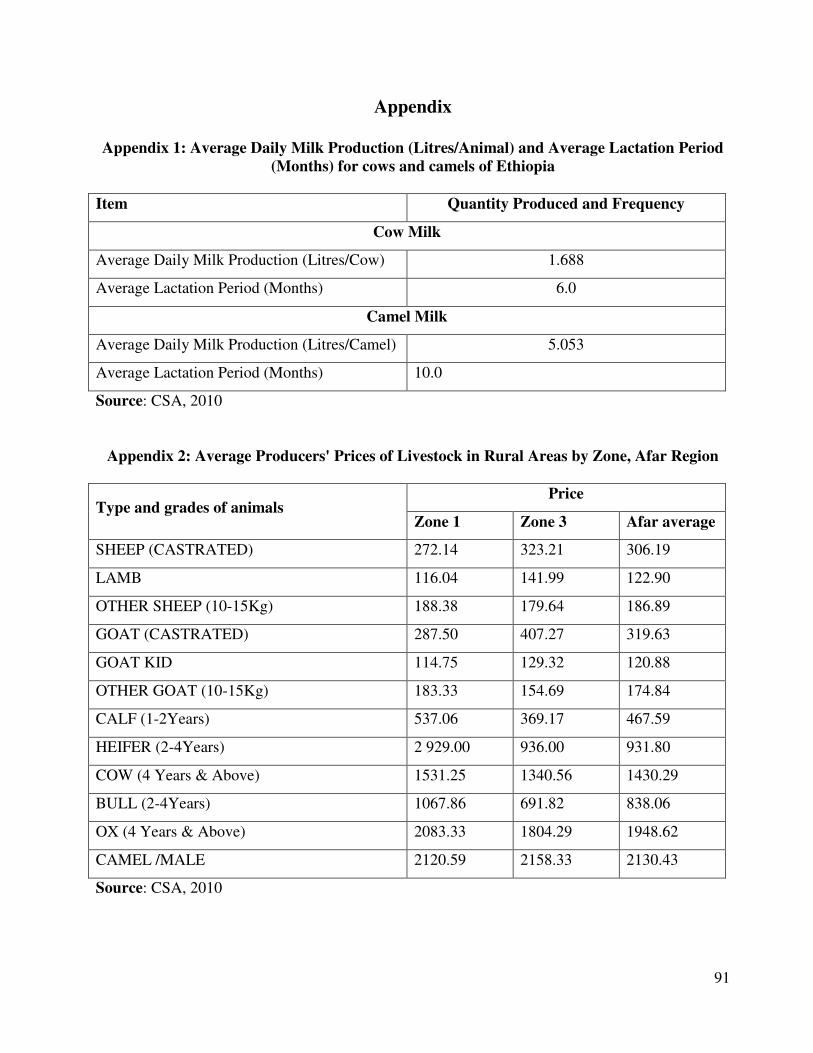
91
Appendix
Appendix 1: Average Daily Milk Production (Litres/Animal) and Average Lactation Period
(Months) for cows and camels of Ethiopia
Item Quantity Produced and Frequency
Cow Milk
Average Daily Milk Production (Litres/Cow) 1.688
Average Lactation Period (Months) 6.0
Camel Milk
Average Daily Milk Production (Litres/Camel) 5.053
Average Lactation Period (Months) 10.0
Source: CSA, 2010
Appendix 2: Average Producers' Prices of Livestock in Rural Areas by Zone, Afar Region
Type and grades of animals Price
Zone 1 Zone 3 Afar average
SHEEP (CASTRATED) 272.14 323.21 306.19
LAMB 116.04 141.99 122.90
OTHER SHEEP (10-15Kg) 188.38 179.64 186.89
GOAT (CASTRATED) 287.50 407.27 319.63
GOAT KID 114.75 129.32 120.88
OTHER GOAT (10-15Kg) 183.33 154.69 174.84
CALF (1-2Years) 537.06 369.17 467.59
HEIFER (2-4Years) 2 929.00 936.00 931.80
COW (4 Years & Above) 1531.25 1340.56 1430.29
BULL (2-4Years) 1067.86 691.82 838.06
OX (4 Years & Above) 2083.33 1804.29 1948.62
CAMEL /MALE 2120.59 2158.33 2130.43
Source: CSA, 2010

92
Appendix 3: Conversion Factors to Estimate Tropical Livestock Unit equivalents
Animal category TLU
Cattle 0.7
Shoat 0.1
Camel 1.25
Source: Storck, et al. (1991) as cited in Ephrem (2010); Taylor and Turner (2000), cited in Stefan
Schwarze (2004)
Appendix 4: Goats herd size of a respondent
Source: Own picture during survey, 2010
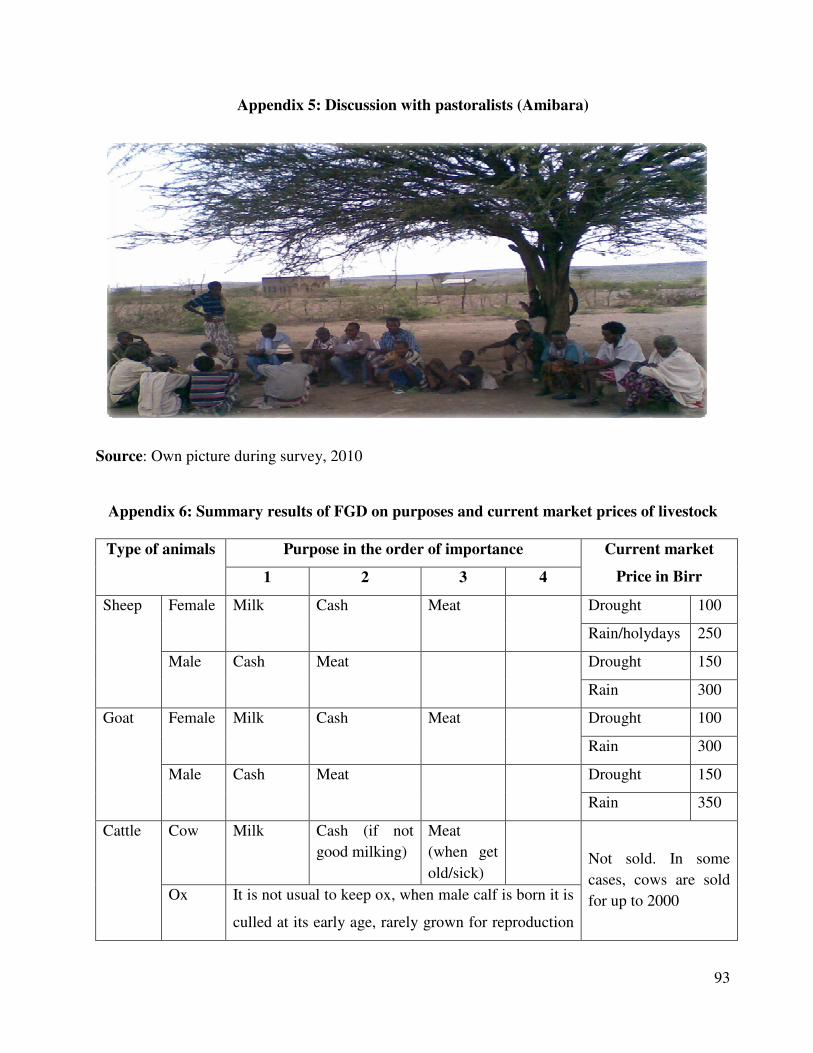
93
Appendix 5: Discussion with pastoralists (Amibara)
Source: Own picture during survey, 2010
Appendix 6: Summary results of FGD on purposes and current market prices of livestock
Type of animals Purpose in the order of importance Current market
Price in Birr 1 2 3 4
Sheep Female Milk Cash Meat Drought 100
Rain/holydays 250
Male Cash Meat Drought 150
Rain 300
Goat Female Milk Cash Meat Drought 100
Rain 300
Male Cash Meat Drought 150
Rain 350
Cattle Cow Milk Cash (if not
good milking)
Meat
(when get
old/sick)
Not sold. In some
cases, cows are sold
for up to 2000 Ox It is not usual to keep ox, when male calf is born it is
culled at its early age, rarely grown for reproduction

94
purpose only.
Calf* If female, grown to milking cow otherwise culled
Heifer Grown to
cow
Cash (if
unmanageable)
Camel Female Milk Prestige Wealth
indicator
Meat
(when
old)
Male Meat Transportation Cash (high
priced at
young)
Meat
(when
get old)
Small 6000
Medium 5000
Old 3000
Donkey Transportation Cash 1000-2000
Source: FGD with BPARD experts, 2010
*Note: In Afar tradition, female calves are given the greatest value for they are tomorrows milking
cows. In general female animals are never sold or slaughtered except forced to do so (in times of
drought, sickness or punishment by the community)
Appendix 7: VIF of continuous variables
Variables VIF
AGE_H 1.390
FAM_SIZ 1.318
TLSH_TLU 1.766
Source: Field survey, 2010

95
Appendix 8: Contingency Coefficient for discrete variables
1 2 3 4 5 6 7 8 9 10 11 12 13 14 15 16 17 18
1 1.00
2 0.469 1.000
3 0.050 0.015 1.000
4 0.038 0.013 0.136 1.000
5 0.165 0.002 0.027 0.060 1.000
6 0.469 0.420 0.011 0.001 0.078 1.000
7 0.170 0.173 0.180 0.103 0.075 0.140 1.000
8 0.338 0.420 0.111 0.001 0.029 0.311 0.054 1.000
9 0.363 0.415 0.024 0.005 0.092 0.294 0.072 0.396 1.000
10 0.125 0.004 0.006 0.028 0.072 0.083 0.131 0.021 0.125 1.000
11 0.140 0.174 0.178 0.053 0.192 0.101 0.140 0.266 0.238 0.205 1.000
12 0.276 0.197 0.222 0.225 0.216 0.220 0.280 0.138 0.131 0.231 0.155 1.000
13 0.150 0.217 0.189 0.191 0.054 0.190 0.380 0.235 0.203 0.038 0.155 0.228 1.000
14 0.143 0.067 0.070 0.054 0.214 0.033 0.032 0.033 0.060 0.031 0.132 0.232 0.146 1.000
15 0.086 0.155 0.069 0.053 0.049 0.078 0.024 0.127 0.139 0.011 0.057 0.128 0.061 0.174 1.000
16 0.071 0.042 0.033 0.247 0.122 0.052 0.221 0.052 0.160 0.094 0.089 0.237 0.070 0.210 0.127 1.000
17 0.126 0.020 0.128 0.027 0.043 0.179 0.113 0.059 0.012 0.067 0.134 0.187 0.057 0.059 0.051 0.269 1.000
18 0.173 0.091 0.041 0.111 0.006 0.144 0.166 0.091 0.041 0.192 0.157 0.118 0.215 0.200 0.199 0.319 0.002 1.000

96
* Note: Exhibiting high multicollinearity effect at less than 1% level significance
1. Availability of Grazing land
2. Conflict over resources*
3. Livestock Mobility
4. Price of livestock in market
5. Risk of Predators
6. Livestock Disease *
7. Market access
8. Livestock Mortality*
9. Drought risk*
10. Livestock Breed type
11. Livestock Management practice
12. Education level of HHH
13. Choice of Livelihood strategy*
14. Wage Employment
15. Market participation
16. Extension access
17. Credit access
18. Veterinary services Access*

97
Appendix 9: Interview Schedule for pastoral income survey
Interview schedule for Pastoral Household Income survey
Mekelle University
College of Business and Economics
Department of Co-operative Studies
This interview schedule is prepared to collect data from pastoral households for the purpose of
studying the “Determinants of Pastoralists’ Livestock Income in Middle Awash, Southern Afar,
Ethiopia”. (Gewane and Amibara woredas)
Date of interview ____________
Name of the interviewer _______________________
General Instructions to Enumerators;
• Make brief introduction about the purpose of the interview to the respondent;
• Please ask the question clearly and patiently until the respondent understands;
• Please fill up the interview schedule according to the respondent replies;
• Please do not use technical terms while discussing with the respondents; and
• Please do not forget to record the data.
I. GEOGRAPHIC INFORMATION
1.1. Zone; 3
1.2. Name of Woreda ___________
1.3. Name of pastoral association ___________
1.4. Distance of PA to the nearest district town ________ walking time (in hours or days)
II. DEMOGRAPHIC CHARACTERSTICS OF THE RESPONDENTS
2.1. Name of the household head ____________________
2.2. Age of the respondent (in number of years) ____________________
2.3. Sex of the household head; _______ Female; _______ Male
2.4. Marital status of the household head; _______ Single; _______ Married;
_______ Divorced;
2.5. Health status of household head; ______ healthy; ______ disable; ______ HIV positive;
______ TB patient; ________________________________ other health problem if any (specify)

98
2.6. Level of education of the household head; _____ Illiterate; ______ Read and write; _______
Primary cycle; ______ Above primary cycle; ____________________________ Other (Specify)
2.7. Family size _____________ (list the family members, including head).
III. OCCUPATION/EMPLOYMENT
3.1. What is your occupation? _____ Pastoral; _____ Agro-pastoral; _____ Civil servant; ______
Trade; _________ Clan leader; _______ Religious leader; __________________________
Other (specify)
3.2. Are you wage employed? ______ Yes; ______ No
3.3. If yes, what is the status of employment? _____ Daily labourer; ______ Contract basis;
______ Permanent
3.4. Are any of your families wage employed? ______ Yes; ______ No
3.5. If yes, fill the following table
S. No Family members Nature of employment (use code)
1
2
3
Codes:
1. Daily laborer; 2. Contract basis; 3. Permanent
IV. ASSETS OWNERSHIP
4.1. Do you own land? ______ Yes; ______ No
4.2. If yes, what is the total size of your land (in ha. Or other local measurement): ________
4.3. How is land tenure system in your locality? ______ (1=Communal; 2=Rent or lease;
3=privately owned; others (specify) _________________________
4.4. What for is the land allotted? Grazing ________; Crops ________; Rent ________; other
purpose (specify) ___________________________________ (in ha or other local measurement)
4.5. Do you own houses? ______ Yes; ______ No
4.6. If yes, i) what type is it? (grass roofed, corrugated iron roofed or both types) ii) what is its
current value in birr? _____ iii) what for is it built? ____ Own residence; _____ Rent; Other
purpose (specify) __________________________
4.7. Do you own livestock (now)? ______ Yes; ______ No

99
4.8. If yes, please fill the following table;
S. No Type of livestock owned Number owned now Current value in Birr
1 Cattle
1. Cow
2. Ox
3. Heifer
4. Calf
2 Sheep
3 Goat
4 Camel
5 Others (if any)
Total
4.9. What for is the livestock kept?
S. No Type of livestock owned Purpose (use codes below)
1 Cattle
a. Ox
b. Cow
c. Heifer
d. Calf
2 Sheep
3 Goat
4 Camel
5 Other (if any)
1=Cash income
2=Meat
3=Milk
4=Prestige
5=Festivals/rituals
6=Transportation
7=Draught power
8=By-products (manure)
9=Wealth accumulation; 10=Others (specify) ______________________________
V. HOUSEHOLD INCOME
5.1. What are the sources of income for your household? ______ Livestock; ______ Crops;
______ Employment; ______ Rent (house, land, livestock); ______ Pension; _____ Remittance;
Others (specify) ______________________
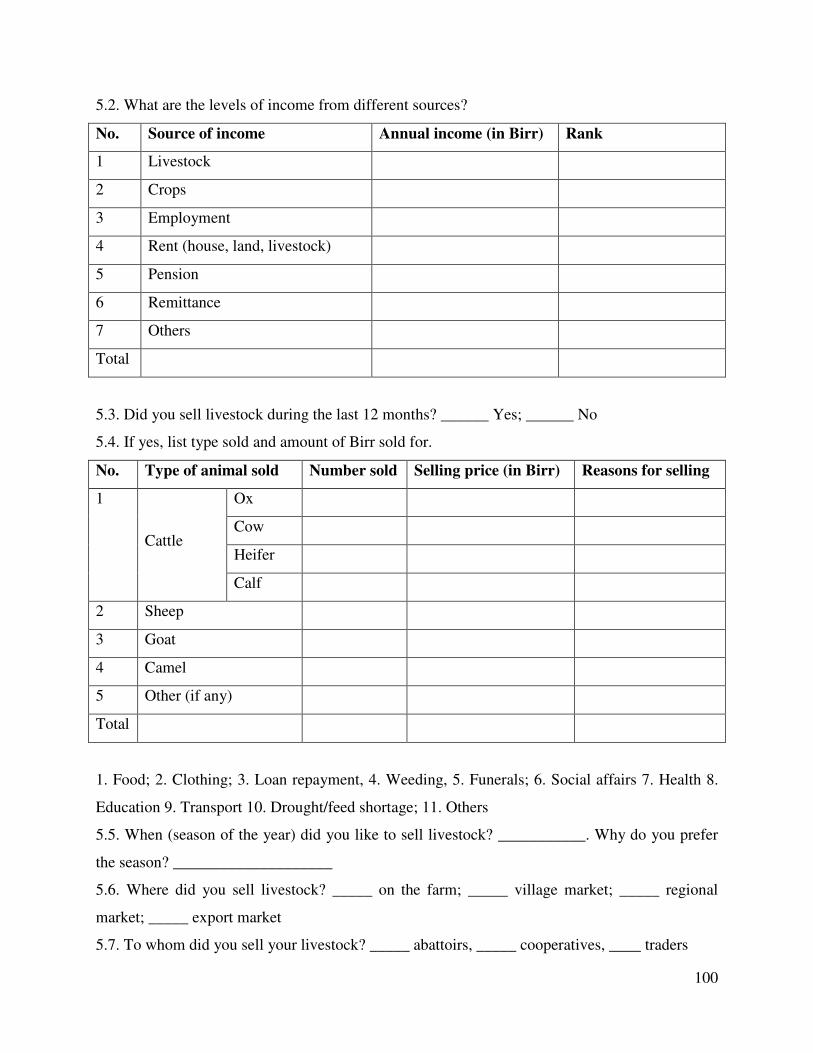
100
5.2. What are the levels of income from different sources?
No. Source of income Annual income (in Birr) Rank
1 Livestock
2 Crops
3 Employment
4 Rent (house, land, livestock)
5 Pension
6 Remittance
7 Others
Total
5.3. Did you sell livestock during the last 12 months? ______ Yes; ______ No
5.4. If yes, list type sold and amount of Birr sold for.
No. Type of animal sold Number sold Selling price (in Birr) Reasons for selling
1
Cattle
Ox
Cow
Heifer
Calf
2 Sheep
3 Goat
4 Camel
5 Other (if any)
Total
1. Food; 2. Clothing; 3. Loan repayment, 4. Weeding, 5. Funerals; 6. Social affairs 7. Health 8.
Education 9. Transport 10. Drought/feed shortage; 11. Others
5.5. When (season of the year) did you like to sell livestock? ___________. Why do you prefer
the season? ____________________
5.6. Where did you sell livestock? _____ on the farm; _____ village market; _____ regional
market; _____ export market
5.7. To whom did you sell your livestock? _____ abattoirs, _____ cooperatives, ____ traders

101
5.8. What costs did you incur while selling livestock? ______ Transportation; _______
Feed/water; _____ Tax; ____ Brokers; _________ Others (specify)
5.9. What is your say about the price you receive for your livestock in the market? ____
reasonable/fair; ______ Not fair
5.10. If no, what do you think are the reasons?
__________________________________________
__________________________________________
__________________________________________
5.11. Did you experience receiving income from sell of livestock products? _____ Yes; ____ No
5.12. If yes, what are the products you sold during the last 12 months? _____ Meat; _____ Milk
and milk products; _____ Hides and skins; Others (specify) _________________
5.13. What is the level of income you received from sell of livestock products last 12 months?
No. Livestock product sold Total income received (in Birr)
1 Meat
2 Milk and milk products
3 Hides and skins
4 Others
Total
5.14. Where did you sell livestock products? ____ Home, _____ village, ____ market
5.15. If the response for 5.11. is no, what are the reasons? __________________________
__________________________________
5.16. Did you slaughter livestock for home meat consumption? _____ yes; ____ no; if yes, recall
type and number of livestock (TLU).
VI. DETERMINANTS OF LIVESTOCK INCOME
6.1. What do you think are the major factors affecting your income from livestock you keep?
No. Determinants Yes or No Rank/prioritize
1 Grazing land/feed availability
2 Water availability
3 Livestock disease

102
4 Livestock breed/Adoption of improved breeds
5 Conflict in the area
6 Drought
7 Mobility
8 Predators
9 Market demand
10 Morbidity
11 Management practice/Adoption
12 Market infrastructure
6.2. Whom do you think is responsible for taking corrective actions? ______________________
_____________________________________
6.3. What suggestions would you recommend for improvement of your income from livestock?
1. __________________
2. ____________________
3. ____________________
4. ____________________
6.4. Do you involve in cultivating crops/forage? ______ Yes; ______ No
5.20. List the crops you are cultivating now in the order of importance
1. ______________
2. ______________
3. ______________
6.5. If response for 6.4 is yes, what for is you doing so?
_____ Food (home consumption); _____ Cash income
6.6. If no, what are the reasons? _____________________________________
6.7. Have you involved in conflict over resource during last 12 months? ___ Yes ___ No
6.8. Do you perceive that conflict in the pastoral areas affect your income? ____ Yes ____ No
6.9. Do you move livestock to other place in search of feed and water? ____ Yes ____ No
6.10. Will mobility affect your income? ____ Yes ____ No
VII: HOUSEHOLD CONSUMPTION AND EXPENDITURE
7.1. What are the major sources of household food consumption?
_____ Livestock

103
• Own use • Purchase • Gift • Others
____ Crops
• Own use • Purchase • Others
____ Food aid; or ___________ Others (specify)
7.2. Level of expenditure and reasons (for the last 12 months)
No. Reasons for expenditure Amount in Birr
1 Food
2 Clothing
3 Farm implements
4 Animal feed
5 Rent
6 Loan repayment
7 Utensils/furniture/electronic goods
8 Social affairs
9 Health expenditure
10 Education fee for children
11 Festivals
12 Others (specify)
Total
VIII: ACCESS TO DIFFERENT SERVICES
8.1. Did you have extension contact in relation to livestock marketing? ___ Yes, ___ No
8.2. Do you receive market information prior to sale? ____ Yes ____ No
8.3. If yes, what is /are your source(s) of information?
____ Radio/TV; ____ VEWs; ____ Cooperatives; ____ Broker or ____ By means of local
information exchange (dagu); Others (specify) _______
8.4. If don’t receive market information, would you like to have a regular source in the future?
____ Yes ____ No
8.5. How often would you like to receive? _____ Daily _____ Weekly _____ Monthly
8.6. Do you have access to livestock market? ____ Yes ____ No. Distance from the PA to the
nearest market centre _________ walking time (in hour or day)
8.7. What are the factors creating risks when producing livestock?

104
_________ Drought risk: _________ Stock theft _________ Mortality/morbidity? _________
Conflict; Others (specify) _________________
8.8. Are there any cooperatives in your PA? ____ Yes ____ No
8.9. Are you a member of cooperative (saving and Credit cooperative, Irrigation cooperative,
livestock marketing cooperative)? ____ Yes ____ No
8.10. Do you have access to credit service? ____ Yes ____ No
8.11. If yes, what is the source of credit?
____ Bank; ____ Microfinance; ____ Credit and saving cooperative; or Others (specify) ______
8.12. Do you have access to veterinary service? ____ Yes ____ No. if yes, at what distance from
your home? __________ (walking hrs. or days)
8.13. How do you transport live animals when you want to selling?
_____ Trucking; _____ Trekking
8.14. What general problem do you experience when moving your live animals for sale?
_______________________
8.15. What are the primary sources of feed for livestock?
_____ Grazing in the range _____ Backyard forage _____ Fallow land grazing _____ Crop
residue; ___________ concentrates; others, specify _________
8.16. Did you attend training in relation to livestock marketing? ____ Yes ____ No
8.17. Did you adopt any improved livestock breed type? ____ Yes _____ No
8.18. Did you adopt any improved livestock production management systems? ___ Yes ____ No
Appendix 10; FGD checklists with Pastoralist Agriculture and Rural Development Officers
These checklists are prepared to collect data from Pastoralist Agriculture and Rural Development
Officers for the purpose of studying the “Determinants of Pastoralists’ Livestock Income in
Middle Awash, Southern Afar, Ethiopia”. (Gewane and Amibara woredas)
Date ______________
Name of the wereda _______________ No. of pastoral associations __________
I. Livelihood related checklists
1. How do you describe the livelihood of the wereda? (pastoral, agro-pastoral, trade)
2. How is the land tenure system of the wereda? (privately, communal, clan, rent/lease)

105
II. Assets ownership
1. What major types of animals are kept in the wereda? For what purpose are they kept?
2. What is the current value (current market price in birr) of each type of animal?
3. Which livestock products are valuable/marketable? How are the livestock products
valued?
4. What is the average lactation period of the milking animals in the wereda? How many
litres of milk each animal does give per day?
5. What are the houses of the pastoralists made of? How are they valued?
III. Sources of income
1. What are the major sources of household income for the pastoralists in the wereda?
2. What are the major factors affecting the livestock income?
3. Who do you think is the responsible body to deal with factors affecting livestock income?
4. What interventions are needed to improve the livestock income?
IV. Access to services
1. Is there livestock market? How is the distribution? How is livestock marketing channel?
2. Do pastoralists receive fair income from the sale of their animals? Why?
3. How many veterinary clinics are there in the wereda?
4. How many cooperatives are there? In what areas are they organized?
Appendix 11; FGD checklists with Pastoralist Agriculture and Rural Development Agents
These checklists are prepared to collect data from Pastoralist Agriculture and Rural Development
Agents for the purpose of studying the “Determinants of Pastoralists’ Livestock Income in
Middle Awash, Southern Afar, Ethiopia”. (Gewane and Amibara woredas)
Date ______________
Name of the wereda _______________ Name of pastoral associations __________
I. Assets ownership
1. What major types of animals are kept in the wereda? For what purpose are they kept?
2. What is the current value (current market price in birr) of each type of animal?
3. Which livestock products are valuable/marketable? How are the livestock products
valued?
106
4. What is the average lactation period of the milking animals in the wereda? How many
litres of milk each animal does give per day?
5. What are the houses of the pastoralists made of? How are they valued?
II. Sources of income
1. What are the major sources of household income for the pastoralists in the wereda?
2. What are the major factors affecting the livestock income? (in the order of severity)
3. Who do you think is the responsible body to deal with factors affecting livestock income?
4. What interventions are needed to improve the livestock income?
III. Access to services
1. Is there livestock market? How is the distribution? How is livestock marketing channel?
2. Do pastoralists receive fair income from the sale of their animals? Why?
3. How many veterinary clinics are there in the wereda?
4. How many cooperatives are there? In what areas are they organized?
I thank you very much!!