WORKFORCE SYSTEM RESULTS - Employment and Training ... · PDF fileWORKFORCE SYSTEM RESULTS For...
41
WORKFORCE SYSTEM RESULTS For the Quarter ending June 30, 2014 | Fourth Quarter of Program Year 2013 | Third Quarter of Fiscal Year 2014 EMPLOYMENT AND TRAINING ADMINISTRATION UNITED STATES DEPARTMENT OF LABOR
-
Upload
nguyenduong -
Category
Documents
-
view
213 -
download
0
Transcript of WORKFORCE SYSTEM RESULTS - Employment and Training ... · PDF fileWORKFORCE SYSTEM RESULTS For...

WORKFORCE SYSTEM RESULTSFor the Quarter ending June 30 2014 | Fourth Quarter of Program Year 2013 | Third Quarter of Fiscal Year 2014
EMPLOYMENT AND TRAINING ADMINISTRATIONUNITED STATES DEPARTMENT OF LABOR
The Employment and Training Administration (ETA) provides this overview of performance results for the 12-month period ending June 30 2014 The programs highlighted reinforce ETArsquos commitment to good jobs for everyonemdashhelping people find good jobs and connecting employers to qualified workers This commitment supports the Department of Laborrsquos strategic goals of preparing workers for good jobs and ensuring fair compensation safe and healthy workplaces health benefits and high quality work-life environments and providing income security for those not working as well as fostering fair working conditions in the global marketplace
In the four quarters ending June 30 2014 ETA programs documented their services to over 28 million participants within their respective programs This is a reduction of nearly 3 million in the past four quarters with the majority of this difference reflected in Unemployment Insurance and Wagner-Peyser Employment Service Although this is good news the overall high level of participants in all programs reflects a continued need for temporary income support training and employment services including job search assistance The spotlight in this edition features a success story from the Alaska Dislocated Worker Training National Emergency Grant (DWT-NEG) funds that provided necessary supports for many dislocated workers throughout Alaska and strengthened Alaskarsquos ability to deliver critical work based learning and training to the long-term unemployed Justin W was able to gain credentials and earn a position as a temporary dispatch with the Waste Water UtilityMunicipal of Anchorage making $3143 per hour and eventually earned a permanent position through support from DWT-NEG funds
Other highlights to note in this report are 1) The National Farmworker Jobs Program (NFJP) exceeded its previous yearrsquos Entered Employment Rate (EER) by 26 percentage points from 855 percent to 881 percent as well as increased their Employment Retention Rate (ERR) from 831 to 856 percent and Six Monthrsquos Average Earnings from $10533 to 10855 2) Workforce Investment Act (WIA) Adult participants who received training services had a 15 percentage point higher EER than those in the overall EER at 761 percent compared to 611 percent and 3) the Registered Apprenticeship Six Monthsrsquo Average Earnings for program completers was $29964 which is $5577 more than that of all Registered Apprenticeship program exiters which shows it pays to stay and complete the program
In general this overview presents program outcomes and results for the four quarters compared to the same four quarters in the prior year Although many programs report common performance measures outcomes several programs have specific performance measures A glossary of performance measures included in this overview provides the performance measure definitions for each program Common performance measures applicable to many of ETArsquos programs focus on obtaining employment retaining employment earnings in a six-month period and acquiring industry recognized credentials to ensure that the nationrsquos youth adults and dislocated workers have the skills necessary to succeed in a global environment
For further information about this overview please contact ETArsquos Office of Policy Development and Research at (202) 693-3700 An electronic version is available at wwwdoletagovperformance
Thomas E Perez Secretary of Labor
United States Department of Labor
200 Constitution Avenue NW
Washington DC 20210
wwwdolgov
Contents
Quarterly Spotlight 1
People Served by Program 2
Current Appropriations 3
Government Performance and Results Act Goals 4
Indian and Native American Adult Program 7
National Farmworker Jobs Program 8
Senior Community Service Employment Program 9
Wagner-Peyser Employment Service 10
Workforce Investment Act Adult Program 11
Workforce Investment Act Dislocated Worker Program 12
H-1B and Permanent Foreign Labor Certification 13
H-2A and H-2B Foreign Labor Certification Programs 14
Reintegration of Ex-Offenders 15
Registered Apprenticeship 16
Trade Adjustment Assistance 18
Unemployment Insurance 19
Job Corps 21
Workforce Investment Act Youthful Offender Initiative 22
Workforce Investment Act Youth Program 23
YouthBuild 24
Indian and Native American Youth Program 25
Green Jobs Innovation Fund Grants 26
H-1B Jobs and Innovation Accelerator Challenge Grants 27
H-1B Technical Skills Training Grants 28
Community-Based Job Training Grants 29
Trade Adjustment Assistance Community College and Career Training Grants 30
Disability Employment Initiative 31
ETA Internet-Based Assistance 32
Glossary of Performance Measures 33
WORKFORCE SYSTEM RESULTS
Quarterly Spotlight Alaska Dislocated Worker Training National Emergency Grant (DWT-NEG)
Certification as a waste water treatment operator put an end to underemployment for Justin W and helped him secure his dream job
In 2012 Alaskarsquos WIA Dislocated Worker (DLW) department received $12 million in Dislocated Worker Training National Emergency Grant (DWT-NEG) funds to expand training opportunities to dislocated workers The federal funding supports on-the-job training registered apprenticeships and other approaches that connect dislocated workers with employers These services are targeted to those experiencing prolonged unemployment The DWT-NEG was initially projected to enroll 100 participants throughout the life of the grant however at the end of Program Year 2013 143 participants were enrolled and approximately half of the funds expended
The high enrollment rate included many success stories including that of Justin W Justin was referred to the Career Support and Training by Plumbers and Pipefitters He was indentured as a first-year apprentice to specialize in HVAC however needed more training Through working with his case manager Justin was able to access tools and training services However he was unable to immediately find steady employment as a HVAC apprentice
Through his own research Justin found that it was possible to study on his own and get certified as a waste water treatment operator With this certification and a commercial driverrsquos license (CDL) he could be dispatched through the union to the local water utility While he would have to start as a temporary dispatch soon after he would be eligible to be transitioned to a full time position This was an especially hard time for Justin and his family as his wife also became unemployed during this time however he persisted and worked with
his case manager to gain funding for his CDL with DWT-NEG funds contingent on his passing the other certification tests Justin was able to successfully complete both the CDL training and a second year of school Then it was just waiting to be dispatched to the water utility One day soon after as Justin was about to leave for a regular dispatch to Shemya he saw he missed a call It was the call he was waiting for to finally be given a position as a temporary dispatch with the water utility A few weeks later Justin gained a full time dispatch position making $3143 per hour
The DWT-NEG funds provided necessary supports for many dislocated workers throughout Alaska and strengthened the departmentrsquos ability to deliver critical work based learning and training to the long-term unemployed Dislocated workers are defined as those who have been unemployed for 27 weeks or more In Alaska funds are administered through the Employment Security Division (ESD) which conducts participant and employer recruitment determines eligibility and provides employment and training services to participants enrolled in the grant
The ESD Unemployment Insurance (UI) system and the Alaska Labor Exchange System (ALEXsys) primarily recruit dislocated workers or UI recipients that have been profiled as likely to exhaust UI benefits
ESD also targets prospective employers through the departmentrsquos apprenticeship outreach program and partners with the Alaska Workforce Investment Board (AWIB) to create job training opportunities and streamline access to job opportunities The departmentrsquos goal has been to create partnerships that provide services to populations with the highest barriers the long-term unemployed Veterans Alaska Natives and workers likely to exhaust their UI benefits and individuals receiving vocational rehabilitation guidance and assistance while pursuing re-employment or registered apprenticeship
Justinrsquos story is just one of many successes that Alaska has been able to facilitate for DWTshyNEG participants
Update Justin continues to work for the Waste Water UtilityMunicipal of Anchorage He became a permanent employee in 2014 and received over a $200 raise after completion of his six month probationary period He has no plans to leave his current job
1
People Served by Program
In the 12 month period ending June 30 2014 ETA programs served a total of 28353698 participants ETA programs are largely administered via the American Job Center Network Caseworkers assess program participantsrsquo needs and connect them with different services and programs funded by the ETA Thus participants receive customized and comprehensive support based on their needs and eligibility and often receive services from various programs simultaneously
Of all the total participants receiving Wagner-Peyser Employment Service (ES) and Unemployment Insurance (UI) 726 percent of those received both Unemployment Insurance and Wagner-Peyser funded Employment Services ETArsquos other programs provided more comprehensive services to over 92 million people
These participants may also be receiving services from other ETA workforce development programs that provide targeted assistance to those seeking to rejoin the workforce
ES Only 10124458
UI-ES Overlap 6495485
UI Only 2451464
Other ETA Programs
7184946 WIA Adults
802386 WIA Dislocated Workers
394399 Registered Apprenticeship1
268359 Community Based Job Training Grants2
197045 WIA Youth
109627 Job Corps3
67814 Senior Community Service Employment Program
62706 Trade Adjustment Assistance
52532 H-1B Technical Skills Training Grants2
37329 National Emergency Grants
36498 Indian and Native American Adult Program4
35192 National Farmworker Jobs Program
7604 YouthBuild
6884 Youthful Offender Initiative
6861 Green Jobs Innovation Fund Grants2
6308 Reintegration of Ex-Offenders - Adult5
3604 Indian and Native American Youth6
2197 H-1B Jobs and Innovation Accelerator Challenge Grants2
Data presented using logarithmic scale in base 10
1 Source Count includes all active completed and cancelled apprentices tracked by Apprenticeship US Military Apprentices Program and State Apprenticeship Agency (SAA) States
2 Data reflect program-to-date performance 3 All participants include the number of students active on the start date number of students enrolled during the timeframe
number of graduates separated prior to start date and in the placement service window during the timeframe and number of former enrollees separated prior to the start date and in the placement service window during the timeframe
4 Number includes self-service individuals 5 Program-to-date as of program inception in Spring 2006 6 Data reflective of the period from April 1 2013 through March 31 2014 most recent data available
WORKFORCE SYSTEM RESULTS 2
WORKFORCE SYSTEM RESULTS
Current Appropriations
In general the following resources are used to operate authorized workforce investment programs Although this report generally presents quarterly results the figures below represent annual appropriations This report for the quarter ending June 30 2014 covers programs operating in Program Year 2013 (July 1 2013 through June 30 2014) and programs operating in Fiscal Year 2014 (October 1 2013 through September 30 2014) The funding displayed is from both the Fiscal Year 2013 appropriation and Fiscal Year 2014 appropriation Apprenticeship TAA and UI run on a Fiscal Year cycle whereby June 30 2014 is the end of the third quarter of Fiscal Year 2014 All other programs run on the Program Year from July 1 to June 30 whereby June 30 2014 is the end of the fourth quarter of Program Year 2013
FY 2014 amp PY 2013 Workforce Investment Resourcesab
Apprenticeship1 $30000000
Women in Apprenticeship $944182
Dislocated Worker National Reserve2 $224066428
Indian and Native American Adult Program3 $36477500
Job Corps (Operations)4 $1323563463
National Farmworker Jobs Program5 $74033084
Senior Community Service Employment Program $424804974
Trade Adjustment Assistance Training6 $306268000
Unemployment Insurance (UI) Administration $2861575000
Wagner-Peyser ActEmployment Service (ES) $664183664
WIA Adult7 $730624342
WIA Dislocated Workers Formula Grant7 $955591379
Reintegration of Ex-Offenders $76054843
Youth Activities8 $777534561
Indian and Native American Youth Program8 $7879901
WIA Youth (Older and Younger) $769654660
YouthBuild $75534502
Workforce Innovation Fund $47303671
TOTAL $8608559593
Notes a The Consolidated and Further Continuing Appropriations Act 2013 (PL 113-6) included a 02 rescission on all FY 2013
discretionary funds in the Act as part of an agency adjustment associated with sequestration b Section 251A of the Balanced Budget and Emergency Deficit Control Act (BBEDCA) as amended on March 1 2013 required
the President to issue a sequestration order canceling some budgetary resources for the remainder of FY 2013 In this table sequestration impacted all PY 2013 programs except the Dislocated Worker National Reserve Sequestration reductions only impacted TAA Training for the FY 2014 programs included in this table
1 Registered Apprenticeship programs are funded by employers and do not receive specific program appropriations The resources listed above support Federal staff who provide technical assistance for Registered Apprenticeship programs
2 The Dislocated Worker (DW) National Reserve contains funds for national emergency grants demonstrations technical assistance and training outlying areas Dislocated Worker programs and special assistance for AdultsDislocated Worker programs
3 The total appropriation is $45082291 $8604791 was transferred to the Department of InteriorBureau of Indian Affairs for those Indian and Native American grantees per PL 102-477
4 The total appropriation is $1613872025 with $1487005642 for Operations $99310341 for Construction and $27556042 for expenses $163442179 was transferred from Operations to the Department of AgricultureForest Service
5 The total appropriation is $79896847 $5382212 is set aside for migrant and seasonal housing and $481551 is set aside for technical assistance and training
6 The total appropriation for Federal Unemployment Benefits and Allowances is $608768000 and includes $272000000 for TAA benefits and $30500000 for Wage Insurance
7 ETA elected to absorb the reductions associated with the 2 rescission and sequestration in FY 2013 in the PY 2013 base (July 1 2013) funding amounts for the Adult and Dislocated Worker programs
8 The total Youth Activities appropriation is $781375289 the total Indian and Native American Youth Program appropriation is $11720629 of which $3840728 was transferred to the Department of InteriorBureau of Indian Affairs per PL 102shy477
3
WORKFORCE SYSTEM RESULTS
Government Performance and Results Act Goals (GPRA) httpwwwdoletagovperformancegoalsgpracfm
On January 4 2011 President Obama signed HR 2142 the ldquoGPRA Modernization Act of 2010rdquo which became Public Law 111-352 The new law required Federal agencies to set clear performance goals that can be accurately measured and publicly reported in a more transparent way The following table contains performance indicators arrayed by program which represent the key results that ETA programs work to achieve Performance goals for the employment and training programs listed are established in the budget process The goals are set at the higher end to be ldquoambitiousrdquo within the context of prior performance Since the program performance goals are nationwide goals they may not apply in every instance to individual States or grantees where different economic or other circumstances may demand an adjustment in performance expectations
The following table reflects Program Year 2013 (July 1 2013 - June 30 2014) goals for most programs and Fiscal Year 2014 (October 1 2013 - September 30 2014) goals for Foreign Labor Certification Unemployment Insurance Trade Adjustment Assistance and Registered Apprenticeship Programs Cost per Participant is not displayed because it is an annual measure
Government Performance and Results Act Goals Annual Goal Results as of 0630141
Foreign Labor Certification
Percent of H-1B Applications Resolved in Seven Business Days 100 100
Average Number of Days to Resolve PERM Applications Not Subject to Integrity Review 150-225
Average Number of Days to Resolve PERM Applications Subject to Integrity Review (Audit) 350-450
Percent of H-2A Applications with No Deficiencies Resolved 30 Days Before the Date of Need2 80 89
Percent of H-2B Applications Resolved Within 30 Days 90 97
194
424
Indian and Native American Adult Program3
Entered Employment Rate 635 632
Employment Retention Rate 780 794
Six Monthsrsquo Average Earnings $9959 $9476
Indian and Native American Youth Program4
Education Attainment for Dropouts NA 22
Participants Who Attained Two or More Goals NA 927
Job Corps
Placement in Employment or Education Rate Placement in Employment or Education Rate 650 767
Attainment of Degree or Certificate Rate 580 668
Percentage of Students Who Achieve Literacy or Numeracy Gains 620 661
National Electronic ToolsEmployment and Training Administration (ETA) Internet Based Assistance
Combined Site Visits for CareerOneStop Americarsquos Service Locator and ONET 55000000 67733513
4
WORKFORCE SYSTEM RESULTS
Government Performance and Results Act Goals Annual Goal Results as of 0630141
National Farmworker Jobs Program (NFJP)
Entered Employment Rate 861 881
Employment Retention Rate 832 856
Six Monthsrsquo Average Earnings $10501 $10855
Reintegration of Ex-Offenders (formerly Prisoner Reentry Initiative)5
Entered Employment Rate 593 58
Employment Retention Rate 681 72
Six Monthsrsquo Average Earnings $10072 $9770
Percent of Participants Re-arrested for a New Crime or Re-incarcerated for Revocation le22 11
of Parole or Probation Violation within One Year from Release from Prison
Registered Apprenticeship
Entered Employment Rate 747 742
Employment Retention Rate 875 878
Six Monthsrsquo Average Earnings $24754 $24387
Senior Community Service Employment Program
Entered Employment Rate 428 441
Employment Retention Rate 734 721
Six Monthsrsquo Average Earnings $7396 $7127
Trade Adjustment Assistance6
Entered Employment Rate 699 729
Employment Retention Rate 911 911
Six Monthsrsquo Average Earnings $19436 $17828
Wagner-Peyser Employment Service
Entered Employment Rate 538 56
Employment Retention Rate 811 82
Six Monthsrsquo Average Earnings $14642 $14494
Unemployment Insurance
Percent of Intrastate Payments Made Timely 871 812
Detection of Recoverable Overpayments 542 598
Entered Employment Rate for Unemployment Insurance Claimants 647 627
5
WORKFORCE SYSTEM RESULTS
Government Performance and Results Act Goals Annual Goal Results as of 0630141
Percent of Employer Tax Liability Determinations Made Timely 889 886
Workforce Investment Act Adult Program
Entered Employment Rate 612 611
Employment Retention Rate 820 828
Six Monthsrsquo Average Earnings $13684 $13842
Workforce Investment Act Dislocated Worker Program
Entered Employment Rate 612 60
Employment Retention Rate 844 838
Six Monthrsquos Average Earnings $16364 $15997
Workforce Investment Act Youth Program
Placement in Employment or Education Rate 664 690
Attainment of Degree or Certificate Rate 623 684
Percentage of Students Who Achieve Literacy and Numeracy Gains of One Adult Basic Education Level 469 525
YouthBuild7
Placement in Employment or Education Rate 500 519
Attainment of Degree or Certificate Rate 672 672
Percentage of Students Who Achieve Literacy and Numeracy Gains 585 595
Workforce Investment Act Youthful Offender Initiative
Placement Rate for Youth Ages 18 and Above8 352 362
Recidivism Rate for Youth Ages 14 to 17 16 24
Recidivism Rate for Youth Ages 18 to Above 17 16
1 Cumulative four quarters unless otherwise indicated 2 H-2A Measure changed Q2 FY 2014 3 Entered Employment Rate is based on Unemployment Insurance Wage Record and Grantee Supplemental Data for the exit cohort
October 1 2012 ndash September 30 2013 Employment Retention Rate is based on Unemployment Insurance Wage Record and Grantee Supplemental Data for the exit cohort April 1 2012 ndash March 31 2013 Six Monthsrsquo Average Earnings are based on Unemployment Insurance Wage Record only for the exit cohort April 1 2012 ndash March 31 2013
4 Data reported semi-annually and annually Results above are reflective of the period from April 1 2013 through March 31 2014 5 Results are cumulative for currently operating projects 6 The results are for Fiscal Year 2014 (October 1 2013 ndash September 30 2014) 7 The results are program-to-date for the aggregate of all grant cycles of YouthBuild beginning with the 2007 grant class 8 Program-to-date for currently operating projects
6
WORKFORCE SYSTEM RESULTS
Additional Program Year 2013 Quarterly Data
100 $15000
80 $13000
60 $11000
40 $9000
20 $7000
0 Sep-12 Dec-12 Mar-13 Jun-13 Sep-13 Dec-13 Mar-14 Jun-14
$5000
n Entered Employment Rate n Employment Retention Rate n Six Months Average Earnings
Indian and Native American Adult Program (INAP) httpwwwdoletagovdinap
Program Description The Indian and Native American Program (INAP) provides employment and training grants to Indian Tribes nonprofit tribal organizations Alaska Native entities and Native Hawaiian organizations with comprehensive employment and training services designed to increase the ability of program participants to compete in the new global economy and promote the economic and social development of Indian Alaska Native and Native Hawaiian communities
Quarter Highlights In Program Year 2013 the grantee community and Native American Employment and Training Council to the Secretary of Labor implemented a Pilot Study on credential attainments an innovative effort several years in the making As a result the number of exiters in Program Year 2013 94 percent attained a credential (degree or industry-wide certifications) When tracking exiters who were not in a training program leading to credential while on the program 401 percent received a credential
Analysis Using current wage record data
bull The Entered Employment Rate for the 12 month period ending June 30 2014 was 632 percent an increase of 11 percentage points when compared to the same time period last year
bull The Employment Retention Rate for the 12 month period ending June 30 2014 was 794 percent an increase of 15 percentage points when compared to the same period last year
bull The Six Monthsrsquo Average Earnings for the 12 month period ending June 30 2014 was $9476 a decrease of $195 when compared to the same period last year
Using current grantee supplemental data
bull This quarter 6795 participants received services and 477 participants entered employment Those entering employment decreased by 47 when compared to the same period last year
bull INAP served 11982 individuals during the 12 month period ending on June 30 2014 a decrease of 911 people when compared to the same time period last year
bull Including self-service individuals INAP served 36498 people a decrease of 665 people served when compared to the same period last year
bull 2303 individuals received Work Experience training for the 12 month period ending June 30 2014 an increase of 1206 people when compared to the same period last year
bull 5467 individuals received training services an increase of 403 when compared to the same period last year Of those 142 received On-the-Job Training
bull The percentage of participants who received credentials during the 12 month period ending June 30 2014 is 94 percent and the number of Veterans served is 161
Program Performance
Performance Measure Four Quarters
Ending 063013 Four Quarters
Ending 063014 Entered Employment Rate 621 632
Employment Retention Rate 779 794
Six Months Average Earnings $9671 $9476
Entered Employment Rate is based on Unemployment Insurance Wage Record and Grantee Supplemental Data for the exit cohort October 1 2012 ndash September 30 2013 The Employment Retention Rate is based on Unemployment Insurance Wage Record and Grantee Supplemental Data for the exit cohort April 1 2012 ndash March 31 2013 Six Monthsrsquo Average Earnings are based on Unemployment Insurance Wage Record Data for the exit cohort April 1 2012 ndash March 31 2013
Performance Measure Four Quarters
Ending 093013 Four Quarters
Ending 123113 Four Quarters
Ending 033114
Entered Employment Rate 610 621 622
Employment Retention Rate 784 787 790
Six Monthsrsquo Average Earnings $9746 $9623 $9557
Performance in the Past Eight Quarters
7
WORKFORCE SYSTEM RESULTS
100 $15000
80 $13000
60 $11000
40 $9000
20 $7000
0 Sep-12 Dec-12 Mar-13 Jun-13 Sep-13 Dec-13 Mar-14 Jun-14
$5000
n Entered Employment Rate n Employment Retention Rate n Six Months Average Earnings
National Farmworker Jobs Program (NFJP) httpwwwdoletagovFarmworkerhtmlNFJPcfm
Program Description The National Farmworker Jobs Program (NFJP) assists migrants other seasonally employed farmworkers and their families in achieving economic self-sufficiency and stability through job training and other services that address their employment related needs New job skills training in occupations with higher wages are offered as well as supportive services that help farmworkers stabilize their employment in agriculture Assistance from the NFJP is accessed directly through the grantee organizations and local American Job Centers
Quarter Highlights David came to the Proteus Visalia Service Center in California in April 2014 in search of employment and training services David was a high school graduate with limited job skills and worked as a seasonal farmworker David enrolled in the NFJP and received career assessment case management and energy efficiency training services After several months David successfully graduated and was hired as a junior solar installer by Solar City He is now working full-time earning $1300 per hour
Program Performance
Performance Measure Four Quarters
Ending 063013 Four Quarters
Ending 063014
Entered Employment Rate 855 881
Employment Retention Rate 831 856
Six Monthsrsquo Average Earnings $10533 $10855
Additional Program Year 2013 Quarterly Data
Performance Measure
Four Quarters
Ending 093013
Four Quarters
Ending 123113
Four Quarters
Ending 033114
Entered Employment Rate 862 876 884
Employment Retention Rate 836 840 850
Six Monthsrsquo Average Earnings $10439 $10433 $10605
Performance in the Past Eight Quarters
Analysis bull The Entered Employment Rate of 881 percent exceeds the programrsquos performance goal of
861 percent and is a 26 percentage point improvement from the same quarter one year ago bull The Employment Retention Rate of 856 percent exceeds the performance goal of 832
percent and shows a 25 percentage point improvement from the same quarter one year ago bull The Six Months Average Earnings result of $10855 exceeds the programrsquos performance
goal of $10501 and is $322 more when compared to the same reporting period one year ago
8
WORKFORCE SYSTEM RESULTS
100 $8000
80
60 $7000
40 $6000
20
0
n Entered Employment Rate n Employment Retention Rate n Six Month
Dec-13Sep-13Jun-13Mar-13 Dec-12Sep-12 $5000
s Average Earnings
Jun-14Mar-14
Senior Community Service Employment Program (SCSEP) httpwwwdoletagovseniors
Program Description Authorized by the Older Americans Act of 1965 the Senior Community Service Employment Program (SCSEP) is designed to foster individual economic self-sufficiency and promote useful opportunities in community service employment for unemployed low-income persons (particularly persons who have poor employment prospects) who are age 55 or older and to increase the number of persons who may benefit from unsubsidized employment in the public and private sectors
Quarter Highlights A former Vietnam Veteran Mr S and his wife returned to a small town in New Mexico to take care of his ailing parents During the next couple of years his parents passed away his wife died unexpectedly and he lost the family home Homeless Mr S did odd jobs in the community in exchange for necessities Eventually a member of his church gave him a room and told him about Goodwill Industries of Central New Mexicorsquos SCSEP program Goodwill placed Mr S in a training site at the local community center where he had already developed strong relationships with staff and guests The money he earned from SCSEP allowed him to move into an apartment Through the program Mr S developed confidence in his skills and abilities and with the help of Goodwillrsquos SCSEP staff he obtained a job at the local Goodwill store where he currently manages the donation site He says he loves his job and with his salary can afford a much better place to live Mr S continues to volunteer at the local community center by shopping for elderly in the community
Program Performance
Performance Measure Four Quarters
Ending 063013 Four Quarters
Ending 063014
Entered Employment Rate 425 452
Employment Retention Rate 744 731
Six Monthsrsquo Average Earnings $7163 $7446
Additional Program Year 2013 Quarterly Data
Performance Measure
Four Quarters
Ending 093013
Four Quarters
Ending 123113
Four Quarters
Ending 033114
Entered Employment Rate 427 428 433
Employment Retention Rate 722 712 702
Six Monthsrsquo Average Earnings $7329 $7437 $7378
Performance in the Past Eight Quarters
Analysis In Program Year 2013 67814 people were served by the program and 12 percent of those people were Veterans SCSEP participants recorded 35746097 hours of community service Six Monthsrsquo Average Earnings are higher than a year ago which is expected with a recovering economy Eighty-eight percent of participants were at or below poverty level Comparing Program Year 2013 with Program Year 2012
bull The Entered Employment Rate increased 27 percentage points from one year ago bull The Employment Retention Rate decreased 13 percentage points from one year ago bull Six Monthsrsquo Average Earnings increased almost four percentage points from one year ago
9
WORKFORCE SYSTEM RESULTS
100
80
60
40
20
0 Sep-12 Dec-12 Mar-13 Jun-13 Sep-13 Dec-13 Mar-14 Jun-14
n Entered Employment Rate n Employment Retention Rate n Six Months Average Earnings
$15000
$13000
$11000
$9000
$7000
$5000
Wagner-Peyser Employment Service httpwwwdoletagovProgramsWagner_Peysercfm
Program Description Wagner-Peyser Employment Service is an integral part of the American Job Center network formerly known as One-Stop Career Centers delivery system which provides universal access to workers job seekers and businesses The Employment Service focuses on providing a variety of employment related services including but not limited to job search assistance job referral and placement assistance for job seekers reshyemployment services to unemployment insurance claimants and recruitment services to employers with job openings Services are provided in one of three modes of delivery approaches self-service facilitated self-help service and staff-assisted service
Quarter Highlights When Mylan Pharmaceuticals Inc the third largest generic and pharmaceuticals company in the world needed to increase its production team at its Morgantown West Virginia location it was receiving over 100000 resumes and was overwhelmed with interested job seekers for openings to fill Plant Manufacturing Laborer positions With a starting pay of $1800 per hour the positions at Mylan are very attractive and turned to WorkForce (WF) West Virginia for labor exchange assistance beginning a success story of cooperation between private industry and a State agency WF West Virginia was able to help screen job seekers for Mylan and the plant hired 177 participants including 21 Veterans a higher representation than overall Veterans in the labor force (118 percent versus approximately seven percent)
Program Performance
Performance Measure Four Quarters
Ending 063013 Four Quarters
Ending 063014
Entered Employment Rate 530 560
Employment Retention Rate 810 820
Six Monthsrsquo Average Earnings $14252 $14515
Additional Program Year 2013 Quarterly Data
Performance Measure
Four Quarters
Ending 093013
Four Quarters
Ending 123113
Four Quarters
Ending 033114
Entered Employment Rate 530 530
Employment Retention Rate 810 810
Six Monthsrsquo Average Earnings $14129 $14175
Performance in the Past Eight Quarters
540
810
$14265
Analysis bull Over 16 million people received services from the Wagner-Peyser Employment Service
between July 1 2013 and June 30 2014 bull Over 11 million Veterans received services between July 1 2013 and June 30 2014 bull Nearly 35 million unemployed individuals entered employment after receiving services
from the Employment Service between July 1 2013 and June 30 2014
10
WORKFORCE SYSTEM RESULTS
100 $15000
80 $13000
60 $11000
40 $9000
20 $7000
0 Jun-12 Jun-13 Jun-14
$5000
n Entered Employment Rate n Employment Retention Rate n Six Months Average Earnings
Workforce Investment Act Adult Program httpwwwdoletagovprogramsgeneral_infocfm
Program Description The Workforce Investment Act (WIA) Adult Program helps prepare low-skill adult workers for good jobs through formula grants to States States use the funds to provide employment and training services through a network of American Job Centers of which there were nearly 2500 across the United States as of June 30 2014
WIA provides employment and training services at three broad service levels to job seeker customers core intensive and training These services are provided at a level which most efficiently meets their needs to achieve gainful employment The program is also designed to assist employer customers meet their needs for skilled workers
Adult Programs serve the broadest range of individuals including but not limited to public assistance recipients Unemployment Insurance claimants Veterans people with disabilities dislocated workers migrant and seasonal farmworkers Indian and Native Americans and workers age 55 or older
Quarter Highlights In Virginia the GoodwillWIA Adult program assists with the funding for Patient Care Technician (PCT) training provided by Fast Track Health The cost of training is approximately $3450 and the training is eleven weeks in duration This training provides a certificate in CNA EKG CPR and Phlebotomy with the certificationlicensing costs included in the overall training cost Ms O was referred to the WIA Adult program by a local Virginia Employment Commission representative She attended an orientation and started the process of changing her life that very day Ms O excelled and received a 100 percent increase in salary after completing training through this program with Fast Track Ms O stated of her experience ldquoI am very happy with my new career and very grateful for Goodwill and the WIA Adult program for providing [me] with this opportunity to enter a career with so much potential for advancementrdquo
Analysis bull In Program Year 2013 the WIA Adult program served 7184946 participants and over
150000 participants received training services bull Participants who received training services had a 761 percent Entered Employment
Rate in Program Year 2013 15 percentage points higher than the overall Entered Employment Rate of 611 percent
Program Performance
Performance Measure
Four Quarters
Ending 063012
(Program Year 2011)
Four Quarters
Ending 063013
(Program Year 2012)
Four Quarters
Ending 063014
(Program Year 2013)
Entered Employment Rate 572 599 611
Employment Retention Rate 808 819 828
Six Monthsrsquo Average Earnings $13482 $13335 $13842
Performance in the Past Three Program Years
11
WORKFORCE SYSTEM RESULTS
100 $19000
$1700080
$15000 60 $13000
$1100040 $9000
20 $7000
0 $5000 Jun-12 Jun-13 Jun-14
n Entered Employment Rate n Employment Retention Rate n Six Months Average Earnings
Workforce Investment Act Dislocated Worker Program httpwwwdoletagovprogramsgeneral_infocfm
Program Description The Workforce Investment Act Dislocated Worker Program funds services to support the reemployment of laid-off workers The Department of Labor allocates 80 percent of funds by formula to the States The Secretary of Labor may use the remaining 20 percent for National Emergency Grantsmdashthese specially targeted funds can infuse resources to areas suffering most from plant closings mass layoffs or job losses due to natural disasters or military base realignment and closures States allocate their Dislocated Worker funds to their local workforce investment areas Additionally the program allows for States to reserve up to 25 percent of their Dislocated Worker funds for Rapid Response activities Rapid Response is a pro-active business-focused and flexible strategy to help growing companies access an available pool of skilled workers and can respond to layoffs by quickly coordinating services and aid to companies and their workers
Program Performance
Performance Measure
Four Quarters
Ending 063012
(Program Year 2011)
Four Quarters
Ending 063013
(Program Year 2012)
Four Quarters
Ending 063014
(Program Year 2013)
Entered Employment Rate 611 600 600
Employment Retention Rate 842 843 838
Six Monthsrsquo Average Earnings $16500 $15930 $15997
Performance in the Past Three Program Years
Quarter Highlights After Kyle was laid off he was able to utilize an On-the-Job Training (OJT) opportunity with Tyson He now works the second shift from 1-9 pm and was able to obtain the technical training he felt he did not obtain from prior employment or education ldquoI wanted to get more experience on how things technically operate and this program is the perfect fit for merdquo Kyle said And in the end Tyson gained a skilled employee
Analysis bull The Dislocated Worker program served over 800000 participants in Program Year 2013
and provided training services to 109148 participants bull Participants who received training had an 814 percent Entered Employment Rate 214
percentage points higher than the overall Entered Employment Rate of 60 percent
12
WORKFORCE SYSTEM RESULTS
500 100
400 80
300 60
Days
200 40
100 20
0 0 Jun-13 Sep-13 Dec-13 Mar-14 Jun-14
n Average Number of Days to Resolve PERM Applications Not Subject to Integrity Review n Average Number of Days to Resolve PERM Applications Subject to Integrity Review (Audit) n Percent of H1-B Applications Processed within Seven Days of Filing
H-1B and Permanent Foreign Labor Certification (PERM) httpwwwforeignlaborcertdoletagov
Program Description Performance in the Past Five Quarters
H-1B certification permits employers to hire on a temporary basis foreign workers who possess qualifying professional or specialty skills The PERM program allows employers to begin the process for permanently hiring a foreign worker when there are not sufficient numbers of US workers who are able willing qualified and available to perform the job In addition the program ensures that the employment of the foreign worker does not adversely affect the wages and working conditions of American workers who are similarly employed
Program Performance
Performance Measure Four Quarters
Ending 063013 Four Quarters
Ending 063014
Percent of H-1B Applications Resolved in Seven Business Days
100 100
Quarter Highlights Average number of days to resolve PERM applications not subject to integrity review
129 194
The percent of employer applications processed within seven days of filing under the H-1B program sustains at approximately 100 percent ending in June 30 2014
Average number of days to resolve PERM applications subject to integrity review (Audit)
294 424 The Office of Foreign Labor Certification (OFLC) continues to allocate staff resources for the PERM program to increase program integrity by conducting more audit examinations and supervised recruitments This increased emphasis on program integrity has had an effect on processing timeliness
Additional Program Year 2013 Quarterly Data
Performance Measure
Four Quarters
Ending 093013
Four Quarters
Ending 123113
Four Quarters
Ending 033114
Analysis bull The number of H-1B applications processed within seven business days held steady
at 100 percent from the same four quarter reporting period one year ago Of the total 103032 H-1B applications processed over the past four quarters 103032 were completed within seven business days of the filing date
Percent of H-1B Applications Resolved in Seven Business Days
100 804 996 bull The average number of days to resolve PERM applications not subject to integrity review decreased by 20 percent compared to the previous quarter and the average number of days to resolve PERM applications subject to integrity review (Audits) decreased by four percent compared to the previous quarter
Average number of days to resolve PERM applications not subject to integrity review
178 237 234
Average number of days to resolve PERM applications subject to integrity review (Audit)
320 423 444
13
WORKFORCE SYSTEM RESULTS
100
80
60
40
20
0 Jun-13 Sep-13 Dec-13 Mar-14 Jun-14
n Percent of Accepted H-2A Applications Without Deficiencies Resolved by 30 Days Before the Date of Need n Percent of H-2B Applications Resolved Within 30 Days of Receipt
H-2A and H-2B Foreign Labor Certification Programs httpwwwforeignlaborcertdoletagov
Program Description H-2A labor certification permits employers to hire foreign workers on a temporary basis for the agricultural sector of the economy H-2B labor certification permits employers to hire foreign workers to come to the United States and perform temporary nonagricultural work which must be one-time seasonal peak load or intermittent in nature
Program Performance
Performance Measure Four Quarters
Ending 063013 Four Quarters
Ending 063014
Percent of Complete H-2A Employer Applications Resolved Within 30 Days Before the Date of Need
NA 97
Percent of H-2B Applications Resolved Within 30 Days
23 97
Additional Program Year 2013 Quarterly Data
Performance Measure
Four Quarters
Ending 093013
Four Quarters
Ending 123113
Four Quarters
Ending 033114
Percent of Complete H-2A Employer Applications Resolved Within 30 Days Before the Date of Need
NA NA 84
Percent of H-2B Applications Resolved Within 30 Days
98 92 99
The Percent of Complete H-2A Employer Applications Resolved Within 30 days Before the Date of Need measure was changed in the second quarter of Fiscal Year 2014
Performance in the Past Five Quarters
Quarter Highlights The Office of Foreign Labor Certification (OFLC) continues to resolve approximately 971 percent of complete H-2A applications on time The processing rates have improved in spite of an increase in the numbers of applications filed during this reporting period FY 2014 when compared to one year ago
Employer filings under the H-2B program have increased 167 percent this reporting period compared to the same four quarter reporting period one year ago
Analysis bull The percentage of H-2A applications resolved within 30 calendar days increased 125
percentage points from the previous quarter Of the 3845 total of H-2A applications processed in Fiscal Year 2014 908 percent were resolved within 30 calendar days of the filing date
bull The percentage of H-2B applications processed within 30 calendar days increased when compared with the same reporting period one year ago Of the 5188 H-2B applications processed within the last four quarters 998 percent of them were processed within 60 calendar days of the filing date
14
WORKFORCE SYSTEM RESULTS
100
80
60
40
20
0 Sep-12 Dec-12 Mar-13 Jun-13 Sep-13 Dec-13 Mar-14 Jun-14
$15000
$13000
$11000
$9000
$7000
$5000
n Entered EmploymentPlacement Rate n Employment Retention Rate n Six Months Average Earnings
Reintegration of Ex-Offenders (RExO-ADULT) httpwwwdoletagovRExOeta_defaultcfm
Program Description The Reintegration of Ex-Offenders ndash Adult Program (RExO-Adult) is an employment-centered program that seeks to strengthen urban communities that have large numbers of returning prisoners The program incorporates mentoring job training and other comprehensive transitional services It is designed to reduce recidivism by helping inmates find work when they return to their communities as part of an effort to improve community life
Quarter Highlights The Adult RExO Program operated three initiatives this program year
bull Grants to community and faith-based organizations to help returning offenders find employment
bull Grants aimed specifically at serving female offenders providing employment and supportive services
bull Grants to provide occupational training and job placement to offenders in Halfway Houses
Program Performance
Performance Measure Quarter Ending
063013
Quarter Ending
063014
Entered Employment Rate
58 58
Employment Retention Rate
68 72
Six Monthsrsquo Average Earnings
$9797 $9770
The data for June 30 2013 are program-to-date since the inception of the program in the Spring of 2006 The June 30 2014 numbers are program-to-date for currently operating projects
Additional Program Year 2013 Quarterly Data
Performance Measure Quarter Ending
093013
Quarter Ending
123113
Quarter Ending
033114
Entered Employment Rate
55 56
Employment Retention Rate
66 68 70
Six Monthsrsquo Average Earnings
$10036 $9962 $9736
Performance in the Past Eight Quarters
58
Analysis The Adult RExO Program served 6308 participants this program year
bull Adult RExO Grantees reported 3404 enrollees receiving training or education bull Adult RExO Grantees reported 2555 enrollees receiving a certificate bull The recidivism rate largely reflects the extent to which the program is serving persons
at high or low risk of re-offending
15
WORKFORCE SYSTEM RESULTS
Registered Apprenticeship httpwwwdoletagovoa
Program Description Registered Apprenticeship is a leader in preparing American workers to compete in a global 21st Century economy With a network of over 150000 employers in more than 1000 occupations Registered Apprenticeship has already trained millions of Americarsquos workers Modern apprenticeships are now on the cutting edge of innovation in preparing a skilled workforce for todayrsquos industries including expanding industries like health care information technology transportation telecommunications and advanced manufacturing as well as in industries like construction where apprenticeships have a long and successful history
Quarter Highlights During the summer of 2014 the White House hosted the first-ever Summit on Apprenticeship to gather the best ideas and to catalyze action to dramatically increase apprenticeship in America More than 60 attendees presented their ideas including leading employers big and small like IBM Bank of America Blue CrossBlue Shield and Oberg Industries labor unions like the International Brotherhood of Electrical Workers (IBEW) training providers like Ivy Tech and Lone Star Community Colleges and local workforce leaders The event was the apex in a series of industry roundtables on apprenticeship which took place across the country during June amp July 2014
Program Performance
Performance Measure Four Quarters
Ending 063013 Four Quarters
Ending 063014
Entered Employment Rate 734 742
Employment Retention Rate 873 878
Six Monthsrsquo Average Earnings $23826 $24387
Performance Measure Quarter Ending
063013 Quarter Ending
063014
Apprentices
Total Apprentices (Active Apprentices)
148039 152582
New Apprentices 17432 17011
Programs
New Programs 139
Programs Maintained Total (Active Programs)
9809 9077
Number of new programs in Construction and Manufacturing
93
Source Registered Apprenticeship Partners Information Management Data System (RAPIDS) data managed by Department of Labor staff only 063013 data has been revised to include federal data only Running total of active apprenticesprograms during the quarter
16
177
127
WORKFORCE SYSTEM RESULTS
0
20
40
60
80
100
Sep-12 Dec-12 Mar-13 Jun-13 Sep-13 Dec-13 Mar-14 Jun-14 $5000 $7000 $9000 $11000 $13000 $15000 $17000 $19000 $21000 $23000 $25000
n Entered Employment Rate n Employment Retention Rate n Six Months Average Earnings
Registered Apprenticeship httpwwwdoletagovoa
Additional Program Year 2013 Quarterly Data
Performance Measure
Four Quarters
Ending 093013
Four Quarters
Ending 123113
Four Quarters
Ending 033114
Entered Employment Rate 735 738 738
Employment Retention Rate 874 877 878
Six Monthsrsquo Average Earnings $24171 $24324 $24378
Performance in the Past Eight Quarters
Analysis bull During the third quarter of Fiscal Year 2014 there were over 394000 active apprentices
nationwide while over 13000 program participants completed their apprenticeship and received a credential that is portable industry recognized and can provide a pathway to middle-class and sustainable careers
bull The Entered Employment Rate for participants who completed their Registered Apprenticeship program was 856 percent 114 percentage points higher than for all program exiters who either completed or cancelled (742 percent as shown in table on the previous page)
bull The Employment Retention Rate for program completers was 910 percent 32 percentage points higher than for all program exiters (878 percent as shown in table on the previous page)
bull The Six Monthsrsquo Average Earnings for program completers was $29964 which is over $5577 more than that of all program exiters (ie completers or those who cancelled) The results for those completing the program shows it pays to stay
17
WORKFORCE SYSTEM RESULTS
100
80
60
40
20
0 Sep-12 Dec-12 Mar-13 June-13 Sep-13 Dec-13 Mar-14 Jun-14
n Entered Employment Rate n Employment Retention Rate n Six Months Average Earnings
$25000
$21000
$17000
$13000
$9000
$5000
Trade Adjustment Assistance (TAA) httpwwwdoletagovtradeact
Program Description The Trade Adjustment Assistance (TAA) Program is an integral part of the comprehensive workforce development system The program is essential to helping workers dislocated by foreign trade to adjust to changing market conditions and shifting skill requirements Addressing the needs of trade-affected workers involved in this transformation is a unique challenge because in general these workers are being dislocated from relatively outdated-skill high-wage employment In many cases this is complicated by mass layoffs or plant closures that occur in single-industry towns which makes finding comparable employment in the same geographic area difficult Furthermore many of these jobs are lost permanently from the domestic economy requiring affected workers to completely retool their skills
Fiscal Year Highlights During Fiscal Year 2014 Massachusetts diligently trained staff at the local CareerOneStop Centers to ascertain a TAA participantrsquos eligibility for other funding resources to assist in their reemployment initiatives These improved efforts to provide and report reemployment services enables Trade customers to flow through the CareerOneStop Center system with other dislocated workers and receive seamless resources through the resource sharing initiatives of the Career Center methodology These streamlined reemployment services have resulted in an Entered Employment Rate of 815 percent nearly ten percentage points higher than the national average
Program Performance
Performance Measure FY 2011 FY 2012 FY 2013 FY 2014
Entered Employment Rate 653 689 716 729
Employment Retention Rate 897 913 917 911
Six Monthsrsquo Average Earnings $18319 $18837 $18099 $17828
Performance Measure Quarter Ending 063013 Quarter Ending 063014
Entered Employment Rate 733 728
Employment Retention Rate 900 927
Six Monthsrsquo Average Earnings $18210 $17692
Additional Program Year 2013 Quarterly Data
Performance Measure Quarter Ending
093013
Quarter Ending
123013
Quarter Ending
033014
Entered Employment Rate 713 713
Employment Retention Rate 918 918
Six Monthsrsquo Average Earnings $17499 $17499
Performance in the Past Eight Quarters
727
917
$17550
Analysis During Fiscal Year 2014 there were 62706 total participants receiving TAA benefits or services and 20577 exiters entered employment (729 percent) More than one-third of all participants were minorities with the average age of participants being 47 years and the average tenure being approximately 13 years 9547 exiter participants received credentials or 83 percent of all exiter participants who completed training 32527 participants received training or approximately 52 percent of all participants Lastly the program served 4828 Veteran participants accounting for approximately eight percent of all participants
18
WORKFORCE SYSTEM RESULTS
Unemployment Insurance (UI) httpouidoletagovunemploy
Program Description The federal-state Unemployment Insurance (UI) System minimizes individual and family financial hardship due to unemployment and stabilizes the economy during economic downturns by providing unemployed workers with temporary income support States operate their own Unemployment Insurance Programs regulated by State laws
As the Federal partner DOL provides program leadership allocates administrative funds provides technical assistance and exercises performance oversight
Quarter Highlights As the economy improved the system emphasized program integrity solvency and reemployment Claims rates decreased about 10 percent from the year before and Trust Fund loans decreased from $21 billion to $14 billion EUC benefit payments ceased on December 28 2013 Twenty-four states implemented Short-term Compensation programs allowing unemployed workers to stay on jobs while receiving partial unemployment benefits proportionate to reduced work hours States implemented systems to improve efficiency and reduce overpayments such as data exchange and recover UI overpayments By June 30 2014 42 states were recovering overpayments through Federal Income tax refund offset (TOP) and had recovered $370 million in 2014 (over $840 million since TOPrsquos inception)
Analysis During the year ending June 30 2014
bull 51 million UI claimants were reemployed in the quarter following their UI 1st payments (17 million in the last quarter)
bull The UI system met two and failed two of its four targets UI met detection of overpayments (643 percent vs target of 542 percent) and met reemployment (657 percent vs target of 647 percent)
bull The system fell short of its 1st pay and status targets because of retirements and other turnover of key staff
Program Performance
Performance Measure Four Quarters
Ending 063013 Four Quarters
Ending 063014
Percent of Intrastate Payments Made Timely
812 792
Detection of Recoverable Overpayments Rate
598 643
Facilitation of Reemployment Rate 6261 6552
Percent of Employer Tax Liability 888 882
Operational Results
Recipiency Rate 263 272
Exhaustion Rate 456 431
Percent of Recipients of Prime Working Age (25-54)
702 700
Percent of Recipients Who Are Female
434 437
New Initial Unemployment Insurance Claims
13906868 12501014
Number of First Unemployment Insurance Payments
8404507 7632522
Average Duration of Unemployment Insurance (Weeks)
169
1 Reemployment for year ending June 30 2013 2 Reemployment for year ending June 30 2014
19
167
WORKFORCE SYSTEM RESULTS
Unemployment Insurance (UI) httpouidoletagovunemploy
Additional Program Year 2013 Quarterly Data
Performance Measure Four Quarters
Ending 093013 Four Quarters
Ending 123113 Four Quarters
Ending 033114
Percent of Intrastate Payments Made Timely
809 802 793
Detection of Recoverable Overpayments Rate
590 630 603
Facilitation of Reemployment Rate 6311 6312 6363
Percent of Employer Tax Liability 886 885 884
Operational Results
Recipiency Rate 263 262 267
Exhaustion Rate 453 446 437
Percent of Recipients of Prime Working Age (25-54)
702 702 701
Percent of Recipients Who Are Female
434 434 435
New Initial Unemployment Insurance Claims
13559233 13340263 12947493
Number of First Unemployment Insurance Payments
8215687 7967852 7857395
Average Duration of Unemployment Insurance (Weeks)
169 169 168
1 Reemployment for year ending September 30 2013 2 Reemployment for year ending December 31 2013 3 Reemployment for year ending March 31 2014
20
WORKFORCE SYSTEM RESULTS
100
80
60
40
20
0 Sep-12 Dec-12 Mar-13 Jun-13 Sep-13 Dec-13 Mar-14 Jun-14
n Placement in Employment or Education n Attainment of a Degree or Certificate n LiteracyNumeracy Gains
Job Corps httpwwwjobcorpsgovhomeaspx
Program Description Job Corps is the nationrsquos largest residential educational and career technical training program for at-risk youth ages 16 through 24 The 125 Job Corps centers nationwide provide an integrated comprehensive array of services that include academic career technical and life skills training career planning and work-based learning health care and post-program placement and transition support
Job Corps is committed to offering all students a safe drug-free environment where they can take advantage of the resources provided Job Corpsrsquo mission is to attract eligible young people teach them the skills they need to become employable and independent and place them in meaningful jobs or further education
Program Performance
Performance Measure Four Quarters
Ending 063013 Four Quarters
Ending 063014
Placement in Employment or Education 746 767
Attainment of a Degree or Certificate 706 668
LiteracyNumeracy Gains 692 661
Additional Program Year 2013 Quarterly Data
Performance Measure
Four Quarters
Ending 093013
Four Quarters
Ending 123113
Four Quarters
Ending 033114
Placement in Employment or Education 757 760 765
Attainment of a Degree or Certificate 722 727 707
LiteracyNumeracy Gains 702 709 695
Performance in the Past Eight Quarters
The Performance in the Past Eight Quarters graph displays single quarter data versus the Program Performance tables which depict cumulative four quarter data
Quarter Highlights In May 2014 four Job Corps students from centers in Montana California Iowa and Virginia participated in the 2nd Asia-Pacific Economic Cooperation (APEC) Youth Skills Camp in Beijing and Guangzhou China the second time Job Corps students have participated in this event The camp included field visits to vocational training schools business enterprises and public practical training facilities as well as skills exchanges This international event provides students with life-changing experiences in travel diversity and first-hand exposure to global issues
Analysis bull During the current quarter Job Corps served 69979 participants including 13079 new
enrollees an increase of 801 percent overall compared to the same quarter in PY 2013 and due to the resumption of new enrollments after the PY 2012 enrollment suspensions The number of new students increased by over 200 percent from the same quarter in PY 2013
bull The proportion of 16-17 year olds served increased by 45 percentage points Conversely the proportion of all older students served similarly decreased from the same quarter in PY 2013
bull In the current quarter Job Corps placed 7203 students in Employment and Education a slight decrease of 04 percentage points compared to the same quarter last year In addition 8657 students attained a Certificate a 131 percentage point decrease compared to the same quarter in PY 2013 Also 6789 students attained a LiteracyNumeracy gain an 116 percentage point decrease over the same quarter in PY 2013
bull In the current quarter the program served 50 participants who were Veterans prior to enrollment bull When comparing the four quarter data Placement in Employment or Education increased
21 percentage points Attainment of a Degree or Certificate decreased 38 percentage points and LiteracyNumeracy Gains decreased 31 percentage points from the same quarter one year ago 21
WORKFORCE SYSTEM RESULTS
100
80
60
40
20
0 Sep-12 Dec-12 Mar-13 Jun-13 Sep-13 Dec-13 Mar-14 Jun-14
n Placement Rate for Out-of-School Youth Ages 18 and Above n Recidivism Rate for Youth Ages 14 to 17 n Recidivism Rate for Youth Ages 18 and Above
Workforce Investment Act Youthful Offender Initiative httpwwwdoletagovYouth_servicesyouthful_offendercfm
Program Description The Employment and Training Administration uses its Youthful Offender Appropriation to fund a variety of projects that target youth offenders and young adult offenders Currently operating projects include grants to community-based organizations to involve juvenile offenders in training and service learning projects grants to intermediary organizations to serve young offenders in high-poverty high-crime communities and grants to help youth enter diversion programs as an alternative to out-of-home placements and to assist eligible youth have their juvenile records sealed or expunged
Quarter Highlights The great majority of juvenile offenders are of ages 17 and below and many are still in high school The youth offender grants focus on helping younger youth stay in school and complete their education and helping older youth find jobs and succeed in the labor market Case management mentoring and supportive services are also provided by these grants
Performance in the Past Eight Quarters
Program Performance
Performance Measure Four Quarters
Ending 063013 Four Quarters
Ending 063014
Placement Rate for Youth Ages 18 and Above
36 362
Recidivism Rate for Youth Ages 14 to 17
35 24
Recidivism Rate for Youth Ages 18 and Above
34 16
Results are cumulative for currently operating grants
Additional Program Year 2013 Quarterly Data
Placement Rate for Youth Ages 18 and Above
277 334 325
Performance Measure
Four Quarters
Ending 093013
Four Quarters
Ending 123113
Four Quarters
Ending 033114
Recidivism Rate for Youth Ages 14 to 17
349 349 349
Recidivism Rate for Youth Ages 18 and Above
335 335 335
Analysis bull Providing opportunities to youthful offenders results in varying outcomes depending on
the mix of projects being operated in a given year bull Projects have markedly different placement and recidivism rates depending on whether
they are serving young adults in their 20s or youth ages 16-17 they recruit youth in the community or through direct referrals from the juvenile justice system whether they are located in small or large cities and the extent to which enrollees are at high or low risk of re-offending
22
WORKFORCE SYSTEM RESULTS
100
80
60
40
20
0 Jun-12 Jun-13 Jun-14
n Placement in Employment or Education n Attainment of a Degree or Certificate n LiteracyNumeracy Gains
Workforce Investment Act Youth Program httpwwwdoletagovyouth_services
Program Description The Workforce Investment Act Youth Formula Program provides employment and education services to eligible low-income youth ages 14 to 21 who face barriers to employment The program serves in-school and out-of-school youth youth with disabilities and low literacy rates as well as others who may require additional assistance to complete an educational program and acquire an industry-recognized credential or enter employment
Quarter Highlights The passage of the Workforce Innovation and Opportunity Act (WIOA) includes a major shift in focus to spending more funds on and serving more out-of-school youth (OSY) The workforce system demonstrated its readiness for this shift in that 48 percent of all youth served in PY 2013 were OSY and 57 percent of all WIA youth local area funds were spent on OSY So far in Program Year 2013 California has spent almost 65 percent of their WIA youth funds on OSY with high levels of OSY expenditures in both urban and rural areas 53 percent of all youth served in CA in Program Year 2013 were OSY For example Los Angeles City spent 80 percent of their funds on OSY and the Northern Rural Training and Employment Consortium spent 76 percent of their funds on OSY Both local areas have achieved these levels through strong partnerships with organizations that serve OSY as well as access to high quality work experiences
Program Performance
Performance Measure
Four Quarters
Ending 063012
(Program Year 2011)
Four Quarters
Ending 063013
(Program Year 2012)
Four Quarters
Ending 063014
(Program Year 2013)
Placement in Employment or Education 589 666 690
Attainment of a Degree or Certificate 648 675 684
LiteracyNumeracy Gains 476 509 525
Performance in the Past Three Program Years
Analysis bull 197045 participants were served in the cumulative four quarter reporting period compared
to 217244 served during the same time period last year This decrease is due primarily to a lower funding level compared to the previous year
bull Placement in Employment or Education achieved a result of 690 percent a 24 percentage point increase when compared with the same time period last year
bull The program achieved a result of 684 percent for the Attainment of a Degree or Certificate measure This is a 09 percentage point increase from the same time period last year
bull The LiteracyNumeracy Gains measure achieved a result of 525 percent an increase of 16 percentage points when compared with the same time period last year
bull All three youth common measures exceeded Program Year 2013 GPRA goals
23
WORKFORCE SYSTEM RESULTS
100
80
60
40
20
0 Sep-12 Dec-12 Mar-13 Jun-13 Sep-13 Dec-13 Mar-14 Jun-14
n Placement in Employment or Education n Attainment of a Degree or Certificate n LiteracyNumeracy Gains
YouthBuild httpwwwdoletagovyouth_servicesyouthbuildcfm
Program Description YouthBuild provides job training and educational opportunities for at-risk youth ages 16 to 24 while constructing or rehabilitating affordable housing for low-income or homeless families in their own neighborhoods The youth split their time between the construction site and the classroom where they earn their high school diploma or equivalency learn to be community leaders and prepare for college and other post-secondary training opportunities
Analysis bull 33392 participants have been enrolled into the YouthBuild program since 2007 and 29553
have exited so far bull Since the program began a total of 11716 participants have received a high school
diploma or equivalency 17572 have attained an industry-recognized certificate and 21835 have been placed into initial jobs post-secondary education andor long-term vocational occupational skills training including apprenticeship
bull The Class of 20102011 performance steadily increased The outcomes for all three measures were above those for the Class of 2009 and significantly above the GPRA goals
bull YouthBuild is currently meeting or exceeding the GPRA goal for all three measures The additional quarter of service for 20102011 grants provided additional positive outcomes as expected As the 2012 grant class progresses it is expected that this trend will continue
Program Performance
Quarter Highlights Just A Start in Cambridge (MA) has been a YouthBuild grantee since 2010 In the fourth quarter of the Program Year 2013 they shared the following success story
Victor earned a High School Diploma and HBIPACT construction certification He was accepted to Endicott College in MA He also secured a full time painting position with George Souza Painting making $25 per hour He continues to develop his career plan with staff
Class of 20102011 Performance in the Past Eight Quarters
Performance Measure GPRA Results for Class
0f 20102011 Results for Class 2012 Overall Results
Percent of Participants Entering Employment or Enrolling in Postsecondary Education the Military or Advanced Training Occupational Skills Training in the First Quarter After Exit
500 612 586 519
Percent of Youth Who Attain a Diploma GED or Certificate by the End of the Third Quarter after Exit
672 770 609 672
Percent of Participants Deficient in Basic Skills Who Achieve Literacy or Numeracy Gains of One Adult Basic Education Level
585 676 549 595
24
WORKFORCE SYSTEM RESULTS
100
80
60
40
20
0 Sep-12 Dec-12 Mar-13 Jun-13 Sep-13 Dec-13 Mar-14 Jun-14
n Attainment of a High School Diploma GED or improvement of basic skills by at least two grade levels or completed Occupational Skills training n Participants who Attained Two or more Goals
Indian and Native American Youth Program httpwwwdoletagovdinap
Program Description The Indian and Native American Supplemental Youth Services Program provides summer and year-round employment and training activities for Indian Alaska Native and Native Hawaiian individuals between the ages of 14 and 21 Program resources are targeted to at-risk and the neediest youth who face substantial barriers to education and employment success This population includes high school dropouts and youth who are basic-skills deficient
Quarter Highlights Youth summer employment is a high priority for Native American Tribes However most rural reservation areas do not have enough employers to put youth to work during the summer As a result Tribes rely on the annual WIA Section 166 funding to place youth in summer employment where they can earn a wage and receive valuable work experience
Over the past four quarter period 2487 of the 4399 youth that participated in the youth program were placed in summer employment Youth participants come from low income families with little or no opportunity to earn money during the summer months Through the Indian and Native American Youth Program these youth are given an opportunity to work and earn money during the summer which helps them contribute to their familyrsquos income
Performance in the Past Eight Quarters
Program Performance
Performance Measure Four Quarters
Ending 063013 Four Quarters
Ending 063014
Educational Attainment for Dropouts 180 220
Attainment of Two or More Goals 920 927
The data reported reflect the period from April 1 2012 through March 31 2013 The data reported reflect the period from April 1 2013 through March 31 2014
Additional Program Year 2013 Quarterly Data
Performance Measure Four Quarters
Ending 093013 Four Quarters
Ending 123113 Four Quarters
Ending 033114
Educational Attainment for Dropouts
250 250 220
Attainment of Two or More Goals
930 930 927
The data reported reflect the period from April 1 2013 through September 30 2013 The data reported reflect the period from April 1 2013 through March 31 2014
Analysis bull The Attainment of Two or More Goals rate increased slightly from 92 percent in June 2013
to 927 percent in June 2014 bull The Indian and Native American Youth Program served 4310 youth during the period July
1 2013 through June 30 2014 This is a 164 percentage point decrease in youth served one year ago
bull The Education Attainment for Dropouts increased from 18 percent in June 2013 to 22 percent in June 2014
25
WORKFORCE SYSTEM RESULTS
Green Jobs Innovation Fund Grants (GJIF) httpwwwdoletagovBRGGreenJobs
Program Description The Green Jobs Innovation Fund (GJIF) was authorized as a Pilot and Demonstration Project under the Workforce Investment Act (WIA) of 1998 to help workers receive job training in green industry sectors and occupations as well as access green career pathways GJIF is seeking to increase the number of individuals completing training programs who receive industry-recognized credentials and to increase the number of individuals completing training programs for employment in green jobs
With these grants the Department is emphasizing two key workforce programs that move participants along green career pathways by 1) forging linkages between Registered Apprenticeship and pre-apprenticeship programs andor 2) integrating the delivery of technical and basic skills training through community-based partnerships The grantees are building on existing programs that are already established and serving workers and moving workers into and along green career pathways The Green Jobs Innovation Fund (GJIF) grants are all anticipated to end by June 30 2015
Quarter Highlights The Jobs for the Future (JFF) GreenWays grant program made great progress toward their goal of increasing access for women to enter higher-paying non-traditional occupations Women currently comprise 254 of the programs total enrollment and are earning higher placement wages overall than men At the same time their completion rates credential attainment rates and job placement rates lag behind those of men reflecting the ongoing challenges that women experience in non-traditional occupations The JFF GreenWays program continues to focus on raising the visibility of this issue as a key element in regional approaches to addressing poverty in female-headed households
Program Performance
Performance Measure Cumulative
Four Quarters Ending 063013
Cumulative Four Quarters
Ending 063014
Entered Employment Rate 569 642
Employment Retention Rate 750 821
Six Monthsrsquo Average Earnings $16249 $17459
Additional Program Year 2013 Quarterly Data
Performance Measure
Cumulative Four
Quarters Ending
093013
Cumulative Four
Quarters Ending
123113
Cumulative Four
Quarters Ending
033114
Entered Employment Rate 560 626 641
Employment Retention Rate 790 795 785
Six Monthsrsquo Average Earnings $16406 $15228 $15039
Cumulative Credential Outcomes in the Past Three Quarters
Performance Measure Quarter Ending
123113
Quarter Ending
033114
Quarter Ending
063014
Number Completed Education Job Training Activities
5521 6438 7076
Number Completed Training and Received Credential
5343 6242 6849
Attainment Rate 97 97 97
Analysis As of June 30 2014 8360 participants were enrolled in educationtraining Of these participants 600 participated in Registered Apprenticeship 874 participated in Pre-Apprenticeship and 40 participated in On-the-Job Training A total of 7076 participants completed educationtraining A total of 6849 participants received a credential Lastly a total of 4870 participants entered employment and of these participants 4343 entered training-related employment
26
WORKFORCE SYSTEM RESULTS
Dec-13 Mar-14 Jun-14
100 $27000
$2600080
$2500060
$24000 40
$23000
20 $22000
0 $21000
n Entered Employment Rate n Employment Retention Rate n Six Months Average Earnings
H-1B Jobs and Innovation Accelerator Challenge Grants httpwwwdoletagovETA_News_Releases20111398cfm
Program Description The Jobs and Innovation Accelerator Challenge (Jobs Accelerator) is designed to help regions achieve the demonstrated benefits of collaborative cluster-based regional development This initiative represents the implementation of Administration policy priorities to accelerate bottom-up innovation in urban and rural regions as opposed to imposing ldquoone-size-fits-allrdquo solutions The Jobs Accelerator also meets Administration goals for smarter use of government resources through reduction of Federal silos and promotion of coordinated Federal funding opportunities that offer more efficient access to Federal resources Investments from Federal agencies for the Jobs Accelerator projects include The US Department of Laborrsquos Employment and Training Administration (DOL-ETA) the US Department of Commercersquos Economic Development Administration (DOC-EDA) and the National Institutes of Standards and Technologyrsquos Hollings Manufacturing Extension Partnership (NIST-MEP) the Small Business Administration (SBA) the Department of Energy Advanced Manufacturing Office (DOE AMO) and the Delta Regional Authority (DRA)
The objectives of the Jobs Accelerator are to
bull Accelerate the formation of new high-growth businesses and expansion of existing businesses
bull Accelerate the creation of higher-wage jobs bull Advance commercialization of research including Federally-funded research bull Support deployment of new processes new technologies and new products to grow sales
and generate employment bull Enhance the capacity of small businesses in the cluster including small and disadvantaged
businesses bull Increase exports and business interaction with international buyers and suppliers bull Develop the skilled workforce needed to support growing clusters and bull Ensure diverse workforce participation in clusters through outreach training and the
creation of career pathways
Quarter Highlights The Northeast Ohio Speed-To-Market Accelerator (STMA) program administered by Lorain County Community College aims to accelerate the speed-to-market for near production or pilot production prototypes stimulate job creation and increase the global competitiveness of cluster companies attract private capital and attract students incumbent workers and the unemployed
This quarter STMA helped accelerate the introduction of a new dry electrode product for heart monitoring This sensor and electronics will be introduced as part of the next generation of wearable human performance arm band from Pittsburgh based Body Media a subsidiary of Jawbone Further STMA continues to bring new companies into the STMA
program through cluster outreach activities and this quarter three new leads were generated as the result of the existing STMA partners MAGNET JumpStart Lorain County Community College and NorTech
Program Performance
Performance Measure Four Quarters
Ending 123113 Four Quarters
Ending 033114 Four Quarters
Ending 063014
Entered Employment Rate 307 283 359
Employment Retention Rate 907 925 927
Six Monthsrsquo Average Earnings $23310 $22953 $26682
Performance in the Past Three Quarters
Analysis A total of 3702 individuals were served 3632 individuals began educationjob training activities and 2052 individuals completed educationjob training services Of participants completing educationjob training 370 unemployed individuals completed training and entered employment and of these 114 individuals entered training-related employment A total of 204 employed individuals completed training and retained their current position and of these 85 employed individuals completed training and advanced into a new position A total of 2006 individuals completed educationtraining activities and received credentials and of these 2273 total credentials were awarded
This data represents three rounds of the for Jobs Accelerator initiative which includes the Jobs Accelerator Round 1 the Advanced Manufacturing Jobs Accelerator Round 2 and the Make it in America (MIIA) Jobs Accelerator grants program
27
WORKFORCE SYSTEM RESULTS
100 $56000
80 $54000
$52000 60 $50000
40 $48000
$46000 20
$44000
0 $42000 Dec-13 Mar-14 Jun-14
n Entered Employment Rate n Employment Retention Rate n Six Months Average Earnings
H-1B Technical Skills Training Grants httpwwwdoletagovbusinessH1B_Tech_Skillscfm
Program Description The H-1B Technical Skills Training (TST) Grants were authorized by the American Competitiveness and Workforce Improvement Act of 1998 (ACWIA) as amended (29 USC 2916a) to provide education training and job placement assistance in the occupations and industries for which employers are using H-1B visas to hire highly-skilled foreign workers on a temporary basis and the related activities necessary to support such training The H-1B TST Grant Program is intended to raise the technical skill levels of American workers so they can obtain or upgrade employment in high-growth industries and occupations Over time these education and training programs will help businesses reduce their use of skilled foreign professionals permitted to work in the US on a temporary basis under the H-1B visa program The grants represent significant investments in sectors such as information technology advanced manufacturing and health care In addition these grants will focus on serving participants who have been identified as long-term unemployed particularly those who have been unemployed the longest These grants also have an emphasis on providing on-the-job training allowing participants to learn new skills while earning a pay check To date ETA has announced two rounds of TST grants totaling $342 million The first round was announced on October 4 2011 and the second round was announced on February 22 2012
Quarter Highlights The Los Angeles HealthWorks On-the-Job training (OJT) initiative administered by Managed Career Solutions Inc (MCS) provides individuals with training that leads to industry recognized credentials and employment opportunities within the regionrsquos healthcare field MCS maintains several strong partnerships to coordinate outreach recruitment training OJT placements and employment opportunities As of June 30 2014 MCS served nearly 800 long-term unemployed participants and overall 1100 participants In the same period over 650 individuals completed training and earned an industry recognized credential Of those completers 128 were employed at participation however the majority were underemployed and gained the necessary job skills and credentials that allowed 80 percent to advance into a new position In recognition MCS received the Malcom Baldrige and State Eureka awards
Analysis bull 52532 individuals were served and 51071 individuals began educationjob training
activities bull 15185 individuals completed educationjob training activities including 3321 unemployed
individuals who completed training and entered employment bull Of these 2925 individuals entered training-related employment 2902 employed individuals
completed training and retained their current position 1452 employed individuals completed training and advanced into a new position
bull 11944 individuals completed educationjob training activities and received credentials with 14099 total credentials awarded
Program Performance
Performance Measure
Four Quarters
Ending 123113
Four Quarters
Ending 033114
Four Quarters
Ending 063014
Entered Employment Rate 778 725 675
Employment Retention Rate 993 944 926
Six Monthsrsquo Average Earnings $54683 $50833 $46245
Since the H-1B TST program provides training to incumbent unemployed and long-term unemployed workers to prepare them for jobs in a variety H-1B industries andor occupations the Entered Employment Rate and Six Monthsrsquo Average Earnings can vary For the quarter ending on June 30 2014 the H-1B TST program saw a decline in the Entered Employment Rate and Six Monthsrsquo Average Earnings in comparison with the results for the previous rolling four quarters Previous results reflected a large number of incumbent workers who enrolled in short-term high-skilled training and exited early leading to a relatively high Six Monthsrsquo Average Earnings As the projects progress unemployed and long-term unemployed workers who required longer-term training begin to exit the program and search for jobs Ultimately as they enter employment wages may be less than those achieved by the higher-skilled incumbent workers who either retain or advance in their positions after training
Performance in the Past Three Quarters
28
WORKFORCE SYSTEM RESULTS
100 $21000
$19000 80
$17000
$1500060 $13000
40 $11000
$900020
$7000
0 $5000Sep-12 Dec-12 Mar-13 Jun-13 Sep-13 Dec-13 Mar-14 Jun-14
n Entered Employment Rate n Employment Retention Rate n Six Months Average Earnings
Community-Based Job Training Grants (CBJT) httpwwwdoletagovbusinessCommunity-BasedJobTrainingGrantscfm
Program Description Community-Based Job Training Grants (CBJT) seek to strengthen the role of community colleges in promoting the United States workforcersquos competitiveness The program does this by building the capacity of community colleges to train workers in skills required to succeed in regionally based high-growth high-demand industries and occupations Important grant activities include training in the healthcare biotech advanced manufacturing energy automotive transportation construction insurance forestry and aerospace industries The first round of CBJT grants were awarded in October 2005 To date ETA has announced five rounds of CBJT grants awarding 320 grants to community colleges and other organizations All CBJT grants ended as of June 30 2014
Quarter Highlights The 14 remaining projects active in this quarter represent the culmination of another successful DOL initiative Some of the significant accomplishments include the development and sustainability of Roane State Community Collegersquos Lean Manufacturing program designed to meet the needs of local manufacturing employers the San Jacinto Community College Districtrsquos Gulf Coast Healthcare Partners project which developed training to support healthcare career and Central Arizona Collegersquos Pinal County Alternative Energy Project More than half of the CBJT participants who began education and training activities completed their programs 79 percent of them received an industry recognized credential ie certificate or degree Eighty-four percent of the participants who gained employment entered into new training-related positions
Program Performance
Performance Measure Four Quarters
Ending 063013 Four Quarters
Ending 063014
Entered Employment Rate 572 662
Employment Retention Rate 891 899
Six Monthsrsquo Average Earnings $18675 $17027
Additional Program Year 2013 Quarterly Data
Performance Measure
Four Quarters
Ending 093013
Four Quarters
Ending 123113
Four Quarters
Ending 033114
Entered Employment Rate 57 605 655
Employment Retention Rate 891 897 891
Six Monthsrsquo Average Earnings $18675 $18285 $16642
Performance in the Past Eight Quarters
Analysis bull 268359 individuals have been served through the initiative bull 258216 individuals began educationjob training activities bull 165264 individuals completed educationjob training activities Of these
bull 131107 individuals received credentials bull 65089 individuals entered new positions of employment and 54344 individuals entered new
positions of training-related employment
Note All data are cumulative Prior to new reporting requirements implemented in the quarter ending December 31 2011 grantees only reported results for individuals that entered employment and individuals that entered training-related employment (noted above) if those participants entered employment and completed training in the same quarter As a result prior to that quarter participants that entered employment in quarters after they completed training were captured in the Common Measures and the total number of individuals that ultimately entered employment and training-related employment are actually higher than the results above indicate
29
WORKFORCE SYSTEM RESULTS
100 92
7880
5760
40
20
0
n Percent of Target Number of Programs Launched by Round
Round 1 Round 2 Round 3
Trade Adjustment Assistance Community College and Career Training (TAACCCT) Grants httpwwwdoletagovtaaccct
Program Description The Trade Adjustment Assistance Community College and Career Training (TAACCCT) Grant Program is authorized by the Trade Act of 1974 under Chapter 4 of Title II The purpose of this grant program is to provide eligible institutions of higher education with funds to expand and improve their ability to deliver education and career training programs that can be completed in two years or less and that result in skills degrees and credentials that prepare program participants for employment in high-wage high-skill occupations and are suited for workers who are eligible for training under the Trade Adjustment Assistance (TAA) for Workers program under Chapter 2 of Title II of the Trade Act The TAACCCT Grant Program is funded under the Health Care and Education Reconciliation Act of 2010 which appropriated $500 million for the program for each of Fiscal Years 2011-2014 for a total of $2 billion
Round 1 ndash FY 2011 Grants On June 30 2014 grants awarded in Round 1 (FY 2011) had completed all but one quarter of their periods of performance By the end of their final year of the grant the forty-nine (49) Round 1 grantees project that they will offer a total of 906 new programs of study As of June 30 2014 grantees began offering 834 (92 percent) of these programs of study
Round 2 ndash FY 2012 Grants The seventy-nine (79) grants awarded in the Fiscal Year 2012 had completed seven quarters of their grants at the end of June 30 2014 Their period of performance began on October 1 2012 and will end on September 30 2016 however their final year will be dedicated to gathering information and data for reporting outcome measures and completing the requirements for a third-party evaluation They project that by the end of the third year they will have launched 761 programs As of the end of June 30 2014 they had began offering 561 (78 percent) of these programs
Round 3 ndash FY 2013 Grants Grants awarded in FY 2013 had completed the first three quarters of their period of performance Their grants began on October 1 2013 and will end on September 30 2017
In their third year they will have launched all of their programs as their final year will be dedicated to collecting follow up data for evaluation and reporting purposes only The fifty-seven (57) grantees plan to launch 551 programs As of June 30 2014 they had already launched 288 (57 percent) of these programs
Percentage of Target Number of Programs Launched as of June 30 2014 by Grant Round
Performance Information Programmatic data is collected at different intervals throughout the period of performance including
bull Quarterly Narrative Progress Reports (QNPR) Grantees will provide quarterly qualitative data on the capacity building taking place through progress and other implementation measures that grantees defined in their Statements of Work
bull Annual Performance Reports (APR) Grantees will provide annual quantitative data on their training and employment outcomes for TAACCCT program participants that are impacted by the capacity building activities being implemented by their grants
30
WORKFORCE SYSTEM RESULTS
$4500000 3500$4000000 3000$3500000
2500
Jun-13 Dec-13 Mar-14 Jun-14
Amou
nt $3000000 2000$2500000
$2000000 1500 $1500000 1000 $1000000
500$500000 $0 0
n Amount of Revenue Generated n Number of Tickets Assigned
Disability Employment Initiative (DEI) httpwwwdoletagovdisability
Program Description All DEI Workforce Employment Network (EN) Trends
Launched in 2010 the Disability Employment Initiative (DEI) seeks to improve education training and employment opportunities for youth and adults with disabilities who are unemployed underemployed andor receiving Social Security disability benefits The DEI is jointly funded by the US Department of Laborrsquos Employment and Training Administration and Office of Disability Employment Policy DEI projects improve collaboration among employment and training and asset development programs implemented at state and local levels including the Social Security Administrationrsquos Ticket to Work Program and build effective partnerships that leverage resources to better serve individuals with disabilities and improve employment outcomes
Quarter Highlights A variety of Department of Labor programs helped Vietnam-era veteran Richard James navigate through life After servicing B-52 bombers in the Air Force James held a series of sales jobs while putting himself through law school at night He rose to become a successful New England attorney and owner of a boat dock building company when he suffered a terrible head injury which caused spine and nerve damage Addiction to pain medication followed and James ended up homeless While recovering from his injuries James took a college course through the Veterans Retraining Assistance Program managed in part by the Department He received career counseling from a Disabled Veterans Outreach Program representative at a local American Job Center and support from the DEI Disability Resource Coordinator Eventually James was hired as an attorney by a Rhode Island law firm The departments grants and programs made possible the services that put me back in a position of being a productive member of society he said
Program Performance
Performance Measure Quarter Ending 63013
Quarter Ending
123113
Quarter Ending 33114
Quarter Ending 63014
Analysis bull The Exit Rate for Adult and Youth exiters with disabilities in Round one DEI sites is almost
double the national average Adult DEI was 89 percent vs All StatesAll LWIAs 49 percent Older Youth DEI 166 percent vs All StatesAll LWIAs 87 percent Younger Youth DEI 339 percent vs All StatesAll LWIAs 151 percent
bull The CredentialSkill Attainment Rate for older and younger youth with disabilities in Round 1 DEI sites was higher than the national average Older Youth DEI credential rate 568 percent vs All StatesAll LWIAs 383 percent Younger Youth DEI skill rate 902 percent vs All States All LWIAs 834 percent
bull The Exit Rate for Adult and Youth exiters with disabilities in Round two DEI sites is higher than the national average Adult DEI 56 percent vs All StatesAll LWIAs 49 percent Older Youth DEI 163 percent vs All StatesAll LWIAs 87 percent and Younger Youth DEI 167 percent vs All StatesAll LWIAs 151 percent
bull The Entered Employment Rate for Adult DEI sites 657 percent is 20 percent higher than in All StatesAll LWIAs 434 percent
bull DEI Workforce Employment Networks (EN) activity shows that the number of Tickets assigned increased from 1780 to 2903 an increase of 1123 and the amount of revenue
Number of Tickets Assigned 1780 1590 2554 2903 generated from DEI EN payments increased from $2373404 to $4057353 an increase of $168 million Amount of Revenue Generated $2373404 $1927104 $3505582 $4057353
31
WORKFORCE SYSTEM RESULTS
ETA Internet-Based Assistance (E-TOOLS) wwwcareerinfonetorg wwwservicelocatororg wwwcareeronestoporg wwwonetonlineorg wwwmyskillsmyfutureorg wwwmynextmoveorg
Program Description Additional Program Year 2013 Quarterly Data
Performance Measure Quarter Ending
093013
Quarter Ending
123113
Quarter Ending
033114
CareerOneStop Portal Visits 5754645 5159240 5340022
ETArsquos Internet-based assistance includes electronic tools that help individuals explore career opportunities and link to job postings either on their own or at local American Job Centers to make informed employment and education choices
The Web sites feature user-friendly occupation and industry information salary data career videos education resources career exploration assistance and other resources that support talent development in todayrsquos fast-paced global marketplace Users can find information some of which is also industry sponsored about occupations that are in-demand in high growth industries Additionally information is available regarding occupational skills and workplace competencies
Quarter Highlights For the year ending June 2014 CareerOneStop launched a new portal for Ex-Offenders added Federal Contractor job tagging a TAACCCT information finder Youth Council information to Americarsquos Service Locator and began working on adding more job feeds
Americarsquos Service Locator (ASL) Visits
730998 758919 724053
ONET Downloads 26646 29407 28505
ONET Visits 7697608 10211177 11500039
Combined Visits 14183251 16129336 17564114
Performance in the Past Eight Quarters
25000000 $36000
Sep-12 Dec-12 Mar-13 Jun-13 Sep-13 Dec-13 Mar-14 Jun-14
n Combined Visits (in millions) n ONET Product Downloads (in thousands)
$31500 20000000
ONE
T Pr
oduc
t Dow
nloa
ds
$27000
Com
bine
d Vi
sits
$2250015000000 $18000
10000000 $13500
$90005000000
$4500
$00
ONET has added web services for developers and increased the available Tools and Technology and Detailed Work Activities information to convey specialized occupational attributes
Program Performance
Performance Measure Quarter
Ending 063013 Quarter
Ending 063014
CareerOneStop Portal Visits 5104850 5472742
Americarsquos Service Locator (ASL)Visits
747114 802148
ONET Downloads 29482 25278
ONET Visits 8716609 13581922
Combined Visits 14568573 19856812
Analysis bull ETA Internet-Based Assistance received 19856812 combined visits for the quarter ending
June 30 2014 an increase of 36 percent over the same period in 2013 bull Visits to CareerOneStop increased to 5472742 or 72 percent over the same period in 2013
with mySkillsmyFuture continuing to be a popular tool with an increase of 23 percent bull Americarsquos Service Locator Visits traffic increased 74 percent over the same period in 2013 bull The ONET traffic received 13581922 visits in this quarter an increase of 558 percent
over the same period in 2013 and the ONET downloads totaled 25278 for the quarter a decrease of 142 percent
32
WORKFORCE SYSTEM RESULTS
Glossary of Performance Measures
Common Performance Measures Common Performance Measures are used by Workforce Investment Act Indian and Native American Program Disability Program Navigator Initiative Wagner-Peyser Trade Adjustment Assistance Senior Community Service Employment Program Reintegration of Ex-Offenders Registered Apprenticeship Program Job Corps National Farmworker Jobs Program High Growth Job Training Initiative and Community-Based Job Training Grants
Adult Measures Entered Employment Of those who are not employed at the date of participation the number of adult participants who are employed in the first quarter after the exit quarter divided by the number of adult participants who exit during the quarter
Employment Retention Of those who are employed in the first quarter after the exit quarter the number of adult participants who are employed in both the second and third quarters after the exit quarter divided by the number of adult participants who exit during the quarter
Six Monthsrsquo Average Earnings Of those adult participants who are employed in the first second and third quarters after the exit quarter total earnings in the second quarter plus the total earnings in the third quarter after the exit quarter divided by the number of adult participants who exit during the quarter
Average Earnings Change in Six Months1
Of those who are employed in Q1 after exit the total post-program earnings (earnings in Q2 + Q3 after exit) minus pre-program earnings (earnings in Q2 + Q3 prior to registration) divided by the number of adults who exit during the quarter
Youth Measures Attainment of a Degree or Certificate Of those enrolled in education (at the date of participation or at any point during the program) the number of youth participants who attain a diploma GED or certificate by the end of the third quarter after the exit quarter divided by the number of youth participants who exit during the quarter
1 This definition was used for earnings in PY 2005 Q=quarter
33
Literacy and Numeracy Gains Of those out-of-school youth who are basic skills deficient the number of youth participants who increase one or more educational functioning levels divided by the number of youth participants who have completed a year in the program (ie one year from the date of first youth program service) plus the number of youth participants who exit before completing a year in the program
Placement in Employment or Education2
Of those who are not in postsecondary education or employment (including the military) at the date of participation the number of youth participants who are in employment (including the military) or enrolled in postsecondary education andor advanced trainingoccupational skills training in the first quarter after the exit quarter divided by the number of youth participants who exit during the quarter
Program-Specific Performance Measures
Disability Employment Initiative (DEI) Number of Tickets Assigned Number of individuals on Social Security Administration (SSA) disability benefits who assigned their Ticket to the workforce board agency or American Job Center as their designated Employment Network under the SSA Ticket to Work program All DEI pilot sites must become an Employment Network under Ticket to Work
Amount of Revenue Generated Under the SSA Ticket to Work program when jobseekers who receive SSA disability benefits assign their Ticket to a workforce board agency or American Job Center as an Employment Network and then achieve certain employment milestones the Employment Network receives money or ldquoTicket revenuerdquo
2 Because of its intensity and duration the YouthBuild performance measure for placement in employment or education does not exclude those who entered the program with a job or in college
WORKFORCE SYSTEM RESULTS
Foreign Labor Certification Percent of H-1B Applications Resolved in Seven Business Days This estimate is based on the total number of applications processed within seven business days divided by the total number of applications processed for a given reporting period An application is considered processed if the last significant event is (1) certified (2) denied or (3) withdrawn
Average Number of Days to Resolve PERM Applications Not Subject to Integrity Review The average processing time between case receipt and decision date for non-audited cases
Average Number of Days to Resolve PERM Applications Subject to Integrity Review The average processing time between case receipt and decision date for audited cases
Percent of Complete H-2A Employer Applications Resolved within 30 Days Before the Date of Need This estimate is based on the total number of complete applications resolved within 30 days before the date of need divided by the total number of applications processed for a given reporting period
Percent of H-2B Applications Processed Within 30 Days of Receipt This estimate is based on the total number of applications processed within 30 days of receipt divided by the total number of applications processed for a given reporting period An application is considered processed if the last significant event is (1) certified (2) denied or (3) withdrawn
Indian and Native American Youth Attainment of Two or More Goals The total number of youth participants enrolled in the Granteersquos Supplemental Youth Services Program who attained at least two of the 14 goals listed below divided by the total number of Supplemental Youth Services participants enrolled during the report period The 14 goals include
1 Completed Job ReadinessOrientation to the World of Work Training 2 Completed Internship or Vocational Exploration Program
3 Completed Career Assessment 4 Entered Unsubsidized Employment 5 Remained in School 6 Returned to School Full Time 7 Enrolled in Job Corps 8 Improved Basic Skills Level By At Least Two Grades 9 Attained High School Diploma 10 Attained GED 11 Completed Occupational Skills Training 12 Completed Leadership Skills Training 13 Entered Other (Non-Supplemental Youth) Training Program 14 Summer Employment
Educational Attainment for Dropouts The number of dropouts who have obtained a high school diploma GED or increased their literacy and numeracy by two grade levels divided by the total number of dropouts
Job Corps Measures Placement in Employment or Education Percent of Job Corps participants3 entering employment or enrolling in post-secondary education andor advanced skills trainingoccupational skills training in the first quarter after exit from the program
Attainment of a Degree or Certificate Percent of students who attain a GED HSD or certificate
Literacy Numeracy Gains Percent of students who achieve literacy or numeracy gains of one or more Adult Basic Education (ABE) levels
3 Calculation of the Placement rate measure does not include outcomes for students who participated in the program for less than 60 days
34
WORKFORCE SYSTEM RESULTS
Internet-Based Assistance Web Site Visits ETArsquos Internet-based assistance includes electronic tools that help individuals make informed employment and education choices The measure for tracking the overall performance and usage of these tools is Web site visits A visit is defined as a series of page requests from the same uniquely identified client with a time of no more than 30 minutes between each page
request
ONet Product Downloads The ONET product downloads count the number of unique users who download an ONET online resource (wwwonetcenterorg) which includes the ONET database (all versions) ONET technical reports (such as on green jobs) supplemental data files (lay titles tools and technology) the ONET Career Exploration Tool files ONET Survey questionnaires and other related materials such as the Toolkit for Business
Registered Apprenticeship Program Entered Employment Rate Percent of apprentices employed in the first quarter after exit who either completed or cancelled from their Registered Apprenticeship Program
Employment Retention Rate Percent of apprentices employed in the first quarter after exit still employed in the second and third quarter after exit who either completed or cancelled from their Registered Apprenticeship Program
Six Monthsrsquo Average Earnings Six month Average Earnings of apprentices employed in the first quarter after exit still employed in the second and third quarter after exit who either completed or cancelled from their Registered Apprenticeship Program
Reintegration of Ex-OffendersmdashAdult Program Recidivism Rate The percentage of participants who are rearrested for a new crime or re-incarcerated for revocation of a parole or probation violation within one year from release from prison
Senior Community Service Employment Program Service Level The count of participants during the report period divided by the total number of authorized grantee community service positions
Community Service The number of community service hours as reported by each grantee divided by the total community service hours funded for the grantee adjusted for minimum wage differences among the states
Most-in-Need Most-in-need means participants with one or more of the following characteristics have a severe disability are frail are age 75 or older are age-eligible but not receiving benefits under Title II of the Social Security Act reside in an area with persistent unemployment and have severely limited employment prospects have limited English proficiency have low literacy skills have a disability reside in a rural area are Veterans have low employment prospects have failed to find employment after utilizing services provided under Title I of the Workforce Investment Act of 1998 (29 USC 2801 et seq) or are homeless or at risk for homelessness (sect 513(b)(1)(E) as amended by Pub L No 109-365)
Unemployment Insurance Percent of Payments Made Timely The percentage of intrastate Unemployment Insurance benefit first payments for full weeks of unemployment issued within 14 days following the first compensable week in states with a waiting week and 21 days in non-waiting week states
Detection of Recoverable Overpayments The amount of overpayments (dollars) established through state operations as a percent of the estimated amount states can detect and establish for recovery
Entered Employment Rate The percent of persons receiving a first payment in a given quarter who had earnings in the next quarter
Percent of Employer Tax Liability Determinations Made Timely The percent of new employer determinations made within 90 days of the end of the quarter in which employers became liable to pay unemployment taxes
35
WORKFORCE SYSTEM RESULTS
YouthBuild Attainment of a Degree or Certificate Of those enrolled the number of youth participants who attain a diploma high school equivalency degree or industry-recognized certificate by the end of the third quarter after the exit quarter divided by the number of youth enrolled (minus youth exited for other reasons)
Literacy and Numeracy Gains Of those youth participants who are basic skills deficient at enrollment the number of youth participants who increase one or more educational functioning levels within one year of enrollment divided by the number of youth participants who have completed a year in the program
Placement in Employment or Education The number of youth participants who are in employment (including the military) or are enrolled in post-secondary education andor advanced trainingoccupational skills training in the first quarter after the exit quarter divided by the number of youth participants who exited during the previous quarter
Youthful Offender Projects Placement Rate The placement rate is the percentage of out-of-school youth ages 18 and above placed in unsubsidized jobs occupational training post-secondary education or the military
Recidivism Rate The recidivism rate is the percentage of youth offenders who have been convicted of a new crime within 12 months of their release of a correctional facility or being placed on probation
36
WORKFORCE SYSTEM RESULTS
2471 American Job Centers formerly known as One-Stop Career Centers
12 VT
9 HI
1 GU
6 DC
2 VI
15 NE
16 SD
12 ME
19 IA
19 AK
19 WV
4 DE
47 AL
55 CO
48 MN
57 WI
89 NC
60 GA
31 MA
23 NM
16 ND
47 AR
70 PA
18 CT 4 RI
12 NV
20 WY
22 KS
18 PR
89 OH
69 TN
102 FL
59 AZ 46
SC
12 NH
29 NJ
52 VA
22 MT
33 OK
39 MS
59 WA
61 IL 34 MD
47 OR
131 KY
62 LA
83 IN
33 UT
44 MO
26 ID 90
NY95 MI
1 to 25
25 to 50
50 to 75
75 to 100
Over 100
203 CA
180 TX
Source Americarsquos Service Locator (wwwServiceLocatororg) Americarsquos Service Locator connects individuals to employment and training opportunities available at local American Job Centers The Web site provides contact information for a range of local work-related services including unemployment benefits career development and educational opportunities As of March 17 2015
37
WORKFORCE SYSTEM RESULTS
United States Department of Labor
200 Constitution Avenue NW
Washington DC 20210
wwwdolgov
- A9RFAFEtmp
- DOL_Workforce_Rprt_Jun_2014_51415-dp
-
- Workforce System Results
-
- Contents
- Quarterly Spotlight
- People Served by Program
- Current Appropriations
- Government Performance and Results Act Goals (GPRA)
- Indian and Native American Adult Program (INAP)
- National Farmworker Jobs Program (NFJP)
- Senior Community Service Employment Program (SCSEP)
- Wagner-Peyser Employment Service
- Workforce Investment Act Adult Program
- Workforce Investment Act Dislocated Worker Program
- H-1B and Permanent Foreign Labor Certification (PERM)
- H-2A and H-2B Foreign Labor Certification Programs
- Reintegration of Ex-Offenders (RExO-ADULT)
- Registered Apprenticeship
- Registered Apprenticeship
- Trade Adjustment Assistance (TAA)
- Unemployment Insurance (UI)
- Unemployment Insurance (UI)
- Job Corps
- Workforce Investment Act Youthful Offender Initiative
- Workforce Investment Act Youth Program
- YouthBuild
- Indian and Native American Youth Program
- H-1B Jobs and Innovation Accelerator Challenge Grants
- H-1B Technical Skills Training Grants
- Community-Based Job Training Grants (CBJT)
- Trade Adjustment Assistance Community College and Career Training (TAACCCT) Grants
- Disability Employment Initiative (DEI)
- ETA Internet-Based Assistance (E-TOOLS)
- Glossary of Performance Measures
- 2471 American Job Centers formerly known as One-Stop Career Centers
-

WORKFORCE SYSTEM RESULTS
Quarterly Spotlight Alaska Dislocated Worker Training National Emergency Grant (DWT-NEG)
Certification as a waste water treatment operator put an end to underemployment for Justin W and helped him secure his dream job
In 2012 Alaskarsquos WIA Dislocated Worker (DLW) department received $12 million in Dislocated Worker Training National Emergency Grant (DWT-NEG) funds to expand training opportunities to dislocated workers The federal funding supports on-the-job training registered apprenticeships and other approaches that connect dislocated workers with employers These services are targeted to those experiencing prolonged unemployment The DWT-NEG was initially projected to enroll 100 participants throughout the life of the grant however at the end of Program Year 2013 143 participants were enrolled and approximately half of the funds expended
The high enrollment rate included many success stories including that of Justin W Justin was referred to the Career Support and Training by Plumbers and Pipefitters He was indentured as a first-year apprentice to specialize in HVAC however needed more training Through working with his case manager Justin was able to access tools and training services However he was unable to immediately find steady employment as a HVAC apprentice
Through his own research Justin found that it was possible to study on his own and get certified as a waste water treatment operator With this certification and a commercial driverrsquos license (CDL) he could be dispatched through the union to the local water utility While he would have to start as a temporary dispatch soon after he would be eligible to be transitioned to a full time position This was an especially hard time for Justin and his family as his wife also became unemployed during this time however he persisted and worked with
his case manager to gain funding for his CDL with DWT-NEG funds contingent on his passing the other certification tests Justin was able to successfully complete both the CDL training and a second year of school Then it was just waiting to be dispatched to the water utility One day soon after as Justin was about to leave for a regular dispatch to Shemya he saw he missed a call It was the call he was waiting for to finally be given a position as a temporary dispatch with the water utility A few weeks later Justin gained a full time dispatch position making $3143 per hour
The DWT-NEG funds provided necessary supports for many dislocated workers throughout Alaska and strengthened the departmentrsquos ability to deliver critical work based learning and training to the long-term unemployed Dislocated workers are defined as those who have been unemployed for 27 weeks or more In Alaska funds are administered through the Employment Security Division (ESD) which conducts participant and employer recruitment determines eligibility and provides employment and training services to participants enrolled in the grant
The ESD Unemployment Insurance (UI) system and the Alaska Labor Exchange System (ALEXsys) primarily recruit dislocated workers or UI recipients that have been profiled as likely to exhaust UI benefits
ESD also targets prospective employers through the departmentrsquos apprenticeship outreach program and partners with the Alaska Workforce Investment Board (AWIB) to create job training opportunities and streamline access to job opportunities The departmentrsquos goal has been to create partnerships that provide services to populations with the highest barriers the long-term unemployed Veterans Alaska Natives and workers likely to exhaust their UI benefits and individuals receiving vocational rehabilitation guidance and assistance while pursuing re-employment or registered apprenticeship
Justinrsquos story is just one of many successes that Alaska has been able to facilitate for DWTshyNEG participants
Update Justin continues to work for the Waste Water UtilityMunicipal of Anchorage He became a permanent employee in 2014 and received over a $200 raise after completion of his six month probationary period He has no plans to leave his current job
1
People Served by Program
In the 12 month period ending June 30 2014 ETA programs served a total of 28353698 participants ETA programs are largely administered via the American Job Center Network Caseworkers assess program participantsrsquo needs and connect them with different services and programs funded by the ETA Thus participants receive customized and comprehensive support based on their needs and eligibility and often receive services from various programs simultaneously
Of all the total participants receiving Wagner-Peyser Employment Service (ES) and Unemployment Insurance (UI) 726 percent of those received both Unemployment Insurance and Wagner-Peyser funded Employment Services ETArsquos other programs provided more comprehensive services to over 92 million people
These participants may also be receiving services from other ETA workforce development programs that provide targeted assistance to those seeking to rejoin the workforce
ES Only 10124458
UI-ES Overlap 6495485
UI Only 2451464
Other ETA Programs
7184946 WIA Adults
802386 WIA Dislocated Workers
394399 Registered Apprenticeship1
268359 Community Based Job Training Grants2
197045 WIA Youth
109627 Job Corps3
67814 Senior Community Service Employment Program
62706 Trade Adjustment Assistance
52532 H-1B Technical Skills Training Grants2
37329 National Emergency Grants
36498 Indian and Native American Adult Program4
35192 National Farmworker Jobs Program
7604 YouthBuild
6884 Youthful Offender Initiative
6861 Green Jobs Innovation Fund Grants2
6308 Reintegration of Ex-Offenders - Adult5
3604 Indian and Native American Youth6
2197 H-1B Jobs and Innovation Accelerator Challenge Grants2
Data presented using logarithmic scale in base 10
1 Source Count includes all active completed and cancelled apprentices tracked by Apprenticeship US Military Apprentices Program and State Apprenticeship Agency (SAA) States
2 Data reflect program-to-date performance 3 All participants include the number of students active on the start date number of students enrolled during the timeframe
number of graduates separated prior to start date and in the placement service window during the timeframe and number of former enrollees separated prior to the start date and in the placement service window during the timeframe
4 Number includes self-service individuals 5 Program-to-date as of program inception in Spring 2006 6 Data reflective of the period from April 1 2013 through March 31 2014 most recent data available
WORKFORCE SYSTEM RESULTS 2
WORKFORCE SYSTEM RESULTS
Current Appropriations
In general the following resources are used to operate authorized workforce investment programs Although this report generally presents quarterly results the figures below represent annual appropriations This report for the quarter ending June 30 2014 covers programs operating in Program Year 2013 (July 1 2013 through June 30 2014) and programs operating in Fiscal Year 2014 (October 1 2013 through September 30 2014) The funding displayed is from both the Fiscal Year 2013 appropriation and Fiscal Year 2014 appropriation Apprenticeship TAA and UI run on a Fiscal Year cycle whereby June 30 2014 is the end of the third quarter of Fiscal Year 2014 All other programs run on the Program Year from July 1 to June 30 whereby June 30 2014 is the end of the fourth quarter of Program Year 2013
FY 2014 amp PY 2013 Workforce Investment Resourcesab
Apprenticeship1 $30000000
Women in Apprenticeship $944182
Dislocated Worker National Reserve2 $224066428
Indian and Native American Adult Program3 $36477500
Job Corps (Operations)4 $1323563463
National Farmworker Jobs Program5 $74033084
Senior Community Service Employment Program $424804974
Trade Adjustment Assistance Training6 $306268000
Unemployment Insurance (UI) Administration $2861575000
Wagner-Peyser ActEmployment Service (ES) $664183664
WIA Adult7 $730624342
WIA Dislocated Workers Formula Grant7 $955591379
Reintegration of Ex-Offenders $76054843
Youth Activities8 $777534561
Indian and Native American Youth Program8 $7879901
WIA Youth (Older and Younger) $769654660
YouthBuild $75534502
Workforce Innovation Fund $47303671
TOTAL $8608559593
Notes a The Consolidated and Further Continuing Appropriations Act 2013 (PL 113-6) included a 02 rescission on all FY 2013
discretionary funds in the Act as part of an agency adjustment associated with sequestration b Section 251A of the Balanced Budget and Emergency Deficit Control Act (BBEDCA) as amended on March 1 2013 required
the President to issue a sequestration order canceling some budgetary resources for the remainder of FY 2013 In this table sequestration impacted all PY 2013 programs except the Dislocated Worker National Reserve Sequestration reductions only impacted TAA Training for the FY 2014 programs included in this table
1 Registered Apprenticeship programs are funded by employers and do not receive specific program appropriations The resources listed above support Federal staff who provide technical assistance for Registered Apprenticeship programs
2 The Dislocated Worker (DW) National Reserve contains funds for national emergency grants demonstrations technical assistance and training outlying areas Dislocated Worker programs and special assistance for AdultsDislocated Worker programs
3 The total appropriation is $45082291 $8604791 was transferred to the Department of InteriorBureau of Indian Affairs for those Indian and Native American grantees per PL 102-477
4 The total appropriation is $1613872025 with $1487005642 for Operations $99310341 for Construction and $27556042 for expenses $163442179 was transferred from Operations to the Department of AgricultureForest Service
5 The total appropriation is $79896847 $5382212 is set aside for migrant and seasonal housing and $481551 is set aside for technical assistance and training
6 The total appropriation for Federal Unemployment Benefits and Allowances is $608768000 and includes $272000000 for TAA benefits and $30500000 for Wage Insurance
7 ETA elected to absorb the reductions associated with the 2 rescission and sequestration in FY 2013 in the PY 2013 base (July 1 2013) funding amounts for the Adult and Dislocated Worker programs
8 The total Youth Activities appropriation is $781375289 the total Indian and Native American Youth Program appropriation is $11720629 of which $3840728 was transferred to the Department of InteriorBureau of Indian Affairs per PL 102shy477
3
WORKFORCE SYSTEM RESULTS
Government Performance and Results Act Goals (GPRA) httpwwwdoletagovperformancegoalsgpracfm
On January 4 2011 President Obama signed HR 2142 the ldquoGPRA Modernization Act of 2010rdquo which became Public Law 111-352 The new law required Federal agencies to set clear performance goals that can be accurately measured and publicly reported in a more transparent way The following table contains performance indicators arrayed by program which represent the key results that ETA programs work to achieve Performance goals for the employment and training programs listed are established in the budget process The goals are set at the higher end to be ldquoambitiousrdquo within the context of prior performance Since the program performance goals are nationwide goals they may not apply in every instance to individual States or grantees where different economic or other circumstances may demand an adjustment in performance expectations
The following table reflects Program Year 2013 (July 1 2013 - June 30 2014) goals for most programs and Fiscal Year 2014 (October 1 2013 - September 30 2014) goals for Foreign Labor Certification Unemployment Insurance Trade Adjustment Assistance and Registered Apprenticeship Programs Cost per Participant is not displayed because it is an annual measure
Government Performance and Results Act Goals Annual Goal Results as of 0630141
Foreign Labor Certification
Percent of H-1B Applications Resolved in Seven Business Days 100 100
Average Number of Days to Resolve PERM Applications Not Subject to Integrity Review 150-225
Average Number of Days to Resolve PERM Applications Subject to Integrity Review (Audit) 350-450
Percent of H-2A Applications with No Deficiencies Resolved 30 Days Before the Date of Need2 80 89
Percent of H-2B Applications Resolved Within 30 Days 90 97
194
424
Indian and Native American Adult Program3
Entered Employment Rate 635 632
Employment Retention Rate 780 794
Six Monthsrsquo Average Earnings $9959 $9476
Indian and Native American Youth Program4
Education Attainment for Dropouts NA 22
Participants Who Attained Two or More Goals NA 927
Job Corps
Placement in Employment or Education Rate Placement in Employment or Education Rate 650 767
Attainment of Degree or Certificate Rate 580 668
Percentage of Students Who Achieve Literacy or Numeracy Gains 620 661
National Electronic ToolsEmployment and Training Administration (ETA) Internet Based Assistance
Combined Site Visits for CareerOneStop Americarsquos Service Locator and ONET 55000000 67733513
4
WORKFORCE SYSTEM RESULTS
Government Performance and Results Act Goals Annual Goal Results as of 0630141
National Farmworker Jobs Program (NFJP)
Entered Employment Rate 861 881
Employment Retention Rate 832 856
Six Monthsrsquo Average Earnings $10501 $10855
Reintegration of Ex-Offenders (formerly Prisoner Reentry Initiative)5
Entered Employment Rate 593 58
Employment Retention Rate 681 72
Six Monthsrsquo Average Earnings $10072 $9770
Percent of Participants Re-arrested for a New Crime or Re-incarcerated for Revocation le22 11
of Parole or Probation Violation within One Year from Release from Prison
Registered Apprenticeship
Entered Employment Rate 747 742
Employment Retention Rate 875 878
Six Monthsrsquo Average Earnings $24754 $24387
Senior Community Service Employment Program
Entered Employment Rate 428 441
Employment Retention Rate 734 721
Six Monthsrsquo Average Earnings $7396 $7127
Trade Adjustment Assistance6
Entered Employment Rate 699 729
Employment Retention Rate 911 911
Six Monthsrsquo Average Earnings $19436 $17828
Wagner-Peyser Employment Service
Entered Employment Rate 538 56
Employment Retention Rate 811 82
Six Monthsrsquo Average Earnings $14642 $14494
Unemployment Insurance
Percent of Intrastate Payments Made Timely 871 812
Detection of Recoverable Overpayments 542 598
Entered Employment Rate for Unemployment Insurance Claimants 647 627
5
WORKFORCE SYSTEM RESULTS
Government Performance and Results Act Goals Annual Goal Results as of 0630141
Percent of Employer Tax Liability Determinations Made Timely 889 886
Workforce Investment Act Adult Program
Entered Employment Rate 612 611
Employment Retention Rate 820 828
Six Monthsrsquo Average Earnings $13684 $13842
Workforce Investment Act Dislocated Worker Program
Entered Employment Rate 612 60
Employment Retention Rate 844 838
Six Monthrsquos Average Earnings $16364 $15997
Workforce Investment Act Youth Program
Placement in Employment or Education Rate 664 690
Attainment of Degree or Certificate Rate 623 684
Percentage of Students Who Achieve Literacy and Numeracy Gains of One Adult Basic Education Level 469 525
YouthBuild7
Placement in Employment or Education Rate 500 519
Attainment of Degree or Certificate Rate 672 672
Percentage of Students Who Achieve Literacy and Numeracy Gains 585 595
Workforce Investment Act Youthful Offender Initiative
Placement Rate for Youth Ages 18 and Above8 352 362
Recidivism Rate for Youth Ages 14 to 17 16 24
Recidivism Rate for Youth Ages 18 to Above 17 16
1 Cumulative four quarters unless otherwise indicated 2 H-2A Measure changed Q2 FY 2014 3 Entered Employment Rate is based on Unemployment Insurance Wage Record and Grantee Supplemental Data for the exit cohort
October 1 2012 ndash September 30 2013 Employment Retention Rate is based on Unemployment Insurance Wage Record and Grantee Supplemental Data for the exit cohort April 1 2012 ndash March 31 2013 Six Monthsrsquo Average Earnings are based on Unemployment Insurance Wage Record only for the exit cohort April 1 2012 ndash March 31 2013
4 Data reported semi-annually and annually Results above are reflective of the period from April 1 2013 through March 31 2014 5 Results are cumulative for currently operating projects 6 The results are for Fiscal Year 2014 (October 1 2013 ndash September 30 2014) 7 The results are program-to-date for the aggregate of all grant cycles of YouthBuild beginning with the 2007 grant class 8 Program-to-date for currently operating projects
6
WORKFORCE SYSTEM RESULTS
Additional Program Year 2013 Quarterly Data
100 $15000
80 $13000
60 $11000
40 $9000
20 $7000
0 Sep-12 Dec-12 Mar-13 Jun-13 Sep-13 Dec-13 Mar-14 Jun-14
$5000
n Entered Employment Rate n Employment Retention Rate n Six Months Average Earnings
Indian and Native American Adult Program (INAP) httpwwwdoletagovdinap
Program Description The Indian and Native American Program (INAP) provides employment and training grants to Indian Tribes nonprofit tribal organizations Alaska Native entities and Native Hawaiian organizations with comprehensive employment and training services designed to increase the ability of program participants to compete in the new global economy and promote the economic and social development of Indian Alaska Native and Native Hawaiian communities
Quarter Highlights In Program Year 2013 the grantee community and Native American Employment and Training Council to the Secretary of Labor implemented a Pilot Study on credential attainments an innovative effort several years in the making As a result the number of exiters in Program Year 2013 94 percent attained a credential (degree or industry-wide certifications) When tracking exiters who were not in a training program leading to credential while on the program 401 percent received a credential
Analysis Using current wage record data
bull The Entered Employment Rate for the 12 month period ending June 30 2014 was 632 percent an increase of 11 percentage points when compared to the same time period last year
bull The Employment Retention Rate for the 12 month period ending June 30 2014 was 794 percent an increase of 15 percentage points when compared to the same period last year
bull The Six Monthsrsquo Average Earnings for the 12 month period ending June 30 2014 was $9476 a decrease of $195 when compared to the same period last year
Using current grantee supplemental data
bull This quarter 6795 participants received services and 477 participants entered employment Those entering employment decreased by 47 when compared to the same period last year
bull INAP served 11982 individuals during the 12 month period ending on June 30 2014 a decrease of 911 people when compared to the same time period last year
bull Including self-service individuals INAP served 36498 people a decrease of 665 people served when compared to the same period last year
bull 2303 individuals received Work Experience training for the 12 month period ending June 30 2014 an increase of 1206 people when compared to the same period last year
bull 5467 individuals received training services an increase of 403 when compared to the same period last year Of those 142 received On-the-Job Training
bull The percentage of participants who received credentials during the 12 month period ending June 30 2014 is 94 percent and the number of Veterans served is 161
Program Performance
Performance Measure Four Quarters
Ending 063013 Four Quarters
Ending 063014 Entered Employment Rate 621 632
Employment Retention Rate 779 794
Six Months Average Earnings $9671 $9476
Entered Employment Rate is based on Unemployment Insurance Wage Record and Grantee Supplemental Data for the exit cohort October 1 2012 ndash September 30 2013 The Employment Retention Rate is based on Unemployment Insurance Wage Record and Grantee Supplemental Data for the exit cohort April 1 2012 ndash March 31 2013 Six Monthsrsquo Average Earnings are based on Unemployment Insurance Wage Record Data for the exit cohort April 1 2012 ndash March 31 2013
Performance Measure Four Quarters
Ending 093013 Four Quarters
Ending 123113 Four Quarters
Ending 033114
Entered Employment Rate 610 621 622
Employment Retention Rate 784 787 790
Six Monthsrsquo Average Earnings $9746 $9623 $9557
Performance in the Past Eight Quarters
7
WORKFORCE SYSTEM RESULTS
100 $15000
80 $13000
60 $11000
40 $9000
20 $7000
0 Sep-12 Dec-12 Mar-13 Jun-13 Sep-13 Dec-13 Mar-14 Jun-14
$5000
n Entered Employment Rate n Employment Retention Rate n Six Months Average Earnings
National Farmworker Jobs Program (NFJP) httpwwwdoletagovFarmworkerhtmlNFJPcfm
Program Description The National Farmworker Jobs Program (NFJP) assists migrants other seasonally employed farmworkers and their families in achieving economic self-sufficiency and stability through job training and other services that address their employment related needs New job skills training in occupations with higher wages are offered as well as supportive services that help farmworkers stabilize their employment in agriculture Assistance from the NFJP is accessed directly through the grantee organizations and local American Job Centers
Quarter Highlights David came to the Proteus Visalia Service Center in California in April 2014 in search of employment and training services David was a high school graduate with limited job skills and worked as a seasonal farmworker David enrolled in the NFJP and received career assessment case management and energy efficiency training services After several months David successfully graduated and was hired as a junior solar installer by Solar City He is now working full-time earning $1300 per hour
Program Performance
Performance Measure Four Quarters
Ending 063013 Four Quarters
Ending 063014
Entered Employment Rate 855 881
Employment Retention Rate 831 856
Six Monthsrsquo Average Earnings $10533 $10855
Additional Program Year 2013 Quarterly Data
Performance Measure
Four Quarters
Ending 093013
Four Quarters
Ending 123113
Four Quarters
Ending 033114
Entered Employment Rate 862 876 884
Employment Retention Rate 836 840 850
Six Monthsrsquo Average Earnings $10439 $10433 $10605
Performance in the Past Eight Quarters
Analysis bull The Entered Employment Rate of 881 percent exceeds the programrsquos performance goal of
861 percent and is a 26 percentage point improvement from the same quarter one year ago bull The Employment Retention Rate of 856 percent exceeds the performance goal of 832
percent and shows a 25 percentage point improvement from the same quarter one year ago bull The Six Months Average Earnings result of $10855 exceeds the programrsquos performance
goal of $10501 and is $322 more when compared to the same reporting period one year ago
8
WORKFORCE SYSTEM RESULTS
100 $8000
80
60 $7000
40 $6000
20
0
n Entered Employment Rate n Employment Retention Rate n Six Month
Dec-13Sep-13Jun-13Mar-13 Dec-12Sep-12 $5000
s Average Earnings
Jun-14Mar-14
Senior Community Service Employment Program (SCSEP) httpwwwdoletagovseniors
Program Description Authorized by the Older Americans Act of 1965 the Senior Community Service Employment Program (SCSEP) is designed to foster individual economic self-sufficiency and promote useful opportunities in community service employment for unemployed low-income persons (particularly persons who have poor employment prospects) who are age 55 or older and to increase the number of persons who may benefit from unsubsidized employment in the public and private sectors
Quarter Highlights A former Vietnam Veteran Mr S and his wife returned to a small town in New Mexico to take care of his ailing parents During the next couple of years his parents passed away his wife died unexpectedly and he lost the family home Homeless Mr S did odd jobs in the community in exchange for necessities Eventually a member of his church gave him a room and told him about Goodwill Industries of Central New Mexicorsquos SCSEP program Goodwill placed Mr S in a training site at the local community center where he had already developed strong relationships with staff and guests The money he earned from SCSEP allowed him to move into an apartment Through the program Mr S developed confidence in his skills and abilities and with the help of Goodwillrsquos SCSEP staff he obtained a job at the local Goodwill store where he currently manages the donation site He says he loves his job and with his salary can afford a much better place to live Mr S continues to volunteer at the local community center by shopping for elderly in the community
Program Performance
Performance Measure Four Quarters
Ending 063013 Four Quarters
Ending 063014
Entered Employment Rate 425 452
Employment Retention Rate 744 731
Six Monthsrsquo Average Earnings $7163 $7446
Additional Program Year 2013 Quarterly Data
Performance Measure
Four Quarters
Ending 093013
Four Quarters
Ending 123113
Four Quarters
Ending 033114
Entered Employment Rate 427 428 433
Employment Retention Rate 722 712 702
Six Monthsrsquo Average Earnings $7329 $7437 $7378
Performance in the Past Eight Quarters
Analysis In Program Year 2013 67814 people were served by the program and 12 percent of those people were Veterans SCSEP participants recorded 35746097 hours of community service Six Monthsrsquo Average Earnings are higher than a year ago which is expected with a recovering economy Eighty-eight percent of participants were at or below poverty level Comparing Program Year 2013 with Program Year 2012
bull The Entered Employment Rate increased 27 percentage points from one year ago bull The Employment Retention Rate decreased 13 percentage points from one year ago bull Six Monthsrsquo Average Earnings increased almost four percentage points from one year ago
9
WORKFORCE SYSTEM RESULTS
100
80
60
40
20
0 Sep-12 Dec-12 Mar-13 Jun-13 Sep-13 Dec-13 Mar-14 Jun-14
n Entered Employment Rate n Employment Retention Rate n Six Months Average Earnings
$15000
$13000
$11000
$9000
$7000
$5000
Wagner-Peyser Employment Service httpwwwdoletagovProgramsWagner_Peysercfm
Program Description Wagner-Peyser Employment Service is an integral part of the American Job Center network formerly known as One-Stop Career Centers delivery system which provides universal access to workers job seekers and businesses The Employment Service focuses on providing a variety of employment related services including but not limited to job search assistance job referral and placement assistance for job seekers reshyemployment services to unemployment insurance claimants and recruitment services to employers with job openings Services are provided in one of three modes of delivery approaches self-service facilitated self-help service and staff-assisted service
Quarter Highlights When Mylan Pharmaceuticals Inc the third largest generic and pharmaceuticals company in the world needed to increase its production team at its Morgantown West Virginia location it was receiving over 100000 resumes and was overwhelmed with interested job seekers for openings to fill Plant Manufacturing Laborer positions With a starting pay of $1800 per hour the positions at Mylan are very attractive and turned to WorkForce (WF) West Virginia for labor exchange assistance beginning a success story of cooperation between private industry and a State agency WF West Virginia was able to help screen job seekers for Mylan and the plant hired 177 participants including 21 Veterans a higher representation than overall Veterans in the labor force (118 percent versus approximately seven percent)
Program Performance
Performance Measure Four Quarters
Ending 063013 Four Quarters
Ending 063014
Entered Employment Rate 530 560
Employment Retention Rate 810 820
Six Monthsrsquo Average Earnings $14252 $14515
Additional Program Year 2013 Quarterly Data
Performance Measure
Four Quarters
Ending 093013
Four Quarters
Ending 123113
Four Quarters
Ending 033114
Entered Employment Rate 530 530
Employment Retention Rate 810 810
Six Monthsrsquo Average Earnings $14129 $14175
Performance in the Past Eight Quarters
540
810
$14265
Analysis bull Over 16 million people received services from the Wagner-Peyser Employment Service
between July 1 2013 and June 30 2014 bull Over 11 million Veterans received services between July 1 2013 and June 30 2014 bull Nearly 35 million unemployed individuals entered employment after receiving services
from the Employment Service between July 1 2013 and June 30 2014
10
WORKFORCE SYSTEM RESULTS
100 $15000
80 $13000
60 $11000
40 $9000
20 $7000
0 Jun-12 Jun-13 Jun-14
$5000
n Entered Employment Rate n Employment Retention Rate n Six Months Average Earnings
Workforce Investment Act Adult Program httpwwwdoletagovprogramsgeneral_infocfm
Program Description The Workforce Investment Act (WIA) Adult Program helps prepare low-skill adult workers for good jobs through formula grants to States States use the funds to provide employment and training services through a network of American Job Centers of which there were nearly 2500 across the United States as of June 30 2014
WIA provides employment and training services at three broad service levels to job seeker customers core intensive and training These services are provided at a level which most efficiently meets their needs to achieve gainful employment The program is also designed to assist employer customers meet their needs for skilled workers
Adult Programs serve the broadest range of individuals including but not limited to public assistance recipients Unemployment Insurance claimants Veterans people with disabilities dislocated workers migrant and seasonal farmworkers Indian and Native Americans and workers age 55 or older
Quarter Highlights In Virginia the GoodwillWIA Adult program assists with the funding for Patient Care Technician (PCT) training provided by Fast Track Health The cost of training is approximately $3450 and the training is eleven weeks in duration This training provides a certificate in CNA EKG CPR and Phlebotomy with the certificationlicensing costs included in the overall training cost Ms O was referred to the WIA Adult program by a local Virginia Employment Commission representative She attended an orientation and started the process of changing her life that very day Ms O excelled and received a 100 percent increase in salary after completing training through this program with Fast Track Ms O stated of her experience ldquoI am very happy with my new career and very grateful for Goodwill and the WIA Adult program for providing [me] with this opportunity to enter a career with so much potential for advancementrdquo
Analysis bull In Program Year 2013 the WIA Adult program served 7184946 participants and over
150000 participants received training services bull Participants who received training services had a 761 percent Entered Employment
Rate in Program Year 2013 15 percentage points higher than the overall Entered Employment Rate of 611 percent
Program Performance
Performance Measure
Four Quarters
Ending 063012
(Program Year 2011)
Four Quarters
Ending 063013
(Program Year 2012)
Four Quarters
Ending 063014
(Program Year 2013)
Entered Employment Rate 572 599 611
Employment Retention Rate 808 819 828
Six Monthsrsquo Average Earnings $13482 $13335 $13842
Performance in the Past Three Program Years
11
WORKFORCE SYSTEM RESULTS
100 $19000
$1700080
$15000 60 $13000
$1100040 $9000
20 $7000
0 $5000 Jun-12 Jun-13 Jun-14
n Entered Employment Rate n Employment Retention Rate n Six Months Average Earnings
Workforce Investment Act Dislocated Worker Program httpwwwdoletagovprogramsgeneral_infocfm
Program Description The Workforce Investment Act Dislocated Worker Program funds services to support the reemployment of laid-off workers The Department of Labor allocates 80 percent of funds by formula to the States The Secretary of Labor may use the remaining 20 percent for National Emergency Grantsmdashthese specially targeted funds can infuse resources to areas suffering most from plant closings mass layoffs or job losses due to natural disasters or military base realignment and closures States allocate their Dislocated Worker funds to their local workforce investment areas Additionally the program allows for States to reserve up to 25 percent of their Dislocated Worker funds for Rapid Response activities Rapid Response is a pro-active business-focused and flexible strategy to help growing companies access an available pool of skilled workers and can respond to layoffs by quickly coordinating services and aid to companies and their workers
Program Performance
Performance Measure
Four Quarters
Ending 063012
(Program Year 2011)
Four Quarters
Ending 063013
(Program Year 2012)
Four Quarters
Ending 063014
(Program Year 2013)
Entered Employment Rate 611 600 600
Employment Retention Rate 842 843 838
Six Monthsrsquo Average Earnings $16500 $15930 $15997
Performance in the Past Three Program Years
Quarter Highlights After Kyle was laid off he was able to utilize an On-the-Job Training (OJT) opportunity with Tyson He now works the second shift from 1-9 pm and was able to obtain the technical training he felt he did not obtain from prior employment or education ldquoI wanted to get more experience on how things technically operate and this program is the perfect fit for merdquo Kyle said And in the end Tyson gained a skilled employee
Analysis bull The Dislocated Worker program served over 800000 participants in Program Year 2013
and provided training services to 109148 participants bull Participants who received training had an 814 percent Entered Employment Rate 214
percentage points higher than the overall Entered Employment Rate of 60 percent
12
WORKFORCE SYSTEM RESULTS
500 100
400 80
300 60
Days
200 40
100 20
0 0 Jun-13 Sep-13 Dec-13 Mar-14 Jun-14
n Average Number of Days to Resolve PERM Applications Not Subject to Integrity Review n Average Number of Days to Resolve PERM Applications Subject to Integrity Review (Audit) n Percent of H1-B Applications Processed within Seven Days of Filing
H-1B and Permanent Foreign Labor Certification (PERM) httpwwwforeignlaborcertdoletagov
Program Description Performance in the Past Five Quarters
H-1B certification permits employers to hire on a temporary basis foreign workers who possess qualifying professional or specialty skills The PERM program allows employers to begin the process for permanently hiring a foreign worker when there are not sufficient numbers of US workers who are able willing qualified and available to perform the job In addition the program ensures that the employment of the foreign worker does not adversely affect the wages and working conditions of American workers who are similarly employed
Program Performance
Performance Measure Four Quarters
Ending 063013 Four Quarters
Ending 063014
Percent of H-1B Applications Resolved in Seven Business Days
100 100
Quarter Highlights Average number of days to resolve PERM applications not subject to integrity review
129 194
The percent of employer applications processed within seven days of filing under the H-1B program sustains at approximately 100 percent ending in June 30 2014
Average number of days to resolve PERM applications subject to integrity review (Audit)
294 424 The Office of Foreign Labor Certification (OFLC) continues to allocate staff resources for the PERM program to increase program integrity by conducting more audit examinations and supervised recruitments This increased emphasis on program integrity has had an effect on processing timeliness
Additional Program Year 2013 Quarterly Data
Performance Measure
Four Quarters
Ending 093013
Four Quarters
Ending 123113
Four Quarters
Ending 033114
Analysis bull The number of H-1B applications processed within seven business days held steady
at 100 percent from the same four quarter reporting period one year ago Of the total 103032 H-1B applications processed over the past four quarters 103032 were completed within seven business days of the filing date
Percent of H-1B Applications Resolved in Seven Business Days
100 804 996 bull The average number of days to resolve PERM applications not subject to integrity review decreased by 20 percent compared to the previous quarter and the average number of days to resolve PERM applications subject to integrity review (Audits) decreased by four percent compared to the previous quarter
Average number of days to resolve PERM applications not subject to integrity review
178 237 234
Average number of days to resolve PERM applications subject to integrity review (Audit)
320 423 444
13
WORKFORCE SYSTEM RESULTS
100
80
60
40
20
0 Jun-13 Sep-13 Dec-13 Mar-14 Jun-14
n Percent of Accepted H-2A Applications Without Deficiencies Resolved by 30 Days Before the Date of Need n Percent of H-2B Applications Resolved Within 30 Days of Receipt
H-2A and H-2B Foreign Labor Certification Programs httpwwwforeignlaborcertdoletagov
Program Description H-2A labor certification permits employers to hire foreign workers on a temporary basis for the agricultural sector of the economy H-2B labor certification permits employers to hire foreign workers to come to the United States and perform temporary nonagricultural work which must be one-time seasonal peak load or intermittent in nature
Program Performance
Performance Measure Four Quarters
Ending 063013 Four Quarters
Ending 063014
Percent of Complete H-2A Employer Applications Resolved Within 30 Days Before the Date of Need
NA 97
Percent of H-2B Applications Resolved Within 30 Days
23 97
Additional Program Year 2013 Quarterly Data
Performance Measure
Four Quarters
Ending 093013
Four Quarters
Ending 123113
Four Quarters
Ending 033114
Percent of Complete H-2A Employer Applications Resolved Within 30 Days Before the Date of Need
NA NA 84
Percent of H-2B Applications Resolved Within 30 Days
98 92 99
The Percent of Complete H-2A Employer Applications Resolved Within 30 days Before the Date of Need measure was changed in the second quarter of Fiscal Year 2014
Performance in the Past Five Quarters
Quarter Highlights The Office of Foreign Labor Certification (OFLC) continues to resolve approximately 971 percent of complete H-2A applications on time The processing rates have improved in spite of an increase in the numbers of applications filed during this reporting period FY 2014 when compared to one year ago
Employer filings under the H-2B program have increased 167 percent this reporting period compared to the same four quarter reporting period one year ago
Analysis bull The percentage of H-2A applications resolved within 30 calendar days increased 125
percentage points from the previous quarter Of the 3845 total of H-2A applications processed in Fiscal Year 2014 908 percent were resolved within 30 calendar days of the filing date
bull The percentage of H-2B applications processed within 30 calendar days increased when compared with the same reporting period one year ago Of the 5188 H-2B applications processed within the last four quarters 998 percent of them were processed within 60 calendar days of the filing date
14
WORKFORCE SYSTEM RESULTS
100
80
60
40
20
0 Sep-12 Dec-12 Mar-13 Jun-13 Sep-13 Dec-13 Mar-14 Jun-14
$15000
$13000
$11000
$9000
$7000
$5000
n Entered EmploymentPlacement Rate n Employment Retention Rate n Six Months Average Earnings
Reintegration of Ex-Offenders (RExO-ADULT) httpwwwdoletagovRExOeta_defaultcfm
Program Description The Reintegration of Ex-Offenders ndash Adult Program (RExO-Adult) is an employment-centered program that seeks to strengthen urban communities that have large numbers of returning prisoners The program incorporates mentoring job training and other comprehensive transitional services It is designed to reduce recidivism by helping inmates find work when they return to their communities as part of an effort to improve community life
Quarter Highlights The Adult RExO Program operated three initiatives this program year
bull Grants to community and faith-based organizations to help returning offenders find employment
bull Grants aimed specifically at serving female offenders providing employment and supportive services
bull Grants to provide occupational training and job placement to offenders in Halfway Houses
Program Performance
Performance Measure Quarter Ending
063013
Quarter Ending
063014
Entered Employment Rate
58 58
Employment Retention Rate
68 72
Six Monthsrsquo Average Earnings
$9797 $9770
The data for June 30 2013 are program-to-date since the inception of the program in the Spring of 2006 The June 30 2014 numbers are program-to-date for currently operating projects
Additional Program Year 2013 Quarterly Data
Performance Measure Quarter Ending
093013
Quarter Ending
123113
Quarter Ending
033114
Entered Employment Rate
55 56
Employment Retention Rate
66 68 70
Six Monthsrsquo Average Earnings
$10036 $9962 $9736
Performance in the Past Eight Quarters
58
Analysis The Adult RExO Program served 6308 participants this program year
bull Adult RExO Grantees reported 3404 enrollees receiving training or education bull Adult RExO Grantees reported 2555 enrollees receiving a certificate bull The recidivism rate largely reflects the extent to which the program is serving persons
at high or low risk of re-offending
15
WORKFORCE SYSTEM RESULTS
Registered Apprenticeship httpwwwdoletagovoa
Program Description Registered Apprenticeship is a leader in preparing American workers to compete in a global 21st Century economy With a network of over 150000 employers in more than 1000 occupations Registered Apprenticeship has already trained millions of Americarsquos workers Modern apprenticeships are now on the cutting edge of innovation in preparing a skilled workforce for todayrsquos industries including expanding industries like health care information technology transportation telecommunications and advanced manufacturing as well as in industries like construction where apprenticeships have a long and successful history
Quarter Highlights During the summer of 2014 the White House hosted the first-ever Summit on Apprenticeship to gather the best ideas and to catalyze action to dramatically increase apprenticeship in America More than 60 attendees presented their ideas including leading employers big and small like IBM Bank of America Blue CrossBlue Shield and Oberg Industries labor unions like the International Brotherhood of Electrical Workers (IBEW) training providers like Ivy Tech and Lone Star Community Colleges and local workforce leaders The event was the apex in a series of industry roundtables on apprenticeship which took place across the country during June amp July 2014
Program Performance
Performance Measure Four Quarters
Ending 063013 Four Quarters
Ending 063014
Entered Employment Rate 734 742
Employment Retention Rate 873 878
Six Monthsrsquo Average Earnings $23826 $24387
Performance Measure Quarter Ending
063013 Quarter Ending
063014
Apprentices
Total Apprentices (Active Apprentices)
148039 152582
New Apprentices 17432 17011
Programs
New Programs 139
Programs Maintained Total (Active Programs)
9809 9077
Number of new programs in Construction and Manufacturing
93
Source Registered Apprenticeship Partners Information Management Data System (RAPIDS) data managed by Department of Labor staff only 063013 data has been revised to include federal data only Running total of active apprenticesprograms during the quarter
16
177
127
WORKFORCE SYSTEM RESULTS
0
20
40
60
80
100
Sep-12 Dec-12 Mar-13 Jun-13 Sep-13 Dec-13 Mar-14 Jun-14 $5000 $7000 $9000 $11000 $13000 $15000 $17000 $19000 $21000 $23000 $25000
n Entered Employment Rate n Employment Retention Rate n Six Months Average Earnings
Registered Apprenticeship httpwwwdoletagovoa
Additional Program Year 2013 Quarterly Data
Performance Measure
Four Quarters
Ending 093013
Four Quarters
Ending 123113
Four Quarters
Ending 033114
Entered Employment Rate 735 738 738
Employment Retention Rate 874 877 878
Six Monthsrsquo Average Earnings $24171 $24324 $24378
Performance in the Past Eight Quarters
Analysis bull During the third quarter of Fiscal Year 2014 there were over 394000 active apprentices
nationwide while over 13000 program participants completed their apprenticeship and received a credential that is portable industry recognized and can provide a pathway to middle-class and sustainable careers
bull The Entered Employment Rate for participants who completed their Registered Apprenticeship program was 856 percent 114 percentage points higher than for all program exiters who either completed or cancelled (742 percent as shown in table on the previous page)
bull The Employment Retention Rate for program completers was 910 percent 32 percentage points higher than for all program exiters (878 percent as shown in table on the previous page)
bull The Six Monthsrsquo Average Earnings for program completers was $29964 which is over $5577 more than that of all program exiters (ie completers or those who cancelled) The results for those completing the program shows it pays to stay
17
WORKFORCE SYSTEM RESULTS
100
80
60
40
20
0 Sep-12 Dec-12 Mar-13 June-13 Sep-13 Dec-13 Mar-14 Jun-14
n Entered Employment Rate n Employment Retention Rate n Six Months Average Earnings
$25000
$21000
$17000
$13000
$9000
$5000
Trade Adjustment Assistance (TAA) httpwwwdoletagovtradeact
Program Description The Trade Adjustment Assistance (TAA) Program is an integral part of the comprehensive workforce development system The program is essential to helping workers dislocated by foreign trade to adjust to changing market conditions and shifting skill requirements Addressing the needs of trade-affected workers involved in this transformation is a unique challenge because in general these workers are being dislocated from relatively outdated-skill high-wage employment In many cases this is complicated by mass layoffs or plant closures that occur in single-industry towns which makes finding comparable employment in the same geographic area difficult Furthermore many of these jobs are lost permanently from the domestic economy requiring affected workers to completely retool their skills
Fiscal Year Highlights During Fiscal Year 2014 Massachusetts diligently trained staff at the local CareerOneStop Centers to ascertain a TAA participantrsquos eligibility for other funding resources to assist in their reemployment initiatives These improved efforts to provide and report reemployment services enables Trade customers to flow through the CareerOneStop Center system with other dislocated workers and receive seamless resources through the resource sharing initiatives of the Career Center methodology These streamlined reemployment services have resulted in an Entered Employment Rate of 815 percent nearly ten percentage points higher than the national average
Program Performance
Performance Measure FY 2011 FY 2012 FY 2013 FY 2014
Entered Employment Rate 653 689 716 729
Employment Retention Rate 897 913 917 911
Six Monthsrsquo Average Earnings $18319 $18837 $18099 $17828
Performance Measure Quarter Ending 063013 Quarter Ending 063014
Entered Employment Rate 733 728
Employment Retention Rate 900 927
Six Monthsrsquo Average Earnings $18210 $17692
Additional Program Year 2013 Quarterly Data
Performance Measure Quarter Ending
093013
Quarter Ending
123013
Quarter Ending
033014
Entered Employment Rate 713 713
Employment Retention Rate 918 918
Six Monthsrsquo Average Earnings $17499 $17499
Performance in the Past Eight Quarters
727
917
$17550
Analysis During Fiscal Year 2014 there were 62706 total participants receiving TAA benefits or services and 20577 exiters entered employment (729 percent) More than one-third of all participants were minorities with the average age of participants being 47 years and the average tenure being approximately 13 years 9547 exiter participants received credentials or 83 percent of all exiter participants who completed training 32527 participants received training or approximately 52 percent of all participants Lastly the program served 4828 Veteran participants accounting for approximately eight percent of all participants
18
WORKFORCE SYSTEM RESULTS
Unemployment Insurance (UI) httpouidoletagovunemploy
Program Description The federal-state Unemployment Insurance (UI) System minimizes individual and family financial hardship due to unemployment and stabilizes the economy during economic downturns by providing unemployed workers with temporary income support States operate their own Unemployment Insurance Programs regulated by State laws
As the Federal partner DOL provides program leadership allocates administrative funds provides technical assistance and exercises performance oversight
Quarter Highlights As the economy improved the system emphasized program integrity solvency and reemployment Claims rates decreased about 10 percent from the year before and Trust Fund loans decreased from $21 billion to $14 billion EUC benefit payments ceased on December 28 2013 Twenty-four states implemented Short-term Compensation programs allowing unemployed workers to stay on jobs while receiving partial unemployment benefits proportionate to reduced work hours States implemented systems to improve efficiency and reduce overpayments such as data exchange and recover UI overpayments By June 30 2014 42 states were recovering overpayments through Federal Income tax refund offset (TOP) and had recovered $370 million in 2014 (over $840 million since TOPrsquos inception)
Analysis During the year ending June 30 2014
bull 51 million UI claimants were reemployed in the quarter following their UI 1st payments (17 million in the last quarter)
bull The UI system met two and failed two of its four targets UI met detection of overpayments (643 percent vs target of 542 percent) and met reemployment (657 percent vs target of 647 percent)
bull The system fell short of its 1st pay and status targets because of retirements and other turnover of key staff
Program Performance
Performance Measure Four Quarters
Ending 063013 Four Quarters
Ending 063014
Percent of Intrastate Payments Made Timely
812 792
Detection of Recoverable Overpayments Rate
598 643
Facilitation of Reemployment Rate 6261 6552
Percent of Employer Tax Liability 888 882
Operational Results
Recipiency Rate 263 272
Exhaustion Rate 456 431
Percent of Recipients of Prime Working Age (25-54)
702 700
Percent of Recipients Who Are Female
434 437
New Initial Unemployment Insurance Claims
13906868 12501014
Number of First Unemployment Insurance Payments
8404507 7632522
Average Duration of Unemployment Insurance (Weeks)
169
1 Reemployment for year ending June 30 2013 2 Reemployment for year ending June 30 2014
19
167
WORKFORCE SYSTEM RESULTS
Unemployment Insurance (UI) httpouidoletagovunemploy
Additional Program Year 2013 Quarterly Data
Performance Measure Four Quarters
Ending 093013 Four Quarters
Ending 123113 Four Quarters
Ending 033114
Percent of Intrastate Payments Made Timely
809 802 793
Detection of Recoverable Overpayments Rate
590 630 603
Facilitation of Reemployment Rate 6311 6312 6363
Percent of Employer Tax Liability 886 885 884
Operational Results
Recipiency Rate 263 262 267
Exhaustion Rate 453 446 437
Percent of Recipients of Prime Working Age (25-54)
702 702 701
Percent of Recipients Who Are Female
434 434 435
New Initial Unemployment Insurance Claims
13559233 13340263 12947493
Number of First Unemployment Insurance Payments
8215687 7967852 7857395
Average Duration of Unemployment Insurance (Weeks)
169 169 168
1 Reemployment for year ending September 30 2013 2 Reemployment for year ending December 31 2013 3 Reemployment for year ending March 31 2014
20
WORKFORCE SYSTEM RESULTS
100
80
60
40
20
0 Sep-12 Dec-12 Mar-13 Jun-13 Sep-13 Dec-13 Mar-14 Jun-14
n Placement in Employment or Education n Attainment of a Degree or Certificate n LiteracyNumeracy Gains
Job Corps httpwwwjobcorpsgovhomeaspx
Program Description Job Corps is the nationrsquos largest residential educational and career technical training program for at-risk youth ages 16 through 24 The 125 Job Corps centers nationwide provide an integrated comprehensive array of services that include academic career technical and life skills training career planning and work-based learning health care and post-program placement and transition support
Job Corps is committed to offering all students a safe drug-free environment where they can take advantage of the resources provided Job Corpsrsquo mission is to attract eligible young people teach them the skills they need to become employable and independent and place them in meaningful jobs or further education
Program Performance
Performance Measure Four Quarters
Ending 063013 Four Quarters
Ending 063014
Placement in Employment or Education 746 767
Attainment of a Degree or Certificate 706 668
LiteracyNumeracy Gains 692 661
Additional Program Year 2013 Quarterly Data
Performance Measure
Four Quarters
Ending 093013
Four Quarters
Ending 123113
Four Quarters
Ending 033114
Placement in Employment or Education 757 760 765
Attainment of a Degree or Certificate 722 727 707
LiteracyNumeracy Gains 702 709 695
Performance in the Past Eight Quarters
The Performance in the Past Eight Quarters graph displays single quarter data versus the Program Performance tables which depict cumulative four quarter data
Quarter Highlights In May 2014 four Job Corps students from centers in Montana California Iowa and Virginia participated in the 2nd Asia-Pacific Economic Cooperation (APEC) Youth Skills Camp in Beijing and Guangzhou China the second time Job Corps students have participated in this event The camp included field visits to vocational training schools business enterprises and public practical training facilities as well as skills exchanges This international event provides students with life-changing experiences in travel diversity and first-hand exposure to global issues
Analysis bull During the current quarter Job Corps served 69979 participants including 13079 new
enrollees an increase of 801 percent overall compared to the same quarter in PY 2013 and due to the resumption of new enrollments after the PY 2012 enrollment suspensions The number of new students increased by over 200 percent from the same quarter in PY 2013
bull The proportion of 16-17 year olds served increased by 45 percentage points Conversely the proportion of all older students served similarly decreased from the same quarter in PY 2013
bull In the current quarter Job Corps placed 7203 students in Employment and Education a slight decrease of 04 percentage points compared to the same quarter last year In addition 8657 students attained a Certificate a 131 percentage point decrease compared to the same quarter in PY 2013 Also 6789 students attained a LiteracyNumeracy gain an 116 percentage point decrease over the same quarter in PY 2013
bull In the current quarter the program served 50 participants who were Veterans prior to enrollment bull When comparing the four quarter data Placement in Employment or Education increased
21 percentage points Attainment of a Degree or Certificate decreased 38 percentage points and LiteracyNumeracy Gains decreased 31 percentage points from the same quarter one year ago 21
WORKFORCE SYSTEM RESULTS
100
80
60
40
20
0 Sep-12 Dec-12 Mar-13 Jun-13 Sep-13 Dec-13 Mar-14 Jun-14
n Placement Rate for Out-of-School Youth Ages 18 and Above n Recidivism Rate for Youth Ages 14 to 17 n Recidivism Rate for Youth Ages 18 and Above
Workforce Investment Act Youthful Offender Initiative httpwwwdoletagovYouth_servicesyouthful_offendercfm
Program Description The Employment and Training Administration uses its Youthful Offender Appropriation to fund a variety of projects that target youth offenders and young adult offenders Currently operating projects include grants to community-based organizations to involve juvenile offenders in training and service learning projects grants to intermediary organizations to serve young offenders in high-poverty high-crime communities and grants to help youth enter diversion programs as an alternative to out-of-home placements and to assist eligible youth have their juvenile records sealed or expunged
Quarter Highlights The great majority of juvenile offenders are of ages 17 and below and many are still in high school The youth offender grants focus on helping younger youth stay in school and complete their education and helping older youth find jobs and succeed in the labor market Case management mentoring and supportive services are also provided by these grants
Performance in the Past Eight Quarters
Program Performance
Performance Measure Four Quarters
Ending 063013 Four Quarters
Ending 063014
Placement Rate for Youth Ages 18 and Above
36 362
Recidivism Rate for Youth Ages 14 to 17
35 24
Recidivism Rate for Youth Ages 18 and Above
34 16
Results are cumulative for currently operating grants
Additional Program Year 2013 Quarterly Data
Placement Rate for Youth Ages 18 and Above
277 334 325
Performance Measure
Four Quarters
Ending 093013
Four Quarters
Ending 123113
Four Quarters
Ending 033114
Recidivism Rate for Youth Ages 14 to 17
349 349 349
Recidivism Rate for Youth Ages 18 and Above
335 335 335
Analysis bull Providing opportunities to youthful offenders results in varying outcomes depending on
the mix of projects being operated in a given year bull Projects have markedly different placement and recidivism rates depending on whether
they are serving young adults in their 20s or youth ages 16-17 they recruit youth in the community or through direct referrals from the juvenile justice system whether they are located in small or large cities and the extent to which enrollees are at high or low risk of re-offending
22
WORKFORCE SYSTEM RESULTS
100
80
60
40
20
0 Jun-12 Jun-13 Jun-14
n Placement in Employment or Education n Attainment of a Degree or Certificate n LiteracyNumeracy Gains
Workforce Investment Act Youth Program httpwwwdoletagovyouth_services
Program Description The Workforce Investment Act Youth Formula Program provides employment and education services to eligible low-income youth ages 14 to 21 who face barriers to employment The program serves in-school and out-of-school youth youth with disabilities and low literacy rates as well as others who may require additional assistance to complete an educational program and acquire an industry-recognized credential or enter employment
Quarter Highlights The passage of the Workforce Innovation and Opportunity Act (WIOA) includes a major shift in focus to spending more funds on and serving more out-of-school youth (OSY) The workforce system demonstrated its readiness for this shift in that 48 percent of all youth served in PY 2013 were OSY and 57 percent of all WIA youth local area funds were spent on OSY So far in Program Year 2013 California has spent almost 65 percent of their WIA youth funds on OSY with high levels of OSY expenditures in both urban and rural areas 53 percent of all youth served in CA in Program Year 2013 were OSY For example Los Angeles City spent 80 percent of their funds on OSY and the Northern Rural Training and Employment Consortium spent 76 percent of their funds on OSY Both local areas have achieved these levels through strong partnerships with organizations that serve OSY as well as access to high quality work experiences
Program Performance
Performance Measure
Four Quarters
Ending 063012
(Program Year 2011)
Four Quarters
Ending 063013
(Program Year 2012)
Four Quarters
Ending 063014
(Program Year 2013)
Placement in Employment or Education 589 666 690
Attainment of a Degree or Certificate 648 675 684
LiteracyNumeracy Gains 476 509 525
Performance in the Past Three Program Years
Analysis bull 197045 participants were served in the cumulative four quarter reporting period compared
to 217244 served during the same time period last year This decrease is due primarily to a lower funding level compared to the previous year
bull Placement in Employment or Education achieved a result of 690 percent a 24 percentage point increase when compared with the same time period last year
bull The program achieved a result of 684 percent for the Attainment of a Degree or Certificate measure This is a 09 percentage point increase from the same time period last year
bull The LiteracyNumeracy Gains measure achieved a result of 525 percent an increase of 16 percentage points when compared with the same time period last year
bull All three youth common measures exceeded Program Year 2013 GPRA goals
23
WORKFORCE SYSTEM RESULTS
100
80
60
40
20
0 Sep-12 Dec-12 Mar-13 Jun-13 Sep-13 Dec-13 Mar-14 Jun-14
n Placement in Employment or Education n Attainment of a Degree or Certificate n LiteracyNumeracy Gains
YouthBuild httpwwwdoletagovyouth_servicesyouthbuildcfm
Program Description YouthBuild provides job training and educational opportunities for at-risk youth ages 16 to 24 while constructing or rehabilitating affordable housing for low-income or homeless families in their own neighborhoods The youth split their time between the construction site and the classroom where they earn their high school diploma or equivalency learn to be community leaders and prepare for college and other post-secondary training opportunities
Analysis bull 33392 participants have been enrolled into the YouthBuild program since 2007 and 29553
have exited so far bull Since the program began a total of 11716 participants have received a high school
diploma or equivalency 17572 have attained an industry-recognized certificate and 21835 have been placed into initial jobs post-secondary education andor long-term vocational occupational skills training including apprenticeship
bull The Class of 20102011 performance steadily increased The outcomes for all three measures were above those for the Class of 2009 and significantly above the GPRA goals
bull YouthBuild is currently meeting or exceeding the GPRA goal for all three measures The additional quarter of service for 20102011 grants provided additional positive outcomes as expected As the 2012 grant class progresses it is expected that this trend will continue
Program Performance
Quarter Highlights Just A Start in Cambridge (MA) has been a YouthBuild grantee since 2010 In the fourth quarter of the Program Year 2013 they shared the following success story
Victor earned a High School Diploma and HBIPACT construction certification He was accepted to Endicott College in MA He also secured a full time painting position with George Souza Painting making $25 per hour He continues to develop his career plan with staff
Class of 20102011 Performance in the Past Eight Quarters
Performance Measure GPRA Results for Class
0f 20102011 Results for Class 2012 Overall Results
Percent of Participants Entering Employment or Enrolling in Postsecondary Education the Military or Advanced Training Occupational Skills Training in the First Quarter After Exit
500 612 586 519
Percent of Youth Who Attain a Diploma GED or Certificate by the End of the Third Quarter after Exit
672 770 609 672
Percent of Participants Deficient in Basic Skills Who Achieve Literacy or Numeracy Gains of One Adult Basic Education Level
585 676 549 595
24
WORKFORCE SYSTEM RESULTS
100
80
60
40
20
0 Sep-12 Dec-12 Mar-13 Jun-13 Sep-13 Dec-13 Mar-14 Jun-14
n Attainment of a High School Diploma GED or improvement of basic skills by at least two grade levels or completed Occupational Skills training n Participants who Attained Two or more Goals
Indian and Native American Youth Program httpwwwdoletagovdinap
Program Description The Indian and Native American Supplemental Youth Services Program provides summer and year-round employment and training activities for Indian Alaska Native and Native Hawaiian individuals between the ages of 14 and 21 Program resources are targeted to at-risk and the neediest youth who face substantial barriers to education and employment success This population includes high school dropouts and youth who are basic-skills deficient
Quarter Highlights Youth summer employment is a high priority for Native American Tribes However most rural reservation areas do not have enough employers to put youth to work during the summer As a result Tribes rely on the annual WIA Section 166 funding to place youth in summer employment where they can earn a wage and receive valuable work experience
Over the past four quarter period 2487 of the 4399 youth that participated in the youth program were placed in summer employment Youth participants come from low income families with little or no opportunity to earn money during the summer months Through the Indian and Native American Youth Program these youth are given an opportunity to work and earn money during the summer which helps them contribute to their familyrsquos income
Performance in the Past Eight Quarters
Program Performance
Performance Measure Four Quarters
Ending 063013 Four Quarters
Ending 063014
Educational Attainment for Dropouts 180 220
Attainment of Two or More Goals 920 927
The data reported reflect the period from April 1 2012 through March 31 2013 The data reported reflect the period from April 1 2013 through March 31 2014
Additional Program Year 2013 Quarterly Data
Performance Measure Four Quarters
Ending 093013 Four Quarters
Ending 123113 Four Quarters
Ending 033114
Educational Attainment for Dropouts
250 250 220
Attainment of Two or More Goals
930 930 927
The data reported reflect the period from April 1 2013 through September 30 2013 The data reported reflect the period from April 1 2013 through March 31 2014
Analysis bull The Attainment of Two or More Goals rate increased slightly from 92 percent in June 2013
to 927 percent in June 2014 bull The Indian and Native American Youth Program served 4310 youth during the period July
1 2013 through June 30 2014 This is a 164 percentage point decrease in youth served one year ago
bull The Education Attainment for Dropouts increased from 18 percent in June 2013 to 22 percent in June 2014
25
WORKFORCE SYSTEM RESULTS
Green Jobs Innovation Fund Grants (GJIF) httpwwwdoletagovBRGGreenJobs
Program Description The Green Jobs Innovation Fund (GJIF) was authorized as a Pilot and Demonstration Project under the Workforce Investment Act (WIA) of 1998 to help workers receive job training in green industry sectors and occupations as well as access green career pathways GJIF is seeking to increase the number of individuals completing training programs who receive industry-recognized credentials and to increase the number of individuals completing training programs for employment in green jobs
With these grants the Department is emphasizing two key workforce programs that move participants along green career pathways by 1) forging linkages between Registered Apprenticeship and pre-apprenticeship programs andor 2) integrating the delivery of technical and basic skills training through community-based partnerships The grantees are building on existing programs that are already established and serving workers and moving workers into and along green career pathways The Green Jobs Innovation Fund (GJIF) grants are all anticipated to end by June 30 2015
Quarter Highlights The Jobs for the Future (JFF) GreenWays grant program made great progress toward their goal of increasing access for women to enter higher-paying non-traditional occupations Women currently comprise 254 of the programs total enrollment and are earning higher placement wages overall than men At the same time their completion rates credential attainment rates and job placement rates lag behind those of men reflecting the ongoing challenges that women experience in non-traditional occupations The JFF GreenWays program continues to focus on raising the visibility of this issue as a key element in regional approaches to addressing poverty in female-headed households
Program Performance
Performance Measure Cumulative
Four Quarters Ending 063013
Cumulative Four Quarters
Ending 063014
Entered Employment Rate 569 642
Employment Retention Rate 750 821
Six Monthsrsquo Average Earnings $16249 $17459
Additional Program Year 2013 Quarterly Data
Performance Measure
Cumulative Four
Quarters Ending
093013
Cumulative Four
Quarters Ending
123113
Cumulative Four
Quarters Ending
033114
Entered Employment Rate 560 626 641
Employment Retention Rate 790 795 785
Six Monthsrsquo Average Earnings $16406 $15228 $15039
Cumulative Credential Outcomes in the Past Three Quarters
Performance Measure Quarter Ending
123113
Quarter Ending
033114
Quarter Ending
063014
Number Completed Education Job Training Activities
5521 6438 7076
Number Completed Training and Received Credential
5343 6242 6849
Attainment Rate 97 97 97
Analysis As of June 30 2014 8360 participants were enrolled in educationtraining Of these participants 600 participated in Registered Apprenticeship 874 participated in Pre-Apprenticeship and 40 participated in On-the-Job Training A total of 7076 participants completed educationtraining A total of 6849 participants received a credential Lastly a total of 4870 participants entered employment and of these participants 4343 entered training-related employment
26
WORKFORCE SYSTEM RESULTS
Dec-13 Mar-14 Jun-14
100 $27000
$2600080
$2500060
$24000 40
$23000
20 $22000
0 $21000
n Entered Employment Rate n Employment Retention Rate n Six Months Average Earnings
H-1B Jobs and Innovation Accelerator Challenge Grants httpwwwdoletagovETA_News_Releases20111398cfm
Program Description The Jobs and Innovation Accelerator Challenge (Jobs Accelerator) is designed to help regions achieve the demonstrated benefits of collaborative cluster-based regional development This initiative represents the implementation of Administration policy priorities to accelerate bottom-up innovation in urban and rural regions as opposed to imposing ldquoone-size-fits-allrdquo solutions The Jobs Accelerator also meets Administration goals for smarter use of government resources through reduction of Federal silos and promotion of coordinated Federal funding opportunities that offer more efficient access to Federal resources Investments from Federal agencies for the Jobs Accelerator projects include The US Department of Laborrsquos Employment and Training Administration (DOL-ETA) the US Department of Commercersquos Economic Development Administration (DOC-EDA) and the National Institutes of Standards and Technologyrsquos Hollings Manufacturing Extension Partnership (NIST-MEP) the Small Business Administration (SBA) the Department of Energy Advanced Manufacturing Office (DOE AMO) and the Delta Regional Authority (DRA)
The objectives of the Jobs Accelerator are to
bull Accelerate the formation of new high-growth businesses and expansion of existing businesses
bull Accelerate the creation of higher-wage jobs bull Advance commercialization of research including Federally-funded research bull Support deployment of new processes new technologies and new products to grow sales
and generate employment bull Enhance the capacity of small businesses in the cluster including small and disadvantaged
businesses bull Increase exports and business interaction with international buyers and suppliers bull Develop the skilled workforce needed to support growing clusters and bull Ensure diverse workforce participation in clusters through outreach training and the
creation of career pathways
Quarter Highlights The Northeast Ohio Speed-To-Market Accelerator (STMA) program administered by Lorain County Community College aims to accelerate the speed-to-market for near production or pilot production prototypes stimulate job creation and increase the global competitiveness of cluster companies attract private capital and attract students incumbent workers and the unemployed
This quarter STMA helped accelerate the introduction of a new dry electrode product for heart monitoring This sensor and electronics will be introduced as part of the next generation of wearable human performance arm band from Pittsburgh based Body Media a subsidiary of Jawbone Further STMA continues to bring new companies into the STMA
program through cluster outreach activities and this quarter three new leads were generated as the result of the existing STMA partners MAGNET JumpStart Lorain County Community College and NorTech
Program Performance
Performance Measure Four Quarters
Ending 123113 Four Quarters
Ending 033114 Four Quarters
Ending 063014
Entered Employment Rate 307 283 359
Employment Retention Rate 907 925 927
Six Monthsrsquo Average Earnings $23310 $22953 $26682
Performance in the Past Three Quarters
Analysis A total of 3702 individuals were served 3632 individuals began educationjob training activities and 2052 individuals completed educationjob training services Of participants completing educationjob training 370 unemployed individuals completed training and entered employment and of these 114 individuals entered training-related employment A total of 204 employed individuals completed training and retained their current position and of these 85 employed individuals completed training and advanced into a new position A total of 2006 individuals completed educationtraining activities and received credentials and of these 2273 total credentials were awarded
This data represents three rounds of the for Jobs Accelerator initiative which includes the Jobs Accelerator Round 1 the Advanced Manufacturing Jobs Accelerator Round 2 and the Make it in America (MIIA) Jobs Accelerator grants program
27
WORKFORCE SYSTEM RESULTS
100 $56000
80 $54000
$52000 60 $50000
40 $48000
$46000 20
$44000
0 $42000 Dec-13 Mar-14 Jun-14
n Entered Employment Rate n Employment Retention Rate n Six Months Average Earnings
H-1B Technical Skills Training Grants httpwwwdoletagovbusinessH1B_Tech_Skillscfm
Program Description The H-1B Technical Skills Training (TST) Grants were authorized by the American Competitiveness and Workforce Improvement Act of 1998 (ACWIA) as amended (29 USC 2916a) to provide education training and job placement assistance in the occupations and industries for which employers are using H-1B visas to hire highly-skilled foreign workers on a temporary basis and the related activities necessary to support such training The H-1B TST Grant Program is intended to raise the technical skill levels of American workers so they can obtain or upgrade employment in high-growth industries and occupations Over time these education and training programs will help businesses reduce their use of skilled foreign professionals permitted to work in the US on a temporary basis under the H-1B visa program The grants represent significant investments in sectors such as information technology advanced manufacturing and health care In addition these grants will focus on serving participants who have been identified as long-term unemployed particularly those who have been unemployed the longest These grants also have an emphasis on providing on-the-job training allowing participants to learn new skills while earning a pay check To date ETA has announced two rounds of TST grants totaling $342 million The first round was announced on October 4 2011 and the second round was announced on February 22 2012
Quarter Highlights The Los Angeles HealthWorks On-the-Job training (OJT) initiative administered by Managed Career Solutions Inc (MCS) provides individuals with training that leads to industry recognized credentials and employment opportunities within the regionrsquos healthcare field MCS maintains several strong partnerships to coordinate outreach recruitment training OJT placements and employment opportunities As of June 30 2014 MCS served nearly 800 long-term unemployed participants and overall 1100 participants In the same period over 650 individuals completed training and earned an industry recognized credential Of those completers 128 were employed at participation however the majority were underemployed and gained the necessary job skills and credentials that allowed 80 percent to advance into a new position In recognition MCS received the Malcom Baldrige and State Eureka awards
Analysis bull 52532 individuals were served and 51071 individuals began educationjob training
activities bull 15185 individuals completed educationjob training activities including 3321 unemployed
individuals who completed training and entered employment bull Of these 2925 individuals entered training-related employment 2902 employed individuals
completed training and retained their current position 1452 employed individuals completed training and advanced into a new position
bull 11944 individuals completed educationjob training activities and received credentials with 14099 total credentials awarded
Program Performance
Performance Measure
Four Quarters
Ending 123113
Four Quarters
Ending 033114
Four Quarters
Ending 063014
Entered Employment Rate 778 725 675
Employment Retention Rate 993 944 926
Six Monthsrsquo Average Earnings $54683 $50833 $46245
Since the H-1B TST program provides training to incumbent unemployed and long-term unemployed workers to prepare them for jobs in a variety H-1B industries andor occupations the Entered Employment Rate and Six Monthsrsquo Average Earnings can vary For the quarter ending on June 30 2014 the H-1B TST program saw a decline in the Entered Employment Rate and Six Monthsrsquo Average Earnings in comparison with the results for the previous rolling four quarters Previous results reflected a large number of incumbent workers who enrolled in short-term high-skilled training and exited early leading to a relatively high Six Monthsrsquo Average Earnings As the projects progress unemployed and long-term unemployed workers who required longer-term training begin to exit the program and search for jobs Ultimately as they enter employment wages may be less than those achieved by the higher-skilled incumbent workers who either retain or advance in their positions after training
Performance in the Past Three Quarters
28
WORKFORCE SYSTEM RESULTS
100 $21000
$19000 80
$17000
$1500060 $13000
40 $11000
$900020
$7000
0 $5000Sep-12 Dec-12 Mar-13 Jun-13 Sep-13 Dec-13 Mar-14 Jun-14
n Entered Employment Rate n Employment Retention Rate n Six Months Average Earnings
Community-Based Job Training Grants (CBJT) httpwwwdoletagovbusinessCommunity-BasedJobTrainingGrantscfm
Program Description Community-Based Job Training Grants (CBJT) seek to strengthen the role of community colleges in promoting the United States workforcersquos competitiveness The program does this by building the capacity of community colleges to train workers in skills required to succeed in regionally based high-growth high-demand industries and occupations Important grant activities include training in the healthcare biotech advanced manufacturing energy automotive transportation construction insurance forestry and aerospace industries The first round of CBJT grants were awarded in October 2005 To date ETA has announced five rounds of CBJT grants awarding 320 grants to community colleges and other organizations All CBJT grants ended as of June 30 2014
Quarter Highlights The 14 remaining projects active in this quarter represent the culmination of another successful DOL initiative Some of the significant accomplishments include the development and sustainability of Roane State Community Collegersquos Lean Manufacturing program designed to meet the needs of local manufacturing employers the San Jacinto Community College Districtrsquos Gulf Coast Healthcare Partners project which developed training to support healthcare career and Central Arizona Collegersquos Pinal County Alternative Energy Project More than half of the CBJT participants who began education and training activities completed their programs 79 percent of them received an industry recognized credential ie certificate or degree Eighty-four percent of the participants who gained employment entered into new training-related positions
Program Performance
Performance Measure Four Quarters
Ending 063013 Four Quarters
Ending 063014
Entered Employment Rate 572 662
Employment Retention Rate 891 899
Six Monthsrsquo Average Earnings $18675 $17027
Additional Program Year 2013 Quarterly Data
Performance Measure
Four Quarters
Ending 093013
Four Quarters
Ending 123113
Four Quarters
Ending 033114
Entered Employment Rate 57 605 655
Employment Retention Rate 891 897 891
Six Monthsrsquo Average Earnings $18675 $18285 $16642
Performance in the Past Eight Quarters
Analysis bull 268359 individuals have been served through the initiative bull 258216 individuals began educationjob training activities bull 165264 individuals completed educationjob training activities Of these
bull 131107 individuals received credentials bull 65089 individuals entered new positions of employment and 54344 individuals entered new
positions of training-related employment
Note All data are cumulative Prior to new reporting requirements implemented in the quarter ending December 31 2011 grantees only reported results for individuals that entered employment and individuals that entered training-related employment (noted above) if those participants entered employment and completed training in the same quarter As a result prior to that quarter participants that entered employment in quarters after they completed training were captured in the Common Measures and the total number of individuals that ultimately entered employment and training-related employment are actually higher than the results above indicate
29
WORKFORCE SYSTEM RESULTS
100 92
7880
5760
40
20
0
n Percent of Target Number of Programs Launched by Round
Round 1 Round 2 Round 3
Trade Adjustment Assistance Community College and Career Training (TAACCCT) Grants httpwwwdoletagovtaaccct
Program Description The Trade Adjustment Assistance Community College and Career Training (TAACCCT) Grant Program is authorized by the Trade Act of 1974 under Chapter 4 of Title II The purpose of this grant program is to provide eligible institutions of higher education with funds to expand and improve their ability to deliver education and career training programs that can be completed in two years or less and that result in skills degrees and credentials that prepare program participants for employment in high-wage high-skill occupations and are suited for workers who are eligible for training under the Trade Adjustment Assistance (TAA) for Workers program under Chapter 2 of Title II of the Trade Act The TAACCCT Grant Program is funded under the Health Care and Education Reconciliation Act of 2010 which appropriated $500 million for the program for each of Fiscal Years 2011-2014 for a total of $2 billion
Round 1 ndash FY 2011 Grants On June 30 2014 grants awarded in Round 1 (FY 2011) had completed all but one quarter of their periods of performance By the end of their final year of the grant the forty-nine (49) Round 1 grantees project that they will offer a total of 906 new programs of study As of June 30 2014 grantees began offering 834 (92 percent) of these programs of study
Round 2 ndash FY 2012 Grants The seventy-nine (79) grants awarded in the Fiscal Year 2012 had completed seven quarters of their grants at the end of June 30 2014 Their period of performance began on October 1 2012 and will end on September 30 2016 however their final year will be dedicated to gathering information and data for reporting outcome measures and completing the requirements for a third-party evaluation They project that by the end of the third year they will have launched 761 programs As of the end of June 30 2014 they had began offering 561 (78 percent) of these programs
Round 3 ndash FY 2013 Grants Grants awarded in FY 2013 had completed the first three quarters of their period of performance Their grants began on October 1 2013 and will end on September 30 2017
In their third year they will have launched all of their programs as their final year will be dedicated to collecting follow up data for evaluation and reporting purposes only The fifty-seven (57) grantees plan to launch 551 programs As of June 30 2014 they had already launched 288 (57 percent) of these programs
Percentage of Target Number of Programs Launched as of June 30 2014 by Grant Round
Performance Information Programmatic data is collected at different intervals throughout the period of performance including
bull Quarterly Narrative Progress Reports (QNPR) Grantees will provide quarterly qualitative data on the capacity building taking place through progress and other implementation measures that grantees defined in their Statements of Work
bull Annual Performance Reports (APR) Grantees will provide annual quantitative data on their training and employment outcomes for TAACCCT program participants that are impacted by the capacity building activities being implemented by their grants
30
WORKFORCE SYSTEM RESULTS
$4500000 3500$4000000 3000$3500000
2500
Jun-13 Dec-13 Mar-14 Jun-14
Amou
nt $3000000 2000$2500000
$2000000 1500 $1500000 1000 $1000000
500$500000 $0 0
n Amount of Revenue Generated n Number of Tickets Assigned
Disability Employment Initiative (DEI) httpwwwdoletagovdisability
Program Description All DEI Workforce Employment Network (EN) Trends
Launched in 2010 the Disability Employment Initiative (DEI) seeks to improve education training and employment opportunities for youth and adults with disabilities who are unemployed underemployed andor receiving Social Security disability benefits The DEI is jointly funded by the US Department of Laborrsquos Employment and Training Administration and Office of Disability Employment Policy DEI projects improve collaboration among employment and training and asset development programs implemented at state and local levels including the Social Security Administrationrsquos Ticket to Work Program and build effective partnerships that leverage resources to better serve individuals with disabilities and improve employment outcomes
Quarter Highlights A variety of Department of Labor programs helped Vietnam-era veteran Richard James navigate through life After servicing B-52 bombers in the Air Force James held a series of sales jobs while putting himself through law school at night He rose to become a successful New England attorney and owner of a boat dock building company when he suffered a terrible head injury which caused spine and nerve damage Addiction to pain medication followed and James ended up homeless While recovering from his injuries James took a college course through the Veterans Retraining Assistance Program managed in part by the Department He received career counseling from a Disabled Veterans Outreach Program representative at a local American Job Center and support from the DEI Disability Resource Coordinator Eventually James was hired as an attorney by a Rhode Island law firm The departments grants and programs made possible the services that put me back in a position of being a productive member of society he said
Program Performance
Performance Measure Quarter Ending 63013
Quarter Ending
123113
Quarter Ending 33114
Quarter Ending 63014
Analysis bull The Exit Rate for Adult and Youth exiters with disabilities in Round one DEI sites is almost
double the national average Adult DEI was 89 percent vs All StatesAll LWIAs 49 percent Older Youth DEI 166 percent vs All StatesAll LWIAs 87 percent Younger Youth DEI 339 percent vs All StatesAll LWIAs 151 percent
bull The CredentialSkill Attainment Rate for older and younger youth with disabilities in Round 1 DEI sites was higher than the national average Older Youth DEI credential rate 568 percent vs All StatesAll LWIAs 383 percent Younger Youth DEI skill rate 902 percent vs All States All LWIAs 834 percent
bull The Exit Rate for Adult and Youth exiters with disabilities in Round two DEI sites is higher than the national average Adult DEI 56 percent vs All StatesAll LWIAs 49 percent Older Youth DEI 163 percent vs All StatesAll LWIAs 87 percent and Younger Youth DEI 167 percent vs All StatesAll LWIAs 151 percent
bull The Entered Employment Rate for Adult DEI sites 657 percent is 20 percent higher than in All StatesAll LWIAs 434 percent
bull DEI Workforce Employment Networks (EN) activity shows that the number of Tickets assigned increased from 1780 to 2903 an increase of 1123 and the amount of revenue
Number of Tickets Assigned 1780 1590 2554 2903 generated from DEI EN payments increased from $2373404 to $4057353 an increase of $168 million Amount of Revenue Generated $2373404 $1927104 $3505582 $4057353
31
WORKFORCE SYSTEM RESULTS
ETA Internet-Based Assistance (E-TOOLS) wwwcareerinfonetorg wwwservicelocatororg wwwcareeronestoporg wwwonetonlineorg wwwmyskillsmyfutureorg wwwmynextmoveorg
Program Description Additional Program Year 2013 Quarterly Data
Performance Measure Quarter Ending
093013
Quarter Ending
123113
Quarter Ending
033114
CareerOneStop Portal Visits 5754645 5159240 5340022
ETArsquos Internet-based assistance includes electronic tools that help individuals explore career opportunities and link to job postings either on their own or at local American Job Centers to make informed employment and education choices
The Web sites feature user-friendly occupation and industry information salary data career videos education resources career exploration assistance and other resources that support talent development in todayrsquos fast-paced global marketplace Users can find information some of which is also industry sponsored about occupations that are in-demand in high growth industries Additionally information is available regarding occupational skills and workplace competencies
Quarter Highlights For the year ending June 2014 CareerOneStop launched a new portal for Ex-Offenders added Federal Contractor job tagging a TAACCCT information finder Youth Council information to Americarsquos Service Locator and began working on adding more job feeds
Americarsquos Service Locator (ASL) Visits
730998 758919 724053
ONET Downloads 26646 29407 28505
ONET Visits 7697608 10211177 11500039
Combined Visits 14183251 16129336 17564114
Performance in the Past Eight Quarters
25000000 $36000
Sep-12 Dec-12 Mar-13 Jun-13 Sep-13 Dec-13 Mar-14 Jun-14
n Combined Visits (in millions) n ONET Product Downloads (in thousands)
$31500 20000000
ONE
T Pr
oduc
t Dow
nloa
ds
$27000
Com
bine
d Vi
sits
$2250015000000 $18000
10000000 $13500
$90005000000
$4500
$00
ONET has added web services for developers and increased the available Tools and Technology and Detailed Work Activities information to convey specialized occupational attributes
Program Performance
Performance Measure Quarter
Ending 063013 Quarter
Ending 063014
CareerOneStop Portal Visits 5104850 5472742
Americarsquos Service Locator (ASL)Visits
747114 802148
ONET Downloads 29482 25278
ONET Visits 8716609 13581922
Combined Visits 14568573 19856812
Analysis bull ETA Internet-Based Assistance received 19856812 combined visits for the quarter ending
June 30 2014 an increase of 36 percent over the same period in 2013 bull Visits to CareerOneStop increased to 5472742 or 72 percent over the same period in 2013
with mySkillsmyFuture continuing to be a popular tool with an increase of 23 percent bull Americarsquos Service Locator Visits traffic increased 74 percent over the same period in 2013 bull The ONET traffic received 13581922 visits in this quarter an increase of 558 percent
over the same period in 2013 and the ONET downloads totaled 25278 for the quarter a decrease of 142 percent
32
WORKFORCE SYSTEM RESULTS
Glossary of Performance Measures
Common Performance Measures Common Performance Measures are used by Workforce Investment Act Indian and Native American Program Disability Program Navigator Initiative Wagner-Peyser Trade Adjustment Assistance Senior Community Service Employment Program Reintegration of Ex-Offenders Registered Apprenticeship Program Job Corps National Farmworker Jobs Program High Growth Job Training Initiative and Community-Based Job Training Grants
Adult Measures Entered Employment Of those who are not employed at the date of participation the number of adult participants who are employed in the first quarter after the exit quarter divided by the number of adult participants who exit during the quarter
Employment Retention Of those who are employed in the first quarter after the exit quarter the number of adult participants who are employed in both the second and third quarters after the exit quarter divided by the number of adult participants who exit during the quarter
Six Monthsrsquo Average Earnings Of those adult participants who are employed in the first second and third quarters after the exit quarter total earnings in the second quarter plus the total earnings in the third quarter after the exit quarter divided by the number of adult participants who exit during the quarter
Average Earnings Change in Six Months1
Of those who are employed in Q1 after exit the total post-program earnings (earnings in Q2 + Q3 after exit) minus pre-program earnings (earnings in Q2 + Q3 prior to registration) divided by the number of adults who exit during the quarter
Youth Measures Attainment of a Degree or Certificate Of those enrolled in education (at the date of participation or at any point during the program) the number of youth participants who attain a diploma GED or certificate by the end of the third quarter after the exit quarter divided by the number of youth participants who exit during the quarter
1 This definition was used for earnings in PY 2005 Q=quarter
33
Literacy and Numeracy Gains Of those out-of-school youth who are basic skills deficient the number of youth participants who increase one or more educational functioning levels divided by the number of youth participants who have completed a year in the program (ie one year from the date of first youth program service) plus the number of youth participants who exit before completing a year in the program
Placement in Employment or Education2
Of those who are not in postsecondary education or employment (including the military) at the date of participation the number of youth participants who are in employment (including the military) or enrolled in postsecondary education andor advanced trainingoccupational skills training in the first quarter after the exit quarter divided by the number of youth participants who exit during the quarter
Program-Specific Performance Measures
Disability Employment Initiative (DEI) Number of Tickets Assigned Number of individuals on Social Security Administration (SSA) disability benefits who assigned their Ticket to the workforce board agency or American Job Center as their designated Employment Network under the SSA Ticket to Work program All DEI pilot sites must become an Employment Network under Ticket to Work
Amount of Revenue Generated Under the SSA Ticket to Work program when jobseekers who receive SSA disability benefits assign their Ticket to a workforce board agency or American Job Center as an Employment Network and then achieve certain employment milestones the Employment Network receives money or ldquoTicket revenuerdquo
2 Because of its intensity and duration the YouthBuild performance measure for placement in employment or education does not exclude those who entered the program with a job or in college
WORKFORCE SYSTEM RESULTS
Foreign Labor Certification Percent of H-1B Applications Resolved in Seven Business Days This estimate is based on the total number of applications processed within seven business days divided by the total number of applications processed for a given reporting period An application is considered processed if the last significant event is (1) certified (2) denied or (3) withdrawn
Average Number of Days to Resolve PERM Applications Not Subject to Integrity Review The average processing time between case receipt and decision date for non-audited cases
Average Number of Days to Resolve PERM Applications Subject to Integrity Review The average processing time between case receipt and decision date for audited cases
Percent of Complete H-2A Employer Applications Resolved within 30 Days Before the Date of Need This estimate is based on the total number of complete applications resolved within 30 days before the date of need divided by the total number of applications processed for a given reporting period
Percent of H-2B Applications Processed Within 30 Days of Receipt This estimate is based on the total number of applications processed within 30 days of receipt divided by the total number of applications processed for a given reporting period An application is considered processed if the last significant event is (1) certified (2) denied or (3) withdrawn
Indian and Native American Youth Attainment of Two or More Goals The total number of youth participants enrolled in the Granteersquos Supplemental Youth Services Program who attained at least two of the 14 goals listed below divided by the total number of Supplemental Youth Services participants enrolled during the report period The 14 goals include
1 Completed Job ReadinessOrientation to the World of Work Training 2 Completed Internship or Vocational Exploration Program
3 Completed Career Assessment 4 Entered Unsubsidized Employment 5 Remained in School 6 Returned to School Full Time 7 Enrolled in Job Corps 8 Improved Basic Skills Level By At Least Two Grades 9 Attained High School Diploma 10 Attained GED 11 Completed Occupational Skills Training 12 Completed Leadership Skills Training 13 Entered Other (Non-Supplemental Youth) Training Program 14 Summer Employment
Educational Attainment for Dropouts The number of dropouts who have obtained a high school diploma GED or increased their literacy and numeracy by two grade levels divided by the total number of dropouts
Job Corps Measures Placement in Employment or Education Percent of Job Corps participants3 entering employment or enrolling in post-secondary education andor advanced skills trainingoccupational skills training in the first quarter after exit from the program
Attainment of a Degree or Certificate Percent of students who attain a GED HSD or certificate
Literacy Numeracy Gains Percent of students who achieve literacy or numeracy gains of one or more Adult Basic Education (ABE) levels
3 Calculation of the Placement rate measure does not include outcomes for students who participated in the program for less than 60 days
34
WORKFORCE SYSTEM RESULTS
Internet-Based Assistance Web Site Visits ETArsquos Internet-based assistance includes electronic tools that help individuals make informed employment and education choices The measure for tracking the overall performance and usage of these tools is Web site visits A visit is defined as a series of page requests from the same uniquely identified client with a time of no more than 30 minutes between each page
request
ONet Product Downloads The ONET product downloads count the number of unique users who download an ONET online resource (wwwonetcenterorg) which includes the ONET database (all versions) ONET technical reports (such as on green jobs) supplemental data files (lay titles tools and technology) the ONET Career Exploration Tool files ONET Survey questionnaires and other related materials such as the Toolkit for Business
Registered Apprenticeship Program Entered Employment Rate Percent of apprentices employed in the first quarter after exit who either completed or cancelled from their Registered Apprenticeship Program
Employment Retention Rate Percent of apprentices employed in the first quarter after exit still employed in the second and third quarter after exit who either completed or cancelled from their Registered Apprenticeship Program
Six Monthsrsquo Average Earnings Six month Average Earnings of apprentices employed in the first quarter after exit still employed in the second and third quarter after exit who either completed or cancelled from their Registered Apprenticeship Program
Reintegration of Ex-OffendersmdashAdult Program Recidivism Rate The percentage of participants who are rearrested for a new crime or re-incarcerated for revocation of a parole or probation violation within one year from release from prison
Senior Community Service Employment Program Service Level The count of participants during the report period divided by the total number of authorized grantee community service positions
Community Service The number of community service hours as reported by each grantee divided by the total community service hours funded for the grantee adjusted for minimum wage differences among the states
Most-in-Need Most-in-need means participants with one or more of the following characteristics have a severe disability are frail are age 75 or older are age-eligible but not receiving benefits under Title II of the Social Security Act reside in an area with persistent unemployment and have severely limited employment prospects have limited English proficiency have low literacy skills have a disability reside in a rural area are Veterans have low employment prospects have failed to find employment after utilizing services provided under Title I of the Workforce Investment Act of 1998 (29 USC 2801 et seq) or are homeless or at risk for homelessness (sect 513(b)(1)(E) as amended by Pub L No 109-365)
Unemployment Insurance Percent of Payments Made Timely The percentage of intrastate Unemployment Insurance benefit first payments for full weeks of unemployment issued within 14 days following the first compensable week in states with a waiting week and 21 days in non-waiting week states
Detection of Recoverable Overpayments The amount of overpayments (dollars) established through state operations as a percent of the estimated amount states can detect and establish for recovery
Entered Employment Rate The percent of persons receiving a first payment in a given quarter who had earnings in the next quarter
Percent of Employer Tax Liability Determinations Made Timely The percent of new employer determinations made within 90 days of the end of the quarter in which employers became liable to pay unemployment taxes
35
WORKFORCE SYSTEM RESULTS
YouthBuild Attainment of a Degree or Certificate Of those enrolled the number of youth participants who attain a diploma high school equivalency degree or industry-recognized certificate by the end of the third quarter after the exit quarter divided by the number of youth enrolled (minus youth exited for other reasons)
Literacy and Numeracy Gains Of those youth participants who are basic skills deficient at enrollment the number of youth participants who increase one or more educational functioning levels within one year of enrollment divided by the number of youth participants who have completed a year in the program
Placement in Employment or Education The number of youth participants who are in employment (including the military) or are enrolled in post-secondary education andor advanced trainingoccupational skills training in the first quarter after the exit quarter divided by the number of youth participants who exited during the previous quarter
Youthful Offender Projects Placement Rate The placement rate is the percentage of out-of-school youth ages 18 and above placed in unsubsidized jobs occupational training post-secondary education or the military
Recidivism Rate The recidivism rate is the percentage of youth offenders who have been convicted of a new crime within 12 months of their release of a correctional facility or being placed on probation
36
WORKFORCE SYSTEM RESULTS
2471 American Job Centers formerly known as One-Stop Career Centers
12 VT
9 HI
1 GU
6 DC
2 VI
15 NE
16 SD
12 ME
19 IA
19 AK
19 WV
4 DE
47 AL
55 CO
48 MN
57 WI
89 NC
60 GA
31 MA
23 NM
16 ND
47 AR
70 PA
18 CT 4 RI
12 NV
20 WY
22 KS
18 PR
89 OH
69 TN
102 FL
59 AZ 46
SC
12 NH
29 NJ
52 VA
22 MT
33 OK
39 MS
59 WA
61 IL 34 MD
47 OR
131 KY
62 LA
83 IN
33 UT
44 MO
26 ID 90
NY95 MI
1 to 25
25 to 50
50 to 75
75 to 100
Over 100
203 CA
180 TX
Source Americarsquos Service Locator (wwwServiceLocatororg) Americarsquos Service Locator connects individuals to employment and training opportunities available at local American Job Centers The Web site provides contact information for a range of local work-related services including unemployment benefits career development and educational opportunities As of March 17 2015
37
WORKFORCE SYSTEM RESULTS
United States Department of Labor
200 Constitution Avenue NW
Washington DC 20210
wwwdolgov
- A9RFAFEtmp
- DOL_Workforce_Rprt_Jun_2014_51415-dp
-
- Workforce System Results
-
- Contents
- Quarterly Spotlight
- People Served by Program
- Current Appropriations
- Government Performance and Results Act Goals (GPRA)
- Indian and Native American Adult Program (INAP)
- National Farmworker Jobs Program (NFJP)
- Senior Community Service Employment Program (SCSEP)
- Wagner-Peyser Employment Service
- Workforce Investment Act Adult Program
- Workforce Investment Act Dislocated Worker Program
- H-1B and Permanent Foreign Labor Certification (PERM)
- H-2A and H-2B Foreign Labor Certification Programs
- Reintegration of Ex-Offenders (RExO-ADULT)
- Registered Apprenticeship
- Registered Apprenticeship
- Trade Adjustment Assistance (TAA)
- Unemployment Insurance (UI)
- Unemployment Insurance (UI)
- Job Corps
- Workforce Investment Act Youthful Offender Initiative
- Workforce Investment Act Youth Program
- YouthBuild
- Indian and Native American Youth Program
- H-1B Jobs and Innovation Accelerator Challenge Grants
- H-1B Technical Skills Training Grants
- Community-Based Job Training Grants (CBJT)
- Trade Adjustment Assistance Community College and Career Training (TAACCCT) Grants
- Disability Employment Initiative (DEI)
- ETA Internet-Based Assistance (E-TOOLS)
- Glossary of Performance Measures
- 2471 American Job Centers formerly known as One-Stop Career Centers
-

WORKFORCE SYSTEM RESULTS
Government Performance and Results Act Goals Annual Goal Results as of 0630141
Percent of Employer Tax Liability Determinations Made Timely 889 886
Workforce Investment Act Adult Program
Entered Employment Rate 612 611
Employment Retention Rate 820 828
Six Monthsrsquo Average Earnings $13684 $13842
Workforce Investment Act Dislocated Worker Program
Entered Employment Rate 612 60
Employment Retention Rate 844 838
Six Monthrsquos Average Earnings $16364 $15997
Workforce Investment Act Youth Program
Placement in Employment or Education Rate 664 690
Attainment of Degree or Certificate Rate 623 684
Percentage of Students Who Achieve Literacy and Numeracy Gains of One Adult Basic Education Level 469 525
YouthBuild7
Placement in Employment or Education Rate 500 519
Attainment of Degree or Certificate Rate 672 672
Percentage of Students Who Achieve Literacy and Numeracy Gains 585 595
Workforce Investment Act Youthful Offender Initiative
Placement Rate for Youth Ages 18 and Above8 352 362
Recidivism Rate for Youth Ages 14 to 17 16 24
Recidivism Rate for Youth Ages 18 to Above 17 16
1 Cumulative four quarters unless otherwise indicated 2 H-2A Measure changed Q2 FY 2014 3 Entered Employment Rate is based on Unemployment Insurance Wage Record and Grantee Supplemental Data for the exit cohort
October 1 2012 ndash September 30 2013 Employment Retention Rate is based on Unemployment Insurance Wage Record and Grantee Supplemental Data for the exit cohort April 1 2012 ndash March 31 2013 Six Monthsrsquo Average Earnings are based on Unemployment Insurance Wage Record only for the exit cohort April 1 2012 ndash March 31 2013
4 Data reported semi-annually and annually Results above are reflective of the period from April 1 2013 through March 31 2014 5 Results are cumulative for currently operating projects 6 The results are for Fiscal Year 2014 (October 1 2013 ndash September 30 2014) 7 The results are program-to-date for the aggregate of all grant cycles of YouthBuild beginning with the 2007 grant class 8 Program-to-date for currently operating projects
6
WORKFORCE SYSTEM RESULTS
Additional Program Year 2013 Quarterly Data
100 $15000
80 $13000
60 $11000
40 $9000
20 $7000
0 Sep-12 Dec-12 Mar-13 Jun-13 Sep-13 Dec-13 Mar-14 Jun-14
$5000
n Entered Employment Rate n Employment Retention Rate n Six Months Average Earnings
Indian and Native American Adult Program (INAP) httpwwwdoletagovdinap
Program Description The Indian and Native American Program (INAP) provides employment and training grants to Indian Tribes nonprofit tribal organizations Alaska Native entities and Native Hawaiian organizations with comprehensive employment and training services designed to increase the ability of program participants to compete in the new global economy and promote the economic and social development of Indian Alaska Native and Native Hawaiian communities
Quarter Highlights In Program Year 2013 the grantee community and Native American Employment and Training Council to the Secretary of Labor implemented a Pilot Study on credential attainments an innovative effort several years in the making As a result the number of exiters in Program Year 2013 94 percent attained a credential (degree or industry-wide certifications) When tracking exiters who were not in a training program leading to credential while on the program 401 percent received a credential
Analysis Using current wage record data
bull The Entered Employment Rate for the 12 month period ending June 30 2014 was 632 percent an increase of 11 percentage points when compared to the same time period last year
bull The Employment Retention Rate for the 12 month period ending June 30 2014 was 794 percent an increase of 15 percentage points when compared to the same period last year
bull The Six Monthsrsquo Average Earnings for the 12 month period ending June 30 2014 was $9476 a decrease of $195 when compared to the same period last year
Using current grantee supplemental data
bull This quarter 6795 participants received services and 477 participants entered employment Those entering employment decreased by 47 when compared to the same period last year
bull INAP served 11982 individuals during the 12 month period ending on June 30 2014 a decrease of 911 people when compared to the same time period last year
bull Including self-service individuals INAP served 36498 people a decrease of 665 people served when compared to the same period last year
bull 2303 individuals received Work Experience training for the 12 month period ending June 30 2014 an increase of 1206 people when compared to the same period last year
bull 5467 individuals received training services an increase of 403 when compared to the same period last year Of those 142 received On-the-Job Training
bull The percentage of participants who received credentials during the 12 month period ending June 30 2014 is 94 percent and the number of Veterans served is 161
Program Performance
Performance Measure Four Quarters
Ending 063013 Four Quarters
Ending 063014 Entered Employment Rate 621 632
Employment Retention Rate 779 794
Six Months Average Earnings $9671 $9476
Entered Employment Rate is based on Unemployment Insurance Wage Record and Grantee Supplemental Data for the exit cohort October 1 2012 ndash September 30 2013 The Employment Retention Rate is based on Unemployment Insurance Wage Record and Grantee Supplemental Data for the exit cohort April 1 2012 ndash March 31 2013 Six Monthsrsquo Average Earnings are based on Unemployment Insurance Wage Record Data for the exit cohort April 1 2012 ndash March 31 2013
Performance Measure Four Quarters
Ending 093013 Four Quarters
Ending 123113 Four Quarters
Ending 033114
Entered Employment Rate 610 621 622
Employment Retention Rate 784 787 790
Six Monthsrsquo Average Earnings $9746 $9623 $9557
Performance in the Past Eight Quarters
7
WORKFORCE SYSTEM RESULTS
100 $15000
80 $13000
60 $11000
40 $9000
20 $7000
0 Sep-12 Dec-12 Mar-13 Jun-13 Sep-13 Dec-13 Mar-14 Jun-14
$5000
n Entered Employment Rate n Employment Retention Rate n Six Months Average Earnings
National Farmworker Jobs Program (NFJP) httpwwwdoletagovFarmworkerhtmlNFJPcfm
Program Description The National Farmworker Jobs Program (NFJP) assists migrants other seasonally employed farmworkers and their families in achieving economic self-sufficiency and stability through job training and other services that address their employment related needs New job skills training in occupations with higher wages are offered as well as supportive services that help farmworkers stabilize their employment in agriculture Assistance from the NFJP is accessed directly through the grantee organizations and local American Job Centers
Quarter Highlights David came to the Proteus Visalia Service Center in California in April 2014 in search of employment and training services David was a high school graduate with limited job skills and worked as a seasonal farmworker David enrolled in the NFJP and received career assessment case management and energy efficiency training services After several months David successfully graduated and was hired as a junior solar installer by Solar City He is now working full-time earning $1300 per hour
Program Performance
Performance Measure Four Quarters
Ending 063013 Four Quarters
Ending 063014
Entered Employment Rate 855 881
Employment Retention Rate 831 856
Six Monthsrsquo Average Earnings $10533 $10855
Additional Program Year 2013 Quarterly Data
Performance Measure
Four Quarters
Ending 093013
Four Quarters
Ending 123113
Four Quarters
Ending 033114
Entered Employment Rate 862 876 884
Employment Retention Rate 836 840 850
Six Monthsrsquo Average Earnings $10439 $10433 $10605
Performance in the Past Eight Quarters
Analysis bull The Entered Employment Rate of 881 percent exceeds the programrsquos performance goal of
861 percent and is a 26 percentage point improvement from the same quarter one year ago bull The Employment Retention Rate of 856 percent exceeds the performance goal of 832
percent and shows a 25 percentage point improvement from the same quarter one year ago bull The Six Months Average Earnings result of $10855 exceeds the programrsquos performance
goal of $10501 and is $322 more when compared to the same reporting period one year ago
8
WORKFORCE SYSTEM RESULTS
100 $8000
80
60 $7000
40 $6000
20
0
n Entered Employment Rate n Employment Retention Rate n Six Month
Dec-13Sep-13Jun-13Mar-13 Dec-12Sep-12 $5000
s Average Earnings
Jun-14Mar-14
Senior Community Service Employment Program (SCSEP) httpwwwdoletagovseniors
Program Description Authorized by the Older Americans Act of 1965 the Senior Community Service Employment Program (SCSEP) is designed to foster individual economic self-sufficiency and promote useful opportunities in community service employment for unemployed low-income persons (particularly persons who have poor employment prospects) who are age 55 or older and to increase the number of persons who may benefit from unsubsidized employment in the public and private sectors
Quarter Highlights A former Vietnam Veteran Mr S and his wife returned to a small town in New Mexico to take care of his ailing parents During the next couple of years his parents passed away his wife died unexpectedly and he lost the family home Homeless Mr S did odd jobs in the community in exchange for necessities Eventually a member of his church gave him a room and told him about Goodwill Industries of Central New Mexicorsquos SCSEP program Goodwill placed Mr S in a training site at the local community center where he had already developed strong relationships with staff and guests The money he earned from SCSEP allowed him to move into an apartment Through the program Mr S developed confidence in his skills and abilities and with the help of Goodwillrsquos SCSEP staff he obtained a job at the local Goodwill store where he currently manages the donation site He says he loves his job and with his salary can afford a much better place to live Mr S continues to volunteer at the local community center by shopping for elderly in the community
Program Performance
Performance Measure Four Quarters
Ending 063013 Four Quarters
Ending 063014
Entered Employment Rate 425 452
Employment Retention Rate 744 731
Six Monthsrsquo Average Earnings $7163 $7446
Additional Program Year 2013 Quarterly Data
Performance Measure
Four Quarters
Ending 093013
Four Quarters
Ending 123113
Four Quarters
Ending 033114
Entered Employment Rate 427 428 433
Employment Retention Rate 722 712 702
Six Monthsrsquo Average Earnings $7329 $7437 $7378
Performance in the Past Eight Quarters
Analysis In Program Year 2013 67814 people were served by the program and 12 percent of those people were Veterans SCSEP participants recorded 35746097 hours of community service Six Monthsrsquo Average Earnings are higher than a year ago which is expected with a recovering economy Eighty-eight percent of participants were at or below poverty level Comparing Program Year 2013 with Program Year 2012
bull The Entered Employment Rate increased 27 percentage points from one year ago bull The Employment Retention Rate decreased 13 percentage points from one year ago bull Six Monthsrsquo Average Earnings increased almost four percentage points from one year ago
9
WORKFORCE SYSTEM RESULTS
100
80
60
40
20
0 Sep-12 Dec-12 Mar-13 Jun-13 Sep-13 Dec-13 Mar-14 Jun-14
n Entered Employment Rate n Employment Retention Rate n Six Months Average Earnings
$15000
$13000
$11000
$9000
$7000
$5000
Wagner-Peyser Employment Service httpwwwdoletagovProgramsWagner_Peysercfm
Program Description Wagner-Peyser Employment Service is an integral part of the American Job Center network formerly known as One-Stop Career Centers delivery system which provides universal access to workers job seekers and businesses The Employment Service focuses on providing a variety of employment related services including but not limited to job search assistance job referral and placement assistance for job seekers reshyemployment services to unemployment insurance claimants and recruitment services to employers with job openings Services are provided in one of three modes of delivery approaches self-service facilitated self-help service and staff-assisted service
Quarter Highlights When Mylan Pharmaceuticals Inc the third largest generic and pharmaceuticals company in the world needed to increase its production team at its Morgantown West Virginia location it was receiving over 100000 resumes and was overwhelmed with interested job seekers for openings to fill Plant Manufacturing Laborer positions With a starting pay of $1800 per hour the positions at Mylan are very attractive and turned to WorkForce (WF) West Virginia for labor exchange assistance beginning a success story of cooperation between private industry and a State agency WF West Virginia was able to help screen job seekers for Mylan and the plant hired 177 participants including 21 Veterans a higher representation than overall Veterans in the labor force (118 percent versus approximately seven percent)
Program Performance
Performance Measure Four Quarters
Ending 063013 Four Quarters
Ending 063014
Entered Employment Rate 530 560
Employment Retention Rate 810 820
Six Monthsrsquo Average Earnings $14252 $14515
Additional Program Year 2013 Quarterly Data
Performance Measure
Four Quarters
Ending 093013
Four Quarters
Ending 123113
Four Quarters
Ending 033114
Entered Employment Rate 530 530
Employment Retention Rate 810 810
Six Monthsrsquo Average Earnings $14129 $14175
Performance in the Past Eight Quarters
540
810
$14265
Analysis bull Over 16 million people received services from the Wagner-Peyser Employment Service
between July 1 2013 and June 30 2014 bull Over 11 million Veterans received services between July 1 2013 and June 30 2014 bull Nearly 35 million unemployed individuals entered employment after receiving services
from the Employment Service between July 1 2013 and June 30 2014
10
WORKFORCE SYSTEM RESULTS
100 $15000
80 $13000
60 $11000
40 $9000
20 $7000
0 Jun-12 Jun-13 Jun-14
$5000
n Entered Employment Rate n Employment Retention Rate n Six Months Average Earnings
Workforce Investment Act Adult Program httpwwwdoletagovprogramsgeneral_infocfm
Program Description The Workforce Investment Act (WIA) Adult Program helps prepare low-skill adult workers for good jobs through formula grants to States States use the funds to provide employment and training services through a network of American Job Centers of which there were nearly 2500 across the United States as of June 30 2014
WIA provides employment and training services at three broad service levels to job seeker customers core intensive and training These services are provided at a level which most efficiently meets their needs to achieve gainful employment The program is also designed to assist employer customers meet their needs for skilled workers
Adult Programs serve the broadest range of individuals including but not limited to public assistance recipients Unemployment Insurance claimants Veterans people with disabilities dislocated workers migrant and seasonal farmworkers Indian and Native Americans and workers age 55 or older
Quarter Highlights In Virginia the GoodwillWIA Adult program assists with the funding for Patient Care Technician (PCT) training provided by Fast Track Health The cost of training is approximately $3450 and the training is eleven weeks in duration This training provides a certificate in CNA EKG CPR and Phlebotomy with the certificationlicensing costs included in the overall training cost Ms O was referred to the WIA Adult program by a local Virginia Employment Commission representative She attended an orientation and started the process of changing her life that very day Ms O excelled and received a 100 percent increase in salary after completing training through this program with Fast Track Ms O stated of her experience ldquoI am very happy with my new career and very grateful for Goodwill and the WIA Adult program for providing [me] with this opportunity to enter a career with so much potential for advancementrdquo
Analysis bull In Program Year 2013 the WIA Adult program served 7184946 participants and over
150000 participants received training services bull Participants who received training services had a 761 percent Entered Employment
Rate in Program Year 2013 15 percentage points higher than the overall Entered Employment Rate of 611 percent
Program Performance
Performance Measure
Four Quarters
Ending 063012
(Program Year 2011)
Four Quarters
Ending 063013
(Program Year 2012)
Four Quarters
Ending 063014
(Program Year 2013)
Entered Employment Rate 572 599 611
Employment Retention Rate 808 819 828
Six Monthsrsquo Average Earnings $13482 $13335 $13842
Performance in the Past Three Program Years
11
WORKFORCE SYSTEM RESULTS
100 $19000
$1700080
$15000 60 $13000
$1100040 $9000
20 $7000
0 $5000 Jun-12 Jun-13 Jun-14
n Entered Employment Rate n Employment Retention Rate n Six Months Average Earnings
Workforce Investment Act Dislocated Worker Program httpwwwdoletagovprogramsgeneral_infocfm
Program Description The Workforce Investment Act Dislocated Worker Program funds services to support the reemployment of laid-off workers The Department of Labor allocates 80 percent of funds by formula to the States The Secretary of Labor may use the remaining 20 percent for National Emergency Grantsmdashthese specially targeted funds can infuse resources to areas suffering most from plant closings mass layoffs or job losses due to natural disasters or military base realignment and closures States allocate their Dislocated Worker funds to their local workforce investment areas Additionally the program allows for States to reserve up to 25 percent of their Dislocated Worker funds for Rapid Response activities Rapid Response is a pro-active business-focused and flexible strategy to help growing companies access an available pool of skilled workers and can respond to layoffs by quickly coordinating services and aid to companies and their workers
Program Performance
Performance Measure
Four Quarters
Ending 063012
(Program Year 2011)
Four Quarters
Ending 063013
(Program Year 2012)
Four Quarters
Ending 063014
(Program Year 2013)
Entered Employment Rate 611 600 600
Employment Retention Rate 842 843 838
Six Monthsrsquo Average Earnings $16500 $15930 $15997
Performance in the Past Three Program Years
Quarter Highlights After Kyle was laid off he was able to utilize an On-the-Job Training (OJT) opportunity with Tyson He now works the second shift from 1-9 pm and was able to obtain the technical training he felt he did not obtain from prior employment or education ldquoI wanted to get more experience on how things technically operate and this program is the perfect fit for merdquo Kyle said And in the end Tyson gained a skilled employee
Analysis bull The Dislocated Worker program served over 800000 participants in Program Year 2013
and provided training services to 109148 participants bull Participants who received training had an 814 percent Entered Employment Rate 214
percentage points higher than the overall Entered Employment Rate of 60 percent
12
WORKFORCE SYSTEM RESULTS
500 100
400 80
300 60
Days
200 40
100 20
0 0 Jun-13 Sep-13 Dec-13 Mar-14 Jun-14
n Average Number of Days to Resolve PERM Applications Not Subject to Integrity Review n Average Number of Days to Resolve PERM Applications Subject to Integrity Review (Audit) n Percent of H1-B Applications Processed within Seven Days of Filing
H-1B and Permanent Foreign Labor Certification (PERM) httpwwwforeignlaborcertdoletagov
Program Description Performance in the Past Five Quarters
H-1B certification permits employers to hire on a temporary basis foreign workers who possess qualifying professional or specialty skills The PERM program allows employers to begin the process for permanently hiring a foreign worker when there are not sufficient numbers of US workers who are able willing qualified and available to perform the job In addition the program ensures that the employment of the foreign worker does not adversely affect the wages and working conditions of American workers who are similarly employed
Program Performance
Performance Measure Four Quarters
Ending 063013 Four Quarters
Ending 063014
Percent of H-1B Applications Resolved in Seven Business Days
100 100
Quarter Highlights Average number of days to resolve PERM applications not subject to integrity review
129 194
The percent of employer applications processed within seven days of filing under the H-1B program sustains at approximately 100 percent ending in June 30 2014
Average number of days to resolve PERM applications subject to integrity review (Audit)
294 424 The Office of Foreign Labor Certification (OFLC) continues to allocate staff resources for the PERM program to increase program integrity by conducting more audit examinations and supervised recruitments This increased emphasis on program integrity has had an effect on processing timeliness
Additional Program Year 2013 Quarterly Data
Performance Measure
Four Quarters
Ending 093013
Four Quarters
Ending 123113
Four Quarters
Ending 033114
Analysis bull The number of H-1B applications processed within seven business days held steady
at 100 percent from the same four quarter reporting period one year ago Of the total 103032 H-1B applications processed over the past four quarters 103032 were completed within seven business days of the filing date
Percent of H-1B Applications Resolved in Seven Business Days
100 804 996 bull The average number of days to resolve PERM applications not subject to integrity review decreased by 20 percent compared to the previous quarter and the average number of days to resolve PERM applications subject to integrity review (Audits) decreased by four percent compared to the previous quarter
Average number of days to resolve PERM applications not subject to integrity review
178 237 234
Average number of days to resolve PERM applications subject to integrity review (Audit)
320 423 444
13
WORKFORCE SYSTEM RESULTS
100
80
60
40
20
0 Jun-13 Sep-13 Dec-13 Mar-14 Jun-14
n Percent of Accepted H-2A Applications Without Deficiencies Resolved by 30 Days Before the Date of Need n Percent of H-2B Applications Resolved Within 30 Days of Receipt
H-2A and H-2B Foreign Labor Certification Programs httpwwwforeignlaborcertdoletagov
Program Description H-2A labor certification permits employers to hire foreign workers on a temporary basis for the agricultural sector of the economy H-2B labor certification permits employers to hire foreign workers to come to the United States and perform temporary nonagricultural work which must be one-time seasonal peak load or intermittent in nature
Program Performance
Performance Measure Four Quarters
Ending 063013 Four Quarters
Ending 063014
Percent of Complete H-2A Employer Applications Resolved Within 30 Days Before the Date of Need
NA 97
Percent of H-2B Applications Resolved Within 30 Days
23 97
Additional Program Year 2013 Quarterly Data
Performance Measure
Four Quarters
Ending 093013
Four Quarters
Ending 123113
Four Quarters
Ending 033114
Percent of Complete H-2A Employer Applications Resolved Within 30 Days Before the Date of Need
NA NA 84
Percent of H-2B Applications Resolved Within 30 Days
98 92 99
The Percent of Complete H-2A Employer Applications Resolved Within 30 days Before the Date of Need measure was changed in the second quarter of Fiscal Year 2014
Performance in the Past Five Quarters
Quarter Highlights The Office of Foreign Labor Certification (OFLC) continues to resolve approximately 971 percent of complete H-2A applications on time The processing rates have improved in spite of an increase in the numbers of applications filed during this reporting period FY 2014 when compared to one year ago
Employer filings under the H-2B program have increased 167 percent this reporting period compared to the same four quarter reporting period one year ago
Analysis bull The percentage of H-2A applications resolved within 30 calendar days increased 125
percentage points from the previous quarter Of the 3845 total of H-2A applications processed in Fiscal Year 2014 908 percent were resolved within 30 calendar days of the filing date
bull The percentage of H-2B applications processed within 30 calendar days increased when compared with the same reporting period one year ago Of the 5188 H-2B applications processed within the last four quarters 998 percent of them were processed within 60 calendar days of the filing date
14
WORKFORCE SYSTEM RESULTS
100
80
60
40
20
0 Sep-12 Dec-12 Mar-13 Jun-13 Sep-13 Dec-13 Mar-14 Jun-14
$15000
$13000
$11000
$9000
$7000
$5000
n Entered EmploymentPlacement Rate n Employment Retention Rate n Six Months Average Earnings
Reintegration of Ex-Offenders (RExO-ADULT) httpwwwdoletagovRExOeta_defaultcfm
Program Description The Reintegration of Ex-Offenders ndash Adult Program (RExO-Adult) is an employment-centered program that seeks to strengthen urban communities that have large numbers of returning prisoners The program incorporates mentoring job training and other comprehensive transitional services It is designed to reduce recidivism by helping inmates find work when they return to their communities as part of an effort to improve community life
Quarter Highlights The Adult RExO Program operated three initiatives this program year
bull Grants to community and faith-based organizations to help returning offenders find employment
bull Grants aimed specifically at serving female offenders providing employment and supportive services
bull Grants to provide occupational training and job placement to offenders in Halfway Houses
Program Performance
Performance Measure Quarter Ending
063013
Quarter Ending
063014
Entered Employment Rate
58 58
Employment Retention Rate
68 72
Six Monthsrsquo Average Earnings
$9797 $9770
The data for June 30 2013 are program-to-date since the inception of the program in the Spring of 2006 The June 30 2014 numbers are program-to-date for currently operating projects
Additional Program Year 2013 Quarterly Data
Performance Measure Quarter Ending
093013
Quarter Ending
123113
Quarter Ending
033114
Entered Employment Rate
55 56
Employment Retention Rate
66 68 70
Six Monthsrsquo Average Earnings
$10036 $9962 $9736
Performance in the Past Eight Quarters
58
Analysis The Adult RExO Program served 6308 participants this program year
bull Adult RExO Grantees reported 3404 enrollees receiving training or education bull Adult RExO Grantees reported 2555 enrollees receiving a certificate bull The recidivism rate largely reflects the extent to which the program is serving persons
at high or low risk of re-offending
15
WORKFORCE SYSTEM RESULTS
Registered Apprenticeship httpwwwdoletagovoa
Program Description Registered Apprenticeship is a leader in preparing American workers to compete in a global 21st Century economy With a network of over 150000 employers in more than 1000 occupations Registered Apprenticeship has already trained millions of Americarsquos workers Modern apprenticeships are now on the cutting edge of innovation in preparing a skilled workforce for todayrsquos industries including expanding industries like health care information technology transportation telecommunications and advanced manufacturing as well as in industries like construction where apprenticeships have a long and successful history
Quarter Highlights During the summer of 2014 the White House hosted the first-ever Summit on Apprenticeship to gather the best ideas and to catalyze action to dramatically increase apprenticeship in America More than 60 attendees presented their ideas including leading employers big and small like IBM Bank of America Blue CrossBlue Shield and Oberg Industries labor unions like the International Brotherhood of Electrical Workers (IBEW) training providers like Ivy Tech and Lone Star Community Colleges and local workforce leaders The event was the apex in a series of industry roundtables on apprenticeship which took place across the country during June amp July 2014
Program Performance
Performance Measure Four Quarters
Ending 063013 Four Quarters
Ending 063014
Entered Employment Rate 734 742
Employment Retention Rate 873 878
Six Monthsrsquo Average Earnings $23826 $24387
Performance Measure Quarter Ending
063013 Quarter Ending
063014
Apprentices
Total Apprentices (Active Apprentices)
148039 152582
New Apprentices 17432 17011
Programs
New Programs 139
Programs Maintained Total (Active Programs)
9809 9077
Number of new programs in Construction and Manufacturing
93
Source Registered Apprenticeship Partners Information Management Data System (RAPIDS) data managed by Department of Labor staff only 063013 data has been revised to include federal data only Running total of active apprenticesprograms during the quarter
16
177
127
WORKFORCE SYSTEM RESULTS
0
20
40
60
80
100
Sep-12 Dec-12 Mar-13 Jun-13 Sep-13 Dec-13 Mar-14 Jun-14 $5000 $7000 $9000 $11000 $13000 $15000 $17000 $19000 $21000 $23000 $25000
n Entered Employment Rate n Employment Retention Rate n Six Months Average Earnings
Registered Apprenticeship httpwwwdoletagovoa
Additional Program Year 2013 Quarterly Data
Performance Measure
Four Quarters
Ending 093013
Four Quarters
Ending 123113
Four Quarters
Ending 033114
Entered Employment Rate 735 738 738
Employment Retention Rate 874 877 878
Six Monthsrsquo Average Earnings $24171 $24324 $24378
Performance in the Past Eight Quarters
Analysis bull During the third quarter of Fiscal Year 2014 there were over 394000 active apprentices
nationwide while over 13000 program participants completed their apprenticeship and received a credential that is portable industry recognized and can provide a pathway to middle-class and sustainable careers
bull The Entered Employment Rate for participants who completed their Registered Apprenticeship program was 856 percent 114 percentage points higher than for all program exiters who either completed or cancelled (742 percent as shown in table on the previous page)
bull The Employment Retention Rate for program completers was 910 percent 32 percentage points higher than for all program exiters (878 percent as shown in table on the previous page)
bull The Six Monthsrsquo Average Earnings for program completers was $29964 which is over $5577 more than that of all program exiters (ie completers or those who cancelled) The results for those completing the program shows it pays to stay
17
WORKFORCE SYSTEM RESULTS
100
80
60
40
20
0 Sep-12 Dec-12 Mar-13 June-13 Sep-13 Dec-13 Mar-14 Jun-14
n Entered Employment Rate n Employment Retention Rate n Six Months Average Earnings
$25000
$21000
$17000
$13000
$9000
$5000
Trade Adjustment Assistance (TAA) httpwwwdoletagovtradeact
Program Description The Trade Adjustment Assistance (TAA) Program is an integral part of the comprehensive workforce development system The program is essential to helping workers dislocated by foreign trade to adjust to changing market conditions and shifting skill requirements Addressing the needs of trade-affected workers involved in this transformation is a unique challenge because in general these workers are being dislocated from relatively outdated-skill high-wage employment In many cases this is complicated by mass layoffs or plant closures that occur in single-industry towns which makes finding comparable employment in the same geographic area difficult Furthermore many of these jobs are lost permanently from the domestic economy requiring affected workers to completely retool their skills
Fiscal Year Highlights During Fiscal Year 2014 Massachusetts diligently trained staff at the local CareerOneStop Centers to ascertain a TAA participantrsquos eligibility for other funding resources to assist in their reemployment initiatives These improved efforts to provide and report reemployment services enables Trade customers to flow through the CareerOneStop Center system with other dislocated workers and receive seamless resources through the resource sharing initiatives of the Career Center methodology These streamlined reemployment services have resulted in an Entered Employment Rate of 815 percent nearly ten percentage points higher than the national average
Program Performance
Performance Measure FY 2011 FY 2012 FY 2013 FY 2014
Entered Employment Rate 653 689 716 729
Employment Retention Rate 897 913 917 911
Six Monthsrsquo Average Earnings $18319 $18837 $18099 $17828
Performance Measure Quarter Ending 063013 Quarter Ending 063014
Entered Employment Rate 733 728
Employment Retention Rate 900 927
Six Monthsrsquo Average Earnings $18210 $17692
Additional Program Year 2013 Quarterly Data
Performance Measure Quarter Ending
093013
Quarter Ending
123013
Quarter Ending
033014
Entered Employment Rate 713 713
Employment Retention Rate 918 918
Six Monthsrsquo Average Earnings $17499 $17499
Performance in the Past Eight Quarters
727
917
$17550
Analysis During Fiscal Year 2014 there were 62706 total participants receiving TAA benefits or services and 20577 exiters entered employment (729 percent) More than one-third of all participants were minorities with the average age of participants being 47 years and the average tenure being approximately 13 years 9547 exiter participants received credentials or 83 percent of all exiter participants who completed training 32527 participants received training or approximately 52 percent of all participants Lastly the program served 4828 Veteran participants accounting for approximately eight percent of all participants
18
WORKFORCE SYSTEM RESULTS
Unemployment Insurance (UI) httpouidoletagovunemploy
Program Description The federal-state Unemployment Insurance (UI) System minimizes individual and family financial hardship due to unemployment and stabilizes the economy during economic downturns by providing unemployed workers with temporary income support States operate their own Unemployment Insurance Programs regulated by State laws
As the Federal partner DOL provides program leadership allocates administrative funds provides technical assistance and exercises performance oversight
Quarter Highlights As the economy improved the system emphasized program integrity solvency and reemployment Claims rates decreased about 10 percent from the year before and Trust Fund loans decreased from $21 billion to $14 billion EUC benefit payments ceased on December 28 2013 Twenty-four states implemented Short-term Compensation programs allowing unemployed workers to stay on jobs while receiving partial unemployment benefits proportionate to reduced work hours States implemented systems to improve efficiency and reduce overpayments such as data exchange and recover UI overpayments By June 30 2014 42 states were recovering overpayments through Federal Income tax refund offset (TOP) and had recovered $370 million in 2014 (over $840 million since TOPrsquos inception)
Analysis During the year ending June 30 2014
bull 51 million UI claimants were reemployed in the quarter following their UI 1st payments (17 million in the last quarter)
bull The UI system met two and failed two of its four targets UI met detection of overpayments (643 percent vs target of 542 percent) and met reemployment (657 percent vs target of 647 percent)
bull The system fell short of its 1st pay and status targets because of retirements and other turnover of key staff
Program Performance
Performance Measure Four Quarters
Ending 063013 Four Quarters
Ending 063014
Percent of Intrastate Payments Made Timely
812 792
Detection of Recoverable Overpayments Rate
598 643
Facilitation of Reemployment Rate 6261 6552
Percent of Employer Tax Liability 888 882
Operational Results
Recipiency Rate 263 272
Exhaustion Rate 456 431
Percent of Recipients of Prime Working Age (25-54)
702 700
Percent of Recipients Who Are Female
434 437
New Initial Unemployment Insurance Claims
13906868 12501014
Number of First Unemployment Insurance Payments
8404507 7632522
Average Duration of Unemployment Insurance (Weeks)
169
1 Reemployment for year ending June 30 2013 2 Reemployment for year ending June 30 2014
19
167
WORKFORCE SYSTEM RESULTS
Unemployment Insurance (UI) httpouidoletagovunemploy
Additional Program Year 2013 Quarterly Data
Performance Measure Four Quarters
Ending 093013 Four Quarters
Ending 123113 Four Quarters
Ending 033114
Percent of Intrastate Payments Made Timely
809 802 793
Detection of Recoverable Overpayments Rate
590 630 603
Facilitation of Reemployment Rate 6311 6312 6363
Percent of Employer Tax Liability 886 885 884
Operational Results
Recipiency Rate 263 262 267
Exhaustion Rate 453 446 437
Percent of Recipients of Prime Working Age (25-54)
702 702 701
Percent of Recipients Who Are Female
434 434 435
New Initial Unemployment Insurance Claims
13559233 13340263 12947493
Number of First Unemployment Insurance Payments
8215687 7967852 7857395
Average Duration of Unemployment Insurance (Weeks)
169 169 168
1 Reemployment for year ending September 30 2013 2 Reemployment for year ending December 31 2013 3 Reemployment for year ending March 31 2014
20
WORKFORCE SYSTEM RESULTS
100
80
60
40
20
0 Sep-12 Dec-12 Mar-13 Jun-13 Sep-13 Dec-13 Mar-14 Jun-14
n Placement in Employment or Education n Attainment of a Degree or Certificate n LiteracyNumeracy Gains
Job Corps httpwwwjobcorpsgovhomeaspx
Program Description Job Corps is the nationrsquos largest residential educational and career technical training program for at-risk youth ages 16 through 24 The 125 Job Corps centers nationwide provide an integrated comprehensive array of services that include academic career technical and life skills training career planning and work-based learning health care and post-program placement and transition support
Job Corps is committed to offering all students a safe drug-free environment where they can take advantage of the resources provided Job Corpsrsquo mission is to attract eligible young people teach them the skills they need to become employable and independent and place them in meaningful jobs or further education
Program Performance
Performance Measure Four Quarters
Ending 063013 Four Quarters
Ending 063014
Placement in Employment or Education 746 767
Attainment of a Degree or Certificate 706 668
LiteracyNumeracy Gains 692 661
Additional Program Year 2013 Quarterly Data
Performance Measure
Four Quarters
Ending 093013
Four Quarters
Ending 123113
Four Quarters
Ending 033114
Placement in Employment or Education 757 760 765
Attainment of a Degree or Certificate 722 727 707
LiteracyNumeracy Gains 702 709 695
Performance in the Past Eight Quarters
The Performance in the Past Eight Quarters graph displays single quarter data versus the Program Performance tables which depict cumulative four quarter data
Quarter Highlights In May 2014 four Job Corps students from centers in Montana California Iowa and Virginia participated in the 2nd Asia-Pacific Economic Cooperation (APEC) Youth Skills Camp in Beijing and Guangzhou China the second time Job Corps students have participated in this event The camp included field visits to vocational training schools business enterprises and public practical training facilities as well as skills exchanges This international event provides students with life-changing experiences in travel diversity and first-hand exposure to global issues
Analysis bull During the current quarter Job Corps served 69979 participants including 13079 new
enrollees an increase of 801 percent overall compared to the same quarter in PY 2013 and due to the resumption of new enrollments after the PY 2012 enrollment suspensions The number of new students increased by over 200 percent from the same quarter in PY 2013
bull The proportion of 16-17 year olds served increased by 45 percentage points Conversely the proportion of all older students served similarly decreased from the same quarter in PY 2013
bull In the current quarter Job Corps placed 7203 students in Employment and Education a slight decrease of 04 percentage points compared to the same quarter last year In addition 8657 students attained a Certificate a 131 percentage point decrease compared to the same quarter in PY 2013 Also 6789 students attained a LiteracyNumeracy gain an 116 percentage point decrease over the same quarter in PY 2013
bull In the current quarter the program served 50 participants who were Veterans prior to enrollment bull When comparing the four quarter data Placement in Employment or Education increased
21 percentage points Attainment of a Degree or Certificate decreased 38 percentage points and LiteracyNumeracy Gains decreased 31 percentage points from the same quarter one year ago 21
WORKFORCE SYSTEM RESULTS
100
80
60
40
20
0 Sep-12 Dec-12 Mar-13 Jun-13 Sep-13 Dec-13 Mar-14 Jun-14
n Placement Rate for Out-of-School Youth Ages 18 and Above n Recidivism Rate for Youth Ages 14 to 17 n Recidivism Rate for Youth Ages 18 and Above
Workforce Investment Act Youthful Offender Initiative httpwwwdoletagovYouth_servicesyouthful_offendercfm
Program Description The Employment and Training Administration uses its Youthful Offender Appropriation to fund a variety of projects that target youth offenders and young adult offenders Currently operating projects include grants to community-based organizations to involve juvenile offenders in training and service learning projects grants to intermediary organizations to serve young offenders in high-poverty high-crime communities and grants to help youth enter diversion programs as an alternative to out-of-home placements and to assist eligible youth have their juvenile records sealed or expunged
Quarter Highlights The great majority of juvenile offenders are of ages 17 and below and many are still in high school The youth offender grants focus on helping younger youth stay in school and complete their education and helping older youth find jobs and succeed in the labor market Case management mentoring and supportive services are also provided by these grants
Performance in the Past Eight Quarters
Program Performance
Performance Measure Four Quarters
Ending 063013 Four Quarters
Ending 063014
Placement Rate for Youth Ages 18 and Above
36 362
Recidivism Rate for Youth Ages 14 to 17
35 24
Recidivism Rate for Youth Ages 18 and Above
34 16
Results are cumulative for currently operating grants
Additional Program Year 2013 Quarterly Data
Placement Rate for Youth Ages 18 and Above
277 334 325
Performance Measure
Four Quarters
Ending 093013
Four Quarters
Ending 123113
Four Quarters
Ending 033114
Recidivism Rate for Youth Ages 14 to 17
349 349 349
Recidivism Rate for Youth Ages 18 and Above
335 335 335
Analysis bull Providing opportunities to youthful offenders results in varying outcomes depending on
the mix of projects being operated in a given year bull Projects have markedly different placement and recidivism rates depending on whether
they are serving young adults in their 20s or youth ages 16-17 they recruit youth in the community or through direct referrals from the juvenile justice system whether they are located in small or large cities and the extent to which enrollees are at high or low risk of re-offending
22
WORKFORCE SYSTEM RESULTS
100
80
60
40
20
0 Jun-12 Jun-13 Jun-14
n Placement in Employment or Education n Attainment of a Degree or Certificate n LiteracyNumeracy Gains
Workforce Investment Act Youth Program httpwwwdoletagovyouth_services
Program Description The Workforce Investment Act Youth Formula Program provides employment and education services to eligible low-income youth ages 14 to 21 who face barriers to employment The program serves in-school and out-of-school youth youth with disabilities and low literacy rates as well as others who may require additional assistance to complete an educational program and acquire an industry-recognized credential or enter employment
Quarter Highlights The passage of the Workforce Innovation and Opportunity Act (WIOA) includes a major shift in focus to spending more funds on and serving more out-of-school youth (OSY) The workforce system demonstrated its readiness for this shift in that 48 percent of all youth served in PY 2013 were OSY and 57 percent of all WIA youth local area funds were spent on OSY So far in Program Year 2013 California has spent almost 65 percent of their WIA youth funds on OSY with high levels of OSY expenditures in both urban and rural areas 53 percent of all youth served in CA in Program Year 2013 were OSY For example Los Angeles City spent 80 percent of their funds on OSY and the Northern Rural Training and Employment Consortium spent 76 percent of their funds on OSY Both local areas have achieved these levels through strong partnerships with organizations that serve OSY as well as access to high quality work experiences
Program Performance
Performance Measure
Four Quarters
Ending 063012
(Program Year 2011)
Four Quarters
Ending 063013
(Program Year 2012)
Four Quarters
Ending 063014
(Program Year 2013)
Placement in Employment or Education 589 666 690
Attainment of a Degree or Certificate 648 675 684
LiteracyNumeracy Gains 476 509 525
Performance in the Past Three Program Years
Analysis bull 197045 participants were served in the cumulative four quarter reporting period compared
to 217244 served during the same time period last year This decrease is due primarily to a lower funding level compared to the previous year
bull Placement in Employment or Education achieved a result of 690 percent a 24 percentage point increase when compared with the same time period last year
bull The program achieved a result of 684 percent for the Attainment of a Degree or Certificate measure This is a 09 percentage point increase from the same time period last year
bull The LiteracyNumeracy Gains measure achieved a result of 525 percent an increase of 16 percentage points when compared with the same time period last year
bull All three youth common measures exceeded Program Year 2013 GPRA goals
23
WORKFORCE SYSTEM RESULTS
100
80
60
40
20
0 Sep-12 Dec-12 Mar-13 Jun-13 Sep-13 Dec-13 Mar-14 Jun-14
n Placement in Employment or Education n Attainment of a Degree or Certificate n LiteracyNumeracy Gains
YouthBuild httpwwwdoletagovyouth_servicesyouthbuildcfm
Program Description YouthBuild provides job training and educational opportunities for at-risk youth ages 16 to 24 while constructing or rehabilitating affordable housing for low-income or homeless families in their own neighborhoods The youth split their time between the construction site and the classroom where they earn their high school diploma or equivalency learn to be community leaders and prepare for college and other post-secondary training opportunities
Analysis bull 33392 participants have been enrolled into the YouthBuild program since 2007 and 29553
have exited so far bull Since the program began a total of 11716 participants have received a high school
diploma or equivalency 17572 have attained an industry-recognized certificate and 21835 have been placed into initial jobs post-secondary education andor long-term vocational occupational skills training including apprenticeship
bull The Class of 20102011 performance steadily increased The outcomes for all three measures were above those for the Class of 2009 and significantly above the GPRA goals
bull YouthBuild is currently meeting or exceeding the GPRA goal for all three measures The additional quarter of service for 20102011 grants provided additional positive outcomes as expected As the 2012 grant class progresses it is expected that this trend will continue
Program Performance
Quarter Highlights Just A Start in Cambridge (MA) has been a YouthBuild grantee since 2010 In the fourth quarter of the Program Year 2013 they shared the following success story
Victor earned a High School Diploma and HBIPACT construction certification He was accepted to Endicott College in MA He also secured a full time painting position with George Souza Painting making $25 per hour He continues to develop his career plan with staff
Class of 20102011 Performance in the Past Eight Quarters
Performance Measure GPRA Results for Class
0f 20102011 Results for Class 2012 Overall Results
Percent of Participants Entering Employment or Enrolling in Postsecondary Education the Military or Advanced Training Occupational Skills Training in the First Quarter After Exit
500 612 586 519
Percent of Youth Who Attain a Diploma GED or Certificate by the End of the Third Quarter after Exit
672 770 609 672
Percent of Participants Deficient in Basic Skills Who Achieve Literacy or Numeracy Gains of One Adult Basic Education Level
585 676 549 595
24
WORKFORCE SYSTEM RESULTS
100
80
60
40
20
0 Sep-12 Dec-12 Mar-13 Jun-13 Sep-13 Dec-13 Mar-14 Jun-14
n Attainment of a High School Diploma GED or improvement of basic skills by at least two grade levels or completed Occupational Skills training n Participants who Attained Two or more Goals
Indian and Native American Youth Program httpwwwdoletagovdinap
Program Description The Indian and Native American Supplemental Youth Services Program provides summer and year-round employment and training activities for Indian Alaska Native and Native Hawaiian individuals between the ages of 14 and 21 Program resources are targeted to at-risk and the neediest youth who face substantial barriers to education and employment success This population includes high school dropouts and youth who are basic-skills deficient
Quarter Highlights Youth summer employment is a high priority for Native American Tribes However most rural reservation areas do not have enough employers to put youth to work during the summer As a result Tribes rely on the annual WIA Section 166 funding to place youth in summer employment where they can earn a wage and receive valuable work experience
Over the past four quarter period 2487 of the 4399 youth that participated in the youth program were placed in summer employment Youth participants come from low income families with little or no opportunity to earn money during the summer months Through the Indian and Native American Youth Program these youth are given an opportunity to work and earn money during the summer which helps them contribute to their familyrsquos income
Performance in the Past Eight Quarters
Program Performance
Performance Measure Four Quarters
Ending 063013 Four Quarters
Ending 063014
Educational Attainment for Dropouts 180 220
Attainment of Two or More Goals 920 927
The data reported reflect the period from April 1 2012 through March 31 2013 The data reported reflect the period from April 1 2013 through March 31 2014
Additional Program Year 2013 Quarterly Data
Performance Measure Four Quarters
Ending 093013 Four Quarters
Ending 123113 Four Quarters
Ending 033114
Educational Attainment for Dropouts
250 250 220
Attainment of Two or More Goals
930 930 927
The data reported reflect the period from April 1 2013 through September 30 2013 The data reported reflect the period from April 1 2013 through March 31 2014
Analysis bull The Attainment of Two or More Goals rate increased slightly from 92 percent in June 2013
to 927 percent in June 2014 bull The Indian and Native American Youth Program served 4310 youth during the period July
1 2013 through June 30 2014 This is a 164 percentage point decrease in youth served one year ago
bull The Education Attainment for Dropouts increased from 18 percent in June 2013 to 22 percent in June 2014
25
WORKFORCE SYSTEM RESULTS
Green Jobs Innovation Fund Grants (GJIF) httpwwwdoletagovBRGGreenJobs
Program Description The Green Jobs Innovation Fund (GJIF) was authorized as a Pilot and Demonstration Project under the Workforce Investment Act (WIA) of 1998 to help workers receive job training in green industry sectors and occupations as well as access green career pathways GJIF is seeking to increase the number of individuals completing training programs who receive industry-recognized credentials and to increase the number of individuals completing training programs for employment in green jobs
With these grants the Department is emphasizing two key workforce programs that move participants along green career pathways by 1) forging linkages between Registered Apprenticeship and pre-apprenticeship programs andor 2) integrating the delivery of technical and basic skills training through community-based partnerships The grantees are building on existing programs that are already established and serving workers and moving workers into and along green career pathways The Green Jobs Innovation Fund (GJIF) grants are all anticipated to end by June 30 2015
Quarter Highlights The Jobs for the Future (JFF) GreenWays grant program made great progress toward their goal of increasing access for women to enter higher-paying non-traditional occupations Women currently comprise 254 of the programs total enrollment and are earning higher placement wages overall than men At the same time their completion rates credential attainment rates and job placement rates lag behind those of men reflecting the ongoing challenges that women experience in non-traditional occupations The JFF GreenWays program continues to focus on raising the visibility of this issue as a key element in regional approaches to addressing poverty in female-headed households
Program Performance
Performance Measure Cumulative
Four Quarters Ending 063013
Cumulative Four Quarters
Ending 063014
Entered Employment Rate 569 642
Employment Retention Rate 750 821
Six Monthsrsquo Average Earnings $16249 $17459
Additional Program Year 2013 Quarterly Data
Performance Measure
Cumulative Four
Quarters Ending
093013
Cumulative Four
Quarters Ending
123113
Cumulative Four
Quarters Ending
033114
Entered Employment Rate 560 626 641
Employment Retention Rate 790 795 785
Six Monthsrsquo Average Earnings $16406 $15228 $15039
Cumulative Credential Outcomes in the Past Three Quarters
Performance Measure Quarter Ending
123113
Quarter Ending
033114
Quarter Ending
063014
Number Completed Education Job Training Activities
5521 6438 7076
Number Completed Training and Received Credential
5343 6242 6849
Attainment Rate 97 97 97
Analysis As of June 30 2014 8360 participants were enrolled in educationtraining Of these participants 600 participated in Registered Apprenticeship 874 participated in Pre-Apprenticeship and 40 participated in On-the-Job Training A total of 7076 participants completed educationtraining A total of 6849 participants received a credential Lastly a total of 4870 participants entered employment and of these participants 4343 entered training-related employment
26
WORKFORCE SYSTEM RESULTS
Dec-13 Mar-14 Jun-14
100 $27000
$2600080
$2500060
$24000 40
$23000
20 $22000
0 $21000
n Entered Employment Rate n Employment Retention Rate n Six Months Average Earnings
H-1B Jobs and Innovation Accelerator Challenge Grants httpwwwdoletagovETA_News_Releases20111398cfm
Program Description The Jobs and Innovation Accelerator Challenge (Jobs Accelerator) is designed to help regions achieve the demonstrated benefits of collaborative cluster-based regional development This initiative represents the implementation of Administration policy priorities to accelerate bottom-up innovation in urban and rural regions as opposed to imposing ldquoone-size-fits-allrdquo solutions The Jobs Accelerator also meets Administration goals for smarter use of government resources through reduction of Federal silos and promotion of coordinated Federal funding opportunities that offer more efficient access to Federal resources Investments from Federal agencies for the Jobs Accelerator projects include The US Department of Laborrsquos Employment and Training Administration (DOL-ETA) the US Department of Commercersquos Economic Development Administration (DOC-EDA) and the National Institutes of Standards and Technologyrsquos Hollings Manufacturing Extension Partnership (NIST-MEP) the Small Business Administration (SBA) the Department of Energy Advanced Manufacturing Office (DOE AMO) and the Delta Regional Authority (DRA)
The objectives of the Jobs Accelerator are to
bull Accelerate the formation of new high-growth businesses and expansion of existing businesses
bull Accelerate the creation of higher-wage jobs bull Advance commercialization of research including Federally-funded research bull Support deployment of new processes new technologies and new products to grow sales
and generate employment bull Enhance the capacity of small businesses in the cluster including small and disadvantaged
businesses bull Increase exports and business interaction with international buyers and suppliers bull Develop the skilled workforce needed to support growing clusters and bull Ensure diverse workforce participation in clusters through outreach training and the
creation of career pathways
Quarter Highlights The Northeast Ohio Speed-To-Market Accelerator (STMA) program administered by Lorain County Community College aims to accelerate the speed-to-market for near production or pilot production prototypes stimulate job creation and increase the global competitiveness of cluster companies attract private capital and attract students incumbent workers and the unemployed
This quarter STMA helped accelerate the introduction of a new dry electrode product for heart monitoring This sensor and electronics will be introduced as part of the next generation of wearable human performance arm band from Pittsburgh based Body Media a subsidiary of Jawbone Further STMA continues to bring new companies into the STMA
program through cluster outreach activities and this quarter three new leads were generated as the result of the existing STMA partners MAGNET JumpStart Lorain County Community College and NorTech
Program Performance
Performance Measure Four Quarters
Ending 123113 Four Quarters
Ending 033114 Four Quarters
Ending 063014
Entered Employment Rate 307 283 359
Employment Retention Rate 907 925 927
Six Monthsrsquo Average Earnings $23310 $22953 $26682
Performance in the Past Three Quarters
Analysis A total of 3702 individuals were served 3632 individuals began educationjob training activities and 2052 individuals completed educationjob training services Of participants completing educationjob training 370 unemployed individuals completed training and entered employment and of these 114 individuals entered training-related employment A total of 204 employed individuals completed training and retained their current position and of these 85 employed individuals completed training and advanced into a new position A total of 2006 individuals completed educationtraining activities and received credentials and of these 2273 total credentials were awarded
This data represents three rounds of the for Jobs Accelerator initiative which includes the Jobs Accelerator Round 1 the Advanced Manufacturing Jobs Accelerator Round 2 and the Make it in America (MIIA) Jobs Accelerator grants program
27
WORKFORCE SYSTEM RESULTS
100 $56000
80 $54000
$52000 60 $50000
40 $48000
$46000 20
$44000
0 $42000 Dec-13 Mar-14 Jun-14
n Entered Employment Rate n Employment Retention Rate n Six Months Average Earnings
H-1B Technical Skills Training Grants httpwwwdoletagovbusinessH1B_Tech_Skillscfm
Program Description The H-1B Technical Skills Training (TST) Grants were authorized by the American Competitiveness and Workforce Improvement Act of 1998 (ACWIA) as amended (29 USC 2916a) to provide education training and job placement assistance in the occupations and industries for which employers are using H-1B visas to hire highly-skilled foreign workers on a temporary basis and the related activities necessary to support such training The H-1B TST Grant Program is intended to raise the technical skill levels of American workers so they can obtain or upgrade employment in high-growth industries and occupations Over time these education and training programs will help businesses reduce their use of skilled foreign professionals permitted to work in the US on a temporary basis under the H-1B visa program The grants represent significant investments in sectors such as information technology advanced manufacturing and health care In addition these grants will focus on serving participants who have been identified as long-term unemployed particularly those who have been unemployed the longest These grants also have an emphasis on providing on-the-job training allowing participants to learn new skills while earning a pay check To date ETA has announced two rounds of TST grants totaling $342 million The first round was announced on October 4 2011 and the second round was announced on February 22 2012
Quarter Highlights The Los Angeles HealthWorks On-the-Job training (OJT) initiative administered by Managed Career Solutions Inc (MCS) provides individuals with training that leads to industry recognized credentials and employment opportunities within the regionrsquos healthcare field MCS maintains several strong partnerships to coordinate outreach recruitment training OJT placements and employment opportunities As of June 30 2014 MCS served nearly 800 long-term unemployed participants and overall 1100 participants In the same period over 650 individuals completed training and earned an industry recognized credential Of those completers 128 were employed at participation however the majority were underemployed and gained the necessary job skills and credentials that allowed 80 percent to advance into a new position In recognition MCS received the Malcom Baldrige and State Eureka awards
Analysis bull 52532 individuals were served and 51071 individuals began educationjob training
activities bull 15185 individuals completed educationjob training activities including 3321 unemployed
individuals who completed training and entered employment bull Of these 2925 individuals entered training-related employment 2902 employed individuals
completed training and retained their current position 1452 employed individuals completed training and advanced into a new position
bull 11944 individuals completed educationjob training activities and received credentials with 14099 total credentials awarded
Program Performance
Performance Measure
Four Quarters
Ending 123113
Four Quarters
Ending 033114
Four Quarters
Ending 063014
Entered Employment Rate 778 725 675
Employment Retention Rate 993 944 926
Six Monthsrsquo Average Earnings $54683 $50833 $46245
Since the H-1B TST program provides training to incumbent unemployed and long-term unemployed workers to prepare them for jobs in a variety H-1B industries andor occupations the Entered Employment Rate and Six Monthsrsquo Average Earnings can vary For the quarter ending on June 30 2014 the H-1B TST program saw a decline in the Entered Employment Rate and Six Monthsrsquo Average Earnings in comparison with the results for the previous rolling four quarters Previous results reflected a large number of incumbent workers who enrolled in short-term high-skilled training and exited early leading to a relatively high Six Monthsrsquo Average Earnings As the projects progress unemployed and long-term unemployed workers who required longer-term training begin to exit the program and search for jobs Ultimately as they enter employment wages may be less than those achieved by the higher-skilled incumbent workers who either retain or advance in their positions after training
Performance in the Past Three Quarters
28
WORKFORCE SYSTEM RESULTS
100 $21000
$19000 80
$17000
$1500060 $13000
40 $11000
$900020
$7000
0 $5000Sep-12 Dec-12 Mar-13 Jun-13 Sep-13 Dec-13 Mar-14 Jun-14
n Entered Employment Rate n Employment Retention Rate n Six Months Average Earnings
Community-Based Job Training Grants (CBJT) httpwwwdoletagovbusinessCommunity-BasedJobTrainingGrantscfm
Program Description Community-Based Job Training Grants (CBJT) seek to strengthen the role of community colleges in promoting the United States workforcersquos competitiveness The program does this by building the capacity of community colleges to train workers in skills required to succeed in regionally based high-growth high-demand industries and occupations Important grant activities include training in the healthcare biotech advanced manufacturing energy automotive transportation construction insurance forestry and aerospace industries The first round of CBJT grants were awarded in October 2005 To date ETA has announced five rounds of CBJT grants awarding 320 grants to community colleges and other organizations All CBJT grants ended as of June 30 2014
Quarter Highlights The 14 remaining projects active in this quarter represent the culmination of another successful DOL initiative Some of the significant accomplishments include the development and sustainability of Roane State Community Collegersquos Lean Manufacturing program designed to meet the needs of local manufacturing employers the San Jacinto Community College Districtrsquos Gulf Coast Healthcare Partners project which developed training to support healthcare career and Central Arizona Collegersquos Pinal County Alternative Energy Project More than half of the CBJT participants who began education and training activities completed their programs 79 percent of them received an industry recognized credential ie certificate or degree Eighty-four percent of the participants who gained employment entered into new training-related positions
Program Performance
Performance Measure Four Quarters
Ending 063013 Four Quarters
Ending 063014
Entered Employment Rate 572 662
Employment Retention Rate 891 899
Six Monthsrsquo Average Earnings $18675 $17027
Additional Program Year 2013 Quarterly Data
Performance Measure
Four Quarters
Ending 093013
Four Quarters
Ending 123113
Four Quarters
Ending 033114
Entered Employment Rate 57 605 655
Employment Retention Rate 891 897 891
Six Monthsrsquo Average Earnings $18675 $18285 $16642
Performance in the Past Eight Quarters
Analysis bull 268359 individuals have been served through the initiative bull 258216 individuals began educationjob training activities bull 165264 individuals completed educationjob training activities Of these
bull 131107 individuals received credentials bull 65089 individuals entered new positions of employment and 54344 individuals entered new
positions of training-related employment
Note All data are cumulative Prior to new reporting requirements implemented in the quarter ending December 31 2011 grantees only reported results for individuals that entered employment and individuals that entered training-related employment (noted above) if those participants entered employment and completed training in the same quarter As a result prior to that quarter participants that entered employment in quarters after they completed training were captured in the Common Measures and the total number of individuals that ultimately entered employment and training-related employment are actually higher than the results above indicate
29
WORKFORCE SYSTEM RESULTS
100 92
7880
5760
40
20
0
n Percent of Target Number of Programs Launched by Round
Round 1 Round 2 Round 3
Trade Adjustment Assistance Community College and Career Training (TAACCCT) Grants httpwwwdoletagovtaaccct
Program Description The Trade Adjustment Assistance Community College and Career Training (TAACCCT) Grant Program is authorized by the Trade Act of 1974 under Chapter 4 of Title II The purpose of this grant program is to provide eligible institutions of higher education with funds to expand and improve their ability to deliver education and career training programs that can be completed in two years or less and that result in skills degrees and credentials that prepare program participants for employment in high-wage high-skill occupations and are suited for workers who are eligible for training under the Trade Adjustment Assistance (TAA) for Workers program under Chapter 2 of Title II of the Trade Act The TAACCCT Grant Program is funded under the Health Care and Education Reconciliation Act of 2010 which appropriated $500 million for the program for each of Fiscal Years 2011-2014 for a total of $2 billion
Round 1 ndash FY 2011 Grants On June 30 2014 grants awarded in Round 1 (FY 2011) had completed all but one quarter of their periods of performance By the end of their final year of the grant the forty-nine (49) Round 1 grantees project that they will offer a total of 906 new programs of study As of June 30 2014 grantees began offering 834 (92 percent) of these programs of study
Round 2 ndash FY 2012 Grants The seventy-nine (79) grants awarded in the Fiscal Year 2012 had completed seven quarters of their grants at the end of June 30 2014 Their period of performance began on October 1 2012 and will end on September 30 2016 however their final year will be dedicated to gathering information and data for reporting outcome measures and completing the requirements for a third-party evaluation They project that by the end of the third year they will have launched 761 programs As of the end of June 30 2014 they had began offering 561 (78 percent) of these programs
Round 3 ndash FY 2013 Grants Grants awarded in FY 2013 had completed the first three quarters of their period of performance Their grants began on October 1 2013 and will end on September 30 2017
In their third year they will have launched all of their programs as their final year will be dedicated to collecting follow up data for evaluation and reporting purposes only The fifty-seven (57) grantees plan to launch 551 programs As of June 30 2014 they had already launched 288 (57 percent) of these programs
Percentage of Target Number of Programs Launched as of June 30 2014 by Grant Round
Performance Information Programmatic data is collected at different intervals throughout the period of performance including
bull Quarterly Narrative Progress Reports (QNPR) Grantees will provide quarterly qualitative data on the capacity building taking place through progress and other implementation measures that grantees defined in their Statements of Work
bull Annual Performance Reports (APR) Grantees will provide annual quantitative data on their training and employment outcomes for TAACCCT program participants that are impacted by the capacity building activities being implemented by their grants
30
WORKFORCE SYSTEM RESULTS
$4500000 3500$4000000 3000$3500000
2500
Jun-13 Dec-13 Mar-14 Jun-14
Amou
nt $3000000 2000$2500000
$2000000 1500 $1500000 1000 $1000000
500$500000 $0 0
n Amount of Revenue Generated n Number of Tickets Assigned
Disability Employment Initiative (DEI) httpwwwdoletagovdisability
Program Description All DEI Workforce Employment Network (EN) Trends
Launched in 2010 the Disability Employment Initiative (DEI) seeks to improve education training and employment opportunities for youth and adults with disabilities who are unemployed underemployed andor receiving Social Security disability benefits The DEI is jointly funded by the US Department of Laborrsquos Employment and Training Administration and Office of Disability Employment Policy DEI projects improve collaboration among employment and training and asset development programs implemented at state and local levels including the Social Security Administrationrsquos Ticket to Work Program and build effective partnerships that leverage resources to better serve individuals with disabilities and improve employment outcomes
Quarter Highlights A variety of Department of Labor programs helped Vietnam-era veteran Richard James navigate through life After servicing B-52 bombers in the Air Force James held a series of sales jobs while putting himself through law school at night He rose to become a successful New England attorney and owner of a boat dock building company when he suffered a terrible head injury which caused spine and nerve damage Addiction to pain medication followed and James ended up homeless While recovering from his injuries James took a college course through the Veterans Retraining Assistance Program managed in part by the Department He received career counseling from a Disabled Veterans Outreach Program representative at a local American Job Center and support from the DEI Disability Resource Coordinator Eventually James was hired as an attorney by a Rhode Island law firm The departments grants and programs made possible the services that put me back in a position of being a productive member of society he said
Program Performance
Performance Measure Quarter Ending 63013
Quarter Ending
123113
Quarter Ending 33114
Quarter Ending 63014
Analysis bull The Exit Rate for Adult and Youth exiters with disabilities in Round one DEI sites is almost
double the national average Adult DEI was 89 percent vs All StatesAll LWIAs 49 percent Older Youth DEI 166 percent vs All StatesAll LWIAs 87 percent Younger Youth DEI 339 percent vs All StatesAll LWIAs 151 percent
bull The CredentialSkill Attainment Rate for older and younger youth with disabilities in Round 1 DEI sites was higher than the national average Older Youth DEI credential rate 568 percent vs All StatesAll LWIAs 383 percent Younger Youth DEI skill rate 902 percent vs All States All LWIAs 834 percent
bull The Exit Rate for Adult and Youth exiters with disabilities in Round two DEI sites is higher than the national average Adult DEI 56 percent vs All StatesAll LWIAs 49 percent Older Youth DEI 163 percent vs All StatesAll LWIAs 87 percent and Younger Youth DEI 167 percent vs All StatesAll LWIAs 151 percent
bull The Entered Employment Rate for Adult DEI sites 657 percent is 20 percent higher than in All StatesAll LWIAs 434 percent
bull DEI Workforce Employment Networks (EN) activity shows that the number of Tickets assigned increased from 1780 to 2903 an increase of 1123 and the amount of revenue
Number of Tickets Assigned 1780 1590 2554 2903 generated from DEI EN payments increased from $2373404 to $4057353 an increase of $168 million Amount of Revenue Generated $2373404 $1927104 $3505582 $4057353
31
WORKFORCE SYSTEM RESULTS
ETA Internet-Based Assistance (E-TOOLS) wwwcareerinfonetorg wwwservicelocatororg wwwcareeronestoporg wwwonetonlineorg wwwmyskillsmyfutureorg wwwmynextmoveorg
Program Description Additional Program Year 2013 Quarterly Data
Performance Measure Quarter Ending
093013
Quarter Ending
123113
Quarter Ending
033114
CareerOneStop Portal Visits 5754645 5159240 5340022
ETArsquos Internet-based assistance includes electronic tools that help individuals explore career opportunities and link to job postings either on their own or at local American Job Centers to make informed employment and education choices
The Web sites feature user-friendly occupation and industry information salary data career videos education resources career exploration assistance and other resources that support talent development in todayrsquos fast-paced global marketplace Users can find information some of which is also industry sponsored about occupations that are in-demand in high growth industries Additionally information is available regarding occupational skills and workplace competencies
Quarter Highlights For the year ending June 2014 CareerOneStop launched a new portal for Ex-Offenders added Federal Contractor job tagging a TAACCCT information finder Youth Council information to Americarsquos Service Locator and began working on adding more job feeds
Americarsquos Service Locator (ASL) Visits
730998 758919 724053
ONET Downloads 26646 29407 28505
ONET Visits 7697608 10211177 11500039
Combined Visits 14183251 16129336 17564114
Performance in the Past Eight Quarters
25000000 $36000
Sep-12 Dec-12 Mar-13 Jun-13 Sep-13 Dec-13 Mar-14 Jun-14
n Combined Visits (in millions) n ONET Product Downloads (in thousands)
$31500 20000000
ONE
T Pr
oduc
t Dow
nloa
ds
$27000
Com
bine
d Vi
sits
$2250015000000 $18000
10000000 $13500
$90005000000
$4500
$00
ONET has added web services for developers and increased the available Tools and Technology and Detailed Work Activities information to convey specialized occupational attributes
Program Performance
Performance Measure Quarter
Ending 063013 Quarter
Ending 063014
CareerOneStop Portal Visits 5104850 5472742
Americarsquos Service Locator (ASL)Visits
747114 802148
ONET Downloads 29482 25278
ONET Visits 8716609 13581922
Combined Visits 14568573 19856812
Analysis bull ETA Internet-Based Assistance received 19856812 combined visits for the quarter ending
June 30 2014 an increase of 36 percent over the same period in 2013 bull Visits to CareerOneStop increased to 5472742 or 72 percent over the same period in 2013
with mySkillsmyFuture continuing to be a popular tool with an increase of 23 percent bull Americarsquos Service Locator Visits traffic increased 74 percent over the same period in 2013 bull The ONET traffic received 13581922 visits in this quarter an increase of 558 percent
over the same period in 2013 and the ONET downloads totaled 25278 for the quarter a decrease of 142 percent
32
WORKFORCE SYSTEM RESULTS
Glossary of Performance Measures
Common Performance Measures Common Performance Measures are used by Workforce Investment Act Indian and Native American Program Disability Program Navigator Initiative Wagner-Peyser Trade Adjustment Assistance Senior Community Service Employment Program Reintegration of Ex-Offenders Registered Apprenticeship Program Job Corps National Farmworker Jobs Program High Growth Job Training Initiative and Community-Based Job Training Grants
Adult Measures Entered Employment Of those who are not employed at the date of participation the number of adult participants who are employed in the first quarter after the exit quarter divided by the number of adult participants who exit during the quarter
Employment Retention Of those who are employed in the first quarter after the exit quarter the number of adult participants who are employed in both the second and third quarters after the exit quarter divided by the number of adult participants who exit during the quarter
Six Monthsrsquo Average Earnings Of those adult participants who are employed in the first second and third quarters after the exit quarter total earnings in the second quarter plus the total earnings in the third quarter after the exit quarter divided by the number of adult participants who exit during the quarter
Average Earnings Change in Six Months1
Of those who are employed in Q1 after exit the total post-program earnings (earnings in Q2 + Q3 after exit) minus pre-program earnings (earnings in Q2 + Q3 prior to registration) divided by the number of adults who exit during the quarter
Youth Measures Attainment of a Degree or Certificate Of those enrolled in education (at the date of participation or at any point during the program) the number of youth participants who attain a diploma GED or certificate by the end of the third quarter after the exit quarter divided by the number of youth participants who exit during the quarter
1 This definition was used for earnings in PY 2005 Q=quarter
33
Literacy and Numeracy Gains Of those out-of-school youth who are basic skills deficient the number of youth participants who increase one or more educational functioning levels divided by the number of youth participants who have completed a year in the program (ie one year from the date of first youth program service) plus the number of youth participants who exit before completing a year in the program
Placement in Employment or Education2
Of those who are not in postsecondary education or employment (including the military) at the date of participation the number of youth participants who are in employment (including the military) or enrolled in postsecondary education andor advanced trainingoccupational skills training in the first quarter after the exit quarter divided by the number of youth participants who exit during the quarter
Program-Specific Performance Measures
Disability Employment Initiative (DEI) Number of Tickets Assigned Number of individuals on Social Security Administration (SSA) disability benefits who assigned their Ticket to the workforce board agency or American Job Center as their designated Employment Network under the SSA Ticket to Work program All DEI pilot sites must become an Employment Network under Ticket to Work
Amount of Revenue Generated Under the SSA Ticket to Work program when jobseekers who receive SSA disability benefits assign their Ticket to a workforce board agency or American Job Center as an Employment Network and then achieve certain employment milestones the Employment Network receives money or ldquoTicket revenuerdquo
2 Because of its intensity and duration the YouthBuild performance measure for placement in employment or education does not exclude those who entered the program with a job or in college
WORKFORCE SYSTEM RESULTS
Foreign Labor Certification Percent of H-1B Applications Resolved in Seven Business Days This estimate is based on the total number of applications processed within seven business days divided by the total number of applications processed for a given reporting period An application is considered processed if the last significant event is (1) certified (2) denied or (3) withdrawn
Average Number of Days to Resolve PERM Applications Not Subject to Integrity Review The average processing time between case receipt and decision date for non-audited cases
Average Number of Days to Resolve PERM Applications Subject to Integrity Review The average processing time between case receipt and decision date for audited cases
Percent of Complete H-2A Employer Applications Resolved within 30 Days Before the Date of Need This estimate is based on the total number of complete applications resolved within 30 days before the date of need divided by the total number of applications processed for a given reporting period
Percent of H-2B Applications Processed Within 30 Days of Receipt This estimate is based on the total number of applications processed within 30 days of receipt divided by the total number of applications processed for a given reporting period An application is considered processed if the last significant event is (1) certified (2) denied or (3) withdrawn
Indian and Native American Youth Attainment of Two or More Goals The total number of youth participants enrolled in the Granteersquos Supplemental Youth Services Program who attained at least two of the 14 goals listed below divided by the total number of Supplemental Youth Services participants enrolled during the report period The 14 goals include
1 Completed Job ReadinessOrientation to the World of Work Training 2 Completed Internship or Vocational Exploration Program
3 Completed Career Assessment 4 Entered Unsubsidized Employment 5 Remained in School 6 Returned to School Full Time 7 Enrolled in Job Corps 8 Improved Basic Skills Level By At Least Two Grades 9 Attained High School Diploma 10 Attained GED 11 Completed Occupational Skills Training 12 Completed Leadership Skills Training 13 Entered Other (Non-Supplemental Youth) Training Program 14 Summer Employment
Educational Attainment for Dropouts The number of dropouts who have obtained a high school diploma GED or increased their literacy and numeracy by two grade levels divided by the total number of dropouts
Job Corps Measures Placement in Employment or Education Percent of Job Corps participants3 entering employment or enrolling in post-secondary education andor advanced skills trainingoccupational skills training in the first quarter after exit from the program
Attainment of a Degree or Certificate Percent of students who attain a GED HSD or certificate
Literacy Numeracy Gains Percent of students who achieve literacy or numeracy gains of one or more Adult Basic Education (ABE) levels
3 Calculation of the Placement rate measure does not include outcomes for students who participated in the program for less than 60 days
34
WORKFORCE SYSTEM RESULTS
Internet-Based Assistance Web Site Visits ETArsquos Internet-based assistance includes electronic tools that help individuals make informed employment and education choices The measure for tracking the overall performance and usage of these tools is Web site visits A visit is defined as a series of page requests from the same uniquely identified client with a time of no more than 30 minutes between each page
request
ONet Product Downloads The ONET product downloads count the number of unique users who download an ONET online resource (wwwonetcenterorg) which includes the ONET database (all versions) ONET technical reports (such as on green jobs) supplemental data files (lay titles tools and technology) the ONET Career Exploration Tool files ONET Survey questionnaires and other related materials such as the Toolkit for Business
Registered Apprenticeship Program Entered Employment Rate Percent of apprentices employed in the first quarter after exit who either completed or cancelled from their Registered Apprenticeship Program
Employment Retention Rate Percent of apprentices employed in the first quarter after exit still employed in the second and third quarter after exit who either completed or cancelled from their Registered Apprenticeship Program
Six Monthsrsquo Average Earnings Six month Average Earnings of apprentices employed in the first quarter after exit still employed in the second and third quarter after exit who either completed or cancelled from their Registered Apprenticeship Program
Reintegration of Ex-OffendersmdashAdult Program Recidivism Rate The percentage of participants who are rearrested for a new crime or re-incarcerated for revocation of a parole or probation violation within one year from release from prison
Senior Community Service Employment Program Service Level The count of participants during the report period divided by the total number of authorized grantee community service positions
Community Service The number of community service hours as reported by each grantee divided by the total community service hours funded for the grantee adjusted for minimum wage differences among the states
Most-in-Need Most-in-need means participants with one or more of the following characteristics have a severe disability are frail are age 75 or older are age-eligible but not receiving benefits under Title II of the Social Security Act reside in an area with persistent unemployment and have severely limited employment prospects have limited English proficiency have low literacy skills have a disability reside in a rural area are Veterans have low employment prospects have failed to find employment after utilizing services provided under Title I of the Workforce Investment Act of 1998 (29 USC 2801 et seq) or are homeless or at risk for homelessness (sect 513(b)(1)(E) as amended by Pub L No 109-365)
Unemployment Insurance Percent of Payments Made Timely The percentage of intrastate Unemployment Insurance benefit first payments for full weeks of unemployment issued within 14 days following the first compensable week in states with a waiting week and 21 days in non-waiting week states
Detection of Recoverable Overpayments The amount of overpayments (dollars) established through state operations as a percent of the estimated amount states can detect and establish for recovery
Entered Employment Rate The percent of persons receiving a first payment in a given quarter who had earnings in the next quarter
Percent of Employer Tax Liability Determinations Made Timely The percent of new employer determinations made within 90 days of the end of the quarter in which employers became liable to pay unemployment taxes
35
WORKFORCE SYSTEM RESULTS
YouthBuild Attainment of a Degree or Certificate Of those enrolled the number of youth participants who attain a diploma high school equivalency degree or industry-recognized certificate by the end of the third quarter after the exit quarter divided by the number of youth enrolled (minus youth exited for other reasons)
Literacy and Numeracy Gains Of those youth participants who are basic skills deficient at enrollment the number of youth participants who increase one or more educational functioning levels within one year of enrollment divided by the number of youth participants who have completed a year in the program
Placement in Employment or Education The number of youth participants who are in employment (including the military) or are enrolled in post-secondary education andor advanced trainingoccupational skills training in the first quarter after the exit quarter divided by the number of youth participants who exited during the previous quarter
Youthful Offender Projects Placement Rate The placement rate is the percentage of out-of-school youth ages 18 and above placed in unsubsidized jobs occupational training post-secondary education or the military
Recidivism Rate The recidivism rate is the percentage of youth offenders who have been convicted of a new crime within 12 months of their release of a correctional facility or being placed on probation
36
WORKFORCE SYSTEM RESULTS
2471 American Job Centers formerly known as One-Stop Career Centers
12 VT
9 HI
1 GU
6 DC
2 VI
15 NE
16 SD
12 ME
19 IA
19 AK
19 WV
4 DE
47 AL
55 CO
48 MN
57 WI
89 NC
60 GA
31 MA
23 NM
16 ND
47 AR
70 PA
18 CT 4 RI
12 NV
20 WY
22 KS
18 PR
89 OH
69 TN
102 FL
59 AZ 46
SC
12 NH
29 NJ
52 VA
22 MT
33 OK
39 MS
59 WA
61 IL 34 MD
47 OR
131 KY
62 LA
83 IN
33 UT
44 MO
26 ID 90
NY95 MI
1 to 25
25 to 50
50 to 75
75 to 100
Over 100
203 CA
180 TX
Source Americarsquos Service Locator (wwwServiceLocatororg) Americarsquos Service Locator connects individuals to employment and training opportunities available at local American Job Centers The Web site provides contact information for a range of local work-related services including unemployment benefits career development and educational opportunities As of March 17 2015
37
WORKFORCE SYSTEM RESULTS
United States Department of Labor
200 Constitution Avenue NW
Washington DC 20210
wwwdolgov
- A9RFAFEtmp
- DOL_Workforce_Rprt_Jun_2014_51415-dp
-
- Workforce System Results
-
- Contents
- Quarterly Spotlight
- People Served by Program
- Current Appropriations
- Government Performance and Results Act Goals (GPRA)
- Indian and Native American Adult Program (INAP)
- National Farmworker Jobs Program (NFJP)
- Senior Community Service Employment Program (SCSEP)
- Wagner-Peyser Employment Service
- Workforce Investment Act Adult Program
- Workforce Investment Act Dislocated Worker Program
- H-1B and Permanent Foreign Labor Certification (PERM)
- H-2A and H-2B Foreign Labor Certification Programs
- Reintegration of Ex-Offenders (RExO-ADULT)
- Registered Apprenticeship
- Registered Apprenticeship
- Trade Adjustment Assistance (TAA)
- Unemployment Insurance (UI)
- Unemployment Insurance (UI)
- Job Corps
- Workforce Investment Act Youthful Offender Initiative
- Workforce Investment Act Youth Program
- YouthBuild
- Indian and Native American Youth Program
- H-1B Jobs and Innovation Accelerator Challenge Grants
- H-1B Technical Skills Training Grants
- Community-Based Job Training Grants (CBJT)
- Trade Adjustment Assistance Community College and Career Training (TAACCCT) Grants
- Disability Employment Initiative (DEI)
- ETA Internet-Based Assistance (E-TOOLS)
- Glossary of Performance Measures
- 2471 American Job Centers formerly known as One-Stop Career Centers
-
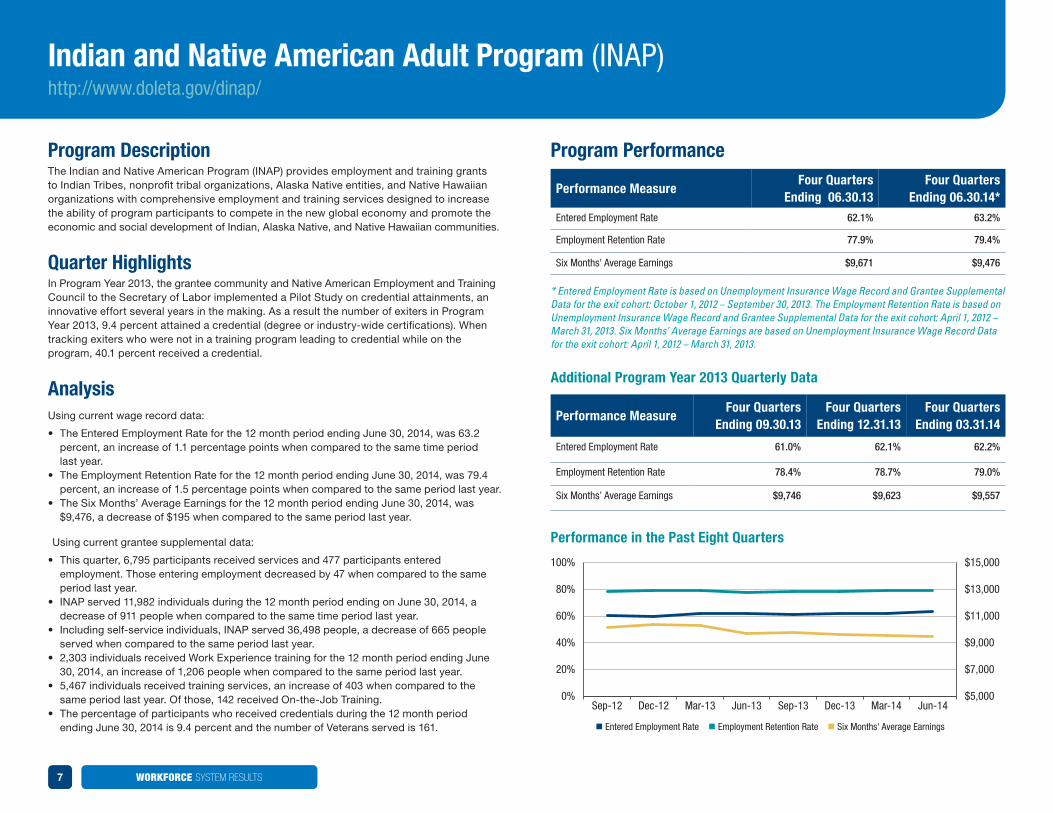
WORKFORCE SYSTEM RESULTS
Additional Program Year 2013 Quarterly Data
100 $15000
80 $13000
60 $11000
40 $9000
20 $7000
0 Sep-12 Dec-12 Mar-13 Jun-13 Sep-13 Dec-13 Mar-14 Jun-14
$5000
n Entered Employment Rate n Employment Retention Rate n Six Months Average Earnings
Indian and Native American Adult Program (INAP) httpwwwdoletagovdinap
Program Description The Indian and Native American Program (INAP) provides employment and training grants to Indian Tribes nonprofit tribal organizations Alaska Native entities and Native Hawaiian organizations with comprehensive employment and training services designed to increase the ability of program participants to compete in the new global economy and promote the economic and social development of Indian Alaska Native and Native Hawaiian communities
Quarter Highlights In Program Year 2013 the grantee community and Native American Employment and Training Council to the Secretary of Labor implemented a Pilot Study on credential attainments an innovative effort several years in the making As a result the number of exiters in Program Year 2013 94 percent attained a credential (degree or industry-wide certifications) When tracking exiters who were not in a training program leading to credential while on the program 401 percent received a credential
Analysis Using current wage record data
bull The Entered Employment Rate for the 12 month period ending June 30 2014 was 632 percent an increase of 11 percentage points when compared to the same time period last year
bull The Employment Retention Rate for the 12 month period ending June 30 2014 was 794 percent an increase of 15 percentage points when compared to the same period last year
bull The Six Monthsrsquo Average Earnings for the 12 month period ending June 30 2014 was $9476 a decrease of $195 when compared to the same period last year
Using current grantee supplemental data
bull This quarter 6795 participants received services and 477 participants entered employment Those entering employment decreased by 47 when compared to the same period last year
bull INAP served 11982 individuals during the 12 month period ending on June 30 2014 a decrease of 911 people when compared to the same time period last year
bull Including self-service individuals INAP served 36498 people a decrease of 665 people served when compared to the same period last year
bull 2303 individuals received Work Experience training for the 12 month period ending June 30 2014 an increase of 1206 people when compared to the same period last year
bull 5467 individuals received training services an increase of 403 when compared to the same period last year Of those 142 received On-the-Job Training
bull The percentage of participants who received credentials during the 12 month period ending June 30 2014 is 94 percent and the number of Veterans served is 161
Program Performance
Performance Measure Four Quarters
Ending 063013 Four Quarters
Ending 063014 Entered Employment Rate 621 632
Employment Retention Rate 779 794
Six Months Average Earnings $9671 $9476
Entered Employment Rate is based on Unemployment Insurance Wage Record and Grantee Supplemental Data for the exit cohort October 1 2012 ndash September 30 2013 The Employment Retention Rate is based on Unemployment Insurance Wage Record and Grantee Supplemental Data for the exit cohort April 1 2012 ndash March 31 2013 Six Monthsrsquo Average Earnings are based on Unemployment Insurance Wage Record Data for the exit cohort April 1 2012 ndash March 31 2013
Performance Measure Four Quarters
Ending 093013 Four Quarters
Ending 123113 Four Quarters
Ending 033114
Entered Employment Rate 610 621 622
Employment Retention Rate 784 787 790
Six Monthsrsquo Average Earnings $9746 $9623 $9557
Performance in the Past Eight Quarters
7
WORKFORCE SYSTEM RESULTS
100 $15000
80 $13000
60 $11000
40 $9000
20 $7000
0 Sep-12 Dec-12 Mar-13 Jun-13 Sep-13 Dec-13 Mar-14 Jun-14
$5000
n Entered Employment Rate n Employment Retention Rate n Six Months Average Earnings
National Farmworker Jobs Program (NFJP) httpwwwdoletagovFarmworkerhtmlNFJPcfm
Program Description The National Farmworker Jobs Program (NFJP) assists migrants other seasonally employed farmworkers and their families in achieving economic self-sufficiency and stability through job training and other services that address their employment related needs New job skills training in occupations with higher wages are offered as well as supportive services that help farmworkers stabilize their employment in agriculture Assistance from the NFJP is accessed directly through the grantee organizations and local American Job Centers
Quarter Highlights David came to the Proteus Visalia Service Center in California in April 2014 in search of employment and training services David was a high school graduate with limited job skills and worked as a seasonal farmworker David enrolled in the NFJP and received career assessment case management and energy efficiency training services After several months David successfully graduated and was hired as a junior solar installer by Solar City He is now working full-time earning $1300 per hour
Program Performance
Performance Measure Four Quarters
Ending 063013 Four Quarters
Ending 063014
Entered Employment Rate 855 881
Employment Retention Rate 831 856
Six Monthsrsquo Average Earnings $10533 $10855
Additional Program Year 2013 Quarterly Data
Performance Measure
Four Quarters
Ending 093013
Four Quarters
Ending 123113
Four Quarters
Ending 033114
Entered Employment Rate 862 876 884
Employment Retention Rate 836 840 850
Six Monthsrsquo Average Earnings $10439 $10433 $10605
Performance in the Past Eight Quarters
Analysis bull The Entered Employment Rate of 881 percent exceeds the programrsquos performance goal of
861 percent and is a 26 percentage point improvement from the same quarter one year ago bull The Employment Retention Rate of 856 percent exceeds the performance goal of 832
percent and shows a 25 percentage point improvement from the same quarter one year ago bull The Six Months Average Earnings result of $10855 exceeds the programrsquos performance
goal of $10501 and is $322 more when compared to the same reporting period one year ago
8
WORKFORCE SYSTEM RESULTS
100 $8000
80
60 $7000
40 $6000
20
0
n Entered Employment Rate n Employment Retention Rate n Six Month
Dec-13Sep-13Jun-13Mar-13 Dec-12Sep-12 $5000
s Average Earnings
Jun-14Mar-14
Senior Community Service Employment Program (SCSEP) httpwwwdoletagovseniors
Program Description Authorized by the Older Americans Act of 1965 the Senior Community Service Employment Program (SCSEP) is designed to foster individual economic self-sufficiency and promote useful opportunities in community service employment for unemployed low-income persons (particularly persons who have poor employment prospects) who are age 55 or older and to increase the number of persons who may benefit from unsubsidized employment in the public and private sectors
Quarter Highlights A former Vietnam Veteran Mr S and his wife returned to a small town in New Mexico to take care of his ailing parents During the next couple of years his parents passed away his wife died unexpectedly and he lost the family home Homeless Mr S did odd jobs in the community in exchange for necessities Eventually a member of his church gave him a room and told him about Goodwill Industries of Central New Mexicorsquos SCSEP program Goodwill placed Mr S in a training site at the local community center where he had already developed strong relationships with staff and guests The money he earned from SCSEP allowed him to move into an apartment Through the program Mr S developed confidence in his skills and abilities and with the help of Goodwillrsquos SCSEP staff he obtained a job at the local Goodwill store where he currently manages the donation site He says he loves his job and with his salary can afford a much better place to live Mr S continues to volunteer at the local community center by shopping for elderly in the community
Program Performance
Performance Measure Four Quarters
Ending 063013 Four Quarters
Ending 063014
Entered Employment Rate 425 452
Employment Retention Rate 744 731
Six Monthsrsquo Average Earnings $7163 $7446
Additional Program Year 2013 Quarterly Data
Performance Measure
Four Quarters
Ending 093013
Four Quarters
Ending 123113
Four Quarters
Ending 033114
Entered Employment Rate 427 428 433
Employment Retention Rate 722 712 702
Six Monthsrsquo Average Earnings $7329 $7437 $7378
Performance in the Past Eight Quarters
Analysis In Program Year 2013 67814 people were served by the program and 12 percent of those people were Veterans SCSEP participants recorded 35746097 hours of community service Six Monthsrsquo Average Earnings are higher than a year ago which is expected with a recovering economy Eighty-eight percent of participants were at or below poverty level Comparing Program Year 2013 with Program Year 2012
bull The Entered Employment Rate increased 27 percentage points from one year ago bull The Employment Retention Rate decreased 13 percentage points from one year ago bull Six Monthsrsquo Average Earnings increased almost four percentage points from one year ago
9
WORKFORCE SYSTEM RESULTS
100
80
60
40
20
0 Sep-12 Dec-12 Mar-13 Jun-13 Sep-13 Dec-13 Mar-14 Jun-14
n Entered Employment Rate n Employment Retention Rate n Six Months Average Earnings
$15000
$13000
$11000
$9000
$7000
$5000
Wagner-Peyser Employment Service httpwwwdoletagovProgramsWagner_Peysercfm
Program Description Wagner-Peyser Employment Service is an integral part of the American Job Center network formerly known as One-Stop Career Centers delivery system which provides universal access to workers job seekers and businesses The Employment Service focuses on providing a variety of employment related services including but not limited to job search assistance job referral and placement assistance for job seekers reshyemployment services to unemployment insurance claimants and recruitment services to employers with job openings Services are provided in one of three modes of delivery approaches self-service facilitated self-help service and staff-assisted service
Quarter Highlights When Mylan Pharmaceuticals Inc the third largest generic and pharmaceuticals company in the world needed to increase its production team at its Morgantown West Virginia location it was receiving over 100000 resumes and was overwhelmed with interested job seekers for openings to fill Plant Manufacturing Laborer positions With a starting pay of $1800 per hour the positions at Mylan are very attractive and turned to WorkForce (WF) West Virginia for labor exchange assistance beginning a success story of cooperation between private industry and a State agency WF West Virginia was able to help screen job seekers for Mylan and the plant hired 177 participants including 21 Veterans a higher representation than overall Veterans in the labor force (118 percent versus approximately seven percent)
Program Performance
Performance Measure Four Quarters
Ending 063013 Four Quarters
Ending 063014
Entered Employment Rate 530 560
Employment Retention Rate 810 820
Six Monthsrsquo Average Earnings $14252 $14515
Additional Program Year 2013 Quarterly Data
Performance Measure
Four Quarters
Ending 093013
Four Quarters
Ending 123113
Four Quarters
Ending 033114
Entered Employment Rate 530 530
Employment Retention Rate 810 810
Six Monthsrsquo Average Earnings $14129 $14175
Performance in the Past Eight Quarters
540
810
$14265
Analysis bull Over 16 million people received services from the Wagner-Peyser Employment Service
between July 1 2013 and June 30 2014 bull Over 11 million Veterans received services between July 1 2013 and June 30 2014 bull Nearly 35 million unemployed individuals entered employment after receiving services
from the Employment Service between July 1 2013 and June 30 2014
10
WORKFORCE SYSTEM RESULTS
100 $15000
80 $13000
60 $11000
40 $9000
20 $7000
0 Jun-12 Jun-13 Jun-14
$5000
n Entered Employment Rate n Employment Retention Rate n Six Months Average Earnings
Workforce Investment Act Adult Program httpwwwdoletagovprogramsgeneral_infocfm
Program Description The Workforce Investment Act (WIA) Adult Program helps prepare low-skill adult workers for good jobs through formula grants to States States use the funds to provide employment and training services through a network of American Job Centers of which there were nearly 2500 across the United States as of June 30 2014
WIA provides employment and training services at three broad service levels to job seeker customers core intensive and training These services are provided at a level which most efficiently meets their needs to achieve gainful employment The program is also designed to assist employer customers meet their needs for skilled workers
Adult Programs serve the broadest range of individuals including but not limited to public assistance recipients Unemployment Insurance claimants Veterans people with disabilities dislocated workers migrant and seasonal farmworkers Indian and Native Americans and workers age 55 or older
Quarter Highlights In Virginia the GoodwillWIA Adult program assists with the funding for Patient Care Technician (PCT) training provided by Fast Track Health The cost of training is approximately $3450 and the training is eleven weeks in duration This training provides a certificate in CNA EKG CPR and Phlebotomy with the certificationlicensing costs included in the overall training cost Ms O was referred to the WIA Adult program by a local Virginia Employment Commission representative She attended an orientation and started the process of changing her life that very day Ms O excelled and received a 100 percent increase in salary after completing training through this program with Fast Track Ms O stated of her experience ldquoI am very happy with my new career and very grateful for Goodwill and the WIA Adult program for providing [me] with this opportunity to enter a career with so much potential for advancementrdquo
Analysis bull In Program Year 2013 the WIA Adult program served 7184946 participants and over
150000 participants received training services bull Participants who received training services had a 761 percent Entered Employment
Rate in Program Year 2013 15 percentage points higher than the overall Entered Employment Rate of 611 percent
Program Performance
Performance Measure
Four Quarters
Ending 063012
(Program Year 2011)
Four Quarters
Ending 063013
(Program Year 2012)
Four Quarters
Ending 063014
(Program Year 2013)
Entered Employment Rate 572 599 611
Employment Retention Rate 808 819 828
Six Monthsrsquo Average Earnings $13482 $13335 $13842
Performance in the Past Three Program Years
11
WORKFORCE SYSTEM RESULTS
100 $19000
$1700080
$15000 60 $13000
$1100040 $9000
20 $7000
0 $5000 Jun-12 Jun-13 Jun-14
n Entered Employment Rate n Employment Retention Rate n Six Months Average Earnings
Workforce Investment Act Dislocated Worker Program httpwwwdoletagovprogramsgeneral_infocfm
Program Description The Workforce Investment Act Dislocated Worker Program funds services to support the reemployment of laid-off workers The Department of Labor allocates 80 percent of funds by formula to the States The Secretary of Labor may use the remaining 20 percent for National Emergency Grantsmdashthese specially targeted funds can infuse resources to areas suffering most from plant closings mass layoffs or job losses due to natural disasters or military base realignment and closures States allocate their Dislocated Worker funds to their local workforce investment areas Additionally the program allows for States to reserve up to 25 percent of their Dislocated Worker funds for Rapid Response activities Rapid Response is a pro-active business-focused and flexible strategy to help growing companies access an available pool of skilled workers and can respond to layoffs by quickly coordinating services and aid to companies and their workers
Program Performance
Performance Measure
Four Quarters
Ending 063012
(Program Year 2011)
Four Quarters
Ending 063013
(Program Year 2012)
Four Quarters
Ending 063014
(Program Year 2013)
Entered Employment Rate 611 600 600
Employment Retention Rate 842 843 838
Six Monthsrsquo Average Earnings $16500 $15930 $15997
Performance in the Past Three Program Years
Quarter Highlights After Kyle was laid off he was able to utilize an On-the-Job Training (OJT) opportunity with Tyson He now works the second shift from 1-9 pm and was able to obtain the technical training he felt he did not obtain from prior employment or education ldquoI wanted to get more experience on how things technically operate and this program is the perfect fit for merdquo Kyle said And in the end Tyson gained a skilled employee
Analysis bull The Dislocated Worker program served over 800000 participants in Program Year 2013
and provided training services to 109148 participants bull Participants who received training had an 814 percent Entered Employment Rate 214
percentage points higher than the overall Entered Employment Rate of 60 percent
12
WORKFORCE SYSTEM RESULTS
500 100
400 80
300 60
Days
200 40
100 20
0 0 Jun-13 Sep-13 Dec-13 Mar-14 Jun-14
n Average Number of Days to Resolve PERM Applications Not Subject to Integrity Review n Average Number of Days to Resolve PERM Applications Subject to Integrity Review (Audit) n Percent of H1-B Applications Processed within Seven Days of Filing
H-1B and Permanent Foreign Labor Certification (PERM) httpwwwforeignlaborcertdoletagov
Program Description Performance in the Past Five Quarters
H-1B certification permits employers to hire on a temporary basis foreign workers who possess qualifying professional or specialty skills The PERM program allows employers to begin the process for permanently hiring a foreign worker when there are not sufficient numbers of US workers who are able willing qualified and available to perform the job In addition the program ensures that the employment of the foreign worker does not adversely affect the wages and working conditions of American workers who are similarly employed
Program Performance
Performance Measure Four Quarters
Ending 063013 Four Quarters
Ending 063014
Percent of H-1B Applications Resolved in Seven Business Days
100 100
Quarter Highlights Average number of days to resolve PERM applications not subject to integrity review
129 194
The percent of employer applications processed within seven days of filing under the H-1B program sustains at approximately 100 percent ending in June 30 2014
Average number of days to resolve PERM applications subject to integrity review (Audit)
294 424 The Office of Foreign Labor Certification (OFLC) continues to allocate staff resources for the PERM program to increase program integrity by conducting more audit examinations and supervised recruitments This increased emphasis on program integrity has had an effect on processing timeliness
Additional Program Year 2013 Quarterly Data
Performance Measure
Four Quarters
Ending 093013
Four Quarters
Ending 123113
Four Quarters
Ending 033114
Analysis bull The number of H-1B applications processed within seven business days held steady
at 100 percent from the same four quarter reporting period one year ago Of the total 103032 H-1B applications processed over the past four quarters 103032 were completed within seven business days of the filing date
Percent of H-1B Applications Resolved in Seven Business Days
100 804 996 bull The average number of days to resolve PERM applications not subject to integrity review decreased by 20 percent compared to the previous quarter and the average number of days to resolve PERM applications subject to integrity review (Audits) decreased by four percent compared to the previous quarter
Average number of days to resolve PERM applications not subject to integrity review
178 237 234
Average number of days to resolve PERM applications subject to integrity review (Audit)
320 423 444
13
WORKFORCE SYSTEM RESULTS
100
80
60
40
20
0 Jun-13 Sep-13 Dec-13 Mar-14 Jun-14
n Percent of Accepted H-2A Applications Without Deficiencies Resolved by 30 Days Before the Date of Need n Percent of H-2B Applications Resolved Within 30 Days of Receipt
H-2A and H-2B Foreign Labor Certification Programs httpwwwforeignlaborcertdoletagov
Program Description H-2A labor certification permits employers to hire foreign workers on a temporary basis for the agricultural sector of the economy H-2B labor certification permits employers to hire foreign workers to come to the United States and perform temporary nonagricultural work which must be one-time seasonal peak load or intermittent in nature
Program Performance
Performance Measure Four Quarters
Ending 063013 Four Quarters
Ending 063014
Percent of Complete H-2A Employer Applications Resolved Within 30 Days Before the Date of Need
NA 97
Percent of H-2B Applications Resolved Within 30 Days
23 97
Additional Program Year 2013 Quarterly Data
Performance Measure
Four Quarters
Ending 093013
Four Quarters
Ending 123113
Four Quarters
Ending 033114
Percent of Complete H-2A Employer Applications Resolved Within 30 Days Before the Date of Need
NA NA 84
Percent of H-2B Applications Resolved Within 30 Days
98 92 99
The Percent of Complete H-2A Employer Applications Resolved Within 30 days Before the Date of Need measure was changed in the second quarter of Fiscal Year 2014
Performance in the Past Five Quarters
Quarter Highlights The Office of Foreign Labor Certification (OFLC) continues to resolve approximately 971 percent of complete H-2A applications on time The processing rates have improved in spite of an increase in the numbers of applications filed during this reporting period FY 2014 when compared to one year ago
Employer filings under the H-2B program have increased 167 percent this reporting period compared to the same four quarter reporting period one year ago
Analysis bull The percentage of H-2A applications resolved within 30 calendar days increased 125
percentage points from the previous quarter Of the 3845 total of H-2A applications processed in Fiscal Year 2014 908 percent were resolved within 30 calendar days of the filing date
bull The percentage of H-2B applications processed within 30 calendar days increased when compared with the same reporting period one year ago Of the 5188 H-2B applications processed within the last four quarters 998 percent of them were processed within 60 calendar days of the filing date
14
WORKFORCE SYSTEM RESULTS
100
80
60
40
20
0 Sep-12 Dec-12 Mar-13 Jun-13 Sep-13 Dec-13 Mar-14 Jun-14
$15000
$13000
$11000
$9000
$7000
$5000
n Entered EmploymentPlacement Rate n Employment Retention Rate n Six Months Average Earnings
Reintegration of Ex-Offenders (RExO-ADULT) httpwwwdoletagovRExOeta_defaultcfm
Program Description The Reintegration of Ex-Offenders ndash Adult Program (RExO-Adult) is an employment-centered program that seeks to strengthen urban communities that have large numbers of returning prisoners The program incorporates mentoring job training and other comprehensive transitional services It is designed to reduce recidivism by helping inmates find work when they return to their communities as part of an effort to improve community life
Quarter Highlights The Adult RExO Program operated three initiatives this program year
bull Grants to community and faith-based organizations to help returning offenders find employment
bull Grants aimed specifically at serving female offenders providing employment and supportive services
bull Grants to provide occupational training and job placement to offenders in Halfway Houses
Program Performance
Performance Measure Quarter Ending
063013
Quarter Ending
063014
Entered Employment Rate
58 58
Employment Retention Rate
68 72
Six Monthsrsquo Average Earnings
$9797 $9770
The data for June 30 2013 are program-to-date since the inception of the program in the Spring of 2006 The June 30 2014 numbers are program-to-date for currently operating projects
Additional Program Year 2013 Quarterly Data
Performance Measure Quarter Ending
093013
Quarter Ending
123113
Quarter Ending
033114
Entered Employment Rate
55 56
Employment Retention Rate
66 68 70
Six Monthsrsquo Average Earnings
$10036 $9962 $9736
Performance in the Past Eight Quarters
58
Analysis The Adult RExO Program served 6308 participants this program year
bull Adult RExO Grantees reported 3404 enrollees receiving training or education bull Adult RExO Grantees reported 2555 enrollees receiving a certificate bull The recidivism rate largely reflects the extent to which the program is serving persons
at high or low risk of re-offending
15
WORKFORCE SYSTEM RESULTS
Registered Apprenticeship httpwwwdoletagovoa
Program Description Registered Apprenticeship is a leader in preparing American workers to compete in a global 21st Century economy With a network of over 150000 employers in more than 1000 occupations Registered Apprenticeship has already trained millions of Americarsquos workers Modern apprenticeships are now on the cutting edge of innovation in preparing a skilled workforce for todayrsquos industries including expanding industries like health care information technology transportation telecommunications and advanced manufacturing as well as in industries like construction where apprenticeships have a long and successful history
Quarter Highlights During the summer of 2014 the White House hosted the first-ever Summit on Apprenticeship to gather the best ideas and to catalyze action to dramatically increase apprenticeship in America More than 60 attendees presented their ideas including leading employers big and small like IBM Bank of America Blue CrossBlue Shield and Oberg Industries labor unions like the International Brotherhood of Electrical Workers (IBEW) training providers like Ivy Tech and Lone Star Community Colleges and local workforce leaders The event was the apex in a series of industry roundtables on apprenticeship which took place across the country during June amp July 2014
Program Performance
Performance Measure Four Quarters
Ending 063013 Four Quarters
Ending 063014
Entered Employment Rate 734 742
Employment Retention Rate 873 878
Six Monthsrsquo Average Earnings $23826 $24387
Performance Measure Quarter Ending
063013 Quarter Ending
063014
Apprentices
Total Apprentices (Active Apprentices)
148039 152582
New Apprentices 17432 17011
Programs
New Programs 139
Programs Maintained Total (Active Programs)
9809 9077
Number of new programs in Construction and Manufacturing
93
Source Registered Apprenticeship Partners Information Management Data System (RAPIDS) data managed by Department of Labor staff only 063013 data has been revised to include federal data only Running total of active apprenticesprograms during the quarter
16
177
127
WORKFORCE SYSTEM RESULTS
0
20
40
60
80
100
Sep-12 Dec-12 Mar-13 Jun-13 Sep-13 Dec-13 Mar-14 Jun-14 $5000 $7000 $9000 $11000 $13000 $15000 $17000 $19000 $21000 $23000 $25000
n Entered Employment Rate n Employment Retention Rate n Six Months Average Earnings
Registered Apprenticeship httpwwwdoletagovoa
Additional Program Year 2013 Quarterly Data
Performance Measure
Four Quarters
Ending 093013
Four Quarters
Ending 123113
Four Quarters
Ending 033114
Entered Employment Rate 735 738 738
Employment Retention Rate 874 877 878
Six Monthsrsquo Average Earnings $24171 $24324 $24378
Performance in the Past Eight Quarters
Analysis bull During the third quarter of Fiscal Year 2014 there were over 394000 active apprentices
nationwide while over 13000 program participants completed their apprenticeship and received a credential that is portable industry recognized and can provide a pathway to middle-class and sustainable careers
bull The Entered Employment Rate for participants who completed their Registered Apprenticeship program was 856 percent 114 percentage points higher than for all program exiters who either completed or cancelled (742 percent as shown in table on the previous page)
bull The Employment Retention Rate for program completers was 910 percent 32 percentage points higher than for all program exiters (878 percent as shown in table on the previous page)
bull The Six Monthsrsquo Average Earnings for program completers was $29964 which is over $5577 more than that of all program exiters (ie completers or those who cancelled) The results for those completing the program shows it pays to stay
17
WORKFORCE SYSTEM RESULTS
100
80
60
40
20
0 Sep-12 Dec-12 Mar-13 June-13 Sep-13 Dec-13 Mar-14 Jun-14
n Entered Employment Rate n Employment Retention Rate n Six Months Average Earnings
$25000
$21000
$17000
$13000
$9000
$5000
Trade Adjustment Assistance (TAA) httpwwwdoletagovtradeact
Program Description The Trade Adjustment Assistance (TAA) Program is an integral part of the comprehensive workforce development system The program is essential to helping workers dislocated by foreign trade to adjust to changing market conditions and shifting skill requirements Addressing the needs of trade-affected workers involved in this transformation is a unique challenge because in general these workers are being dislocated from relatively outdated-skill high-wage employment In many cases this is complicated by mass layoffs or plant closures that occur in single-industry towns which makes finding comparable employment in the same geographic area difficult Furthermore many of these jobs are lost permanently from the domestic economy requiring affected workers to completely retool their skills
Fiscal Year Highlights During Fiscal Year 2014 Massachusetts diligently trained staff at the local CareerOneStop Centers to ascertain a TAA participantrsquos eligibility for other funding resources to assist in their reemployment initiatives These improved efforts to provide and report reemployment services enables Trade customers to flow through the CareerOneStop Center system with other dislocated workers and receive seamless resources through the resource sharing initiatives of the Career Center methodology These streamlined reemployment services have resulted in an Entered Employment Rate of 815 percent nearly ten percentage points higher than the national average
Program Performance
Performance Measure FY 2011 FY 2012 FY 2013 FY 2014
Entered Employment Rate 653 689 716 729
Employment Retention Rate 897 913 917 911
Six Monthsrsquo Average Earnings $18319 $18837 $18099 $17828
Performance Measure Quarter Ending 063013 Quarter Ending 063014
Entered Employment Rate 733 728
Employment Retention Rate 900 927
Six Monthsrsquo Average Earnings $18210 $17692
Additional Program Year 2013 Quarterly Data
Performance Measure Quarter Ending
093013
Quarter Ending
123013
Quarter Ending
033014
Entered Employment Rate 713 713
Employment Retention Rate 918 918
Six Monthsrsquo Average Earnings $17499 $17499
Performance in the Past Eight Quarters
727
917
$17550
Analysis During Fiscal Year 2014 there were 62706 total participants receiving TAA benefits or services and 20577 exiters entered employment (729 percent) More than one-third of all participants were minorities with the average age of participants being 47 years and the average tenure being approximately 13 years 9547 exiter participants received credentials or 83 percent of all exiter participants who completed training 32527 participants received training or approximately 52 percent of all participants Lastly the program served 4828 Veteran participants accounting for approximately eight percent of all participants
18
WORKFORCE SYSTEM RESULTS
Unemployment Insurance (UI) httpouidoletagovunemploy
Program Description The federal-state Unemployment Insurance (UI) System minimizes individual and family financial hardship due to unemployment and stabilizes the economy during economic downturns by providing unemployed workers with temporary income support States operate their own Unemployment Insurance Programs regulated by State laws
As the Federal partner DOL provides program leadership allocates administrative funds provides technical assistance and exercises performance oversight
Quarter Highlights As the economy improved the system emphasized program integrity solvency and reemployment Claims rates decreased about 10 percent from the year before and Trust Fund loans decreased from $21 billion to $14 billion EUC benefit payments ceased on December 28 2013 Twenty-four states implemented Short-term Compensation programs allowing unemployed workers to stay on jobs while receiving partial unemployment benefits proportionate to reduced work hours States implemented systems to improve efficiency and reduce overpayments such as data exchange and recover UI overpayments By June 30 2014 42 states were recovering overpayments through Federal Income tax refund offset (TOP) and had recovered $370 million in 2014 (over $840 million since TOPrsquos inception)
Analysis During the year ending June 30 2014
bull 51 million UI claimants were reemployed in the quarter following their UI 1st payments (17 million in the last quarter)
bull The UI system met two and failed two of its four targets UI met detection of overpayments (643 percent vs target of 542 percent) and met reemployment (657 percent vs target of 647 percent)
bull The system fell short of its 1st pay and status targets because of retirements and other turnover of key staff
Program Performance
Performance Measure Four Quarters
Ending 063013 Four Quarters
Ending 063014
Percent of Intrastate Payments Made Timely
812 792
Detection of Recoverable Overpayments Rate
598 643
Facilitation of Reemployment Rate 6261 6552
Percent of Employer Tax Liability 888 882
Operational Results
Recipiency Rate 263 272
Exhaustion Rate 456 431
Percent of Recipients of Prime Working Age (25-54)
702 700
Percent of Recipients Who Are Female
434 437
New Initial Unemployment Insurance Claims
13906868 12501014
Number of First Unemployment Insurance Payments
8404507 7632522
Average Duration of Unemployment Insurance (Weeks)
169
1 Reemployment for year ending June 30 2013 2 Reemployment for year ending June 30 2014
19
167
WORKFORCE SYSTEM RESULTS
Unemployment Insurance (UI) httpouidoletagovunemploy
Additional Program Year 2013 Quarterly Data
Performance Measure Four Quarters
Ending 093013 Four Quarters
Ending 123113 Four Quarters
Ending 033114
Percent of Intrastate Payments Made Timely
809 802 793
Detection of Recoverable Overpayments Rate
590 630 603
Facilitation of Reemployment Rate 6311 6312 6363
Percent of Employer Tax Liability 886 885 884
Operational Results
Recipiency Rate 263 262 267
Exhaustion Rate 453 446 437
Percent of Recipients of Prime Working Age (25-54)
702 702 701
Percent of Recipients Who Are Female
434 434 435
New Initial Unemployment Insurance Claims
13559233 13340263 12947493
Number of First Unemployment Insurance Payments
8215687 7967852 7857395
Average Duration of Unemployment Insurance (Weeks)
169 169 168
1 Reemployment for year ending September 30 2013 2 Reemployment for year ending December 31 2013 3 Reemployment for year ending March 31 2014
20
WORKFORCE SYSTEM RESULTS
100
80
60
40
20
0 Sep-12 Dec-12 Mar-13 Jun-13 Sep-13 Dec-13 Mar-14 Jun-14
n Placement in Employment or Education n Attainment of a Degree or Certificate n LiteracyNumeracy Gains
Job Corps httpwwwjobcorpsgovhomeaspx
Program Description Job Corps is the nationrsquos largest residential educational and career technical training program for at-risk youth ages 16 through 24 The 125 Job Corps centers nationwide provide an integrated comprehensive array of services that include academic career technical and life skills training career planning and work-based learning health care and post-program placement and transition support
Job Corps is committed to offering all students a safe drug-free environment where they can take advantage of the resources provided Job Corpsrsquo mission is to attract eligible young people teach them the skills they need to become employable and independent and place them in meaningful jobs or further education
Program Performance
Performance Measure Four Quarters
Ending 063013 Four Quarters
Ending 063014
Placement in Employment or Education 746 767
Attainment of a Degree or Certificate 706 668
LiteracyNumeracy Gains 692 661
Additional Program Year 2013 Quarterly Data
Performance Measure
Four Quarters
Ending 093013
Four Quarters
Ending 123113
Four Quarters
Ending 033114
Placement in Employment or Education 757 760 765
Attainment of a Degree or Certificate 722 727 707
LiteracyNumeracy Gains 702 709 695
Performance in the Past Eight Quarters
The Performance in the Past Eight Quarters graph displays single quarter data versus the Program Performance tables which depict cumulative four quarter data
Quarter Highlights In May 2014 four Job Corps students from centers in Montana California Iowa and Virginia participated in the 2nd Asia-Pacific Economic Cooperation (APEC) Youth Skills Camp in Beijing and Guangzhou China the second time Job Corps students have participated in this event The camp included field visits to vocational training schools business enterprises and public practical training facilities as well as skills exchanges This international event provides students with life-changing experiences in travel diversity and first-hand exposure to global issues
Analysis bull During the current quarter Job Corps served 69979 participants including 13079 new
enrollees an increase of 801 percent overall compared to the same quarter in PY 2013 and due to the resumption of new enrollments after the PY 2012 enrollment suspensions The number of new students increased by over 200 percent from the same quarter in PY 2013
bull The proportion of 16-17 year olds served increased by 45 percentage points Conversely the proportion of all older students served similarly decreased from the same quarter in PY 2013
bull In the current quarter Job Corps placed 7203 students in Employment and Education a slight decrease of 04 percentage points compared to the same quarter last year In addition 8657 students attained a Certificate a 131 percentage point decrease compared to the same quarter in PY 2013 Also 6789 students attained a LiteracyNumeracy gain an 116 percentage point decrease over the same quarter in PY 2013
bull In the current quarter the program served 50 participants who were Veterans prior to enrollment bull When comparing the four quarter data Placement in Employment or Education increased
21 percentage points Attainment of a Degree or Certificate decreased 38 percentage points and LiteracyNumeracy Gains decreased 31 percentage points from the same quarter one year ago 21
WORKFORCE SYSTEM RESULTS
100
80
60
40
20
0 Sep-12 Dec-12 Mar-13 Jun-13 Sep-13 Dec-13 Mar-14 Jun-14
n Placement Rate for Out-of-School Youth Ages 18 and Above n Recidivism Rate for Youth Ages 14 to 17 n Recidivism Rate for Youth Ages 18 and Above
Workforce Investment Act Youthful Offender Initiative httpwwwdoletagovYouth_servicesyouthful_offendercfm
Program Description The Employment and Training Administration uses its Youthful Offender Appropriation to fund a variety of projects that target youth offenders and young adult offenders Currently operating projects include grants to community-based organizations to involve juvenile offenders in training and service learning projects grants to intermediary organizations to serve young offenders in high-poverty high-crime communities and grants to help youth enter diversion programs as an alternative to out-of-home placements and to assist eligible youth have their juvenile records sealed or expunged
Quarter Highlights The great majority of juvenile offenders are of ages 17 and below and many are still in high school The youth offender grants focus on helping younger youth stay in school and complete their education and helping older youth find jobs and succeed in the labor market Case management mentoring and supportive services are also provided by these grants
Performance in the Past Eight Quarters
Program Performance
Performance Measure Four Quarters
Ending 063013 Four Quarters
Ending 063014
Placement Rate for Youth Ages 18 and Above
36 362
Recidivism Rate for Youth Ages 14 to 17
35 24
Recidivism Rate for Youth Ages 18 and Above
34 16
Results are cumulative for currently operating grants
Additional Program Year 2013 Quarterly Data
Placement Rate for Youth Ages 18 and Above
277 334 325
Performance Measure
Four Quarters
Ending 093013
Four Quarters
Ending 123113
Four Quarters
Ending 033114
Recidivism Rate for Youth Ages 14 to 17
349 349 349
Recidivism Rate for Youth Ages 18 and Above
335 335 335
Analysis bull Providing opportunities to youthful offenders results in varying outcomes depending on
the mix of projects being operated in a given year bull Projects have markedly different placement and recidivism rates depending on whether
they are serving young adults in their 20s or youth ages 16-17 they recruit youth in the community or through direct referrals from the juvenile justice system whether they are located in small or large cities and the extent to which enrollees are at high or low risk of re-offending
22
WORKFORCE SYSTEM RESULTS
100
80
60
40
20
0 Jun-12 Jun-13 Jun-14
n Placement in Employment or Education n Attainment of a Degree or Certificate n LiteracyNumeracy Gains
Workforce Investment Act Youth Program httpwwwdoletagovyouth_services
Program Description The Workforce Investment Act Youth Formula Program provides employment and education services to eligible low-income youth ages 14 to 21 who face barriers to employment The program serves in-school and out-of-school youth youth with disabilities and low literacy rates as well as others who may require additional assistance to complete an educational program and acquire an industry-recognized credential or enter employment
Quarter Highlights The passage of the Workforce Innovation and Opportunity Act (WIOA) includes a major shift in focus to spending more funds on and serving more out-of-school youth (OSY) The workforce system demonstrated its readiness for this shift in that 48 percent of all youth served in PY 2013 were OSY and 57 percent of all WIA youth local area funds were spent on OSY So far in Program Year 2013 California has spent almost 65 percent of their WIA youth funds on OSY with high levels of OSY expenditures in both urban and rural areas 53 percent of all youth served in CA in Program Year 2013 were OSY For example Los Angeles City spent 80 percent of their funds on OSY and the Northern Rural Training and Employment Consortium spent 76 percent of their funds on OSY Both local areas have achieved these levels through strong partnerships with organizations that serve OSY as well as access to high quality work experiences
Program Performance
Performance Measure
Four Quarters
Ending 063012
(Program Year 2011)
Four Quarters
Ending 063013
(Program Year 2012)
Four Quarters
Ending 063014
(Program Year 2013)
Placement in Employment or Education 589 666 690
Attainment of a Degree or Certificate 648 675 684
LiteracyNumeracy Gains 476 509 525
Performance in the Past Three Program Years
Analysis bull 197045 participants were served in the cumulative four quarter reporting period compared
to 217244 served during the same time period last year This decrease is due primarily to a lower funding level compared to the previous year
bull Placement in Employment or Education achieved a result of 690 percent a 24 percentage point increase when compared with the same time period last year
bull The program achieved a result of 684 percent for the Attainment of a Degree or Certificate measure This is a 09 percentage point increase from the same time period last year
bull The LiteracyNumeracy Gains measure achieved a result of 525 percent an increase of 16 percentage points when compared with the same time period last year
bull All three youth common measures exceeded Program Year 2013 GPRA goals
23
WORKFORCE SYSTEM RESULTS
100
80
60
40
20
0 Sep-12 Dec-12 Mar-13 Jun-13 Sep-13 Dec-13 Mar-14 Jun-14
n Placement in Employment or Education n Attainment of a Degree or Certificate n LiteracyNumeracy Gains
YouthBuild httpwwwdoletagovyouth_servicesyouthbuildcfm
Program Description YouthBuild provides job training and educational opportunities for at-risk youth ages 16 to 24 while constructing or rehabilitating affordable housing for low-income or homeless families in their own neighborhoods The youth split their time between the construction site and the classroom where they earn their high school diploma or equivalency learn to be community leaders and prepare for college and other post-secondary training opportunities
Analysis bull 33392 participants have been enrolled into the YouthBuild program since 2007 and 29553
have exited so far bull Since the program began a total of 11716 participants have received a high school
diploma or equivalency 17572 have attained an industry-recognized certificate and 21835 have been placed into initial jobs post-secondary education andor long-term vocational occupational skills training including apprenticeship
bull The Class of 20102011 performance steadily increased The outcomes for all three measures were above those for the Class of 2009 and significantly above the GPRA goals
bull YouthBuild is currently meeting or exceeding the GPRA goal for all three measures The additional quarter of service for 20102011 grants provided additional positive outcomes as expected As the 2012 grant class progresses it is expected that this trend will continue
Program Performance
Quarter Highlights Just A Start in Cambridge (MA) has been a YouthBuild grantee since 2010 In the fourth quarter of the Program Year 2013 they shared the following success story
Victor earned a High School Diploma and HBIPACT construction certification He was accepted to Endicott College in MA He also secured a full time painting position with George Souza Painting making $25 per hour He continues to develop his career plan with staff
Class of 20102011 Performance in the Past Eight Quarters
Performance Measure GPRA Results for Class
0f 20102011 Results for Class 2012 Overall Results
Percent of Participants Entering Employment or Enrolling in Postsecondary Education the Military or Advanced Training Occupational Skills Training in the First Quarter After Exit
500 612 586 519
Percent of Youth Who Attain a Diploma GED or Certificate by the End of the Third Quarter after Exit
672 770 609 672
Percent of Participants Deficient in Basic Skills Who Achieve Literacy or Numeracy Gains of One Adult Basic Education Level
585 676 549 595
24
WORKFORCE SYSTEM RESULTS
100
80
60
40
20
0 Sep-12 Dec-12 Mar-13 Jun-13 Sep-13 Dec-13 Mar-14 Jun-14
n Attainment of a High School Diploma GED or improvement of basic skills by at least two grade levels or completed Occupational Skills training n Participants who Attained Two or more Goals
Indian and Native American Youth Program httpwwwdoletagovdinap
Program Description The Indian and Native American Supplemental Youth Services Program provides summer and year-round employment and training activities for Indian Alaska Native and Native Hawaiian individuals between the ages of 14 and 21 Program resources are targeted to at-risk and the neediest youth who face substantial barriers to education and employment success This population includes high school dropouts and youth who are basic-skills deficient
Quarter Highlights Youth summer employment is a high priority for Native American Tribes However most rural reservation areas do not have enough employers to put youth to work during the summer As a result Tribes rely on the annual WIA Section 166 funding to place youth in summer employment where they can earn a wage and receive valuable work experience
Over the past four quarter period 2487 of the 4399 youth that participated in the youth program were placed in summer employment Youth participants come from low income families with little or no opportunity to earn money during the summer months Through the Indian and Native American Youth Program these youth are given an opportunity to work and earn money during the summer which helps them contribute to their familyrsquos income
Performance in the Past Eight Quarters
Program Performance
Performance Measure Four Quarters
Ending 063013 Four Quarters
Ending 063014
Educational Attainment for Dropouts 180 220
Attainment of Two or More Goals 920 927
The data reported reflect the period from April 1 2012 through March 31 2013 The data reported reflect the period from April 1 2013 through March 31 2014
Additional Program Year 2013 Quarterly Data
Performance Measure Four Quarters
Ending 093013 Four Quarters
Ending 123113 Four Quarters
Ending 033114
Educational Attainment for Dropouts
250 250 220
Attainment of Two or More Goals
930 930 927
The data reported reflect the period from April 1 2013 through September 30 2013 The data reported reflect the period from April 1 2013 through March 31 2014
Analysis bull The Attainment of Two or More Goals rate increased slightly from 92 percent in June 2013
to 927 percent in June 2014 bull The Indian and Native American Youth Program served 4310 youth during the period July
1 2013 through June 30 2014 This is a 164 percentage point decrease in youth served one year ago
bull The Education Attainment for Dropouts increased from 18 percent in June 2013 to 22 percent in June 2014
25
WORKFORCE SYSTEM RESULTS
Green Jobs Innovation Fund Grants (GJIF) httpwwwdoletagovBRGGreenJobs
Program Description The Green Jobs Innovation Fund (GJIF) was authorized as a Pilot and Demonstration Project under the Workforce Investment Act (WIA) of 1998 to help workers receive job training in green industry sectors and occupations as well as access green career pathways GJIF is seeking to increase the number of individuals completing training programs who receive industry-recognized credentials and to increase the number of individuals completing training programs for employment in green jobs
With these grants the Department is emphasizing two key workforce programs that move participants along green career pathways by 1) forging linkages between Registered Apprenticeship and pre-apprenticeship programs andor 2) integrating the delivery of technical and basic skills training through community-based partnerships The grantees are building on existing programs that are already established and serving workers and moving workers into and along green career pathways The Green Jobs Innovation Fund (GJIF) grants are all anticipated to end by June 30 2015
Quarter Highlights The Jobs for the Future (JFF) GreenWays grant program made great progress toward their goal of increasing access for women to enter higher-paying non-traditional occupations Women currently comprise 254 of the programs total enrollment and are earning higher placement wages overall than men At the same time their completion rates credential attainment rates and job placement rates lag behind those of men reflecting the ongoing challenges that women experience in non-traditional occupations The JFF GreenWays program continues to focus on raising the visibility of this issue as a key element in regional approaches to addressing poverty in female-headed households
Program Performance
Performance Measure Cumulative
Four Quarters Ending 063013
Cumulative Four Quarters
Ending 063014
Entered Employment Rate 569 642
Employment Retention Rate 750 821
Six Monthsrsquo Average Earnings $16249 $17459
Additional Program Year 2013 Quarterly Data
Performance Measure
Cumulative Four
Quarters Ending
093013
Cumulative Four
Quarters Ending
123113
Cumulative Four
Quarters Ending
033114
Entered Employment Rate 560 626 641
Employment Retention Rate 790 795 785
Six Monthsrsquo Average Earnings $16406 $15228 $15039
Cumulative Credential Outcomes in the Past Three Quarters
Performance Measure Quarter Ending
123113
Quarter Ending
033114
Quarter Ending
063014
Number Completed Education Job Training Activities
5521 6438 7076
Number Completed Training and Received Credential
5343 6242 6849
Attainment Rate 97 97 97
Analysis As of June 30 2014 8360 participants were enrolled in educationtraining Of these participants 600 participated in Registered Apprenticeship 874 participated in Pre-Apprenticeship and 40 participated in On-the-Job Training A total of 7076 participants completed educationtraining A total of 6849 participants received a credential Lastly a total of 4870 participants entered employment and of these participants 4343 entered training-related employment
26
WORKFORCE SYSTEM RESULTS
Dec-13 Mar-14 Jun-14
100 $27000
$2600080
$2500060
$24000 40
$23000
20 $22000
0 $21000
n Entered Employment Rate n Employment Retention Rate n Six Months Average Earnings
H-1B Jobs and Innovation Accelerator Challenge Grants httpwwwdoletagovETA_News_Releases20111398cfm
Program Description The Jobs and Innovation Accelerator Challenge (Jobs Accelerator) is designed to help regions achieve the demonstrated benefits of collaborative cluster-based regional development This initiative represents the implementation of Administration policy priorities to accelerate bottom-up innovation in urban and rural regions as opposed to imposing ldquoone-size-fits-allrdquo solutions The Jobs Accelerator also meets Administration goals for smarter use of government resources through reduction of Federal silos and promotion of coordinated Federal funding opportunities that offer more efficient access to Federal resources Investments from Federal agencies for the Jobs Accelerator projects include The US Department of Laborrsquos Employment and Training Administration (DOL-ETA) the US Department of Commercersquos Economic Development Administration (DOC-EDA) and the National Institutes of Standards and Technologyrsquos Hollings Manufacturing Extension Partnership (NIST-MEP) the Small Business Administration (SBA) the Department of Energy Advanced Manufacturing Office (DOE AMO) and the Delta Regional Authority (DRA)
The objectives of the Jobs Accelerator are to
bull Accelerate the formation of new high-growth businesses and expansion of existing businesses
bull Accelerate the creation of higher-wage jobs bull Advance commercialization of research including Federally-funded research bull Support deployment of new processes new technologies and new products to grow sales
and generate employment bull Enhance the capacity of small businesses in the cluster including small and disadvantaged
businesses bull Increase exports and business interaction with international buyers and suppliers bull Develop the skilled workforce needed to support growing clusters and bull Ensure diverse workforce participation in clusters through outreach training and the
creation of career pathways
Quarter Highlights The Northeast Ohio Speed-To-Market Accelerator (STMA) program administered by Lorain County Community College aims to accelerate the speed-to-market for near production or pilot production prototypes stimulate job creation and increase the global competitiveness of cluster companies attract private capital and attract students incumbent workers and the unemployed
This quarter STMA helped accelerate the introduction of a new dry electrode product for heart monitoring This sensor and electronics will be introduced as part of the next generation of wearable human performance arm band from Pittsburgh based Body Media a subsidiary of Jawbone Further STMA continues to bring new companies into the STMA
program through cluster outreach activities and this quarter three new leads were generated as the result of the existing STMA partners MAGNET JumpStart Lorain County Community College and NorTech
Program Performance
Performance Measure Four Quarters
Ending 123113 Four Quarters
Ending 033114 Four Quarters
Ending 063014
Entered Employment Rate 307 283 359
Employment Retention Rate 907 925 927
Six Monthsrsquo Average Earnings $23310 $22953 $26682
Performance in the Past Three Quarters
Analysis A total of 3702 individuals were served 3632 individuals began educationjob training activities and 2052 individuals completed educationjob training services Of participants completing educationjob training 370 unemployed individuals completed training and entered employment and of these 114 individuals entered training-related employment A total of 204 employed individuals completed training and retained their current position and of these 85 employed individuals completed training and advanced into a new position A total of 2006 individuals completed educationtraining activities and received credentials and of these 2273 total credentials were awarded
This data represents three rounds of the for Jobs Accelerator initiative which includes the Jobs Accelerator Round 1 the Advanced Manufacturing Jobs Accelerator Round 2 and the Make it in America (MIIA) Jobs Accelerator grants program
27
WORKFORCE SYSTEM RESULTS
100 $56000
80 $54000
$52000 60 $50000
40 $48000
$46000 20
$44000
0 $42000 Dec-13 Mar-14 Jun-14
n Entered Employment Rate n Employment Retention Rate n Six Months Average Earnings
H-1B Technical Skills Training Grants httpwwwdoletagovbusinessH1B_Tech_Skillscfm
Program Description The H-1B Technical Skills Training (TST) Grants were authorized by the American Competitiveness and Workforce Improvement Act of 1998 (ACWIA) as amended (29 USC 2916a) to provide education training and job placement assistance in the occupations and industries for which employers are using H-1B visas to hire highly-skilled foreign workers on a temporary basis and the related activities necessary to support such training The H-1B TST Grant Program is intended to raise the technical skill levels of American workers so they can obtain or upgrade employment in high-growth industries and occupations Over time these education and training programs will help businesses reduce their use of skilled foreign professionals permitted to work in the US on a temporary basis under the H-1B visa program The grants represent significant investments in sectors such as information technology advanced manufacturing and health care In addition these grants will focus on serving participants who have been identified as long-term unemployed particularly those who have been unemployed the longest These grants also have an emphasis on providing on-the-job training allowing participants to learn new skills while earning a pay check To date ETA has announced two rounds of TST grants totaling $342 million The first round was announced on October 4 2011 and the second round was announced on February 22 2012
Quarter Highlights The Los Angeles HealthWorks On-the-Job training (OJT) initiative administered by Managed Career Solutions Inc (MCS) provides individuals with training that leads to industry recognized credentials and employment opportunities within the regionrsquos healthcare field MCS maintains several strong partnerships to coordinate outreach recruitment training OJT placements and employment opportunities As of June 30 2014 MCS served nearly 800 long-term unemployed participants and overall 1100 participants In the same period over 650 individuals completed training and earned an industry recognized credential Of those completers 128 were employed at participation however the majority were underemployed and gained the necessary job skills and credentials that allowed 80 percent to advance into a new position In recognition MCS received the Malcom Baldrige and State Eureka awards
Analysis bull 52532 individuals were served and 51071 individuals began educationjob training
activities bull 15185 individuals completed educationjob training activities including 3321 unemployed
individuals who completed training and entered employment bull Of these 2925 individuals entered training-related employment 2902 employed individuals
completed training and retained their current position 1452 employed individuals completed training and advanced into a new position
bull 11944 individuals completed educationjob training activities and received credentials with 14099 total credentials awarded
Program Performance
Performance Measure
Four Quarters
Ending 123113
Four Quarters
Ending 033114
Four Quarters
Ending 063014
Entered Employment Rate 778 725 675
Employment Retention Rate 993 944 926
Six Monthsrsquo Average Earnings $54683 $50833 $46245
Since the H-1B TST program provides training to incumbent unemployed and long-term unemployed workers to prepare them for jobs in a variety H-1B industries andor occupations the Entered Employment Rate and Six Monthsrsquo Average Earnings can vary For the quarter ending on June 30 2014 the H-1B TST program saw a decline in the Entered Employment Rate and Six Monthsrsquo Average Earnings in comparison with the results for the previous rolling four quarters Previous results reflected a large number of incumbent workers who enrolled in short-term high-skilled training and exited early leading to a relatively high Six Monthsrsquo Average Earnings As the projects progress unemployed and long-term unemployed workers who required longer-term training begin to exit the program and search for jobs Ultimately as they enter employment wages may be less than those achieved by the higher-skilled incumbent workers who either retain or advance in their positions after training
Performance in the Past Three Quarters
28
WORKFORCE SYSTEM RESULTS
100 $21000
$19000 80
$17000
$1500060 $13000
40 $11000
$900020
$7000
0 $5000Sep-12 Dec-12 Mar-13 Jun-13 Sep-13 Dec-13 Mar-14 Jun-14
n Entered Employment Rate n Employment Retention Rate n Six Months Average Earnings
Community-Based Job Training Grants (CBJT) httpwwwdoletagovbusinessCommunity-BasedJobTrainingGrantscfm
Program Description Community-Based Job Training Grants (CBJT) seek to strengthen the role of community colleges in promoting the United States workforcersquos competitiveness The program does this by building the capacity of community colleges to train workers in skills required to succeed in regionally based high-growth high-demand industries and occupations Important grant activities include training in the healthcare biotech advanced manufacturing energy automotive transportation construction insurance forestry and aerospace industries The first round of CBJT grants were awarded in October 2005 To date ETA has announced five rounds of CBJT grants awarding 320 grants to community colleges and other organizations All CBJT grants ended as of June 30 2014
Quarter Highlights The 14 remaining projects active in this quarter represent the culmination of another successful DOL initiative Some of the significant accomplishments include the development and sustainability of Roane State Community Collegersquos Lean Manufacturing program designed to meet the needs of local manufacturing employers the San Jacinto Community College Districtrsquos Gulf Coast Healthcare Partners project which developed training to support healthcare career and Central Arizona Collegersquos Pinal County Alternative Energy Project More than half of the CBJT participants who began education and training activities completed their programs 79 percent of them received an industry recognized credential ie certificate or degree Eighty-four percent of the participants who gained employment entered into new training-related positions
Program Performance
Performance Measure Four Quarters
Ending 063013 Four Quarters
Ending 063014
Entered Employment Rate 572 662
Employment Retention Rate 891 899
Six Monthsrsquo Average Earnings $18675 $17027
Additional Program Year 2013 Quarterly Data
Performance Measure
Four Quarters
Ending 093013
Four Quarters
Ending 123113
Four Quarters
Ending 033114
Entered Employment Rate 57 605 655
Employment Retention Rate 891 897 891
Six Monthsrsquo Average Earnings $18675 $18285 $16642
Performance in the Past Eight Quarters
Analysis bull 268359 individuals have been served through the initiative bull 258216 individuals began educationjob training activities bull 165264 individuals completed educationjob training activities Of these
bull 131107 individuals received credentials bull 65089 individuals entered new positions of employment and 54344 individuals entered new
positions of training-related employment
Note All data are cumulative Prior to new reporting requirements implemented in the quarter ending December 31 2011 grantees only reported results for individuals that entered employment and individuals that entered training-related employment (noted above) if those participants entered employment and completed training in the same quarter As a result prior to that quarter participants that entered employment in quarters after they completed training were captured in the Common Measures and the total number of individuals that ultimately entered employment and training-related employment are actually higher than the results above indicate
29
WORKFORCE SYSTEM RESULTS
100 92
7880
5760
40
20
0
n Percent of Target Number of Programs Launched by Round
Round 1 Round 2 Round 3
Trade Adjustment Assistance Community College and Career Training (TAACCCT) Grants httpwwwdoletagovtaaccct
Program Description The Trade Adjustment Assistance Community College and Career Training (TAACCCT) Grant Program is authorized by the Trade Act of 1974 under Chapter 4 of Title II The purpose of this grant program is to provide eligible institutions of higher education with funds to expand and improve their ability to deliver education and career training programs that can be completed in two years or less and that result in skills degrees and credentials that prepare program participants for employment in high-wage high-skill occupations and are suited for workers who are eligible for training under the Trade Adjustment Assistance (TAA) for Workers program under Chapter 2 of Title II of the Trade Act The TAACCCT Grant Program is funded under the Health Care and Education Reconciliation Act of 2010 which appropriated $500 million for the program for each of Fiscal Years 2011-2014 for a total of $2 billion
Round 1 ndash FY 2011 Grants On June 30 2014 grants awarded in Round 1 (FY 2011) had completed all but one quarter of their periods of performance By the end of their final year of the grant the forty-nine (49) Round 1 grantees project that they will offer a total of 906 new programs of study As of June 30 2014 grantees began offering 834 (92 percent) of these programs of study
Round 2 ndash FY 2012 Grants The seventy-nine (79) grants awarded in the Fiscal Year 2012 had completed seven quarters of their grants at the end of June 30 2014 Their period of performance began on October 1 2012 and will end on September 30 2016 however their final year will be dedicated to gathering information and data for reporting outcome measures and completing the requirements for a third-party evaluation They project that by the end of the third year they will have launched 761 programs As of the end of June 30 2014 they had began offering 561 (78 percent) of these programs
Round 3 ndash FY 2013 Grants Grants awarded in FY 2013 had completed the first three quarters of their period of performance Their grants began on October 1 2013 and will end on September 30 2017
In their third year they will have launched all of their programs as their final year will be dedicated to collecting follow up data for evaluation and reporting purposes only The fifty-seven (57) grantees plan to launch 551 programs As of June 30 2014 they had already launched 288 (57 percent) of these programs
Percentage of Target Number of Programs Launched as of June 30 2014 by Grant Round
Performance Information Programmatic data is collected at different intervals throughout the period of performance including
bull Quarterly Narrative Progress Reports (QNPR) Grantees will provide quarterly qualitative data on the capacity building taking place through progress and other implementation measures that grantees defined in their Statements of Work
bull Annual Performance Reports (APR) Grantees will provide annual quantitative data on their training and employment outcomes for TAACCCT program participants that are impacted by the capacity building activities being implemented by their grants
30
WORKFORCE SYSTEM RESULTS
$4500000 3500$4000000 3000$3500000
2500
Jun-13 Dec-13 Mar-14 Jun-14
Amou
nt $3000000 2000$2500000
$2000000 1500 $1500000 1000 $1000000
500$500000 $0 0
n Amount of Revenue Generated n Number of Tickets Assigned
Disability Employment Initiative (DEI) httpwwwdoletagovdisability
Program Description All DEI Workforce Employment Network (EN) Trends
Launched in 2010 the Disability Employment Initiative (DEI) seeks to improve education training and employment opportunities for youth and adults with disabilities who are unemployed underemployed andor receiving Social Security disability benefits The DEI is jointly funded by the US Department of Laborrsquos Employment and Training Administration and Office of Disability Employment Policy DEI projects improve collaboration among employment and training and asset development programs implemented at state and local levels including the Social Security Administrationrsquos Ticket to Work Program and build effective partnerships that leverage resources to better serve individuals with disabilities and improve employment outcomes
Quarter Highlights A variety of Department of Labor programs helped Vietnam-era veteran Richard James navigate through life After servicing B-52 bombers in the Air Force James held a series of sales jobs while putting himself through law school at night He rose to become a successful New England attorney and owner of a boat dock building company when he suffered a terrible head injury which caused spine and nerve damage Addiction to pain medication followed and James ended up homeless While recovering from his injuries James took a college course through the Veterans Retraining Assistance Program managed in part by the Department He received career counseling from a Disabled Veterans Outreach Program representative at a local American Job Center and support from the DEI Disability Resource Coordinator Eventually James was hired as an attorney by a Rhode Island law firm The departments grants and programs made possible the services that put me back in a position of being a productive member of society he said
Program Performance
Performance Measure Quarter Ending 63013
Quarter Ending
123113
Quarter Ending 33114
Quarter Ending 63014
Analysis bull The Exit Rate for Adult and Youth exiters with disabilities in Round one DEI sites is almost
double the national average Adult DEI was 89 percent vs All StatesAll LWIAs 49 percent Older Youth DEI 166 percent vs All StatesAll LWIAs 87 percent Younger Youth DEI 339 percent vs All StatesAll LWIAs 151 percent
bull The CredentialSkill Attainment Rate for older and younger youth with disabilities in Round 1 DEI sites was higher than the national average Older Youth DEI credential rate 568 percent vs All StatesAll LWIAs 383 percent Younger Youth DEI skill rate 902 percent vs All States All LWIAs 834 percent
bull The Exit Rate for Adult and Youth exiters with disabilities in Round two DEI sites is higher than the national average Adult DEI 56 percent vs All StatesAll LWIAs 49 percent Older Youth DEI 163 percent vs All StatesAll LWIAs 87 percent and Younger Youth DEI 167 percent vs All StatesAll LWIAs 151 percent
bull The Entered Employment Rate for Adult DEI sites 657 percent is 20 percent higher than in All StatesAll LWIAs 434 percent
bull DEI Workforce Employment Networks (EN) activity shows that the number of Tickets assigned increased from 1780 to 2903 an increase of 1123 and the amount of revenue
Number of Tickets Assigned 1780 1590 2554 2903 generated from DEI EN payments increased from $2373404 to $4057353 an increase of $168 million Amount of Revenue Generated $2373404 $1927104 $3505582 $4057353
31
WORKFORCE SYSTEM RESULTS
ETA Internet-Based Assistance (E-TOOLS) wwwcareerinfonetorg wwwservicelocatororg wwwcareeronestoporg wwwonetonlineorg wwwmyskillsmyfutureorg wwwmynextmoveorg
Program Description Additional Program Year 2013 Quarterly Data
Performance Measure Quarter Ending
093013
Quarter Ending
123113
Quarter Ending
033114
CareerOneStop Portal Visits 5754645 5159240 5340022
ETArsquos Internet-based assistance includes electronic tools that help individuals explore career opportunities and link to job postings either on their own or at local American Job Centers to make informed employment and education choices
The Web sites feature user-friendly occupation and industry information salary data career videos education resources career exploration assistance and other resources that support talent development in todayrsquos fast-paced global marketplace Users can find information some of which is also industry sponsored about occupations that are in-demand in high growth industries Additionally information is available regarding occupational skills and workplace competencies
Quarter Highlights For the year ending June 2014 CareerOneStop launched a new portal for Ex-Offenders added Federal Contractor job tagging a TAACCCT information finder Youth Council information to Americarsquos Service Locator and began working on adding more job feeds
Americarsquos Service Locator (ASL) Visits
730998 758919 724053
ONET Downloads 26646 29407 28505
ONET Visits 7697608 10211177 11500039
Combined Visits 14183251 16129336 17564114
Performance in the Past Eight Quarters
25000000 $36000
Sep-12 Dec-12 Mar-13 Jun-13 Sep-13 Dec-13 Mar-14 Jun-14
n Combined Visits (in millions) n ONET Product Downloads (in thousands)
$31500 20000000
ONE
T Pr
oduc
t Dow
nloa
ds
$27000
Com
bine
d Vi
sits
$2250015000000 $18000
10000000 $13500
$90005000000
$4500
$00
ONET has added web services for developers and increased the available Tools and Technology and Detailed Work Activities information to convey specialized occupational attributes
Program Performance
Performance Measure Quarter
Ending 063013 Quarter
Ending 063014
CareerOneStop Portal Visits 5104850 5472742
Americarsquos Service Locator (ASL)Visits
747114 802148
ONET Downloads 29482 25278
ONET Visits 8716609 13581922
Combined Visits 14568573 19856812
Analysis bull ETA Internet-Based Assistance received 19856812 combined visits for the quarter ending
June 30 2014 an increase of 36 percent over the same period in 2013 bull Visits to CareerOneStop increased to 5472742 or 72 percent over the same period in 2013
with mySkillsmyFuture continuing to be a popular tool with an increase of 23 percent bull Americarsquos Service Locator Visits traffic increased 74 percent over the same period in 2013 bull The ONET traffic received 13581922 visits in this quarter an increase of 558 percent
over the same period in 2013 and the ONET downloads totaled 25278 for the quarter a decrease of 142 percent
32
WORKFORCE SYSTEM RESULTS
Glossary of Performance Measures
Common Performance Measures Common Performance Measures are used by Workforce Investment Act Indian and Native American Program Disability Program Navigator Initiative Wagner-Peyser Trade Adjustment Assistance Senior Community Service Employment Program Reintegration of Ex-Offenders Registered Apprenticeship Program Job Corps National Farmworker Jobs Program High Growth Job Training Initiative and Community-Based Job Training Grants
Adult Measures Entered Employment Of those who are not employed at the date of participation the number of adult participants who are employed in the first quarter after the exit quarter divided by the number of adult participants who exit during the quarter
Employment Retention Of those who are employed in the first quarter after the exit quarter the number of adult participants who are employed in both the second and third quarters after the exit quarter divided by the number of adult participants who exit during the quarter
Six Monthsrsquo Average Earnings Of those adult participants who are employed in the first second and third quarters after the exit quarter total earnings in the second quarter plus the total earnings in the third quarter after the exit quarter divided by the number of adult participants who exit during the quarter
Average Earnings Change in Six Months1
Of those who are employed in Q1 after exit the total post-program earnings (earnings in Q2 + Q3 after exit) minus pre-program earnings (earnings in Q2 + Q3 prior to registration) divided by the number of adults who exit during the quarter
Youth Measures Attainment of a Degree or Certificate Of those enrolled in education (at the date of participation or at any point during the program) the number of youth participants who attain a diploma GED or certificate by the end of the third quarter after the exit quarter divided by the number of youth participants who exit during the quarter
1 This definition was used for earnings in PY 2005 Q=quarter
33
Literacy and Numeracy Gains Of those out-of-school youth who are basic skills deficient the number of youth participants who increase one or more educational functioning levels divided by the number of youth participants who have completed a year in the program (ie one year from the date of first youth program service) plus the number of youth participants who exit before completing a year in the program
Placement in Employment or Education2
Of those who are not in postsecondary education or employment (including the military) at the date of participation the number of youth participants who are in employment (including the military) or enrolled in postsecondary education andor advanced trainingoccupational skills training in the first quarter after the exit quarter divided by the number of youth participants who exit during the quarter
Program-Specific Performance Measures
Disability Employment Initiative (DEI) Number of Tickets Assigned Number of individuals on Social Security Administration (SSA) disability benefits who assigned their Ticket to the workforce board agency or American Job Center as their designated Employment Network under the SSA Ticket to Work program All DEI pilot sites must become an Employment Network under Ticket to Work
Amount of Revenue Generated Under the SSA Ticket to Work program when jobseekers who receive SSA disability benefits assign their Ticket to a workforce board agency or American Job Center as an Employment Network and then achieve certain employment milestones the Employment Network receives money or ldquoTicket revenuerdquo
2 Because of its intensity and duration the YouthBuild performance measure for placement in employment or education does not exclude those who entered the program with a job or in college
WORKFORCE SYSTEM RESULTS
Foreign Labor Certification Percent of H-1B Applications Resolved in Seven Business Days This estimate is based on the total number of applications processed within seven business days divided by the total number of applications processed for a given reporting period An application is considered processed if the last significant event is (1) certified (2) denied or (3) withdrawn
Average Number of Days to Resolve PERM Applications Not Subject to Integrity Review The average processing time between case receipt and decision date for non-audited cases
Average Number of Days to Resolve PERM Applications Subject to Integrity Review The average processing time between case receipt and decision date for audited cases
Percent of Complete H-2A Employer Applications Resolved within 30 Days Before the Date of Need This estimate is based on the total number of complete applications resolved within 30 days before the date of need divided by the total number of applications processed for a given reporting period
Percent of H-2B Applications Processed Within 30 Days of Receipt This estimate is based on the total number of applications processed within 30 days of receipt divided by the total number of applications processed for a given reporting period An application is considered processed if the last significant event is (1) certified (2) denied or (3) withdrawn
Indian and Native American Youth Attainment of Two or More Goals The total number of youth participants enrolled in the Granteersquos Supplemental Youth Services Program who attained at least two of the 14 goals listed below divided by the total number of Supplemental Youth Services participants enrolled during the report period The 14 goals include
1 Completed Job ReadinessOrientation to the World of Work Training 2 Completed Internship or Vocational Exploration Program
3 Completed Career Assessment 4 Entered Unsubsidized Employment 5 Remained in School 6 Returned to School Full Time 7 Enrolled in Job Corps 8 Improved Basic Skills Level By At Least Two Grades 9 Attained High School Diploma 10 Attained GED 11 Completed Occupational Skills Training 12 Completed Leadership Skills Training 13 Entered Other (Non-Supplemental Youth) Training Program 14 Summer Employment
Educational Attainment for Dropouts The number of dropouts who have obtained a high school diploma GED or increased their literacy and numeracy by two grade levels divided by the total number of dropouts
Job Corps Measures Placement in Employment or Education Percent of Job Corps participants3 entering employment or enrolling in post-secondary education andor advanced skills trainingoccupational skills training in the first quarter after exit from the program
Attainment of a Degree or Certificate Percent of students who attain a GED HSD or certificate
Literacy Numeracy Gains Percent of students who achieve literacy or numeracy gains of one or more Adult Basic Education (ABE) levels
3 Calculation of the Placement rate measure does not include outcomes for students who participated in the program for less than 60 days
34
WORKFORCE SYSTEM RESULTS
Internet-Based Assistance Web Site Visits ETArsquos Internet-based assistance includes electronic tools that help individuals make informed employment and education choices The measure for tracking the overall performance and usage of these tools is Web site visits A visit is defined as a series of page requests from the same uniquely identified client with a time of no more than 30 minutes between each page
request
ONet Product Downloads The ONET product downloads count the number of unique users who download an ONET online resource (wwwonetcenterorg) which includes the ONET database (all versions) ONET technical reports (such as on green jobs) supplemental data files (lay titles tools and technology) the ONET Career Exploration Tool files ONET Survey questionnaires and other related materials such as the Toolkit for Business
Registered Apprenticeship Program Entered Employment Rate Percent of apprentices employed in the first quarter after exit who either completed or cancelled from their Registered Apprenticeship Program
Employment Retention Rate Percent of apprentices employed in the first quarter after exit still employed in the second and third quarter after exit who either completed or cancelled from their Registered Apprenticeship Program
Six Monthsrsquo Average Earnings Six month Average Earnings of apprentices employed in the first quarter after exit still employed in the second and third quarter after exit who either completed or cancelled from their Registered Apprenticeship Program
Reintegration of Ex-OffendersmdashAdult Program Recidivism Rate The percentage of participants who are rearrested for a new crime or re-incarcerated for revocation of a parole or probation violation within one year from release from prison
Senior Community Service Employment Program Service Level The count of participants during the report period divided by the total number of authorized grantee community service positions
Community Service The number of community service hours as reported by each grantee divided by the total community service hours funded for the grantee adjusted for minimum wage differences among the states
Most-in-Need Most-in-need means participants with one or more of the following characteristics have a severe disability are frail are age 75 or older are age-eligible but not receiving benefits under Title II of the Social Security Act reside in an area with persistent unemployment and have severely limited employment prospects have limited English proficiency have low literacy skills have a disability reside in a rural area are Veterans have low employment prospects have failed to find employment after utilizing services provided under Title I of the Workforce Investment Act of 1998 (29 USC 2801 et seq) or are homeless or at risk for homelessness (sect 513(b)(1)(E) as amended by Pub L No 109-365)
Unemployment Insurance Percent of Payments Made Timely The percentage of intrastate Unemployment Insurance benefit first payments for full weeks of unemployment issued within 14 days following the first compensable week in states with a waiting week and 21 days in non-waiting week states
Detection of Recoverable Overpayments The amount of overpayments (dollars) established through state operations as a percent of the estimated amount states can detect and establish for recovery
Entered Employment Rate The percent of persons receiving a first payment in a given quarter who had earnings in the next quarter
Percent of Employer Tax Liability Determinations Made Timely The percent of new employer determinations made within 90 days of the end of the quarter in which employers became liable to pay unemployment taxes
35
WORKFORCE SYSTEM RESULTS
YouthBuild Attainment of a Degree or Certificate Of those enrolled the number of youth participants who attain a diploma high school equivalency degree or industry-recognized certificate by the end of the third quarter after the exit quarter divided by the number of youth enrolled (minus youth exited for other reasons)
Literacy and Numeracy Gains Of those youth participants who are basic skills deficient at enrollment the number of youth participants who increase one or more educational functioning levels within one year of enrollment divided by the number of youth participants who have completed a year in the program
Placement in Employment or Education The number of youth participants who are in employment (including the military) or are enrolled in post-secondary education andor advanced trainingoccupational skills training in the first quarter after the exit quarter divided by the number of youth participants who exited during the previous quarter
Youthful Offender Projects Placement Rate The placement rate is the percentage of out-of-school youth ages 18 and above placed in unsubsidized jobs occupational training post-secondary education or the military
Recidivism Rate The recidivism rate is the percentage of youth offenders who have been convicted of a new crime within 12 months of their release of a correctional facility or being placed on probation
36
WORKFORCE SYSTEM RESULTS
2471 American Job Centers formerly known as One-Stop Career Centers
12 VT
9 HI
1 GU
6 DC
2 VI
15 NE
16 SD
12 ME
19 IA
19 AK
19 WV
4 DE
47 AL
55 CO
48 MN
57 WI
89 NC
60 GA
31 MA
23 NM
16 ND
47 AR
70 PA
18 CT 4 RI
12 NV
20 WY
22 KS
18 PR
89 OH
69 TN
102 FL
59 AZ 46
SC
12 NH
29 NJ
52 VA
22 MT
33 OK
39 MS
59 WA
61 IL 34 MD
47 OR
131 KY
62 LA
83 IN
33 UT
44 MO
26 ID 90
NY95 MI
1 to 25
25 to 50
50 to 75
75 to 100
Over 100
203 CA
180 TX
Source Americarsquos Service Locator (wwwServiceLocatororg) Americarsquos Service Locator connects individuals to employment and training opportunities available at local American Job Centers The Web site provides contact information for a range of local work-related services including unemployment benefits career development and educational opportunities As of March 17 2015
37
WORKFORCE SYSTEM RESULTS
United States Department of Labor
200 Constitution Avenue NW
Washington DC 20210
wwwdolgov
- A9RFAFEtmp
- DOL_Workforce_Rprt_Jun_2014_51415-dp
-
- Workforce System Results
-
- Contents
- Quarterly Spotlight
- People Served by Program
- Current Appropriations
- Government Performance and Results Act Goals (GPRA)
- Indian and Native American Adult Program (INAP)
- National Farmworker Jobs Program (NFJP)
- Senior Community Service Employment Program (SCSEP)
- Wagner-Peyser Employment Service
- Workforce Investment Act Adult Program
- Workforce Investment Act Dislocated Worker Program
- H-1B and Permanent Foreign Labor Certification (PERM)
- H-2A and H-2B Foreign Labor Certification Programs
- Reintegration of Ex-Offenders (RExO-ADULT)
- Registered Apprenticeship
- Registered Apprenticeship
- Trade Adjustment Assistance (TAA)
- Unemployment Insurance (UI)
- Unemployment Insurance (UI)
- Job Corps
- Workforce Investment Act Youthful Offender Initiative
- Workforce Investment Act Youth Program
- YouthBuild
- Indian and Native American Youth Program
- H-1B Jobs and Innovation Accelerator Challenge Grants
- H-1B Technical Skills Training Grants
- Community-Based Job Training Grants (CBJT)
- Trade Adjustment Assistance Community College and Career Training (TAACCCT) Grants
- Disability Employment Initiative (DEI)
- ETA Internet-Based Assistance (E-TOOLS)
- Glossary of Performance Measures
- 2471 American Job Centers formerly known as One-Stop Career Centers
-
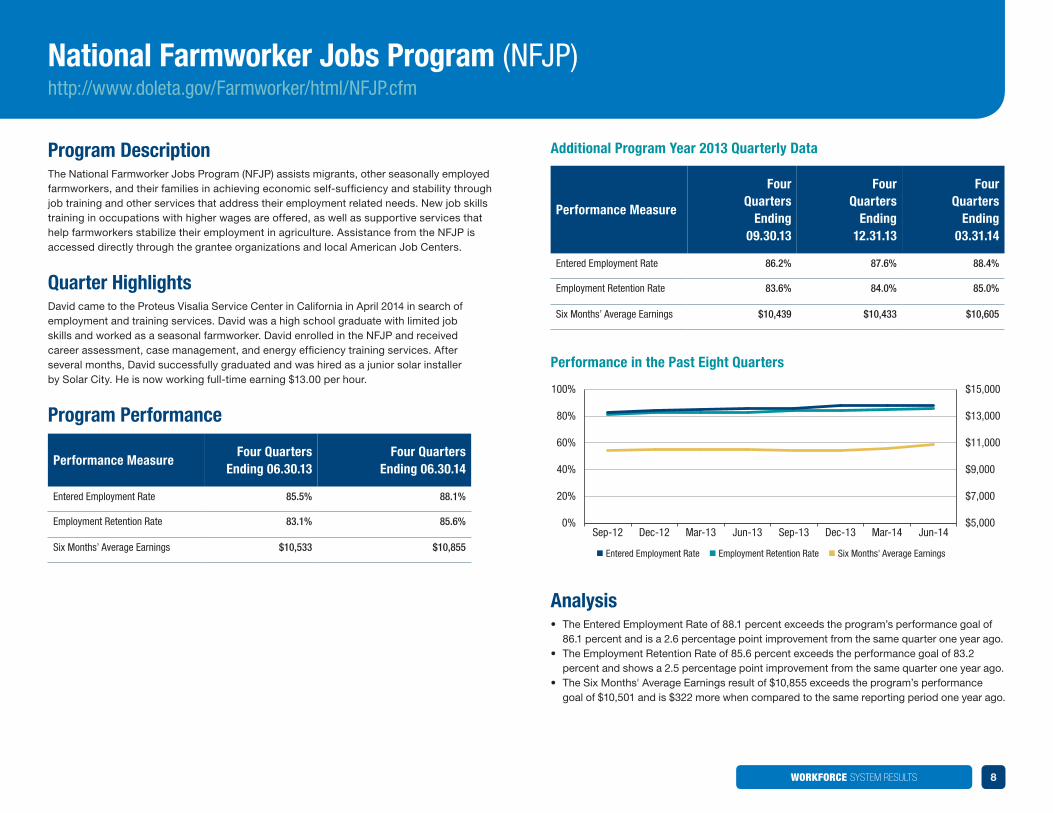
WORKFORCE SYSTEM RESULTS
100 $15000
80 $13000
60 $11000
40 $9000
20 $7000
0 Sep-12 Dec-12 Mar-13 Jun-13 Sep-13 Dec-13 Mar-14 Jun-14
$5000
n Entered Employment Rate n Employment Retention Rate n Six Months Average Earnings
National Farmworker Jobs Program (NFJP) httpwwwdoletagovFarmworkerhtmlNFJPcfm
Program Description The National Farmworker Jobs Program (NFJP) assists migrants other seasonally employed farmworkers and their families in achieving economic self-sufficiency and stability through job training and other services that address their employment related needs New job skills training in occupations with higher wages are offered as well as supportive services that help farmworkers stabilize their employment in agriculture Assistance from the NFJP is accessed directly through the grantee organizations and local American Job Centers
Quarter Highlights David came to the Proteus Visalia Service Center in California in April 2014 in search of employment and training services David was a high school graduate with limited job skills and worked as a seasonal farmworker David enrolled in the NFJP and received career assessment case management and energy efficiency training services After several months David successfully graduated and was hired as a junior solar installer by Solar City He is now working full-time earning $1300 per hour
Program Performance
Performance Measure Four Quarters
Ending 063013 Four Quarters
Ending 063014
Entered Employment Rate 855 881
Employment Retention Rate 831 856
Six Monthsrsquo Average Earnings $10533 $10855
Additional Program Year 2013 Quarterly Data
Performance Measure
Four Quarters
Ending 093013
Four Quarters
Ending 123113
Four Quarters
Ending 033114
Entered Employment Rate 862 876 884
Employment Retention Rate 836 840 850
Six Monthsrsquo Average Earnings $10439 $10433 $10605
Performance in the Past Eight Quarters
Analysis bull The Entered Employment Rate of 881 percent exceeds the programrsquos performance goal of
861 percent and is a 26 percentage point improvement from the same quarter one year ago bull The Employment Retention Rate of 856 percent exceeds the performance goal of 832
percent and shows a 25 percentage point improvement from the same quarter one year ago bull The Six Months Average Earnings result of $10855 exceeds the programrsquos performance
goal of $10501 and is $322 more when compared to the same reporting period one year ago
8
WORKFORCE SYSTEM RESULTS
100 $8000
80
60 $7000
40 $6000
20
0
n Entered Employment Rate n Employment Retention Rate n Six Month
Dec-13Sep-13Jun-13Mar-13 Dec-12Sep-12 $5000
s Average Earnings
Jun-14Mar-14
Senior Community Service Employment Program (SCSEP) httpwwwdoletagovseniors
Program Description Authorized by the Older Americans Act of 1965 the Senior Community Service Employment Program (SCSEP) is designed to foster individual economic self-sufficiency and promote useful opportunities in community service employment for unemployed low-income persons (particularly persons who have poor employment prospects) who are age 55 or older and to increase the number of persons who may benefit from unsubsidized employment in the public and private sectors
Quarter Highlights A former Vietnam Veteran Mr S and his wife returned to a small town in New Mexico to take care of his ailing parents During the next couple of years his parents passed away his wife died unexpectedly and he lost the family home Homeless Mr S did odd jobs in the community in exchange for necessities Eventually a member of his church gave him a room and told him about Goodwill Industries of Central New Mexicorsquos SCSEP program Goodwill placed Mr S in a training site at the local community center where he had already developed strong relationships with staff and guests The money he earned from SCSEP allowed him to move into an apartment Through the program Mr S developed confidence in his skills and abilities and with the help of Goodwillrsquos SCSEP staff he obtained a job at the local Goodwill store where he currently manages the donation site He says he loves his job and with his salary can afford a much better place to live Mr S continues to volunteer at the local community center by shopping for elderly in the community
Program Performance
Performance Measure Four Quarters
Ending 063013 Four Quarters
Ending 063014
Entered Employment Rate 425 452
Employment Retention Rate 744 731
Six Monthsrsquo Average Earnings $7163 $7446
Additional Program Year 2013 Quarterly Data
Performance Measure
Four Quarters
Ending 093013
Four Quarters
Ending 123113
Four Quarters
Ending 033114
Entered Employment Rate 427 428 433
Employment Retention Rate 722 712 702
Six Monthsrsquo Average Earnings $7329 $7437 $7378
Performance in the Past Eight Quarters
Analysis In Program Year 2013 67814 people were served by the program and 12 percent of those people were Veterans SCSEP participants recorded 35746097 hours of community service Six Monthsrsquo Average Earnings are higher than a year ago which is expected with a recovering economy Eighty-eight percent of participants were at or below poverty level Comparing Program Year 2013 with Program Year 2012
bull The Entered Employment Rate increased 27 percentage points from one year ago bull The Employment Retention Rate decreased 13 percentage points from one year ago bull Six Monthsrsquo Average Earnings increased almost four percentage points from one year ago
9
WORKFORCE SYSTEM RESULTS
100
80
60
40
20
0 Sep-12 Dec-12 Mar-13 Jun-13 Sep-13 Dec-13 Mar-14 Jun-14
n Entered Employment Rate n Employment Retention Rate n Six Months Average Earnings
$15000
$13000
$11000
$9000
$7000
$5000
Wagner-Peyser Employment Service httpwwwdoletagovProgramsWagner_Peysercfm
Program Description Wagner-Peyser Employment Service is an integral part of the American Job Center network formerly known as One-Stop Career Centers delivery system which provides universal access to workers job seekers and businesses The Employment Service focuses on providing a variety of employment related services including but not limited to job search assistance job referral and placement assistance for job seekers reshyemployment services to unemployment insurance claimants and recruitment services to employers with job openings Services are provided in one of three modes of delivery approaches self-service facilitated self-help service and staff-assisted service
Quarter Highlights When Mylan Pharmaceuticals Inc the third largest generic and pharmaceuticals company in the world needed to increase its production team at its Morgantown West Virginia location it was receiving over 100000 resumes and was overwhelmed with interested job seekers for openings to fill Plant Manufacturing Laborer positions With a starting pay of $1800 per hour the positions at Mylan are very attractive and turned to WorkForce (WF) West Virginia for labor exchange assistance beginning a success story of cooperation between private industry and a State agency WF West Virginia was able to help screen job seekers for Mylan and the plant hired 177 participants including 21 Veterans a higher representation than overall Veterans in the labor force (118 percent versus approximately seven percent)
Program Performance
Performance Measure Four Quarters
Ending 063013 Four Quarters
Ending 063014
Entered Employment Rate 530 560
Employment Retention Rate 810 820
Six Monthsrsquo Average Earnings $14252 $14515
Additional Program Year 2013 Quarterly Data
Performance Measure
Four Quarters
Ending 093013
Four Quarters
Ending 123113
Four Quarters
Ending 033114
Entered Employment Rate 530 530
Employment Retention Rate 810 810
Six Monthsrsquo Average Earnings $14129 $14175
Performance in the Past Eight Quarters
540
810
$14265
Analysis bull Over 16 million people received services from the Wagner-Peyser Employment Service
between July 1 2013 and June 30 2014 bull Over 11 million Veterans received services between July 1 2013 and June 30 2014 bull Nearly 35 million unemployed individuals entered employment after receiving services
from the Employment Service between July 1 2013 and June 30 2014
10
WORKFORCE SYSTEM RESULTS
100 $15000
80 $13000
60 $11000
40 $9000
20 $7000
0 Jun-12 Jun-13 Jun-14
$5000
n Entered Employment Rate n Employment Retention Rate n Six Months Average Earnings
Workforce Investment Act Adult Program httpwwwdoletagovprogramsgeneral_infocfm
Program Description The Workforce Investment Act (WIA) Adult Program helps prepare low-skill adult workers for good jobs through formula grants to States States use the funds to provide employment and training services through a network of American Job Centers of which there were nearly 2500 across the United States as of June 30 2014
WIA provides employment and training services at three broad service levels to job seeker customers core intensive and training These services are provided at a level which most efficiently meets their needs to achieve gainful employment The program is also designed to assist employer customers meet their needs for skilled workers
Adult Programs serve the broadest range of individuals including but not limited to public assistance recipients Unemployment Insurance claimants Veterans people with disabilities dislocated workers migrant and seasonal farmworkers Indian and Native Americans and workers age 55 or older
Quarter Highlights In Virginia the GoodwillWIA Adult program assists with the funding for Patient Care Technician (PCT) training provided by Fast Track Health The cost of training is approximately $3450 and the training is eleven weeks in duration This training provides a certificate in CNA EKG CPR and Phlebotomy with the certificationlicensing costs included in the overall training cost Ms O was referred to the WIA Adult program by a local Virginia Employment Commission representative She attended an orientation and started the process of changing her life that very day Ms O excelled and received a 100 percent increase in salary after completing training through this program with Fast Track Ms O stated of her experience ldquoI am very happy with my new career and very grateful for Goodwill and the WIA Adult program for providing [me] with this opportunity to enter a career with so much potential for advancementrdquo
Analysis bull In Program Year 2013 the WIA Adult program served 7184946 participants and over
150000 participants received training services bull Participants who received training services had a 761 percent Entered Employment
Rate in Program Year 2013 15 percentage points higher than the overall Entered Employment Rate of 611 percent
Program Performance
Performance Measure
Four Quarters
Ending 063012
(Program Year 2011)
Four Quarters
Ending 063013
(Program Year 2012)
Four Quarters
Ending 063014
(Program Year 2013)
Entered Employment Rate 572 599 611
Employment Retention Rate 808 819 828
Six Monthsrsquo Average Earnings $13482 $13335 $13842
Performance in the Past Three Program Years
11
WORKFORCE SYSTEM RESULTS
100 $19000
$1700080
$15000 60 $13000
$1100040 $9000
20 $7000
0 $5000 Jun-12 Jun-13 Jun-14
n Entered Employment Rate n Employment Retention Rate n Six Months Average Earnings
Workforce Investment Act Dislocated Worker Program httpwwwdoletagovprogramsgeneral_infocfm
Program Description The Workforce Investment Act Dislocated Worker Program funds services to support the reemployment of laid-off workers The Department of Labor allocates 80 percent of funds by formula to the States The Secretary of Labor may use the remaining 20 percent for National Emergency Grantsmdashthese specially targeted funds can infuse resources to areas suffering most from plant closings mass layoffs or job losses due to natural disasters or military base realignment and closures States allocate their Dislocated Worker funds to their local workforce investment areas Additionally the program allows for States to reserve up to 25 percent of their Dislocated Worker funds for Rapid Response activities Rapid Response is a pro-active business-focused and flexible strategy to help growing companies access an available pool of skilled workers and can respond to layoffs by quickly coordinating services and aid to companies and their workers
Program Performance
Performance Measure
Four Quarters
Ending 063012
(Program Year 2011)
Four Quarters
Ending 063013
(Program Year 2012)
Four Quarters
Ending 063014
(Program Year 2013)
Entered Employment Rate 611 600 600
Employment Retention Rate 842 843 838
Six Monthsrsquo Average Earnings $16500 $15930 $15997
Performance in the Past Three Program Years
Quarter Highlights After Kyle was laid off he was able to utilize an On-the-Job Training (OJT) opportunity with Tyson He now works the second shift from 1-9 pm and was able to obtain the technical training he felt he did not obtain from prior employment or education ldquoI wanted to get more experience on how things technically operate and this program is the perfect fit for merdquo Kyle said And in the end Tyson gained a skilled employee
Analysis bull The Dislocated Worker program served over 800000 participants in Program Year 2013
and provided training services to 109148 participants bull Participants who received training had an 814 percent Entered Employment Rate 214
percentage points higher than the overall Entered Employment Rate of 60 percent
12
WORKFORCE SYSTEM RESULTS
500 100
400 80
300 60
Days
200 40
100 20
0 0 Jun-13 Sep-13 Dec-13 Mar-14 Jun-14
n Average Number of Days to Resolve PERM Applications Not Subject to Integrity Review n Average Number of Days to Resolve PERM Applications Subject to Integrity Review (Audit) n Percent of H1-B Applications Processed within Seven Days of Filing
H-1B and Permanent Foreign Labor Certification (PERM) httpwwwforeignlaborcertdoletagov
Program Description Performance in the Past Five Quarters
H-1B certification permits employers to hire on a temporary basis foreign workers who possess qualifying professional or specialty skills The PERM program allows employers to begin the process for permanently hiring a foreign worker when there are not sufficient numbers of US workers who are able willing qualified and available to perform the job In addition the program ensures that the employment of the foreign worker does not adversely affect the wages and working conditions of American workers who are similarly employed
Program Performance
Performance Measure Four Quarters
Ending 063013 Four Quarters
Ending 063014
Percent of H-1B Applications Resolved in Seven Business Days
100 100
Quarter Highlights Average number of days to resolve PERM applications not subject to integrity review
129 194
The percent of employer applications processed within seven days of filing under the H-1B program sustains at approximately 100 percent ending in June 30 2014
Average number of days to resolve PERM applications subject to integrity review (Audit)
294 424 The Office of Foreign Labor Certification (OFLC) continues to allocate staff resources for the PERM program to increase program integrity by conducting more audit examinations and supervised recruitments This increased emphasis on program integrity has had an effect on processing timeliness
Additional Program Year 2013 Quarterly Data
Performance Measure
Four Quarters
Ending 093013
Four Quarters
Ending 123113
Four Quarters
Ending 033114
Analysis bull The number of H-1B applications processed within seven business days held steady
at 100 percent from the same four quarter reporting period one year ago Of the total 103032 H-1B applications processed over the past four quarters 103032 were completed within seven business days of the filing date
Percent of H-1B Applications Resolved in Seven Business Days
100 804 996 bull The average number of days to resolve PERM applications not subject to integrity review decreased by 20 percent compared to the previous quarter and the average number of days to resolve PERM applications subject to integrity review (Audits) decreased by four percent compared to the previous quarter
Average number of days to resolve PERM applications not subject to integrity review
178 237 234
Average number of days to resolve PERM applications subject to integrity review (Audit)
320 423 444
13
WORKFORCE SYSTEM RESULTS
100
80
60
40
20
0 Jun-13 Sep-13 Dec-13 Mar-14 Jun-14
n Percent of Accepted H-2A Applications Without Deficiencies Resolved by 30 Days Before the Date of Need n Percent of H-2B Applications Resolved Within 30 Days of Receipt
H-2A and H-2B Foreign Labor Certification Programs httpwwwforeignlaborcertdoletagov
Program Description H-2A labor certification permits employers to hire foreign workers on a temporary basis for the agricultural sector of the economy H-2B labor certification permits employers to hire foreign workers to come to the United States and perform temporary nonagricultural work which must be one-time seasonal peak load or intermittent in nature
Program Performance
Performance Measure Four Quarters
Ending 063013 Four Quarters
Ending 063014
Percent of Complete H-2A Employer Applications Resolved Within 30 Days Before the Date of Need
NA 97
Percent of H-2B Applications Resolved Within 30 Days
23 97
Additional Program Year 2013 Quarterly Data
Performance Measure
Four Quarters
Ending 093013
Four Quarters
Ending 123113
Four Quarters
Ending 033114
Percent of Complete H-2A Employer Applications Resolved Within 30 Days Before the Date of Need
NA NA 84
Percent of H-2B Applications Resolved Within 30 Days
98 92 99
The Percent of Complete H-2A Employer Applications Resolved Within 30 days Before the Date of Need measure was changed in the second quarter of Fiscal Year 2014
Performance in the Past Five Quarters
Quarter Highlights The Office of Foreign Labor Certification (OFLC) continues to resolve approximately 971 percent of complete H-2A applications on time The processing rates have improved in spite of an increase in the numbers of applications filed during this reporting period FY 2014 when compared to one year ago
Employer filings under the H-2B program have increased 167 percent this reporting period compared to the same four quarter reporting period one year ago
Analysis bull The percentage of H-2A applications resolved within 30 calendar days increased 125
percentage points from the previous quarter Of the 3845 total of H-2A applications processed in Fiscal Year 2014 908 percent were resolved within 30 calendar days of the filing date
bull The percentage of H-2B applications processed within 30 calendar days increased when compared with the same reporting period one year ago Of the 5188 H-2B applications processed within the last four quarters 998 percent of them were processed within 60 calendar days of the filing date
14
WORKFORCE SYSTEM RESULTS
100
80
60
40
20
0 Sep-12 Dec-12 Mar-13 Jun-13 Sep-13 Dec-13 Mar-14 Jun-14
$15000
$13000
$11000
$9000
$7000
$5000
n Entered EmploymentPlacement Rate n Employment Retention Rate n Six Months Average Earnings
Reintegration of Ex-Offenders (RExO-ADULT) httpwwwdoletagovRExOeta_defaultcfm
Program Description The Reintegration of Ex-Offenders ndash Adult Program (RExO-Adult) is an employment-centered program that seeks to strengthen urban communities that have large numbers of returning prisoners The program incorporates mentoring job training and other comprehensive transitional services It is designed to reduce recidivism by helping inmates find work when they return to their communities as part of an effort to improve community life
Quarter Highlights The Adult RExO Program operated three initiatives this program year
bull Grants to community and faith-based organizations to help returning offenders find employment
bull Grants aimed specifically at serving female offenders providing employment and supportive services
bull Grants to provide occupational training and job placement to offenders in Halfway Houses
Program Performance
Performance Measure Quarter Ending
063013
Quarter Ending
063014
Entered Employment Rate
58 58
Employment Retention Rate
68 72
Six Monthsrsquo Average Earnings
$9797 $9770
The data for June 30 2013 are program-to-date since the inception of the program in the Spring of 2006 The June 30 2014 numbers are program-to-date for currently operating projects
Additional Program Year 2013 Quarterly Data
Performance Measure Quarter Ending
093013
Quarter Ending
123113
Quarter Ending
033114
Entered Employment Rate
55 56
Employment Retention Rate
66 68 70
Six Monthsrsquo Average Earnings
$10036 $9962 $9736
Performance in the Past Eight Quarters
58
Analysis The Adult RExO Program served 6308 participants this program year
bull Adult RExO Grantees reported 3404 enrollees receiving training or education bull Adult RExO Grantees reported 2555 enrollees receiving a certificate bull The recidivism rate largely reflects the extent to which the program is serving persons
at high or low risk of re-offending
15
WORKFORCE SYSTEM RESULTS
Registered Apprenticeship httpwwwdoletagovoa
Program Description Registered Apprenticeship is a leader in preparing American workers to compete in a global 21st Century economy With a network of over 150000 employers in more than 1000 occupations Registered Apprenticeship has already trained millions of Americarsquos workers Modern apprenticeships are now on the cutting edge of innovation in preparing a skilled workforce for todayrsquos industries including expanding industries like health care information technology transportation telecommunications and advanced manufacturing as well as in industries like construction where apprenticeships have a long and successful history
Quarter Highlights During the summer of 2014 the White House hosted the first-ever Summit on Apprenticeship to gather the best ideas and to catalyze action to dramatically increase apprenticeship in America More than 60 attendees presented their ideas including leading employers big and small like IBM Bank of America Blue CrossBlue Shield and Oberg Industries labor unions like the International Brotherhood of Electrical Workers (IBEW) training providers like Ivy Tech and Lone Star Community Colleges and local workforce leaders The event was the apex in a series of industry roundtables on apprenticeship which took place across the country during June amp July 2014
Program Performance
Performance Measure Four Quarters
Ending 063013 Four Quarters
Ending 063014
Entered Employment Rate 734 742
Employment Retention Rate 873 878
Six Monthsrsquo Average Earnings $23826 $24387
Performance Measure Quarter Ending
063013 Quarter Ending
063014
Apprentices
Total Apprentices (Active Apprentices)
148039 152582
New Apprentices 17432 17011
Programs
New Programs 139
Programs Maintained Total (Active Programs)
9809 9077
Number of new programs in Construction and Manufacturing
93
Source Registered Apprenticeship Partners Information Management Data System (RAPIDS) data managed by Department of Labor staff only 063013 data has been revised to include federal data only Running total of active apprenticesprograms during the quarter
16
177
127
WORKFORCE SYSTEM RESULTS
0
20
40
60
80
100
Sep-12 Dec-12 Mar-13 Jun-13 Sep-13 Dec-13 Mar-14 Jun-14 $5000 $7000 $9000 $11000 $13000 $15000 $17000 $19000 $21000 $23000 $25000
n Entered Employment Rate n Employment Retention Rate n Six Months Average Earnings
Registered Apprenticeship httpwwwdoletagovoa
Additional Program Year 2013 Quarterly Data
Performance Measure
Four Quarters
Ending 093013
Four Quarters
Ending 123113
Four Quarters
Ending 033114
Entered Employment Rate 735 738 738
Employment Retention Rate 874 877 878
Six Monthsrsquo Average Earnings $24171 $24324 $24378
Performance in the Past Eight Quarters
Analysis bull During the third quarter of Fiscal Year 2014 there were over 394000 active apprentices
nationwide while over 13000 program participants completed their apprenticeship and received a credential that is portable industry recognized and can provide a pathway to middle-class and sustainable careers
bull The Entered Employment Rate for participants who completed their Registered Apprenticeship program was 856 percent 114 percentage points higher than for all program exiters who either completed or cancelled (742 percent as shown in table on the previous page)
bull The Employment Retention Rate for program completers was 910 percent 32 percentage points higher than for all program exiters (878 percent as shown in table on the previous page)
bull The Six Monthsrsquo Average Earnings for program completers was $29964 which is over $5577 more than that of all program exiters (ie completers or those who cancelled) The results for those completing the program shows it pays to stay
17
WORKFORCE SYSTEM RESULTS
100
80
60
40
20
0 Sep-12 Dec-12 Mar-13 June-13 Sep-13 Dec-13 Mar-14 Jun-14
n Entered Employment Rate n Employment Retention Rate n Six Months Average Earnings
$25000
$21000
$17000
$13000
$9000
$5000
Trade Adjustment Assistance (TAA) httpwwwdoletagovtradeact
Program Description The Trade Adjustment Assistance (TAA) Program is an integral part of the comprehensive workforce development system The program is essential to helping workers dislocated by foreign trade to adjust to changing market conditions and shifting skill requirements Addressing the needs of trade-affected workers involved in this transformation is a unique challenge because in general these workers are being dislocated from relatively outdated-skill high-wage employment In many cases this is complicated by mass layoffs or plant closures that occur in single-industry towns which makes finding comparable employment in the same geographic area difficult Furthermore many of these jobs are lost permanently from the domestic economy requiring affected workers to completely retool their skills
Fiscal Year Highlights During Fiscal Year 2014 Massachusetts diligently trained staff at the local CareerOneStop Centers to ascertain a TAA participantrsquos eligibility for other funding resources to assist in their reemployment initiatives These improved efforts to provide and report reemployment services enables Trade customers to flow through the CareerOneStop Center system with other dislocated workers and receive seamless resources through the resource sharing initiatives of the Career Center methodology These streamlined reemployment services have resulted in an Entered Employment Rate of 815 percent nearly ten percentage points higher than the national average
Program Performance
Performance Measure FY 2011 FY 2012 FY 2013 FY 2014
Entered Employment Rate 653 689 716 729
Employment Retention Rate 897 913 917 911
Six Monthsrsquo Average Earnings $18319 $18837 $18099 $17828
Performance Measure Quarter Ending 063013 Quarter Ending 063014
Entered Employment Rate 733 728
Employment Retention Rate 900 927
Six Monthsrsquo Average Earnings $18210 $17692
Additional Program Year 2013 Quarterly Data
Performance Measure Quarter Ending
093013
Quarter Ending
123013
Quarter Ending
033014
Entered Employment Rate 713 713
Employment Retention Rate 918 918
Six Monthsrsquo Average Earnings $17499 $17499
Performance in the Past Eight Quarters
727
917
$17550
Analysis During Fiscal Year 2014 there were 62706 total participants receiving TAA benefits or services and 20577 exiters entered employment (729 percent) More than one-third of all participants were minorities with the average age of participants being 47 years and the average tenure being approximately 13 years 9547 exiter participants received credentials or 83 percent of all exiter participants who completed training 32527 participants received training or approximately 52 percent of all participants Lastly the program served 4828 Veteran participants accounting for approximately eight percent of all participants
18
WORKFORCE SYSTEM RESULTS
Unemployment Insurance (UI) httpouidoletagovunemploy
Program Description The federal-state Unemployment Insurance (UI) System minimizes individual and family financial hardship due to unemployment and stabilizes the economy during economic downturns by providing unemployed workers with temporary income support States operate their own Unemployment Insurance Programs regulated by State laws
As the Federal partner DOL provides program leadership allocates administrative funds provides technical assistance and exercises performance oversight
Quarter Highlights As the economy improved the system emphasized program integrity solvency and reemployment Claims rates decreased about 10 percent from the year before and Trust Fund loans decreased from $21 billion to $14 billion EUC benefit payments ceased on December 28 2013 Twenty-four states implemented Short-term Compensation programs allowing unemployed workers to stay on jobs while receiving partial unemployment benefits proportionate to reduced work hours States implemented systems to improve efficiency and reduce overpayments such as data exchange and recover UI overpayments By June 30 2014 42 states were recovering overpayments through Federal Income tax refund offset (TOP) and had recovered $370 million in 2014 (over $840 million since TOPrsquos inception)
Analysis During the year ending June 30 2014
bull 51 million UI claimants were reemployed in the quarter following their UI 1st payments (17 million in the last quarter)
bull The UI system met two and failed two of its four targets UI met detection of overpayments (643 percent vs target of 542 percent) and met reemployment (657 percent vs target of 647 percent)
bull The system fell short of its 1st pay and status targets because of retirements and other turnover of key staff
Program Performance
Performance Measure Four Quarters
Ending 063013 Four Quarters
Ending 063014
Percent of Intrastate Payments Made Timely
812 792
Detection of Recoverable Overpayments Rate
598 643
Facilitation of Reemployment Rate 6261 6552
Percent of Employer Tax Liability 888 882
Operational Results
Recipiency Rate 263 272
Exhaustion Rate 456 431
Percent of Recipients of Prime Working Age (25-54)
702 700
Percent of Recipients Who Are Female
434 437
New Initial Unemployment Insurance Claims
13906868 12501014
Number of First Unemployment Insurance Payments
8404507 7632522
Average Duration of Unemployment Insurance (Weeks)
169
1 Reemployment for year ending June 30 2013 2 Reemployment for year ending June 30 2014
19
167
WORKFORCE SYSTEM RESULTS
Unemployment Insurance (UI) httpouidoletagovunemploy
Additional Program Year 2013 Quarterly Data
Performance Measure Four Quarters
Ending 093013 Four Quarters
Ending 123113 Four Quarters
Ending 033114
Percent of Intrastate Payments Made Timely
809 802 793
Detection of Recoverable Overpayments Rate
590 630 603
Facilitation of Reemployment Rate 6311 6312 6363
Percent of Employer Tax Liability 886 885 884
Operational Results
Recipiency Rate 263 262 267
Exhaustion Rate 453 446 437
Percent of Recipients of Prime Working Age (25-54)
702 702 701
Percent of Recipients Who Are Female
434 434 435
New Initial Unemployment Insurance Claims
13559233 13340263 12947493
Number of First Unemployment Insurance Payments
8215687 7967852 7857395
Average Duration of Unemployment Insurance (Weeks)
169 169 168
1 Reemployment for year ending September 30 2013 2 Reemployment for year ending December 31 2013 3 Reemployment for year ending March 31 2014
20
WORKFORCE SYSTEM RESULTS
100
80
60
40
20
0 Sep-12 Dec-12 Mar-13 Jun-13 Sep-13 Dec-13 Mar-14 Jun-14
n Placement in Employment or Education n Attainment of a Degree or Certificate n LiteracyNumeracy Gains
Job Corps httpwwwjobcorpsgovhomeaspx
Program Description Job Corps is the nationrsquos largest residential educational and career technical training program for at-risk youth ages 16 through 24 The 125 Job Corps centers nationwide provide an integrated comprehensive array of services that include academic career technical and life skills training career planning and work-based learning health care and post-program placement and transition support
Job Corps is committed to offering all students a safe drug-free environment where they can take advantage of the resources provided Job Corpsrsquo mission is to attract eligible young people teach them the skills they need to become employable and independent and place them in meaningful jobs or further education
Program Performance
Performance Measure Four Quarters
Ending 063013 Four Quarters
Ending 063014
Placement in Employment or Education 746 767
Attainment of a Degree or Certificate 706 668
LiteracyNumeracy Gains 692 661
Additional Program Year 2013 Quarterly Data
Performance Measure
Four Quarters
Ending 093013
Four Quarters
Ending 123113
Four Quarters
Ending 033114
Placement in Employment or Education 757 760 765
Attainment of a Degree or Certificate 722 727 707
LiteracyNumeracy Gains 702 709 695
Performance in the Past Eight Quarters
The Performance in the Past Eight Quarters graph displays single quarter data versus the Program Performance tables which depict cumulative four quarter data
Quarter Highlights In May 2014 four Job Corps students from centers in Montana California Iowa and Virginia participated in the 2nd Asia-Pacific Economic Cooperation (APEC) Youth Skills Camp in Beijing and Guangzhou China the second time Job Corps students have participated in this event The camp included field visits to vocational training schools business enterprises and public practical training facilities as well as skills exchanges This international event provides students with life-changing experiences in travel diversity and first-hand exposure to global issues
Analysis bull During the current quarter Job Corps served 69979 participants including 13079 new
enrollees an increase of 801 percent overall compared to the same quarter in PY 2013 and due to the resumption of new enrollments after the PY 2012 enrollment suspensions The number of new students increased by over 200 percent from the same quarter in PY 2013
bull The proportion of 16-17 year olds served increased by 45 percentage points Conversely the proportion of all older students served similarly decreased from the same quarter in PY 2013
bull In the current quarter Job Corps placed 7203 students in Employment and Education a slight decrease of 04 percentage points compared to the same quarter last year In addition 8657 students attained a Certificate a 131 percentage point decrease compared to the same quarter in PY 2013 Also 6789 students attained a LiteracyNumeracy gain an 116 percentage point decrease over the same quarter in PY 2013
bull In the current quarter the program served 50 participants who were Veterans prior to enrollment bull When comparing the four quarter data Placement in Employment or Education increased
21 percentage points Attainment of a Degree or Certificate decreased 38 percentage points and LiteracyNumeracy Gains decreased 31 percentage points from the same quarter one year ago 21
WORKFORCE SYSTEM RESULTS
100
80
60
40
20
0 Sep-12 Dec-12 Mar-13 Jun-13 Sep-13 Dec-13 Mar-14 Jun-14
n Placement Rate for Out-of-School Youth Ages 18 and Above n Recidivism Rate for Youth Ages 14 to 17 n Recidivism Rate for Youth Ages 18 and Above
Workforce Investment Act Youthful Offender Initiative httpwwwdoletagovYouth_servicesyouthful_offendercfm
Program Description The Employment and Training Administration uses its Youthful Offender Appropriation to fund a variety of projects that target youth offenders and young adult offenders Currently operating projects include grants to community-based organizations to involve juvenile offenders in training and service learning projects grants to intermediary organizations to serve young offenders in high-poverty high-crime communities and grants to help youth enter diversion programs as an alternative to out-of-home placements and to assist eligible youth have their juvenile records sealed or expunged
Quarter Highlights The great majority of juvenile offenders are of ages 17 and below and many are still in high school The youth offender grants focus on helping younger youth stay in school and complete their education and helping older youth find jobs and succeed in the labor market Case management mentoring and supportive services are also provided by these grants
Performance in the Past Eight Quarters
Program Performance
Performance Measure Four Quarters
Ending 063013 Four Quarters
Ending 063014
Placement Rate for Youth Ages 18 and Above
36 362
Recidivism Rate for Youth Ages 14 to 17
35 24
Recidivism Rate for Youth Ages 18 and Above
34 16
Results are cumulative for currently operating grants
Additional Program Year 2013 Quarterly Data
Placement Rate for Youth Ages 18 and Above
277 334 325
Performance Measure
Four Quarters
Ending 093013
Four Quarters
Ending 123113
Four Quarters
Ending 033114
Recidivism Rate for Youth Ages 14 to 17
349 349 349
Recidivism Rate for Youth Ages 18 and Above
335 335 335
Analysis bull Providing opportunities to youthful offenders results in varying outcomes depending on
the mix of projects being operated in a given year bull Projects have markedly different placement and recidivism rates depending on whether
they are serving young adults in their 20s or youth ages 16-17 they recruit youth in the community or through direct referrals from the juvenile justice system whether they are located in small or large cities and the extent to which enrollees are at high or low risk of re-offending
22
WORKFORCE SYSTEM RESULTS
100
80
60
40
20
0 Jun-12 Jun-13 Jun-14
n Placement in Employment or Education n Attainment of a Degree or Certificate n LiteracyNumeracy Gains
Workforce Investment Act Youth Program httpwwwdoletagovyouth_services
Program Description The Workforce Investment Act Youth Formula Program provides employment and education services to eligible low-income youth ages 14 to 21 who face barriers to employment The program serves in-school and out-of-school youth youth with disabilities and low literacy rates as well as others who may require additional assistance to complete an educational program and acquire an industry-recognized credential or enter employment
Quarter Highlights The passage of the Workforce Innovation and Opportunity Act (WIOA) includes a major shift in focus to spending more funds on and serving more out-of-school youth (OSY) The workforce system demonstrated its readiness for this shift in that 48 percent of all youth served in PY 2013 were OSY and 57 percent of all WIA youth local area funds were spent on OSY So far in Program Year 2013 California has spent almost 65 percent of their WIA youth funds on OSY with high levels of OSY expenditures in both urban and rural areas 53 percent of all youth served in CA in Program Year 2013 were OSY For example Los Angeles City spent 80 percent of their funds on OSY and the Northern Rural Training and Employment Consortium spent 76 percent of their funds on OSY Both local areas have achieved these levels through strong partnerships with organizations that serve OSY as well as access to high quality work experiences
Program Performance
Performance Measure
Four Quarters
Ending 063012
(Program Year 2011)
Four Quarters
Ending 063013
(Program Year 2012)
Four Quarters
Ending 063014
(Program Year 2013)
Placement in Employment or Education 589 666 690
Attainment of a Degree or Certificate 648 675 684
LiteracyNumeracy Gains 476 509 525
Performance in the Past Three Program Years
Analysis bull 197045 participants were served in the cumulative four quarter reporting period compared
to 217244 served during the same time period last year This decrease is due primarily to a lower funding level compared to the previous year
bull Placement in Employment or Education achieved a result of 690 percent a 24 percentage point increase when compared with the same time period last year
bull The program achieved a result of 684 percent for the Attainment of a Degree or Certificate measure This is a 09 percentage point increase from the same time period last year
bull The LiteracyNumeracy Gains measure achieved a result of 525 percent an increase of 16 percentage points when compared with the same time period last year
bull All three youth common measures exceeded Program Year 2013 GPRA goals
23
WORKFORCE SYSTEM RESULTS
100
80
60
40
20
0 Sep-12 Dec-12 Mar-13 Jun-13 Sep-13 Dec-13 Mar-14 Jun-14
n Placement in Employment or Education n Attainment of a Degree or Certificate n LiteracyNumeracy Gains
YouthBuild httpwwwdoletagovyouth_servicesyouthbuildcfm
Program Description YouthBuild provides job training and educational opportunities for at-risk youth ages 16 to 24 while constructing or rehabilitating affordable housing for low-income or homeless families in their own neighborhoods The youth split their time between the construction site and the classroom where they earn their high school diploma or equivalency learn to be community leaders and prepare for college and other post-secondary training opportunities
Analysis bull 33392 participants have been enrolled into the YouthBuild program since 2007 and 29553
have exited so far bull Since the program began a total of 11716 participants have received a high school
diploma or equivalency 17572 have attained an industry-recognized certificate and 21835 have been placed into initial jobs post-secondary education andor long-term vocational occupational skills training including apprenticeship
bull The Class of 20102011 performance steadily increased The outcomes for all three measures were above those for the Class of 2009 and significantly above the GPRA goals
bull YouthBuild is currently meeting or exceeding the GPRA goal for all three measures The additional quarter of service for 20102011 grants provided additional positive outcomes as expected As the 2012 grant class progresses it is expected that this trend will continue
Program Performance
Quarter Highlights Just A Start in Cambridge (MA) has been a YouthBuild grantee since 2010 In the fourth quarter of the Program Year 2013 they shared the following success story
Victor earned a High School Diploma and HBIPACT construction certification He was accepted to Endicott College in MA He also secured a full time painting position with George Souza Painting making $25 per hour He continues to develop his career plan with staff
Class of 20102011 Performance in the Past Eight Quarters
Performance Measure GPRA Results for Class
0f 20102011 Results for Class 2012 Overall Results
Percent of Participants Entering Employment or Enrolling in Postsecondary Education the Military or Advanced Training Occupational Skills Training in the First Quarter After Exit
500 612 586 519
Percent of Youth Who Attain a Diploma GED or Certificate by the End of the Third Quarter after Exit
672 770 609 672
Percent of Participants Deficient in Basic Skills Who Achieve Literacy or Numeracy Gains of One Adult Basic Education Level
585 676 549 595
24
WORKFORCE SYSTEM RESULTS
100
80
60
40
20
0 Sep-12 Dec-12 Mar-13 Jun-13 Sep-13 Dec-13 Mar-14 Jun-14
n Attainment of a High School Diploma GED or improvement of basic skills by at least two grade levels or completed Occupational Skills training n Participants who Attained Two or more Goals
Indian and Native American Youth Program httpwwwdoletagovdinap
Program Description The Indian and Native American Supplemental Youth Services Program provides summer and year-round employment and training activities for Indian Alaska Native and Native Hawaiian individuals between the ages of 14 and 21 Program resources are targeted to at-risk and the neediest youth who face substantial barriers to education and employment success This population includes high school dropouts and youth who are basic-skills deficient
Quarter Highlights Youth summer employment is a high priority for Native American Tribes However most rural reservation areas do not have enough employers to put youth to work during the summer As a result Tribes rely on the annual WIA Section 166 funding to place youth in summer employment where they can earn a wage and receive valuable work experience
Over the past four quarter period 2487 of the 4399 youth that participated in the youth program were placed in summer employment Youth participants come from low income families with little or no opportunity to earn money during the summer months Through the Indian and Native American Youth Program these youth are given an opportunity to work and earn money during the summer which helps them contribute to their familyrsquos income
Performance in the Past Eight Quarters
Program Performance
Performance Measure Four Quarters
Ending 063013 Four Quarters
Ending 063014
Educational Attainment for Dropouts 180 220
Attainment of Two or More Goals 920 927
The data reported reflect the period from April 1 2012 through March 31 2013 The data reported reflect the period from April 1 2013 through March 31 2014
Additional Program Year 2013 Quarterly Data
Performance Measure Four Quarters
Ending 093013 Four Quarters
Ending 123113 Four Quarters
Ending 033114
Educational Attainment for Dropouts
250 250 220
Attainment of Two or More Goals
930 930 927
The data reported reflect the period from April 1 2013 through September 30 2013 The data reported reflect the period from April 1 2013 through March 31 2014
Analysis bull The Attainment of Two or More Goals rate increased slightly from 92 percent in June 2013
to 927 percent in June 2014 bull The Indian and Native American Youth Program served 4310 youth during the period July
1 2013 through June 30 2014 This is a 164 percentage point decrease in youth served one year ago
bull The Education Attainment for Dropouts increased from 18 percent in June 2013 to 22 percent in June 2014
25
WORKFORCE SYSTEM RESULTS
Green Jobs Innovation Fund Grants (GJIF) httpwwwdoletagovBRGGreenJobs
Program Description The Green Jobs Innovation Fund (GJIF) was authorized as a Pilot and Demonstration Project under the Workforce Investment Act (WIA) of 1998 to help workers receive job training in green industry sectors and occupations as well as access green career pathways GJIF is seeking to increase the number of individuals completing training programs who receive industry-recognized credentials and to increase the number of individuals completing training programs for employment in green jobs
With these grants the Department is emphasizing two key workforce programs that move participants along green career pathways by 1) forging linkages between Registered Apprenticeship and pre-apprenticeship programs andor 2) integrating the delivery of technical and basic skills training through community-based partnerships The grantees are building on existing programs that are already established and serving workers and moving workers into and along green career pathways The Green Jobs Innovation Fund (GJIF) grants are all anticipated to end by June 30 2015
Quarter Highlights The Jobs for the Future (JFF) GreenWays grant program made great progress toward their goal of increasing access for women to enter higher-paying non-traditional occupations Women currently comprise 254 of the programs total enrollment and are earning higher placement wages overall than men At the same time their completion rates credential attainment rates and job placement rates lag behind those of men reflecting the ongoing challenges that women experience in non-traditional occupations The JFF GreenWays program continues to focus on raising the visibility of this issue as a key element in regional approaches to addressing poverty in female-headed households
Program Performance
Performance Measure Cumulative
Four Quarters Ending 063013
Cumulative Four Quarters
Ending 063014
Entered Employment Rate 569 642
Employment Retention Rate 750 821
Six Monthsrsquo Average Earnings $16249 $17459
Additional Program Year 2013 Quarterly Data
Performance Measure
Cumulative Four
Quarters Ending
093013
Cumulative Four
Quarters Ending
123113
Cumulative Four
Quarters Ending
033114
Entered Employment Rate 560 626 641
Employment Retention Rate 790 795 785
Six Monthsrsquo Average Earnings $16406 $15228 $15039
Cumulative Credential Outcomes in the Past Three Quarters
Performance Measure Quarter Ending
123113
Quarter Ending
033114
Quarter Ending
063014
Number Completed Education Job Training Activities
5521 6438 7076
Number Completed Training and Received Credential
5343 6242 6849
Attainment Rate 97 97 97
Analysis As of June 30 2014 8360 participants were enrolled in educationtraining Of these participants 600 participated in Registered Apprenticeship 874 participated in Pre-Apprenticeship and 40 participated in On-the-Job Training A total of 7076 participants completed educationtraining A total of 6849 participants received a credential Lastly a total of 4870 participants entered employment and of these participants 4343 entered training-related employment
26
WORKFORCE SYSTEM RESULTS
Dec-13 Mar-14 Jun-14
100 $27000
$2600080
$2500060
$24000 40
$23000
20 $22000
0 $21000
n Entered Employment Rate n Employment Retention Rate n Six Months Average Earnings
H-1B Jobs and Innovation Accelerator Challenge Grants httpwwwdoletagovETA_News_Releases20111398cfm
Program Description The Jobs and Innovation Accelerator Challenge (Jobs Accelerator) is designed to help regions achieve the demonstrated benefits of collaborative cluster-based regional development This initiative represents the implementation of Administration policy priorities to accelerate bottom-up innovation in urban and rural regions as opposed to imposing ldquoone-size-fits-allrdquo solutions The Jobs Accelerator also meets Administration goals for smarter use of government resources through reduction of Federal silos and promotion of coordinated Federal funding opportunities that offer more efficient access to Federal resources Investments from Federal agencies for the Jobs Accelerator projects include The US Department of Laborrsquos Employment and Training Administration (DOL-ETA) the US Department of Commercersquos Economic Development Administration (DOC-EDA) and the National Institutes of Standards and Technologyrsquos Hollings Manufacturing Extension Partnership (NIST-MEP) the Small Business Administration (SBA) the Department of Energy Advanced Manufacturing Office (DOE AMO) and the Delta Regional Authority (DRA)
The objectives of the Jobs Accelerator are to
bull Accelerate the formation of new high-growth businesses and expansion of existing businesses
bull Accelerate the creation of higher-wage jobs bull Advance commercialization of research including Federally-funded research bull Support deployment of new processes new technologies and new products to grow sales
and generate employment bull Enhance the capacity of small businesses in the cluster including small and disadvantaged
businesses bull Increase exports and business interaction with international buyers and suppliers bull Develop the skilled workforce needed to support growing clusters and bull Ensure diverse workforce participation in clusters through outreach training and the
creation of career pathways
Quarter Highlights The Northeast Ohio Speed-To-Market Accelerator (STMA) program administered by Lorain County Community College aims to accelerate the speed-to-market for near production or pilot production prototypes stimulate job creation and increase the global competitiveness of cluster companies attract private capital and attract students incumbent workers and the unemployed
This quarter STMA helped accelerate the introduction of a new dry electrode product for heart monitoring This sensor and electronics will be introduced as part of the next generation of wearable human performance arm band from Pittsburgh based Body Media a subsidiary of Jawbone Further STMA continues to bring new companies into the STMA
program through cluster outreach activities and this quarter three new leads were generated as the result of the existing STMA partners MAGNET JumpStart Lorain County Community College and NorTech
Program Performance
Performance Measure Four Quarters
Ending 123113 Four Quarters
Ending 033114 Four Quarters
Ending 063014
Entered Employment Rate 307 283 359
Employment Retention Rate 907 925 927
Six Monthsrsquo Average Earnings $23310 $22953 $26682
Performance in the Past Three Quarters
Analysis A total of 3702 individuals were served 3632 individuals began educationjob training activities and 2052 individuals completed educationjob training services Of participants completing educationjob training 370 unemployed individuals completed training and entered employment and of these 114 individuals entered training-related employment A total of 204 employed individuals completed training and retained their current position and of these 85 employed individuals completed training and advanced into a new position A total of 2006 individuals completed educationtraining activities and received credentials and of these 2273 total credentials were awarded
This data represents three rounds of the for Jobs Accelerator initiative which includes the Jobs Accelerator Round 1 the Advanced Manufacturing Jobs Accelerator Round 2 and the Make it in America (MIIA) Jobs Accelerator grants program
27
WORKFORCE SYSTEM RESULTS
100 $56000
80 $54000
$52000 60 $50000
40 $48000
$46000 20
$44000
0 $42000 Dec-13 Mar-14 Jun-14
n Entered Employment Rate n Employment Retention Rate n Six Months Average Earnings
H-1B Technical Skills Training Grants httpwwwdoletagovbusinessH1B_Tech_Skillscfm
Program Description The H-1B Technical Skills Training (TST) Grants were authorized by the American Competitiveness and Workforce Improvement Act of 1998 (ACWIA) as amended (29 USC 2916a) to provide education training and job placement assistance in the occupations and industries for which employers are using H-1B visas to hire highly-skilled foreign workers on a temporary basis and the related activities necessary to support such training The H-1B TST Grant Program is intended to raise the technical skill levels of American workers so they can obtain or upgrade employment in high-growth industries and occupations Over time these education and training programs will help businesses reduce their use of skilled foreign professionals permitted to work in the US on a temporary basis under the H-1B visa program The grants represent significant investments in sectors such as information technology advanced manufacturing and health care In addition these grants will focus on serving participants who have been identified as long-term unemployed particularly those who have been unemployed the longest These grants also have an emphasis on providing on-the-job training allowing participants to learn new skills while earning a pay check To date ETA has announced two rounds of TST grants totaling $342 million The first round was announced on October 4 2011 and the second round was announced on February 22 2012
Quarter Highlights The Los Angeles HealthWorks On-the-Job training (OJT) initiative administered by Managed Career Solutions Inc (MCS) provides individuals with training that leads to industry recognized credentials and employment opportunities within the regionrsquos healthcare field MCS maintains several strong partnerships to coordinate outreach recruitment training OJT placements and employment opportunities As of June 30 2014 MCS served nearly 800 long-term unemployed participants and overall 1100 participants In the same period over 650 individuals completed training and earned an industry recognized credential Of those completers 128 were employed at participation however the majority were underemployed and gained the necessary job skills and credentials that allowed 80 percent to advance into a new position In recognition MCS received the Malcom Baldrige and State Eureka awards
Analysis bull 52532 individuals were served and 51071 individuals began educationjob training
activities bull 15185 individuals completed educationjob training activities including 3321 unemployed
individuals who completed training and entered employment bull Of these 2925 individuals entered training-related employment 2902 employed individuals
completed training and retained their current position 1452 employed individuals completed training and advanced into a new position
bull 11944 individuals completed educationjob training activities and received credentials with 14099 total credentials awarded
Program Performance
Performance Measure
Four Quarters
Ending 123113
Four Quarters
Ending 033114
Four Quarters
Ending 063014
Entered Employment Rate 778 725 675
Employment Retention Rate 993 944 926
Six Monthsrsquo Average Earnings $54683 $50833 $46245
Since the H-1B TST program provides training to incumbent unemployed and long-term unemployed workers to prepare them for jobs in a variety H-1B industries andor occupations the Entered Employment Rate and Six Monthsrsquo Average Earnings can vary For the quarter ending on June 30 2014 the H-1B TST program saw a decline in the Entered Employment Rate and Six Monthsrsquo Average Earnings in comparison with the results for the previous rolling four quarters Previous results reflected a large number of incumbent workers who enrolled in short-term high-skilled training and exited early leading to a relatively high Six Monthsrsquo Average Earnings As the projects progress unemployed and long-term unemployed workers who required longer-term training begin to exit the program and search for jobs Ultimately as they enter employment wages may be less than those achieved by the higher-skilled incumbent workers who either retain or advance in their positions after training
Performance in the Past Three Quarters
28
WORKFORCE SYSTEM RESULTS
100 $21000
$19000 80
$17000
$1500060 $13000
40 $11000
$900020
$7000
0 $5000Sep-12 Dec-12 Mar-13 Jun-13 Sep-13 Dec-13 Mar-14 Jun-14
n Entered Employment Rate n Employment Retention Rate n Six Months Average Earnings
Community-Based Job Training Grants (CBJT) httpwwwdoletagovbusinessCommunity-BasedJobTrainingGrantscfm
Program Description Community-Based Job Training Grants (CBJT) seek to strengthen the role of community colleges in promoting the United States workforcersquos competitiveness The program does this by building the capacity of community colleges to train workers in skills required to succeed in regionally based high-growth high-demand industries and occupations Important grant activities include training in the healthcare biotech advanced manufacturing energy automotive transportation construction insurance forestry and aerospace industries The first round of CBJT grants were awarded in October 2005 To date ETA has announced five rounds of CBJT grants awarding 320 grants to community colleges and other organizations All CBJT grants ended as of June 30 2014
Quarter Highlights The 14 remaining projects active in this quarter represent the culmination of another successful DOL initiative Some of the significant accomplishments include the development and sustainability of Roane State Community Collegersquos Lean Manufacturing program designed to meet the needs of local manufacturing employers the San Jacinto Community College Districtrsquos Gulf Coast Healthcare Partners project which developed training to support healthcare career and Central Arizona Collegersquos Pinal County Alternative Energy Project More than half of the CBJT participants who began education and training activities completed their programs 79 percent of them received an industry recognized credential ie certificate or degree Eighty-four percent of the participants who gained employment entered into new training-related positions
Program Performance
Performance Measure Four Quarters
Ending 063013 Four Quarters
Ending 063014
Entered Employment Rate 572 662
Employment Retention Rate 891 899
Six Monthsrsquo Average Earnings $18675 $17027
Additional Program Year 2013 Quarterly Data
Performance Measure
Four Quarters
Ending 093013
Four Quarters
Ending 123113
Four Quarters
Ending 033114
Entered Employment Rate 57 605 655
Employment Retention Rate 891 897 891
Six Monthsrsquo Average Earnings $18675 $18285 $16642
Performance in the Past Eight Quarters
Analysis bull 268359 individuals have been served through the initiative bull 258216 individuals began educationjob training activities bull 165264 individuals completed educationjob training activities Of these
bull 131107 individuals received credentials bull 65089 individuals entered new positions of employment and 54344 individuals entered new
positions of training-related employment
Note All data are cumulative Prior to new reporting requirements implemented in the quarter ending December 31 2011 grantees only reported results for individuals that entered employment and individuals that entered training-related employment (noted above) if those participants entered employment and completed training in the same quarter As a result prior to that quarter participants that entered employment in quarters after they completed training were captured in the Common Measures and the total number of individuals that ultimately entered employment and training-related employment are actually higher than the results above indicate
29
WORKFORCE SYSTEM RESULTS
100 92
7880
5760
40
20
0
n Percent of Target Number of Programs Launched by Round
Round 1 Round 2 Round 3
Trade Adjustment Assistance Community College and Career Training (TAACCCT) Grants httpwwwdoletagovtaaccct
Program Description The Trade Adjustment Assistance Community College and Career Training (TAACCCT) Grant Program is authorized by the Trade Act of 1974 under Chapter 4 of Title II The purpose of this grant program is to provide eligible institutions of higher education with funds to expand and improve their ability to deliver education and career training programs that can be completed in two years or less and that result in skills degrees and credentials that prepare program participants for employment in high-wage high-skill occupations and are suited for workers who are eligible for training under the Trade Adjustment Assistance (TAA) for Workers program under Chapter 2 of Title II of the Trade Act The TAACCCT Grant Program is funded under the Health Care and Education Reconciliation Act of 2010 which appropriated $500 million for the program for each of Fiscal Years 2011-2014 for a total of $2 billion
Round 1 ndash FY 2011 Grants On June 30 2014 grants awarded in Round 1 (FY 2011) had completed all but one quarter of their periods of performance By the end of their final year of the grant the forty-nine (49) Round 1 grantees project that they will offer a total of 906 new programs of study As of June 30 2014 grantees began offering 834 (92 percent) of these programs of study
Round 2 ndash FY 2012 Grants The seventy-nine (79) grants awarded in the Fiscal Year 2012 had completed seven quarters of their grants at the end of June 30 2014 Their period of performance began on October 1 2012 and will end on September 30 2016 however their final year will be dedicated to gathering information and data for reporting outcome measures and completing the requirements for a third-party evaluation They project that by the end of the third year they will have launched 761 programs As of the end of June 30 2014 they had began offering 561 (78 percent) of these programs
Round 3 ndash FY 2013 Grants Grants awarded in FY 2013 had completed the first three quarters of their period of performance Their grants began on October 1 2013 and will end on September 30 2017
In their third year they will have launched all of their programs as their final year will be dedicated to collecting follow up data for evaluation and reporting purposes only The fifty-seven (57) grantees plan to launch 551 programs As of June 30 2014 they had already launched 288 (57 percent) of these programs
Percentage of Target Number of Programs Launched as of June 30 2014 by Grant Round
Performance Information Programmatic data is collected at different intervals throughout the period of performance including
bull Quarterly Narrative Progress Reports (QNPR) Grantees will provide quarterly qualitative data on the capacity building taking place through progress and other implementation measures that grantees defined in their Statements of Work
bull Annual Performance Reports (APR) Grantees will provide annual quantitative data on their training and employment outcomes for TAACCCT program participants that are impacted by the capacity building activities being implemented by their grants
30
WORKFORCE SYSTEM RESULTS
$4500000 3500$4000000 3000$3500000
2500
Jun-13 Dec-13 Mar-14 Jun-14
Amou
nt $3000000 2000$2500000
$2000000 1500 $1500000 1000 $1000000
500$500000 $0 0
n Amount of Revenue Generated n Number of Tickets Assigned
Disability Employment Initiative (DEI) httpwwwdoletagovdisability
Program Description All DEI Workforce Employment Network (EN) Trends
Launched in 2010 the Disability Employment Initiative (DEI) seeks to improve education training and employment opportunities for youth and adults with disabilities who are unemployed underemployed andor receiving Social Security disability benefits The DEI is jointly funded by the US Department of Laborrsquos Employment and Training Administration and Office of Disability Employment Policy DEI projects improve collaboration among employment and training and asset development programs implemented at state and local levels including the Social Security Administrationrsquos Ticket to Work Program and build effective partnerships that leverage resources to better serve individuals with disabilities and improve employment outcomes
Quarter Highlights A variety of Department of Labor programs helped Vietnam-era veteran Richard James navigate through life After servicing B-52 bombers in the Air Force James held a series of sales jobs while putting himself through law school at night He rose to become a successful New England attorney and owner of a boat dock building company when he suffered a terrible head injury which caused spine and nerve damage Addiction to pain medication followed and James ended up homeless While recovering from his injuries James took a college course through the Veterans Retraining Assistance Program managed in part by the Department He received career counseling from a Disabled Veterans Outreach Program representative at a local American Job Center and support from the DEI Disability Resource Coordinator Eventually James was hired as an attorney by a Rhode Island law firm The departments grants and programs made possible the services that put me back in a position of being a productive member of society he said
Program Performance
Performance Measure Quarter Ending 63013
Quarter Ending
123113
Quarter Ending 33114
Quarter Ending 63014
Analysis bull The Exit Rate for Adult and Youth exiters with disabilities in Round one DEI sites is almost
double the national average Adult DEI was 89 percent vs All StatesAll LWIAs 49 percent Older Youth DEI 166 percent vs All StatesAll LWIAs 87 percent Younger Youth DEI 339 percent vs All StatesAll LWIAs 151 percent
bull The CredentialSkill Attainment Rate for older and younger youth with disabilities in Round 1 DEI sites was higher than the national average Older Youth DEI credential rate 568 percent vs All StatesAll LWIAs 383 percent Younger Youth DEI skill rate 902 percent vs All States All LWIAs 834 percent
bull The Exit Rate for Adult and Youth exiters with disabilities in Round two DEI sites is higher than the national average Adult DEI 56 percent vs All StatesAll LWIAs 49 percent Older Youth DEI 163 percent vs All StatesAll LWIAs 87 percent and Younger Youth DEI 167 percent vs All StatesAll LWIAs 151 percent
bull The Entered Employment Rate for Adult DEI sites 657 percent is 20 percent higher than in All StatesAll LWIAs 434 percent
bull DEI Workforce Employment Networks (EN) activity shows that the number of Tickets assigned increased from 1780 to 2903 an increase of 1123 and the amount of revenue
Number of Tickets Assigned 1780 1590 2554 2903 generated from DEI EN payments increased from $2373404 to $4057353 an increase of $168 million Amount of Revenue Generated $2373404 $1927104 $3505582 $4057353
31
WORKFORCE SYSTEM RESULTS
ETA Internet-Based Assistance (E-TOOLS) wwwcareerinfonetorg wwwservicelocatororg wwwcareeronestoporg wwwonetonlineorg wwwmyskillsmyfutureorg wwwmynextmoveorg
Program Description Additional Program Year 2013 Quarterly Data
Performance Measure Quarter Ending
093013
Quarter Ending
123113
Quarter Ending
033114
CareerOneStop Portal Visits 5754645 5159240 5340022
ETArsquos Internet-based assistance includes electronic tools that help individuals explore career opportunities and link to job postings either on their own or at local American Job Centers to make informed employment and education choices
The Web sites feature user-friendly occupation and industry information salary data career videos education resources career exploration assistance and other resources that support talent development in todayrsquos fast-paced global marketplace Users can find information some of which is also industry sponsored about occupations that are in-demand in high growth industries Additionally information is available regarding occupational skills and workplace competencies
Quarter Highlights For the year ending June 2014 CareerOneStop launched a new portal for Ex-Offenders added Federal Contractor job tagging a TAACCCT information finder Youth Council information to Americarsquos Service Locator and began working on adding more job feeds
Americarsquos Service Locator (ASL) Visits
730998 758919 724053
ONET Downloads 26646 29407 28505
ONET Visits 7697608 10211177 11500039
Combined Visits 14183251 16129336 17564114
Performance in the Past Eight Quarters
25000000 $36000
Sep-12 Dec-12 Mar-13 Jun-13 Sep-13 Dec-13 Mar-14 Jun-14
n Combined Visits (in millions) n ONET Product Downloads (in thousands)
$31500 20000000
ONE
T Pr
oduc
t Dow
nloa
ds
$27000
Com
bine
d Vi
sits
$2250015000000 $18000
10000000 $13500
$90005000000
$4500
$00
ONET has added web services for developers and increased the available Tools and Technology and Detailed Work Activities information to convey specialized occupational attributes
Program Performance
Performance Measure Quarter
Ending 063013 Quarter
Ending 063014
CareerOneStop Portal Visits 5104850 5472742
Americarsquos Service Locator (ASL)Visits
747114 802148
ONET Downloads 29482 25278
ONET Visits 8716609 13581922
Combined Visits 14568573 19856812
Analysis bull ETA Internet-Based Assistance received 19856812 combined visits for the quarter ending
June 30 2014 an increase of 36 percent over the same period in 2013 bull Visits to CareerOneStop increased to 5472742 or 72 percent over the same period in 2013
with mySkillsmyFuture continuing to be a popular tool with an increase of 23 percent bull Americarsquos Service Locator Visits traffic increased 74 percent over the same period in 2013 bull The ONET traffic received 13581922 visits in this quarter an increase of 558 percent
over the same period in 2013 and the ONET downloads totaled 25278 for the quarter a decrease of 142 percent
32
WORKFORCE SYSTEM RESULTS
Glossary of Performance Measures
Common Performance Measures Common Performance Measures are used by Workforce Investment Act Indian and Native American Program Disability Program Navigator Initiative Wagner-Peyser Trade Adjustment Assistance Senior Community Service Employment Program Reintegration of Ex-Offenders Registered Apprenticeship Program Job Corps National Farmworker Jobs Program High Growth Job Training Initiative and Community-Based Job Training Grants
Adult Measures Entered Employment Of those who are not employed at the date of participation the number of adult participants who are employed in the first quarter after the exit quarter divided by the number of adult participants who exit during the quarter
Employment Retention Of those who are employed in the first quarter after the exit quarter the number of adult participants who are employed in both the second and third quarters after the exit quarter divided by the number of adult participants who exit during the quarter
Six Monthsrsquo Average Earnings Of those adult participants who are employed in the first second and third quarters after the exit quarter total earnings in the second quarter plus the total earnings in the third quarter after the exit quarter divided by the number of adult participants who exit during the quarter
Average Earnings Change in Six Months1
Of those who are employed in Q1 after exit the total post-program earnings (earnings in Q2 + Q3 after exit) minus pre-program earnings (earnings in Q2 + Q3 prior to registration) divided by the number of adults who exit during the quarter
Youth Measures Attainment of a Degree or Certificate Of those enrolled in education (at the date of participation or at any point during the program) the number of youth participants who attain a diploma GED or certificate by the end of the third quarter after the exit quarter divided by the number of youth participants who exit during the quarter
1 This definition was used for earnings in PY 2005 Q=quarter
33
Literacy and Numeracy Gains Of those out-of-school youth who are basic skills deficient the number of youth participants who increase one or more educational functioning levels divided by the number of youth participants who have completed a year in the program (ie one year from the date of first youth program service) plus the number of youth participants who exit before completing a year in the program
Placement in Employment or Education2
Of those who are not in postsecondary education or employment (including the military) at the date of participation the number of youth participants who are in employment (including the military) or enrolled in postsecondary education andor advanced trainingoccupational skills training in the first quarter after the exit quarter divided by the number of youth participants who exit during the quarter
Program-Specific Performance Measures
Disability Employment Initiative (DEI) Number of Tickets Assigned Number of individuals on Social Security Administration (SSA) disability benefits who assigned their Ticket to the workforce board agency or American Job Center as their designated Employment Network under the SSA Ticket to Work program All DEI pilot sites must become an Employment Network under Ticket to Work
Amount of Revenue Generated Under the SSA Ticket to Work program when jobseekers who receive SSA disability benefits assign their Ticket to a workforce board agency or American Job Center as an Employment Network and then achieve certain employment milestones the Employment Network receives money or ldquoTicket revenuerdquo
2 Because of its intensity and duration the YouthBuild performance measure for placement in employment or education does not exclude those who entered the program with a job or in college
WORKFORCE SYSTEM RESULTS
Foreign Labor Certification Percent of H-1B Applications Resolved in Seven Business Days This estimate is based on the total number of applications processed within seven business days divided by the total number of applications processed for a given reporting period An application is considered processed if the last significant event is (1) certified (2) denied or (3) withdrawn
Average Number of Days to Resolve PERM Applications Not Subject to Integrity Review The average processing time between case receipt and decision date for non-audited cases
Average Number of Days to Resolve PERM Applications Subject to Integrity Review The average processing time between case receipt and decision date for audited cases
Percent of Complete H-2A Employer Applications Resolved within 30 Days Before the Date of Need This estimate is based on the total number of complete applications resolved within 30 days before the date of need divided by the total number of applications processed for a given reporting period
Percent of H-2B Applications Processed Within 30 Days of Receipt This estimate is based on the total number of applications processed within 30 days of receipt divided by the total number of applications processed for a given reporting period An application is considered processed if the last significant event is (1) certified (2) denied or (3) withdrawn
Indian and Native American Youth Attainment of Two or More Goals The total number of youth participants enrolled in the Granteersquos Supplemental Youth Services Program who attained at least two of the 14 goals listed below divided by the total number of Supplemental Youth Services participants enrolled during the report period The 14 goals include
1 Completed Job ReadinessOrientation to the World of Work Training 2 Completed Internship or Vocational Exploration Program
3 Completed Career Assessment 4 Entered Unsubsidized Employment 5 Remained in School 6 Returned to School Full Time 7 Enrolled in Job Corps 8 Improved Basic Skills Level By At Least Two Grades 9 Attained High School Diploma 10 Attained GED 11 Completed Occupational Skills Training 12 Completed Leadership Skills Training 13 Entered Other (Non-Supplemental Youth) Training Program 14 Summer Employment
Educational Attainment for Dropouts The number of dropouts who have obtained a high school diploma GED or increased their literacy and numeracy by two grade levels divided by the total number of dropouts
Job Corps Measures Placement in Employment or Education Percent of Job Corps participants3 entering employment or enrolling in post-secondary education andor advanced skills trainingoccupational skills training in the first quarter after exit from the program
Attainment of a Degree or Certificate Percent of students who attain a GED HSD or certificate
Literacy Numeracy Gains Percent of students who achieve literacy or numeracy gains of one or more Adult Basic Education (ABE) levels
3 Calculation of the Placement rate measure does not include outcomes for students who participated in the program for less than 60 days
34
WORKFORCE SYSTEM RESULTS
Internet-Based Assistance Web Site Visits ETArsquos Internet-based assistance includes electronic tools that help individuals make informed employment and education choices The measure for tracking the overall performance and usage of these tools is Web site visits A visit is defined as a series of page requests from the same uniquely identified client with a time of no more than 30 minutes between each page
request
ONet Product Downloads The ONET product downloads count the number of unique users who download an ONET online resource (wwwonetcenterorg) which includes the ONET database (all versions) ONET technical reports (such as on green jobs) supplemental data files (lay titles tools and technology) the ONET Career Exploration Tool files ONET Survey questionnaires and other related materials such as the Toolkit for Business
Registered Apprenticeship Program Entered Employment Rate Percent of apprentices employed in the first quarter after exit who either completed or cancelled from their Registered Apprenticeship Program
Employment Retention Rate Percent of apprentices employed in the first quarter after exit still employed in the second and third quarter after exit who either completed or cancelled from their Registered Apprenticeship Program
Six Monthsrsquo Average Earnings Six month Average Earnings of apprentices employed in the first quarter after exit still employed in the second and third quarter after exit who either completed or cancelled from their Registered Apprenticeship Program
Reintegration of Ex-OffendersmdashAdult Program Recidivism Rate The percentage of participants who are rearrested for a new crime or re-incarcerated for revocation of a parole or probation violation within one year from release from prison
Senior Community Service Employment Program Service Level The count of participants during the report period divided by the total number of authorized grantee community service positions
Community Service The number of community service hours as reported by each grantee divided by the total community service hours funded for the grantee adjusted for minimum wage differences among the states
Most-in-Need Most-in-need means participants with one or more of the following characteristics have a severe disability are frail are age 75 or older are age-eligible but not receiving benefits under Title II of the Social Security Act reside in an area with persistent unemployment and have severely limited employment prospects have limited English proficiency have low literacy skills have a disability reside in a rural area are Veterans have low employment prospects have failed to find employment after utilizing services provided under Title I of the Workforce Investment Act of 1998 (29 USC 2801 et seq) or are homeless or at risk for homelessness (sect 513(b)(1)(E) as amended by Pub L No 109-365)
Unemployment Insurance Percent of Payments Made Timely The percentage of intrastate Unemployment Insurance benefit first payments for full weeks of unemployment issued within 14 days following the first compensable week in states with a waiting week and 21 days in non-waiting week states
Detection of Recoverable Overpayments The amount of overpayments (dollars) established through state operations as a percent of the estimated amount states can detect and establish for recovery
Entered Employment Rate The percent of persons receiving a first payment in a given quarter who had earnings in the next quarter
Percent of Employer Tax Liability Determinations Made Timely The percent of new employer determinations made within 90 days of the end of the quarter in which employers became liable to pay unemployment taxes
35
WORKFORCE SYSTEM RESULTS
YouthBuild Attainment of a Degree or Certificate Of those enrolled the number of youth participants who attain a diploma high school equivalency degree or industry-recognized certificate by the end of the third quarter after the exit quarter divided by the number of youth enrolled (minus youth exited for other reasons)
Literacy and Numeracy Gains Of those youth participants who are basic skills deficient at enrollment the number of youth participants who increase one or more educational functioning levels within one year of enrollment divided by the number of youth participants who have completed a year in the program
Placement in Employment or Education The number of youth participants who are in employment (including the military) or are enrolled in post-secondary education andor advanced trainingoccupational skills training in the first quarter after the exit quarter divided by the number of youth participants who exited during the previous quarter
Youthful Offender Projects Placement Rate The placement rate is the percentage of out-of-school youth ages 18 and above placed in unsubsidized jobs occupational training post-secondary education or the military
Recidivism Rate The recidivism rate is the percentage of youth offenders who have been convicted of a new crime within 12 months of their release of a correctional facility or being placed on probation
36
WORKFORCE SYSTEM RESULTS
2471 American Job Centers formerly known as One-Stop Career Centers
12 VT
9 HI
1 GU
6 DC
2 VI
15 NE
16 SD
12 ME
19 IA
19 AK
19 WV
4 DE
47 AL
55 CO
48 MN
57 WI
89 NC
60 GA
31 MA
23 NM
16 ND
47 AR
70 PA
18 CT 4 RI
12 NV
20 WY
22 KS
18 PR
89 OH
69 TN
102 FL
59 AZ 46
SC
12 NH
29 NJ
52 VA
22 MT
33 OK
39 MS
59 WA
61 IL 34 MD
47 OR
131 KY
62 LA
83 IN
33 UT
44 MO
26 ID 90
NY95 MI
1 to 25
25 to 50
50 to 75
75 to 100
Over 100
203 CA
180 TX
Source Americarsquos Service Locator (wwwServiceLocatororg) Americarsquos Service Locator connects individuals to employment and training opportunities available at local American Job Centers The Web site provides contact information for a range of local work-related services including unemployment benefits career development and educational opportunities As of March 17 2015
37
WORKFORCE SYSTEM RESULTS
United States Department of Labor
200 Constitution Avenue NW
Washington DC 20210
wwwdolgov
- A9RFAFEtmp
- DOL_Workforce_Rprt_Jun_2014_51415-dp
-
- Workforce System Results
-
- Contents
- Quarterly Spotlight
- People Served by Program
- Current Appropriations
- Government Performance and Results Act Goals (GPRA)
- Indian and Native American Adult Program (INAP)
- National Farmworker Jobs Program (NFJP)
- Senior Community Service Employment Program (SCSEP)
- Wagner-Peyser Employment Service
- Workforce Investment Act Adult Program
- Workforce Investment Act Dislocated Worker Program
- H-1B and Permanent Foreign Labor Certification (PERM)
- H-2A and H-2B Foreign Labor Certification Programs
- Reintegration of Ex-Offenders (RExO-ADULT)
- Registered Apprenticeship
- Registered Apprenticeship
- Trade Adjustment Assistance (TAA)
- Unemployment Insurance (UI)
- Unemployment Insurance (UI)
- Job Corps
- Workforce Investment Act Youthful Offender Initiative
- Workforce Investment Act Youth Program
- YouthBuild
- Indian and Native American Youth Program
- H-1B Jobs and Innovation Accelerator Challenge Grants
- H-1B Technical Skills Training Grants
- Community-Based Job Training Grants (CBJT)
- Trade Adjustment Assistance Community College and Career Training (TAACCCT) Grants
- Disability Employment Initiative (DEI)
- ETA Internet-Based Assistance (E-TOOLS)
- Glossary of Performance Measures
- 2471 American Job Centers formerly known as One-Stop Career Centers
-

WORKFORCE SYSTEM RESULTS
100
80
60
40
20
0 Sep-12 Dec-12 Mar-13 Jun-13 Sep-13 Dec-13 Mar-14 Jun-14
n Entered Employment Rate n Employment Retention Rate n Six Months Average Earnings
$15000
$13000
$11000
$9000
$7000
$5000
Wagner-Peyser Employment Service httpwwwdoletagovProgramsWagner_Peysercfm
Program Description Wagner-Peyser Employment Service is an integral part of the American Job Center network formerly known as One-Stop Career Centers delivery system which provides universal access to workers job seekers and businesses The Employment Service focuses on providing a variety of employment related services including but not limited to job search assistance job referral and placement assistance for job seekers reshyemployment services to unemployment insurance claimants and recruitment services to employers with job openings Services are provided in one of three modes of delivery approaches self-service facilitated self-help service and staff-assisted service
Quarter Highlights When Mylan Pharmaceuticals Inc the third largest generic and pharmaceuticals company in the world needed to increase its production team at its Morgantown West Virginia location it was receiving over 100000 resumes and was overwhelmed with interested job seekers for openings to fill Plant Manufacturing Laborer positions With a starting pay of $1800 per hour the positions at Mylan are very attractive and turned to WorkForce (WF) West Virginia for labor exchange assistance beginning a success story of cooperation between private industry and a State agency WF West Virginia was able to help screen job seekers for Mylan and the plant hired 177 participants including 21 Veterans a higher representation than overall Veterans in the labor force (118 percent versus approximately seven percent)
Program Performance
Performance Measure Four Quarters
Ending 063013 Four Quarters
Ending 063014
Entered Employment Rate 530 560
Employment Retention Rate 810 820
Six Monthsrsquo Average Earnings $14252 $14515
Additional Program Year 2013 Quarterly Data
Performance Measure
Four Quarters
Ending 093013
Four Quarters
Ending 123113
Four Quarters
Ending 033114
Entered Employment Rate 530 530
Employment Retention Rate 810 810
Six Monthsrsquo Average Earnings $14129 $14175
Performance in the Past Eight Quarters
540
810
$14265
Analysis bull Over 16 million people received services from the Wagner-Peyser Employment Service
between July 1 2013 and June 30 2014 bull Over 11 million Veterans received services between July 1 2013 and June 30 2014 bull Nearly 35 million unemployed individuals entered employment after receiving services
from the Employment Service between July 1 2013 and June 30 2014
10
WORKFORCE SYSTEM RESULTS
100 $15000
80 $13000
60 $11000
40 $9000
20 $7000
0 Jun-12 Jun-13 Jun-14
$5000
n Entered Employment Rate n Employment Retention Rate n Six Months Average Earnings
Workforce Investment Act Adult Program httpwwwdoletagovprogramsgeneral_infocfm
Program Description The Workforce Investment Act (WIA) Adult Program helps prepare low-skill adult workers for good jobs through formula grants to States States use the funds to provide employment and training services through a network of American Job Centers of which there were nearly 2500 across the United States as of June 30 2014
WIA provides employment and training services at three broad service levels to job seeker customers core intensive and training These services are provided at a level which most efficiently meets their needs to achieve gainful employment The program is also designed to assist employer customers meet their needs for skilled workers
Adult Programs serve the broadest range of individuals including but not limited to public assistance recipients Unemployment Insurance claimants Veterans people with disabilities dislocated workers migrant and seasonal farmworkers Indian and Native Americans and workers age 55 or older
Quarter Highlights In Virginia the GoodwillWIA Adult program assists with the funding for Patient Care Technician (PCT) training provided by Fast Track Health The cost of training is approximately $3450 and the training is eleven weeks in duration This training provides a certificate in CNA EKG CPR and Phlebotomy with the certificationlicensing costs included in the overall training cost Ms O was referred to the WIA Adult program by a local Virginia Employment Commission representative She attended an orientation and started the process of changing her life that very day Ms O excelled and received a 100 percent increase in salary after completing training through this program with Fast Track Ms O stated of her experience ldquoI am very happy with my new career and very grateful for Goodwill and the WIA Adult program for providing [me] with this opportunity to enter a career with so much potential for advancementrdquo
Analysis bull In Program Year 2013 the WIA Adult program served 7184946 participants and over
150000 participants received training services bull Participants who received training services had a 761 percent Entered Employment
Rate in Program Year 2013 15 percentage points higher than the overall Entered Employment Rate of 611 percent
Program Performance
Performance Measure
Four Quarters
Ending 063012
(Program Year 2011)
Four Quarters
Ending 063013
(Program Year 2012)
Four Quarters
Ending 063014
(Program Year 2013)
Entered Employment Rate 572 599 611
Employment Retention Rate 808 819 828
Six Monthsrsquo Average Earnings $13482 $13335 $13842
Performance in the Past Three Program Years
11
WORKFORCE SYSTEM RESULTS
100 $19000
$1700080
$15000 60 $13000
$1100040 $9000
20 $7000
0 $5000 Jun-12 Jun-13 Jun-14
n Entered Employment Rate n Employment Retention Rate n Six Months Average Earnings
Workforce Investment Act Dislocated Worker Program httpwwwdoletagovprogramsgeneral_infocfm
Program Description The Workforce Investment Act Dislocated Worker Program funds services to support the reemployment of laid-off workers The Department of Labor allocates 80 percent of funds by formula to the States The Secretary of Labor may use the remaining 20 percent for National Emergency Grantsmdashthese specially targeted funds can infuse resources to areas suffering most from plant closings mass layoffs or job losses due to natural disasters or military base realignment and closures States allocate their Dislocated Worker funds to their local workforce investment areas Additionally the program allows for States to reserve up to 25 percent of their Dislocated Worker funds for Rapid Response activities Rapid Response is a pro-active business-focused and flexible strategy to help growing companies access an available pool of skilled workers and can respond to layoffs by quickly coordinating services and aid to companies and their workers
Program Performance
Performance Measure
Four Quarters
Ending 063012
(Program Year 2011)
Four Quarters
Ending 063013
(Program Year 2012)
Four Quarters
Ending 063014
(Program Year 2013)
Entered Employment Rate 611 600 600
Employment Retention Rate 842 843 838
Six Monthsrsquo Average Earnings $16500 $15930 $15997
Performance in the Past Three Program Years
Quarter Highlights After Kyle was laid off he was able to utilize an On-the-Job Training (OJT) opportunity with Tyson He now works the second shift from 1-9 pm and was able to obtain the technical training he felt he did not obtain from prior employment or education ldquoI wanted to get more experience on how things technically operate and this program is the perfect fit for merdquo Kyle said And in the end Tyson gained a skilled employee
Analysis bull The Dislocated Worker program served over 800000 participants in Program Year 2013
and provided training services to 109148 participants bull Participants who received training had an 814 percent Entered Employment Rate 214
percentage points higher than the overall Entered Employment Rate of 60 percent
12
WORKFORCE SYSTEM RESULTS
500 100
400 80
300 60
Days
200 40
100 20
0 0 Jun-13 Sep-13 Dec-13 Mar-14 Jun-14
n Average Number of Days to Resolve PERM Applications Not Subject to Integrity Review n Average Number of Days to Resolve PERM Applications Subject to Integrity Review (Audit) n Percent of H1-B Applications Processed within Seven Days of Filing
H-1B and Permanent Foreign Labor Certification (PERM) httpwwwforeignlaborcertdoletagov
Program Description Performance in the Past Five Quarters
H-1B certification permits employers to hire on a temporary basis foreign workers who possess qualifying professional or specialty skills The PERM program allows employers to begin the process for permanently hiring a foreign worker when there are not sufficient numbers of US workers who are able willing qualified and available to perform the job In addition the program ensures that the employment of the foreign worker does not adversely affect the wages and working conditions of American workers who are similarly employed
Program Performance
Performance Measure Four Quarters
Ending 063013 Four Quarters
Ending 063014
Percent of H-1B Applications Resolved in Seven Business Days
100 100
Quarter Highlights Average number of days to resolve PERM applications not subject to integrity review
129 194
The percent of employer applications processed within seven days of filing under the H-1B program sustains at approximately 100 percent ending in June 30 2014
Average number of days to resolve PERM applications subject to integrity review (Audit)
294 424 The Office of Foreign Labor Certification (OFLC) continues to allocate staff resources for the PERM program to increase program integrity by conducting more audit examinations and supervised recruitments This increased emphasis on program integrity has had an effect on processing timeliness
Additional Program Year 2013 Quarterly Data
Performance Measure
Four Quarters
Ending 093013
Four Quarters
Ending 123113
Four Quarters
Ending 033114
Analysis bull The number of H-1B applications processed within seven business days held steady
at 100 percent from the same four quarter reporting period one year ago Of the total 103032 H-1B applications processed over the past four quarters 103032 were completed within seven business days of the filing date
Percent of H-1B Applications Resolved in Seven Business Days
100 804 996 bull The average number of days to resolve PERM applications not subject to integrity review decreased by 20 percent compared to the previous quarter and the average number of days to resolve PERM applications subject to integrity review (Audits) decreased by four percent compared to the previous quarter
Average number of days to resolve PERM applications not subject to integrity review
178 237 234
Average number of days to resolve PERM applications subject to integrity review (Audit)
320 423 444
13
WORKFORCE SYSTEM RESULTS
100
80
60
40
20
0 Jun-13 Sep-13 Dec-13 Mar-14 Jun-14
n Percent of Accepted H-2A Applications Without Deficiencies Resolved by 30 Days Before the Date of Need n Percent of H-2B Applications Resolved Within 30 Days of Receipt
H-2A and H-2B Foreign Labor Certification Programs httpwwwforeignlaborcertdoletagov
Program Description H-2A labor certification permits employers to hire foreign workers on a temporary basis for the agricultural sector of the economy H-2B labor certification permits employers to hire foreign workers to come to the United States and perform temporary nonagricultural work which must be one-time seasonal peak load or intermittent in nature
Program Performance
Performance Measure Four Quarters
Ending 063013 Four Quarters
Ending 063014
Percent of Complete H-2A Employer Applications Resolved Within 30 Days Before the Date of Need
NA 97
Percent of H-2B Applications Resolved Within 30 Days
23 97
Additional Program Year 2013 Quarterly Data
Performance Measure
Four Quarters
Ending 093013
Four Quarters
Ending 123113
Four Quarters
Ending 033114
Percent of Complete H-2A Employer Applications Resolved Within 30 Days Before the Date of Need
NA NA 84
Percent of H-2B Applications Resolved Within 30 Days
98 92 99
The Percent of Complete H-2A Employer Applications Resolved Within 30 days Before the Date of Need measure was changed in the second quarter of Fiscal Year 2014
Performance in the Past Five Quarters
Quarter Highlights The Office of Foreign Labor Certification (OFLC) continues to resolve approximately 971 percent of complete H-2A applications on time The processing rates have improved in spite of an increase in the numbers of applications filed during this reporting period FY 2014 when compared to one year ago
Employer filings under the H-2B program have increased 167 percent this reporting period compared to the same four quarter reporting period one year ago
Analysis bull The percentage of H-2A applications resolved within 30 calendar days increased 125
percentage points from the previous quarter Of the 3845 total of H-2A applications processed in Fiscal Year 2014 908 percent were resolved within 30 calendar days of the filing date
bull The percentage of H-2B applications processed within 30 calendar days increased when compared with the same reporting period one year ago Of the 5188 H-2B applications processed within the last four quarters 998 percent of them were processed within 60 calendar days of the filing date
14
WORKFORCE SYSTEM RESULTS
100
80
60
40
20
0 Sep-12 Dec-12 Mar-13 Jun-13 Sep-13 Dec-13 Mar-14 Jun-14
$15000
$13000
$11000
$9000
$7000
$5000
n Entered EmploymentPlacement Rate n Employment Retention Rate n Six Months Average Earnings
Reintegration of Ex-Offenders (RExO-ADULT) httpwwwdoletagovRExOeta_defaultcfm
Program Description The Reintegration of Ex-Offenders ndash Adult Program (RExO-Adult) is an employment-centered program that seeks to strengthen urban communities that have large numbers of returning prisoners The program incorporates mentoring job training and other comprehensive transitional services It is designed to reduce recidivism by helping inmates find work when they return to their communities as part of an effort to improve community life
Quarter Highlights The Adult RExO Program operated three initiatives this program year
bull Grants to community and faith-based organizations to help returning offenders find employment
bull Grants aimed specifically at serving female offenders providing employment and supportive services
bull Grants to provide occupational training and job placement to offenders in Halfway Houses
Program Performance
Performance Measure Quarter Ending
063013
Quarter Ending
063014
Entered Employment Rate
58 58
Employment Retention Rate
68 72
Six Monthsrsquo Average Earnings
$9797 $9770
The data for June 30 2013 are program-to-date since the inception of the program in the Spring of 2006 The June 30 2014 numbers are program-to-date for currently operating projects
Additional Program Year 2013 Quarterly Data
Performance Measure Quarter Ending
093013
Quarter Ending
123113
Quarter Ending
033114
Entered Employment Rate
55 56
Employment Retention Rate
66 68 70
Six Monthsrsquo Average Earnings
$10036 $9962 $9736
Performance in the Past Eight Quarters
58
Analysis The Adult RExO Program served 6308 participants this program year
bull Adult RExO Grantees reported 3404 enrollees receiving training or education bull Adult RExO Grantees reported 2555 enrollees receiving a certificate bull The recidivism rate largely reflects the extent to which the program is serving persons
at high or low risk of re-offending
15
WORKFORCE SYSTEM RESULTS
Registered Apprenticeship httpwwwdoletagovoa
Program Description Registered Apprenticeship is a leader in preparing American workers to compete in a global 21st Century economy With a network of over 150000 employers in more than 1000 occupations Registered Apprenticeship has already trained millions of Americarsquos workers Modern apprenticeships are now on the cutting edge of innovation in preparing a skilled workforce for todayrsquos industries including expanding industries like health care information technology transportation telecommunications and advanced manufacturing as well as in industries like construction where apprenticeships have a long and successful history
Quarter Highlights During the summer of 2014 the White House hosted the first-ever Summit on Apprenticeship to gather the best ideas and to catalyze action to dramatically increase apprenticeship in America More than 60 attendees presented their ideas including leading employers big and small like IBM Bank of America Blue CrossBlue Shield and Oberg Industries labor unions like the International Brotherhood of Electrical Workers (IBEW) training providers like Ivy Tech and Lone Star Community Colleges and local workforce leaders The event was the apex in a series of industry roundtables on apprenticeship which took place across the country during June amp July 2014
Program Performance
Performance Measure Four Quarters
Ending 063013 Four Quarters
Ending 063014
Entered Employment Rate 734 742
Employment Retention Rate 873 878
Six Monthsrsquo Average Earnings $23826 $24387
Performance Measure Quarter Ending
063013 Quarter Ending
063014
Apprentices
Total Apprentices (Active Apprentices)
148039 152582
New Apprentices 17432 17011
Programs
New Programs 139
Programs Maintained Total (Active Programs)
9809 9077
Number of new programs in Construction and Manufacturing
93
Source Registered Apprenticeship Partners Information Management Data System (RAPIDS) data managed by Department of Labor staff only 063013 data has been revised to include federal data only Running total of active apprenticesprograms during the quarter
16
177
127
WORKFORCE SYSTEM RESULTS
0
20
40
60
80
100
Sep-12 Dec-12 Mar-13 Jun-13 Sep-13 Dec-13 Mar-14 Jun-14 $5000 $7000 $9000 $11000 $13000 $15000 $17000 $19000 $21000 $23000 $25000
n Entered Employment Rate n Employment Retention Rate n Six Months Average Earnings
Registered Apprenticeship httpwwwdoletagovoa
Additional Program Year 2013 Quarterly Data
Performance Measure
Four Quarters
Ending 093013
Four Quarters
Ending 123113
Four Quarters
Ending 033114
Entered Employment Rate 735 738 738
Employment Retention Rate 874 877 878
Six Monthsrsquo Average Earnings $24171 $24324 $24378
Performance in the Past Eight Quarters
Analysis bull During the third quarter of Fiscal Year 2014 there were over 394000 active apprentices
nationwide while over 13000 program participants completed their apprenticeship and received a credential that is portable industry recognized and can provide a pathway to middle-class and sustainable careers
bull The Entered Employment Rate for participants who completed their Registered Apprenticeship program was 856 percent 114 percentage points higher than for all program exiters who either completed or cancelled (742 percent as shown in table on the previous page)
bull The Employment Retention Rate for program completers was 910 percent 32 percentage points higher than for all program exiters (878 percent as shown in table on the previous page)
bull The Six Monthsrsquo Average Earnings for program completers was $29964 which is over $5577 more than that of all program exiters (ie completers or those who cancelled) The results for those completing the program shows it pays to stay
17
WORKFORCE SYSTEM RESULTS
100
80
60
40
20
0 Sep-12 Dec-12 Mar-13 June-13 Sep-13 Dec-13 Mar-14 Jun-14
n Entered Employment Rate n Employment Retention Rate n Six Months Average Earnings
$25000
$21000
$17000
$13000
$9000
$5000
Trade Adjustment Assistance (TAA) httpwwwdoletagovtradeact
Program Description The Trade Adjustment Assistance (TAA) Program is an integral part of the comprehensive workforce development system The program is essential to helping workers dislocated by foreign trade to adjust to changing market conditions and shifting skill requirements Addressing the needs of trade-affected workers involved in this transformation is a unique challenge because in general these workers are being dislocated from relatively outdated-skill high-wage employment In many cases this is complicated by mass layoffs or plant closures that occur in single-industry towns which makes finding comparable employment in the same geographic area difficult Furthermore many of these jobs are lost permanently from the domestic economy requiring affected workers to completely retool their skills
Fiscal Year Highlights During Fiscal Year 2014 Massachusetts diligently trained staff at the local CareerOneStop Centers to ascertain a TAA participantrsquos eligibility for other funding resources to assist in their reemployment initiatives These improved efforts to provide and report reemployment services enables Trade customers to flow through the CareerOneStop Center system with other dislocated workers and receive seamless resources through the resource sharing initiatives of the Career Center methodology These streamlined reemployment services have resulted in an Entered Employment Rate of 815 percent nearly ten percentage points higher than the national average
Program Performance
Performance Measure FY 2011 FY 2012 FY 2013 FY 2014
Entered Employment Rate 653 689 716 729
Employment Retention Rate 897 913 917 911
Six Monthsrsquo Average Earnings $18319 $18837 $18099 $17828
Performance Measure Quarter Ending 063013 Quarter Ending 063014
Entered Employment Rate 733 728
Employment Retention Rate 900 927
Six Monthsrsquo Average Earnings $18210 $17692
Additional Program Year 2013 Quarterly Data
Performance Measure Quarter Ending
093013
Quarter Ending
123013
Quarter Ending
033014
Entered Employment Rate 713 713
Employment Retention Rate 918 918
Six Monthsrsquo Average Earnings $17499 $17499
Performance in the Past Eight Quarters
727
917
$17550
Analysis During Fiscal Year 2014 there were 62706 total participants receiving TAA benefits or services and 20577 exiters entered employment (729 percent) More than one-third of all participants were minorities with the average age of participants being 47 years and the average tenure being approximately 13 years 9547 exiter participants received credentials or 83 percent of all exiter participants who completed training 32527 participants received training or approximately 52 percent of all participants Lastly the program served 4828 Veteran participants accounting for approximately eight percent of all participants
18
WORKFORCE SYSTEM RESULTS
Unemployment Insurance (UI) httpouidoletagovunemploy
Program Description The federal-state Unemployment Insurance (UI) System minimizes individual and family financial hardship due to unemployment and stabilizes the economy during economic downturns by providing unemployed workers with temporary income support States operate their own Unemployment Insurance Programs regulated by State laws
As the Federal partner DOL provides program leadership allocates administrative funds provides technical assistance and exercises performance oversight
Quarter Highlights As the economy improved the system emphasized program integrity solvency and reemployment Claims rates decreased about 10 percent from the year before and Trust Fund loans decreased from $21 billion to $14 billion EUC benefit payments ceased on December 28 2013 Twenty-four states implemented Short-term Compensation programs allowing unemployed workers to stay on jobs while receiving partial unemployment benefits proportionate to reduced work hours States implemented systems to improve efficiency and reduce overpayments such as data exchange and recover UI overpayments By June 30 2014 42 states were recovering overpayments through Federal Income tax refund offset (TOP) and had recovered $370 million in 2014 (over $840 million since TOPrsquos inception)
Analysis During the year ending June 30 2014
bull 51 million UI claimants were reemployed in the quarter following their UI 1st payments (17 million in the last quarter)
bull The UI system met two and failed two of its four targets UI met detection of overpayments (643 percent vs target of 542 percent) and met reemployment (657 percent vs target of 647 percent)
bull The system fell short of its 1st pay and status targets because of retirements and other turnover of key staff
Program Performance
Performance Measure Four Quarters
Ending 063013 Four Quarters
Ending 063014
Percent of Intrastate Payments Made Timely
812 792
Detection of Recoverable Overpayments Rate
598 643
Facilitation of Reemployment Rate 6261 6552
Percent of Employer Tax Liability 888 882
Operational Results
Recipiency Rate 263 272
Exhaustion Rate 456 431
Percent of Recipients of Prime Working Age (25-54)
702 700
Percent of Recipients Who Are Female
434 437
New Initial Unemployment Insurance Claims
13906868 12501014
Number of First Unemployment Insurance Payments
8404507 7632522
Average Duration of Unemployment Insurance (Weeks)
169
1 Reemployment for year ending June 30 2013 2 Reemployment for year ending June 30 2014
19
167
WORKFORCE SYSTEM RESULTS
Unemployment Insurance (UI) httpouidoletagovunemploy
Additional Program Year 2013 Quarterly Data
Performance Measure Four Quarters
Ending 093013 Four Quarters
Ending 123113 Four Quarters
Ending 033114
Percent of Intrastate Payments Made Timely
809 802 793
Detection of Recoverable Overpayments Rate
590 630 603
Facilitation of Reemployment Rate 6311 6312 6363
Percent of Employer Tax Liability 886 885 884
Operational Results
Recipiency Rate 263 262 267
Exhaustion Rate 453 446 437
Percent of Recipients of Prime Working Age (25-54)
702 702 701
Percent of Recipients Who Are Female
434 434 435
New Initial Unemployment Insurance Claims
13559233 13340263 12947493
Number of First Unemployment Insurance Payments
8215687 7967852 7857395
Average Duration of Unemployment Insurance (Weeks)
169 169 168
1 Reemployment for year ending September 30 2013 2 Reemployment for year ending December 31 2013 3 Reemployment for year ending March 31 2014
20
WORKFORCE SYSTEM RESULTS
100
80
60
40
20
0 Sep-12 Dec-12 Mar-13 Jun-13 Sep-13 Dec-13 Mar-14 Jun-14
n Placement in Employment or Education n Attainment of a Degree or Certificate n LiteracyNumeracy Gains
Job Corps httpwwwjobcorpsgovhomeaspx
Program Description Job Corps is the nationrsquos largest residential educational and career technical training program for at-risk youth ages 16 through 24 The 125 Job Corps centers nationwide provide an integrated comprehensive array of services that include academic career technical and life skills training career planning and work-based learning health care and post-program placement and transition support
Job Corps is committed to offering all students a safe drug-free environment where they can take advantage of the resources provided Job Corpsrsquo mission is to attract eligible young people teach them the skills they need to become employable and independent and place them in meaningful jobs or further education
Program Performance
Performance Measure Four Quarters
Ending 063013 Four Quarters
Ending 063014
Placement in Employment or Education 746 767
Attainment of a Degree or Certificate 706 668
LiteracyNumeracy Gains 692 661
Additional Program Year 2013 Quarterly Data
Performance Measure
Four Quarters
Ending 093013
Four Quarters
Ending 123113
Four Quarters
Ending 033114
Placement in Employment or Education 757 760 765
Attainment of a Degree or Certificate 722 727 707
LiteracyNumeracy Gains 702 709 695
Performance in the Past Eight Quarters
The Performance in the Past Eight Quarters graph displays single quarter data versus the Program Performance tables which depict cumulative four quarter data
Quarter Highlights In May 2014 four Job Corps students from centers in Montana California Iowa and Virginia participated in the 2nd Asia-Pacific Economic Cooperation (APEC) Youth Skills Camp in Beijing and Guangzhou China the second time Job Corps students have participated in this event The camp included field visits to vocational training schools business enterprises and public practical training facilities as well as skills exchanges This international event provides students with life-changing experiences in travel diversity and first-hand exposure to global issues
Analysis bull During the current quarter Job Corps served 69979 participants including 13079 new
enrollees an increase of 801 percent overall compared to the same quarter in PY 2013 and due to the resumption of new enrollments after the PY 2012 enrollment suspensions The number of new students increased by over 200 percent from the same quarter in PY 2013
bull The proportion of 16-17 year olds served increased by 45 percentage points Conversely the proportion of all older students served similarly decreased from the same quarter in PY 2013
bull In the current quarter Job Corps placed 7203 students in Employment and Education a slight decrease of 04 percentage points compared to the same quarter last year In addition 8657 students attained a Certificate a 131 percentage point decrease compared to the same quarter in PY 2013 Also 6789 students attained a LiteracyNumeracy gain an 116 percentage point decrease over the same quarter in PY 2013
bull In the current quarter the program served 50 participants who were Veterans prior to enrollment bull When comparing the four quarter data Placement in Employment or Education increased
21 percentage points Attainment of a Degree or Certificate decreased 38 percentage points and LiteracyNumeracy Gains decreased 31 percentage points from the same quarter one year ago 21
WORKFORCE SYSTEM RESULTS
100
80
60
40
20
0 Sep-12 Dec-12 Mar-13 Jun-13 Sep-13 Dec-13 Mar-14 Jun-14
n Placement Rate for Out-of-School Youth Ages 18 and Above n Recidivism Rate for Youth Ages 14 to 17 n Recidivism Rate for Youth Ages 18 and Above
Workforce Investment Act Youthful Offender Initiative httpwwwdoletagovYouth_servicesyouthful_offendercfm
Program Description The Employment and Training Administration uses its Youthful Offender Appropriation to fund a variety of projects that target youth offenders and young adult offenders Currently operating projects include grants to community-based organizations to involve juvenile offenders in training and service learning projects grants to intermediary organizations to serve young offenders in high-poverty high-crime communities and grants to help youth enter diversion programs as an alternative to out-of-home placements and to assist eligible youth have their juvenile records sealed or expunged
Quarter Highlights The great majority of juvenile offenders are of ages 17 and below and many are still in high school The youth offender grants focus on helping younger youth stay in school and complete their education and helping older youth find jobs and succeed in the labor market Case management mentoring and supportive services are also provided by these grants
Performance in the Past Eight Quarters
Program Performance
Performance Measure Four Quarters
Ending 063013 Four Quarters
Ending 063014
Placement Rate for Youth Ages 18 and Above
36 362
Recidivism Rate for Youth Ages 14 to 17
35 24
Recidivism Rate for Youth Ages 18 and Above
34 16
Results are cumulative for currently operating grants
Additional Program Year 2013 Quarterly Data
Placement Rate for Youth Ages 18 and Above
277 334 325
Performance Measure
Four Quarters
Ending 093013
Four Quarters
Ending 123113
Four Quarters
Ending 033114
Recidivism Rate for Youth Ages 14 to 17
349 349 349
Recidivism Rate for Youth Ages 18 and Above
335 335 335
Analysis bull Providing opportunities to youthful offenders results in varying outcomes depending on
the mix of projects being operated in a given year bull Projects have markedly different placement and recidivism rates depending on whether
they are serving young adults in their 20s or youth ages 16-17 they recruit youth in the community or through direct referrals from the juvenile justice system whether they are located in small or large cities and the extent to which enrollees are at high or low risk of re-offending
22
WORKFORCE SYSTEM RESULTS
100
80
60
40
20
0 Jun-12 Jun-13 Jun-14
n Placement in Employment or Education n Attainment of a Degree or Certificate n LiteracyNumeracy Gains
Workforce Investment Act Youth Program httpwwwdoletagovyouth_services
Program Description The Workforce Investment Act Youth Formula Program provides employment and education services to eligible low-income youth ages 14 to 21 who face barriers to employment The program serves in-school and out-of-school youth youth with disabilities and low literacy rates as well as others who may require additional assistance to complete an educational program and acquire an industry-recognized credential or enter employment
Quarter Highlights The passage of the Workforce Innovation and Opportunity Act (WIOA) includes a major shift in focus to spending more funds on and serving more out-of-school youth (OSY) The workforce system demonstrated its readiness for this shift in that 48 percent of all youth served in PY 2013 were OSY and 57 percent of all WIA youth local area funds were spent on OSY So far in Program Year 2013 California has spent almost 65 percent of their WIA youth funds on OSY with high levels of OSY expenditures in both urban and rural areas 53 percent of all youth served in CA in Program Year 2013 were OSY For example Los Angeles City spent 80 percent of their funds on OSY and the Northern Rural Training and Employment Consortium spent 76 percent of their funds on OSY Both local areas have achieved these levels through strong partnerships with organizations that serve OSY as well as access to high quality work experiences
Program Performance
Performance Measure
Four Quarters
Ending 063012
(Program Year 2011)
Four Quarters
Ending 063013
(Program Year 2012)
Four Quarters
Ending 063014
(Program Year 2013)
Placement in Employment or Education 589 666 690
Attainment of a Degree or Certificate 648 675 684
LiteracyNumeracy Gains 476 509 525
Performance in the Past Three Program Years
Analysis bull 197045 participants were served in the cumulative four quarter reporting period compared
to 217244 served during the same time period last year This decrease is due primarily to a lower funding level compared to the previous year
bull Placement in Employment or Education achieved a result of 690 percent a 24 percentage point increase when compared with the same time period last year
bull The program achieved a result of 684 percent for the Attainment of a Degree or Certificate measure This is a 09 percentage point increase from the same time period last year
bull The LiteracyNumeracy Gains measure achieved a result of 525 percent an increase of 16 percentage points when compared with the same time period last year
bull All three youth common measures exceeded Program Year 2013 GPRA goals
23
WORKFORCE SYSTEM RESULTS
100
80
60
40
20
0 Sep-12 Dec-12 Mar-13 Jun-13 Sep-13 Dec-13 Mar-14 Jun-14
n Placement in Employment or Education n Attainment of a Degree or Certificate n LiteracyNumeracy Gains
YouthBuild httpwwwdoletagovyouth_servicesyouthbuildcfm
Program Description YouthBuild provides job training and educational opportunities for at-risk youth ages 16 to 24 while constructing or rehabilitating affordable housing for low-income or homeless families in their own neighborhoods The youth split their time between the construction site and the classroom where they earn their high school diploma or equivalency learn to be community leaders and prepare for college and other post-secondary training opportunities
Analysis bull 33392 participants have been enrolled into the YouthBuild program since 2007 and 29553
have exited so far bull Since the program began a total of 11716 participants have received a high school
diploma or equivalency 17572 have attained an industry-recognized certificate and 21835 have been placed into initial jobs post-secondary education andor long-term vocational occupational skills training including apprenticeship
bull The Class of 20102011 performance steadily increased The outcomes for all three measures were above those for the Class of 2009 and significantly above the GPRA goals
bull YouthBuild is currently meeting or exceeding the GPRA goal for all three measures The additional quarter of service for 20102011 grants provided additional positive outcomes as expected As the 2012 grant class progresses it is expected that this trend will continue
Program Performance
Quarter Highlights Just A Start in Cambridge (MA) has been a YouthBuild grantee since 2010 In the fourth quarter of the Program Year 2013 they shared the following success story
Victor earned a High School Diploma and HBIPACT construction certification He was accepted to Endicott College in MA He also secured a full time painting position with George Souza Painting making $25 per hour He continues to develop his career plan with staff
Class of 20102011 Performance in the Past Eight Quarters
Performance Measure GPRA Results for Class
0f 20102011 Results for Class 2012 Overall Results
Percent of Participants Entering Employment or Enrolling in Postsecondary Education the Military or Advanced Training Occupational Skills Training in the First Quarter After Exit
500 612 586 519
Percent of Youth Who Attain a Diploma GED or Certificate by the End of the Third Quarter after Exit
672 770 609 672
Percent of Participants Deficient in Basic Skills Who Achieve Literacy or Numeracy Gains of One Adult Basic Education Level
585 676 549 595
24
WORKFORCE SYSTEM RESULTS
100
80
60
40
20
0 Sep-12 Dec-12 Mar-13 Jun-13 Sep-13 Dec-13 Mar-14 Jun-14
n Attainment of a High School Diploma GED or improvement of basic skills by at least two grade levels or completed Occupational Skills training n Participants who Attained Two or more Goals
Indian and Native American Youth Program httpwwwdoletagovdinap
Program Description The Indian and Native American Supplemental Youth Services Program provides summer and year-round employment and training activities for Indian Alaska Native and Native Hawaiian individuals between the ages of 14 and 21 Program resources are targeted to at-risk and the neediest youth who face substantial barriers to education and employment success This population includes high school dropouts and youth who are basic-skills deficient
Quarter Highlights Youth summer employment is a high priority for Native American Tribes However most rural reservation areas do not have enough employers to put youth to work during the summer As a result Tribes rely on the annual WIA Section 166 funding to place youth in summer employment where they can earn a wage and receive valuable work experience
Over the past four quarter period 2487 of the 4399 youth that participated in the youth program were placed in summer employment Youth participants come from low income families with little or no opportunity to earn money during the summer months Through the Indian and Native American Youth Program these youth are given an opportunity to work and earn money during the summer which helps them contribute to their familyrsquos income
Performance in the Past Eight Quarters
Program Performance
Performance Measure Four Quarters
Ending 063013 Four Quarters
Ending 063014
Educational Attainment for Dropouts 180 220
Attainment of Two or More Goals 920 927
The data reported reflect the period from April 1 2012 through March 31 2013 The data reported reflect the period from April 1 2013 through March 31 2014
Additional Program Year 2013 Quarterly Data
Performance Measure Four Quarters
Ending 093013 Four Quarters
Ending 123113 Four Quarters
Ending 033114
Educational Attainment for Dropouts
250 250 220
Attainment of Two or More Goals
930 930 927
The data reported reflect the period from April 1 2013 through September 30 2013 The data reported reflect the period from April 1 2013 through March 31 2014
Analysis bull The Attainment of Two or More Goals rate increased slightly from 92 percent in June 2013
to 927 percent in June 2014 bull The Indian and Native American Youth Program served 4310 youth during the period July
1 2013 through June 30 2014 This is a 164 percentage point decrease in youth served one year ago
bull The Education Attainment for Dropouts increased from 18 percent in June 2013 to 22 percent in June 2014
25
WORKFORCE SYSTEM RESULTS
Green Jobs Innovation Fund Grants (GJIF) httpwwwdoletagovBRGGreenJobs
Program Description The Green Jobs Innovation Fund (GJIF) was authorized as a Pilot and Demonstration Project under the Workforce Investment Act (WIA) of 1998 to help workers receive job training in green industry sectors and occupations as well as access green career pathways GJIF is seeking to increase the number of individuals completing training programs who receive industry-recognized credentials and to increase the number of individuals completing training programs for employment in green jobs
With these grants the Department is emphasizing two key workforce programs that move participants along green career pathways by 1) forging linkages between Registered Apprenticeship and pre-apprenticeship programs andor 2) integrating the delivery of technical and basic skills training through community-based partnerships The grantees are building on existing programs that are already established and serving workers and moving workers into and along green career pathways The Green Jobs Innovation Fund (GJIF) grants are all anticipated to end by June 30 2015
Quarter Highlights The Jobs for the Future (JFF) GreenWays grant program made great progress toward their goal of increasing access for women to enter higher-paying non-traditional occupations Women currently comprise 254 of the programs total enrollment and are earning higher placement wages overall than men At the same time their completion rates credential attainment rates and job placement rates lag behind those of men reflecting the ongoing challenges that women experience in non-traditional occupations The JFF GreenWays program continues to focus on raising the visibility of this issue as a key element in regional approaches to addressing poverty in female-headed households
Program Performance
Performance Measure Cumulative
Four Quarters Ending 063013
Cumulative Four Quarters
Ending 063014
Entered Employment Rate 569 642
Employment Retention Rate 750 821
Six Monthsrsquo Average Earnings $16249 $17459
Additional Program Year 2013 Quarterly Data
Performance Measure
Cumulative Four
Quarters Ending
093013
Cumulative Four
Quarters Ending
123113
Cumulative Four
Quarters Ending
033114
Entered Employment Rate 560 626 641
Employment Retention Rate 790 795 785
Six Monthsrsquo Average Earnings $16406 $15228 $15039
Cumulative Credential Outcomes in the Past Three Quarters
Performance Measure Quarter Ending
123113
Quarter Ending
033114
Quarter Ending
063014
Number Completed Education Job Training Activities
5521 6438 7076
Number Completed Training and Received Credential
5343 6242 6849
Attainment Rate 97 97 97
Analysis As of June 30 2014 8360 participants were enrolled in educationtraining Of these participants 600 participated in Registered Apprenticeship 874 participated in Pre-Apprenticeship and 40 participated in On-the-Job Training A total of 7076 participants completed educationtraining A total of 6849 participants received a credential Lastly a total of 4870 participants entered employment and of these participants 4343 entered training-related employment
26
WORKFORCE SYSTEM RESULTS
Dec-13 Mar-14 Jun-14
100 $27000
$2600080
$2500060
$24000 40
$23000
20 $22000
0 $21000
n Entered Employment Rate n Employment Retention Rate n Six Months Average Earnings
H-1B Jobs and Innovation Accelerator Challenge Grants httpwwwdoletagovETA_News_Releases20111398cfm
Program Description The Jobs and Innovation Accelerator Challenge (Jobs Accelerator) is designed to help regions achieve the demonstrated benefits of collaborative cluster-based regional development This initiative represents the implementation of Administration policy priorities to accelerate bottom-up innovation in urban and rural regions as opposed to imposing ldquoone-size-fits-allrdquo solutions The Jobs Accelerator also meets Administration goals for smarter use of government resources through reduction of Federal silos and promotion of coordinated Federal funding opportunities that offer more efficient access to Federal resources Investments from Federal agencies for the Jobs Accelerator projects include The US Department of Laborrsquos Employment and Training Administration (DOL-ETA) the US Department of Commercersquos Economic Development Administration (DOC-EDA) and the National Institutes of Standards and Technologyrsquos Hollings Manufacturing Extension Partnership (NIST-MEP) the Small Business Administration (SBA) the Department of Energy Advanced Manufacturing Office (DOE AMO) and the Delta Regional Authority (DRA)
The objectives of the Jobs Accelerator are to
bull Accelerate the formation of new high-growth businesses and expansion of existing businesses
bull Accelerate the creation of higher-wage jobs bull Advance commercialization of research including Federally-funded research bull Support deployment of new processes new technologies and new products to grow sales
and generate employment bull Enhance the capacity of small businesses in the cluster including small and disadvantaged
businesses bull Increase exports and business interaction with international buyers and suppliers bull Develop the skilled workforce needed to support growing clusters and bull Ensure diverse workforce participation in clusters through outreach training and the
creation of career pathways
Quarter Highlights The Northeast Ohio Speed-To-Market Accelerator (STMA) program administered by Lorain County Community College aims to accelerate the speed-to-market for near production or pilot production prototypes stimulate job creation and increase the global competitiveness of cluster companies attract private capital and attract students incumbent workers and the unemployed
This quarter STMA helped accelerate the introduction of a new dry electrode product for heart monitoring This sensor and electronics will be introduced as part of the next generation of wearable human performance arm band from Pittsburgh based Body Media a subsidiary of Jawbone Further STMA continues to bring new companies into the STMA
program through cluster outreach activities and this quarter three new leads were generated as the result of the existing STMA partners MAGNET JumpStart Lorain County Community College and NorTech
Program Performance
Performance Measure Four Quarters
Ending 123113 Four Quarters
Ending 033114 Four Quarters
Ending 063014
Entered Employment Rate 307 283 359
Employment Retention Rate 907 925 927
Six Monthsrsquo Average Earnings $23310 $22953 $26682
Performance in the Past Three Quarters
Analysis A total of 3702 individuals were served 3632 individuals began educationjob training activities and 2052 individuals completed educationjob training services Of participants completing educationjob training 370 unemployed individuals completed training and entered employment and of these 114 individuals entered training-related employment A total of 204 employed individuals completed training and retained their current position and of these 85 employed individuals completed training and advanced into a new position A total of 2006 individuals completed educationtraining activities and received credentials and of these 2273 total credentials were awarded
This data represents three rounds of the for Jobs Accelerator initiative which includes the Jobs Accelerator Round 1 the Advanced Manufacturing Jobs Accelerator Round 2 and the Make it in America (MIIA) Jobs Accelerator grants program
27
WORKFORCE SYSTEM RESULTS
100 $56000
80 $54000
$52000 60 $50000
40 $48000
$46000 20
$44000
0 $42000 Dec-13 Mar-14 Jun-14
n Entered Employment Rate n Employment Retention Rate n Six Months Average Earnings
H-1B Technical Skills Training Grants httpwwwdoletagovbusinessH1B_Tech_Skillscfm
Program Description The H-1B Technical Skills Training (TST) Grants were authorized by the American Competitiveness and Workforce Improvement Act of 1998 (ACWIA) as amended (29 USC 2916a) to provide education training and job placement assistance in the occupations and industries for which employers are using H-1B visas to hire highly-skilled foreign workers on a temporary basis and the related activities necessary to support such training The H-1B TST Grant Program is intended to raise the technical skill levels of American workers so they can obtain or upgrade employment in high-growth industries and occupations Over time these education and training programs will help businesses reduce their use of skilled foreign professionals permitted to work in the US on a temporary basis under the H-1B visa program The grants represent significant investments in sectors such as information technology advanced manufacturing and health care In addition these grants will focus on serving participants who have been identified as long-term unemployed particularly those who have been unemployed the longest These grants also have an emphasis on providing on-the-job training allowing participants to learn new skills while earning a pay check To date ETA has announced two rounds of TST grants totaling $342 million The first round was announced on October 4 2011 and the second round was announced on February 22 2012
Quarter Highlights The Los Angeles HealthWorks On-the-Job training (OJT) initiative administered by Managed Career Solutions Inc (MCS) provides individuals with training that leads to industry recognized credentials and employment opportunities within the regionrsquos healthcare field MCS maintains several strong partnerships to coordinate outreach recruitment training OJT placements and employment opportunities As of June 30 2014 MCS served nearly 800 long-term unemployed participants and overall 1100 participants In the same period over 650 individuals completed training and earned an industry recognized credential Of those completers 128 were employed at participation however the majority were underemployed and gained the necessary job skills and credentials that allowed 80 percent to advance into a new position In recognition MCS received the Malcom Baldrige and State Eureka awards
Analysis bull 52532 individuals were served and 51071 individuals began educationjob training
activities bull 15185 individuals completed educationjob training activities including 3321 unemployed
individuals who completed training and entered employment bull Of these 2925 individuals entered training-related employment 2902 employed individuals
completed training and retained their current position 1452 employed individuals completed training and advanced into a new position
bull 11944 individuals completed educationjob training activities and received credentials with 14099 total credentials awarded
Program Performance
Performance Measure
Four Quarters
Ending 123113
Four Quarters
Ending 033114
Four Quarters
Ending 063014
Entered Employment Rate 778 725 675
Employment Retention Rate 993 944 926
Six Monthsrsquo Average Earnings $54683 $50833 $46245
Since the H-1B TST program provides training to incumbent unemployed and long-term unemployed workers to prepare them for jobs in a variety H-1B industries andor occupations the Entered Employment Rate and Six Monthsrsquo Average Earnings can vary For the quarter ending on June 30 2014 the H-1B TST program saw a decline in the Entered Employment Rate and Six Monthsrsquo Average Earnings in comparison with the results for the previous rolling four quarters Previous results reflected a large number of incumbent workers who enrolled in short-term high-skilled training and exited early leading to a relatively high Six Monthsrsquo Average Earnings As the projects progress unemployed and long-term unemployed workers who required longer-term training begin to exit the program and search for jobs Ultimately as they enter employment wages may be less than those achieved by the higher-skilled incumbent workers who either retain or advance in their positions after training
Performance in the Past Three Quarters
28
WORKFORCE SYSTEM RESULTS
100 $21000
$19000 80
$17000
$1500060 $13000
40 $11000
$900020
$7000
0 $5000Sep-12 Dec-12 Mar-13 Jun-13 Sep-13 Dec-13 Mar-14 Jun-14
n Entered Employment Rate n Employment Retention Rate n Six Months Average Earnings
Community-Based Job Training Grants (CBJT) httpwwwdoletagovbusinessCommunity-BasedJobTrainingGrantscfm
Program Description Community-Based Job Training Grants (CBJT) seek to strengthen the role of community colleges in promoting the United States workforcersquos competitiveness The program does this by building the capacity of community colleges to train workers in skills required to succeed in regionally based high-growth high-demand industries and occupations Important grant activities include training in the healthcare biotech advanced manufacturing energy automotive transportation construction insurance forestry and aerospace industries The first round of CBJT grants were awarded in October 2005 To date ETA has announced five rounds of CBJT grants awarding 320 grants to community colleges and other organizations All CBJT grants ended as of June 30 2014
Quarter Highlights The 14 remaining projects active in this quarter represent the culmination of another successful DOL initiative Some of the significant accomplishments include the development and sustainability of Roane State Community Collegersquos Lean Manufacturing program designed to meet the needs of local manufacturing employers the San Jacinto Community College Districtrsquos Gulf Coast Healthcare Partners project which developed training to support healthcare career and Central Arizona Collegersquos Pinal County Alternative Energy Project More than half of the CBJT participants who began education and training activities completed their programs 79 percent of them received an industry recognized credential ie certificate or degree Eighty-four percent of the participants who gained employment entered into new training-related positions
Program Performance
Performance Measure Four Quarters
Ending 063013 Four Quarters
Ending 063014
Entered Employment Rate 572 662
Employment Retention Rate 891 899
Six Monthsrsquo Average Earnings $18675 $17027
Additional Program Year 2013 Quarterly Data
Performance Measure
Four Quarters
Ending 093013
Four Quarters
Ending 123113
Four Quarters
Ending 033114
Entered Employment Rate 57 605 655
Employment Retention Rate 891 897 891
Six Monthsrsquo Average Earnings $18675 $18285 $16642
Performance in the Past Eight Quarters
Analysis bull 268359 individuals have been served through the initiative bull 258216 individuals began educationjob training activities bull 165264 individuals completed educationjob training activities Of these
bull 131107 individuals received credentials bull 65089 individuals entered new positions of employment and 54344 individuals entered new
positions of training-related employment
Note All data are cumulative Prior to new reporting requirements implemented in the quarter ending December 31 2011 grantees only reported results for individuals that entered employment and individuals that entered training-related employment (noted above) if those participants entered employment and completed training in the same quarter As a result prior to that quarter participants that entered employment in quarters after they completed training were captured in the Common Measures and the total number of individuals that ultimately entered employment and training-related employment are actually higher than the results above indicate
29
WORKFORCE SYSTEM RESULTS
100 92
7880
5760
40
20
0
n Percent of Target Number of Programs Launched by Round
Round 1 Round 2 Round 3
Trade Adjustment Assistance Community College and Career Training (TAACCCT) Grants httpwwwdoletagovtaaccct
Program Description The Trade Adjustment Assistance Community College and Career Training (TAACCCT) Grant Program is authorized by the Trade Act of 1974 under Chapter 4 of Title II The purpose of this grant program is to provide eligible institutions of higher education with funds to expand and improve their ability to deliver education and career training programs that can be completed in two years or less and that result in skills degrees and credentials that prepare program participants for employment in high-wage high-skill occupations and are suited for workers who are eligible for training under the Trade Adjustment Assistance (TAA) for Workers program under Chapter 2 of Title II of the Trade Act The TAACCCT Grant Program is funded under the Health Care and Education Reconciliation Act of 2010 which appropriated $500 million for the program for each of Fiscal Years 2011-2014 for a total of $2 billion
Round 1 ndash FY 2011 Grants On June 30 2014 grants awarded in Round 1 (FY 2011) had completed all but one quarter of their periods of performance By the end of their final year of the grant the forty-nine (49) Round 1 grantees project that they will offer a total of 906 new programs of study As of June 30 2014 grantees began offering 834 (92 percent) of these programs of study
Round 2 ndash FY 2012 Grants The seventy-nine (79) grants awarded in the Fiscal Year 2012 had completed seven quarters of their grants at the end of June 30 2014 Their period of performance began on October 1 2012 and will end on September 30 2016 however their final year will be dedicated to gathering information and data for reporting outcome measures and completing the requirements for a third-party evaluation They project that by the end of the third year they will have launched 761 programs As of the end of June 30 2014 they had began offering 561 (78 percent) of these programs
Round 3 ndash FY 2013 Grants Grants awarded in FY 2013 had completed the first three quarters of their period of performance Their grants began on October 1 2013 and will end on September 30 2017
In their third year they will have launched all of their programs as their final year will be dedicated to collecting follow up data for evaluation and reporting purposes only The fifty-seven (57) grantees plan to launch 551 programs As of June 30 2014 they had already launched 288 (57 percent) of these programs
Percentage of Target Number of Programs Launched as of June 30 2014 by Grant Round
Performance Information Programmatic data is collected at different intervals throughout the period of performance including
bull Quarterly Narrative Progress Reports (QNPR) Grantees will provide quarterly qualitative data on the capacity building taking place through progress and other implementation measures that grantees defined in their Statements of Work
bull Annual Performance Reports (APR) Grantees will provide annual quantitative data on their training and employment outcomes for TAACCCT program participants that are impacted by the capacity building activities being implemented by their grants
30
WORKFORCE SYSTEM RESULTS
$4500000 3500$4000000 3000$3500000
2500
Jun-13 Dec-13 Mar-14 Jun-14
Amou
nt $3000000 2000$2500000
$2000000 1500 $1500000 1000 $1000000
500$500000 $0 0
n Amount of Revenue Generated n Number of Tickets Assigned
Disability Employment Initiative (DEI) httpwwwdoletagovdisability
Program Description All DEI Workforce Employment Network (EN) Trends
Launched in 2010 the Disability Employment Initiative (DEI) seeks to improve education training and employment opportunities for youth and adults with disabilities who are unemployed underemployed andor receiving Social Security disability benefits The DEI is jointly funded by the US Department of Laborrsquos Employment and Training Administration and Office of Disability Employment Policy DEI projects improve collaboration among employment and training and asset development programs implemented at state and local levels including the Social Security Administrationrsquos Ticket to Work Program and build effective partnerships that leverage resources to better serve individuals with disabilities and improve employment outcomes
Quarter Highlights A variety of Department of Labor programs helped Vietnam-era veteran Richard James navigate through life After servicing B-52 bombers in the Air Force James held a series of sales jobs while putting himself through law school at night He rose to become a successful New England attorney and owner of a boat dock building company when he suffered a terrible head injury which caused spine and nerve damage Addiction to pain medication followed and James ended up homeless While recovering from his injuries James took a college course through the Veterans Retraining Assistance Program managed in part by the Department He received career counseling from a Disabled Veterans Outreach Program representative at a local American Job Center and support from the DEI Disability Resource Coordinator Eventually James was hired as an attorney by a Rhode Island law firm The departments grants and programs made possible the services that put me back in a position of being a productive member of society he said
Program Performance
Performance Measure Quarter Ending 63013
Quarter Ending
123113
Quarter Ending 33114
Quarter Ending 63014
Analysis bull The Exit Rate for Adult and Youth exiters with disabilities in Round one DEI sites is almost
double the national average Adult DEI was 89 percent vs All StatesAll LWIAs 49 percent Older Youth DEI 166 percent vs All StatesAll LWIAs 87 percent Younger Youth DEI 339 percent vs All StatesAll LWIAs 151 percent
bull The CredentialSkill Attainment Rate for older and younger youth with disabilities in Round 1 DEI sites was higher than the national average Older Youth DEI credential rate 568 percent vs All StatesAll LWIAs 383 percent Younger Youth DEI skill rate 902 percent vs All States All LWIAs 834 percent
bull The Exit Rate for Adult and Youth exiters with disabilities in Round two DEI sites is higher than the national average Adult DEI 56 percent vs All StatesAll LWIAs 49 percent Older Youth DEI 163 percent vs All StatesAll LWIAs 87 percent and Younger Youth DEI 167 percent vs All StatesAll LWIAs 151 percent
bull The Entered Employment Rate for Adult DEI sites 657 percent is 20 percent higher than in All StatesAll LWIAs 434 percent
bull DEI Workforce Employment Networks (EN) activity shows that the number of Tickets assigned increased from 1780 to 2903 an increase of 1123 and the amount of revenue
Number of Tickets Assigned 1780 1590 2554 2903 generated from DEI EN payments increased from $2373404 to $4057353 an increase of $168 million Amount of Revenue Generated $2373404 $1927104 $3505582 $4057353
31
WORKFORCE SYSTEM RESULTS
ETA Internet-Based Assistance (E-TOOLS) wwwcareerinfonetorg wwwservicelocatororg wwwcareeronestoporg wwwonetonlineorg wwwmyskillsmyfutureorg wwwmynextmoveorg
Program Description Additional Program Year 2013 Quarterly Data
Performance Measure Quarter Ending
093013
Quarter Ending
123113
Quarter Ending
033114
CareerOneStop Portal Visits 5754645 5159240 5340022
ETArsquos Internet-based assistance includes electronic tools that help individuals explore career opportunities and link to job postings either on their own or at local American Job Centers to make informed employment and education choices
The Web sites feature user-friendly occupation and industry information salary data career videos education resources career exploration assistance and other resources that support talent development in todayrsquos fast-paced global marketplace Users can find information some of which is also industry sponsored about occupations that are in-demand in high growth industries Additionally information is available regarding occupational skills and workplace competencies
Quarter Highlights For the year ending June 2014 CareerOneStop launched a new portal for Ex-Offenders added Federal Contractor job tagging a TAACCCT information finder Youth Council information to Americarsquos Service Locator and began working on adding more job feeds
Americarsquos Service Locator (ASL) Visits
730998 758919 724053
ONET Downloads 26646 29407 28505
ONET Visits 7697608 10211177 11500039
Combined Visits 14183251 16129336 17564114
Performance in the Past Eight Quarters
25000000 $36000
Sep-12 Dec-12 Mar-13 Jun-13 Sep-13 Dec-13 Mar-14 Jun-14
n Combined Visits (in millions) n ONET Product Downloads (in thousands)
$31500 20000000
ONE
T Pr
oduc
t Dow
nloa
ds
$27000
Com
bine
d Vi
sits
$2250015000000 $18000
10000000 $13500
$90005000000
$4500
$00
ONET has added web services for developers and increased the available Tools and Technology and Detailed Work Activities information to convey specialized occupational attributes
Program Performance
Performance Measure Quarter
Ending 063013 Quarter
Ending 063014
CareerOneStop Portal Visits 5104850 5472742
Americarsquos Service Locator (ASL)Visits
747114 802148
ONET Downloads 29482 25278
ONET Visits 8716609 13581922
Combined Visits 14568573 19856812
Analysis bull ETA Internet-Based Assistance received 19856812 combined visits for the quarter ending
June 30 2014 an increase of 36 percent over the same period in 2013 bull Visits to CareerOneStop increased to 5472742 or 72 percent over the same period in 2013
with mySkillsmyFuture continuing to be a popular tool with an increase of 23 percent bull Americarsquos Service Locator Visits traffic increased 74 percent over the same period in 2013 bull The ONET traffic received 13581922 visits in this quarter an increase of 558 percent
over the same period in 2013 and the ONET downloads totaled 25278 for the quarter a decrease of 142 percent
32
WORKFORCE SYSTEM RESULTS
Glossary of Performance Measures
Common Performance Measures Common Performance Measures are used by Workforce Investment Act Indian and Native American Program Disability Program Navigator Initiative Wagner-Peyser Trade Adjustment Assistance Senior Community Service Employment Program Reintegration of Ex-Offenders Registered Apprenticeship Program Job Corps National Farmworker Jobs Program High Growth Job Training Initiative and Community-Based Job Training Grants
Adult Measures Entered Employment Of those who are not employed at the date of participation the number of adult participants who are employed in the first quarter after the exit quarter divided by the number of adult participants who exit during the quarter
Employment Retention Of those who are employed in the first quarter after the exit quarter the number of adult participants who are employed in both the second and third quarters after the exit quarter divided by the number of adult participants who exit during the quarter
Six Monthsrsquo Average Earnings Of those adult participants who are employed in the first second and third quarters after the exit quarter total earnings in the second quarter plus the total earnings in the third quarter after the exit quarter divided by the number of adult participants who exit during the quarter
Average Earnings Change in Six Months1
Of those who are employed in Q1 after exit the total post-program earnings (earnings in Q2 + Q3 after exit) minus pre-program earnings (earnings in Q2 + Q3 prior to registration) divided by the number of adults who exit during the quarter
Youth Measures Attainment of a Degree or Certificate Of those enrolled in education (at the date of participation or at any point during the program) the number of youth participants who attain a diploma GED or certificate by the end of the third quarter after the exit quarter divided by the number of youth participants who exit during the quarter
1 This definition was used for earnings in PY 2005 Q=quarter
33
Literacy and Numeracy Gains Of those out-of-school youth who are basic skills deficient the number of youth participants who increase one or more educational functioning levels divided by the number of youth participants who have completed a year in the program (ie one year from the date of first youth program service) plus the number of youth participants who exit before completing a year in the program
Placement in Employment or Education2
Of those who are not in postsecondary education or employment (including the military) at the date of participation the number of youth participants who are in employment (including the military) or enrolled in postsecondary education andor advanced trainingoccupational skills training in the first quarter after the exit quarter divided by the number of youth participants who exit during the quarter
Program-Specific Performance Measures
Disability Employment Initiative (DEI) Number of Tickets Assigned Number of individuals on Social Security Administration (SSA) disability benefits who assigned their Ticket to the workforce board agency or American Job Center as their designated Employment Network under the SSA Ticket to Work program All DEI pilot sites must become an Employment Network under Ticket to Work
Amount of Revenue Generated Under the SSA Ticket to Work program when jobseekers who receive SSA disability benefits assign their Ticket to a workforce board agency or American Job Center as an Employment Network and then achieve certain employment milestones the Employment Network receives money or ldquoTicket revenuerdquo
2 Because of its intensity and duration the YouthBuild performance measure for placement in employment or education does not exclude those who entered the program with a job or in college
WORKFORCE SYSTEM RESULTS
Foreign Labor Certification Percent of H-1B Applications Resolved in Seven Business Days This estimate is based on the total number of applications processed within seven business days divided by the total number of applications processed for a given reporting period An application is considered processed if the last significant event is (1) certified (2) denied or (3) withdrawn
Average Number of Days to Resolve PERM Applications Not Subject to Integrity Review The average processing time between case receipt and decision date for non-audited cases
Average Number of Days to Resolve PERM Applications Subject to Integrity Review The average processing time between case receipt and decision date for audited cases
Percent of Complete H-2A Employer Applications Resolved within 30 Days Before the Date of Need This estimate is based on the total number of complete applications resolved within 30 days before the date of need divided by the total number of applications processed for a given reporting period
Percent of H-2B Applications Processed Within 30 Days of Receipt This estimate is based on the total number of applications processed within 30 days of receipt divided by the total number of applications processed for a given reporting period An application is considered processed if the last significant event is (1) certified (2) denied or (3) withdrawn
Indian and Native American Youth Attainment of Two or More Goals The total number of youth participants enrolled in the Granteersquos Supplemental Youth Services Program who attained at least two of the 14 goals listed below divided by the total number of Supplemental Youth Services participants enrolled during the report period The 14 goals include
1 Completed Job ReadinessOrientation to the World of Work Training 2 Completed Internship or Vocational Exploration Program
3 Completed Career Assessment 4 Entered Unsubsidized Employment 5 Remained in School 6 Returned to School Full Time 7 Enrolled in Job Corps 8 Improved Basic Skills Level By At Least Two Grades 9 Attained High School Diploma 10 Attained GED 11 Completed Occupational Skills Training 12 Completed Leadership Skills Training 13 Entered Other (Non-Supplemental Youth) Training Program 14 Summer Employment
Educational Attainment for Dropouts The number of dropouts who have obtained a high school diploma GED or increased their literacy and numeracy by two grade levels divided by the total number of dropouts
Job Corps Measures Placement in Employment or Education Percent of Job Corps participants3 entering employment or enrolling in post-secondary education andor advanced skills trainingoccupational skills training in the first quarter after exit from the program
Attainment of a Degree or Certificate Percent of students who attain a GED HSD or certificate
Literacy Numeracy Gains Percent of students who achieve literacy or numeracy gains of one or more Adult Basic Education (ABE) levels
3 Calculation of the Placement rate measure does not include outcomes for students who participated in the program for less than 60 days
34
WORKFORCE SYSTEM RESULTS
Internet-Based Assistance Web Site Visits ETArsquos Internet-based assistance includes electronic tools that help individuals make informed employment and education choices The measure for tracking the overall performance and usage of these tools is Web site visits A visit is defined as a series of page requests from the same uniquely identified client with a time of no more than 30 minutes between each page
request
ONet Product Downloads The ONET product downloads count the number of unique users who download an ONET online resource (wwwonetcenterorg) which includes the ONET database (all versions) ONET technical reports (such as on green jobs) supplemental data files (lay titles tools and technology) the ONET Career Exploration Tool files ONET Survey questionnaires and other related materials such as the Toolkit for Business
Registered Apprenticeship Program Entered Employment Rate Percent of apprentices employed in the first quarter after exit who either completed or cancelled from their Registered Apprenticeship Program
Employment Retention Rate Percent of apprentices employed in the first quarter after exit still employed in the second and third quarter after exit who either completed or cancelled from their Registered Apprenticeship Program
Six Monthsrsquo Average Earnings Six month Average Earnings of apprentices employed in the first quarter after exit still employed in the second and third quarter after exit who either completed or cancelled from their Registered Apprenticeship Program
Reintegration of Ex-OffendersmdashAdult Program Recidivism Rate The percentage of participants who are rearrested for a new crime or re-incarcerated for revocation of a parole or probation violation within one year from release from prison
Senior Community Service Employment Program Service Level The count of participants during the report period divided by the total number of authorized grantee community service positions
Community Service The number of community service hours as reported by each grantee divided by the total community service hours funded for the grantee adjusted for minimum wage differences among the states
Most-in-Need Most-in-need means participants with one or more of the following characteristics have a severe disability are frail are age 75 or older are age-eligible but not receiving benefits under Title II of the Social Security Act reside in an area with persistent unemployment and have severely limited employment prospects have limited English proficiency have low literacy skills have a disability reside in a rural area are Veterans have low employment prospects have failed to find employment after utilizing services provided under Title I of the Workforce Investment Act of 1998 (29 USC 2801 et seq) or are homeless or at risk for homelessness (sect 513(b)(1)(E) as amended by Pub L No 109-365)
Unemployment Insurance Percent of Payments Made Timely The percentage of intrastate Unemployment Insurance benefit first payments for full weeks of unemployment issued within 14 days following the first compensable week in states with a waiting week and 21 days in non-waiting week states
Detection of Recoverable Overpayments The amount of overpayments (dollars) established through state operations as a percent of the estimated amount states can detect and establish for recovery
Entered Employment Rate The percent of persons receiving a first payment in a given quarter who had earnings in the next quarter
Percent of Employer Tax Liability Determinations Made Timely The percent of new employer determinations made within 90 days of the end of the quarter in which employers became liable to pay unemployment taxes
35
WORKFORCE SYSTEM RESULTS
YouthBuild Attainment of a Degree or Certificate Of those enrolled the number of youth participants who attain a diploma high school equivalency degree or industry-recognized certificate by the end of the third quarter after the exit quarter divided by the number of youth enrolled (minus youth exited for other reasons)
Literacy and Numeracy Gains Of those youth participants who are basic skills deficient at enrollment the number of youth participants who increase one or more educational functioning levels within one year of enrollment divided by the number of youth participants who have completed a year in the program
Placement in Employment or Education The number of youth participants who are in employment (including the military) or are enrolled in post-secondary education andor advanced trainingoccupational skills training in the first quarter after the exit quarter divided by the number of youth participants who exited during the previous quarter
Youthful Offender Projects Placement Rate The placement rate is the percentage of out-of-school youth ages 18 and above placed in unsubsidized jobs occupational training post-secondary education or the military
Recidivism Rate The recidivism rate is the percentage of youth offenders who have been convicted of a new crime within 12 months of their release of a correctional facility or being placed on probation
36
WORKFORCE SYSTEM RESULTS
2471 American Job Centers formerly known as One-Stop Career Centers
12 VT
9 HI
1 GU
6 DC
2 VI
15 NE
16 SD
12 ME
19 IA
19 AK
19 WV
4 DE
47 AL
55 CO
48 MN
57 WI
89 NC
60 GA
31 MA
23 NM
16 ND
47 AR
70 PA
18 CT 4 RI
12 NV
20 WY
22 KS
18 PR
89 OH
69 TN
102 FL
59 AZ 46
SC
12 NH
29 NJ
52 VA
22 MT
33 OK
39 MS
59 WA
61 IL 34 MD
47 OR
131 KY
62 LA
83 IN
33 UT
44 MO
26 ID 90
NY95 MI
1 to 25
25 to 50
50 to 75
75 to 100
Over 100
203 CA
180 TX
Source Americarsquos Service Locator (wwwServiceLocatororg) Americarsquos Service Locator connects individuals to employment and training opportunities available at local American Job Centers The Web site provides contact information for a range of local work-related services including unemployment benefits career development and educational opportunities As of March 17 2015
37
WORKFORCE SYSTEM RESULTS
United States Department of Labor
200 Constitution Avenue NW
Washington DC 20210
wwwdolgov
- A9RFAFEtmp
- DOL_Workforce_Rprt_Jun_2014_51415-dp
-
- Workforce System Results
-
- Contents
- Quarterly Spotlight
- People Served by Program
- Current Appropriations
- Government Performance and Results Act Goals (GPRA)
- Indian and Native American Adult Program (INAP)
- National Farmworker Jobs Program (NFJP)
- Senior Community Service Employment Program (SCSEP)
- Wagner-Peyser Employment Service
- Workforce Investment Act Adult Program
- Workforce Investment Act Dislocated Worker Program
- H-1B and Permanent Foreign Labor Certification (PERM)
- H-2A and H-2B Foreign Labor Certification Programs
- Reintegration of Ex-Offenders (RExO-ADULT)
- Registered Apprenticeship
- Registered Apprenticeship
- Trade Adjustment Assistance (TAA)
- Unemployment Insurance (UI)
- Unemployment Insurance (UI)
- Job Corps
- Workforce Investment Act Youthful Offender Initiative
- Workforce Investment Act Youth Program
- YouthBuild
- Indian and Native American Youth Program
- H-1B Jobs and Innovation Accelerator Challenge Grants
- H-1B Technical Skills Training Grants
- Community-Based Job Training Grants (CBJT)
- Trade Adjustment Assistance Community College and Career Training (TAACCCT) Grants
- Disability Employment Initiative (DEI)
- ETA Internet-Based Assistance (E-TOOLS)
- Glossary of Performance Measures
- 2471 American Job Centers formerly known as One-Stop Career Centers
-

WORKFORCE SYSTEM RESULTS
100
80
60
40
20
0 Sep-12 Dec-12 Mar-13 Jun-13 Sep-13 Dec-13 Mar-14 Jun-14
$15000
$13000
$11000
$9000
$7000
$5000
n Entered EmploymentPlacement Rate n Employment Retention Rate n Six Months Average Earnings
Reintegration of Ex-Offenders (RExO-ADULT) httpwwwdoletagovRExOeta_defaultcfm
Program Description The Reintegration of Ex-Offenders ndash Adult Program (RExO-Adult) is an employment-centered program that seeks to strengthen urban communities that have large numbers of returning prisoners The program incorporates mentoring job training and other comprehensive transitional services It is designed to reduce recidivism by helping inmates find work when they return to their communities as part of an effort to improve community life
Quarter Highlights The Adult RExO Program operated three initiatives this program year
bull Grants to community and faith-based organizations to help returning offenders find employment
bull Grants aimed specifically at serving female offenders providing employment and supportive services
bull Grants to provide occupational training and job placement to offenders in Halfway Houses
Program Performance
Performance Measure Quarter Ending
063013
Quarter Ending
063014
Entered Employment Rate
58 58
Employment Retention Rate
68 72
Six Monthsrsquo Average Earnings
$9797 $9770
The data for June 30 2013 are program-to-date since the inception of the program in the Spring of 2006 The June 30 2014 numbers are program-to-date for currently operating projects
Additional Program Year 2013 Quarterly Data
Performance Measure Quarter Ending
093013
Quarter Ending
123113
Quarter Ending
033114
Entered Employment Rate
55 56
Employment Retention Rate
66 68 70
Six Monthsrsquo Average Earnings
$10036 $9962 $9736
Performance in the Past Eight Quarters
58
Analysis The Adult RExO Program served 6308 participants this program year
bull Adult RExO Grantees reported 3404 enrollees receiving training or education bull Adult RExO Grantees reported 2555 enrollees receiving a certificate bull The recidivism rate largely reflects the extent to which the program is serving persons
at high or low risk of re-offending
15
WORKFORCE SYSTEM RESULTS
Registered Apprenticeship httpwwwdoletagovoa
Program Description Registered Apprenticeship is a leader in preparing American workers to compete in a global 21st Century economy With a network of over 150000 employers in more than 1000 occupations Registered Apprenticeship has already trained millions of Americarsquos workers Modern apprenticeships are now on the cutting edge of innovation in preparing a skilled workforce for todayrsquos industries including expanding industries like health care information technology transportation telecommunications and advanced manufacturing as well as in industries like construction where apprenticeships have a long and successful history
Quarter Highlights During the summer of 2014 the White House hosted the first-ever Summit on Apprenticeship to gather the best ideas and to catalyze action to dramatically increase apprenticeship in America More than 60 attendees presented their ideas including leading employers big and small like IBM Bank of America Blue CrossBlue Shield and Oberg Industries labor unions like the International Brotherhood of Electrical Workers (IBEW) training providers like Ivy Tech and Lone Star Community Colleges and local workforce leaders The event was the apex in a series of industry roundtables on apprenticeship which took place across the country during June amp July 2014
Program Performance
Performance Measure Four Quarters
Ending 063013 Four Quarters
Ending 063014
Entered Employment Rate 734 742
Employment Retention Rate 873 878
Six Monthsrsquo Average Earnings $23826 $24387
Performance Measure Quarter Ending
063013 Quarter Ending
063014
Apprentices
Total Apprentices (Active Apprentices)
148039 152582
New Apprentices 17432 17011
Programs
New Programs 139
Programs Maintained Total (Active Programs)
9809 9077
Number of new programs in Construction and Manufacturing
93
Source Registered Apprenticeship Partners Information Management Data System (RAPIDS) data managed by Department of Labor staff only 063013 data has been revised to include federal data only Running total of active apprenticesprograms during the quarter
16
177
127
WORKFORCE SYSTEM RESULTS
0
20
40
60
80
100
Sep-12 Dec-12 Mar-13 Jun-13 Sep-13 Dec-13 Mar-14 Jun-14 $5000 $7000 $9000 $11000 $13000 $15000 $17000 $19000 $21000 $23000 $25000
n Entered Employment Rate n Employment Retention Rate n Six Months Average Earnings
Registered Apprenticeship httpwwwdoletagovoa
Additional Program Year 2013 Quarterly Data
Performance Measure
Four Quarters
Ending 093013
Four Quarters
Ending 123113
Four Quarters
Ending 033114
Entered Employment Rate 735 738 738
Employment Retention Rate 874 877 878
Six Monthsrsquo Average Earnings $24171 $24324 $24378
Performance in the Past Eight Quarters
Analysis bull During the third quarter of Fiscal Year 2014 there were over 394000 active apprentices
nationwide while over 13000 program participants completed their apprenticeship and received a credential that is portable industry recognized and can provide a pathway to middle-class and sustainable careers
bull The Entered Employment Rate for participants who completed their Registered Apprenticeship program was 856 percent 114 percentage points higher than for all program exiters who either completed or cancelled (742 percent as shown in table on the previous page)
bull The Employment Retention Rate for program completers was 910 percent 32 percentage points higher than for all program exiters (878 percent as shown in table on the previous page)
bull The Six Monthsrsquo Average Earnings for program completers was $29964 which is over $5577 more than that of all program exiters (ie completers or those who cancelled) The results for those completing the program shows it pays to stay
17
WORKFORCE SYSTEM RESULTS
100
80
60
40
20
0 Sep-12 Dec-12 Mar-13 June-13 Sep-13 Dec-13 Mar-14 Jun-14
n Entered Employment Rate n Employment Retention Rate n Six Months Average Earnings
$25000
$21000
$17000
$13000
$9000
$5000
Trade Adjustment Assistance (TAA) httpwwwdoletagovtradeact
Program Description The Trade Adjustment Assistance (TAA) Program is an integral part of the comprehensive workforce development system The program is essential to helping workers dislocated by foreign trade to adjust to changing market conditions and shifting skill requirements Addressing the needs of trade-affected workers involved in this transformation is a unique challenge because in general these workers are being dislocated from relatively outdated-skill high-wage employment In many cases this is complicated by mass layoffs or plant closures that occur in single-industry towns which makes finding comparable employment in the same geographic area difficult Furthermore many of these jobs are lost permanently from the domestic economy requiring affected workers to completely retool their skills
Fiscal Year Highlights During Fiscal Year 2014 Massachusetts diligently trained staff at the local CareerOneStop Centers to ascertain a TAA participantrsquos eligibility for other funding resources to assist in their reemployment initiatives These improved efforts to provide and report reemployment services enables Trade customers to flow through the CareerOneStop Center system with other dislocated workers and receive seamless resources through the resource sharing initiatives of the Career Center methodology These streamlined reemployment services have resulted in an Entered Employment Rate of 815 percent nearly ten percentage points higher than the national average
Program Performance
Performance Measure FY 2011 FY 2012 FY 2013 FY 2014
Entered Employment Rate 653 689 716 729
Employment Retention Rate 897 913 917 911
Six Monthsrsquo Average Earnings $18319 $18837 $18099 $17828
Performance Measure Quarter Ending 063013 Quarter Ending 063014
Entered Employment Rate 733 728
Employment Retention Rate 900 927
Six Monthsrsquo Average Earnings $18210 $17692
Additional Program Year 2013 Quarterly Data
Performance Measure Quarter Ending
093013
Quarter Ending
123013
Quarter Ending
033014
Entered Employment Rate 713 713
Employment Retention Rate 918 918
Six Monthsrsquo Average Earnings $17499 $17499
Performance in the Past Eight Quarters
727
917
$17550
Analysis During Fiscal Year 2014 there were 62706 total participants receiving TAA benefits or services and 20577 exiters entered employment (729 percent) More than one-third of all participants were minorities with the average age of participants being 47 years and the average tenure being approximately 13 years 9547 exiter participants received credentials or 83 percent of all exiter participants who completed training 32527 participants received training or approximately 52 percent of all participants Lastly the program served 4828 Veteran participants accounting for approximately eight percent of all participants
18
WORKFORCE SYSTEM RESULTS
Unemployment Insurance (UI) httpouidoletagovunemploy
Program Description The federal-state Unemployment Insurance (UI) System minimizes individual and family financial hardship due to unemployment and stabilizes the economy during economic downturns by providing unemployed workers with temporary income support States operate their own Unemployment Insurance Programs regulated by State laws
As the Federal partner DOL provides program leadership allocates administrative funds provides technical assistance and exercises performance oversight
Quarter Highlights As the economy improved the system emphasized program integrity solvency and reemployment Claims rates decreased about 10 percent from the year before and Trust Fund loans decreased from $21 billion to $14 billion EUC benefit payments ceased on December 28 2013 Twenty-four states implemented Short-term Compensation programs allowing unemployed workers to stay on jobs while receiving partial unemployment benefits proportionate to reduced work hours States implemented systems to improve efficiency and reduce overpayments such as data exchange and recover UI overpayments By June 30 2014 42 states were recovering overpayments through Federal Income tax refund offset (TOP) and had recovered $370 million in 2014 (over $840 million since TOPrsquos inception)
Analysis During the year ending June 30 2014
bull 51 million UI claimants were reemployed in the quarter following their UI 1st payments (17 million in the last quarter)
bull The UI system met two and failed two of its four targets UI met detection of overpayments (643 percent vs target of 542 percent) and met reemployment (657 percent vs target of 647 percent)
bull The system fell short of its 1st pay and status targets because of retirements and other turnover of key staff
Program Performance
Performance Measure Four Quarters
Ending 063013 Four Quarters
Ending 063014
Percent of Intrastate Payments Made Timely
812 792
Detection of Recoverable Overpayments Rate
598 643
Facilitation of Reemployment Rate 6261 6552
Percent of Employer Tax Liability 888 882
Operational Results
Recipiency Rate 263 272
Exhaustion Rate 456 431
Percent of Recipients of Prime Working Age (25-54)
702 700
Percent of Recipients Who Are Female
434 437
New Initial Unemployment Insurance Claims
13906868 12501014
Number of First Unemployment Insurance Payments
8404507 7632522
Average Duration of Unemployment Insurance (Weeks)
169
1 Reemployment for year ending June 30 2013 2 Reemployment for year ending June 30 2014
19
167
WORKFORCE SYSTEM RESULTS
Unemployment Insurance (UI) httpouidoletagovunemploy
Additional Program Year 2013 Quarterly Data
Performance Measure Four Quarters
Ending 093013 Four Quarters
Ending 123113 Four Quarters
Ending 033114
Percent of Intrastate Payments Made Timely
809 802 793
Detection of Recoverable Overpayments Rate
590 630 603
Facilitation of Reemployment Rate 6311 6312 6363
Percent of Employer Tax Liability 886 885 884
Operational Results
Recipiency Rate 263 262 267
Exhaustion Rate 453 446 437
Percent of Recipients of Prime Working Age (25-54)
702 702 701
Percent of Recipients Who Are Female
434 434 435
New Initial Unemployment Insurance Claims
13559233 13340263 12947493
Number of First Unemployment Insurance Payments
8215687 7967852 7857395
Average Duration of Unemployment Insurance (Weeks)
169 169 168
1 Reemployment for year ending September 30 2013 2 Reemployment for year ending December 31 2013 3 Reemployment for year ending March 31 2014
20
WORKFORCE SYSTEM RESULTS
100
80
60
40
20
0 Sep-12 Dec-12 Mar-13 Jun-13 Sep-13 Dec-13 Mar-14 Jun-14
n Placement in Employment or Education n Attainment of a Degree or Certificate n LiteracyNumeracy Gains
Job Corps httpwwwjobcorpsgovhomeaspx
Program Description Job Corps is the nationrsquos largest residential educational and career technical training program for at-risk youth ages 16 through 24 The 125 Job Corps centers nationwide provide an integrated comprehensive array of services that include academic career technical and life skills training career planning and work-based learning health care and post-program placement and transition support
Job Corps is committed to offering all students a safe drug-free environment where they can take advantage of the resources provided Job Corpsrsquo mission is to attract eligible young people teach them the skills they need to become employable and independent and place them in meaningful jobs or further education
Program Performance
Performance Measure Four Quarters
Ending 063013 Four Quarters
Ending 063014
Placement in Employment or Education 746 767
Attainment of a Degree or Certificate 706 668
LiteracyNumeracy Gains 692 661
Additional Program Year 2013 Quarterly Data
Performance Measure
Four Quarters
Ending 093013
Four Quarters
Ending 123113
Four Quarters
Ending 033114
Placement in Employment or Education 757 760 765
Attainment of a Degree or Certificate 722 727 707
LiteracyNumeracy Gains 702 709 695
Performance in the Past Eight Quarters
The Performance in the Past Eight Quarters graph displays single quarter data versus the Program Performance tables which depict cumulative four quarter data
Quarter Highlights In May 2014 four Job Corps students from centers in Montana California Iowa and Virginia participated in the 2nd Asia-Pacific Economic Cooperation (APEC) Youth Skills Camp in Beijing and Guangzhou China the second time Job Corps students have participated in this event The camp included field visits to vocational training schools business enterprises and public practical training facilities as well as skills exchanges This international event provides students with life-changing experiences in travel diversity and first-hand exposure to global issues
Analysis bull During the current quarter Job Corps served 69979 participants including 13079 new
enrollees an increase of 801 percent overall compared to the same quarter in PY 2013 and due to the resumption of new enrollments after the PY 2012 enrollment suspensions The number of new students increased by over 200 percent from the same quarter in PY 2013
bull The proportion of 16-17 year olds served increased by 45 percentage points Conversely the proportion of all older students served similarly decreased from the same quarter in PY 2013
bull In the current quarter Job Corps placed 7203 students in Employment and Education a slight decrease of 04 percentage points compared to the same quarter last year In addition 8657 students attained a Certificate a 131 percentage point decrease compared to the same quarter in PY 2013 Also 6789 students attained a LiteracyNumeracy gain an 116 percentage point decrease over the same quarter in PY 2013
bull In the current quarter the program served 50 participants who were Veterans prior to enrollment bull When comparing the four quarter data Placement in Employment or Education increased
21 percentage points Attainment of a Degree or Certificate decreased 38 percentage points and LiteracyNumeracy Gains decreased 31 percentage points from the same quarter one year ago 21
WORKFORCE SYSTEM RESULTS
100
80
60
40
20
0 Sep-12 Dec-12 Mar-13 Jun-13 Sep-13 Dec-13 Mar-14 Jun-14
n Placement Rate for Out-of-School Youth Ages 18 and Above n Recidivism Rate for Youth Ages 14 to 17 n Recidivism Rate for Youth Ages 18 and Above
Workforce Investment Act Youthful Offender Initiative httpwwwdoletagovYouth_servicesyouthful_offendercfm
Program Description The Employment and Training Administration uses its Youthful Offender Appropriation to fund a variety of projects that target youth offenders and young adult offenders Currently operating projects include grants to community-based organizations to involve juvenile offenders in training and service learning projects grants to intermediary organizations to serve young offenders in high-poverty high-crime communities and grants to help youth enter diversion programs as an alternative to out-of-home placements and to assist eligible youth have their juvenile records sealed or expunged
Quarter Highlights The great majority of juvenile offenders are of ages 17 and below and many are still in high school The youth offender grants focus on helping younger youth stay in school and complete their education and helping older youth find jobs and succeed in the labor market Case management mentoring and supportive services are also provided by these grants
Performance in the Past Eight Quarters
Program Performance
Performance Measure Four Quarters
Ending 063013 Four Quarters
Ending 063014
Placement Rate for Youth Ages 18 and Above
36 362
Recidivism Rate for Youth Ages 14 to 17
35 24
Recidivism Rate for Youth Ages 18 and Above
34 16
Results are cumulative for currently operating grants
Additional Program Year 2013 Quarterly Data
Placement Rate for Youth Ages 18 and Above
277 334 325
Performance Measure
Four Quarters
Ending 093013
Four Quarters
Ending 123113
Four Quarters
Ending 033114
Recidivism Rate for Youth Ages 14 to 17
349 349 349
Recidivism Rate for Youth Ages 18 and Above
335 335 335
Analysis bull Providing opportunities to youthful offenders results in varying outcomes depending on
the mix of projects being operated in a given year bull Projects have markedly different placement and recidivism rates depending on whether
they are serving young adults in their 20s or youth ages 16-17 they recruit youth in the community or through direct referrals from the juvenile justice system whether they are located in small or large cities and the extent to which enrollees are at high or low risk of re-offending
22
WORKFORCE SYSTEM RESULTS
100
80
60
40
20
0 Jun-12 Jun-13 Jun-14
n Placement in Employment or Education n Attainment of a Degree or Certificate n LiteracyNumeracy Gains
Workforce Investment Act Youth Program httpwwwdoletagovyouth_services
Program Description The Workforce Investment Act Youth Formula Program provides employment and education services to eligible low-income youth ages 14 to 21 who face barriers to employment The program serves in-school and out-of-school youth youth with disabilities and low literacy rates as well as others who may require additional assistance to complete an educational program and acquire an industry-recognized credential or enter employment
Quarter Highlights The passage of the Workforce Innovation and Opportunity Act (WIOA) includes a major shift in focus to spending more funds on and serving more out-of-school youth (OSY) The workforce system demonstrated its readiness for this shift in that 48 percent of all youth served in PY 2013 were OSY and 57 percent of all WIA youth local area funds were spent on OSY So far in Program Year 2013 California has spent almost 65 percent of their WIA youth funds on OSY with high levels of OSY expenditures in both urban and rural areas 53 percent of all youth served in CA in Program Year 2013 were OSY For example Los Angeles City spent 80 percent of their funds on OSY and the Northern Rural Training and Employment Consortium spent 76 percent of their funds on OSY Both local areas have achieved these levels through strong partnerships with organizations that serve OSY as well as access to high quality work experiences
Program Performance
Performance Measure
Four Quarters
Ending 063012
(Program Year 2011)
Four Quarters
Ending 063013
(Program Year 2012)
Four Quarters
Ending 063014
(Program Year 2013)
Placement in Employment or Education 589 666 690
Attainment of a Degree or Certificate 648 675 684
LiteracyNumeracy Gains 476 509 525
Performance in the Past Three Program Years
Analysis bull 197045 participants were served in the cumulative four quarter reporting period compared
to 217244 served during the same time period last year This decrease is due primarily to a lower funding level compared to the previous year
bull Placement in Employment or Education achieved a result of 690 percent a 24 percentage point increase when compared with the same time period last year
bull The program achieved a result of 684 percent for the Attainment of a Degree or Certificate measure This is a 09 percentage point increase from the same time period last year
bull The LiteracyNumeracy Gains measure achieved a result of 525 percent an increase of 16 percentage points when compared with the same time period last year
bull All three youth common measures exceeded Program Year 2013 GPRA goals
23
WORKFORCE SYSTEM RESULTS
100
80
60
40
20
0 Sep-12 Dec-12 Mar-13 Jun-13 Sep-13 Dec-13 Mar-14 Jun-14
n Placement in Employment or Education n Attainment of a Degree or Certificate n LiteracyNumeracy Gains
YouthBuild httpwwwdoletagovyouth_servicesyouthbuildcfm
Program Description YouthBuild provides job training and educational opportunities for at-risk youth ages 16 to 24 while constructing or rehabilitating affordable housing for low-income or homeless families in their own neighborhoods The youth split their time between the construction site and the classroom where they earn their high school diploma or equivalency learn to be community leaders and prepare for college and other post-secondary training opportunities
Analysis bull 33392 participants have been enrolled into the YouthBuild program since 2007 and 29553
have exited so far bull Since the program began a total of 11716 participants have received a high school
diploma or equivalency 17572 have attained an industry-recognized certificate and 21835 have been placed into initial jobs post-secondary education andor long-term vocational occupational skills training including apprenticeship
bull The Class of 20102011 performance steadily increased The outcomes for all three measures were above those for the Class of 2009 and significantly above the GPRA goals
bull YouthBuild is currently meeting or exceeding the GPRA goal for all three measures The additional quarter of service for 20102011 grants provided additional positive outcomes as expected As the 2012 grant class progresses it is expected that this trend will continue
Program Performance
Quarter Highlights Just A Start in Cambridge (MA) has been a YouthBuild grantee since 2010 In the fourth quarter of the Program Year 2013 they shared the following success story
Victor earned a High School Diploma and HBIPACT construction certification He was accepted to Endicott College in MA He also secured a full time painting position with George Souza Painting making $25 per hour He continues to develop his career plan with staff
Class of 20102011 Performance in the Past Eight Quarters
Performance Measure GPRA Results for Class
0f 20102011 Results for Class 2012 Overall Results
Percent of Participants Entering Employment or Enrolling in Postsecondary Education the Military or Advanced Training Occupational Skills Training in the First Quarter After Exit
500 612 586 519
Percent of Youth Who Attain a Diploma GED or Certificate by the End of the Third Quarter after Exit
672 770 609 672
Percent of Participants Deficient in Basic Skills Who Achieve Literacy or Numeracy Gains of One Adult Basic Education Level
585 676 549 595
24
WORKFORCE SYSTEM RESULTS
100
80
60
40
20
0 Sep-12 Dec-12 Mar-13 Jun-13 Sep-13 Dec-13 Mar-14 Jun-14
n Attainment of a High School Diploma GED or improvement of basic skills by at least two grade levels or completed Occupational Skills training n Participants who Attained Two or more Goals
Indian and Native American Youth Program httpwwwdoletagovdinap
Program Description The Indian and Native American Supplemental Youth Services Program provides summer and year-round employment and training activities for Indian Alaska Native and Native Hawaiian individuals between the ages of 14 and 21 Program resources are targeted to at-risk and the neediest youth who face substantial barriers to education and employment success This population includes high school dropouts and youth who are basic-skills deficient
Quarter Highlights Youth summer employment is a high priority for Native American Tribes However most rural reservation areas do not have enough employers to put youth to work during the summer As a result Tribes rely on the annual WIA Section 166 funding to place youth in summer employment where they can earn a wage and receive valuable work experience
Over the past four quarter period 2487 of the 4399 youth that participated in the youth program were placed in summer employment Youth participants come from low income families with little or no opportunity to earn money during the summer months Through the Indian and Native American Youth Program these youth are given an opportunity to work and earn money during the summer which helps them contribute to their familyrsquos income
Performance in the Past Eight Quarters
Program Performance
Performance Measure Four Quarters
Ending 063013 Four Quarters
Ending 063014
Educational Attainment for Dropouts 180 220
Attainment of Two or More Goals 920 927
The data reported reflect the period from April 1 2012 through March 31 2013 The data reported reflect the period from April 1 2013 through March 31 2014
Additional Program Year 2013 Quarterly Data
Performance Measure Four Quarters
Ending 093013 Four Quarters
Ending 123113 Four Quarters
Ending 033114
Educational Attainment for Dropouts
250 250 220
Attainment of Two or More Goals
930 930 927
The data reported reflect the period from April 1 2013 through September 30 2013 The data reported reflect the period from April 1 2013 through March 31 2014
Analysis bull The Attainment of Two or More Goals rate increased slightly from 92 percent in June 2013
to 927 percent in June 2014 bull The Indian and Native American Youth Program served 4310 youth during the period July
1 2013 through June 30 2014 This is a 164 percentage point decrease in youth served one year ago
bull The Education Attainment for Dropouts increased from 18 percent in June 2013 to 22 percent in June 2014
25
WORKFORCE SYSTEM RESULTS
Green Jobs Innovation Fund Grants (GJIF) httpwwwdoletagovBRGGreenJobs
Program Description The Green Jobs Innovation Fund (GJIF) was authorized as a Pilot and Demonstration Project under the Workforce Investment Act (WIA) of 1998 to help workers receive job training in green industry sectors and occupations as well as access green career pathways GJIF is seeking to increase the number of individuals completing training programs who receive industry-recognized credentials and to increase the number of individuals completing training programs for employment in green jobs
With these grants the Department is emphasizing two key workforce programs that move participants along green career pathways by 1) forging linkages between Registered Apprenticeship and pre-apprenticeship programs andor 2) integrating the delivery of technical and basic skills training through community-based partnerships The grantees are building on existing programs that are already established and serving workers and moving workers into and along green career pathways The Green Jobs Innovation Fund (GJIF) grants are all anticipated to end by June 30 2015
Quarter Highlights The Jobs for the Future (JFF) GreenWays grant program made great progress toward their goal of increasing access for women to enter higher-paying non-traditional occupations Women currently comprise 254 of the programs total enrollment and are earning higher placement wages overall than men At the same time their completion rates credential attainment rates and job placement rates lag behind those of men reflecting the ongoing challenges that women experience in non-traditional occupations The JFF GreenWays program continues to focus on raising the visibility of this issue as a key element in regional approaches to addressing poverty in female-headed households
Program Performance
Performance Measure Cumulative
Four Quarters Ending 063013
Cumulative Four Quarters
Ending 063014
Entered Employment Rate 569 642
Employment Retention Rate 750 821
Six Monthsrsquo Average Earnings $16249 $17459
Additional Program Year 2013 Quarterly Data
Performance Measure
Cumulative Four
Quarters Ending
093013
Cumulative Four
Quarters Ending
123113
Cumulative Four
Quarters Ending
033114
Entered Employment Rate 560 626 641
Employment Retention Rate 790 795 785
Six Monthsrsquo Average Earnings $16406 $15228 $15039
Cumulative Credential Outcomes in the Past Three Quarters
Performance Measure Quarter Ending
123113
Quarter Ending
033114
Quarter Ending
063014
Number Completed Education Job Training Activities
5521 6438 7076
Number Completed Training and Received Credential
5343 6242 6849
Attainment Rate 97 97 97
Analysis As of June 30 2014 8360 participants were enrolled in educationtraining Of these participants 600 participated in Registered Apprenticeship 874 participated in Pre-Apprenticeship and 40 participated in On-the-Job Training A total of 7076 participants completed educationtraining A total of 6849 participants received a credential Lastly a total of 4870 participants entered employment and of these participants 4343 entered training-related employment
26
WORKFORCE SYSTEM RESULTS
Dec-13 Mar-14 Jun-14
100 $27000
$2600080
$2500060
$24000 40
$23000
20 $22000
0 $21000
n Entered Employment Rate n Employment Retention Rate n Six Months Average Earnings
H-1B Jobs and Innovation Accelerator Challenge Grants httpwwwdoletagovETA_News_Releases20111398cfm
Program Description The Jobs and Innovation Accelerator Challenge (Jobs Accelerator) is designed to help regions achieve the demonstrated benefits of collaborative cluster-based regional development This initiative represents the implementation of Administration policy priorities to accelerate bottom-up innovation in urban and rural regions as opposed to imposing ldquoone-size-fits-allrdquo solutions The Jobs Accelerator also meets Administration goals for smarter use of government resources through reduction of Federal silos and promotion of coordinated Federal funding opportunities that offer more efficient access to Federal resources Investments from Federal agencies for the Jobs Accelerator projects include The US Department of Laborrsquos Employment and Training Administration (DOL-ETA) the US Department of Commercersquos Economic Development Administration (DOC-EDA) and the National Institutes of Standards and Technologyrsquos Hollings Manufacturing Extension Partnership (NIST-MEP) the Small Business Administration (SBA) the Department of Energy Advanced Manufacturing Office (DOE AMO) and the Delta Regional Authority (DRA)
The objectives of the Jobs Accelerator are to
bull Accelerate the formation of new high-growth businesses and expansion of existing businesses
bull Accelerate the creation of higher-wage jobs bull Advance commercialization of research including Federally-funded research bull Support deployment of new processes new technologies and new products to grow sales
and generate employment bull Enhance the capacity of small businesses in the cluster including small and disadvantaged
businesses bull Increase exports and business interaction with international buyers and suppliers bull Develop the skilled workforce needed to support growing clusters and bull Ensure diverse workforce participation in clusters through outreach training and the
creation of career pathways
Quarter Highlights The Northeast Ohio Speed-To-Market Accelerator (STMA) program administered by Lorain County Community College aims to accelerate the speed-to-market for near production or pilot production prototypes stimulate job creation and increase the global competitiveness of cluster companies attract private capital and attract students incumbent workers and the unemployed
This quarter STMA helped accelerate the introduction of a new dry electrode product for heart monitoring This sensor and electronics will be introduced as part of the next generation of wearable human performance arm band from Pittsburgh based Body Media a subsidiary of Jawbone Further STMA continues to bring new companies into the STMA
program through cluster outreach activities and this quarter three new leads were generated as the result of the existing STMA partners MAGNET JumpStart Lorain County Community College and NorTech
Program Performance
Performance Measure Four Quarters
Ending 123113 Four Quarters
Ending 033114 Four Quarters
Ending 063014
Entered Employment Rate 307 283 359
Employment Retention Rate 907 925 927
Six Monthsrsquo Average Earnings $23310 $22953 $26682
Performance in the Past Three Quarters
Analysis A total of 3702 individuals were served 3632 individuals began educationjob training activities and 2052 individuals completed educationjob training services Of participants completing educationjob training 370 unemployed individuals completed training and entered employment and of these 114 individuals entered training-related employment A total of 204 employed individuals completed training and retained their current position and of these 85 employed individuals completed training and advanced into a new position A total of 2006 individuals completed educationtraining activities and received credentials and of these 2273 total credentials were awarded
This data represents three rounds of the for Jobs Accelerator initiative which includes the Jobs Accelerator Round 1 the Advanced Manufacturing Jobs Accelerator Round 2 and the Make it in America (MIIA) Jobs Accelerator grants program
27
WORKFORCE SYSTEM RESULTS
100 $56000
80 $54000
$52000 60 $50000
40 $48000
$46000 20
$44000
0 $42000 Dec-13 Mar-14 Jun-14
n Entered Employment Rate n Employment Retention Rate n Six Months Average Earnings
H-1B Technical Skills Training Grants httpwwwdoletagovbusinessH1B_Tech_Skillscfm
Program Description The H-1B Technical Skills Training (TST) Grants were authorized by the American Competitiveness and Workforce Improvement Act of 1998 (ACWIA) as amended (29 USC 2916a) to provide education training and job placement assistance in the occupations and industries for which employers are using H-1B visas to hire highly-skilled foreign workers on a temporary basis and the related activities necessary to support such training The H-1B TST Grant Program is intended to raise the technical skill levels of American workers so they can obtain or upgrade employment in high-growth industries and occupations Over time these education and training programs will help businesses reduce their use of skilled foreign professionals permitted to work in the US on a temporary basis under the H-1B visa program The grants represent significant investments in sectors such as information technology advanced manufacturing and health care In addition these grants will focus on serving participants who have been identified as long-term unemployed particularly those who have been unemployed the longest These grants also have an emphasis on providing on-the-job training allowing participants to learn new skills while earning a pay check To date ETA has announced two rounds of TST grants totaling $342 million The first round was announced on October 4 2011 and the second round was announced on February 22 2012
Quarter Highlights The Los Angeles HealthWorks On-the-Job training (OJT) initiative administered by Managed Career Solutions Inc (MCS) provides individuals with training that leads to industry recognized credentials and employment opportunities within the regionrsquos healthcare field MCS maintains several strong partnerships to coordinate outreach recruitment training OJT placements and employment opportunities As of June 30 2014 MCS served nearly 800 long-term unemployed participants and overall 1100 participants In the same period over 650 individuals completed training and earned an industry recognized credential Of those completers 128 were employed at participation however the majority were underemployed and gained the necessary job skills and credentials that allowed 80 percent to advance into a new position In recognition MCS received the Malcom Baldrige and State Eureka awards
Analysis bull 52532 individuals were served and 51071 individuals began educationjob training
activities bull 15185 individuals completed educationjob training activities including 3321 unemployed
individuals who completed training and entered employment bull Of these 2925 individuals entered training-related employment 2902 employed individuals
completed training and retained their current position 1452 employed individuals completed training and advanced into a new position
bull 11944 individuals completed educationjob training activities and received credentials with 14099 total credentials awarded
Program Performance
Performance Measure
Four Quarters
Ending 123113
Four Quarters
Ending 033114
Four Quarters
Ending 063014
Entered Employment Rate 778 725 675
Employment Retention Rate 993 944 926
Six Monthsrsquo Average Earnings $54683 $50833 $46245
Since the H-1B TST program provides training to incumbent unemployed and long-term unemployed workers to prepare them for jobs in a variety H-1B industries andor occupations the Entered Employment Rate and Six Monthsrsquo Average Earnings can vary For the quarter ending on June 30 2014 the H-1B TST program saw a decline in the Entered Employment Rate and Six Monthsrsquo Average Earnings in comparison with the results for the previous rolling four quarters Previous results reflected a large number of incumbent workers who enrolled in short-term high-skilled training and exited early leading to a relatively high Six Monthsrsquo Average Earnings As the projects progress unemployed and long-term unemployed workers who required longer-term training begin to exit the program and search for jobs Ultimately as they enter employment wages may be less than those achieved by the higher-skilled incumbent workers who either retain or advance in their positions after training
Performance in the Past Three Quarters
28
WORKFORCE SYSTEM RESULTS
100 $21000
$19000 80
$17000
$1500060 $13000
40 $11000
$900020
$7000
0 $5000Sep-12 Dec-12 Mar-13 Jun-13 Sep-13 Dec-13 Mar-14 Jun-14
n Entered Employment Rate n Employment Retention Rate n Six Months Average Earnings
Community-Based Job Training Grants (CBJT) httpwwwdoletagovbusinessCommunity-BasedJobTrainingGrantscfm
Program Description Community-Based Job Training Grants (CBJT) seek to strengthen the role of community colleges in promoting the United States workforcersquos competitiveness The program does this by building the capacity of community colleges to train workers in skills required to succeed in regionally based high-growth high-demand industries and occupations Important grant activities include training in the healthcare biotech advanced manufacturing energy automotive transportation construction insurance forestry and aerospace industries The first round of CBJT grants were awarded in October 2005 To date ETA has announced five rounds of CBJT grants awarding 320 grants to community colleges and other organizations All CBJT grants ended as of June 30 2014
Quarter Highlights The 14 remaining projects active in this quarter represent the culmination of another successful DOL initiative Some of the significant accomplishments include the development and sustainability of Roane State Community Collegersquos Lean Manufacturing program designed to meet the needs of local manufacturing employers the San Jacinto Community College Districtrsquos Gulf Coast Healthcare Partners project which developed training to support healthcare career and Central Arizona Collegersquos Pinal County Alternative Energy Project More than half of the CBJT participants who began education and training activities completed their programs 79 percent of them received an industry recognized credential ie certificate or degree Eighty-four percent of the participants who gained employment entered into new training-related positions
Program Performance
Performance Measure Four Quarters
Ending 063013 Four Quarters
Ending 063014
Entered Employment Rate 572 662
Employment Retention Rate 891 899
Six Monthsrsquo Average Earnings $18675 $17027
Additional Program Year 2013 Quarterly Data
Performance Measure
Four Quarters
Ending 093013
Four Quarters
Ending 123113
Four Quarters
Ending 033114
Entered Employment Rate 57 605 655
Employment Retention Rate 891 897 891
Six Monthsrsquo Average Earnings $18675 $18285 $16642
Performance in the Past Eight Quarters
Analysis bull 268359 individuals have been served through the initiative bull 258216 individuals began educationjob training activities bull 165264 individuals completed educationjob training activities Of these
bull 131107 individuals received credentials bull 65089 individuals entered new positions of employment and 54344 individuals entered new
positions of training-related employment
Note All data are cumulative Prior to new reporting requirements implemented in the quarter ending December 31 2011 grantees only reported results for individuals that entered employment and individuals that entered training-related employment (noted above) if those participants entered employment and completed training in the same quarter As a result prior to that quarter participants that entered employment in quarters after they completed training were captured in the Common Measures and the total number of individuals that ultimately entered employment and training-related employment are actually higher than the results above indicate
29
WORKFORCE SYSTEM RESULTS
100 92
7880
5760
40
20
0
n Percent of Target Number of Programs Launched by Round
Round 1 Round 2 Round 3
Trade Adjustment Assistance Community College and Career Training (TAACCCT) Grants httpwwwdoletagovtaaccct
Program Description The Trade Adjustment Assistance Community College and Career Training (TAACCCT) Grant Program is authorized by the Trade Act of 1974 under Chapter 4 of Title II The purpose of this grant program is to provide eligible institutions of higher education with funds to expand and improve their ability to deliver education and career training programs that can be completed in two years or less and that result in skills degrees and credentials that prepare program participants for employment in high-wage high-skill occupations and are suited for workers who are eligible for training under the Trade Adjustment Assistance (TAA) for Workers program under Chapter 2 of Title II of the Trade Act The TAACCCT Grant Program is funded under the Health Care and Education Reconciliation Act of 2010 which appropriated $500 million for the program for each of Fiscal Years 2011-2014 for a total of $2 billion
Round 1 ndash FY 2011 Grants On June 30 2014 grants awarded in Round 1 (FY 2011) had completed all but one quarter of their periods of performance By the end of their final year of the grant the forty-nine (49) Round 1 grantees project that they will offer a total of 906 new programs of study As of June 30 2014 grantees began offering 834 (92 percent) of these programs of study
Round 2 ndash FY 2012 Grants The seventy-nine (79) grants awarded in the Fiscal Year 2012 had completed seven quarters of their grants at the end of June 30 2014 Their period of performance began on October 1 2012 and will end on September 30 2016 however their final year will be dedicated to gathering information and data for reporting outcome measures and completing the requirements for a third-party evaluation They project that by the end of the third year they will have launched 761 programs As of the end of June 30 2014 they had began offering 561 (78 percent) of these programs
Round 3 ndash FY 2013 Grants Grants awarded in FY 2013 had completed the first three quarters of their period of performance Their grants began on October 1 2013 and will end on September 30 2017
In their third year they will have launched all of their programs as their final year will be dedicated to collecting follow up data for evaluation and reporting purposes only The fifty-seven (57) grantees plan to launch 551 programs As of June 30 2014 they had already launched 288 (57 percent) of these programs
Percentage of Target Number of Programs Launched as of June 30 2014 by Grant Round
Performance Information Programmatic data is collected at different intervals throughout the period of performance including
bull Quarterly Narrative Progress Reports (QNPR) Grantees will provide quarterly qualitative data on the capacity building taking place through progress and other implementation measures that grantees defined in their Statements of Work
bull Annual Performance Reports (APR) Grantees will provide annual quantitative data on their training and employment outcomes for TAACCCT program participants that are impacted by the capacity building activities being implemented by their grants
30
WORKFORCE SYSTEM RESULTS
$4500000 3500$4000000 3000$3500000
2500
Jun-13 Dec-13 Mar-14 Jun-14
Amou
nt $3000000 2000$2500000
$2000000 1500 $1500000 1000 $1000000
500$500000 $0 0
n Amount of Revenue Generated n Number of Tickets Assigned
Disability Employment Initiative (DEI) httpwwwdoletagovdisability
Program Description All DEI Workforce Employment Network (EN) Trends
Launched in 2010 the Disability Employment Initiative (DEI) seeks to improve education training and employment opportunities for youth and adults with disabilities who are unemployed underemployed andor receiving Social Security disability benefits The DEI is jointly funded by the US Department of Laborrsquos Employment and Training Administration and Office of Disability Employment Policy DEI projects improve collaboration among employment and training and asset development programs implemented at state and local levels including the Social Security Administrationrsquos Ticket to Work Program and build effective partnerships that leverage resources to better serve individuals with disabilities and improve employment outcomes
Quarter Highlights A variety of Department of Labor programs helped Vietnam-era veteran Richard James navigate through life After servicing B-52 bombers in the Air Force James held a series of sales jobs while putting himself through law school at night He rose to become a successful New England attorney and owner of a boat dock building company when he suffered a terrible head injury which caused spine and nerve damage Addiction to pain medication followed and James ended up homeless While recovering from his injuries James took a college course through the Veterans Retraining Assistance Program managed in part by the Department He received career counseling from a Disabled Veterans Outreach Program representative at a local American Job Center and support from the DEI Disability Resource Coordinator Eventually James was hired as an attorney by a Rhode Island law firm The departments grants and programs made possible the services that put me back in a position of being a productive member of society he said
Program Performance
Performance Measure Quarter Ending 63013
Quarter Ending
123113
Quarter Ending 33114
Quarter Ending 63014
Analysis bull The Exit Rate for Adult and Youth exiters with disabilities in Round one DEI sites is almost
double the national average Adult DEI was 89 percent vs All StatesAll LWIAs 49 percent Older Youth DEI 166 percent vs All StatesAll LWIAs 87 percent Younger Youth DEI 339 percent vs All StatesAll LWIAs 151 percent
bull The CredentialSkill Attainment Rate for older and younger youth with disabilities in Round 1 DEI sites was higher than the national average Older Youth DEI credential rate 568 percent vs All StatesAll LWIAs 383 percent Younger Youth DEI skill rate 902 percent vs All States All LWIAs 834 percent
bull The Exit Rate for Adult and Youth exiters with disabilities in Round two DEI sites is higher than the national average Adult DEI 56 percent vs All StatesAll LWIAs 49 percent Older Youth DEI 163 percent vs All StatesAll LWIAs 87 percent and Younger Youth DEI 167 percent vs All StatesAll LWIAs 151 percent
bull The Entered Employment Rate for Adult DEI sites 657 percent is 20 percent higher than in All StatesAll LWIAs 434 percent
bull DEI Workforce Employment Networks (EN) activity shows that the number of Tickets assigned increased from 1780 to 2903 an increase of 1123 and the amount of revenue
Number of Tickets Assigned 1780 1590 2554 2903 generated from DEI EN payments increased from $2373404 to $4057353 an increase of $168 million Amount of Revenue Generated $2373404 $1927104 $3505582 $4057353
31
WORKFORCE SYSTEM RESULTS
ETA Internet-Based Assistance (E-TOOLS) wwwcareerinfonetorg wwwservicelocatororg wwwcareeronestoporg wwwonetonlineorg wwwmyskillsmyfutureorg wwwmynextmoveorg
Program Description Additional Program Year 2013 Quarterly Data
Performance Measure Quarter Ending
093013
Quarter Ending
123113
Quarter Ending
033114
CareerOneStop Portal Visits 5754645 5159240 5340022
ETArsquos Internet-based assistance includes electronic tools that help individuals explore career opportunities and link to job postings either on their own or at local American Job Centers to make informed employment and education choices
The Web sites feature user-friendly occupation and industry information salary data career videos education resources career exploration assistance and other resources that support talent development in todayrsquos fast-paced global marketplace Users can find information some of which is also industry sponsored about occupations that are in-demand in high growth industries Additionally information is available regarding occupational skills and workplace competencies
Quarter Highlights For the year ending June 2014 CareerOneStop launched a new portal for Ex-Offenders added Federal Contractor job tagging a TAACCCT information finder Youth Council information to Americarsquos Service Locator and began working on adding more job feeds
Americarsquos Service Locator (ASL) Visits
730998 758919 724053
ONET Downloads 26646 29407 28505
ONET Visits 7697608 10211177 11500039
Combined Visits 14183251 16129336 17564114
Performance in the Past Eight Quarters
25000000 $36000
Sep-12 Dec-12 Mar-13 Jun-13 Sep-13 Dec-13 Mar-14 Jun-14
n Combined Visits (in millions) n ONET Product Downloads (in thousands)
$31500 20000000
ONE
T Pr
oduc
t Dow
nloa
ds
$27000
Com
bine
d Vi
sits
$2250015000000 $18000
10000000 $13500
$90005000000
$4500
$00
ONET has added web services for developers and increased the available Tools and Technology and Detailed Work Activities information to convey specialized occupational attributes
Program Performance
Performance Measure Quarter
Ending 063013 Quarter
Ending 063014
CareerOneStop Portal Visits 5104850 5472742
Americarsquos Service Locator (ASL)Visits
747114 802148
ONET Downloads 29482 25278
ONET Visits 8716609 13581922
Combined Visits 14568573 19856812
Analysis bull ETA Internet-Based Assistance received 19856812 combined visits for the quarter ending
June 30 2014 an increase of 36 percent over the same period in 2013 bull Visits to CareerOneStop increased to 5472742 or 72 percent over the same period in 2013
with mySkillsmyFuture continuing to be a popular tool with an increase of 23 percent bull Americarsquos Service Locator Visits traffic increased 74 percent over the same period in 2013 bull The ONET traffic received 13581922 visits in this quarter an increase of 558 percent
over the same period in 2013 and the ONET downloads totaled 25278 for the quarter a decrease of 142 percent
32
WORKFORCE SYSTEM RESULTS
Glossary of Performance Measures
Common Performance Measures Common Performance Measures are used by Workforce Investment Act Indian and Native American Program Disability Program Navigator Initiative Wagner-Peyser Trade Adjustment Assistance Senior Community Service Employment Program Reintegration of Ex-Offenders Registered Apprenticeship Program Job Corps National Farmworker Jobs Program High Growth Job Training Initiative and Community-Based Job Training Grants
Adult Measures Entered Employment Of those who are not employed at the date of participation the number of adult participants who are employed in the first quarter after the exit quarter divided by the number of adult participants who exit during the quarter
Employment Retention Of those who are employed in the first quarter after the exit quarter the number of adult participants who are employed in both the second and third quarters after the exit quarter divided by the number of adult participants who exit during the quarter
Six Monthsrsquo Average Earnings Of those adult participants who are employed in the first second and third quarters after the exit quarter total earnings in the second quarter plus the total earnings in the third quarter after the exit quarter divided by the number of adult participants who exit during the quarter
Average Earnings Change in Six Months1
Of those who are employed in Q1 after exit the total post-program earnings (earnings in Q2 + Q3 after exit) minus pre-program earnings (earnings in Q2 + Q3 prior to registration) divided by the number of adults who exit during the quarter
Youth Measures Attainment of a Degree or Certificate Of those enrolled in education (at the date of participation or at any point during the program) the number of youth participants who attain a diploma GED or certificate by the end of the third quarter after the exit quarter divided by the number of youth participants who exit during the quarter
1 This definition was used for earnings in PY 2005 Q=quarter
33
Literacy and Numeracy Gains Of those out-of-school youth who are basic skills deficient the number of youth participants who increase one or more educational functioning levels divided by the number of youth participants who have completed a year in the program (ie one year from the date of first youth program service) plus the number of youth participants who exit before completing a year in the program
Placement in Employment or Education2
Of those who are not in postsecondary education or employment (including the military) at the date of participation the number of youth participants who are in employment (including the military) or enrolled in postsecondary education andor advanced trainingoccupational skills training in the first quarter after the exit quarter divided by the number of youth participants who exit during the quarter
Program-Specific Performance Measures
Disability Employment Initiative (DEI) Number of Tickets Assigned Number of individuals on Social Security Administration (SSA) disability benefits who assigned their Ticket to the workforce board agency or American Job Center as their designated Employment Network under the SSA Ticket to Work program All DEI pilot sites must become an Employment Network under Ticket to Work
Amount of Revenue Generated Under the SSA Ticket to Work program when jobseekers who receive SSA disability benefits assign their Ticket to a workforce board agency or American Job Center as an Employment Network and then achieve certain employment milestones the Employment Network receives money or ldquoTicket revenuerdquo
2 Because of its intensity and duration the YouthBuild performance measure for placement in employment or education does not exclude those who entered the program with a job or in college
WORKFORCE SYSTEM RESULTS
Foreign Labor Certification Percent of H-1B Applications Resolved in Seven Business Days This estimate is based on the total number of applications processed within seven business days divided by the total number of applications processed for a given reporting period An application is considered processed if the last significant event is (1) certified (2) denied or (3) withdrawn
Average Number of Days to Resolve PERM Applications Not Subject to Integrity Review The average processing time between case receipt and decision date for non-audited cases
Average Number of Days to Resolve PERM Applications Subject to Integrity Review The average processing time between case receipt and decision date for audited cases
Percent of Complete H-2A Employer Applications Resolved within 30 Days Before the Date of Need This estimate is based on the total number of complete applications resolved within 30 days before the date of need divided by the total number of applications processed for a given reporting period
Percent of H-2B Applications Processed Within 30 Days of Receipt This estimate is based on the total number of applications processed within 30 days of receipt divided by the total number of applications processed for a given reporting period An application is considered processed if the last significant event is (1) certified (2) denied or (3) withdrawn
Indian and Native American Youth Attainment of Two or More Goals The total number of youth participants enrolled in the Granteersquos Supplemental Youth Services Program who attained at least two of the 14 goals listed below divided by the total number of Supplemental Youth Services participants enrolled during the report period The 14 goals include
1 Completed Job ReadinessOrientation to the World of Work Training 2 Completed Internship or Vocational Exploration Program
3 Completed Career Assessment 4 Entered Unsubsidized Employment 5 Remained in School 6 Returned to School Full Time 7 Enrolled in Job Corps 8 Improved Basic Skills Level By At Least Two Grades 9 Attained High School Diploma 10 Attained GED 11 Completed Occupational Skills Training 12 Completed Leadership Skills Training 13 Entered Other (Non-Supplemental Youth) Training Program 14 Summer Employment
Educational Attainment for Dropouts The number of dropouts who have obtained a high school diploma GED or increased their literacy and numeracy by two grade levels divided by the total number of dropouts
Job Corps Measures Placement in Employment or Education Percent of Job Corps participants3 entering employment or enrolling in post-secondary education andor advanced skills trainingoccupational skills training in the first quarter after exit from the program
Attainment of a Degree or Certificate Percent of students who attain a GED HSD or certificate
Literacy Numeracy Gains Percent of students who achieve literacy or numeracy gains of one or more Adult Basic Education (ABE) levels
3 Calculation of the Placement rate measure does not include outcomes for students who participated in the program for less than 60 days
34
WORKFORCE SYSTEM RESULTS
Internet-Based Assistance Web Site Visits ETArsquos Internet-based assistance includes electronic tools that help individuals make informed employment and education choices The measure for tracking the overall performance and usage of these tools is Web site visits A visit is defined as a series of page requests from the same uniquely identified client with a time of no more than 30 minutes between each page
request
ONet Product Downloads The ONET product downloads count the number of unique users who download an ONET online resource (wwwonetcenterorg) which includes the ONET database (all versions) ONET technical reports (such as on green jobs) supplemental data files (lay titles tools and technology) the ONET Career Exploration Tool files ONET Survey questionnaires and other related materials such as the Toolkit for Business
Registered Apprenticeship Program Entered Employment Rate Percent of apprentices employed in the first quarter after exit who either completed or cancelled from their Registered Apprenticeship Program
Employment Retention Rate Percent of apprentices employed in the first quarter after exit still employed in the second and third quarter after exit who either completed or cancelled from their Registered Apprenticeship Program
Six Monthsrsquo Average Earnings Six month Average Earnings of apprentices employed in the first quarter after exit still employed in the second and third quarter after exit who either completed or cancelled from their Registered Apprenticeship Program
Reintegration of Ex-OffendersmdashAdult Program Recidivism Rate The percentage of participants who are rearrested for a new crime or re-incarcerated for revocation of a parole or probation violation within one year from release from prison
Senior Community Service Employment Program Service Level The count of participants during the report period divided by the total number of authorized grantee community service positions
Community Service The number of community service hours as reported by each grantee divided by the total community service hours funded for the grantee adjusted for minimum wage differences among the states
Most-in-Need Most-in-need means participants with one or more of the following characteristics have a severe disability are frail are age 75 or older are age-eligible but not receiving benefits under Title II of the Social Security Act reside in an area with persistent unemployment and have severely limited employment prospects have limited English proficiency have low literacy skills have a disability reside in a rural area are Veterans have low employment prospects have failed to find employment after utilizing services provided under Title I of the Workforce Investment Act of 1998 (29 USC 2801 et seq) or are homeless or at risk for homelessness (sect 513(b)(1)(E) as amended by Pub L No 109-365)
Unemployment Insurance Percent of Payments Made Timely The percentage of intrastate Unemployment Insurance benefit first payments for full weeks of unemployment issued within 14 days following the first compensable week in states with a waiting week and 21 days in non-waiting week states
Detection of Recoverable Overpayments The amount of overpayments (dollars) established through state operations as a percent of the estimated amount states can detect and establish for recovery
Entered Employment Rate The percent of persons receiving a first payment in a given quarter who had earnings in the next quarter
Percent of Employer Tax Liability Determinations Made Timely The percent of new employer determinations made within 90 days of the end of the quarter in which employers became liable to pay unemployment taxes
35
WORKFORCE SYSTEM RESULTS
YouthBuild Attainment of a Degree or Certificate Of those enrolled the number of youth participants who attain a diploma high school equivalency degree or industry-recognized certificate by the end of the third quarter after the exit quarter divided by the number of youth enrolled (minus youth exited for other reasons)
Literacy and Numeracy Gains Of those youth participants who are basic skills deficient at enrollment the number of youth participants who increase one or more educational functioning levels within one year of enrollment divided by the number of youth participants who have completed a year in the program
Placement in Employment or Education The number of youth participants who are in employment (including the military) or are enrolled in post-secondary education andor advanced trainingoccupational skills training in the first quarter after the exit quarter divided by the number of youth participants who exited during the previous quarter
Youthful Offender Projects Placement Rate The placement rate is the percentage of out-of-school youth ages 18 and above placed in unsubsidized jobs occupational training post-secondary education or the military
Recidivism Rate The recidivism rate is the percentage of youth offenders who have been convicted of a new crime within 12 months of their release of a correctional facility or being placed on probation
36
WORKFORCE SYSTEM RESULTS
2471 American Job Centers formerly known as One-Stop Career Centers
12 VT
9 HI
1 GU
6 DC
2 VI
15 NE
16 SD
12 ME
19 IA
19 AK
19 WV
4 DE
47 AL
55 CO
48 MN
57 WI
89 NC
60 GA
31 MA
23 NM
16 ND
47 AR
70 PA
18 CT 4 RI
12 NV
20 WY
22 KS
18 PR
89 OH
69 TN
102 FL
59 AZ 46
SC
12 NH
29 NJ
52 VA
22 MT
33 OK
39 MS
59 WA
61 IL 34 MD
47 OR
131 KY
62 LA
83 IN
33 UT
44 MO
26 ID 90
NY95 MI
1 to 25
25 to 50
50 to 75
75 to 100
Over 100
203 CA
180 TX
Source Americarsquos Service Locator (wwwServiceLocatororg) Americarsquos Service Locator connects individuals to employment and training opportunities available at local American Job Centers The Web site provides contact information for a range of local work-related services including unemployment benefits career development and educational opportunities As of March 17 2015
37
WORKFORCE SYSTEM RESULTS
United States Department of Labor
200 Constitution Avenue NW
Washington DC 20210
wwwdolgov
- A9RFAFEtmp
- DOL_Workforce_Rprt_Jun_2014_51415-dp
-
- Workforce System Results
-
- Contents
- Quarterly Spotlight
- People Served by Program
- Current Appropriations
- Government Performance and Results Act Goals (GPRA)
- Indian and Native American Adult Program (INAP)
- National Farmworker Jobs Program (NFJP)
- Senior Community Service Employment Program (SCSEP)
- Wagner-Peyser Employment Service
- Workforce Investment Act Adult Program
- Workforce Investment Act Dislocated Worker Program
- H-1B and Permanent Foreign Labor Certification (PERM)
- H-2A and H-2B Foreign Labor Certification Programs
- Reintegration of Ex-Offenders (RExO-ADULT)
- Registered Apprenticeship
- Registered Apprenticeship
- Trade Adjustment Assistance (TAA)
- Unemployment Insurance (UI)
- Unemployment Insurance (UI)
- Job Corps
- Workforce Investment Act Youthful Offender Initiative
- Workforce Investment Act Youth Program
- YouthBuild
- Indian and Native American Youth Program
- H-1B Jobs and Innovation Accelerator Challenge Grants
- H-1B Technical Skills Training Grants
- Community-Based Job Training Grants (CBJT)
- Trade Adjustment Assistance Community College and Career Training (TAACCCT) Grants
- Disability Employment Initiative (DEI)
- ETA Internet-Based Assistance (E-TOOLS)
- Glossary of Performance Measures
- 2471 American Job Centers formerly known as One-Stop Career Centers
-

WORKFORCE SYSTEM RESULTS
Registered Apprenticeship httpwwwdoletagovoa
Program Description Registered Apprenticeship is a leader in preparing American workers to compete in a global 21st Century economy With a network of over 150000 employers in more than 1000 occupations Registered Apprenticeship has already trained millions of Americarsquos workers Modern apprenticeships are now on the cutting edge of innovation in preparing a skilled workforce for todayrsquos industries including expanding industries like health care information technology transportation telecommunications and advanced manufacturing as well as in industries like construction where apprenticeships have a long and successful history
Quarter Highlights During the summer of 2014 the White House hosted the first-ever Summit on Apprenticeship to gather the best ideas and to catalyze action to dramatically increase apprenticeship in America More than 60 attendees presented their ideas including leading employers big and small like IBM Bank of America Blue CrossBlue Shield and Oberg Industries labor unions like the International Brotherhood of Electrical Workers (IBEW) training providers like Ivy Tech and Lone Star Community Colleges and local workforce leaders The event was the apex in a series of industry roundtables on apprenticeship which took place across the country during June amp July 2014
Program Performance
Performance Measure Four Quarters
Ending 063013 Four Quarters
Ending 063014
Entered Employment Rate 734 742
Employment Retention Rate 873 878
Six Monthsrsquo Average Earnings $23826 $24387
Performance Measure Quarter Ending
063013 Quarter Ending
063014
Apprentices
Total Apprentices (Active Apprentices)
148039 152582
New Apprentices 17432 17011
Programs
New Programs 139
Programs Maintained Total (Active Programs)
9809 9077
Number of new programs in Construction and Manufacturing
93
Source Registered Apprenticeship Partners Information Management Data System (RAPIDS) data managed by Department of Labor staff only 063013 data has been revised to include federal data only Running total of active apprenticesprograms during the quarter
16
177
127
WORKFORCE SYSTEM RESULTS
0
20
40
60
80
100
Sep-12 Dec-12 Mar-13 Jun-13 Sep-13 Dec-13 Mar-14 Jun-14 $5000 $7000 $9000 $11000 $13000 $15000 $17000 $19000 $21000 $23000 $25000
n Entered Employment Rate n Employment Retention Rate n Six Months Average Earnings
Registered Apprenticeship httpwwwdoletagovoa
Additional Program Year 2013 Quarterly Data
Performance Measure
Four Quarters
Ending 093013
Four Quarters
Ending 123113
Four Quarters
Ending 033114
Entered Employment Rate 735 738 738
Employment Retention Rate 874 877 878
Six Monthsrsquo Average Earnings $24171 $24324 $24378
Performance in the Past Eight Quarters
Analysis bull During the third quarter of Fiscal Year 2014 there were over 394000 active apprentices
nationwide while over 13000 program participants completed their apprenticeship and received a credential that is portable industry recognized and can provide a pathway to middle-class and sustainable careers
bull The Entered Employment Rate for participants who completed their Registered Apprenticeship program was 856 percent 114 percentage points higher than for all program exiters who either completed or cancelled (742 percent as shown in table on the previous page)
bull The Employment Retention Rate for program completers was 910 percent 32 percentage points higher than for all program exiters (878 percent as shown in table on the previous page)
bull The Six Monthsrsquo Average Earnings for program completers was $29964 which is over $5577 more than that of all program exiters (ie completers or those who cancelled) The results for those completing the program shows it pays to stay
17
WORKFORCE SYSTEM RESULTS
100
80
60
40
20
0 Sep-12 Dec-12 Mar-13 June-13 Sep-13 Dec-13 Mar-14 Jun-14
n Entered Employment Rate n Employment Retention Rate n Six Months Average Earnings
$25000
$21000
$17000
$13000
$9000
$5000
Trade Adjustment Assistance (TAA) httpwwwdoletagovtradeact
Program Description The Trade Adjustment Assistance (TAA) Program is an integral part of the comprehensive workforce development system The program is essential to helping workers dislocated by foreign trade to adjust to changing market conditions and shifting skill requirements Addressing the needs of trade-affected workers involved in this transformation is a unique challenge because in general these workers are being dislocated from relatively outdated-skill high-wage employment In many cases this is complicated by mass layoffs or plant closures that occur in single-industry towns which makes finding comparable employment in the same geographic area difficult Furthermore many of these jobs are lost permanently from the domestic economy requiring affected workers to completely retool their skills
Fiscal Year Highlights During Fiscal Year 2014 Massachusetts diligently trained staff at the local CareerOneStop Centers to ascertain a TAA participantrsquos eligibility for other funding resources to assist in their reemployment initiatives These improved efforts to provide and report reemployment services enables Trade customers to flow through the CareerOneStop Center system with other dislocated workers and receive seamless resources through the resource sharing initiatives of the Career Center methodology These streamlined reemployment services have resulted in an Entered Employment Rate of 815 percent nearly ten percentage points higher than the national average
Program Performance
Performance Measure FY 2011 FY 2012 FY 2013 FY 2014
Entered Employment Rate 653 689 716 729
Employment Retention Rate 897 913 917 911
Six Monthsrsquo Average Earnings $18319 $18837 $18099 $17828
Performance Measure Quarter Ending 063013 Quarter Ending 063014
Entered Employment Rate 733 728
Employment Retention Rate 900 927
Six Monthsrsquo Average Earnings $18210 $17692
Additional Program Year 2013 Quarterly Data
Performance Measure Quarter Ending
093013
Quarter Ending
123013
Quarter Ending
033014
Entered Employment Rate 713 713
Employment Retention Rate 918 918
Six Monthsrsquo Average Earnings $17499 $17499
Performance in the Past Eight Quarters
727
917
$17550
Analysis During Fiscal Year 2014 there were 62706 total participants receiving TAA benefits or services and 20577 exiters entered employment (729 percent) More than one-third of all participants were minorities with the average age of participants being 47 years and the average tenure being approximately 13 years 9547 exiter participants received credentials or 83 percent of all exiter participants who completed training 32527 participants received training or approximately 52 percent of all participants Lastly the program served 4828 Veteran participants accounting for approximately eight percent of all participants
18
WORKFORCE SYSTEM RESULTS
Unemployment Insurance (UI) httpouidoletagovunemploy
Program Description The federal-state Unemployment Insurance (UI) System minimizes individual and family financial hardship due to unemployment and stabilizes the economy during economic downturns by providing unemployed workers with temporary income support States operate their own Unemployment Insurance Programs regulated by State laws
As the Federal partner DOL provides program leadership allocates administrative funds provides technical assistance and exercises performance oversight
Quarter Highlights As the economy improved the system emphasized program integrity solvency and reemployment Claims rates decreased about 10 percent from the year before and Trust Fund loans decreased from $21 billion to $14 billion EUC benefit payments ceased on December 28 2013 Twenty-four states implemented Short-term Compensation programs allowing unemployed workers to stay on jobs while receiving partial unemployment benefits proportionate to reduced work hours States implemented systems to improve efficiency and reduce overpayments such as data exchange and recover UI overpayments By June 30 2014 42 states were recovering overpayments through Federal Income tax refund offset (TOP) and had recovered $370 million in 2014 (over $840 million since TOPrsquos inception)
Analysis During the year ending June 30 2014
bull 51 million UI claimants were reemployed in the quarter following their UI 1st payments (17 million in the last quarter)
bull The UI system met two and failed two of its four targets UI met detection of overpayments (643 percent vs target of 542 percent) and met reemployment (657 percent vs target of 647 percent)
bull The system fell short of its 1st pay and status targets because of retirements and other turnover of key staff
Program Performance
Performance Measure Four Quarters
Ending 063013 Four Quarters
Ending 063014
Percent of Intrastate Payments Made Timely
812 792
Detection of Recoverable Overpayments Rate
598 643
Facilitation of Reemployment Rate 6261 6552
Percent of Employer Tax Liability 888 882
Operational Results
Recipiency Rate 263 272
Exhaustion Rate 456 431
Percent of Recipients of Prime Working Age (25-54)
702 700
Percent of Recipients Who Are Female
434 437
New Initial Unemployment Insurance Claims
13906868 12501014
Number of First Unemployment Insurance Payments
8404507 7632522
Average Duration of Unemployment Insurance (Weeks)
169
1 Reemployment for year ending June 30 2013 2 Reemployment for year ending June 30 2014
19
167
WORKFORCE SYSTEM RESULTS
Unemployment Insurance (UI) httpouidoletagovunemploy
Additional Program Year 2013 Quarterly Data
Performance Measure Four Quarters
Ending 093013 Four Quarters
Ending 123113 Four Quarters
Ending 033114
Percent of Intrastate Payments Made Timely
809 802 793
Detection of Recoverable Overpayments Rate
590 630 603
Facilitation of Reemployment Rate 6311 6312 6363
Percent of Employer Tax Liability 886 885 884
Operational Results
Recipiency Rate 263 262 267
Exhaustion Rate 453 446 437
Percent of Recipients of Prime Working Age (25-54)
702 702 701
Percent of Recipients Who Are Female
434 434 435
New Initial Unemployment Insurance Claims
13559233 13340263 12947493
Number of First Unemployment Insurance Payments
8215687 7967852 7857395
Average Duration of Unemployment Insurance (Weeks)
169 169 168
1 Reemployment for year ending September 30 2013 2 Reemployment for year ending December 31 2013 3 Reemployment for year ending March 31 2014
20
WORKFORCE SYSTEM RESULTS
100
80
60
40
20
0 Sep-12 Dec-12 Mar-13 Jun-13 Sep-13 Dec-13 Mar-14 Jun-14
n Placement in Employment or Education n Attainment of a Degree or Certificate n LiteracyNumeracy Gains
Job Corps httpwwwjobcorpsgovhomeaspx
Program Description Job Corps is the nationrsquos largest residential educational and career technical training program for at-risk youth ages 16 through 24 The 125 Job Corps centers nationwide provide an integrated comprehensive array of services that include academic career technical and life skills training career planning and work-based learning health care and post-program placement and transition support
Job Corps is committed to offering all students a safe drug-free environment where they can take advantage of the resources provided Job Corpsrsquo mission is to attract eligible young people teach them the skills they need to become employable and independent and place them in meaningful jobs or further education
Program Performance
Performance Measure Four Quarters
Ending 063013 Four Quarters
Ending 063014
Placement in Employment or Education 746 767
Attainment of a Degree or Certificate 706 668
LiteracyNumeracy Gains 692 661
Additional Program Year 2013 Quarterly Data
Performance Measure
Four Quarters
Ending 093013
Four Quarters
Ending 123113
Four Quarters
Ending 033114
Placement in Employment or Education 757 760 765
Attainment of a Degree or Certificate 722 727 707
LiteracyNumeracy Gains 702 709 695
Performance in the Past Eight Quarters
The Performance in the Past Eight Quarters graph displays single quarter data versus the Program Performance tables which depict cumulative four quarter data
Quarter Highlights In May 2014 four Job Corps students from centers in Montana California Iowa and Virginia participated in the 2nd Asia-Pacific Economic Cooperation (APEC) Youth Skills Camp in Beijing and Guangzhou China the second time Job Corps students have participated in this event The camp included field visits to vocational training schools business enterprises and public practical training facilities as well as skills exchanges This international event provides students with life-changing experiences in travel diversity and first-hand exposure to global issues
Analysis bull During the current quarter Job Corps served 69979 participants including 13079 new
enrollees an increase of 801 percent overall compared to the same quarter in PY 2013 and due to the resumption of new enrollments after the PY 2012 enrollment suspensions The number of new students increased by over 200 percent from the same quarter in PY 2013
bull The proportion of 16-17 year olds served increased by 45 percentage points Conversely the proportion of all older students served similarly decreased from the same quarter in PY 2013
bull In the current quarter Job Corps placed 7203 students in Employment and Education a slight decrease of 04 percentage points compared to the same quarter last year In addition 8657 students attained a Certificate a 131 percentage point decrease compared to the same quarter in PY 2013 Also 6789 students attained a LiteracyNumeracy gain an 116 percentage point decrease over the same quarter in PY 2013
bull In the current quarter the program served 50 participants who were Veterans prior to enrollment bull When comparing the four quarter data Placement in Employment or Education increased
21 percentage points Attainment of a Degree or Certificate decreased 38 percentage points and LiteracyNumeracy Gains decreased 31 percentage points from the same quarter one year ago 21
WORKFORCE SYSTEM RESULTS
100
80
60
40
20
0 Sep-12 Dec-12 Mar-13 Jun-13 Sep-13 Dec-13 Mar-14 Jun-14
n Placement Rate for Out-of-School Youth Ages 18 and Above n Recidivism Rate for Youth Ages 14 to 17 n Recidivism Rate for Youth Ages 18 and Above
Workforce Investment Act Youthful Offender Initiative httpwwwdoletagovYouth_servicesyouthful_offendercfm
Program Description The Employment and Training Administration uses its Youthful Offender Appropriation to fund a variety of projects that target youth offenders and young adult offenders Currently operating projects include grants to community-based organizations to involve juvenile offenders in training and service learning projects grants to intermediary organizations to serve young offenders in high-poverty high-crime communities and grants to help youth enter diversion programs as an alternative to out-of-home placements and to assist eligible youth have their juvenile records sealed or expunged
Quarter Highlights The great majority of juvenile offenders are of ages 17 and below and many are still in high school The youth offender grants focus on helping younger youth stay in school and complete their education and helping older youth find jobs and succeed in the labor market Case management mentoring and supportive services are also provided by these grants
Performance in the Past Eight Quarters
Program Performance
Performance Measure Four Quarters
Ending 063013 Four Quarters
Ending 063014
Placement Rate for Youth Ages 18 and Above
36 362
Recidivism Rate for Youth Ages 14 to 17
35 24
Recidivism Rate for Youth Ages 18 and Above
34 16
Results are cumulative for currently operating grants
Additional Program Year 2013 Quarterly Data
Placement Rate for Youth Ages 18 and Above
277 334 325
Performance Measure
Four Quarters
Ending 093013
Four Quarters
Ending 123113
Four Quarters
Ending 033114
Recidivism Rate for Youth Ages 14 to 17
349 349 349
Recidivism Rate for Youth Ages 18 and Above
335 335 335
Analysis bull Providing opportunities to youthful offenders results in varying outcomes depending on
the mix of projects being operated in a given year bull Projects have markedly different placement and recidivism rates depending on whether
they are serving young adults in their 20s or youth ages 16-17 they recruit youth in the community or through direct referrals from the juvenile justice system whether they are located in small or large cities and the extent to which enrollees are at high or low risk of re-offending
22
WORKFORCE SYSTEM RESULTS
100
80
60
40
20
0 Jun-12 Jun-13 Jun-14
n Placement in Employment or Education n Attainment of a Degree or Certificate n LiteracyNumeracy Gains
Workforce Investment Act Youth Program httpwwwdoletagovyouth_services
Program Description The Workforce Investment Act Youth Formula Program provides employment and education services to eligible low-income youth ages 14 to 21 who face barriers to employment The program serves in-school and out-of-school youth youth with disabilities and low literacy rates as well as others who may require additional assistance to complete an educational program and acquire an industry-recognized credential or enter employment
Quarter Highlights The passage of the Workforce Innovation and Opportunity Act (WIOA) includes a major shift in focus to spending more funds on and serving more out-of-school youth (OSY) The workforce system demonstrated its readiness for this shift in that 48 percent of all youth served in PY 2013 were OSY and 57 percent of all WIA youth local area funds were spent on OSY So far in Program Year 2013 California has spent almost 65 percent of their WIA youth funds on OSY with high levels of OSY expenditures in both urban and rural areas 53 percent of all youth served in CA in Program Year 2013 were OSY For example Los Angeles City spent 80 percent of their funds on OSY and the Northern Rural Training and Employment Consortium spent 76 percent of their funds on OSY Both local areas have achieved these levels through strong partnerships with organizations that serve OSY as well as access to high quality work experiences
Program Performance
Performance Measure
Four Quarters
Ending 063012
(Program Year 2011)
Four Quarters
Ending 063013
(Program Year 2012)
Four Quarters
Ending 063014
(Program Year 2013)
Placement in Employment or Education 589 666 690
Attainment of a Degree or Certificate 648 675 684
LiteracyNumeracy Gains 476 509 525
Performance in the Past Three Program Years
Analysis bull 197045 participants were served in the cumulative four quarter reporting period compared
to 217244 served during the same time period last year This decrease is due primarily to a lower funding level compared to the previous year
bull Placement in Employment or Education achieved a result of 690 percent a 24 percentage point increase when compared with the same time period last year
bull The program achieved a result of 684 percent for the Attainment of a Degree or Certificate measure This is a 09 percentage point increase from the same time period last year
bull The LiteracyNumeracy Gains measure achieved a result of 525 percent an increase of 16 percentage points when compared with the same time period last year
bull All three youth common measures exceeded Program Year 2013 GPRA goals
23
WORKFORCE SYSTEM RESULTS
100
80
60
40
20
0 Sep-12 Dec-12 Mar-13 Jun-13 Sep-13 Dec-13 Mar-14 Jun-14
n Placement in Employment or Education n Attainment of a Degree or Certificate n LiteracyNumeracy Gains
YouthBuild httpwwwdoletagovyouth_servicesyouthbuildcfm
Program Description YouthBuild provides job training and educational opportunities for at-risk youth ages 16 to 24 while constructing or rehabilitating affordable housing for low-income or homeless families in their own neighborhoods The youth split their time between the construction site and the classroom where they earn their high school diploma or equivalency learn to be community leaders and prepare for college and other post-secondary training opportunities
Analysis bull 33392 participants have been enrolled into the YouthBuild program since 2007 and 29553
have exited so far bull Since the program began a total of 11716 participants have received a high school
diploma or equivalency 17572 have attained an industry-recognized certificate and 21835 have been placed into initial jobs post-secondary education andor long-term vocational occupational skills training including apprenticeship
bull The Class of 20102011 performance steadily increased The outcomes for all three measures were above those for the Class of 2009 and significantly above the GPRA goals
bull YouthBuild is currently meeting or exceeding the GPRA goal for all three measures The additional quarter of service for 20102011 grants provided additional positive outcomes as expected As the 2012 grant class progresses it is expected that this trend will continue
Program Performance
Quarter Highlights Just A Start in Cambridge (MA) has been a YouthBuild grantee since 2010 In the fourth quarter of the Program Year 2013 they shared the following success story
Victor earned a High School Diploma and HBIPACT construction certification He was accepted to Endicott College in MA He also secured a full time painting position with George Souza Painting making $25 per hour He continues to develop his career plan with staff
Class of 20102011 Performance in the Past Eight Quarters
Performance Measure GPRA Results for Class
0f 20102011 Results for Class 2012 Overall Results
Percent of Participants Entering Employment or Enrolling in Postsecondary Education the Military or Advanced Training Occupational Skills Training in the First Quarter After Exit
500 612 586 519
Percent of Youth Who Attain a Diploma GED or Certificate by the End of the Third Quarter after Exit
672 770 609 672
Percent of Participants Deficient in Basic Skills Who Achieve Literacy or Numeracy Gains of One Adult Basic Education Level
585 676 549 595
24
WORKFORCE SYSTEM RESULTS
100
80
60
40
20
0 Sep-12 Dec-12 Mar-13 Jun-13 Sep-13 Dec-13 Mar-14 Jun-14
n Attainment of a High School Diploma GED or improvement of basic skills by at least two grade levels or completed Occupational Skills training n Participants who Attained Two or more Goals
Indian and Native American Youth Program httpwwwdoletagovdinap
Program Description The Indian and Native American Supplemental Youth Services Program provides summer and year-round employment and training activities for Indian Alaska Native and Native Hawaiian individuals between the ages of 14 and 21 Program resources are targeted to at-risk and the neediest youth who face substantial barriers to education and employment success This population includes high school dropouts and youth who are basic-skills deficient
Quarter Highlights Youth summer employment is a high priority for Native American Tribes However most rural reservation areas do not have enough employers to put youth to work during the summer As a result Tribes rely on the annual WIA Section 166 funding to place youth in summer employment where they can earn a wage and receive valuable work experience
Over the past four quarter period 2487 of the 4399 youth that participated in the youth program were placed in summer employment Youth participants come from low income families with little or no opportunity to earn money during the summer months Through the Indian and Native American Youth Program these youth are given an opportunity to work and earn money during the summer which helps them contribute to their familyrsquos income
Performance in the Past Eight Quarters
Program Performance
Performance Measure Four Quarters
Ending 063013 Four Quarters
Ending 063014
Educational Attainment for Dropouts 180 220
Attainment of Two or More Goals 920 927
The data reported reflect the period from April 1 2012 through March 31 2013 The data reported reflect the period from April 1 2013 through March 31 2014
Additional Program Year 2013 Quarterly Data
Performance Measure Four Quarters
Ending 093013 Four Quarters
Ending 123113 Four Quarters
Ending 033114
Educational Attainment for Dropouts
250 250 220
Attainment of Two or More Goals
930 930 927
The data reported reflect the period from April 1 2013 through September 30 2013 The data reported reflect the period from April 1 2013 through March 31 2014
Analysis bull The Attainment of Two or More Goals rate increased slightly from 92 percent in June 2013
to 927 percent in June 2014 bull The Indian and Native American Youth Program served 4310 youth during the period July
1 2013 through June 30 2014 This is a 164 percentage point decrease in youth served one year ago
bull The Education Attainment for Dropouts increased from 18 percent in June 2013 to 22 percent in June 2014
25
WORKFORCE SYSTEM RESULTS
Green Jobs Innovation Fund Grants (GJIF) httpwwwdoletagovBRGGreenJobs
Program Description The Green Jobs Innovation Fund (GJIF) was authorized as a Pilot and Demonstration Project under the Workforce Investment Act (WIA) of 1998 to help workers receive job training in green industry sectors and occupations as well as access green career pathways GJIF is seeking to increase the number of individuals completing training programs who receive industry-recognized credentials and to increase the number of individuals completing training programs for employment in green jobs
With these grants the Department is emphasizing two key workforce programs that move participants along green career pathways by 1) forging linkages between Registered Apprenticeship and pre-apprenticeship programs andor 2) integrating the delivery of technical and basic skills training through community-based partnerships The grantees are building on existing programs that are already established and serving workers and moving workers into and along green career pathways The Green Jobs Innovation Fund (GJIF) grants are all anticipated to end by June 30 2015
Quarter Highlights The Jobs for the Future (JFF) GreenWays grant program made great progress toward their goal of increasing access for women to enter higher-paying non-traditional occupations Women currently comprise 254 of the programs total enrollment and are earning higher placement wages overall than men At the same time their completion rates credential attainment rates and job placement rates lag behind those of men reflecting the ongoing challenges that women experience in non-traditional occupations The JFF GreenWays program continues to focus on raising the visibility of this issue as a key element in regional approaches to addressing poverty in female-headed households
Program Performance
Performance Measure Cumulative
Four Quarters Ending 063013
Cumulative Four Quarters
Ending 063014
Entered Employment Rate 569 642
Employment Retention Rate 750 821
Six Monthsrsquo Average Earnings $16249 $17459
Additional Program Year 2013 Quarterly Data
Performance Measure
Cumulative Four
Quarters Ending
093013
Cumulative Four
Quarters Ending
123113
Cumulative Four
Quarters Ending
033114
Entered Employment Rate 560 626 641
Employment Retention Rate 790 795 785
Six Monthsrsquo Average Earnings $16406 $15228 $15039
Cumulative Credential Outcomes in the Past Three Quarters
Performance Measure Quarter Ending
123113
Quarter Ending
033114
Quarter Ending
063014
Number Completed Education Job Training Activities
5521 6438 7076
Number Completed Training and Received Credential
5343 6242 6849
Attainment Rate 97 97 97
Analysis As of June 30 2014 8360 participants were enrolled in educationtraining Of these participants 600 participated in Registered Apprenticeship 874 participated in Pre-Apprenticeship and 40 participated in On-the-Job Training A total of 7076 participants completed educationtraining A total of 6849 participants received a credential Lastly a total of 4870 participants entered employment and of these participants 4343 entered training-related employment
26
WORKFORCE SYSTEM RESULTS
Dec-13 Mar-14 Jun-14
100 $27000
$2600080
$2500060
$24000 40
$23000
20 $22000
0 $21000
n Entered Employment Rate n Employment Retention Rate n Six Months Average Earnings
H-1B Jobs and Innovation Accelerator Challenge Grants httpwwwdoletagovETA_News_Releases20111398cfm
Program Description The Jobs and Innovation Accelerator Challenge (Jobs Accelerator) is designed to help regions achieve the demonstrated benefits of collaborative cluster-based regional development This initiative represents the implementation of Administration policy priorities to accelerate bottom-up innovation in urban and rural regions as opposed to imposing ldquoone-size-fits-allrdquo solutions The Jobs Accelerator also meets Administration goals for smarter use of government resources through reduction of Federal silos and promotion of coordinated Federal funding opportunities that offer more efficient access to Federal resources Investments from Federal agencies for the Jobs Accelerator projects include The US Department of Laborrsquos Employment and Training Administration (DOL-ETA) the US Department of Commercersquos Economic Development Administration (DOC-EDA) and the National Institutes of Standards and Technologyrsquos Hollings Manufacturing Extension Partnership (NIST-MEP) the Small Business Administration (SBA) the Department of Energy Advanced Manufacturing Office (DOE AMO) and the Delta Regional Authority (DRA)
The objectives of the Jobs Accelerator are to
bull Accelerate the formation of new high-growth businesses and expansion of existing businesses
bull Accelerate the creation of higher-wage jobs bull Advance commercialization of research including Federally-funded research bull Support deployment of new processes new technologies and new products to grow sales
and generate employment bull Enhance the capacity of small businesses in the cluster including small and disadvantaged
businesses bull Increase exports and business interaction with international buyers and suppliers bull Develop the skilled workforce needed to support growing clusters and bull Ensure diverse workforce participation in clusters through outreach training and the
creation of career pathways
Quarter Highlights The Northeast Ohio Speed-To-Market Accelerator (STMA) program administered by Lorain County Community College aims to accelerate the speed-to-market for near production or pilot production prototypes stimulate job creation and increase the global competitiveness of cluster companies attract private capital and attract students incumbent workers and the unemployed
This quarter STMA helped accelerate the introduction of a new dry electrode product for heart monitoring This sensor and electronics will be introduced as part of the next generation of wearable human performance arm band from Pittsburgh based Body Media a subsidiary of Jawbone Further STMA continues to bring new companies into the STMA
program through cluster outreach activities and this quarter three new leads were generated as the result of the existing STMA partners MAGNET JumpStart Lorain County Community College and NorTech
Program Performance
Performance Measure Four Quarters
Ending 123113 Four Quarters
Ending 033114 Four Quarters
Ending 063014
Entered Employment Rate 307 283 359
Employment Retention Rate 907 925 927
Six Monthsrsquo Average Earnings $23310 $22953 $26682
Performance in the Past Three Quarters
Analysis A total of 3702 individuals were served 3632 individuals began educationjob training activities and 2052 individuals completed educationjob training services Of participants completing educationjob training 370 unemployed individuals completed training and entered employment and of these 114 individuals entered training-related employment A total of 204 employed individuals completed training and retained their current position and of these 85 employed individuals completed training and advanced into a new position A total of 2006 individuals completed educationtraining activities and received credentials and of these 2273 total credentials were awarded
This data represents three rounds of the for Jobs Accelerator initiative which includes the Jobs Accelerator Round 1 the Advanced Manufacturing Jobs Accelerator Round 2 and the Make it in America (MIIA) Jobs Accelerator grants program
27
WORKFORCE SYSTEM RESULTS
100 $56000
80 $54000
$52000 60 $50000
40 $48000
$46000 20
$44000
0 $42000 Dec-13 Mar-14 Jun-14
n Entered Employment Rate n Employment Retention Rate n Six Months Average Earnings
H-1B Technical Skills Training Grants httpwwwdoletagovbusinessH1B_Tech_Skillscfm
Program Description The H-1B Technical Skills Training (TST) Grants were authorized by the American Competitiveness and Workforce Improvement Act of 1998 (ACWIA) as amended (29 USC 2916a) to provide education training and job placement assistance in the occupations and industries for which employers are using H-1B visas to hire highly-skilled foreign workers on a temporary basis and the related activities necessary to support such training The H-1B TST Grant Program is intended to raise the technical skill levels of American workers so they can obtain or upgrade employment in high-growth industries and occupations Over time these education and training programs will help businesses reduce their use of skilled foreign professionals permitted to work in the US on a temporary basis under the H-1B visa program The grants represent significant investments in sectors such as information technology advanced manufacturing and health care In addition these grants will focus on serving participants who have been identified as long-term unemployed particularly those who have been unemployed the longest These grants also have an emphasis on providing on-the-job training allowing participants to learn new skills while earning a pay check To date ETA has announced two rounds of TST grants totaling $342 million The first round was announced on October 4 2011 and the second round was announced on February 22 2012
Quarter Highlights The Los Angeles HealthWorks On-the-Job training (OJT) initiative administered by Managed Career Solutions Inc (MCS) provides individuals with training that leads to industry recognized credentials and employment opportunities within the regionrsquos healthcare field MCS maintains several strong partnerships to coordinate outreach recruitment training OJT placements and employment opportunities As of June 30 2014 MCS served nearly 800 long-term unemployed participants and overall 1100 participants In the same period over 650 individuals completed training and earned an industry recognized credential Of those completers 128 were employed at participation however the majority were underemployed and gained the necessary job skills and credentials that allowed 80 percent to advance into a new position In recognition MCS received the Malcom Baldrige and State Eureka awards
Analysis bull 52532 individuals were served and 51071 individuals began educationjob training
activities bull 15185 individuals completed educationjob training activities including 3321 unemployed
individuals who completed training and entered employment bull Of these 2925 individuals entered training-related employment 2902 employed individuals
completed training and retained their current position 1452 employed individuals completed training and advanced into a new position
bull 11944 individuals completed educationjob training activities and received credentials with 14099 total credentials awarded
Program Performance
Performance Measure
Four Quarters
Ending 123113
Four Quarters
Ending 033114
Four Quarters
Ending 063014
Entered Employment Rate 778 725 675
Employment Retention Rate 993 944 926
Six Monthsrsquo Average Earnings $54683 $50833 $46245
Since the H-1B TST program provides training to incumbent unemployed and long-term unemployed workers to prepare them for jobs in a variety H-1B industries andor occupations the Entered Employment Rate and Six Monthsrsquo Average Earnings can vary For the quarter ending on June 30 2014 the H-1B TST program saw a decline in the Entered Employment Rate and Six Monthsrsquo Average Earnings in comparison with the results for the previous rolling four quarters Previous results reflected a large number of incumbent workers who enrolled in short-term high-skilled training and exited early leading to a relatively high Six Monthsrsquo Average Earnings As the projects progress unemployed and long-term unemployed workers who required longer-term training begin to exit the program and search for jobs Ultimately as they enter employment wages may be less than those achieved by the higher-skilled incumbent workers who either retain or advance in their positions after training
Performance in the Past Three Quarters
28
WORKFORCE SYSTEM RESULTS
100 $21000
$19000 80
$17000
$1500060 $13000
40 $11000
$900020
$7000
0 $5000Sep-12 Dec-12 Mar-13 Jun-13 Sep-13 Dec-13 Mar-14 Jun-14
n Entered Employment Rate n Employment Retention Rate n Six Months Average Earnings
Community-Based Job Training Grants (CBJT) httpwwwdoletagovbusinessCommunity-BasedJobTrainingGrantscfm
Program Description Community-Based Job Training Grants (CBJT) seek to strengthen the role of community colleges in promoting the United States workforcersquos competitiveness The program does this by building the capacity of community colleges to train workers in skills required to succeed in regionally based high-growth high-demand industries and occupations Important grant activities include training in the healthcare biotech advanced manufacturing energy automotive transportation construction insurance forestry and aerospace industries The first round of CBJT grants were awarded in October 2005 To date ETA has announced five rounds of CBJT grants awarding 320 grants to community colleges and other organizations All CBJT grants ended as of June 30 2014
Quarter Highlights The 14 remaining projects active in this quarter represent the culmination of another successful DOL initiative Some of the significant accomplishments include the development and sustainability of Roane State Community Collegersquos Lean Manufacturing program designed to meet the needs of local manufacturing employers the San Jacinto Community College Districtrsquos Gulf Coast Healthcare Partners project which developed training to support healthcare career and Central Arizona Collegersquos Pinal County Alternative Energy Project More than half of the CBJT participants who began education and training activities completed their programs 79 percent of them received an industry recognized credential ie certificate or degree Eighty-four percent of the participants who gained employment entered into new training-related positions
Program Performance
Performance Measure Four Quarters
Ending 063013 Four Quarters
Ending 063014
Entered Employment Rate 572 662
Employment Retention Rate 891 899
Six Monthsrsquo Average Earnings $18675 $17027
Additional Program Year 2013 Quarterly Data
Performance Measure
Four Quarters
Ending 093013
Four Quarters
Ending 123113
Four Quarters
Ending 033114
Entered Employment Rate 57 605 655
Employment Retention Rate 891 897 891
Six Monthsrsquo Average Earnings $18675 $18285 $16642
Performance in the Past Eight Quarters
Analysis bull 268359 individuals have been served through the initiative bull 258216 individuals began educationjob training activities bull 165264 individuals completed educationjob training activities Of these
bull 131107 individuals received credentials bull 65089 individuals entered new positions of employment and 54344 individuals entered new
positions of training-related employment
Note All data are cumulative Prior to new reporting requirements implemented in the quarter ending December 31 2011 grantees only reported results for individuals that entered employment and individuals that entered training-related employment (noted above) if those participants entered employment and completed training in the same quarter As a result prior to that quarter participants that entered employment in quarters after they completed training were captured in the Common Measures and the total number of individuals that ultimately entered employment and training-related employment are actually higher than the results above indicate
29
WORKFORCE SYSTEM RESULTS
100 92
7880
5760
40
20
0
n Percent of Target Number of Programs Launched by Round
Round 1 Round 2 Round 3
Trade Adjustment Assistance Community College and Career Training (TAACCCT) Grants httpwwwdoletagovtaaccct
Program Description The Trade Adjustment Assistance Community College and Career Training (TAACCCT) Grant Program is authorized by the Trade Act of 1974 under Chapter 4 of Title II The purpose of this grant program is to provide eligible institutions of higher education with funds to expand and improve their ability to deliver education and career training programs that can be completed in two years or less and that result in skills degrees and credentials that prepare program participants for employment in high-wage high-skill occupations and are suited for workers who are eligible for training under the Trade Adjustment Assistance (TAA) for Workers program under Chapter 2 of Title II of the Trade Act The TAACCCT Grant Program is funded under the Health Care and Education Reconciliation Act of 2010 which appropriated $500 million for the program for each of Fiscal Years 2011-2014 for a total of $2 billion
Round 1 ndash FY 2011 Grants On June 30 2014 grants awarded in Round 1 (FY 2011) had completed all but one quarter of their periods of performance By the end of their final year of the grant the forty-nine (49) Round 1 grantees project that they will offer a total of 906 new programs of study As of June 30 2014 grantees began offering 834 (92 percent) of these programs of study
Round 2 ndash FY 2012 Grants The seventy-nine (79) grants awarded in the Fiscal Year 2012 had completed seven quarters of their grants at the end of June 30 2014 Their period of performance began on October 1 2012 and will end on September 30 2016 however their final year will be dedicated to gathering information and data for reporting outcome measures and completing the requirements for a third-party evaluation They project that by the end of the third year they will have launched 761 programs As of the end of June 30 2014 they had began offering 561 (78 percent) of these programs
Round 3 ndash FY 2013 Grants Grants awarded in FY 2013 had completed the first three quarters of their period of performance Their grants began on October 1 2013 and will end on September 30 2017
In their third year they will have launched all of their programs as their final year will be dedicated to collecting follow up data for evaluation and reporting purposes only The fifty-seven (57) grantees plan to launch 551 programs As of June 30 2014 they had already launched 288 (57 percent) of these programs
Percentage of Target Number of Programs Launched as of June 30 2014 by Grant Round
Performance Information Programmatic data is collected at different intervals throughout the period of performance including
bull Quarterly Narrative Progress Reports (QNPR) Grantees will provide quarterly qualitative data on the capacity building taking place through progress and other implementation measures that grantees defined in their Statements of Work
bull Annual Performance Reports (APR) Grantees will provide annual quantitative data on their training and employment outcomes for TAACCCT program participants that are impacted by the capacity building activities being implemented by their grants
30
WORKFORCE SYSTEM RESULTS
$4500000 3500$4000000 3000$3500000
2500
Jun-13 Dec-13 Mar-14 Jun-14
Amou
nt $3000000 2000$2500000
$2000000 1500 $1500000 1000 $1000000
500$500000 $0 0
n Amount of Revenue Generated n Number of Tickets Assigned
Disability Employment Initiative (DEI) httpwwwdoletagovdisability
Program Description All DEI Workforce Employment Network (EN) Trends
Launched in 2010 the Disability Employment Initiative (DEI) seeks to improve education training and employment opportunities for youth and adults with disabilities who are unemployed underemployed andor receiving Social Security disability benefits The DEI is jointly funded by the US Department of Laborrsquos Employment and Training Administration and Office of Disability Employment Policy DEI projects improve collaboration among employment and training and asset development programs implemented at state and local levels including the Social Security Administrationrsquos Ticket to Work Program and build effective partnerships that leverage resources to better serve individuals with disabilities and improve employment outcomes
Quarter Highlights A variety of Department of Labor programs helped Vietnam-era veteran Richard James navigate through life After servicing B-52 bombers in the Air Force James held a series of sales jobs while putting himself through law school at night He rose to become a successful New England attorney and owner of a boat dock building company when he suffered a terrible head injury which caused spine and nerve damage Addiction to pain medication followed and James ended up homeless While recovering from his injuries James took a college course through the Veterans Retraining Assistance Program managed in part by the Department He received career counseling from a Disabled Veterans Outreach Program representative at a local American Job Center and support from the DEI Disability Resource Coordinator Eventually James was hired as an attorney by a Rhode Island law firm The departments grants and programs made possible the services that put me back in a position of being a productive member of society he said
Program Performance
Performance Measure Quarter Ending 63013
Quarter Ending
123113
Quarter Ending 33114
Quarter Ending 63014
Analysis bull The Exit Rate for Adult and Youth exiters with disabilities in Round one DEI sites is almost
double the national average Adult DEI was 89 percent vs All StatesAll LWIAs 49 percent Older Youth DEI 166 percent vs All StatesAll LWIAs 87 percent Younger Youth DEI 339 percent vs All StatesAll LWIAs 151 percent
bull The CredentialSkill Attainment Rate for older and younger youth with disabilities in Round 1 DEI sites was higher than the national average Older Youth DEI credential rate 568 percent vs All StatesAll LWIAs 383 percent Younger Youth DEI skill rate 902 percent vs All States All LWIAs 834 percent
bull The Exit Rate for Adult and Youth exiters with disabilities in Round two DEI sites is higher than the national average Adult DEI 56 percent vs All StatesAll LWIAs 49 percent Older Youth DEI 163 percent vs All StatesAll LWIAs 87 percent and Younger Youth DEI 167 percent vs All StatesAll LWIAs 151 percent
bull The Entered Employment Rate for Adult DEI sites 657 percent is 20 percent higher than in All StatesAll LWIAs 434 percent
bull DEI Workforce Employment Networks (EN) activity shows that the number of Tickets assigned increased from 1780 to 2903 an increase of 1123 and the amount of revenue
Number of Tickets Assigned 1780 1590 2554 2903 generated from DEI EN payments increased from $2373404 to $4057353 an increase of $168 million Amount of Revenue Generated $2373404 $1927104 $3505582 $4057353
31
WORKFORCE SYSTEM RESULTS
ETA Internet-Based Assistance (E-TOOLS) wwwcareerinfonetorg wwwservicelocatororg wwwcareeronestoporg wwwonetonlineorg wwwmyskillsmyfutureorg wwwmynextmoveorg
Program Description Additional Program Year 2013 Quarterly Data
Performance Measure Quarter Ending
093013
Quarter Ending
123113
Quarter Ending
033114
CareerOneStop Portal Visits 5754645 5159240 5340022
ETArsquos Internet-based assistance includes electronic tools that help individuals explore career opportunities and link to job postings either on their own or at local American Job Centers to make informed employment and education choices
The Web sites feature user-friendly occupation and industry information salary data career videos education resources career exploration assistance and other resources that support talent development in todayrsquos fast-paced global marketplace Users can find information some of which is also industry sponsored about occupations that are in-demand in high growth industries Additionally information is available regarding occupational skills and workplace competencies
Quarter Highlights For the year ending June 2014 CareerOneStop launched a new portal for Ex-Offenders added Federal Contractor job tagging a TAACCCT information finder Youth Council information to Americarsquos Service Locator and began working on adding more job feeds
Americarsquos Service Locator (ASL) Visits
730998 758919 724053
ONET Downloads 26646 29407 28505
ONET Visits 7697608 10211177 11500039
Combined Visits 14183251 16129336 17564114
Performance in the Past Eight Quarters
25000000 $36000
Sep-12 Dec-12 Mar-13 Jun-13 Sep-13 Dec-13 Mar-14 Jun-14
n Combined Visits (in millions) n ONET Product Downloads (in thousands)
$31500 20000000
ONE
T Pr
oduc
t Dow
nloa
ds
$27000
Com
bine
d Vi
sits
$2250015000000 $18000
10000000 $13500
$90005000000
$4500
$00
ONET has added web services for developers and increased the available Tools and Technology and Detailed Work Activities information to convey specialized occupational attributes
Program Performance
Performance Measure Quarter
Ending 063013 Quarter
Ending 063014
CareerOneStop Portal Visits 5104850 5472742
Americarsquos Service Locator (ASL)Visits
747114 802148
ONET Downloads 29482 25278
ONET Visits 8716609 13581922
Combined Visits 14568573 19856812
Analysis bull ETA Internet-Based Assistance received 19856812 combined visits for the quarter ending
June 30 2014 an increase of 36 percent over the same period in 2013 bull Visits to CareerOneStop increased to 5472742 or 72 percent over the same period in 2013
with mySkillsmyFuture continuing to be a popular tool with an increase of 23 percent bull Americarsquos Service Locator Visits traffic increased 74 percent over the same period in 2013 bull The ONET traffic received 13581922 visits in this quarter an increase of 558 percent
over the same period in 2013 and the ONET downloads totaled 25278 for the quarter a decrease of 142 percent
32
WORKFORCE SYSTEM RESULTS
Glossary of Performance Measures
Common Performance Measures Common Performance Measures are used by Workforce Investment Act Indian and Native American Program Disability Program Navigator Initiative Wagner-Peyser Trade Adjustment Assistance Senior Community Service Employment Program Reintegration of Ex-Offenders Registered Apprenticeship Program Job Corps National Farmworker Jobs Program High Growth Job Training Initiative and Community-Based Job Training Grants
Adult Measures Entered Employment Of those who are not employed at the date of participation the number of adult participants who are employed in the first quarter after the exit quarter divided by the number of adult participants who exit during the quarter
Employment Retention Of those who are employed in the first quarter after the exit quarter the number of adult participants who are employed in both the second and third quarters after the exit quarter divided by the number of adult participants who exit during the quarter
Six Monthsrsquo Average Earnings Of those adult participants who are employed in the first second and third quarters after the exit quarter total earnings in the second quarter plus the total earnings in the third quarter after the exit quarter divided by the number of adult participants who exit during the quarter
Average Earnings Change in Six Months1
Of those who are employed in Q1 after exit the total post-program earnings (earnings in Q2 + Q3 after exit) minus pre-program earnings (earnings in Q2 + Q3 prior to registration) divided by the number of adults who exit during the quarter
Youth Measures Attainment of a Degree or Certificate Of those enrolled in education (at the date of participation or at any point during the program) the number of youth participants who attain a diploma GED or certificate by the end of the third quarter after the exit quarter divided by the number of youth participants who exit during the quarter
1 This definition was used for earnings in PY 2005 Q=quarter
33
Literacy and Numeracy Gains Of those out-of-school youth who are basic skills deficient the number of youth participants who increase one or more educational functioning levels divided by the number of youth participants who have completed a year in the program (ie one year from the date of first youth program service) plus the number of youth participants who exit before completing a year in the program
Placement in Employment or Education2
Of those who are not in postsecondary education or employment (including the military) at the date of participation the number of youth participants who are in employment (including the military) or enrolled in postsecondary education andor advanced trainingoccupational skills training in the first quarter after the exit quarter divided by the number of youth participants who exit during the quarter
Program-Specific Performance Measures
Disability Employment Initiative (DEI) Number of Tickets Assigned Number of individuals on Social Security Administration (SSA) disability benefits who assigned their Ticket to the workforce board agency or American Job Center as their designated Employment Network under the SSA Ticket to Work program All DEI pilot sites must become an Employment Network under Ticket to Work
Amount of Revenue Generated Under the SSA Ticket to Work program when jobseekers who receive SSA disability benefits assign their Ticket to a workforce board agency or American Job Center as an Employment Network and then achieve certain employment milestones the Employment Network receives money or ldquoTicket revenuerdquo
2 Because of its intensity and duration the YouthBuild performance measure for placement in employment or education does not exclude those who entered the program with a job or in college
WORKFORCE SYSTEM RESULTS
Foreign Labor Certification Percent of H-1B Applications Resolved in Seven Business Days This estimate is based on the total number of applications processed within seven business days divided by the total number of applications processed for a given reporting period An application is considered processed if the last significant event is (1) certified (2) denied or (3) withdrawn
Average Number of Days to Resolve PERM Applications Not Subject to Integrity Review The average processing time between case receipt and decision date for non-audited cases
Average Number of Days to Resolve PERM Applications Subject to Integrity Review The average processing time between case receipt and decision date for audited cases
Percent of Complete H-2A Employer Applications Resolved within 30 Days Before the Date of Need This estimate is based on the total number of complete applications resolved within 30 days before the date of need divided by the total number of applications processed for a given reporting period
Percent of H-2B Applications Processed Within 30 Days of Receipt This estimate is based on the total number of applications processed within 30 days of receipt divided by the total number of applications processed for a given reporting period An application is considered processed if the last significant event is (1) certified (2) denied or (3) withdrawn
Indian and Native American Youth Attainment of Two or More Goals The total number of youth participants enrolled in the Granteersquos Supplemental Youth Services Program who attained at least two of the 14 goals listed below divided by the total number of Supplemental Youth Services participants enrolled during the report period The 14 goals include
1 Completed Job ReadinessOrientation to the World of Work Training 2 Completed Internship or Vocational Exploration Program
3 Completed Career Assessment 4 Entered Unsubsidized Employment 5 Remained in School 6 Returned to School Full Time 7 Enrolled in Job Corps 8 Improved Basic Skills Level By At Least Two Grades 9 Attained High School Diploma 10 Attained GED 11 Completed Occupational Skills Training 12 Completed Leadership Skills Training 13 Entered Other (Non-Supplemental Youth) Training Program 14 Summer Employment
Educational Attainment for Dropouts The number of dropouts who have obtained a high school diploma GED or increased their literacy and numeracy by two grade levels divided by the total number of dropouts
Job Corps Measures Placement in Employment or Education Percent of Job Corps participants3 entering employment or enrolling in post-secondary education andor advanced skills trainingoccupational skills training in the first quarter after exit from the program
Attainment of a Degree or Certificate Percent of students who attain a GED HSD or certificate
Literacy Numeracy Gains Percent of students who achieve literacy or numeracy gains of one or more Adult Basic Education (ABE) levels
3 Calculation of the Placement rate measure does not include outcomes for students who participated in the program for less than 60 days
34
WORKFORCE SYSTEM RESULTS
Internet-Based Assistance Web Site Visits ETArsquos Internet-based assistance includes electronic tools that help individuals make informed employment and education choices The measure for tracking the overall performance and usage of these tools is Web site visits A visit is defined as a series of page requests from the same uniquely identified client with a time of no more than 30 minutes between each page
request
ONet Product Downloads The ONET product downloads count the number of unique users who download an ONET online resource (wwwonetcenterorg) which includes the ONET database (all versions) ONET technical reports (such as on green jobs) supplemental data files (lay titles tools and technology) the ONET Career Exploration Tool files ONET Survey questionnaires and other related materials such as the Toolkit for Business
Registered Apprenticeship Program Entered Employment Rate Percent of apprentices employed in the first quarter after exit who either completed or cancelled from their Registered Apprenticeship Program
Employment Retention Rate Percent of apprentices employed in the first quarter after exit still employed in the second and third quarter after exit who either completed or cancelled from their Registered Apprenticeship Program
Six Monthsrsquo Average Earnings Six month Average Earnings of apprentices employed in the first quarter after exit still employed in the second and third quarter after exit who either completed or cancelled from their Registered Apprenticeship Program
Reintegration of Ex-OffendersmdashAdult Program Recidivism Rate The percentage of participants who are rearrested for a new crime or re-incarcerated for revocation of a parole or probation violation within one year from release from prison
Senior Community Service Employment Program Service Level The count of participants during the report period divided by the total number of authorized grantee community service positions
Community Service The number of community service hours as reported by each grantee divided by the total community service hours funded for the grantee adjusted for minimum wage differences among the states
Most-in-Need Most-in-need means participants with one or more of the following characteristics have a severe disability are frail are age 75 or older are age-eligible but not receiving benefits under Title II of the Social Security Act reside in an area with persistent unemployment and have severely limited employment prospects have limited English proficiency have low literacy skills have a disability reside in a rural area are Veterans have low employment prospects have failed to find employment after utilizing services provided under Title I of the Workforce Investment Act of 1998 (29 USC 2801 et seq) or are homeless or at risk for homelessness (sect 513(b)(1)(E) as amended by Pub L No 109-365)
Unemployment Insurance Percent of Payments Made Timely The percentage of intrastate Unemployment Insurance benefit first payments for full weeks of unemployment issued within 14 days following the first compensable week in states with a waiting week and 21 days in non-waiting week states
Detection of Recoverable Overpayments The amount of overpayments (dollars) established through state operations as a percent of the estimated amount states can detect and establish for recovery
Entered Employment Rate The percent of persons receiving a first payment in a given quarter who had earnings in the next quarter
Percent of Employer Tax Liability Determinations Made Timely The percent of new employer determinations made within 90 days of the end of the quarter in which employers became liable to pay unemployment taxes
35
WORKFORCE SYSTEM RESULTS
YouthBuild Attainment of a Degree or Certificate Of those enrolled the number of youth participants who attain a diploma high school equivalency degree or industry-recognized certificate by the end of the third quarter after the exit quarter divided by the number of youth enrolled (minus youth exited for other reasons)
Literacy and Numeracy Gains Of those youth participants who are basic skills deficient at enrollment the number of youth participants who increase one or more educational functioning levels within one year of enrollment divided by the number of youth participants who have completed a year in the program
Placement in Employment or Education The number of youth participants who are in employment (including the military) or are enrolled in post-secondary education andor advanced trainingoccupational skills training in the first quarter after the exit quarter divided by the number of youth participants who exited during the previous quarter
Youthful Offender Projects Placement Rate The placement rate is the percentage of out-of-school youth ages 18 and above placed in unsubsidized jobs occupational training post-secondary education or the military
Recidivism Rate The recidivism rate is the percentage of youth offenders who have been convicted of a new crime within 12 months of their release of a correctional facility or being placed on probation
36
WORKFORCE SYSTEM RESULTS
2471 American Job Centers formerly known as One-Stop Career Centers
12 VT
9 HI
1 GU
6 DC
2 VI
15 NE
16 SD
12 ME
19 IA
19 AK
19 WV
4 DE
47 AL
55 CO
48 MN
57 WI
89 NC
60 GA
31 MA
23 NM
16 ND
47 AR
70 PA
18 CT 4 RI
12 NV
20 WY
22 KS
18 PR
89 OH
69 TN
102 FL
59 AZ 46
SC
12 NH
29 NJ
52 VA
22 MT
33 OK
39 MS
59 WA
61 IL 34 MD
47 OR
131 KY
62 LA
83 IN
33 UT
44 MO
26 ID 90
NY95 MI
1 to 25
25 to 50
50 to 75
75 to 100
Over 100
203 CA
180 TX
Source Americarsquos Service Locator (wwwServiceLocatororg) Americarsquos Service Locator connects individuals to employment and training opportunities available at local American Job Centers The Web site provides contact information for a range of local work-related services including unemployment benefits career development and educational opportunities As of March 17 2015
37
WORKFORCE SYSTEM RESULTS
United States Department of Labor
200 Constitution Avenue NW
Washington DC 20210
wwwdolgov
- A9RFAFEtmp
- DOL_Workforce_Rprt_Jun_2014_51415-dp
-
- Workforce System Results
-
- Contents
- Quarterly Spotlight
- People Served by Program
- Current Appropriations
- Government Performance and Results Act Goals (GPRA)
- Indian and Native American Adult Program (INAP)
- National Farmworker Jobs Program (NFJP)
- Senior Community Service Employment Program (SCSEP)
- Wagner-Peyser Employment Service
- Workforce Investment Act Adult Program
- Workforce Investment Act Dislocated Worker Program
- H-1B and Permanent Foreign Labor Certification (PERM)
- H-2A and H-2B Foreign Labor Certification Programs
- Reintegration of Ex-Offenders (RExO-ADULT)
- Registered Apprenticeship
- Registered Apprenticeship
- Trade Adjustment Assistance (TAA)
- Unemployment Insurance (UI)
- Unemployment Insurance (UI)
- Job Corps
- Workforce Investment Act Youthful Offender Initiative
- Workforce Investment Act Youth Program
- YouthBuild
- Indian and Native American Youth Program
- H-1B Jobs and Innovation Accelerator Challenge Grants
- H-1B Technical Skills Training Grants
- Community-Based Job Training Grants (CBJT)
- Trade Adjustment Assistance Community College and Career Training (TAACCCT) Grants
- Disability Employment Initiative (DEI)
- ETA Internet-Based Assistance (E-TOOLS)
- Glossary of Performance Measures
- 2471 American Job Centers formerly known as One-Stop Career Centers
-

WORKFORCE SYSTEM RESULTS
0
20
40
60
80
100
Sep-12 Dec-12 Mar-13 Jun-13 Sep-13 Dec-13 Mar-14 Jun-14 $5000 $7000 $9000 $11000 $13000 $15000 $17000 $19000 $21000 $23000 $25000
n Entered Employment Rate n Employment Retention Rate n Six Months Average Earnings
Registered Apprenticeship httpwwwdoletagovoa
Additional Program Year 2013 Quarterly Data
Performance Measure
Four Quarters
Ending 093013
Four Quarters
Ending 123113
Four Quarters
Ending 033114
Entered Employment Rate 735 738 738
Employment Retention Rate 874 877 878
Six Monthsrsquo Average Earnings $24171 $24324 $24378
Performance in the Past Eight Quarters
Analysis bull During the third quarter of Fiscal Year 2014 there were over 394000 active apprentices
nationwide while over 13000 program participants completed their apprenticeship and received a credential that is portable industry recognized and can provide a pathway to middle-class and sustainable careers
bull The Entered Employment Rate for participants who completed their Registered Apprenticeship program was 856 percent 114 percentage points higher than for all program exiters who either completed or cancelled (742 percent as shown in table on the previous page)
bull The Employment Retention Rate for program completers was 910 percent 32 percentage points higher than for all program exiters (878 percent as shown in table on the previous page)
bull The Six Monthsrsquo Average Earnings for program completers was $29964 which is over $5577 more than that of all program exiters (ie completers or those who cancelled) The results for those completing the program shows it pays to stay
17
WORKFORCE SYSTEM RESULTS
100
80
60
40
20
0 Sep-12 Dec-12 Mar-13 June-13 Sep-13 Dec-13 Mar-14 Jun-14
n Entered Employment Rate n Employment Retention Rate n Six Months Average Earnings
$25000
$21000
$17000
$13000
$9000
$5000
Trade Adjustment Assistance (TAA) httpwwwdoletagovtradeact
Program Description The Trade Adjustment Assistance (TAA) Program is an integral part of the comprehensive workforce development system The program is essential to helping workers dislocated by foreign trade to adjust to changing market conditions and shifting skill requirements Addressing the needs of trade-affected workers involved in this transformation is a unique challenge because in general these workers are being dislocated from relatively outdated-skill high-wage employment In many cases this is complicated by mass layoffs or plant closures that occur in single-industry towns which makes finding comparable employment in the same geographic area difficult Furthermore many of these jobs are lost permanently from the domestic economy requiring affected workers to completely retool their skills
Fiscal Year Highlights During Fiscal Year 2014 Massachusetts diligently trained staff at the local CareerOneStop Centers to ascertain a TAA participantrsquos eligibility for other funding resources to assist in their reemployment initiatives These improved efforts to provide and report reemployment services enables Trade customers to flow through the CareerOneStop Center system with other dislocated workers and receive seamless resources through the resource sharing initiatives of the Career Center methodology These streamlined reemployment services have resulted in an Entered Employment Rate of 815 percent nearly ten percentage points higher than the national average
Program Performance
Performance Measure FY 2011 FY 2012 FY 2013 FY 2014
Entered Employment Rate 653 689 716 729
Employment Retention Rate 897 913 917 911
Six Monthsrsquo Average Earnings $18319 $18837 $18099 $17828
Performance Measure Quarter Ending 063013 Quarter Ending 063014
Entered Employment Rate 733 728
Employment Retention Rate 900 927
Six Monthsrsquo Average Earnings $18210 $17692
Additional Program Year 2013 Quarterly Data
Performance Measure Quarter Ending
093013
Quarter Ending
123013
Quarter Ending
033014
Entered Employment Rate 713 713
Employment Retention Rate 918 918
Six Monthsrsquo Average Earnings $17499 $17499
Performance in the Past Eight Quarters
727
917
$17550
Analysis During Fiscal Year 2014 there were 62706 total participants receiving TAA benefits or services and 20577 exiters entered employment (729 percent) More than one-third of all participants were minorities with the average age of participants being 47 years and the average tenure being approximately 13 years 9547 exiter participants received credentials or 83 percent of all exiter participants who completed training 32527 participants received training or approximately 52 percent of all participants Lastly the program served 4828 Veteran participants accounting for approximately eight percent of all participants
18
WORKFORCE SYSTEM RESULTS
Unemployment Insurance (UI) httpouidoletagovunemploy
Program Description The federal-state Unemployment Insurance (UI) System minimizes individual and family financial hardship due to unemployment and stabilizes the economy during economic downturns by providing unemployed workers with temporary income support States operate their own Unemployment Insurance Programs regulated by State laws
As the Federal partner DOL provides program leadership allocates administrative funds provides technical assistance and exercises performance oversight
Quarter Highlights As the economy improved the system emphasized program integrity solvency and reemployment Claims rates decreased about 10 percent from the year before and Trust Fund loans decreased from $21 billion to $14 billion EUC benefit payments ceased on December 28 2013 Twenty-four states implemented Short-term Compensation programs allowing unemployed workers to stay on jobs while receiving partial unemployment benefits proportionate to reduced work hours States implemented systems to improve efficiency and reduce overpayments such as data exchange and recover UI overpayments By June 30 2014 42 states were recovering overpayments through Federal Income tax refund offset (TOP) and had recovered $370 million in 2014 (over $840 million since TOPrsquos inception)
Analysis During the year ending June 30 2014
bull 51 million UI claimants were reemployed in the quarter following their UI 1st payments (17 million in the last quarter)
bull The UI system met two and failed two of its four targets UI met detection of overpayments (643 percent vs target of 542 percent) and met reemployment (657 percent vs target of 647 percent)
bull The system fell short of its 1st pay and status targets because of retirements and other turnover of key staff
Program Performance
Performance Measure Four Quarters
Ending 063013 Four Quarters
Ending 063014
Percent of Intrastate Payments Made Timely
812 792
Detection of Recoverable Overpayments Rate
598 643
Facilitation of Reemployment Rate 6261 6552
Percent of Employer Tax Liability 888 882
Operational Results
Recipiency Rate 263 272
Exhaustion Rate 456 431
Percent of Recipients of Prime Working Age (25-54)
702 700
Percent of Recipients Who Are Female
434 437
New Initial Unemployment Insurance Claims
13906868 12501014
Number of First Unemployment Insurance Payments
8404507 7632522
Average Duration of Unemployment Insurance (Weeks)
169
1 Reemployment for year ending June 30 2013 2 Reemployment for year ending June 30 2014
19
167
WORKFORCE SYSTEM RESULTS
Unemployment Insurance (UI) httpouidoletagovunemploy
Additional Program Year 2013 Quarterly Data
Performance Measure Four Quarters
Ending 093013 Four Quarters
Ending 123113 Four Quarters
Ending 033114
Percent of Intrastate Payments Made Timely
809 802 793
Detection of Recoverable Overpayments Rate
590 630 603
Facilitation of Reemployment Rate 6311 6312 6363
Percent of Employer Tax Liability 886 885 884
Operational Results
Recipiency Rate 263 262 267
Exhaustion Rate 453 446 437
Percent of Recipients of Prime Working Age (25-54)
702 702 701
Percent of Recipients Who Are Female
434 434 435
New Initial Unemployment Insurance Claims
13559233 13340263 12947493
Number of First Unemployment Insurance Payments
8215687 7967852 7857395
Average Duration of Unemployment Insurance (Weeks)
169 169 168
1 Reemployment for year ending September 30 2013 2 Reemployment for year ending December 31 2013 3 Reemployment for year ending March 31 2014
20
WORKFORCE SYSTEM RESULTS
100
80
60
40
20
0 Sep-12 Dec-12 Mar-13 Jun-13 Sep-13 Dec-13 Mar-14 Jun-14
n Placement in Employment or Education n Attainment of a Degree or Certificate n LiteracyNumeracy Gains
Job Corps httpwwwjobcorpsgovhomeaspx
Program Description Job Corps is the nationrsquos largest residential educational and career technical training program for at-risk youth ages 16 through 24 The 125 Job Corps centers nationwide provide an integrated comprehensive array of services that include academic career technical and life skills training career planning and work-based learning health care and post-program placement and transition support
Job Corps is committed to offering all students a safe drug-free environment where they can take advantage of the resources provided Job Corpsrsquo mission is to attract eligible young people teach them the skills they need to become employable and independent and place them in meaningful jobs or further education
Program Performance
Performance Measure Four Quarters
Ending 063013 Four Quarters
Ending 063014
Placement in Employment or Education 746 767
Attainment of a Degree or Certificate 706 668
LiteracyNumeracy Gains 692 661
Additional Program Year 2013 Quarterly Data
Performance Measure
Four Quarters
Ending 093013
Four Quarters
Ending 123113
Four Quarters
Ending 033114
Placement in Employment or Education 757 760 765
Attainment of a Degree or Certificate 722 727 707
LiteracyNumeracy Gains 702 709 695
Performance in the Past Eight Quarters
The Performance in the Past Eight Quarters graph displays single quarter data versus the Program Performance tables which depict cumulative four quarter data
Quarter Highlights In May 2014 four Job Corps students from centers in Montana California Iowa and Virginia participated in the 2nd Asia-Pacific Economic Cooperation (APEC) Youth Skills Camp in Beijing and Guangzhou China the second time Job Corps students have participated in this event The camp included field visits to vocational training schools business enterprises and public practical training facilities as well as skills exchanges This international event provides students with life-changing experiences in travel diversity and first-hand exposure to global issues
Analysis bull During the current quarter Job Corps served 69979 participants including 13079 new
enrollees an increase of 801 percent overall compared to the same quarter in PY 2013 and due to the resumption of new enrollments after the PY 2012 enrollment suspensions The number of new students increased by over 200 percent from the same quarter in PY 2013
bull The proportion of 16-17 year olds served increased by 45 percentage points Conversely the proportion of all older students served similarly decreased from the same quarter in PY 2013
bull In the current quarter Job Corps placed 7203 students in Employment and Education a slight decrease of 04 percentage points compared to the same quarter last year In addition 8657 students attained a Certificate a 131 percentage point decrease compared to the same quarter in PY 2013 Also 6789 students attained a LiteracyNumeracy gain an 116 percentage point decrease over the same quarter in PY 2013
bull In the current quarter the program served 50 participants who were Veterans prior to enrollment bull When comparing the four quarter data Placement in Employment or Education increased
21 percentage points Attainment of a Degree or Certificate decreased 38 percentage points and LiteracyNumeracy Gains decreased 31 percentage points from the same quarter one year ago 21
WORKFORCE SYSTEM RESULTS
100
80
60
40
20
0 Sep-12 Dec-12 Mar-13 Jun-13 Sep-13 Dec-13 Mar-14 Jun-14
n Placement Rate for Out-of-School Youth Ages 18 and Above n Recidivism Rate for Youth Ages 14 to 17 n Recidivism Rate for Youth Ages 18 and Above
Workforce Investment Act Youthful Offender Initiative httpwwwdoletagovYouth_servicesyouthful_offendercfm
Program Description The Employment and Training Administration uses its Youthful Offender Appropriation to fund a variety of projects that target youth offenders and young adult offenders Currently operating projects include grants to community-based organizations to involve juvenile offenders in training and service learning projects grants to intermediary organizations to serve young offenders in high-poverty high-crime communities and grants to help youth enter diversion programs as an alternative to out-of-home placements and to assist eligible youth have their juvenile records sealed or expunged
Quarter Highlights The great majority of juvenile offenders are of ages 17 and below and many are still in high school The youth offender grants focus on helping younger youth stay in school and complete their education and helping older youth find jobs and succeed in the labor market Case management mentoring and supportive services are also provided by these grants
Performance in the Past Eight Quarters
Program Performance
Performance Measure Four Quarters
Ending 063013 Four Quarters
Ending 063014
Placement Rate for Youth Ages 18 and Above
36 362
Recidivism Rate for Youth Ages 14 to 17
35 24
Recidivism Rate for Youth Ages 18 and Above
34 16
Results are cumulative for currently operating grants
Additional Program Year 2013 Quarterly Data
Placement Rate for Youth Ages 18 and Above
277 334 325
Performance Measure
Four Quarters
Ending 093013
Four Quarters
Ending 123113
Four Quarters
Ending 033114
Recidivism Rate for Youth Ages 14 to 17
349 349 349
Recidivism Rate for Youth Ages 18 and Above
335 335 335
Analysis bull Providing opportunities to youthful offenders results in varying outcomes depending on
the mix of projects being operated in a given year bull Projects have markedly different placement and recidivism rates depending on whether
they are serving young adults in their 20s or youth ages 16-17 they recruit youth in the community or through direct referrals from the juvenile justice system whether they are located in small or large cities and the extent to which enrollees are at high or low risk of re-offending
22
WORKFORCE SYSTEM RESULTS
100
80
60
40
20
0 Jun-12 Jun-13 Jun-14
n Placement in Employment or Education n Attainment of a Degree or Certificate n LiteracyNumeracy Gains
Workforce Investment Act Youth Program httpwwwdoletagovyouth_services
Program Description The Workforce Investment Act Youth Formula Program provides employment and education services to eligible low-income youth ages 14 to 21 who face barriers to employment The program serves in-school and out-of-school youth youth with disabilities and low literacy rates as well as others who may require additional assistance to complete an educational program and acquire an industry-recognized credential or enter employment
Quarter Highlights The passage of the Workforce Innovation and Opportunity Act (WIOA) includes a major shift in focus to spending more funds on and serving more out-of-school youth (OSY) The workforce system demonstrated its readiness for this shift in that 48 percent of all youth served in PY 2013 were OSY and 57 percent of all WIA youth local area funds were spent on OSY So far in Program Year 2013 California has spent almost 65 percent of their WIA youth funds on OSY with high levels of OSY expenditures in both urban and rural areas 53 percent of all youth served in CA in Program Year 2013 were OSY For example Los Angeles City spent 80 percent of their funds on OSY and the Northern Rural Training and Employment Consortium spent 76 percent of their funds on OSY Both local areas have achieved these levels through strong partnerships with organizations that serve OSY as well as access to high quality work experiences
Program Performance
Performance Measure
Four Quarters
Ending 063012
(Program Year 2011)
Four Quarters
Ending 063013
(Program Year 2012)
Four Quarters
Ending 063014
(Program Year 2013)
Placement in Employment or Education 589 666 690
Attainment of a Degree or Certificate 648 675 684
LiteracyNumeracy Gains 476 509 525
Performance in the Past Three Program Years
Analysis bull 197045 participants were served in the cumulative four quarter reporting period compared
to 217244 served during the same time period last year This decrease is due primarily to a lower funding level compared to the previous year
bull Placement in Employment or Education achieved a result of 690 percent a 24 percentage point increase when compared with the same time period last year
bull The program achieved a result of 684 percent for the Attainment of a Degree or Certificate measure This is a 09 percentage point increase from the same time period last year
bull The LiteracyNumeracy Gains measure achieved a result of 525 percent an increase of 16 percentage points when compared with the same time period last year
bull All three youth common measures exceeded Program Year 2013 GPRA goals
23
WORKFORCE SYSTEM RESULTS
100
80
60
40
20
0 Sep-12 Dec-12 Mar-13 Jun-13 Sep-13 Dec-13 Mar-14 Jun-14
n Placement in Employment or Education n Attainment of a Degree or Certificate n LiteracyNumeracy Gains
YouthBuild httpwwwdoletagovyouth_servicesyouthbuildcfm
Program Description YouthBuild provides job training and educational opportunities for at-risk youth ages 16 to 24 while constructing or rehabilitating affordable housing for low-income or homeless families in their own neighborhoods The youth split their time between the construction site and the classroom where they earn their high school diploma or equivalency learn to be community leaders and prepare for college and other post-secondary training opportunities
Analysis bull 33392 participants have been enrolled into the YouthBuild program since 2007 and 29553
have exited so far bull Since the program began a total of 11716 participants have received a high school
diploma or equivalency 17572 have attained an industry-recognized certificate and 21835 have been placed into initial jobs post-secondary education andor long-term vocational occupational skills training including apprenticeship
bull The Class of 20102011 performance steadily increased The outcomes for all three measures were above those for the Class of 2009 and significantly above the GPRA goals
bull YouthBuild is currently meeting or exceeding the GPRA goal for all three measures The additional quarter of service for 20102011 grants provided additional positive outcomes as expected As the 2012 grant class progresses it is expected that this trend will continue
Program Performance
Quarter Highlights Just A Start in Cambridge (MA) has been a YouthBuild grantee since 2010 In the fourth quarter of the Program Year 2013 they shared the following success story
Victor earned a High School Diploma and HBIPACT construction certification He was accepted to Endicott College in MA He also secured a full time painting position with George Souza Painting making $25 per hour He continues to develop his career plan with staff
Class of 20102011 Performance in the Past Eight Quarters
Performance Measure GPRA Results for Class
0f 20102011 Results for Class 2012 Overall Results
Percent of Participants Entering Employment or Enrolling in Postsecondary Education the Military or Advanced Training Occupational Skills Training in the First Quarter After Exit
500 612 586 519
Percent of Youth Who Attain a Diploma GED or Certificate by the End of the Third Quarter after Exit
672 770 609 672
Percent of Participants Deficient in Basic Skills Who Achieve Literacy or Numeracy Gains of One Adult Basic Education Level
585 676 549 595
24
WORKFORCE SYSTEM RESULTS
100
80
60
40
20
0 Sep-12 Dec-12 Mar-13 Jun-13 Sep-13 Dec-13 Mar-14 Jun-14
n Attainment of a High School Diploma GED or improvement of basic skills by at least two grade levels or completed Occupational Skills training n Participants who Attained Two or more Goals
Indian and Native American Youth Program httpwwwdoletagovdinap
Program Description The Indian and Native American Supplemental Youth Services Program provides summer and year-round employment and training activities for Indian Alaska Native and Native Hawaiian individuals between the ages of 14 and 21 Program resources are targeted to at-risk and the neediest youth who face substantial barriers to education and employment success This population includes high school dropouts and youth who are basic-skills deficient
Quarter Highlights Youth summer employment is a high priority for Native American Tribes However most rural reservation areas do not have enough employers to put youth to work during the summer As a result Tribes rely on the annual WIA Section 166 funding to place youth in summer employment where they can earn a wage and receive valuable work experience
Over the past four quarter period 2487 of the 4399 youth that participated in the youth program were placed in summer employment Youth participants come from low income families with little or no opportunity to earn money during the summer months Through the Indian and Native American Youth Program these youth are given an opportunity to work and earn money during the summer which helps them contribute to their familyrsquos income
Performance in the Past Eight Quarters
Program Performance
Performance Measure Four Quarters
Ending 063013 Four Quarters
Ending 063014
Educational Attainment for Dropouts 180 220
Attainment of Two or More Goals 920 927
The data reported reflect the period from April 1 2012 through March 31 2013 The data reported reflect the period from April 1 2013 through March 31 2014
Additional Program Year 2013 Quarterly Data
Performance Measure Four Quarters
Ending 093013 Four Quarters
Ending 123113 Four Quarters
Ending 033114
Educational Attainment for Dropouts
250 250 220
Attainment of Two or More Goals
930 930 927
The data reported reflect the period from April 1 2013 through September 30 2013 The data reported reflect the period from April 1 2013 through March 31 2014
Analysis bull The Attainment of Two or More Goals rate increased slightly from 92 percent in June 2013
to 927 percent in June 2014 bull The Indian and Native American Youth Program served 4310 youth during the period July
1 2013 through June 30 2014 This is a 164 percentage point decrease in youth served one year ago
bull The Education Attainment for Dropouts increased from 18 percent in June 2013 to 22 percent in June 2014
25
WORKFORCE SYSTEM RESULTS
Green Jobs Innovation Fund Grants (GJIF) httpwwwdoletagovBRGGreenJobs
Program Description The Green Jobs Innovation Fund (GJIF) was authorized as a Pilot and Demonstration Project under the Workforce Investment Act (WIA) of 1998 to help workers receive job training in green industry sectors and occupations as well as access green career pathways GJIF is seeking to increase the number of individuals completing training programs who receive industry-recognized credentials and to increase the number of individuals completing training programs for employment in green jobs
With these grants the Department is emphasizing two key workforce programs that move participants along green career pathways by 1) forging linkages between Registered Apprenticeship and pre-apprenticeship programs andor 2) integrating the delivery of technical and basic skills training through community-based partnerships The grantees are building on existing programs that are already established and serving workers and moving workers into and along green career pathways The Green Jobs Innovation Fund (GJIF) grants are all anticipated to end by June 30 2015
Quarter Highlights The Jobs for the Future (JFF) GreenWays grant program made great progress toward their goal of increasing access for women to enter higher-paying non-traditional occupations Women currently comprise 254 of the programs total enrollment and are earning higher placement wages overall than men At the same time their completion rates credential attainment rates and job placement rates lag behind those of men reflecting the ongoing challenges that women experience in non-traditional occupations The JFF GreenWays program continues to focus on raising the visibility of this issue as a key element in regional approaches to addressing poverty in female-headed households
Program Performance
Performance Measure Cumulative
Four Quarters Ending 063013
Cumulative Four Quarters
Ending 063014
Entered Employment Rate 569 642
Employment Retention Rate 750 821
Six Monthsrsquo Average Earnings $16249 $17459
Additional Program Year 2013 Quarterly Data
Performance Measure
Cumulative Four
Quarters Ending
093013
Cumulative Four
Quarters Ending
123113
Cumulative Four
Quarters Ending
033114
Entered Employment Rate 560 626 641
Employment Retention Rate 790 795 785
Six Monthsrsquo Average Earnings $16406 $15228 $15039
Cumulative Credential Outcomes in the Past Three Quarters
Performance Measure Quarter Ending
123113
Quarter Ending
033114
Quarter Ending
063014
Number Completed Education Job Training Activities
5521 6438 7076
Number Completed Training and Received Credential
5343 6242 6849
Attainment Rate 97 97 97
Analysis As of June 30 2014 8360 participants were enrolled in educationtraining Of these participants 600 participated in Registered Apprenticeship 874 participated in Pre-Apprenticeship and 40 participated in On-the-Job Training A total of 7076 participants completed educationtraining A total of 6849 participants received a credential Lastly a total of 4870 participants entered employment and of these participants 4343 entered training-related employment
26
WORKFORCE SYSTEM RESULTS
Dec-13 Mar-14 Jun-14
100 $27000
$2600080
$2500060
$24000 40
$23000
20 $22000
0 $21000
n Entered Employment Rate n Employment Retention Rate n Six Months Average Earnings
H-1B Jobs and Innovation Accelerator Challenge Grants httpwwwdoletagovETA_News_Releases20111398cfm
Program Description The Jobs and Innovation Accelerator Challenge (Jobs Accelerator) is designed to help regions achieve the demonstrated benefits of collaborative cluster-based regional development This initiative represents the implementation of Administration policy priorities to accelerate bottom-up innovation in urban and rural regions as opposed to imposing ldquoone-size-fits-allrdquo solutions The Jobs Accelerator also meets Administration goals for smarter use of government resources through reduction of Federal silos and promotion of coordinated Federal funding opportunities that offer more efficient access to Federal resources Investments from Federal agencies for the Jobs Accelerator projects include The US Department of Laborrsquos Employment and Training Administration (DOL-ETA) the US Department of Commercersquos Economic Development Administration (DOC-EDA) and the National Institutes of Standards and Technologyrsquos Hollings Manufacturing Extension Partnership (NIST-MEP) the Small Business Administration (SBA) the Department of Energy Advanced Manufacturing Office (DOE AMO) and the Delta Regional Authority (DRA)
The objectives of the Jobs Accelerator are to
bull Accelerate the formation of new high-growth businesses and expansion of existing businesses
bull Accelerate the creation of higher-wage jobs bull Advance commercialization of research including Federally-funded research bull Support deployment of new processes new technologies and new products to grow sales
and generate employment bull Enhance the capacity of small businesses in the cluster including small and disadvantaged
businesses bull Increase exports and business interaction with international buyers and suppliers bull Develop the skilled workforce needed to support growing clusters and bull Ensure diverse workforce participation in clusters through outreach training and the
creation of career pathways
Quarter Highlights The Northeast Ohio Speed-To-Market Accelerator (STMA) program administered by Lorain County Community College aims to accelerate the speed-to-market for near production or pilot production prototypes stimulate job creation and increase the global competitiveness of cluster companies attract private capital and attract students incumbent workers and the unemployed
This quarter STMA helped accelerate the introduction of a new dry electrode product for heart monitoring This sensor and electronics will be introduced as part of the next generation of wearable human performance arm band from Pittsburgh based Body Media a subsidiary of Jawbone Further STMA continues to bring new companies into the STMA
program through cluster outreach activities and this quarter three new leads were generated as the result of the existing STMA partners MAGNET JumpStart Lorain County Community College and NorTech
Program Performance
Performance Measure Four Quarters
Ending 123113 Four Quarters
Ending 033114 Four Quarters
Ending 063014
Entered Employment Rate 307 283 359
Employment Retention Rate 907 925 927
Six Monthsrsquo Average Earnings $23310 $22953 $26682
Performance in the Past Three Quarters
Analysis A total of 3702 individuals were served 3632 individuals began educationjob training activities and 2052 individuals completed educationjob training services Of participants completing educationjob training 370 unemployed individuals completed training and entered employment and of these 114 individuals entered training-related employment A total of 204 employed individuals completed training and retained their current position and of these 85 employed individuals completed training and advanced into a new position A total of 2006 individuals completed educationtraining activities and received credentials and of these 2273 total credentials were awarded
This data represents three rounds of the for Jobs Accelerator initiative which includes the Jobs Accelerator Round 1 the Advanced Manufacturing Jobs Accelerator Round 2 and the Make it in America (MIIA) Jobs Accelerator grants program
27
WORKFORCE SYSTEM RESULTS
100 $56000
80 $54000
$52000 60 $50000
40 $48000
$46000 20
$44000
0 $42000 Dec-13 Mar-14 Jun-14
n Entered Employment Rate n Employment Retention Rate n Six Months Average Earnings
H-1B Technical Skills Training Grants httpwwwdoletagovbusinessH1B_Tech_Skillscfm
Program Description The H-1B Technical Skills Training (TST) Grants were authorized by the American Competitiveness and Workforce Improvement Act of 1998 (ACWIA) as amended (29 USC 2916a) to provide education training and job placement assistance in the occupations and industries for which employers are using H-1B visas to hire highly-skilled foreign workers on a temporary basis and the related activities necessary to support such training The H-1B TST Grant Program is intended to raise the technical skill levels of American workers so they can obtain or upgrade employment in high-growth industries and occupations Over time these education and training programs will help businesses reduce their use of skilled foreign professionals permitted to work in the US on a temporary basis under the H-1B visa program The grants represent significant investments in sectors such as information technology advanced manufacturing and health care In addition these grants will focus on serving participants who have been identified as long-term unemployed particularly those who have been unemployed the longest These grants also have an emphasis on providing on-the-job training allowing participants to learn new skills while earning a pay check To date ETA has announced two rounds of TST grants totaling $342 million The first round was announced on October 4 2011 and the second round was announced on February 22 2012
Quarter Highlights The Los Angeles HealthWorks On-the-Job training (OJT) initiative administered by Managed Career Solutions Inc (MCS) provides individuals with training that leads to industry recognized credentials and employment opportunities within the regionrsquos healthcare field MCS maintains several strong partnerships to coordinate outreach recruitment training OJT placements and employment opportunities As of June 30 2014 MCS served nearly 800 long-term unemployed participants and overall 1100 participants In the same period over 650 individuals completed training and earned an industry recognized credential Of those completers 128 were employed at participation however the majority were underemployed and gained the necessary job skills and credentials that allowed 80 percent to advance into a new position In recognition MCS received the Malcom Baldrige and State Eureka awards
Analysis bull 52532 individuals were served and 51071 individuals began educationjob training
activities bull 15185 individuals completed educationjob training activities including 3321 unemployed
individuals who completed training and entered employment bull Of these 2925 individuals entered training-related employment 2902 employed individuals
completed training and retained their current position 1452 employed individuals completed training and advanced into a new position
bull 11944 individuals completed educationjob training activities and received credentials with 14099 total credentials awarded
Program Performance
Performance Measure
Four Quarters
Ending 123113
Four Quarters
Ending 033114
Four Quarters
Ending 063014
Entered Employment Rate 778 725 675
Employment Retention Rate 993 944 926
Six Monthsrsquo Average Earnings $54683 $50833 $46245
Since the H-1B TST program provides training to incumbent unemployed and long-term unemployed workers to prepare them for jobs in a variety H-1B industries andor occupations the Entered Employment Rate and Six Monthsrsquo Average Earnings can vary For the quarter ending on June 30 2014 the H-1B TST program saw a decline in the Entered Employment Rate and Six Monthsrsquo Average Earnings in comparison with the results for the previous rolling four quarters Previous results reflected a large number of incumbent workers who enrolled in short-term high-skilled training and exited early leading to a relatively high Six Monthsrsquo Average Earnings As the projects progress unemployed and long-term unemployed workers who required longer-term training begin to exit the program and search for jobs Ultimately as they enter employment wages may be less than those achieved by the higher-skilled incumbent workers who either retain or advance in their positions after training
Performance in the Past Three Quarters
28
WORKFORCE SYSTEM RESULTS
100 $21000
$19000 80
$17000
$1500060 $13000
40 $11000
$900020
$7000
0 $5000Sep-12 Dec-12 Mar-13 Jun-13 Sep-13 Dec-13 Mar-14 Jun-14
n Entered Employment Rate n Employment Retention Rate n Six Months Average Earnings
Community-Based Job Training Grants (CBJT) httpwwwdoletagovbusinessCommunity-BasedJobTrainingGrantscfm
Program Description Community-Based Job Training Grants (CBJT) seek to strengthen the role of community colleges in promoting the United States workforcersquos competitiveness The program does this by building the capacity of community colleges to train workers in skills required to succeed in regionally based high-growth high-demand industries and occupations Important grant activities include training in the healthcare biotech advanced manufacturing energy automotive transportation construction insurance forestry and aerospace industries The first round of CBJT grants were awarded in October 2005 To date ETA has announced five rounds of CBJT grants awarding 320 grants to community colleges and other organizations All CBJT grants ended as of June 30 2014
Quarter Highlights The 14 remaining projects active in this quarter represent the culmination of another successful DOL initiative Some of the significant accomplishments include the development and sustainability of Roane State Community Collegersquos Lean Manufacturing program designed to meet the needs of local manufacturing employers the San Jacinto Community College Districtrsquos Gulf Coast Healthcare Partners project which developed training to support healthcare career and Central Arizona Collegersquos Pinal County Alternative Energy Project More than half of the CBJT participants who began education and training activities completed their programs 79 percent of them received an industry recognized credential ie certificate or degree Eighty-four percent of the participants who gained employment entered into new training-related positions
Program Performance
Performance Measure Four Quarters
Ending 063013 Four Quarters
Ending 063014
Entered Employment Rate 572 662
Employment Retention Rate 891 899
Six Monthsrsquo Average Earnings $18675 $17027
Additional Program Year 2013 Quarterly Data
Performance Measure
Four Quarters
Ending 093013
Four Quarters
Ending 123113
Four Quarters
Ending 033114
Entered Employment Rate 57 605 655
Employment Retention Rate 891 897 891
Six Monthsrsquo Average Earnings $18675 $18285 $16642
Performance in the Past Eight Quarters
Analysis bull 268359 individuals have been served through the initiative bull 258216 individuals began educationjob training activities bull 165264 individuals completed educationjob training activities Of these
bull 131107 individuals received credentials bull 65089 individuals entered new positions of employment and 54344 individuals entered new
positions of training-related employment
Note All data are cumulative Prior to new reporting requirements implemented in the quarter ending December 31 2011 grantees only reported results for individuals that entered employment and individuals that entered training-related employment (noted above) if those participants entered employment and completed training in the same quarter As a result prior to that quarter participants that entered employment in quarters after they completed training were captured in the Common Measures and the total number of individuals that ultimately entered employment and training-related employment are actually higher than the results above indicate
29
WORKFORCE SYSTEM RESULTS
100 92
7880
5760
40
20
0
n Percent of Target Number of Programs Launched by Round
Round 1 Round 2 Round 3
Trade Adjustment Assistance Community College and Career Training (TAACCCT) Grants httpwwwdoletagovtaaccct
Program Description The Trade Adjustment Assistance Community College and Career Training (TAACCCT) Grant Program is authorized by the Trade Act of 1974 under Chapter 4 of Title II The purpose of this grant program is to provide eligible institutions of higher education with funds to expand and improve their ability to deliver education and career training programs that can be completed in two years or less and that result in skills degrees and credentials that prepare program participants for employment in high-wage high-skill occupations and are suited for workers who are eligible for training under the Trade Adjustment Assistance (TAA) for Workers program under Chapter 2 of Title II of the Trade Act The TAACCCT Grant Program is funded under the Health Care and Education Reconciliation Act of 2010 which appropriated $500 million for the program for each of Fiscal Years 2011-2014 for a total of $2 billion
Round 1 ndash FY 2011 Grants On June 30 2014 grants awarded in Round 1 (FY 2011) had completed all but one quarter of their periods of performance By the end of their final year of the grant the forty-nine (49) Round 1 grantees project that they will offer a total of 906 new programs of study As of June 30 2014 grantees began offering 834 (92 percent) of these programs of study
Round 2 ndash FY 2012 Grants The seventy-nine (79) grants awarded in the Fiscal Year 2012 had completed seven quarters of their grants at the end of June 30 2014 Their period of performance began on October 1 2012 and will end on September 30 2016 however their final year will be dedicated to gathering information and data for reporting outcome measures and completing the requirements for a third-party evaluation They project that by the end of the third year they will have launched 761 programs As of the end of June 30 2014 they had began offering 561 (78 percent) of these programs
Round 3 ndash FY 2013 Grants Grants awarded in FY 2013 had completed the first three quarters of their period of performance Their grants began on October 1 2013 and will end on September 30 2017
In their third year they will have launched all of their programs as their final year will be dedicated to collecting follow up data for evaluation and reporting purposes only The fifty-seven (57) grantees plan to launch 551 programs As of June 30 2014 they had already launched 288 (57 percent) of these programs
Percentage of Target Number of Programs Launched as of June 30 2014 by Grant Round
Performance Information Programmatic data is collected at different intervals throughout the period of performance including
bull Quarterly Narrative Progress Reports (QNPR) Grantees will provide quarterly qualitative data on the capacity building taking place through progress and other implementation measures that grantees defined in their Statements of Work
bull Annual Performance Reports (APR) Grantees will provide annual quantitative data on their training and employment outcomes for TAACCCT program participants that are impacted by the capacity building activities being implemented by their grants
30
WORKFORCE SYSTEM RESULTS
$4500000 3500$4000000 3000$3500000
2500
Jun-13 Dec-13 Mar-14 Jun-14
Amou
nt $3000000 2000$2500000
$2000000 1500 $1500000 1000 $1000000
500$500000 $0 0
n Amount of Revenue Generated n Number of Tickets Assigned
Disability Employment Initiative (DEI) httpwwwdoletagovdisability
Program Description All DEI Workforce Employment Network (EN) Trends
Launched in 2010 the Disability Employment Initiative (DEI) seeks to improve education training and employment opportunities for youth and adults with disabilities who are unemployed underemployed andor receiving Social Security disability benefits The DEI is jointly funded by the US Department of Laborrsquos Employment and Training Administration and Office of Disability Employment Policy DEI projects improve collaboration among employment and training and asset development programs implemented at state and local levels including the Social Security Administrationrsquos Ticket to Work Program and build effective partnerships that leverage resources to better serve individuals with disabilities and improve employment outcomes
Quarter Highlights A variety of Department of Labor programs helped Vietnam-era veteran Richard James navigate through life After servicing B-52 bombers in the Air Force James held a series of sales jobs while putting himself through law school at night He rose to become a successful New England attorney and owner of a boat dock building company when he suffered a terrible head injury which caused spine and nerve damage Addiction to pain medication followed and James ended up homeless While recovering from his injuries James took a college course through the Veterans Retraining Assistance Program managed in part by the Department He received career counseling from a Disabled Veterans Outreach Program representative at a local American Job Center and support from the DEI Disability Resource Coordinator Eventually James was hired as an attorney by a Rhode Island law firm The departments grants and programs made possible the services that put me back in a position of being a productive member of society he said
Program Performance
Performance Measure Quarter Ending 63013
Quarter Ending
123113
Quarter Ending 33114
Quarter Ending 63014
Analysis bull The Exit Rate for Adult and Youth exiters with disabilities in Round one DEI sites is almost
double the national average Adult DEI was 89 percent vs All StatesAll LWIAs 49 percent Older Youth DEI 166 percent vs All StatesAll LWIAs 87 percent Younger Youth DEI 339 percent vs All StatesAll LWIAs 151 percent
bull The CredentialSkill Attainment Rate for older and younger youth with disabilities in Round 1 DEI sites was higher than the national average Older Youth DEI credential rate 568 percent vs All StatesAll LWIAs 383 percent Younger Youth DEI skill rate 902 percent vs All States All LWIAs 834 percent
bull The Exit Rate for Adult and Youth exiters with disabilities in Round two DEI sites is higher than the national average Adult DEI 56 percent vs All StatesAll LWIAs 49 percent Older Youth DEI 163 percent vs All StatesAll LWIAs 87 percent and Younger Youth DEI 167 percent vs All StatesAll LWIAs 151 percent
bull The Entered Employment Rate for Adult DEI sites 657 percent is 20 percent higher than in All StatesAll LWIAs 434 percent
bull DEI Workforce Employment Networks (EN) activity shows that the number of Tickets assigned increased from 1780 to 2903 an increase of 1123 and the amount of revenue
Number of Tickets Assigned 1780 1590 2554 2903 generated from DEI EN payments increased from $2373404 to $4057353 an increase of $168 million Amount of Revenue Generated $2373404 $1927104 $3505582 $4057353
31
WORKFORCE SYSTEM RESULTS
ETA Internet-Based Assistance (E-TOOLS) wwwcareerinfonetorg wwwservicelocatororg wwwcareeronestoporg wwwonetonlineorg wwwmyskillsmyfutureorg wwwmynextmoveorg
Program Description Additional Program Year 2013 Quarterly Data
Performance Measure Quarter Ending
093013
Quarter Ending
123113
Quarter Ending
033114
CareerOneStop Portal Visits 5754645 5159240 5340022
ETArsquos Internet-based assistance includes electronic tools that help individuals explore career opportunities and link to job postings either on their own or at local American Job Centers to make informed employment and education choices
The Web sites feature user-friendly occupation and industry information salary data career videos education resources career exploration assistance and other resources that support talent development in todayrsquos fast-paced global marketplace Users can find information some of which is also industry sponsored about occupations that are in-demand in high growth industries Additionally information is available regarding occupational skills and workplace competencies
Quarter Highlights For the year ending June 2014 CareerOneStop launched a new portal for Ex-Offenders added Federal Contractor job tagging a TAACCCT information finder Youth Council information to Americarsquos Service Locator and began working on adding more job feeds
Americarsquos Service Locator (ASL) Visits
730998 758919 724053
ONET Downloads 26646 29407 28505
ONET Visits 7697608 10211177 11500039
Combined Visits 14183251 16129336 17564114
Performance in the Past Eight Quarters
25000000 $36000
Sep-12 Dec-12 Mar-13 Jun-13 Sep-13 Dec-13 Mar-14 Jun-14
n Combined Visits (in millions) n ONET Product Downloads (in thousands)
$31500 20000000
ONE
T Pr
oduc
t Dow
nloa
ds
$27000
Com
bine
d Vi
sits
$2250015000000 $18000
10000000 $13500
$90005000000
$4500
$00
ONET has added web services for developers and increased the available Tools and Technology and Detailed Work Activities information to convey specialized occupational attributes
Program Performance
Performance Measure Quarter
Ending 063013 Quarter
Ending 063014
CareerOneStop Portal Visits 5104850 5472742
Americarsquos Service Locator (ASL)Visits
747114 802148
ONET Downloads 29482 25278
ONET Visits 8716609 13581922
Combined Visits 14568573 19856812
Analysis bull ETA Internet-Based Assistance received 19856812 combined visits for the quarter ending
June 30 2014 an increase of 36 percent over the same period in 2013 bull Visits to CareerOneStop increased to 5472742 or 72 percent over the same period in 2013
with mySkillsmyFuture continuing to be a popular tool with an increase of 23 percent bull Americarsquos Service Locator Visits traffic increased 74 percent over the same period in 2013 bull The ONET traffic received 13581922 visits in this quarter an increase of 558 percent
over the same period in 2013 and the ONET downloads totaled 25278 for the quarter a decrease of 142 percent
32
WORKFORCE SYSTEM RESULTS
Glossary of Performance Measures
Common Performance Measures Common Performance Measures are used by Workforce Investment Act Indian and Native American Program Disability Program Navigator Initiative Wagner-Peyser Trade Adjustment Assistance Senior Community Service Employment Program Reintegration of Ex-Offenders Registered Apprenticeship Program Job Corps National Farmworker Jobs Program High Growth Job Training Initiative and Community-Based Job Training Grants
Adult Measures Entered Employment Of those who are not employed at the date of participation the number of adult participants who are employed in the first quarter after the exit quarter divided by the number of adult participants who exit during the quarter
Employment Retention Of those who are employed in the first quarter after the exit quarter the number of adult participants who are employed in both the second and third quarters after the exit quarter divided by the number of adult participants who exit during the quarter
Six Monthsrsquo Average Earnings Of those adult participants who are employed in the first second and third quarters after the exit quarter total earnings in the second quarter plus the total earnings in the third quarter after the exit quarter divided by the number of adult participants who exit during the quarter
Average Earnings Change in Six Months1
Of those who are employed in Q1 after exit the total post-program earnings (earnings in Q2 + Q3 after exit) minus pre-program earnings (earnings in Q2 + Q3 prior to registration) divided by the number of adults who exit during the quarter
Youth Measures Attainment of a Degree or Certificate Of those enrolled in education (at the date of participation or at any point during the program) the number of youth participants who attain a diploma GED or certificate by the end of the third quarter after the exit quarter divided by the number of youth participants who exit during the quarter
1 This definition was used for earnings in PY 2005 Q=quarter
33
Literacy and Numeracy Gains Of those out-of-school youth who are basic skills deficient the number of youth participants who increase one or more educational functioning levels divided by the number of youth participants who have completed a year in the program (ie one year from the date of first youth program service) plus the number of youth participants who exit before completing a year in the program
Placement in Employment or Education2
Of those who are not in postsecondary education or employment (including the military) at the date of participation the number of youth participants who are in employment (including the military) or enrolled in postsecondary education andor advanced trainingoccupational skills training in the first quarter after the exit quarter divided by the number of youth participants who exit during the quarter
Program-Specific Performance Measures
Disability Employment Initiative (DEI) Number of Tickets Assigned Number of individuals on Social Security Administration (SSA) disability benefits who assigned their Ticket to the workforce board agency or American Job Center as their designated Employment Network under the SSA Ticket to Work program All DEI pilot sites must become an Employment Network under Ticket to Work
Amount of Revenue Generated Under the SSA Ticket to Work program when jobseekers who receive SSA disability benefits assign their Ticket to a workforce board agency or American Job Center as an Employment Network and then achieve certain employment milestones the Employment Network receives money or ldquoTicket revenuerdquo
2 Because of its intensity and duration the YouthBuild performance measure for placement in employment or education does not exclude those who entered the program with a job or in college
WORKFORCE SYSTEM RESULTS
Foreign Labor Certification Percent of H-1B Applications Resolved in Seven Business Days This estimate is based on the total number of applications processed within seven business days divided by the total number of applications processed for a given reporting period An application is considered processed if the last significant event is (1) certified (2) denied or (3) withdrawn
Average Number of Days to Resolve PERM Applications Not Subject to Integrity Review The average processing time between case receipt and decision date for non-audited cases
Average Number of Days to Resolve PERM Applications Subject to Integrity Review The average processing time between case receipt and decision date for audited cases
Percent of Complete H-2A Employer Applications Resolved within 30 Days Before the Date of Need This estimate is based on the total number of complete applications resolved within 30 days before the date of need divided by the total number of applications processed for a given reporting period
Percent of H-2B Applications Processed Within 30 Days of Receipt This estimate is based on the total number of applications processed within 30 days of receipt divided by the total number of applications processed for a given reporting period An application is considered processed if the last significant event is (1) certified (2) denied or (3) withdrawn
Indian and Native American Youth Attainment of Two or More Goals The total number of youth participants enrolled in the Granteersquos Supplemental Youth Services Program who attained at least two of the 14 goals listed below divided by the total number of Supplemental Youth Services participants enrolled during the report period The 14 goals include
1 Completed Job ReadinessOrientation to the World of Work Training 2 Completed Internship or Vocational Exploration Program
3 Completed Career Assessment 4 Entered Unsubsidized Employment 5 Remained in School 6 Returned to School Full Time 7 Enrolled in Job Corps 8 Improved Basic Skills Level By At Least Two Grades 9 Attained High School Diploma 10 Attained GED 11 Completed Occupational Skills Training 12 Completed Leadership Skills Training 13 Entered Other (Non-Supplemental Youth) Training Program 14 Summer Employment
Educational Attainment for Dropouts The number of dropouts who have obtained a high school diploma GED or increased their literacy and numeracy by two grade levels divided by the total number of dropouts
Job Corps Measures Placement in Employment or Education Percent of Job Corps participants3 entering employment or enrolling in post-secondary education andor advanced skills trainingoccupational skills training in the first quarter after exit from the program
Attainment of a Degree or Certificate Percent of students who attain a GED HSD or certificate
Literacy Numeracy Gains Percent of students who achieve literacy or numeracy gains of one or more Adult Basic Education (ABE) levels
3 Calculation of the Placement rate measure does not include outcomes for students who participated in the program for less than 60 days
34
WORKFORCE SYSTEM RESULTS
Internet-Based Assistance Web Site Visits ETArsquos Internet-based assistance includes electronic tools that help individuals make informed employment and education choices The measure for tracking the overall performance and usage of these tools is Web site visits A visit is defined as a series of page requests from the same uniquely identified client with a time of no more than 30 minutes between each page
request
ONet Product Downloads The ONET product downloads count the number of unique users who download an ONET online resource (wwwonetcenterorg) which includes the ONET database (all versions) ONET technical reports (such as on green jobs) supplemental data files (lay titles tools and technology) the ONET Career Exploration Tool files ONET Survey questionnaires and other related materials such as the Toolkit for Business
Registered Apprenticeship Program Entered Employment Rate Percent of apprentices employed in the first quarter after exit who either completed or cancelled from their Registered Apprenticeship Program
Employment Retention Rate Percent of apprentices employed in the first quarter after exit still employed in the second and third quarter after exit who either completed or cancelled from their Registered Apprenticeship Program
Six Monthsrsquo Average Earnings Six month Average Earnings of apprentices employed in the first quarter after exit still employed in the second and third quarter after exit who either completed or cancelled from their Registered Apprenticeship Program
Reintegration of Ex-OffendersmdashAdult Program Recidivism Rate The percentage of participants who are rearrested for a new crime or re-incarcerated for revocation of a parole or probation violation within one year from release from prison
Senior Community Service Employment Program Service Level The count of participants during the report period divided by the total number of authorized grantee community service positions
Community Service The number of community service hours as reported by each grantee divided by the total community service hours funded for the grantee adjusted for minimum wage differences among the states
Most-in-Need Most-in-need means participants with one or more of the following characteristics have a severe disability are frail are age 75 or older are age-eligible but not receiving benefits under Title II of the Social Security Act reside in an area with persistent unemployment and have severely limited employment prospects have limited English proficiency have low literacy skills have a disability reside in a rural area are Veterans have low employment prospects have failed to find employment after utilizing services provided under Title I of the Workforce Investment Act of 1998 (29 USC 2801 et seq) or are homeless or at risk for homelessness (sect 513(b)(1)(E) as amended by Pub L No 109-365)
Unemployment Insurance Percent of Payments Made Timely The percentage of intrastate Unemployment Insurance benefit first payments for full weeks of unemployment issued within 14 days following the first compensable week in states with a waiting week and 21 days in non-waiting week states
Detection of Recoverable Overpayments The amount of overpayments (dollars) established through state operations as a percent of the estimated amount states can detect and establish for recovery
Entered Employment Rate The percent of persons receiving a first payment in a given quarter who had earnings in the next quarter
Percent of Employer Tax Liability Determinations Made Timely The percent of new employer determinations made within 90 days of the end of the quarter in which employers became liable to pay unemployment taxes
35
WORKFORCE SYSTEM RESULTS
YouthBuild Attainment of a Degree or Certificate Of those enrolled the number of youth participants who attain a diploma high school equivalency degree or industry-recognized certificate by the end of the third quarter after the exit quarter divided by the number of youth enrolled (minus youth exited for other reasons)
Literacy and Numeracy Gains Of those youth participants who are basic skills deficient at enrollment the number of youth participants who increase one or more educational functioning levels within one year of enrollment divided by the number of youth participants who have completed a year in the program
Placement in Employment or Education The number of youth participants who are in employment (including the military) or are enrolled in post-secondary education andor advanced trainingoccupational skills training in the first quarter after the exit quarter divided by the number of youth participants who exited during the previous quarter
Youthful Offender Projects Placement Rate The placement rate is the percentage of out-of-school youth ages 18 and above placed in unsubsidized jobs occupational training post-secondary education or the military
Recidivism Rate The recidivism rate is the percentage of youth offenders who have been convicted of a new crime within 12 months of their release of a correctional facility or being placed on probation
36
WORKFORCE SYSTEM RESULTS
2471 American Job Centers formerly known as One-Stop Career Centers
12 VT
9 HI
1 GU
6 DC
2 VI
15 NE
16 SD
12 ME
19 IA
19 AK
19 WV
4 DE
47 AL
55 CO
48 MN
57 WI
89 NC
60 GA
31 MA
23 NM
16 ND
47 AR
70 PA
18 CT 4 RI
12 NV
20 WY
22 KS
18 PR
89 OH
69 TN
102 FL
59 AZ 46
SC
12 NH
29 NJ
52 VA
22 MT
33 OK
39 MS
59 WA
61 IL 34 MD
47 OR
131 KY
62 LA
83 IN
33 UT
44 MO
26 ID 90
NY95 MI
1 to 25
25 to 50
50 to 75
75 to 100
Over 100
203 CA
180 TX
Source Americarsquos Service Locator (wwwServiceLocatororg) Americarsquos Service Locator connects individuals to employment and training opportunities available at local American Job Centers The Web site provides contact information for a range of local work-related services including unemployment benefits career development and educational opportunities As of March 17 2015
37
WORKFORCE SYSTEM RESULTS
United States Department of Labor
200 Constitution Avenue NW
Washington DC 20210
wwwdolgov
- A9RFAFEtmp
- DOL_Workforce_Rprt_Jun_2014_51415-dp
-
- Workforce System Results
-
- Contents
- Quarterly Spotlight
- People Served by Program
- Current Appropriations
- Government Performance and Results Act Goals (GPRA)
- Indian and Native American Adult Program (INAP)
- National Farmworker Jobs Program (NFJP)
- Senior Community Service Employment Program (SCSEP)
- Wagner-Peyser Employment Service
- Workforce Investment Act Adult Program
- Workforce Investment Act Dislocated Worker Program
- H-1B and Permanent Foreign Labor Certification (PERM)
- H-2A and H-2B Foreign Labor Certification Programs
- Reintegration of Ex-Offenders (RExO-ADULT)
- Registered Apprenticeship
- Registered Apprenticeship
- Trade Adjustment Assistance (TAA)
- Unemployment Insurance (UI)
- Unemployment Insurance (UI)
- Job Corps
- Workforce Investment Act Youthful Offender Initiative
- Workforce Investment Act Youth Program
- YouthBuild
- Indian and Native American Youth Program
- H-1B Jobs and Innovation Accelerator Challenge Grants
- H-1B Technical Skills Training Grants
- Community-Based Job Training Grants (CBJT)
- Trade Adjustment Assistance Community College and Career Training (TAACCCT) Grants
- Disability Employment Initiative (DEI)
- ETA Internet-Based Assistance (E-TOOLS)
- Glossary of Performance Measures
- 2471 American Job Centers formerly known as One-Stop Career Centers
-

WORKFORCE SYSTEM RESULTS
100
80
60
40
20
0 Sep-12 Dec-12 Mar-13 June-13 Sep-13 Dec-13 Mar-14 Jun-14
n Entered Employment Rate n Employment Retention Rate n Six Months Average Earnings
$25000
$21000
$17000
$13000
$9000
$5000
Trade Adjustment Assistance (TAA) httpwwwdoletagovtradeact
Program Description The Trade Adjustment Assistance (TAA) Program is an integral part of the comprehensive workforce development system The program is essential to helping workers dislocated by foreign trade to adjust to changing market conditions and shifting skill requirements Addressing the needs of trade-affected workers involved in this transformation is a unique challenge because in general these workers are being dislocated from relatively outdated-skill high-wage employment In many cases this is complicated by mass layoffs or plant closures that occur in single-industry towns which makes finding comparable employment in the same geographic area difficult Furthermore many of these jobs are lost permanently from the domestic economy requiring affected workers to completely retool their skills
Fiscal Year Highlights During Fiscal Year 2014 Massachusetts diligently trained staff at the local CareerOneStop Centers to ascertain a TAA participantrsquos eligibility for other funding resources to assist in their reemployment initiatives These improved efforts to provide and report reemployment services enables Trade customers to flow through the CareerOneStop Center system with other dislocated workers and receive seamless resources through the resource sharing initiatives of the Career Center methodology These streamlined reemployment services have resulted in an Entered Employment Rate of 815 percent nearly ten percentage points higher than the national average
Program Performance
Performance Measure FY 2011 FY 2012 FY 2013 FY 2014
Entered Employment Rate 653 689 716 729
Employment Retention Rate 897 913 917 911
Six Monthsrsquo Average Earnings $18319 $18837 $18099 $17828
Performance Measure Quarter Ending 063013 Quarter Ending 063014
Entered Employment Rate 733 728
Employment Retention Rate 900 927
Six Monthsrsquo Average Earnings $18210 $17692
Additional Program Year 2013 Quarterly Data
Performance Measure Quarter Ending
093013
Quarter Ending
123013
Quarter Ending
033014
Entered Employment Rate 713 713
Employment Retention Rate 918 918
Six Monthsrsquo Average Earnings $17499 $17499
Performance in the Past Eight Quarters
727
917
$17550
Analysis During Fiscal Year 2014 there were 62706 total participants receiving TAA benefits or services and 20577 exiters entered employment (729 percent) More than one-third of all participants were minorities with the average age of participants being 47 years and the average tenure being approximately 13 years 9547 exiter participants received credentials or 83 percent of all exiter participants who completed training 32527 participants received training or approximately 52 percent of all participants Lastly the program served 4828 Veteran participants accounting for approximately eight percent of all participants
18
WORKFORCE SYSTEM RESULTS
Unemployment Insurance (UI) httpouidoletagovunemploy
Program Description The federal-state Unemployment Insurance (UI) System minimizes individual and family financial hardship due to unemployment and stabilizes the economy during economic downturns by providing unemployed workers with temporary income support States operate their own Unemployment Insurance Programs regulated by State laws
As the Federal partner DOL provides program leadership allocates administrative funds provides technical assistance and exercises performance oversight
Quarter Highlights As the economy improved the system emphasized program integrity solvency and reemployment Claims rates decreased about 10 percent from the year before and Trust Fund loans decreased from $21 billion to $14 billion EUC benefit payments ceased on December 28 2013 Twenty-four states implemented Short-term Compensation programs allowing unemployed workers to stay on jobs while receiving partial unemployment benefits proportionate to reduced work hours States implemented systems to improve efficiency and reduce overpayments such as data exchange and recover UI overpayments By June 30 2014 42 states were recovering overpayments through Federal Income tax refund offset (TOP) and had recovered $370 million in 2014 (over $840 million since TOPrsquos inception)
Analysis During the year ending June 30 2014
bull 51 million UI claimants were reemployed in the quarter following their UI 1st payments (17 million in the last quarter)
bull The UI system met two and failed two of its four targets UI met detection of overpayments (643 percent vs target of 542 percent) and met reemployment (657 percent vs target of 647 percent)
bull The system fell short of its 1st pay and status targets because of retirements and other turnover of key staff
Program Performance
Performance Measure Four Quarters
Ending 063013 Four Quarters
Ending 063014
Percent of Intrastate Payments Made Timely
812 792
Detection of Recoverable Overpayments Rate
598 643
Facilitation of Reemployment Rate 6261 6552
Percent of Employer Tax Liability 888 882
Operational Results
Recipiency Rate 263 272
Exhaustion Rate 456 431
Percent of Recipients of Prime Working Age (25-54)
702 700
Percent of Recipients Who Are Female
434 437
New Initial Unemployment Insurance Claims
13906868 12501014
Number of First Unemployment Insurance Payments
8404507 7632522
Average Duration of Unemployment Insurance (Weeks)
169
1 Reemployment for year ending June 30 2013 2 Reemployment for year ending June 30 2014
19
167
WORKFORCE SYSTEM RESULTS
Unemployment Insurance (UI) httpouidoletagovunemploy
Additional Program Year 2013 Quarterly Data
Performance Measure Four Quarters
Ending 093013 Four Quarters
Ending 123113 Four Quarters
Ending 033114
Percent of Intrastate Payments Made Timely
809 802 793
Detection of Recoverable Overpayments Rate
590 630 603
Facilitation of Reemployment Rate 6311 6312 6363
Percent of Employer Tax Liability 886 885 884
Operational Results
Recipiency Rate 263 262 267
Exhaustion Rate 453 446 437
Percent of Recipients of Prime Working Age (25-54)
702 702 701
Percent of Recipients Who Are Female
434 434 435
New Initial Unemployment Insurance Claims
13559233 13340263 12947493
Number of First Unemployment Insurance Payments
8215687 7967852 7857395
Average Duration of Unemployment Insurance (Weeks)
169 169 168
1 Reemployment for year ending September 30 2013 2 Reemployment for year ending December 31 2013 3 Reemployment for year ending March 31 2014
20
WORKFORCE SYSTEM RESULTS
100
80
60
40
20
0 Sep-12 Dec-12 Mar-13 Jun-13 Sep-13 Dec-13 Mar-14 Jun-14
n Placement in Employment or Education n Attainment of a Degree or Certificate n LiteracyNumeracy Gains
Job Corps httpwwwjobcorpsgovhomeaspx
Program Description Job Corps is the nationrsquos largest residential educational and career technical training program for at-risk youth ages 16 through 24 The 125 Job Corps centers nationwide provide an integrated comprehensive array of services that include academic career technical and life skills training career planning and work-based learning health care and post-program placement and transition support
Job Corps is committed to offering all students a safe drug-free environment where they can take advantage of the resources provided Job Corpsrsquo mission is to attract eligible young people teach them the skills they need to become employable and independent and place them in meaningful jobs or further education
Program Performance
Performance Measure Four Quarters
Ending 063013 Four Quarters
Ending 063014
Placement in Employment or Education 746 767
Attainment of a Degree or Certificate 706 668
LiteracyNumeracy Gains 692 661
Additional Program Year 2013 Quarterly Data
Performance Measure
Four Quarters
Ending 093013
Four Quarters
Ending 123113
Four Quarters
Ending 033114
Placement in Employment or Education 757 760 765
Attainment of a Degree or Certificate 722 727 707
LiteracyNumeracy Gains 702 709 695
Performance in the Past Eight Quarters
The Performance in the Past Eight Quarters graph displays single quarter data versus the Program Performance tables which depict cumulative four quarter data
Quarter Highlights In May 2014 four Job Corps students from centers in Montana California Iowa and Virginia participated in the 2nd Asia-Pacific Economic Cooperation (APEC) Youth Skills Camp in Beijing and Guangzhou China the second time Job Corps students have participated in this event The camp included field visits to vocational training schools business enterprises and public practical training facilities as well as skills exchanges This international event provides students with life-changing experiences in travel diversity and first-hand exposure to global issues
Analysis bull During the current quarter Job Corps served 69979 participants including 13079 new
enrollees an increase of 801 percent overall compared to the same quarter in PY 2013 and due to the resumption of new enrollments after the PY 2012 enrollment suspensions The number of new students increased by over 200 percent from the same quarter in PY 2013
bull The proportion of 16-17 year olds served increased by 45 percentage points Conversely the proportion of all older students served similarly decreased from the same quarter in PY 2013
bull In the current quarter Job Corps placed 7203 students in Employment and Education a slight decrease of 04 percentage points compared to the same quarter last year In addition 8657 students attained a Certificate a 131 percentage point decrease compared to the same quarter in PY 2013 Also 6789 students attained a LiteracyNumeracy gain an 116 percentage point decrease over the same quarter in PY 2013
bull In the current quarter the program served 50 participants who were Veterans prior to enrollment bull When comparing the four quarter data Placement in Employment or Education increased
21 percentage points Attainment of a Degree or Certificate decreased 38 percentage points and LiteracyNumeracy Gains decreased 31 percentage points from the same quarter one year ago 21
WORKFORCE SYSTEM RESULTS
100
80
60
40
20
0 Sep-12 Dec-12 Mar-13 Jun-13 Sep-13 Dec-13 Mar-14 Jun-14
n Placement Rate for Out-of-School Youth Ages 18 and Above n Recidivism Rate for Youth Ages 14 to 17 n Recidivism Rate for Youth Ages 18 and Above
Workforce Investment Act Youthful Offender Initiative httpwwwdoletagovYouth_servicesyouthful_offendercfm
Program Description The Employment and Training Administration uses its Youthful Offender Appropriation to fund a variety of projects that target youth offenders and young adult offenders Currently operating projects include grants to community-based organizations to involve juvenile offenders in training and service learning projects grants to intermediary organizations to serve young offenders in high-poverty high-crime communities and grants to help youth enter diversion programs as an alternative to out-of-home placements and to assist eligible youth have their juvenile records sealed or expunged
Quarter Highlights The great majority of juvenile offenders are of ages 17 and below and many are still in high school The youth offender grants focus on helping younger youth stay in school and complete their education and helping older youth find jobs and succeed in the labor market Case management mentoring and supportive services are also provided by these grants
Performance in the Past Eight Quarters
Program Performance
Performance Measure Four Quarters
Ending 063013 Four Quarters
Ending 063014
Placement Rate for Youth Ages 18 and Above
36 362
Recidivism Rate for Youth Ages 14 to 17
35 24
Recidivism Rate for Youth Ages 18 and Above
34 16
Results are cumulative for currently operating grants
Additional Program Year 2013 Quarterly Data
Placement Rate for Youth Ages 18 and Above
277 334 325
Performance Measure
Four Quarters
Ending 093013
Four Quarters
Ending 123113
Four Quarters
Ending 033114
Recidivism Rate for Youth Ages 14 to 17
349 349 349
Recidivism Rate for Youth Ages 18 and Above
335 335 335
Analysis bull Providing opportunities to youthful offenders results in varying outcomes depending on
the mix of projects being operated in a given year bull Projects have markedly different placement and recidivism rates depending on whether
they are serving young adults in their 20s or youth ages 16-17 they recruit youth in the community or through direct referrals from the juvenile justice system whether they are located in small or large cities and the extent to which enrollees are at high or low risk of re-offending
22
WORKFORCE SYSTEM RESULTS
100
80
60
40
20
0 Jun-12 Jun-13 Jun-14
n Placement in Employment or Education n Attainment of a Degree or Certificate n LiteracyNumeracy Gains
Workforce Investment Act Youth Program httpwwwdoletagovyouth_services
Program Description The Workforce Investment Act Youth Formula Program provides employment and education services to eligible low-income youth ages 14 to 21 who face barriers to employment The program serves in-school and out-of-school youth youth with disabilities and low literacy rates as well as others who may require additional assistance to complete an educational program and acquire an industry-recognized credential or enter employment
Quarter Highlights The passage of the Workforce Innovation and Opportunity Act (WIOA) includes a major shift in focus to spending more funds on and serving more out-of-school youth (OSY) The workforce system demonstrated its readiness for this shift in that 48 percent of all youth served in PY 2013 were OSY and 57 percent of all WIA youth local area funds were spent on OSY So far in Program Year 2013 California has spent almost 65 percent of their WIA youth funds on OSY with high levels of OSY expenditures in both urban and rural areas 53 percent of all youth served in CA in Program Year 2013 were OSY For example Los Angeles City spent 80 percent of their funds on OSY and the Northern Rural Training and Employment Consortium spent 76 percent of their funds on OSY Both local areas have achieved these levels through strong partnerships with organizations that serve OSY as well as access to high quality work experiences
Program Performance
Performance Measure
Four Quarters
Ending 063012
(Program Year 2011)
Four Quarters
Ending 063013
(Program Year 2012)
Four Quarters
Ending 063014
(Program Year 2013)
Placement in Employment or Education 589 666 690
Attainment of a Degree or Certificate 648 675 684
LiteracyNumeracy Gains 476 509 525
Performance in the Past Three Program Years
Analysis bull 197045 participants were served in the cumulative four quarter reporting period compared
to 217244 served during the same time period last year This decrease is due primarily to a lower funding level compared to the previous year
bull Placement in Employment or Education achieved a result of 690 percent a 24 percentage point increase when compared with the same time period last year
bull The program achieved a result of 684 percent for the Attainment of a Degree or Certificate measure This is a 09 percentage point increase from the same time period last year
bull The LiteracyNumeracy Gains measure achieved a result of 525 percent an increase of 16 percentage points when compared with the same time period last year
bull All three youth common measures exceeded Program Year 2013 GPRA goals
23
WORKFORCE SYSTEM RESULTS
100
80
60
40
20
0 Sep-12 Dec-12 Mar-13 Jun-13 Sep-13 Dec-13 Mar-14 Jun-14
n Placement in Employment or Education n Attainment of a Degree or Certificate n LiteracyNumeracy Gains
YouthBuild httpwwwdoletagovyouth_servicesyouthbuildcfm
Program Description YouthBuild provides job training and educational opportunities for at-risk youth ages 16 to 24 while constructing or rehabilitating affordable housing for low-income or homeless families in their own neighborhoods The youth split their time between the construction site and the classroom where they earn their high school diploma or equivalency learn to be community leaders and prepare for college and other post-secondary training opportunities
Analysis bull 33392 participants have been enrolled into the YouthBuild program since 2007 and 29553
have exited so far bull Since the program began a total of 11716 participants have received a high school
diploma or equivalency 17572 have attained an industry-recognized certificate and 21835 have been placed into initial jobs post-secondary education andor long-term vocational occupational skills training including apprenticeship
bull The Class of 20102011 performance steadily increased The outcomes for all three measures were above those for the Class of 2009 and significantly above the GPRA goals
bull YouthBuild is currently meeting or exceeding the GPRA goal for all three measures The additional quarter of service for 20102011 grants provided additional positive outcomes as expected As the 2012 grant class progresses it is expected that this trend will continue
Program Performance
Quarter Highlights Just A Start in Cambridge (MA) has been a YouthBuild grantee since 2010 In the fourth quarter of the Program Year 2013 they shared the following success story
Victor earned a High School Diploma and HBIPACT construction certification He was accepted to Endicott College in MA He also secured a full time painting position with George Souza Painting making $25 per hour He continues to develop his career plan with staff
Class of 20102011 Performance in the Past Eight Quarters
Performance Measure GPRA Results for Class
0f 20102011 Results for Class 2012 Overall Results
Percent of Participants Entering Employment or Enrolling in Postsecondary Education the Military or Advanced Training Occupational Skills Training in the First Quarter After Exit
500 612 586 519
Percent of Youth Who Attain a Diploma GED or Certificate by the End of the Third Quarter after Exit
672 770 609 672
Percent of Participants Deficient in Basic Skills Who Achieve Literacy or Numeracy Gains of One Adult Basic Education Level
585 676 549 595
24
WORKFORCE SYSTEM RESULTS
100
80
60
40
20
0 Sep-12 Dec-12 Mar-13 Jun-13 Sep-13 Dec-13 Mar-14 Jun-14
n Attainment of a High School Diploma GED or improvement of basic skills by at least two grade levels or completed Occupational Skills training n Participants who Attained Two or more Goals
Indian and Native American Youth Program httpwwwdoletagovdinap
Program Description The Indian and Native American Supplemental Youth Services Program provides summer and year-round employment and training activities for Indian Alaska Native and Native Hawaiian individuals between the ages of 14 and 21 Program resources are targeted to at-risk and the neediest youth who face substantial barriers to education and employment success This population includes high school dropouts and youth who are basic-skills deficient
Quarter Highlights Youth summer employment is a high priority for Native American Tribes However most rural reservation areas do not have enough employers to put youth to work during the summer As a result Tribes rely on the annual WIA Section 166 funding to place youth in summer employment where they can earn a wage and receive valuable work experience
Over the past four quarter period 2487 of the 4399 youth that participated in the youth program were placed in summer employment Youth participants come from low income families with little or no opportunity to earn money during the summer months Through the Indian and Native American Youth Program these youth are given an opportunity to work and earn money during the summer which helps them contribute to their familyrsquos income
Performance in the Past Eight Quarters
Program Performance
Performance Measure Four Quarters
Ending 063013 Four Quarters
Ending 063014
Educational Attainment for Dropouts 180 220
Attainment of Two or More Goals 920 927
The data reported reflect the period from April 1 2012 through March 31 2013 The data reported reflect the period from April 1 2013 through March 31 2014
Additional Program Year 2013 Quarterly Data
Performance Measure Four Quarters
Ending 093013 Four Quarters
Ending 123113 Four Quarters
Ending 033114
Educational Attainment for Dropouts
250 250 220
Attainment of Two or More Goals
930 930 927
The data reported reflect the period from April 1 2013 through September 30 2013 The data reported reflect the period from April 1 2013 through March 31 2014
Analysis bull The Attainment of Two or More Goals rate increased slightly from 92 percent in June 2013
to 927 percent in June 2014 bull The Indian and Native American Youth Program served 4310 youth during the period July
1 2013 through June 30 2014 This is a 164 percentage point decrease in youth served one year ago
bull The Education Attainment for Dropouts increased from 18 percent in June 2013 to 22 percent in June 2014
25
WORKFORCE SYSTEM RESULTS
Green Jobs Innovation Fund Grants (GJIF) httpwwwdoletagovBRGGreenJobs
Program Description The Green Jobs Innovation Fund (GJIF) was authorized as a Pilot and Demonstration Project under the Workforce Investment Act (WIA) of 1998 to help workers receive job training in green industry sectors and occupations as well as access green career pathways GJIF is seeking to increase the number of individuals completing training programs who receive industry-recognized credentials and to increase the number of individuals completing training programs for employment in green jobs
With these grants the Department is emphasizing two key workforce programs that move participants along green career pathways by 1) forging linkages between Registered Apprenticeship and pre-apprenticeship programs andor 2) integrating the delivery of technical and basic skills training through community-based partnerships The grantees are building on existing programs that are already established and serving workers and moving workers into and along green career pathways The Green Jobs Innovation Fund (GJIF) grants are all anticipated to end by June 30 2015
Quarter Highlights The Jobs for the Future (JFF) GreenWays grant program made great progress toward their goal of increasing access for women to enter higher-paying non-traditional occupations Women currently comprise 254 of the programs total enrollment and are earning higher placement wages overall than men At the same time their completion rates credential attainment rates and job placement rates lag behind those of men reflecting the ongoing challenges that women experience in non-traditional occupations The JFF GreenWays program continues to focus on raising the visibility of this issue as a key element in regional approaches to addressing poverty in female-headed households
Program Performance
Performance Measure Cumulative
Four Quarters Ending 063013
Cumulative Four Quarters
Ending 063014
Entered Employment Rate 569 642
Employment Retention Rate 750 821
Six Monthsrsquo Average Earnings $16249 $17459
Additional Program Year 2013 Quarterly Data
Performance Measure
Cumulative Four
Quarters Ending
093013
Cumulative Four
Quarters Ending
123113
Cumulative Four
Quarters Ending
033114
Entered Employment Rate 560 626 641
Employment Retention Rate 790 795 785
Six Monthsrsquo Average Earnings $16406 $15228 $15039
Cumulative Credential Outcomes in the Past Three Quarters
Performance Measure Quarter Ending
123113
Quarter Ending
033114
Quarter Ending
063014
Number Completed Education Job Training Activities
5521 6438 7076
Number Completed Training and Received Credential
5343 6242 6849
Attainment Rate 97 97 97
Analysis As of June 30 2014 8360 participants were enrolled in educationtraining Of these participants 600 participated in Registered Apprenticeship 874 participated in Pre-Apprenticeship and 40 participated in On-the-Job Training A total of 7076 participants completed educationtraining A total of 6849 participants received a credential Lastly a total of 4870 participants entered employment and of these participants 4343 entered training-related employment
26
WORKFORCE SYSTEM RESULTS
Dec-13 Mar-14 Jun-14
100 $27000
$2600080
$2500060
$24000 40
$23000
20 $22000
0 $21000
n Entered Employment Rate n Employment Retention Rate n Six Months Average Earnings
H-1B Jobs and Innovation Accelerator Challenge Grants httpwwwdoletagovETA_News_Releases20111398cfm
Program Description The Jobs and Innovation Accelerator Challenge (Jobs Accelerator) is designed to help regions achieve the demonstrated benefits of collaborative cluster-based regional development This initiative represents the implementation of Administration policy priorities to accelerate bottom-up innovation in urban and rural regions as opposed to imposing ldquoone-size-fits-allrdquo solutions The Jobs Accelerator also meets Administration goals for smarter use of government resources through reduction of Federal silos and promotion of coordinated Federal funding opportunities that offer more efficient access to Federal resources Investments from Federal agencies for the Jobs Accelerator projects include The US Department of Laborrsquos Employment and Training Administration (DOL-ETA) the US Department of Commercersquos Economic Development Administration (DOC-EDA) and the National Institutes of Standards and Technologyrsquos Hollings Manufacturing Extension Partnership (NIST-MEP) the Small Business Administration (SBA) the Department of Energy Advanced Manufacturing Office (DOE AMO) and the Delta Regional Authority (DRA)
The objectives of the Jobs Accelerator are to
bull Accelerate the formation of new high-growth businesses and expansion of existing businesses
bull Accelerate the creation of higher-wage jobs bull Advance commercialization of research including Federally-funded research bull Support deployment of new processes new technologies and new products to grow sales
and generate employment bull Enhance the capacity of small businesses in the cluster including small and disadvantaged
businesses bull Increase exports and business interaction with international buyers and suppliers bull Develop the skilled workforce needed to support growing clusters and bull Ensure diverse workforce participation in clusters through outreach training and the
creation of career pathways
Quarter Highlights The Northeast Ohio Speed-To-Market Accelerator (STMA) program administered by Lorain County Community College aims to accelerate the speed-to-market for near production or pilot production prototypes stimulate job creation and increase the global competitiveness of cluster companies attract private capital and attract students incumbent workers and the unemployed
This quarter STMA helped accelerate the introduction of a new dry electrode product for heart monitoring This sensor and electronics will be introduced as part of the next generation of wearable human performance arm band from Pittsburgh based Body Media a subsidiary of Jawbone Further STMA continues to bring new companies into the STMA
program through cluster outreach activities and this quarter three new leads were generated as the result of the existing STMA partners MAGNET JumpStart Lorain County Community College and NorTech
Program Performance
Performance Measure Four Quarters
Ending 123113 Four Quarters
Ending 033114 Four Quarters
Ending 063014
Entered Employment Rate 307 283 359
Employment Retention Rate 907 925 927
Six Monthsrsquo Average Earnings $23310 $22953 $26682
Performance in the Past Three Quarters
Analysis A total of 3702 individuals were served 3632 individuals began educationjob training activities and 2052 individuals completed educationjob training services Of participants completing educationjob training 370 unemployed individuals completed training and entered employment and of these 114 individuals entered training-related employment A total of 204 employed individuals completed training and retained their current position and of these 85 employed individuals completed training and advanced into a new position A total of 2006 individuals completed educationtraining activities and received credentials and of these 2273 total credentials were awarded
This data represents three rounds of the for Jobs Accelerator initiative which includes the Jobs Accelerator Round 1 the Advanced Manufacturing Jobs Accelerator Round 2 and the Make it in America (MIIA) Jobs Accelerator grants program
27
WORKFORCE SYSTEM RESULTS
100 $56000
80 $54000
$52000 60 $50000
40 $48000
$46000 20
$44000
0 $42000 Dec-13 Mar-14 Jun-14
n Entered Employment Rate n Employment Retention Rate n Six Months Average Earnings
H-1B Technical Skills Training Grants httpwwwdoletagovbusinessH1B_Tech_Skillscfm
Program Description The H-1B Technical Skills Training (TST) Grants were authorized by the American Competitiveness and Workforce Improvement Act of 1998 (ACWIA) as amended (29 USC 2916a) to provide education training and job placement assistance in the occupations and industries for which employers are using H-1B visas to hire highly-skilled foreign workers on a temporary basis and the related activities necessary to support such training The H-1B TST Grant Program is intended to raise the technical skill levels of American workers so they can obtain or upgrade employment in high-growth industries and occupations Over time these education and training programs will help businesses reduce their use of skilled foreign professionals permitted to work in the US on a temporary basis under the H-1B visa program The grants represent significant investments in sectors such as information technology advanced manufacturing and health care In addition these grants will focus on serving participants who have been identified as long-term unemployed particularly those who have been unemployed the longest These grants also have an emphasis on providing on-the-job training allowing participants to learn new skills while earning a pay check To date ETA has announced two rounds of TST grants totaling $342 million The first round was announced on October 4 2011 and the second round was announced on February 22 2012
Quarter Highlights The Los Angeles HealthWorks On-the-Job training (OJT) initiative administered by Managed Career Solutions Inc (MCS) provides individuals with training that leads to industry recognized credentials and employment opportunities within the regionrsquos healthcare field MCS maintains several strong partnerships to coordinate outreach recruitment training OJT placements and employment opportunities As of June 30 2014 MCS served nearly 800 long-term unemployed participants and overall 1100 participants In the same period over 650 individuals completed training and earned an industry recognized credential Of those completers 128 were employed at participation however the majority were underemployed and gained the necessary job skills and credentials that allowed 80 percent to advance into a new position In recognition MCS received the Malcom Baldrige and State Eureka awards
Analysis bull 52532 individuals were served and 51071 individuals began educationjob training
activities bull 15185 individuals completed educationjob training activities including 3321 unemployed
individuals who completed training and entered employment bull Of these 2925 individuals entered training-related employment 2902 employed individuals
completed training and retained their current position 1452 employed individuals completed training and advanced into a new position
bull 11944 individuals completed educationjob training activities and received credentials with 14099 total credentials awarded
Program Performance
Performance Measure
Four Quarters
Ending 123113
Four Quarters
Ending 033114
Four Quarters
Ending 063014
Entered Employment Rate 778 725 675
Employment Retention Rate 993 944 926
Six Monthsrsquo Average Earnings $54683 $50833 $46245
Since the H-1B TST program provides training to incumbent unemployed and long-term unemployed workers to prepare them for jobs in a variety H-1B industries andor occupations the Entered Employment Rate and Six Monthsrsquo Average Earnings can vary For the quarter ending on June 30 2014 the H-1B TST program saw a decline in the Entered Employment Rate and Six Monthsrsquo Average Earnings in comparison with the results for the previous rolling four quarters Previous results reflected a large number of incumbent workers who enrolled in short-term high-skilled training and exited early leading to a relatively high Six Monthsrsquo Average Earnings As the projects progress unemployed and long-term unemployed workers who required longer-term training begin to exit the program and search for jobs Ultimately as they enter employment wages may be less than those achieved by the higher-skilled incumbent workers who either retain or advance in their positions after training
Performance in the Past Three Quarters
28
WORKFORCE SYSTEM RESULTS
100 $21000
$19000 80
$17000
$1500060 $13000
40 $11000
$900020
$7000
0 $5000Sep-12 Dec-12 Mar-13 Jun-13 Sep-13 Dec-13 Mar-14 Jun-14
n Entered Employment Rate n Employment Retention Rate n Six Months Average Earnings
Community-Based Job Training Grants (CBJT) httpwwwdoletagovbusinessCommunity-BasedJobTrainingGrantscfm
Program Description Community-Based Job Training Grants (CBJT) seek to strengthen the role of community colleges in promoting the United States workforcersquos competitiveness The program does this by building the capacity of community colleges to train workers in skills required to succeed in regionally based high-growth high-demand industries and occupations Important grant activities include training in the healthcare biotech advanced manufacturing energy automotive transportation construction insurance forestry and aerospace industries The first round of CBJT grants were awarded in October 2005 To date ETA has announced five rounds of CBJT grants awarding 320 grants to community colleges and other organizations All CBJT grants ended as of June 30 2014
Quarter Highlights The 14 remaining projects active in this quarter represent the culmination of another successful DOL initiative Some of the significant accomplishments include the development and sustainability of Roane State Community Collegersquos Lean Manufacturing program designed to meet the needs of local manufacturing employers the San Jacinto Community College Districtrsquos Gulf Coast Healthcare Partners project which developed training to support healthcare career and Central Arizona Collegersquos Pinal County Alternative Energy Project More than half of the CBJT participants who began education and training activities completed their programs 79 percent of them received an industry recognized credential ie certificate or degree Eighty-four percent of the participants who gained employment entered into new training-related positions
Program Performance
Performance Measure Four Quarters
Ending 063013 Four Quarters
Ending 063014
Entered Employment Rate 572 662
Employment Retention Rate 891 899
Six Monthsrsquo Average Earnings $18675 $17027
Additional Program Year 2013 Quarterly Data
Performance Measure
Four Quarters
Ending 093013
Four Quarters
Ending 123113
Four Quarters
Ending 033114
Entered Employment Rate 57 605 655
Employment Retention Rate 891 897 891
Six Monthsrsquo Average Earnings $18675 $18285 $16642
Performance in the Past Eight Quarters
Analysis bull 268359 individuals have been served through the initiative bull 258216 individuals began educationjob training activities bull 165264 individuals completed educationjob training activities Of these
bull 131107 individuals received credentials bull 65089 individuals entered new positions of employment and 54344 individuals entered new
positions of training-related employment
Note All data are cumulative Prior to new reporting requirements implemented in the quarter ending December 31 2011 grantees only reported results for individuals that entered employment and individuals that entered training-related employment (noted above) if those participants entered employment and completed training in the same quarter As a result prior to that quarter participants that entered employment in quarters after they completed training were captured in the Common Measures and the total number of individuals that ultimately entered employment and training-related employment are actually higher than the results above indicate
29
WORKFORCE SYSTEM RESULTS
100 92
7880
5760
40
20
0
n Percent of Target Number of Programs Launched by Round
Round 1 Round 2 Round 3
Trade Adjustment Assistance Community College and Career Training (TAACCCT) Grants httpwwwdoletagovtaaccct
Program Description The Trade Adjustment Assistance Community College and Career Training (TAACCCT) Grant Program is authorized by the Trade Act of 1974 under Chapter 4 of Title II The purpose of this grant program is to provide eligible institutions of higher education with funds to expand and improve their ability to deliver education and career training programs that can be completed in two years or less and that result in skills degrees and credentials that prepare program participants for employment in high-wage high-skill occupations and are suited for workers who are eligible for training under the Trade Adjustment Assistance (TAA) for Workers program under Chapter 2 of Title II of the Trade Act The TAACCCT Grant Program is funded under the Health Care and Education Reconciliation Act of 2010 which appropriated $500 million for the program for each of Fiscal Years 2011-2014 for a total of $2 billion
Round 1 ndash FY 2011 Grants On June 30 2014 grants awarded in Round 1 (FY 2011) had completed all but one quarter of their periods of performance By the end of their final year of the grant the forty-nine (49) Round 1 grantees project that they will offer a total of 906 new programs of study As of June 30 2014 grantees began offering 834 (92 percent) of these programs of study
Round 2 ndash FY 2012 Grants The seventy-nine (79) grants awarded in the Fiscal Year 2012 had completed seven quarters of their grants at the end of June 30 2014 Their period of performance began on October 1 2012 and will end on September 30 2016 however their final year will be dedicated to gathering information and data for reporting outcome measures and completing the requirements for a third-party evaluation They project that by the end of the third year they will have launched 761 programs As of the end of June 30 2014 they had began offering 561 (78 percent) of these programs
Round 3 ndash FY 2013 Grants Grants awarded in FY 2013 had completed the first three quarters of their period of performance Their grants began on October 1 2013 and will end on September 30 2017
In their third year they will have launched all of their programs as their final year will be dedicated to collecting follow up data for evaluation and reporting purposes only The fifty-seven (57) grantees plan to launch 551 programs As of June 30 2014 they had already launched 288 (57 percent) of these programs
Percentage of Target Number of Programs Launched as of June 30 2014 by Grant Round
Performance Information Programmatic data is collected at different intervals throughout the period of performance including
bull Quarterly Narrative Progress Reports (QNPR) Grantees will provide quarterly qualitative data on the capacity building taking place through progress and other implementation measures that grantees defined in their Statements of Work
bull Annual Performance Reports (APR) Grantees will provide annual quantitative data on their training and employment outcomes for TAACCCT program participants that are impacted by the capacity building activities being implemented by their grants
30
WORKFORCE SYSTEM RESULTS
$4500000 3500$4000000 3000$3500000
2500
Jun-13 Dec-13 Mar-14 Jun-14
Amou
nt $3000000 2000$2500000
$2000000 1500 $1500000 1000 $1000000
500$500000 $0 0
n Amount of Revenue Generated n Number of Tickets Assigned
Disability Employment Initiative (DEI) httpwwwdoletagovdisability
Program Description All DEI Workforce Employment Network (EN) Trends
Launched in 2010 the Disability Employment Initiative (DEI) seeks to improve education training and employment opportunities for youth and adults with disabilities who are unemployed underemployed andor receiving Social Security disability benefits The DEI is jointly funded by the US Department of Laborrsquos Employment and Training Administration and Office of Disability Employment Policy DEI projects improve collaboration among employment and training and asset development programs implemented at state and local levels including the Social Security Administrationrsquos Ticket to Work Program and build effective partnerships that leverage resources to better serve individuals with disabilities and improve employment outcomes
Quarter Highlights A variety of Department of Labor programs helped Vietnam-era veteran Richard James navigate through life After servicing B-52 bombers in the Air Force James held a series of sales jobs while putting himself through law school at night He rose to become a successful New England attorney and owner of a boat dock building company when he suffered a terrible head injury which caused spine and nerve damage Addiction to pain medication followed and James ended up homeless While recovering from his injuries James took a college course through the Veterans Retraining Assistance Program managed in part by the Department He received career counseling from a Disabled Veterans Outreach Program representative at a local American Job Center and support from the DEI Disability Resource Coordinator Eventually James was hired as an attorney by a Rhode Island law firm The departments grants and programs made possible the services that put me back in a position of being a productive member of society he said
Program Performance
Performance Measure Quarter Ending 63013
Quarter Ending
123113
Quarter Ending 33114
Quarter Ending 63014
Analysis bull The Exit Rate for Adult and Youth exiters with disabilities in Round one DEI sites is almost
double the national average Adult DEI was 89 percent vs All StatesAll LWIAs 49 percent Older Youth DEI 166 percent vs All StatesAll LWIAs 87 percent Younger Youth DEI 339 percent vs All StatesAll LWIAs 151 percent
bull The CredentialSkill Attainment Rate for older and younger youth with disabilities in Round 1 DEI sites was higher than the national average Older Youth DEI credential rate 568 percent vs All StatesAll LWIAs 383 percent Younger Youth DEI skill rate 902 percent vs All States All LWIAs 834 percent
bull The Exit Rate for Adult and Youth exiters with disabilities in Round two DEI sites is higher than the national average Adult DEI 56 percent vs All StatesAll LWIAs 49 percent Older Youth DEI 163 percent vs All StatesAll LWIAs 87 percent and Younger Youth DEI 167 percent vs All StatesAll LWIAs 151 percent
bull The Entered Employment Rate for Adult DEI sites 657 percent is 20 percent higher than in All StatesAll LWIAs 434 percent
bull DEI Workforce Employment Networks (EN) activity shows that the number of Tickets assigned increased from 1780 to 2903 an increase of 1123 and the amount of revenue
Number of Tickets Assigned 1780 1590 2554 2903 generated from DEI EN payments increased from $2373404 to $4057353 an increase of $168 million Amount of Revenue Generated $2373404 $1927104 $3505582 $4057353
31
WORKFORCE SYSTEM RESULTS
ETA Internet-Based Assistance (E-TOOLS) wwwcareerinfonetorg wwwservicelocatororg wwwcareeronestoporg wwwonetonlineorg wwwmyskillsmyfutureorg wwwmynextmoveorg
Program Description Additional Program Year 2013 Quarterly Data
Performance Measure Quarter Ending
093013
Quarter Ending
123113
Quarter Ending
033114
CareerOneStop Portal Visits 5754645 5159240 5340022
ETArsquos Internet-based assistance includes electronic tools that help individuals explore career opportunities and link to job postings either on their own or at local American Job Centers to make informed employment and education choices
The Web sites feature user-friendly occupation and industry information salary data career videos education resources career exploration assistance and other resources that support talent development in todayrsquos fast-paced global marketplace Users can find information some of which is also industry sponsored about occupations that are in-demand in high growth industries Additionally information is available regarding occupational skills and workplace competencies
Quarter Highlights For the year ending June 2014 CareerOneStop launched a new portal for Ex-Offenders added Federal Contractor job tagging a TAACCCT information finder Youth Council information to Americarsquos Service Locator and began working on adding more job feeds
Americarsquos Service Locator (ASL) Visits
730998 758919 724053
ONET Downloads 26646 29407 28505
ONET Visits 7697608 10211177 11500039
Combined Visits 14183251 16129336 17564114
Performance in the Past Eight Quarters
25000000 $36000
Sep-12 Dec-12 Mar-13 Jun-13 Sep-13 Dec-13 Mar-14 Jun-14
n Combined Visits (in millions) n ONET Product Downloads (in thousands)
$31500 20000000
ONE
T Pr
oduc
t Dow
nloa
ds
$27000
Com
bine
d Vi
sits
$2250015000000 $18000
10000000 $13500
$90005000000
$4500
$00
ONET has added web services for developers and increased the available Tools and Technology and Detailed Work Activities information to convey specialized occupational attributes
Program Performance
Performance Measure Quarter
Ending 063013 Quarter
Ending 063014
CareerOneStop Portal Visits 5104850 5472742
Americarsquos Service Locator (ASL)Visits
747114 802148
ONET Downloads 29482 25278
ONET Visits 8716609 13581922
Combined Visits 14568573 19856812
Analysis bull ETA Internet-Based Assistance received 19856812 combined visits for the quarter ending
June 30 2014 an increase of 36 percent over the same period in 2013 bull Visits to CareerOneStop increased to 5472742 or 72 percent over the same period in 2013
with mySkillsmyFuture continuing to be a popular tool with an increase of 23 percent bull Americarsquos Service Locator Visits traffic increased 74 percent over the same period in 2013 bull The ONET traffic received 13581922 visits in this quarter an increase of 558 percent
over the same period in 2013 and the ONET downloads totaled 25278 for the quarter a decrease of 142 percent
32
WORKFORCE SYSTEM RESULTS
Glossary of Performance Measures
Common Performance Measures Common Performance Measures are used by Workforce Investment Act Indian and Native American Program Disability Program Navigator Initiative Wagner-Peyser Trade Adjustment Assistance Senior Community Service Employment Program Reintegration of Ex-Offenders Registered Apprenticeship Program Job Corps National Farmworker Jobs Program High Growth Job Training Initiative and Community-Based Job Training Grants
Adult Measures Entered Employment Of those who are not employed at the date of participation the number of adult participants who are employed in the first quarter after the exit quarter divided by the number of adult participants who exit during the quarter
Employment Retention Of those who are employed in the first quarter after the exit quarter the number of adult participants who are employed in both the second and third quarters after the exit quarter divided by the number of adult participants who exit during the quarter
Six Monthsrsquo Average Earnings Of those adult participants who are employed in the first second and third quarters after the exit quarter total earnings in the second quarter plus the total earnings in the third quarter after the exit quarter divided by the number of adult participants who exit during the quarter
Average Earnings Change in Six Months1
Of those who are employed in Q1 after exit the total post-program earnings (earnings in Q2 + Q3 after exit) minus pre-program earnings (earnings in Q2 + Q3 prior to registration) divided by the number of adults who exit during the quarter
Youth Measures Attainment of a Degree or Certificate Of those enrolled in education (at the date of participation or at any point during the program) the number of youth participants who attain a diploma GED or certificate by the end of the third quarter after the exit quarter divided by the number of youth participants who exit during the quarter
1 This definition was used for earnings in PY 2005 Q=quarter
33
Literacy and Numeracy Gains Of those out-of-school youth who are basic skills deficient the number of youth participants who increase one or more educational functioning levels divided by the number of youth participants who have completed a year in the program (ie one year from the date of first youth program service) plus the number of youth participants who exit before completing a year in the program
Placement in Employment or Education2
Of those who are not in postsecondary education or employment (including the military) at the date of participation the number of youth participants who are in employment (including the military) or enrolled in postsecondary education andor advanced trainingoccupational skills training in the first quarter after the exit quarter divided by the number of youth participants who exit during the quarter
Program-Specific Performance Measures
Disability Employment Initiative (DEI) Number of Tickets Assigned Number of individuals on Social Security Administration (SSA) disability benefits who assigned their Ticket to the workforce board agency or American Job Center as their designated Employment Network under the SSA Ticket to Work program All DEI pilot sites must become an Employment Network under Ticket to Work
Amount of Revenue Generated Under the SSA Ticket to Work program when jobseekers who receive SSA disability benefits assign their Ticket to a workforce board agency or American Job Center as an Employment Network and then achieve certain employment milestones the Employment Network receives money or ldquoTicket revenuerdquo
2 Because of its intensity and duration the YouthBuild performance measure for placement in employment or education does not exclude those who entered the program with a job or in college
WORKFORCE SYSTEM RESULTS
Foreign Labor Certification Percent of H-1B Applications Resolved in Seven Business Days This estimate is based on the total number of applications processed within seven business days divided by the total number of applications processed for a given reporting period An application is considered processed if the last significant event is (1) certified (2) denied or (3) withdrawn
Average Number of Days to Resolve PERM Applications Not Subject to Integrity Review The average processing time between case receipt and decision date for non-audited cases
Average Number of Days to Resolve PERM Applications Subject to Integrity Review The average processing time between case receipt and decision date for audited cases
Percent of Complete H-2A Employer Applications Resolved within 30 Days Before the Date of Need This estimate is based on the total number of complete applications resolved within 30 days before the date of need divided by the total number of applications processed for a given reporting period
Percent of H-2B Applications Processed Within 30 Days of Receipt This estimate is based on the total number of applications processed within 30 days of receipt divided by the total number of applications processed for a given reporting period An application is considered processed if the last significant event is (1) certified (2) denied or (3) withdrawn
Indian and Native American Youth Attainment of Two or More Goals The total number of youth participants enrolled in the Granteersquos Supplemental Youth Services Program who attained at least two of the 14 goals listed below divided by the total number of Supplemental Youth Services participants enrolled during the report period The 14 goals include
1 Completed Job ReadinessOrientation to the World of Work Training 2 Completed Internship or Vocational Exploration Program
3 Completed Career Assessment 4 Entered Unsubsidized Employment 5 Remained in School 6 Returned to School Full Time 7 Enrolled in Job Corps 8 Improved Basic Skills Level By At Least Two Grades 9 Attained High School Diploma 10 Attained GED 11 Completed Occupational Skills Training 12 Completed Leadership Skills Training 13 Entered Other (Non-Supplemental Youth) Training Program 14 Summer Employment
Educational Attainment for Dropouts The number of dropouts who have obtained a high school diploma GED or increased their literacy and numeracy by two grade levels divided by the total number of dropouts
Job Corps Measures Placement in Employment or Education Percent of Job Corps participants3 entering employment or enrolling in post-secondary education andor advanced skills trainingoccupational skills training in the first quarter after exit from the program
Attainment of a Degree or Certificate Percent of students who attain a GED HSD or certificate
Literacy Numeracy Gains Percent of students who achieve literacy or numeracy gains of one or more Adult Basic Education (ABE) levels
3 Calculation of the Placement rate measure does not include outcomes for students who participated in the program for less than 60 days
34
WORKFORCE SYSTEM RESULTS
Internet-Based Assistance Web Site Visits ETArsquos Internet-based assistance includes electronic tools that help individuals make informed employment and education choices The measure for tracking the overall performance and usage of these tools is Web site visits A visit is defined as a series of page requests from the same uniquely identified client with a time of no more than 30 minutes between each page
request
ONet Product Downloads The ONET product downloads count the number of unique users who download an ONET online resource (wwwonetcenterorg) which includes the ONET database (all versions) ONET technical reports (such as on green jobs) supplemental data files (lay titles tools and technology) the ONET Career Exploration Tool files ONET Survey questionnaires and other related materials such as the Toolkit for Business
Registered Apprenticeship Program Entered Employment Rate Percent of apprentices employed in the first quarter after exit who either completed or cancelled from their Registered Apprenticeship Program
Employment Retention Rate Percent of apprentices employed in the first quarter after exit still employed in the second and third quarter after exit who either completed or cancelled from their Registered Apprenticeship Program
Six Monthsrsquo Average Earnings Six month Average Earnings of apprentices employed in the first quarter after exit still employed in the second and third quarter after exit who either completed or cancelled from their Registered Apprenticeship Program
Reintegration of Ex-OffendersmdashAdult Program Recidivism Rate The percentage of participants who are rearrested for a new crime or re-incarcerated for revocation of a parole or probation violation within one year from release from prison
Senior Community Service Employment Program Service Level The count of participants during the report period divided by the total number of authorized grantee community service positions
Community Service The number of community service hours as reported by each grantee divided by the total community service hours funded for the grantee adjusted for minimum wage differences among the states
Most-in-Need Most-in-need means participants with one or more of the following characteristics have a severe disability are frail are age 75 or older are age-eligible but not receiving benefits under Title II of the Social Security Act reside in an area with persistent unemployment and have severely limited employment prospects have limited English proficiency have low literacy skills have a disability reside in a rural area are Veterans have low employment prospects have failed to find employment after utilizing services provided under Title I of the Workforce Investment Act of 1998 (29 USC 2801 et seq) or are homeless or at risk for homelessness (sect 513(b)(1)(E) as amended by Pub L No 109-365)
Unemployment Insurance Percent of Payments Made Timely The percentage of intrastate Unemployment Insurance benefit first payments for full weeks of unemployment issued within 14 days following the first compensable week in states with a waiting week and 21 days in non-waiting week states
Detection of Recoverable Overpayments The amount of overpayments (dollars) established through state operations as a percent of the estimated amount states can detect and establish for recovery
Entered Employment Rate The percent of persons receiving a first payment in a given quarter who had earnings in the next quarter
Percent of Employer Tax Liability Determinations Made Timely The percent of new employer determinations made within 90 days of the end of the quarter in which employers became liable to pay unemployment taxes
35
WORKFORCE SYSTEM RESULTS
YouthBuild Attainment of a Degree or Certificate Of those enrolled the number of youth participants who attain a diploma high school equivalency degree or industry-recognized certificate by the end of the third quarter after the exit quarter divided by the number of youth enrolled (minus youth exited for other reasons)
Literacy and Numeracy Gains Of those youth participants who are basic skills deficient at enrollment the number of youth participants who increase one or more educational functioning levels within one year of enrollment divided by the number of youth participants who have completed a year in the program
Placement in Employment or Education The number of youth participants who are in employment (including the military) or are enrolled in post-secondary education andor advanced trainingoccupational skills training in the first quarter after the exit quarter divided by the number of youth participants who exited during the previous quarter
Youthful Offender Projects Placement Rate The placement rate is the percentage of out-of-school youth ages 18 and above placed in unsubsidized jobs occupational training post-secondary education or the military
Recidivism Rate The recidivism rate is the percentage of youth offenders who have been convicted of a new crime within 12 months of their release of a correctional facility or being placed on probation
36
WORKFORCE SYSTEM RESULTS
2471 American Job Centers formerly known as One-Stop Career Centers
12 VT
9 HI
1 GU
6 DC
2 VI
15 NE
16 SD
12 ME
19 IA
19 AK
19 WV
4 DE
47 AL
55 CO
48 MN
57 WI
89 NC
60 GA
31 MA
23 NM
16 ND
47 AR
70 PA
18 CT 4 RI
12 NV
20 WY
22 KS
18 PR
89 OH
69 TN
102 FL
59 AZ 46
SC
12 NH
29 NJ
52 VA
22 MT
33 OK
39 MS
59 WA
61 IL 34 MD
47 OR
131 KY
62 LA
83 IN
33 UT
44 MO
26 ID 90
NY95 MI
1 to 25
25 to 50
50 to 75
75 to 100
Over 100
203 CA
180 TX
Source Americarsquos Service Locator (wwwServiceLocatororg) Americarsquos Service Locator connects individuals to employment and training opportunities available at local American Job Centers The Web site provides contact information for a range of local work-related services including unemployment benefits career development and educational opportunities As of March 17 2015
37
WORKFORCE SYSTEM RESULTS
United States Department of Labor
200 Constitution Avenue NW
Washington DC 20210
wwwdolgov
- A9RFAFEtmp
- DOL_Workforce_Rprt_Jun_2014_51415-dp
-
- Workforce System Results
-
- Contents
- Quarterly Spotlight
- People Served by Program
- Current Appropriations
- Government Performance and Results Act Goals (GPRA)
- Indian and Native American Adult Program (INAP)
- National Farmworker Jobs Program (NFJP)
- Senior Community Service Employment Program (SCSEP)
- Wagner-Peyser Employment Service
- Workforce Investment Act Adult Program
- Workforce Investment Act Dislocated Worker Program
- H-1B and Permanent Foreign Labor Certification (PERM)
- H-2A and H-2B Foreign Labor Certification Programs
- Reintegration of Ex-Offenders (RExO-ADULT)
- Registered Apprenticeship
- Registered Apprenticeship
- Trade Adjustment Assistance (TAA)
- Unemployment Insurance (UI)
- Unemployment Insurance (UI)
- Job Corps
- Workforce Investment Act Youthful Offender Initiative
- Workforce Investment Act Youth Program
- YouthBuild
- Indian and Native American Youth Program
- H-1B Jobs and Innovation Accelerator Challenge Grants
- H-1B Technical Skills Training Grants
- Community-Based Job Training Grants (CBJT)
- Trade Adjustment Assistance Community College and Career Training (TAACCCT) Grants
- Disability Employment Initiative (DEI)
- ETA Internet-Based Assistance (E-TOOLS)
- Glossary of Performance Measures
- 2471 American Job Centers formerly known as One-Stop Career Centers
-

WORKFORCE SYSTEM RESULTS
Unemployment Insurance (UI) httpouidoletagovunemploy
Additional Program Year 2013 Quarterly Data
Performance Measure Four Quarters
Ending 093013 Four Quarters
Ending 123113 Four Quarters
Ending 033114
Percent of Intrastate Payments Made Timely
809 802 793
Detection of Recoverable Overpayments Rate
590 630 603
Facilitation of Reemployment Rate 6311 6312 6363
Percent of Employer Tax Liability 886 885 884
Operational Results
Recipiency Rate 263 262 267
Exhaustion Rate 453 446 437
Percent of Recipients of Prime Working Age (25-54)
702 702 701
Percent of Recipients Who Are Female
434 434 435
New Initial Unemployment Insurance Claims
13559233 13340263 12947493
Number of First Unemployment Insurance Payments
8215687 7967852 7857395
Average Duration of Unemployment Insurance (Weeks)
169 169 168
1 Reemployment for year ending September 30 2013 2 Reemployment for year ending December 31 2013 3 Reemployment for year ending March 31 2014
20
WORKFORCE SYSTEM RESULTS
100
80
60
40
20
0 Sep-12 Dec-12 Mar-13 Jun-13 Sep-13 Dec-13 Mar-14 Jun-14
n Placement in Employment or Education n Attainment of a Degree or Certificate n LiteracyNumeracy Gains
Job Corps httpwwwjobcorpsgovhomeaspx
Program Description Job Corps is the nationrsquos largest residential educational and career technical training program for at-risk youth ages 16 through 24 The 125 Job Corps centers nationwide provide an integrated comprehensive array of services that include academic career technical and life skills training career planning and work-based learning health care and post-program placement and transition support
Job Corps is committed to offering all students a safe drug-free environment where they can take advantage of the resources provided Job Corpsrsquo mission is to attract eligible young people teach them the skills they need to become employable and independent and place them in meaningful jobs or further education
Program Performance
Performance Measure Four Quarters
Ending 063013 Four Quarters
Ending 063014
Placement in Employment or Education 746 767
Attainment of a Degree or Certificate 706 668
LiteracyNumeracy Gains 692 661
Additional Program Year 2013 Quarterly Data
Performance Measure
Four Quarters
Ending 093013
Four Quarters
Ending 123113
Four Quarters
Ending 033114
Placement in Employment or Education 757 760 765
Attainment of a Degree or Certificate 722 727 707
LiteracyNumeracy Gains 702 709 695
Performance in the Past Eight Quarters
The Performance in the Past Eight Quarters graph displays single quarter data versus the Program Performance tables which depict cumulative four quarter data
Quarter Highlights In May 2014 four Job Corps students from centers in Montana California Iowa and Virginia participated in the 2nd Asia-Pacific Economic Cooperation (APEC) Youth Skills Camp in Beijing and Guangzhou China the second time Job Corps students have participated in this event The camp included field visits to vocational training schools business enterprises and public practical training facilities as well as skills exchanges This international event provides students with life-changing experiences in travel diversity and first-hand exposure to global issues
Analysis bull During the current quarter Job Corps served 69979 participants including 13079 new
enrollees an increase of 801 percent overall compared to the same quarter in PY 2013 and due to the resumption of new enrollments after the PY 2012 enrollment suspensions The number of new students increased by over 200 percent from the same quarter in PY 2013
bull The proportion of 16-17 year olds served increased by 45 percentage points Conversely the proportion of all older students served similarly decreased from the same quarter in PY 2013
bull In the current quarter Job Corps placed 7203 students in Employment and Education a slight decrease of 04 percentage points compared to the same quarter last year In addition 8657 students attained a Certificate a 131 percentage point decrease compared to the same quarter in PY 2013 Also 6789 students attained a LiteracyNumeracy gain an 116 percentage point decrease over the same quarter in PY 2013
bull In the current quarter the program served 50 participants who were Veterans prior to enrollment bull When comparing the four quarter data Placement in Employment or Education increased
21 percentage points Attainment of a Degree or Certificate decreased 38 percentage points and LiteracyNumeracy Gains decreased 31 percentage points from the same quarter one year ago 21
WORKFORCE SYSTEM RESULTS
100
80
60
40
20
0 Sep-12 Dec-12 Mar-13 Jun-13 Sep-13 Dec-13 Mar-14 Jun-14
n Placement Rate for Out-of-School Youth Ages 18 and Above n Recidivism Rate for Youth Ages 14 to 17 n Recidivism Rate for Youth Ages 18 and Above
Workforce Investment Act Youthful Offender Initiative httpwwwdoletagovYouth_servicesyouthful_offendercfm
Program Description The Employment and Training Administration uses its Youthful Offender Appropriation to fund a variety of projects that target youth offenders and young adult offenders Currently operating projects include grants to community-based organizations to involve juvenile offenders in training and service learning projects grants to intermediary organizations to serve young offenders in high-poverty high-crime communities and grants to help youth enter diversion programs as an alternative to out-of-home placements and to assist eligible youth have their juvenile records sealed or expunged
Quarter Highlights The great majority of juvenile offenders are of ages 17 and below and many are still in high school The youth offender grants focus on helping younger youth stay in school and complete their education and helping older youth find jobs and succeed in the labor market Case management mentoring and supportive services are also provided by these grants
Performance in the Past Eight Quarters
Program Performance
Performance Measure Four Quarters
Ending 063013 Four Quarters
Ending 063014
Placement Rate for Youth Ages 18 and Above
36 362
Recidivism Rate for Youth Ages 14 to 17
35 24
Recidivism Rate for Youth Ages 18 and Above
34 16
Results are cumulative for currently operating grants
Additional Program Year 2013 Quarterly Data
Placement Rate for Youth Ages 18 and Above
277 334 325
Performance Measure
Four Quarters
Ending 093013
Four Quarters
Ending 123113
Four Quarters
Ending 033114
Recidivism Rate for Youth Ages 14 to 17
349 349 349
Recidivism Rate for Youth Ages 18 and Above
335 335 335
Analysis bull Providing opportunities to youthful offenders results in varying outcomes depending on
the mix of projects being operated in a given year bull Projects have markedly different placement and recidivism rates depending on whether
they are serving young adults in their 20s or youth ages 16-17 they recruit youth in the community or through direct referrals from the juvenile justice system whether they are located in small or large cities and the extent to which enrollees are at high or low risk of re-offending
22
WORKFORCE SYSTEM RESULTS
100
80
60
40
20
0 Jun-12 Jun-13 Jun-14
n Placement in Employment or Education n Attainment of a Degree or Certificate n LiteracyNumeracy Gains
Workforce Investment Act Youth Program httpwwwdoletagovyouth_services
Program Description The Workforce Investment Act Youth Formula Program provides employment and education services to eligible low-income youth ages 14 to 21 who face barriers to employment The program serves in-school and out-of-school youth youth with disabilities and low literacy rates as well as others who may require additional assistance to complete an educational program and acquire an industry-recognized credential or enter employment
Quarter Highlights The passage of the Workforce Innovation and Opportunity Act (WIOA) includes a major shift in focus to spending more funds on and serving more out-of-school youth (OSY) The workforce system demonstrated its readiness for this shift in that 48 percent of all youth served in PY 2013 were OSY and 57 percent of all WIA youth local area funds were spent on OSY So far in Program Year 2013 California has spent almost 65 percent of their WIA youth funds on OSY with high levels of OSY expenditures in both urban and rural areas 53 percent of all youth served in CA in Program Year 2013 were OSY For example Los Angeles City spent 80 percent of their funds on OSY and the Northern Rural Training and Employment Consortium spent 76 percent of their funds on OSY Both local areas have achieved these levels through strong partnerships with organizations that serve OSY as well as access to high quality work experiences
Program Performance
Performance Measure
Four Quarters
Ending 063012
(Program Year 2011)
Four Quarters
Ending 063013
(Program Year 2012)
Four Quarters
Ending 063014
(Program Year 2013)
Placement in Employment or Education 589 666 690
Attainment of a Degree or Certificate 648 675 684
LiteracyNumeracy Gains 476 509 525
Performance in the Past Three Program Years
Analysis bull 197045 participants were served in the cumulative four quarter reporting period compared
to 217244 served during the same time period last year This decrease is due primarily to a lower funding level compared to the previous year
bull Placement in Employment or Education achieved a result of 690 percent a 24 percentage point increase when compared with the same time period last year
bull The program achieved a result of 684 percent for the Attainment of a Degree or Certificate measure This is a 09 percentage point increase from the same time period last year
bull The LiteracyNumeracy Gains measure achieved a result of 525 percent an increase of 16 percentage points when compared with the same time period last year
bull All three youth common measures exceeded Program Year 2013 GPRA goals
23
WORKFORCE SYSTEM RESULTS
100
80
60
40
20
0 Sep-12 Dec-12 Mar-13 Jun-13 Sep-13 Dec-13 Mar-14 Jun-14
n Placement in Employment or Education n Attainment of a Degree or Certificate n LiteracyNumeracy Gains
YouthBuild httpwwwdoletagovyouth_servicesyouthbuildcfm
Program Description YouthBuild provides job training and educational opportunities for at-risk youth ages 16 to 24 while constructing or rehabilitating affordable housing for low-income or homeless families in their own neighborhoods The youth split their time between the construction site and the classroom where they earn their high school diploma or equivalency learn to be community leaders and prepare for college and other post-secondary training opportunities
Analysis bull 33392 participants have been enrolled into the YouthBuild program since 2007 and 29553
have exited so far bull Since the program began a total of 11716 participants have received a high school
diploma or equivalency 17572 have attained an industry-recognized certificate and 21835 have been placed into initial jobs post-secondary education andor long-term vocational occupational skills training including apprenticeship
bull The Class of 20102011 performance steadily increased The outcomes for all three measures were above those for the Class of 2009 and significantly above the GPRA goals
bull YouthBuild is currently meeting or exceeding the GPRA goal for all three measures The additional quarter of service for 20102011 grants provided additional positive outcomes as expected As the 2012 grant class progresses it is expected that this trend will continue
Program Performance
Quarter Highlights Just A Start in Cambridge (MA) has been a YouthBuild grantee since 2010 In the fourth quarter of the Program Year 2013 they shared the following success story
Victor earned a High School Diploma and HBIPACT construction certification He was accepted to Endicott College in MA He also secured a full time painting position with George Souza Painting making $25 per hour He continues to develop his career plan with staff
Class of 20102011 Performance in the Past Eight Quarters
Performance Measure GPRA Results for Class
0f 20102011 Results for Class 2012 Overall Results
Percent of Participants Entering Employment or Enrolling in Postsecondary Education the Military or Advanced Training Occupational Skills Training in the First Quarter After Exit
500 612 586 519
Percent of Youth Who Attain a Diploma GED or Certificate by the End of the Third Quarter after Exit
672 770 609 672
Percent of Participants Deficient in Basic Skills Who Achieve Literacy or Numeracy Gains of One Adult Basic Education Level
585 676 549 595
24
WORKFORCE SYSTEM RESULTS
100
80
60
40
20
0 Sep-12 Dec-12 Mar-13 Jun-13 Sep-13 Dec-13 Mar-14 Jun-14
n Attainment of a High School Diploma GED or improvement of basic skills by at least two grade levels or completed Occupational Skills training n Participants who Attained Two or more Goals
Indian and Native American Youth Program httpwwwdoletagovdinap
Program Description The Indian and Native American Supplemental Youth Services Program provides summer and year-round employment and training activities for Indian Alaska Native and Native Hawaiian individuals between the ages of 14 and 21 Program resources are targeted to at-risk and the neediest youth who face substantial barriers to education and employment success This population includes high school dropouts and youth who are basic-skills deficient
Quarter Highlights Youth summer employment is a high priority for Native American Tribes However most rural reservation areas do not have enough employers to put youth to work during the summer As a result Tribes rely on the annual WIA Section 166 funding to place youth in summer employment where they can earn a wage and receive valuable work experience
Over the past four quarter period 2487 of the 4399 youth that participated in the youth program were placed in summer employment Youth participants come from low income families with little or no opportunity to earn money during the summer months Through the Indian and Native American Youth Program these youth are given an opportunity to work and earn money during the summer which helps them contribute to their familyrsquos income
Performance in the Past Eight Quarters
Program Performance
Performance Measure Four Quarters
Ending 063013 Four Quarters
Ending 063014
Educational Attainment for Dropouts 180 220
Attainment of Two or More Goals 920 927
The data reported reflect the period from April 1 2012 through March 31 2013 The data reported reflect the period from April 1 2013 through March 31 2014
Additional Program Year 2013 Quarterly Data
Performance Measure Four Quarters
Ending 093013 Four Quarters
Ending 123113 Four Quarters
Ending 033114
Educational Attainment for Dropouts
250 250 220
Attainment of Two or More Goals
930 930 927
The data reported reflect the period from April 1 2013 through September 30 2013 The data reported reflect the period from April 1 2013 through March 31 2014
Analysis bull The Attainment of Two or More Goals rate increased slightly from 92 percent in June 2013
to 927 percent in June 2014 bull The Indian and Native American Youth Program served 4310 youth during the period July
1 2013 through June 30 2014 This is a 164 percentage point decrease in youth served one year ago
bull The Education Attainment for Dropouts increased from 18 percent in June 2013 to 22 percent in June 2014
25
WORKFORCE SYSTEM RESULTS
Green Jobs Innovation Fund Grants (GJIF) httpwwwdoletagovBRGGreenJobs
Program Description The Green Jobs Innovation Fund (GJIF) was authorized as a Pilot and Demonstration Project under the Workforce Investment Act (WIA) of 1998 to help workers receive job training in green industry sectors and occupations as well as access green career pathways GJIF is seeking to increase the number of individuals completing training programs who receive industry-recognized credentials and to increase the number of individuals completing training programs for employment in green jobs
With these grants the Department is emphasizing two key workforce programs that move participants along green career pathways by 1) forging linkages between Registered Apprenticeship and pre-apprenticeship programs andor 2) integrating the delivery of technical and basic skills training through community-based partnerships The grantees are building on existing programs that are already established and serving workers and moving workers into and along green career pathways The Green Jobs Innovation Fund (GJIF) grants are all anticipated to end by June 30 2015
Quarter Highlights The Jobs for the Future (JFF) GreenWays grant program made great progress toward their goal of increasing access for women to enter higher-paying non-traditional occupations Women currently comprise 254 of the programs total enrollment and are earning higher placement wages overall than men At the same time their completion rates credential attainment rates and job placement rates lag behind those of men reflecting the ongoing challenges that women experience in non-traditional occupations The JFF GreenWays program continues to focus on raising the visibility of this issue as a key element in regional approaches to addressing poverty in female-headed households
Program Performance
Performance Measure Cumulative
Four Quarters Ending 063013
Cumulative Four Quarters
Ending 063014
Entered Employment Rate 569 642
Employment Retention Rate 750 821
Six Monthsrsquo Average Earnings $16249 $17459
Additional Program Year 2013 Quarterly Data
Performance Measure
Cumulative Four
Quarters Ending
093013
Cumulative Four
Quarters Ending
123113
Cumulative Four
Quarters Ending
033114
Entered Employment Rate 560 626 641
Employment Retention Rate 790 795 785
Six Monthsrsquo Average Earnings $16406 $15228 $15039
Cumulative Credential Outcomes in the Past Three Quarters
Performance Measure Quarter Ending
123113
Quarter Ending
033114
Quarter Ending
063014
Number Completed Education Job Training Activities
5521 6438 7076
Number Completed Training and Received Credential
5343 6242 6849
Attainment Rate 97 97 97
Analysis As of June 30 2014 8360 participants were enrolled in educationtraining Of these participants 600 participated in Registered Apprenticeship 874 participated in Pre-Apprenticeship and 40 participated in On-the-Job Training A total of 7076 participants completed educationtraining A total of 6849 participants received a credential Lastly a total of 4870 participants entered employment and of these participants 4343 entered training-related employment
26
WORKFORCE SYSTEM RESULTS
Dec-13 Mar-14 Jun-14
100 $27000
$2600080
$2500060
$24000 40
$23000
20 $22000
0 $21000
n Entered Employment Rate n Employment Retention Rate n Six Months Average Earnings
H-1B Jobs and Innovation Accelerator Challenge Grants httpwwwdoletagovETA_News_Releases20111398cfm
Program Description The Jobs and Innovation Accelerator Challenge (Jobs Accelerator) is designed to help regions achieve the demonstrated benefits of collaborative cluster-based regional development This initiative represents the implementation of Administration policy priorities to accelerate bottom-up innovation in urban and rural regions as opposed to imposing ldquoone-size-fits-allrdquo solutions The Jobs Accelerator also meets Administration goals for smarter use of government resources through reduction of Federal silos and promotion of coordinated Federal funding opportunities that offer more efficient access to Federal resources Investments from Federal agencies for the Jobs Accelerator projects include The US Department of Laborrsquos Employment and Training Administration (DOL-ETA) the US Department of Commercersquos Economic Development Administration (DOC-EDA) and the National Institutes of Standards and Technologyrsquos Hollings Manufacturing Extension Partnership (NIST-MEP) the Small Business Administration (SBA) the Department of Energy Advanced Manufacturing Office (DOE AMO) and the Delta Regional Authority (DRA)
The objectives of the Jobs Accelerator are to
bull Accelerate the formation of new high-growth businesses and expansion of existing businesses
bull Accelerate the creation of higher-wage jobs bull Advance commercialization of research including Federally-funded research bull Support deployment of new processes new technologies and new products to grow sales
and generate employment bull Enhance the capacity of small businesses in the cluster including small and disadvantaged
businesses bull Increase exports and business interaction with international buyers and suppliers bull Develop the skilled workforce needed to support growing clusters and bull Ensure diverse workforce participation in clusters through outreach training and the
creation of career pathways
Quarter Highlights The Northeast Ohio Speed-To-Market Accelerator (STMA) program administered by Lorain County Community College aims to accelerate the speed-to-market for near production or pilot production prototypes stimulate job creation and increase the global competitiveness of cluster companies attract private capital and attract students incumbent workers and the unemployed
This quarter STMA helped accelerate the introduction of a new dry electrode product for heart monitoring This sensor and electronics will be introduced as part of the next generation of wearable human performance arm band from Pittsburgh based Body Media a subsidiary of Jawbone Further STMA continues to bring new companies into the STMA
program through cluster outreach activities and this quarter three new leads were generated as the result of the existing STMA partners MAGNET JumpStart Lorain County Community College and NorTech
Program Performance
Performance Measure Four Quarters
Ending 123113 Four Quarters
Ending 033114 Four Quarters
Ending 063014
Entered Employment Rate 307 283 359
Employment Retention Rate 907 925 927
Six Monthsrsquo Average Earnings $23310 $22953 $26682
Performance in the Past Three Quarters
Analysis A total of 3702 individuals were served 3632 individuals began educationjob training activities and 2052 individuals completed educationjob training services Of participants completing educationjob training 370 unemployed individuals completed training and entered employment and of these 114 individuals entered training-related employment A total of 204 employed individuals completed training and retained their current position and of these 85 employed individuals completed training and advanced into a new position A total of 2006 individuals completed educationtraining activities and received credentials and of these 2273 total credentials were awarded
This data represents three rounds of the for Jobs Accelerator initiative which includes the Jobs Accelerator Round 1 the Advanced Manufacturing Jobs Accelerator Round 2 and the Make it in America (MIIA) Jobs Accelerator grants program
27
WORKFORCE SYSTEM RESULTS
100 $56000
80 $54000
$52000 60 $50000
40 $48000
$46000 20
$44000
0 $42000 Dec-13 Mar-14 Jun-14
n Entered Employment Rate n Employment Retention Rate n Six Months Average Earnings
H-1B Technical Skills Training Grants httpwwwdoletagovbusinessH1B_Tech_Skillscfm
Program Description The H-1B Technical Skills Training (TST) Grants were authorized by the American Competitiveness and Workforce Improvement Act of 1998 (ACWIA) as amended (29 USC 2916a) to provide education training and job placement assistance in the occupations and industries for which employers are using H-1B visas to hire highly-skilled foreign workers on a temporary basis and the related activities necessary to support such training The H-1B TST Grant Program is intended to raise the technical skill levels of American workers so they can obtain or upgrade employment in high-growth industries and occupations Over time these education and training programs will help businesses reduce their use of skilled foreign professionals permitted to work in the US on a temporary basis under the H-1B visa program The grants represent significant investments in sectors such as information technology advanced manufacturing and health care In addition these grants will focus on serving participants who have been identified as long-term unemployed particularly those who have been unemployed the longest These grants also have an emphasis on providing on-the-job training allowing participants to learn new skills while earning a pay check To date ETA has announced two rounds of TST grants totaling $342 million The first round was announced on October 4 2011 and the second round was announced on February 22 2012
Quarter Highlights The Los Angeles HealthWorks On-the-Job training (OJT) initiative administered by Managed Career Solutions Inc (MCS) provides individuals with training that leads to industry recognized credentials and employment opportunities within the regionrsquos healthcare field MCS maintains several strong partnerships to coordinate outreach recruitment training OJT placements and employment opportunities As of June 30 2014 MCS served nearly 800 long-term unemployed participants and overall 1100 participants In the same period over 650 individuals completed training and earned an industry recognized credential Of those completers 128 were employed at participation however the majority were underemployed and gained the necessary job skills and credentials that allowed 80 percent to advance into a new position In recognition MCS received the Malcom Baldrige and State Eureka awards
Analysis bull 52532 individuals were served and 51071 individuals began educationjob training
activities bull 15185 individuals completed educationjob training activities including 3321 unemployed
individuals who completed training and entered employment bull Of these 2925 individuals entered training-related employment 2902 employed individuals
completed training and retained their current position 1452 employed individuals completed training and advanced into a new position
bull 11944 individuals completed educationjob training activities and received credentials with 14099 total credentials awarded
Program Performance
Performance Measure
Four Quarters
Ending 123113
Four Quarters
Ending 033114
Four Quarters
Ending 063014
Entered Employment Rate 778 725 675
Employment Retention Rate 993 944 926
Six Monthsrsquo Average Earnings $54683 $50833 $46245
Since the H-1B TST program provides training to incumbent unemployed and long-term unemployed workers to prepare them for jobs in a variety H-1B industries andor occupations the Entered Employment Rate and Six Monthsrsquo Average Earnings can vary For the quarter ending on June 30 2014 the H-1B TST program saw a decline in the Entered Employment Rate and Six Monthsrsquo Average Earnings in comparison with the results for the previous rolling four quarters Previous results reflected a large number of incumbent workers who enrolled in short-term high-skilled training and exited early leading to a relatively high Six Monthsrsquo Average Earnings As the projects progress unemployed and long-term unemployed workers who required longer-term training begin to exit the program and search for jobs Ultimately as they enter employment wages may be less than those achieved by the higher-skilled incumbent workers who either retain or advance in their positions after training
Performance in the Past Three Quarters
28
WORKFORCE SYSTEM RESULTS
100 $21000
$19000 80
$17000
$1500060 $13000
40 $11000
$900020
$7000
0 $5000Sep-12 Dec-12 Mar-13 Jun-13 Sep-13 Dec-13 Mar-14 Jun-14
n Entered Employment Rate n Employment Retention Rate n Six Months Average Earnings
Community-Based Job Training Grants (CBJT) httpwwwdoletagovbusinessCommunity-BasedJobTrainingGrantscfm
Program Description Community-Based Job Training Grants (CBJT) seek to strengthen the role of community colleges in promoting the United States workforcersquos competitiveness The program does this by building the capacity of community colleges to train workers in skills required to succeed in regionally based high-growth high-demand industries and occupations Important grant activities include training in the healthcare biotech advanced manufacturing energy automotive transportation construction insurance forestry and aerospace industries The first round of CBJT grants were awarded in October 2005 To date ETA has announced five rounds of CBJT grants awarding 320 grants to community colleges and other organizations All CBJT grants ended as of June 30 2014
Quarter Highlights The 14 remaining projects active in this quarter represent the culmination of another successful DOL initiative Some of the significant accomplishments include the development and sustainability of Roane State Community Collegersquos Lean Manufacturing program designed to meet the needs of local manufacturing employers the San Jacinto Community College Districtrsquos Gulf Coast Healthcare Partners project which developed training to support healthcare career and Central Arizona Collegersquos Pinal County Alternative Energy Project More than half of the CBJT participants who began education and training activities completed their programs 79 percent of them received an industry recognized credential ie certificate or degree Eighty-four percent of the participants who gained employment entered into new training-related positions
Program Performance
Performance Measure Four Quarters
Ending 063013 Four Quarters
Ending 063014
Entered Employment Rate 572 662
Employment Retention Rate 891 899
Six Monthsrsquo Average Earnings $18675 $17027
Additional Program Year 2013 Quarterly Data
Performance Measure
Four Quarters
Ending 093013
Four Quarters
Ending 123113
Four Quarters
Ending 033114
Entered Employment Rate 57 605 655
Employment Retention Rate 891 897 891
Six Monthsrsquo Average Earnings $18675 $18285 $16642
Performance in the Past Eight Quarters
Analysis bull 268359 individuals have been served through the initiative bull 258216 individuals began educationjob training activities bull 165264 individuals completed educationjob training activities Of these
bull 131107 individuals received credentials bull 65089 individuals entered new positions of employment and 54344 individuals entered new
positions of training-related employment
Note All data are cumulative Prior to new reporting requirements implemented in the quarter ending December 31 2011 grantees only reported results for individuals that entered employment and individuals that entered training-related employment (noted above) if those participants entered employment and completed training in the same quarter As a result prior to that quarter participants that entered employment in quarters after they completed training were captured in the Common Measures and the total number of individuals that ultimately entered employment and training-related employment are actually higher than the results above indicate
29
WORKFORCE SYSTEM RESULTS
100 92
7880
5760
40
20
0
n Percent of Target Number of Programs Launched by Round
Round 1 Round 2 Round 3
Trade Adjustment Assistance Community College and Career Training (TAACCCT) Grants httpwwwdoletagovtaaccct
Program Description The Trade Adjustment Assistance Community College and Career Training (TAACCCT) Grant Program is authorized by the Trade Act of 1974 under Chapter 4 of Title II The purpose of this grant program is to provide eligible institutions of higher education with funds to expand and improve their ability to deliver education and career training programs that can be completed in two years or less and that result in skills degrees and credentials that prepare program participants for employment in high-wage high-skill occupations and are suited for workers who are eligible for training under the Trade Adjustment Assistance (TAA) for Workers program under Chapter 2 of Title II of the Trade Act The TAACCCT Grant Program is funded under the Health Care and Education Reconciliation Act of 2010 which appropriated $500 million for the program for each of Fiscal Years 2011-2014 for a total of $2 billion
Round 1 ndash FY 2011 Grants On June 30 2014 grants awarded in Round 1 (FY 2011) had completed all but one quarter of their periods of performance By the end of their final year of the grant the forty-nine (49) Round 1 grantees project that they will offer a total of 906 new programs of study As of June 30 2014 grantees began offering 834 (92 percent) of these programs of study
Round 2 ndash FY 2012 Grants The seventy-nine (79) grants awarded in the Fiscal Year 2012 had completed seven quarters of their grants at the end of June 30 2014 Their period of performance began on October 1 2012 and will end on September 30 2016 however their final year will be dedicated to gathering information and data for reporting outcome measures and completing the requirements for a third-party evaluation They project that by the end of the third year they will have launched 761 programs As of the end of June 30 2014 they had began offering 561 (78 percent) of these programs
Round 3 ndash FY 2013 Grants Grants awarded in FY 2013 had completed the first three quarters of their period of performance Their grants began on October 1 2013 and will end on September 30 2017
In their third year they will have launched all of their programs as their final year will be dedicated to collecting follow up data for evaluation and reporting purposes only The fifty-seven (57) grantees plan to launch 551 programs As of June 30 2014 they had already launched 288 (57 percent) of these programs
Percentage of Target Number of Programs Launched as of June 30 2014 by Grant Round
Performance Information Programmatic data is collected at different intervals throughout the period of performance including
bull Quarterly Narrative Progress Reports (QNPR) Grantees will provide quarterly qualitative data on the capacity building taking place through progress and other implementation measures that grantees defined in their Statements of Work
bull Annual Performance Reports (APR) Grantees will provide annual quantitative data on their training and employment outcomes for TAACCCT program participants that are impacted by the capacity building activities being implemented by their grants
30
WORKFORCE SYSTEM RESULTS
$4500000 3500$4000000 3000$3500000
2500
Jun-13 Dec-13 Mar-14 Jun-14
Amou
nt $3000000 2000$2500000
$2000000 1500 $1500000 1000 $1000000
500$500000 $0 0
n Amount of Revenue Generated n Number of Tickets Assigned
Disability Employment Initiative (DEI) httpwwwdoletagovdisability
Program Description All DEI Workforce Employment Network (EN) Trends
Launched in 2010 the Disability Employment Initiative (DEI) seeks to improve education training and employment opportunities for youth and adults with disabilities who are unemployed underemployed andor receiving Social Security disability benefits The DEI is jointly funded by the US Department of Laborrsquos Employment and Training Administration and Office of Disability Employment Policy DEI projects improve collaboration among employment and training and asset development programs implemented at state and local levels including the Social Security Administrationrsquos Ticket to Work Program and build effective partnerships that leverage resources to better serve individuals with disabilities and improve employment outcomes
Quarter Highlights A variety of Department of Labor programs helped Vietnam-era veteran Richard James navigate through life After servicing B-52 bombers in the Air Force James held a series of sales jobs while putting himself through law school at night He rose to become a successful New England attorney and owner of a boat dock building company when he suffered a terrible head injury which caused spine and nerve damage Addiction to pain medication followed and James ended up homeless While recovering from his injuries James took a college course through the Veterans Retraining Assistance Program managed in part by the Department He received career counseling from a Disabled Veterans Outreach Program representative at a local American Job Center and support from the DEI Disability Resource Coordinator Eventually James was hired as an attorney by a Rhode Island law firm The departments grants and programs made possible the services that put me back in a position of being a productive member of society he said
Program Performance
Performance Measure Quarter Ending 63013
Quarter Ending
123113
Quarter Ending 33114
Quarter Ending 63014
Analysis bull The Exit Rate for Adult and Youth exiters with disabilities in Round one DEI sites is almost
double the national average Adult DEI was 89 percent vs All StatesAll LWIAs 49 percent Older Youth DEI 166 percent vs All StatesAll LWIAs 87 percent Younger Youth DEI 339 percent vs All StatesAll LWIAs 151 percent
bull The CredentialSkill Attainment Rate for older and younger youth with disabilities in Round 1 DEI sites was higher than the national average Older Youth DEI credential rate 568 percent vs All StatesAll LWIAs 383 percent Younger Youth DEI skill rate 902 percent vs All States All LWIAs 834 percent
bull The Exit Rate for Adult and Youth exiters with disabilities in Round two DEI sites is higher than the national average Adult DEI 56 percent vs All StatesAll LWIAs 49 percent Older Youth DEI 163 percent vs All StatesAll LWIAs 87 percent and Younger Youth DEI 167 percent vs All StatesAll LWIAs 151 percent
bull The Entered Employment Rate for Adult DEI sites 657 percent is 20 percent higher than in All StatesAll LWIAs 434 percent
bull DEI Workforce Employment Networks (EN) activity shows that the number of Tickets assigned increased from 1780 to 2903 an increase of 1123 and the amount of revenue
Number of Tickets Assigned 1780 1590 2554 2903 generated from DEI EN payments increased from $2373404 to $4057353 an increase of $168 million Amount of Revenue Generated $2373404 $1927104 $3505582 $4057353
31
WORKFORCE SYSTEM RESULTS
ETA Internet-Based Assistance (E-TOOLS) wwwcareerinfonetorg wwwservicelocatororg wwwcareeronestoporg wwwonetonlineorg wwwmyskillsmyfutureorg wwwmynextmoveorg
Program Description Additional Program Year 2013 Quarterly Data
Performance Measure Quarter Ending
093013
Quarter Ending
123113
Quarter Ending
033114
CareerOneStop Portal Visits 5754645 5159240 5340022
ETArsquos Internet-based assistance includes electronic tools that help individuals explore career opportunities and link to job postings either on their own or at local American Job Centers to make informed employment and education choices
The Web sites feature user-friendly occupation and industry information salary data career videos education resources career exploration assistance and other resources that support talent development in todayrsquos fast-paced global marketplace Users can find information some of which is also industry sponsored about occupations that are in-demand in high growth industries Additionally information is available regarding occupational skills and workplace competencies
Quarter Highlights For the year ending June 2014 CareerOneStop launched a new portal for Ex-Offenders added Federal Contractor job tagging a TAACCCT information finder Youth Council information to Americarsquos Service Locator and began working on adding more job feeds
Americarsquos Service Locator (ASL) Visits
730998 758919 724053
ONET Downloads 26646 29407 28505
ONET Visits 7697608 10211177 11500039
Combined Visits 14183251 16129336 17564114
Performance in the Past Eight Quarters
25000000 $36000
Sep-12 Dec-12 Mar-13 Jun-13 Sep-13 Dec-13 Mar-14 Jun-14
n Combined Visits (in millions) n ONET Product Downloads (in thousands)
$31500 20000000
ONE
T Pr
oduc
t Dow
nloa
ds
$27000
Com
bine
d Vi
sits
$2250015000000 $18000
10000000 $13500
$90005000000
$4500
$00
ONET has added web services for developers and increased the available Tools and Technology and Detailed Work Activities information to convey specialized occupational attributes
Program Performance
Performance Measure Quarter
Ending 063013 Quarter
Ending 063014
CareerOneStop Portal Visits 5104850 5472742
Americarsquos Service Locator (ASL)Visits
747114 802148
ONET Downloads 29482 25278
ONET Visits 8716609 13581922
Combined Visits 14568573 19856812
Analysis bull ETA Internet-Based Assistance received 19856812 combined visits for the quarter ending
June 30 2014 an increase of 36 percent over the same period in 2013 bull Visits to CareerOneStop increased to 5472742 or 72 percent over the same period in 2013
with mySkillsmyFuture continuing to be a popular tool with an increase of 23 percent bull Americarsquos Service Locator Visits traffic increased 74 percent over the same period in 2013 bull The ONET traffic received 13581922 visits in this quarter an increase of 558 percent
over the same period in 2013 and the ONET downloads totaled 25278 for the quarter a decrease of 142 percent
32
WORKFORCE SYSTEM RESULTS
Glossary of Performance Measures
Common Performance Measures Common Performance Measures are used by Workforce Investment Act Indian and Native American Program Disability Program Navigator Initiative Wagner-Peyser Trade Adjustment Assistance Senior Community Service Employment Program Reintegration of Ex-Offenders Registered Apprenticeship Program Job Corps National Farmworker Jobs Program High Growth Job Training Initiative and Community-Based Job Training Grants
Adult Measures Entered Employment Of those who are not employed at the date of participation the number of adult participants who are employed in the first quarter after the exit quarter divided by the number of adult participants who exit during the quarter
Employment Retention Of those who are employed in the first quarter after the exit quarter the number of adult participants who are employed in both the second and third quarters after the exit quarter divided by the number of adult participants who exit during the quarter
Six Monthsrsquo Average Earnings Of those adult participants who are employed in the first second and third quarters after the exit quarter total earnings in the second quarter plus the total earnings in the third quarter after the exit quarter divided by the number of adult participants who exit during the quarter
Average Earnings Change in Six Months1
Of those who are employed in Q1 after exit the total post-program earnings (earnings in Q2 + Q3 after exit) minus pre-program earnings (earnings in Q2 + Q3 prior to registration) divided by the number of adults who exit during the quarter
Youth Measures Attainment of a Degree or Certificate Of those enrolled in education (at the date of participation or at any point during the program) the number of youth participants who attain a diploma GED or certificate by the end of the third quarter after the exit quarter divided by the number of youth participants who exit during the quarter
1 This definition was used for earnings in PY 2005 Q=quarter
33
Literacy and Numeracy Gains Of those out-of-school youth who are basic skills deficient the number of youth participants who increase one or more educational functioning levels divided by the number of youth participants who have completed a year in the program (ie one year from the date of first youth program service) plus the number of youth participants who exit before completing a year in the program
Placement in Employment or Education2
Of those who are not in postsecondary education or employment (including the military) at the date of participation the number of youth participants who are in employment (including the military) or enrolled in postsecondary education andor advanced trainingoccupational skills training in the first quarter after the exit quarter divided by the number of youth participants who exit during the quarter
Program-Specific Performance Measures
Disability Employment Initiative (DEI) Number of Tickets Assigned Number of individuals on Social Security Administration (SSA) disability benefits who assigned their Ticket to the workforce board agency or American Job Center as their designated Employment Network under the SSA Ticket to Work program All DEI pilot sites must become an Employment Network under Ticket to Work
Amount of Revenue Generated Under the SSA Ticket to Work program when jobseekers who receive SSA disability benefits assign their Ticket to a workforce board agency or American Job Center as an Employment Network and then achieve certain employment milestones the Employment Network receives money or ldquoTicket revenuerdquo
2 Because of its intensity and duration the YouthBuild performance measure for placement in employment or education does not exclude those who entered the program with a job or in college
WORKFORCE SYSTEM RESULTS
Foreign Labor Certification Percent of H-1B Applications Resolved in Seven Business Days This estimate is based on the total number of applications processed within seven business days divided by the total number of applications processed for a given reporting period An application is considered processed if the last significant event is (1) certified (2) denied or (3) withdrawn
Average Number of Days to Resolve PERM Applications Not Subject to Integrity Review The average processing time between case receipt and decision date for non-audited cases
Average Number of Days to Resolve PERM Applications Subject to Integrity Review The average processing time between case receipt and decision date for audited cases
Percent of Complete H-2A Employer Applications Resolved within 30 Days Before the Date of Need This estimate is based on the total number of complete applications resolved within 30 days before the date of need divided by the total number of applications processed for a given reporting period
Percent of H-2B Applications Processed Within 30 Days of Receipt This estimate is based on the total number of applications processed within 30 days of receipt divided by the total number of applications processed for a given reporting period An application is considered processed if the last significant event is (1) certified (2) denied or (3) withdrawn
Indian and Native American Youth Attainment of Two or More Goals The total number of youth participants enrolled in the Granteersquos Supplemental Youth Services Program who attained at least two of the 14 goals listed below divided by the total number of Supplemental Youth Services participants enrolled during the report period The 14 goals include
1 Completed Job ReadinessOrientation to the World of Work Training 2 Completed Internship or Vocational Exploration Program
3 Completed Career Assessment 4 Entered Unsubsidized Employment 5 Remained in School 6 Returned to School Full Time 7 Enrolled in Job Corps 8 Improved Basic Skills Level By At Least Two Grades 9 Attained High School Diploma 10 Attained GED 11 Completed Occupational Skills Training 12 Completed Leadership Skills Training 13 Entered Other (Non-Supplemental Youth) Training Program 14 Summer Employment
Educational Attainment for Dropouts The number of dropouts who have obtained a high school diploma GED or increased their literacy and numeracy by two grade levels divided by the total number of dropouts
Job Corps Measures Placement in Employment or Education Percent of Job Corps participants3 entering employment or enrolling in post-secondary education andor advanced skills trainingoccupational skills training in the first quarter after exit from the program
Attainment of a Degree or Certificate Percent of students who attain a GED HSD or certificate
Literacy Numeracy Gains Percent of students who achieve literacy or numeracy gains of one or more Adult Basic Education (ABE) levels
3 Calculation of the Placement rate measure does not include outcomes for students who participated in the program for less than 60 days
34
WORKFORCE SYSTEM RESULTS
Internet-Based Assistance Web Site Visits ETArsquos Internet-based assistance includes electronic tools that help individuals make informed employment and education choices The measure for tracking the overall performance and usage of these tools is Web site visits A visit is defined as a series of page requests from the same uniquely identified client with a time of no more than 30 minutes between each page
request
ONet Product Downloads The ONET product downloads count the number of unique users who download an ONET online resource (wwwonetcenterorg) which includes the ONET database (all versions) ONET technical reports (such as on green jobs) supplemental data files (lay titles tools and technology) the ONET Career Exploration Tool files ONET Survey questionnaires and other related materials such as the Toolkit for Business
Registered Apprenticeship Program Entered Employment Rate Percent of apprentices employed in the first quarter after exit who either completed or cancelled from their Registered Apprenticeship Program
Employment Retention Rate Percent of apprentices employed in the first quarter after exit still employed in the second and third quarter after exit who either completed or cancelled from their Registered Apprenticeship Program
Six Monthsrsquo Average Earnings Six month Average Earnings of apprentices employed in the first quarter after exit still employed in the second and third quarter after exit who either completed or cancelled from their Registered Apprenticeship Program
Reintegration of Ex-OffendersmdashAdult Program Recidivism Rate The percentage of participants who are rearrested for a new crime or re-incarcerated for revocation of a parole or probation violation within one year from release from prison
Senior Community Service Employment Program Service Level The count of participants during the report period divided by the total number of authorized grantee community service positions
Community Service The number of community service hours as reported by each grantee divided by the total community service hours funded for the grantee adjusted for minimum wage differences among the states
Most-in-Need Most-in-need means participants with one or more of the following characteristics have a severe disability are frail are age 75 or older are age-eligible but not receiving benefits under Title II of the Social Security Act reside in an area with persistent unemployment and have severely limited employment prospects have limited English proficiency have low literacy skills have a disability reside in a rural area are Veterans have low employment prospects have failed to find employment after utilizing services provided under Title I of the Workforce Investment Act of 1998 (29 USC 2801 et seq) or are homeless or at risk for homelessness (sect 513(b)(1)(E) as amended by Pub L No 109-365)
Unemployment Insurance Percent of Payments Made Timely The percentage of intrastate Unemployment Insurance benefit first payments for full weeks of unemployment issued within 14 days following the first compensable week in states with a waiting week and 21 days in non-waiting week states
Detection of Recoverable Overpayments The amount of overpayments (dollars) established through state operations as a percent of the estimated amount states can detect and establish for recovery
Entered Employment Rate The percent of persons receiving a first payment in a given quarter who had earnings in the next quarter
Percent of Employer Tax Liability Determinations Made Timely The percent of new employer determinations made within 90 days of the end of the quarter in which employers became liable to pay unemployment taxes
35
WORKFORCE SYSTEM RESULTS
YouthBuild Attainment of a Degree or Certificate Of those enrolled the number of youth participants who attain a diploma high school equivalency degree or industry-recognized certificate by the end of the third quarter after the exit quarter divided by the number of youth enrolled (minus youth exited for other reasons)
Literacy and Numeracy Gains Of those youth participants who are basic skills deficient at enrollment the number of youth participants who increase one or more educational functioning levels within one year of enrollment divided by the number of youth participants who have completed a year in the program
Placement in Employment or Education The number of youth participants who are in employment (including the military) or are enrolled in post-secondary education andor advanced trainingoccupational skills training in the first quarter after the exit quarter divided by the number of youth participants who exited during the previous quarter
Youthful Offender Projects Placement Rate The placement rate is the percentage of out-of-school youth ages 18 and above placed in unsubsidized jobs occupational training post-secondary education or the military
Recidivism Rate The recidivism rate is the percentage of youth offenders who have been convicted of a new crime within 12 months of their release of a correctional facility or being placed on probation
36
WORKFORCE SYSTEM RESULTS
2471 American Job Centers formerly known as One-Stop Career Centers
12 VT
9 HI
1 GU
6 DC
2 VI
15 NE
16 SD
12 ME
19 IA
19 AK
19 WV
4 DE
47 AL
55 CO
48 MN
57 WI
89 NC
60 GA
31 MA
23 NM
16 ND
47 AR
70 PA
18 CT 4 RI
12 NV
20 WY
22 KS
18 PR
89 OH
69 TN
102 FL
59 AZ 46
SC
12 NH
29 NJ
52 VA
22 MT
33 OK
39 MS
59 WA
61 IL 34 MD
47 OR
131 KY
62 LA
83 IN
33 UT
44 MO
26 ID 90
NY95 MI
1 to 25
25 to 50
50 to 75
75 to 100
Over 100
203 CA
180 TX
Source Americarsquos Service Locator (wwwServiceLocatororg) Americarsquos Service Locator connects individuals to employment and training opportunities available at local American Job Centers The Web site provides contact information for a range of local work-related services including unemployment benefits career development and educational opportunities As of March 17 2015
37
WORKFORCE SYSTEM RESULTS
United States Department of Labor
200 Constitution Avenue NW
Washington DC 20210
wwwdolgov
- A9RFAFEtmp
- DOL_Workforce_Rprt_Jun_2014_51415-dp
-
- Workforce System Results
-
- Contents
- Quarterly Spotlight
- People Served by Program
- Current Appropriations
- Government Performance and Results Act Goals (GPRA)
- Indian and Native American Adult Program (INAP)
- National Farmworker Jobs Program (NFJP)
- Senior Community Service Employment Program (SCSEP)
- Wagner-Peyser Employment Service
- Workforce Investment Act Adult Program
- Workforce Investment Act Dislocated Worker Program
- H-1B and Permanent Foreign Labor Certification (PERM)
- H-2A and H-2B Foreign Labor Certification Programs
- Reintegration of Ex-Offenders (RExO-ADULT)
- Registered Apprenticeship
- Registered Apprenticeship
- Trade Adjustment Assistance (TAA)
- Unemployment Insurance (UI)
- Unemployment Insurance (UI)
- Job Corps
- Workforce Investment Act Youthful Offender Initiative
- Workforce Investment Act Youth Program
- YouthBuild
- Indian and Native American Youth Program
- H-1B Jobs and Innovation Accelerator Challenge Grants
- H-1B Technical Skills Training Grants
- Community-Based Job Training Grants (CBJT)
- Trade Adjustment Assistance Community College and Career Training (TAACCCT) Grants
- Disability Employment Initiative (DEI)
- ETA Internet-Based Assistance (E-TOOLS)
- Glossary of Performance Measures
- 2471 American Job Centers formerly known as One-Stop Career Centers
-

WORKFORCE SYSTEM RESULTS
100
80
60
40
20
0 Sep-12 Dec-12 Mar-13 Jun-13 Sep-13 Dec-13 Mar-14 Jun-14
n Placement in Employment or Education n Attainment of a Degree or Certificate n LiteracyNumeracy Gains
Job Corps httpwwwjobcorpsgovhomeaspx
Program Description Job Corps is the nationrsquos largest residential educational and career technical training program for at-risk youth ages 16 through 24 The 125 Job Corps centers nationwide provide an integrated comprehensive array of services that include academic career technical and life skills training career planning and work-based learning health care and post-program placement and transition support
Job Corps is committed to offering all students a safe drug-free environment where they can take advantage of the resources provided Job Corpsrsquo mission is to attract eligible young people teach them the skills they need to become employable and independent and place them in meaningful jobs or further education
Program Performance
Performance Measure Four Quarters
Ending 063013 Four Quarters
Ending 063014
Placement in Employment or Education 746 767
Attainment of a Degree or Certificate 706 668
LiteracyNumeracy Gains 692 661
Additional Program Year 2013 Quarterly Data
Performance Measure
Four Quarters
Ending 093013
Four Quarters
Ending 123113
Four Quarters
Ending 033114
Placement in Employment or Education 757 760 765
Attainment of a Degree or Certificate 722 727 707
LiteracyNumeracy Gains 702 709 695
Performance in the Past Eight Quarters
The Performance in the Past Eight Quarters graph displays single quarter data versus the Program Performance tables which depict cumulative four quarter data
Quarter Highlights In May 2014 four Job Corps students from centers in Montana California Iowa and Virginia participated in the 2nd Asia-Pacific Economic Cooperation (APEC) Youth Skills Camp in Beijing and Guangzhou China the second time Job Corps students have participated in this event The camp included field visits to vocational training schools business enterprises and public practical training facilities as well as skills exchanges This international event provides students with life-changing experiences in travel diversity and first-hand exposure to global issues
Analysis bull During the current quarter Job Corps served 69979 participants including 13079 new
enrollees an increase of 801 percent overall compared to the same quarter in PY 2013 and due to the resumption of new enrollments after the PY 2012 enrollment suspensions The number of new students increased by over 200 percent from the same quarter in PY 2013
bull The proportion of 16-17 year olds served increased by 45 percentage points Conversely the proportion of all older students served similarly decreased from the same quarter in PY 2013
bull In the current quarter Job Corps placed 7203 students in Employment and Education a slight decrease of 04 percentage points compared to the same quarter last year In addition 8657 students attained a Certificate a 131 percentage point decrease compared to the same quarter in PY 2013 Also 6789 students attained a LiteracyNumeracy gain an 116 percentage point decrease over the same quarter in PY 2013
bull In the current quarter the program served 50 participants who were Veterans prior to enrollment bull When comparing the four quarter data Placement in Employment or Education increased
21 percentage points Attainment of a Degree or Certificate decreased 38 percentage points and LiteracyNumeracy Gains decreased 31 percentage points from the same quarter one year ago 21
WORKFORCE SYSTEM RESULTS
100
80
60
40
20
0 Sep-12 Dec-12 Mar-13 Jun-13 Sep-13 Dec-13 Mar-14 Jun-14
n Placement Rate for Out-of-School Youth Ages 18 and Above n Recidivism Rate for Youth Ages 14 to 17 n Recidivism Rate for Youth Ages 18 and Above
Workforce Investment Act Youthful Offender Initiative httpwwwdoletagovYouth_servicesyouthful_offendercfm
Program Description The Employment and Training Administration uses its Youthful Offender Appropriation to fund a variety of projects that target youth offenders and young adult offenders Currently operating projects include grants to community-based organizations to involve juvenile offenders in training and service learning projects grants to intermediary organizations to serve young offenders in high-poverty high-crime communities and grants to help youth enter diversion programs as an alternative to out-of-home placements and to assist eligible youth have their juvenile records sealed or expunged
Quarter Highlights The great majority of juvenile offenders are of ages 17 and below and many are still in high school The youth offender grants focus on helping younger youth stay in school and complete their education and helping older youth find jobs and succeed in the labor market Case management mentoring and supportive services are also provided by these grants
Performance in the Past Eight Quarters
Program Performance
Performance Measure Four Quarters
Ending 063013 Four Quarters
Ending 063014
Placement Rate for Youth Ages 18 and Above
36 362
Recidivism Rate for Youth Ages 14 to 17
35 24
Recidivism Rate for Youth Ages 18 and Above
34 16
Results are cumulative for currently operating grants
Additional Program Year 2013 Quarterly Data
Placement Rate for Youth Ages 18 and Above
277 334 325
Performance Measure
Four Quarters
Ending 093013
Four Quarters
Ending 123113
Four Quarters
Ending 033114
Recidivism Rate for Youth Ages 14 to 17
349 349 349
Recidivism Rate for Youth Ages 18 and Above
335 335 335
Analysis bull Providing opportunities to youthful offenders results in varying outcomes depending on
the mix of projects being operated in a given year bull Projects have markedly different placement and recidivism rates depending on whether
they are serving young adults in their 20s or youth ages 16-17 they recruit youth in the community or through direct referrals from the juvenile justice system whether they are located in small or large cities and the extent to which enrollees are at high or low risk of re-offending
22
WORKFORCE SYSTEM RESULTS
100
80
60
40
20
0 Jun-12 Jun-13 Jun-14
n Placement in Employment or Education n Attainment of a Degree or Certificate n LiteracyNumeracy Gains
Workforce Investment Act Youth Program httpwwwdoletagovyouth_services
Program Description The Workforce Investment Act Youth Formula Program provides employment and education services to eligible low-income youth ages 14 to 21 who face barriers to employment The program serves in-school and out-of-school youth youth with disabilities and low literacy rates as well as others who may require additional assistance to complete an educational program and acquire an industry-recognized credential or enter employment
Quarter Highlights The passage of the Workforce Innovation and Opportunity Act (WIOA) includes a major shift in focus to spending more funds on and serving more out-of-school youth (OSY) The workforce system demonstrated its readiness for this shift in that 48 percent of all youth served in PY 2013 were OSY and 57 percent of all WIA youth local area funds were spent on OSY So far in Program Year 2013 California has spent almost 65 percent of their WIA youth funds on OSY with high levels of OSY expenditures in both urban and rural areas 53 percent of all youth served in CA in Program Year 2013 were OSY For example Los Angeles City spent 80 percent of their funds on OSY and the Northern Rural Training and Employment Consortium spent 76 percent of their funds on OSY Both local areas have achieved these levels through strong partnerships with organizations that serve OSY as well as access to high quality work experiences
Program Performance
Performance Measure
Four Quarters
Ending 063012
(Program Year 2011)
Four Quarters
Ending 063013
(Program Year 2012)
Four Quarters
Ending 063014
(Program Year 2013)
Placement in Employment or Education 589 666 690
Attainment of a Degree or Certificate 648 675 684
LiteracyNumeracy Gains 476 509 525
Performance in the Past Three Program Years
Analysis bull 197045 participants were served in the cumulative four quarter reporting period compared
to 217244 served during the same time period last year This decrease is due primarily to a lower funding level compared to the previous year
bull Placement in Employment or Education achieved a result of 690 percent a 24 percentage point increase when compared with the same time period last year
bull The program achieved a result of 684 percent for the Attainment of a Degree or Certificate measure This is a 09 percentage point increase from the same time period last year
bull The LiteracyNumeracy Gains measure achieved a result of 525 percent an increase of 16 percentage points when compared with the same time period last year
bull All three youth common measures exceeded Program Year 2013 GPRA goals
23
WORKFORCE SYSTEM RESULTS
100
80
60
40
20
0 Sep-12 Dec-12 Mar-13 Jun-13 Sep-13 Dec-13 Mar-14 Jun-14
n Placement in Employment or Education n Attainment of a Degree or Certificate n LiteracyNumeracy Gains
YouthBuild httpwwwdoletagovyouth_servicesyouthbuildcfm
Program Description YouthBuild provides job training and educational opportunities for at-risk youth ages 16 to 24 while constructing or rehabilitating affordable housing for low-income or homeless families in their own neighborhoods The youth split their time between the construction site and the classroom where they earn their high school diploma or equivalency learn to be community leaders and prepare for college and other post-secondary training opportunities
Analysis bull 33392 participants have been enrolled into the YouthBuild program since 2007 and 29553
have exited so far bull Since the program began a total of 11716 participants have received a high school
diploma or equivalency 17572 have attained an industry-recognized certificate and 21835 have been placed into initial jobs post-secondary education andor long-term vocational occupational skills training including apprenticeship
bull The Class of 20102011 performance steadily increased The outcomes for all three measures were above those for the Class of 2009 and significantly above the GPRA goals
bull YouthBuild is currently meeting or exceeding the GPRA goal for all three measures The additional quarter of service for 20102011 grants provided additional positive outcomes as expected As the 2012 grant class progresses it is expected that this trend will continue
Program Performance
Quarter Highlights Just A Start in Cambridge (MA) has been a YouthBuild grantee since 2010 In the fourth quarter of the Program Year 2013 they shared the following success story
Victor earned a High School Diploma and HBIPACT construction certification He was accepted to Endicott College in MA He also secured a full time painting position with George Souza Painting making $25 per hour He continues to develop his career plan with staff
Class of 20102011 Performance in the Past Eight Quarters
Performance Measure GPRA Results for Class
0f 20102011 Results for Class 2012 Overall Results
Percent of Participants Entering Employment or Enrolling in Postsecondary Education the Military or Advanced Training Occupational Skills Training in the First Quarter After Exit
500 612 586 519
Percent of Youth Who Attain a Diploma GED or Certificate by the End of the Third Quarter after Exit
672 770 609 672
Percent of Participants Deficient in Basic Skills Who Achieve Literacy or Numeracy Gains of One Adult Basic Education Level
585 676 549 595
24
WORKFORCE SYSTEM RESULTS
100
80
60
40
20
0 Sep-12 Dec-12 Mar-13 Jun-13 Sep-13 Dec-13 Mar-14 Jun-14
n Attainment of a High School Diploma GED or improvement of basic skills by at least two grade levels or completed Occupational Skills training n Participants who Attained Two or more Goals
Indian and Native American Youth Program httpwwwdoletagovdinap
Program Description The Indian and Native American Supplemental Youth Services Program provides summer and year-round employment and training activities for Indian Alaska Native and Native Hawaiian individuals between the ages of 14 and 21 Program resources are targeted to at-risk and the neediest youth who face substantial barriers to education and employment success This population includes high school dropouts and youth who are basic-skills deficient
Quarter Highlights Youth summer employment is a high priority for Native American Tribes However most rural reservation areas do not have enough employers to put youth to work during the summer As a result Tribes rely on the annual WIA Section 166 funding to place youth in summer employment where they can earn a wage and receive valuable work experience
Over the past four quarter period 2487 of the 4399 youth that participated in the youth program were placed in summer employment Youth participants come from low income families with little or no opportunity to earn money during the summer months Through the Indian and Native American Youth Program these youth are given an opportunity to work and earn money during the summer which helps them contribute to their familyrsquos income
Performance in the Past Eight Quarters
Program Performance
Performance Measure Four Quarters
Ending 063013 Four Quarters
Ending 063014
Educational Attainment for Dropouts 180 220
Attainment of Two or More Goals 920 927
The data reported reflect the period from April 1 2012 through March 31 2013 The data reported reflect the period from April 1 2013 through March 31 2014
Additional Program Year 2013 Quarterly Data
Performance Measure Four Quarters
Ending 093013 Four Quarters
Ending 123113 Four Quarters
Ending 033114
Educational Attainment for Dropouts
250 250 220
Attainment of Two or More Goals
930 930 927
The data reported reflect the period from April 1 2013 through September 30 2013 The data reported reflect the period from April 1 2013 through March 31 2014
Analysis bull The Attainment of Two or More Goals rate increased slightly from 92 percent in June 2013
to 927 percent in June 2014 bull The Indian and Native American Youth Program served 4310 youth during the period July
1 2013 through June 30 2014 This is a 164 percentage point decrease in youth served one year ago
bull The Education Attainment for Dropouts increased from 18 percent in June 2013 to 22 percent in June 2014
25
WORKFORCE SYSTEM RESULTS
Green Jobs Innovation Fund Grants (GJIF) httpwwwdoletagovBRGGreenJobs
Program Description The Green Jobs Innovation Fund (GJIF) was authorized as a Pilot and Demonstration Project under the Workforce Investment Act (WIA) of 1998 to help workers receive job training in green industry sectors and occupations as well as access green career pathways GJIF is seeking to increase the number of individuals completing training programs who receive industry-recognized credentials and to increase the number of individuals completing training programs for employment in green jobs
With these grants the Department is emphasizing two key workforce programs that move participants along green career pathways by 1) forging linkages between Registered Apprenticeship and pre-apprenticeship programs andor 2) integrating the delivery of technical and basic skills training through community-based partnerships The grantees are building on existing programs that are already established and serving workers and moving workers into and along green career pathways The Green Jobs Innovation Fund (GJIF) grants are all anticipated to end by June 30 2015
Quarter Highlights The Jobs for the Future (JFF) GreenWays grant program made great progress toward their goal of increasing access for women to enter higher-paying non-traditional occupations Women currently comprise 254 of the programs total enrollment and are earning higher placement wages overall than men At the same time their completion rates credential attainment rates and job placement rates lag behind those of men reflecting the ongoing challenges that women experience in non-traditional occupations The JFF GreenWays program continues to focus on raising the visibility of this issue as a key element in regional approaches to addressing poverty in female-headed households
Program Performance
Performance Measure Cumulative
Four Quarters Ending 063013
Cumulative Four Quarters
Ending 063014
Entered Employment Rate 569 642
Employment Retention Rate 750 821
Six Monthsrsquo Average Earnings $16249 $17459
Additional Program Year 2013 Quarterly Data
Performance Measure
Cumulative Four
Quarters Ending
093013
Cumulative Four
Quarters Ending
123113
Cumulative Four
Quarters Ending
033114
Entered Employment Rate 560 626 641
Employment Retention Rate 790 795 785
Six Monthsrsquo Average Earnings $16406 $15228 $15039
Cumulative Credential Outcomes in the Past Three Quarters
Performance Measure Quarter Ending
123113
Quarter Ending
033114
Quarter Ending
063014
Number Completed Education Job Training Activities
5521 6438 7076
Number Completed Training and Received Credential
5343 6242 6849
Attainment Rate 97 97 97
Analysis As of June 30 2014 8360 participants were enrolled in educationtraining Of these participants 600 participated in Registered Apprenticeship 874 participated in Pre-Apprenticeship and 40 participated in On-the-Job Training A total of 7076 participants completed educationtraining A total of 6849 participants received a credential Lastly a total of 4870 participants entered employment and of these participants 4343 entered training-related employment
26
WORKFORCE SYSTEM RESULTS
Dec-13 Mar-14 Jun-14
100 $27000
$2600080
$2500060
$24000 40
$23000
20 $22000
0 $21000
n Entered Employment Rate n Employment Retention Rate n Six Months Average Earnings
H-1B Jobs and Innovation Accelerator Challenge Grants httpwwwdoletagovETA_News_Releases20111398cfm
Program Description The Jobs and Innovation Accelerator Challenge (Jobs Accelerator) is designed to help regions achieve the demonstrated benefits of collaborative cluster-based regional development This initiative represents the implementation of Administration policy priorities to accelerate bottom-up innovation in urban and rural regions as opposed to imposing ldquoone-size-fits-allrdquo solutions The Jobs Accelerator also meets Administration goals for smarter use of government resources through reduction of Federal silos and promotion of coordinated Federal funding opportunities that offer more efficient access to Federal resources Investments from Federal agencies for the Jobs Accelerator projects include The US Department of Laborrsquos Employment and Training Administration (DOL-ETA) the US Department of Commercersquos Economic Development Administration (DOC-EDA) and the National Institutes of Standards and Technologyrsquos Hollings Manufacturing Extension Partnership (NIST-MEP) the Small Business Administration (SBA) the Department of Energy Advanced Manufacturing Office (DOE AMO) and the Delta Regional Authority (DRA)
The objectives of the Jobs Accelerator are to
bull Accelerate the formation of new high-growth businesses and expansion of existing businesses
bull Accelerate the creation of higher-wage jobs bull Advance commercialization of research including Federally-funded research bull Support deployment of new processes new technologies and new products to grow sales
and generate employment bull Enhance the capacity of small businesses in the cluster including small and disadvantaged
businesses bull Increase exports and business interaction with international buyers and suppliers bull Develop the skilled workforce needed to support growing clusters and bull Ensure diverse workforce participation in clusters through outreach training and the
creation of career pathways
Quarter Highlights The Northeast Ohio Speed-To-Market Accelerator (STMA) program administered by Lorain County Community College aims to accelerate the speed-to-market for near production or pilot production prototypes stimulate job creation and increase the global competitiveness of cluster companies attract private capital and attract students incumbent workers and the unemployed
This quarter STMA helped accelerate the introduction of a new dry electrode product for heart monitoring This sensor and electronics will be introduced as part of the next generation of wearable human performance arm band from Pittsburgh based Body Media a subsidiary of Jawbone Further STMA continues to bring new companies into the STMA
program through cluster outreach activities and this quarter three new leads were generated as the result of the existing STMA partners MAGNET JumpStart Lorain County Community College and NorTech
Program Performance
Performance Measure Four Quarters
Ending 123113 Four Quarters
Ending 033114 Four Quarters
Ending 063014
Entered Employment Rate 307 283 359
Employment Retention Rate 907 925 927
Six Monthsrsquo Average Earnings $23310 $22953 $26682
Performance in the Past Three Quarters
Analysis A total of 3702 individuals were served 3632 individuals began educationjob training activities and 2052 individuals completed educationjob training services Of participants completing educationjob training 370 unemployed individuals completed training and entered employment and of these 114 individuals entered training-related employment A total of 204 employed individuals completed training and retained their current position and of these 85 employed individuals completed training and advanced into a new position A total of 2006 individuals completed educationtraining activities and received credentials and of these 2273 total credentials were awarded
This data represents three rounds of the for Jobs Accelerator initiative which includes the Jobs Accelerator Round 1 the Advanced Manufacturing Jobs Accelerator Round 2 and the Make it in America (MIIA) Jobs Accelerator grants program
27
WORKFORCE SYSTEM RESULTS
100 $56000
80 $54000
$52000 60 $50000
40 $48000
$46000 20
$44000
0 $42000 Dec-13 Mar-14 Jun-14
n Entered Employment Rate n Employment Retention Rate n Six Months Average Earnings
H-1B Technical Skills Training Grants httpwwwdoletagovbusinessH1B_Tech_Skillscfm
Program Description The H-1B Technical Skills Training (TST) Grants were authorized by the American Competitiveness and Workforce Improvement Act of 1998 (ACWIA) as amended (29 USC 2916a) to provide education training and job placement assistance in the occupations and industries for which employers are using H-1B visas to hire highly-skilled foreign workers on a temporary basis and the related activities necessary to support such training The H-1B TST Grant Program is intended to raise the technical skill levels of American workers so they can obtain or upgrade employment in high-growth industries and occupations Over time these education and training programs will help businesses reduce their use of skilled foreign professionals permitted to work in the US on a temporary basis under the H-1B visa program The grants represent significant investments in sectors such as information technology advanced manufacturing and health care In addition these grants will focus on serving participants who have been identified as long-term unemployed particularly those who have been unemployed the longest These grants also have an emphasis on providing on-the-job training allowing participants to learn new skills while earning a pay check To date ETA has announced two rounds of TST grants totaling $342 million The first round was announced on October 4 2011 and the second round was announced on February 22 2012
Quarter Highlights The Los Angeles HealthWorks On-the-Job training (OJT) initiative administered by Managed Career Solutions Inc (MCS) provides individuals with training that leads to industry recognized credentials and employment opportunities within the regionrsquos healthcare field MCS maintains several strong partnerships to coordinate outreach recruitment training OJT placements and employment opportunities As of June 30 2014 MCS served nearly 800 long-term unemployed participants and overall 1100 participants In the same period over 650 individuals completed training and earned an industry recognized credential Of those completers 128 were employed at participation however the majority were underemployed and gained the necessary job skills and credentials that allowed 80 percent to advance into a new position In recognition MCS received the Malcom Baldrige and State Eureka awards
Analysis bull 52532 individuals were served and 51071 individuals began educationjob training
activities bull 15185 individuals completed educationjob training activities including 3321 unemployed
individuals who completed training and entered employment bull Of these 2925 individuals entered training-related employment 2902 employed individuals
completed training and retained their current position 1452 employed individuals completed training and advanced into a new position
bull 11944 individuals completed educationjob training activities and received credentials with 14099 total credentials awarded
Program Performance
Performance Measure
Four Quarters
Ending 123113
Four Quarters
Ending 033114
Four Quarters
Ending 063014
Entered Employment Rate 778 725 675
Employment Retention Rate 993 944 926
Six Monthsrsquo Average Earnings $54683 $50833 $46245
Since the H-1B TST program provides training to incumbent unemployed and long-term unemployed workers to prepare them for jobs in a variety H-1B industries andor occupations the Entered Employment Rate and Six Monthsrsquo Average Earnings can vary For the quarter ending on June 30 2014 the H-1B TST program saw a decline in the Entered Employment Rate and Six Monthsrsquo Average Earnings in comparison with the results for the previous rolling four quarters Previous results reflected a large number of incumbent workers who enrolled in short-term high-skilled training and exited early leading to a relatively high Six Monthsrsquo Average Earnings As the projects progress unemployed and long-term unemployed workers who required longer-term training begin to exit the program and search for jobs Ultimately as they enter employment wages may be less than those achieved by the higher-skilled incumbent workers who either retain or advance in their positions after training
Performance in the Past Three Quarters
28
WORKFORCE SYSTEM RESULTS
100 $21000
$19000 80
$17000
$1500060 $13000
40 $11000
$900020
$7000
0 $5000Sep-12 Dec-12 Mar-13 Jun-13 Sep-13 Dec-13 Mar-14 Jun-14
n Entered Employment Rate n Employment Retention Rate n Six Months Average Earnings
Community-Based Job Training Grants (CBJT) httpwwwdoletagovbusinessCommunity-BasedJobTrainingGrantscfm
Program Description Community-Based Job Training Grants (CBJT) seek to strengthen the role of community colleges in promoting the United States workforcersquos competitiveness The program does this by building the capacity of community colleges to train workers in skills required to succeed in regionally based high-growth high-demand industries and occupations Important grant activities include training in the healthcare biotech advanced manufacturing energy automotive transportation construction insurance forestry and aerospace industries The first round of CBJT grants were awarded in October 2005 To date ETA has announced five rounds of CBJT grants awarding 320 grants to community colleges and other organizations All CBJT grants ended as of June 30 2014
Quarter Highlights The 14 remaining projects active in this quarter represent the culmination of another successful DOL initiative Some of the significant accomplishments include the development and sustainability of Roane State Community Collegersquos Lean Manufacturing program designed to meet the needs of local manufacturing employers the San Jacinto Community College Districtrsquos Gulf Coast Healthcare Partners project which developed training to support healthcare career and Central Arizona Collegersquos Pinal County Alternative Energy Project More than half of the CBJT participants who began education and training activities completed their programs 79 percent of them received an industry recognized credential ie certificate or degree Eighty-four percent of the participants who gained employment entered into new training-related positions
Program Performance
Performance Measure Four Quarters
Ending 063013 Four Quarters
Ending 063014
Entered Employment Rate 572 662
Employment Retention Rate 891 899
Six Monthsrsquo Average Earnings $18675 $17027
Additional Program Year 2013 Quarterly Data
Performance Measure
Four Quarters
Ending 093013
Four Quarters
Ending 123113
Four Quarters
Ending 033114
Entered Employment Rate 57 605 655
Employment Retention Rate 891 897 891
Six Monthsrsquo Average Earnings $18675 $18285 $16642
Performance in the Past Eight Quarters
Analysis bull 268359 individuals have been served through the initiative bull 258216 individuals began educationjob training activities bull 165264 individuals completed educationjob training activities Of these
bull 131107 individuals received credentials bull 65089 individuals entered new positions of employment and 54344 individuals entered new
positions of training-related employment
Note All data are cumulative Prior to new reporting requirements implemented in the quarter ending December 31 2011 grantees only reported results for individuals that entered employment and individuals that entered training-related employment (noted above) if those participants entered employment and completed training in the same quarter As a result prior to that quarter participants that entered employment in quarters after they completed training were captured in the Common Measures and the total number of individuals that ultimately entered employment and training-related employment are actually higher than the results above indicate
29
WORKFORCE SYSTEM RESULTS
100 92
7880
5760
40
20
0
n Percent of Target Number of Programs Launched by Round
Round 1 Round 2 Round 3
Trade Adjustment Assistance Community College and Career Training (TAACCCT) Grants httpwwwdoletagovtaaccct
Program Description The Trade Adjustment Assistance Community College and Career Training (TAACCCT) Grant Program is authorized by the Trade Act of 1974 under Chapter 4 of Title II The purpose of this grant program is to provide eligible institutions of higher education with funds to expand and improve their ability to deliver education and career training programs that can be completed in two years or less and that result in skills degrees and credentials that prepare program participants for employment in high-wage high-skill occupations and are suited for workers who are eligible for training under the Trade Adjustment Assistance (TAA) for Workers program under Chapter 2 of Title II of the Trade Act The TAACCCT Grant Program is funded under the Health Care and Education Reconciliation Act of 2010 which appropriated $500 million for the program for each of Fiscal Years 2011-2014 for a total of $2 billion
Round 1 ndash FY 2011 Grants On June 30 2014 grants awarded in Round 1 (FY 2011) had completed all but one quarter of their periods of performance By the end of their final year of the grant the forty-nine (49) Round 1 grantees project that they will offer a total of 906 new programs of study As of June 30 2014 grantees began offering 834 (92 percent) of these programs of study
Round 2 ndash FY 2012 Grants The seventy-nine (79) grants awarded in the Fiscal Year 2012 had completed seven quarters of their grants at the end of June 30 2014 Their period of performance began on October 1 2012 and will end on September 30 2016 however their final year will be dedicated to gathering information and data for reporting outcome measures and completing the requirements for a third-party evaluation They project that by the end of the third year they will have launched 761 programs As of the end of June 30 2014 they had began offering 561 (78 percent) of these programs
Round 3 ndash FY 2013 Grants Grants awarded in FY 2013 had completed the first three quarters of their period of performance Their grants began on October 1 2013 and will end on September 30 2017
In their third year they will have launched all of their programs as their final year will be dedicated to collecting follow up data for evaluation and reporting purposes only The fifty-seven (57) grantees plan to launch 551 programs As of June 30 2014 they had already launched 288 (57 percent) of these programs
Percentage of Target Number of Programs Launched as of June 30 2014 by Grant Round
Performance Information Programmatic data is collected at different intervals throughout the period of performance including
bull Quarterly Narrative Progress Reports (QNPR) Grantees will provide quarterly qualitative data on the capacity building taking place through progress and other implementation measures that grantees defined in their Statements of Work
bull Annual Performance Reports (APR) Grantees will provide annual quantitative data on their training and employment outcomes for TAACCCT program participants that are impacted by the capacity building activities being implemented by their grants
30
WORKFORCE SYSTEM RESULTS
$4500000 3500$4000000 3000$3500000
2500
Jun-13 Dec-13 Mar-14 Jun-14
Amou
nt $3000000 2000$2500000
$2000000 1500 $1500000 1000 $1000000
500$500000 $0 0
n Amount of Revenue Generated n Number of Tickets Assigned
Disability Employment Initiative (DEI) httpwwwdoletagovdisability
Program Description All DEI Workforce Employment Network (EN) Trends
Launched in 2010 the Disability Employment Initiative (DEI) seeks to improve education training and employment opportunities for youth and adults with disabilities who are unemployed underemployed andor receiving Social Security disability benefits The DEI is jointly funded by the US Department of Laborrsquos Employment and Training Administration and Office of Disability Employment Policy DEI projects improve collaboration among employment and training and asset development programs implemented at state and local levels including the Social Security Administrationrsquos Ticket to Work Program and build effective partnerships that leverage resources to better serve individuals with disabilities and improve employment outcomes
Quarter Highlights A variety of Department of Labor programs helped Vietnam-era veteran Richard James navigate through life After servicing B-52 bombers in the Air Force James held a series of sales jobs while putting himself through law school at night He rose to become a successful New England attorney and owner of a boat dock building company when he suffered a terrible head injury which caused spine and nerve damage Addiction to pain medication followed and James ended up homeless While recovering from his injuries James took a college course through the Veterans Retraining Assistance Program managed in part by the Department He received career counseling from a Disabled Veterans Outreach Program representative at a local American Job Center and support from the DEI Disability Resource Coordinator Eventually James was hired as an attorney by a Rhode Island law firm The departments grants and programs made possible the services that put me back in a position of being a productive member of society he said
Program Performance
Performance Measure Quarter Ending 63013
Quarter Ending
123113
Quarter Ending 33114
Quarter Ending 63014
Analysis bull The Exit Rate for Adult and Youth exiters with disabilities in Round one DEI sites is almost
double the national average Adult DEI was 89 percent vs All StatesAll LWIAs 49 percent Older Youth DEI 166 percent vs All StatesAll LWIAs 87 percent Younger Youth DEI 339 percent vs All StatesAll LWIAs 151 percent
bull The CredentialSkill Attainment Rate for older and younger youth with disabilities in Round 1 DEI sites was higher than the national average Older Youth DEI credential rate 568 percent vs All StatesAll LWIAs 383 percent Younger Youth DEI skill rate 902 percent vs All States All LWIAs 834 percent
bull The Exit Rate for Adult and Youth exiters with disabilities in Round two DEI sites is higher than the national average Adult DEI 56 percent vs All StatesAll LWIAs 49 percent Older Youth DEI 163 percent vs All StatesAll LWIAs 87 percent and Younger Youth DEI 167 percent vs All StatesAll LWIAs 151 percent
bull The Entered Employment Rate for Adult DEI sites 657 percent is 20 percent higher than in All StatesAll LWIAs 434 percent
bull DEI Workforce Employment Networks (EN) activity shows that the number of Tickets assigned increased from 1780 to 2903 an increase of 1123 and the amount of revenue
Number of Tickets Assigned 1780 1590 2554 2903 generated from DEI EN payments increased from $2373404 to $4057353 an increase of $168 million Amount of Revenue Generated $2373404 $1927104 $3505582 $4057353
31
WORKFORCE SYSTEM RESULTS
ETA Internet-Based Assistance (E-TOOLS) wwwcareerinfonetorg wwwservicelocatororg wwwcareeronestoporg wwwonetonlineorg wwwmyskillsmyfutureorg wwwmynextmoveorg
Program Description Additional Program Year 2013 Quarterly Data
Performance Measure Quarter Ending
093013
Quarter Ending
123113
Quarter Ending
033114
CareerOneStop Portal Visits 5754645 5159240 5340022
ETArsquos Internet-based assistance includes electronic tools that help individuals explore career opportunities and link to job postings either on their own or at local American Job Centers to make informed employment and education choices
The Web sites feature user-friendly occupation and industry information salary data career videos education resources career exploration assistance and other resources that support talent development in todayrsquos fast-paced global marketplace Users can find information some of which is also industry sponsored about occupations that are in-demand in high growth industries Additionally information is available regarding occupational skills and workplace competencies
Quarter Highlights For the year ending June 2014 CareerOneStop launched a new portal for Ex-Offenders added Federal Contractor job tagging a TAACCCT information finder Youth Council information to Americarsquos Service Locator and began working on adding more job feeds
Americarsquos Service Locator (ASL) Visits
730998 758919 724053
ONET Downloads 26646 29407 28505
ONET Visits 7697608 10211177 11500039
Combined Visits 14183251 16129336 17564114
Performance in the Past Eight Quarters
25000000 $36000
Sep-12 Dec-12 Mar-13 Jun-13 Sep-13 Dec-13 Mar-14 Jun-14
n Combined Visits (in millions) n ONET Product Downloads (in thousands)
$31500 20000000
ONE
T Pr
oduc
t Dow
nloa
ds
$27000
Com
bine
d Vi
sits
$2250015000000 $18000
10000000 $13500
$90005000000
$4500
$00
ONET has added web services for developers and increased the available Tools and Technology and Detailed Work Activities information to convey specialized occupational attributes
Program Performance
Performance Measure Quarter
Ending 063013 Quarter
Ending 063014
CareerOneStop Portal Visits 5104850 5472742
Americarsquos Service Locator (ASL)Visits
747114 802148
ONET Downloads 29482 25278
ONET Visits 8716609 13581922
Combined Visits 14568573 19856812
Analysis bull ETA Internet-Based Assistance received 19856812 combined visits for the quarter ending
June 30 2014 an increase of 36 percent over the same period in 2013 bull Visits to CareerOneStop increased to 5472742 or 72 percent over the same period in 2013
with mySkillsmyFuture continuing to be a popular tool with an increase of 23 percent bull Americarsquos Service Locator Visits traffic increased 74 percent over the same period in 2013 bull The ONET traffic received 13581922 visits in this quarter an increase of 558 percent
over the same period in 2013 and the ONET downloads totaled 25278 for the quarter a decrease of 142 percent
32
WORKFORCE SYSTEM RESULTS
Glossary of Performance Measures
Common Performance Measures Common Performance Measures are used by Workforce Investment Act Indian and Native American Program Disability Program Navigator Initiative Wagner-Peyser Trade Adjustment Assistance Senior Community Service Employment Program Reintegration of Ex-Offenders Registered Apprenticeship Program Job Corps National Farmworker Jobs Program High Growth Job Training Initiative and Community-Based Job Training Grants
Adult Measures Entered Employment Of those who are not employed at the date of participation the number of adult participants who are employed in the first quarter after the exit quarter divided by the number of adult participants who exit during the quarter
Employment Retention Of those who are employed in the first quarter after the exit quarter the number of adult participants who are employed in both the second and third quarters after the exit quarter divided by the number of adult participants who exit during the quarter
Six Monthsrsquo Average Earnings Of those adult participants who are employed in the first second and third quarters after the exit quarter total earnings in the second quarter plus the total earnings in the third quarter after the exit quarter divided by the number of adult participants who exit during the quarter
Average Earnings Change in Six Months1
Of those who are employed in Q1 after exit the total post-program earnings (earnings in Q2 + Q3 after exit) minus pre-program earnings (earnings in Q2 + Q3 prior to registration) divided by the number of adults who exit during the quarter
Youth Measures Attainment of a Degree or Certificate Of those enrolled in education (at the date of participation or at any point during the program) the number of youth participants who attain a diploma GED or certificate by the end of the third quarter after the exit quarter divided by the number of youth participants who exit during the quarter
1 This definition was used for earnings in PY 2005 Q=quarter
33
Literacy and Numeracy Gains Of those out-of-school youth who are basic skills deficient the number of youth participants who increase one or more educational functioning levels divided by the number of youth participants who have completed a year in the program (ie one year from the date of first youth program service) plus the number of youth participants who exit before completing a year in the program
Placement in Employment or Education2
Of those who are not in postsecondary education or employment (including the military) at the date of participation the number of youth participants who are in employment (including the military) or enrolled in postsecondary education andor advanced trainingoccupational skills training in the first quarter after the exit quarter divided by the number of youth participants who exit during the quarter
Program-Specific Performance Measures
Disability Employment Initiative (DEI) Number of Tickets Assigned Number of individuals on Social Security Administration (SSA) disability benefits who assigned their Ticket to the workforce board agency or American Job Center as their designated Employment Network under the SSA Ticket to Work program All DEI pilot sites must become an Employment Network under Ticket to Work
Amount of Revenue Generated Under the SSA Ticket to Work program when jobseekers who receive SSA disability benefits assign their Ticket to a workforce board agency or American Job Center as an Employment Network and then achieve certain employment milestones the Employment Network receives money or ldquoTicket revenuerdquo
2 Because of its intensity and duration the YouthBuild performance measure for placement in employment or education does not exclude those who entered the program with a job or in college
WORKFORCE SYSTEM RESULTS
Foreign Labor Certification Percent of H-1B Applications Resolved in Seven Business Days This estimate is based on the total number of applications processed within seven business days divided by the total number of applications processed for a given reporting period An application is considered processed if the last significant event is (1) certified (2) denied or (3) withdrawn
Average Number of Days to Resolve PERM Applications Not Subject to Integrity Review The average processing time between case receipt and decision date for non-audited cases
Average Number of Days to Resolve PERM Applications Subject to Integrity Review The average processing time between case receipt and decision date for audited cases
Percent of Complete H-2A Employer Applications Resolved within 30 Days Before the Date of Need This estimate is based on the total number of complete applications resolved within 30 days before the date of need divided by the total number of applications processed for a given reporting period
Percent of H-2B Applications Processed Within 30 Days of Receipt This estimate is based on the total number of applications processed within 30 days of receipt divided by the total number of applications processed for a given reporting period An application is considered processed if the last significant event is (1) certified (2) denied or (3) withdrawn
Indian and Native American Youth Attainment of Two or More Goals The total number of youth participants enrolled in the Granteersquos Supplemental Youth Services Program who attained at least two of the 14 goals listed below divided by the total number of Supplemental Youth Services participants enrolled during the report period The 14 goals include
1 Completed Job ReadinessOrientation to the World of Work Training 2 Completed Internship or Vocational Exploration Program
3 Completed Career Assessment 4 Entered Unsubsidized Employment 5 Remained in School 6 Returned to School Full Time 7 Enrolled in Job Corps 8 Improved Basic Skills Level By At Least Two Grades 9 Attained High School Diploma 10 Attained GED 11 Completed Occupational Skills Training 12 Completed Leadership Skills Training 13 Entered Other (Non-Supplemental Youth) Training Program 14 Summer Employment
Educational Attainment for Dropouts The number of dropouts who have obtained a high school diploma GED or increased their literacy and numeracy by two grade levels divided by the total number of dropouts
Job Corps Measures Placement in Employment or Education Percent of Job Corps participants3 entering employment or enrolling in post-secondary education andor advanced skills trainingoccupational skills training in the first quarter after exit from the program
Attainment of a Degree or Certificate Percent of students who attain a GED HSD or certificate
Literacy Numeracy Gains Percent of students who achieve literacy or numeracy gains of one or more Adult Basic Education (ABE) levels
3 Calculation of the Placement rate measure does not include outcomes for students who participated in the program for less than 60 days
34
WORKFORCE SYSTEM RESULTS
Internet-Based Assistance Web Site Visits ETArsquos Internet-based assistance includes electronic tools that help individuals make informed employment and education choices The measure for tracking the overall performance and usage of these tools is Web site visits A visit is defined as a series of page requests from the same uniquely identified client with a time of no more than 30 minutes between each page
request
ONet Product Downloads The ONET product downloads count the number of unique users who download an ONET online resource (wwwonetcenterorg) which includes the ONET database (all versions) ONET technical reports (such as on green jobs) supplemental data files (lay titles tools and technology) the ONET Career Exploration Tool files ONET Survey questionnaires and other related materials such as the Toolkit for Business
Registered Apprenticeship Program Entered Employment Rate Percent of apprentices employed in the first quarter after exit who either completed or cancelled from their Registered Apprenticeship Program
Employment Retention Rate Percent of apprentices employed in the first quarter after exit still employed in the second and third quarter after exit who either completed or cancelled from their Registered Apprenticeship Program
Six Monthsrsquo Average Earnings Six month Average Earnings of apprentices employed in the first quarter after exit still employed in the second and third quarter after exit who either completed or cancelled from their Registered Apprenticeship Program
Reintegration of Ex-OffendersmdashAdult Program Recidivism Rate The percentage of participants who are rearrested for a new crime or re-incarcerated for revocation of a parole or probation violation within one year from release from prison
Senior Community Service Employment Program Service Level The count of participants during the report period divided by the total number of authorized grantee community service positions
Community Service The number of community service hours as reported by each grantee divided by the total community service hours funded for the grantee adjusted for minimum wage differences among the states
Most-in-Need Most-in-need means participants with one or more of the following characteristics have a severe disability are frail are age 75 or older are age-eligible but not receiving benefits under Title II of the Social Security Act reside in an area with persistent unemployment and have severely limited employment prospects have limited English proficiency have low literacy skills have a disability reside in a rural area are Veterans have low employment prospects have failed to find employment after utilizing services provided under Title I of the Workforce Investment Act of 1998 (29 USC 2801 et seq) or are homeless or at risk for homelessness (sect 513(b)(1)(E) as amended by Pub L No 109-365)
Unemployment Insurance Percent of Payments Made Timely The percentage of intrastate Unemployment Insurance benefit first payments for full weeks of unemployment issued within 14 days following the first compensable week in states with a waiting week and 21 days in non-waiting week states
Detection of Recoverable Overpayments The amount of overpayments (dollars) established through state operations as a percent of the estimated amount states can detect and establish for recovery
Entered Employment Rate The percent of persons receiving a first payment in a given quarter who had earnings in the next quarter
Percent of Employer Tax Liability Determinations Made Timely The percent of new employer determinations made within 90 days of the end of the quarter in which employers became liable to pay unemployment taxes
35
WORKFORCE SYSTEM RESULTS
YouthBuild Attainment of a Degree or Certificate Of those enrolled the number of youth participants who attain a diploma high school equivalency degree or industry-recognized certificate by the end of the third quarter after the exit quarter divided by the number of youth enrolled (minus youth exited for other reasons)
Literacy and Numeracy Gains Of those youth participants who are basic skills deficient at enrollment the number of youth participants who increase one or more educational functioning levels within one year of enrollment divided by the number of youth participants who have completed a year in the program
Placement in Employment or Education The number of youth participants who are in employment (including the military) or are enrolled in post-secondary education andor advanced trainingoccupational skills training in the first quarter after the exit quarter divided by the number of youth participants who exited during the previous quarter
Youthful Offender Projects Placement Rate The placement rate is the percentage of out-of-school youth ages 18 and above placed in unsubsidized jobs occupational training post-secondary education or the military
Recidivism Rate The recidivism rate is the percentage of youth offenders who have been convicted of a new crime within 12 months of their release of a correctional facility or being placed on probation
36
WORKFORCE SYSTEM RESULTS
2471 American Job Centers formerly known as One-Stop Career Centers
12 VT
9 HI
1 GU
6 DC
2 VI
15 NE
16 SD
12 ME
19 IA
19 AK
19 WV
4 DE
47 AL
55 CO
48 MN
57 WI
89 NC
60 GA
31 MA
23 NM
16 ND
47 AR
70 PA
18 CT 4 RI
12 NV
20 WY
22 KS
18 PR
89 OH
69 TN
102 FL
59 AZ 46
SC
12 NH
29 NJ
52 VA
22 MT
33 OK
39 MS
59 WA
61 IL 34 MD
47 OR
131 KY
62 LA
83 IN
33 UT
44 MO
26 ID 90
NY95 MI
1 to 25
25 to 50
50 to 75
75 to 100
Over 100
203 CA
180 TX
Source Americarsquos Service Locator (wwwServiceLocatororg) Americarsquos Service Locator connects individuals to employment and training opportunities available at local American Job Centers The Web site provides contact information for a range of local work-related services including unemployment benefits career development and educational opportunities As of March 17 2015
37
WORKFORCE SYSTEM RESULTS
United States Department of Labor
200 Constitution Avenue NW
Washington DC 20210
wwwdolgov
- A9RFAFEtmp
- DOL_Workforce_Rprt_Jun_2014_51415-dp
-
- Workforce System Results
-
- Contents
- Quarterly Spotlight
- People Served by Program
- Current Appropriations
- Government Performance and Results Act Goals (GPRA)
- Indian and Native American Adult Program (INAP)
- National Farmworker Jobs Program (NFJP)
- Senior Community Service Employment Program (SCSEP)
- Wagner-Peyser Employment Service
- Workforce Investment Act Adult Program
- Workforce Investment Act Dislocated Worker Program
- H-1B and Permanent Foreign Labor Certification (PERM)
- H-2A and H-2B Foreign Labor Certification Programs
- Reintegration of Ex-Offenders (RExO-ADULT)
- Registered Apprenticeship
- Registered Apprenticeship
- Trade Adjustment Assistance (TAA)
- Unemployment Insurance (UI)
- Unemployment Insurance (UI)
- Job Corps
- Workforce Investment Act Youthful Offender Initiative
- Workforce Investment Act Youth Program
- YouthBuild
- Indian and Native American Youth Program
- H-1B Jobs and Innovation Accelerator Challenge Grants
- H-1B Technical Skills Training Grants
- Community-Based Job Training Grants (CBJT)
- Trade Adjustment Assistance Community College and Career Training (TAACCCT) Grants
- Disability Employment Initiative (DEI)
- ETA Internet-Based Assistance (E-TOOLS)
- Glossary of Performance Measures
- 2471 American Job Centers formerly known as One-Stop Career Centers
-

WORKFORCE SYSTEM RESULTS
100
80
60
40
20
0 Sep-12 Dec-12 Mar-13 Jun-13 Sep-13 Dec-13 Mar-14 Jun-14
n Placement Rate for Out-of-School Youth Ages 18 and Above n Recidivism Rate for Youth Ages 14 to 17 n Recidivism Rate for Youth Ages 18 and Above
Workforce Investment Act Youthful Offender Initiative httpwwwdoletagovYouth_servicesyouthful_offendercfm
Program Description The Employment and Training Administration uses its Youthful Offender Appropriation to fund a variety of projects that target youth offenders and young adult offenders Currently operating projects include grants to community-based organizations to involve juvenile offenders in training and service learning projects grants to intermediary organizations to serve young offenders in high-poverty high-crime communities and grants to help youth enter diversion programs as an alternative to out-of-home placements and to assist eligible youth have their juvenile records sealed or expunged
Quarter Highlights The great majority of juvenile offenders are of ages 17 and below and many are still in high school The youth offender grants focus on helping younger youth stay in school and complete their education and helping older youth find jobs and succeed in the labor market Case management mentoring and supportive services are also provided by these grants
Performance in the Past Eight Quarters
Program Performance
Performance Measure Four Quarters
Ending 063013 Four Quarters
Ending 063014
Placement Rate for Youth Ages 18 and Above
36 362
Recidivism Rate for Youth Ages 14 to 17
35 24
Recidivism Rate for Youth Ages 18 and Above
34 16
Results are cumulative for currently operating grants
Additional Program Year 2013 Quarterly Data
Placement Rate for Youth Ages 18 and Above
277 334 325
Performance Measure
Four Quarters
Ending 093013
Four Quarters
Ending 123113
Four Quarters
Ending 033114
Recidivism Rate for Youth Ages 14 to 17
349 349 349
Recidivism Rate for Youth Ages 18 and Above
335 335 335
Analysis bull Providing opportunities to youthful offenders results in varying outcomes depending on
the mix of projects being operated in a given year bull Projects have markedly different placement and recidivism rates depending on whether
they are serving young adults in their 20s or youth ages 16-17 they recruit youth in the community or through direct referrals from the juvenile justice system whether they are located in small or large cities and the extent to which enrollees are at high or low risk of re-offending
22
WORKFORCE SYSTEM RESULTS
100
80
60
40
20
0 Jun-12 Jun-13 Jun-14
n Placement in Employment or Education n Attainment of a Degree or Certificate n LiteracyNumeracy Gains
Workforce Investment Act Youth Program httpwwwdoletagovyouth_services
Program Description The Workforce Investment Act Youth Formula Program provides employment and education services to eligible low-income youth ages 14 to 21 who face barriers to employment The program serves in-school and out-of-school youth youth with disabilities and low literacy rates as well as others who may require additional assistance to complete an educational program and acquire an industry-recognized credential or enter employment
Quarter Highlights The passage of the Workforce Innovation and Opportunity Act (WIOA) includes a major shift in focus to spending more funds on and serving more out-of-school youth (OSY) The workforce system demonstrated its readiness for this shift in that 48 percent of all youth served in PY 2013 were OSY and 57 percent of all WIA youth local area funds were spent on OSY So far in Program Year 2013 California has spent almost 65 percent of their WIA youth funds on OSY with high levels of OSY expenditures in both urban and rural areas 53 percent of all youth served in CA in Program Year 2013 were OSY For example Los Angeles City spent 80 percent of their funds on OSY and the Northern Rural Training and Employment Consortium spent 76 percent of their funds on OSY Both local areas have achieved these levels through strong partnerships with organizations that serve OSY as well as access to high quality work experiences
Program Performance
Performance Measure
Four Quarters
Ending 063012
(Program Year 2011)
Four Quarters
Ending 063013
(Program Year 2012)
Four Quarters
Ending 063014
(Program Year 2013)
Placement in Employment or Education 589 666 690
Attainment of a Degree or Certificate 648 675 684
LiteracyNumeracy Gains 476 509 525
Performance in the Past Three Program Years
Analysis bull 197045 participants were served in the cumulative four quarter reporting period compared
to 217244 served during the same time period last year This decrease is due primarily to a lower funding level compared to the previous year
bull Placement in Employment or Education achieved a result of 690 percent a 24 percentage point increase when compared with the same time period last year
bull The program achieved a result of 684 percent for the Attainment of a Degree or Certificate measure This is a 09 percentage point increase from the same time period last year
bull The LiteracyNumeracy Gains measure achieved a result of 525 percent an increase of 16 percentage points when compared with the same time period last year
bull All three youth common measures exceeded Program Year 2013 GPRA goals
23
WORKFORCE SYSTEM RESULTS
100
80
60
40
20
0 Sep-12 Dec-12 Mar-13 Jun-13 Sep-13 Dec-13 Mar-14 Jun-14
n Placement in Employment or Education n Attainment of a Degree or Certificate n LiteracyNumeracy Gains
YouthBuild httpwwwdoletagovyouth_servicesyouthbuildcfm
Program Description YouthBuild provides job training and educational opportunities for at-risk youth ages 16 to 24 while constructing or rehabilitating affordable housing for low-income or homeless families in their own neighborhoods The youth split their time between the construction site and the classroom where they earn their high school diploma or equivalency learn to be community leaders and prepare for college and other post-secondary training opportunities
Analysis bull 33392 participants have been enrolled into the YouthBuild program since 2007 and 29553
have exited so far bull Since the program began a total of 11716 participants have received a high school
diploma or equivalency 17572 have attained an industry-recognized certificate and 21835 have been placed into initial jobs post-secondary education andor long-term vocational occupational skills training including apprenticeship
bull The Class of 20102011 performance steadily increased The outcomes for all three measures were above those for the Class of 2009 and significantly above the GPRA goals
bull YouthBuild is currently meeting or exceeding the GPRA goal for all three measures The additional quarter of service for 20102011 grants provided additional positive outcomes as expected As the 2012 grant class progresses it is expected that this trend will continue
Program Performance
Quarter Highlights Just A Start in Cambridge (MA) has been a YouthBuild grantee since 2010 In the fourth quarter of the Program Year 2013 they shared the following success story
Victor earned a High School Diploma and HBIPACT construction certification He was accepted to Endicott College in MA He also secured a full time painting position with George Souza Painting making $25 per hour He continues to develop his career plan with staff
Class of 20102011 Performance in the Past Eight Quarters
Performance Measure GPRA Results for Class
0f 20102011 Results for Class 2012 Overall Results
Percent of Participants Entering Employment or Enrolling in Postsecondary Education the Military or Advanced Training Occupational Skills Training in the First Quarter After Exit
500 612 586 519
Percent of Youth Who Attain a Diploma GED or Certificate by the End of the Third Quarter after Exit
672 770 609 672
Percent of Participants Deficient in Basic Skills Who Achieve Literacy or Numeracy Gains of One Adult Basic Education Level
585 676 549 595
24
WORKFORCE SYSTEM RESULTS
100
80
60
40
20
0 Sep-12 Dec-12 Mar-13 Jun-13 Sep-13 Dec-13 Mar-14 Jun-14
n Attainment of a High School Diploma GED or improvement of basic skills by at least two grade levels or completed Occupational Skills training n Participants who Attained Two or more Goals
Indian and Native American Youth Program httpwwwdoletagovdinap
Program Description The Indian and Native American Supplemental Youth Services Program provides summer and year-round employment and training activities for Indian Alaska Native and Native Hawaiian individuals between the ages of 14 and 21 Program resources are targeted to at-risk and the neediest youth who face substantial barriers to education and employment success This population includes high school dropouts and youth who are basic-skills deficient
Quarter Highlights Youth summer employment is a high priority for Native American Tribes However most rural reservation areas do not have enough employers to put youth to work during the summer As a result Tribes rely on the annual WIA Section 166 funding to place youth in summer employment where they can earn a wage and receive valuable work experience
Over the past four quarter period 2487 of the 4399 youth that participated in the youth program were placed in summer employment Youth participants come from low income families with little or no opportunity to earn money during the summer months Through the Indian and Native American Youth Program these youth are given an opportunity to work and earn money during the summer which helps them contribute to their familyrsquos income
Performance in the Past Eight Quarters
Program Performance
Performance Measure Four Quarters
Ending 063013 Four Quarters
Ending 063014
Educational Attainment for Dropouts 180 220
Attainment of Two or More Goals 920 927
The data reported reflect the period from April 1 2012 through March 31 2013 The data reported reflect the period from April 1 2013 through March 31 2014
Additional Program Year 2013 Quarterly Data
Performance Measure Four Quarters
Ending 093013 Four Quarters
Ending 123113 Four Quarters
Ending 033114
Educational Attainment for Dropouts
250 250 220
Attainment of Two or More Goals
930 930 927
The data reported reflect the period from April 1 2013 through September 30 2013 The data reported reflect the period from April 1 2013 through March 31 2014
Analysis bull The Attainment of Two or More Goals rate increased slightly from 92 percent in June 2013
to 927 percent in June 2014 bull The Indian and Native American Youth Program served 4310 youth during the period July
1 2013 through June 30 2014 This is a 164 percentage point decrease in youth served one year ago
bull The Education Attainment for Dropouts increased from 18 percent in June 2013 to 22 percent in June 2014
25
WORKFORCE SYSTEM RESULTS
Green Jobs Innovation Fund Grants (GJIF) httpwwwdoletagovBRGGreenJobs
Program Description The Green Jobs Innovation Fund (GJIF) was authorized as a Pilot and Demonstration Project under the Workforce Investment Act (WIA) of 1998 to help workers receive job training in green industry sectors and occupations as well as access green career pathways GJIF is seeking to increase the number of individuals completing training programs who receive industry-recognized credentials and to increase the number of individuals completing training programs for employment in green jobs
With these grants the Department is emphasizing two key workforce programs that move participants along green career pathways by 1) forging linkages between Registered Apprenticeship and pre-apprenticeship programs andor 2) integrating the delivery of technical and basic skills training through community-based partnerships The grantees are building on existing programs that are already established and serving workers and moving workers into and along green career pathways The Green Jobs Innovation Fund (GJIF) grants are all anticipated to end by June 30 2015
Quarter Highlights The Jobs for the Future (JFF) GreenWays grant program made great progress toward their goal of increasing access for women to enter higher-paying non-traditional occupations Women currently comprise 254 of the programs total enrollment and are earning higher placement wages overall than men At the same time their completion rates credential attainment rates and job placement rates lag behind those of men reflecting the ongoing challenges that women experience in non-traditional occupations The JFF GreenWays program continues to focus on raising the visibility of this issue as a key element in regional approaches to addressing poverty in female-headed households
Program Performance
Performance Measure Cumulative
Four Quarters Ending 063013
Cumulative Four Quarters
Ending 063014
Entered Employment Rate 569 642
Employment Retention Rate 750 821
Six Monthsrsquo Average Earnings $16249 $17459
Additional Program Year 2013 Quarterly Data
Performance Measure
Cumulative Four
Quarters Ending
093013
Cumulative Four
Quarters Ending
123113
Cumulative Four
Quarters Ending
033114
Entered Employment Rate 560 626 641
Employment Retention Rate 790 795 785
Six Monthsrsquo Average Earnings $16406 $15228 $15039
Cumulative Credential Outcomes in the Past Three Quarters
Performance Measure Quarter Ending
123113
Quarter Ending
033114
Quarter Ending
063014
Number Completed Education Job Training Activities
5521 6438 7076
Number Completed Training and Received Credential
5343 6242 6849
Attainment Rate 97 97 97
Analysis As of June 30 2014 8360 participants were enrolled in educationtraining Of these participants 600 participated in Registered Apprenticeship 874 participated in Pre-Apprenticeship and 40 participated in On-the-Job Training A total of 7076 participants completed educationtraining A total of 6849 participants received a credential Lastly a total of 4870 participants entered employment and of these participants 4343 entered training-related employment
26
WORKFORCE SYSTEM RESULTS
Dec-13 Mar-14 Jun-14
100 $27000
$2600080
$2500060
$24000 40
$23000
20 $22000
0 $21000
n Entered Employment Rate n Employment Retention Rate n Six Months Average Earnings
H-1B Jobs and Innovation Accelerator Challenge Grants httpwwwdoletagovETA_News_Releases20111398cfm
Program Description The Jobs and Innovation Accelerator Challenge (Jobs Accelerator) is designed to help regions achieve the demonstrated benefits of collaborative cluster-based regional development This initiative represents the implementation of Administration policy priorities to accelerate bottom-up innovation in urban and rural regions as opposed to imposing ldquoone-size-fits-allrdquo solutions The Jobs Accelerator also meets Administration goals for smarter use of government resources through reduction of Federal silos and promotion of coordinated Federal funding opportunities that offer more efficient access to Federal resources Investments from Federal agencies for the Jobs Accelerator projects include The US Department of Laborrsquos Employment and Training Administration (DOL-ETA) the US Department of Commercersquos Economic Development Administration (DOC-EDA) and the National Institutes of Standards and Technologyrsquos Hollings Manufacturing Extension Partnership (NIST-MEP) the Small Business Administration (SBA) the Department of Energy Advanced Manufacturing Office (DOE AMO) and the Delta Regional Authority (DRA)
The objectives of the Jobs Accelerator are to
bull Accelerate the formation of new high-growth businesses and expansion of existing businesses
bull Accelerate the creation of higher-wage jobs bull Advance commercialization of research including Federally-funded research bull Support deployment of new processes new technologies and new products to grow sales
and generate employment bull Enhance the capacity of small businesses in the cluster including small and disadvantaged
businesses bull Increase exports and business interaction with international buyers and suppliers bull Develop the skilled workforce needed to support growing clusters and bull Ensure diverse workforce participation in clusters through outreach training and the
creation of career pathways
Quarter Highlights The Northeast Ohio Speed-To-Market Accelerator (STMA) program administered by Lorain County Community College aims to accelerate the speed-to-market for near production or pilot production prototypes stimulate job creation and increase the global competitiveness of cluster companies attract private capital and attract students incumbent workers and the unemployed
This quarter STMA helped accelerate the introduction of a new dry electrode product for heart monitoring This sensor and electronics will be introduced as part of the next generation of wearable human performance arm band from Pittsburgh based Body Media a subsidiary of Jawbone Further STMA continues to bring new companies into the STMA
program through cluster outreach activities and this quarter three new leads were generated as the result of the existing STMA partners MAGNET JumpStart Lorain County Community College and NorTech
Program Performance
Performance Measure Four Quarters
Ending 123113 Four Quarters
Ending 033114 Four Quarters
Ending 063014
Entered Employment Rate 307 283 359
Employment Retention Rate 907 925 927
Six Monthsrsquo Average Earnings $23310 $22953 $26682
Performance in the Past Three Quarters
Analysis A total of 3702 individuals were served 3632 individuals began educationjob training activities and 2052 individuals completed educationjob training services Of participants completing educationjob training 370 unemployed individuals completed training and entered employment and of these 114 individuals entered training-related employment A total of 204 employed individuals completed training and retained their current position and of these 85 employed individuals completed training and advanced into a new position A total of 2006 individuals completed educationtraining activities and received credentials and of these 2273 total credentials were awarded
This data represents three rounds of the for Jobs Accelerator initiative which includes the Jobs Accelerator Round 1 the Advanced Manufacturing Jobs Accelerator Round 2 and the Make it in America (MIIA) Jobs Accelerator grants program
27
WORKFORCE SYSTEM RESULTS
100 $56000
80 $54000
$52000 60 $50000
40 $48000
$46000 20
$44000
0 $42000 Dec-13 Mar-14 Jun-14
n Entered Employment Rate n Employment Retention Rate n Six Months Average Earnings
H-1B Technical Skills Training Grants httpwwwdoletagovbusinessH1B_Tech_Skillscfm
Program Description The H-1B Technical Skills Training (TST) Grants were authorized by the American Competitiveness and Workforce Improvement Act of 1998 (ACWIA) as amended (29 USC 2916a) to provide education training and job placement assistance in the occupations and industries for which employers are using H-1B visas to hire highly-skilled foreign workers on a temporary basis and the related activities necessary to support such training The H-1B TST Grant Program is intended to raise the technical skill levels of American workers so they can obtain or upgrade employment in high-growth industries and occupations Over time these education and training programs will help businesses reduce their use of skilled foreign professionals permitted to work in the US on a temporary basis under the H-1B visa program The grants represent significant investments in sectors such as information technology advanced manufacturing and health care In addition these grants will focus on serving participants who have been identified as long-term unemployed particularly those who have been unemployed the longest These grants also have an emphasis on providing on-the-job training allowing participants to learn new skills while earning a pay check To date ETA has announced two rounds of TST grants totaling $342 million The first round was announced on October 4 2011 and the second round was announced on February 22 2012
Quarter Highlights The Los Angeles HealthWorks On-the-Job training (OJT) initiative administered by Managed Career Solutions Inc (MCS) provides individuals with training that leads to industry recognized credentials and employment opportunities within the regionrsquos healthcare field MCS maintains several strong partnerships to coordinate outreach recruitment training OJT placements and employment opportunities As of June 30 2014 MCS served nearly 800 long-term unemployed participants and overall 1100 participants In the same period over 650 individuals completed training and earned an industry recognized credential Of those completers 128 were employed at participation however the majority were underemployed and gained the necessary job skills and credentials that allowed 80 percent to advance into a new position In recognition MCS received the Malcom Baldrige and State Eureka awards
Analysis bull 52532 individuals were served and 51071 individuals began educationjob training
activities bull 15185 individuals completed educationjob training activities including 3321 unemployed
individuals who completed training and entered employment bull Of these 2925 individuals entered training-related employment 2902 employed individuals
completed training and retained their current position 1452 employed individuals completed training and advanced into a new position
bull 11944 individuals completed educationjob training activities and received credentials with 14099 total credentials awarded
Program Performance
Performance Measure
Four Quarters
Ending 123113
Four Quarters
Ending 033114
Four Quarters
Ending 063014
Entered Employment Rate 778 725 675
Employment Retention Rate 993 944 926
Six Monthsrsquo Average Earnings $54683 $50833 $46245
Since the H-1B TST program provides training to incumbent unemployed and long-term unemployed workers to prepare them for jobs in a variety H-1B industries andor occupations the Entered Employment Rate and Six Monthsrsquo Average Earnings can vary For the quarter ending on June 30 2014 the H-1B TST program saw a decline in the Entered Employment Rate and Six Monthsrsquo Average Earnings in comparison with the results for the previous rolling four quarters Previous results reflected a large number of incumbent workers who enrolled in short-term high-skilled training and exited early leading to a relatively high Six Monthsrsquo Average Earnings As the projects progress unemployed and long-term unemployed workers who required longer-term training begin to exit the program and search for jobs Ultimately as they enter employment wages may be less than those achieved by the higher-skilled incumbent workers who either retain or advance in their positions after training
Performance in the Past Three Quarters
28
WORKFORCE SYSTEM RESULTS
100 $21000
$19000 80
$17000
$1500060 $13000
40 $11000
$900020
$7000
0 $5000Sep-12 Dec-12 Mar-13 Jun-13 Sep-13 Dec-13 Mar-14 Jun-14
n Entered Employment Rate n Employment Retention Rate n Six Months Average Earnings
Community-Based Job Training Grants (CBJT) httpwwwdoletagovbusinessCommunity-BasedJobTrainingGrantscfm
Program Description Community-Based Job Training Grants (CBJT) seek to strengthen the role of community colleges in promoting the United States workforcersquos competitiveness The program does this by building the capacity of community colleges to train workers in skills required to succeed in regionally based high-growth high-demand industries and occupations Important grant activities include training in the healthcare biotech advanced manufacturing energy automotive transportation construction insurance forestry and aerospace industries The first round of CBJT grants were awarded in October 2005 To date ETA has announced five rounds of CBJT grants awarding 320 grants to community colleges and other organizations All CBJT grants ended as of June 30 2014
Quarter Highlights The 14 remaining projects active in this quarter represent the culmination of another successful DOL initiative Some of the significant accomplishments include the development and sustainability of Roane State Community Collegersquos Lean Manufacturing program designed to meet the needs of local manufacturing employers the San Jacinto Community College Districtrsquos Gulf Coast Healthcare Partners project which developed training to support healthcare career and Central Arizona Collegersquos Pinal County Alternative Energy Project More than half of the CBJT participants who began education and training activities completed their programs 79 percent of them received an industry recognized credential ie certificate or degree Eighty-four percent of the participants who gained employment entered into new training-related positions
Program Performance
Performance Measure Four Quarters
Ending 063013 Four Quarters
Ending 063014
Entered Employment Rate 572 662
Employment Retention Rate 891 899
Six Monthsrsquo Average Earnings $18675 $17027
Additional Program Year 2013 Quarterly Data
Performance Measure
Four Quarters
Ending 093013
Four Quarters
Ending 123113
Four Quarters
Ending 033114
Entered Employment Rate 57 605 655
Employment Retention Rate 891 897 891
Six Monthsrsquo Average Earnings $18675 $18285 $16642
Performance in the Past Eight Quarters
Analysis bull 268359 individuals have been served through the initiative bull 258216 individuals began educationjob training activities bull 165264 individuals completed educationjob training activities Of these
bull 131107 individuals received credentials bull 65089 individuals entered new positions of employment and 54344 individuals entered new
positions of training-related employment
Note All data are cumulative Prior to new reporting requirements implemented in the quarter ending December 31 2011 grantees only reported results for individuals that entered employment and individuals that entered training-related employment (noted above) if those participants entered employment and completed training in the same quarter As a result prior to that quarter participants that entered employment in quarters after they completed training were captured in the Common Measures and the total number of individuals that ultimately entered employment and training-related employment are actually higher than the results above indicate
29
WORKFORCE SYSTEM RESULTS
100 92
7880
5760
40
20
0
n Percent of Target Number of Programs Launched by Round
Round 1 Round 2 Round 3
Trade Adjustment Assistance Community College and Career Training (TAACCCT) Grants httpwwwdoletagovtaaccct
Program Description The Trade Adjustment Assistance Community College and Career Training (TAACCCT) Grant Program is authorized by the Trade Act of 1974 under Chapter 4 of Title II The purpose of this grant program is to provide eligible institutions of higher education with funds to expand and improve their ability to deliver education and career training programs that can be completed in two years or less and that result in skills degrees and credentials that prepare program participants for employment in high-wage high-skill occupations and are suited for workers who are eligible for training under the Trade Adjustment Assistance (TAA) for Workers program under Chapter 2 of Title II of the Trade Act The TAACCCT Grant Program is funded under the Health Care and Education Reconciliation Act of 2010 which appropriated $500 million for the program for each of Fiscal Years 2011-2014 for a total of $2 billion
Round 1 ndash FY 2011 Grants On June 30 2014 grants awarded in Round 1 (FY 2011) had completed all but one quarter of their periods of performance By the end of their final year of the grant the forty-nine (49) Round 1 grantees project that they will offer a total of 906 new programs of study As of June 30 2014 grantees began offering 834 (92 percent) of these programs of study
Round 2 ndash FY 2012 Grants The seventy-nine (79) grants awarded in the Fiscal Year 2012 had completed seven quarters of their grants at the end of June 30 2014 Their period of performance began on October 1 2012 and will end on September 30 2016 however their final year will be dedicated to gathering information and data for reporting outcome measures and completing the requirements for a third-party evaluation They project that by the end of the third year they will have launched 761 programs As of the end of June 30 2014 they had began offering 561 (78 percent) of these programs
Round 3 ndash FY 2013 Grants Grants awarded in FY 2013 had completed the first three quarters of their period of performance Their grants began on October 1 2013 and will end on September 30 2017
In their third year they will have launched all of their programs as their final year will be dedicated to collecting follow up data for evaluation and reporting purposes only The fifty-seven (57) grantees plan to launch 551 programs As of June 30 2014 they had already launched 288 (57 percent) of these programs
Percentage of Target Number of Programs Launched as of June 30 2014 by Grant Round
Performance Information Programmatic data is collected at different intervals throughout the period of performance including
bull Quarterly Narrative Progress Reports (QNPR) Grantees will provide quarterly qualitative data on the capacity building taking place through progress and other implementation measures that grantees defined in their Statements of Work
bull Annual Performance Reports (APR) Grantees will provide annual quantitative data on their training and employment outcomes for TAACCCT program participants that are impacted by the capacity building activities being implemented by their grants
30
WORKFORCE SYSTEM RESULTS
$4500000 3500$4000000 3000$3500000
2500
Jun-13 Dec-13 Mar-14 Jun-14
Amou
nt $3000000 2000$2500000
$2000000 1500 $1500000 1000 $1000000
500$500000 $0 0
n Amount of Revenue Generated n Number of Tickets Assigned
Disability Employment Initiative (DEI) httpwwwdoletagovdisability
Program Description All DEI Workforce Employment Network (EN) Trends
Launched in 2010 the Disability Employment Initiative (DEI) seeks to improve education training and employment opportunities for youth and adults with disabilities who are unemployed underemployed andor receiving Social Security disability benefits The DEI is jointly funded by the US Department of Laborrsquos Employment and Training Administration and Office of Disability Employment Policy DEI projects improve collaboration among employment and training and asset development programs implemented at state and local levels including the Social Security Administrationrsquos Ticket to Work Program and build effective partnerships that leverage resources to better serve individuals with disabilities and improve employment outcomes
Quarter Highlights A variety of Department of Labor programs helped Vietnam-era veteran Richard James navigate through life After servicing B-52 bombers in the Air Force James held a series of sales jobs while putting himself through law school at night He rose to become a successful New England attorney and owner of a boat dock building company when he suffered a terrible head injury which caused spine and nerve damage Addiction to pain medication followed and James ended up homeless While recovering from his injuries James took a college course through the Veterans Retraining Assistance Program managed in part by the Department He received career counseling from a Disabled Veterans Outreach Program representative at a local American Job Center and support from the DEI Disability Resource Coordinator Eventually James was hired as an attorney by a Rhode Island law firm The departments grants and programs made possible the services that put me back in a position of being a productive member of society he said
Program Performance
Performance Measure Quarter Ending 63013
Quarter Ending
123113
Quarter Ending 33114
Quarter Ending 63014
Analysis bull The Exit Rate for Adult and Youth exiters with disabilities in Round one DEI sites is almost
double the national average Adult DEI was 89 percent vs All StatesAll LWIAs 49 percent Older Youth DEI 166 percent vs All StatesAll LWIAs 87 percent Younger Youth DEI 339 percent vs All StatesAll LWIAs 151 percent
bull The CredentialSkill Attainment Rate for older and younger youth with disabilities in Round 1 DEI sites was higher than the national average Older Youth DEI credential rate 568 percent vs All StatesAll LWIAs 383 percent Younger Youth DEI skill rate 902 percent vs All States All LWIAs 834 percent
bull The Exit Rate for Adult and Youth exiters with disabilities in Round two DEI sites is higher than the national average Adult DEI 56 percent vs All StatesAll LWIAs 49 percent Older Youth DEI 163 percent vs All StatesAll LWIAs 87 percent and Younger Youth DEI 167 percent vs All StatesAll LWIAs 151 percent
bull The Entered Employment Rate for Adult DEI sites 657 percent is 20 percent higher than in All StatesAll LWIAs 434 percent
bull DEI Workforce Employment Networks (EN) activity shows that the number of Tickets assigned increased from 1780 to 2903 an increase of 1123 and the amount of revenue
Number of Tickets Assigned 1780 1590 2554 2903 generated from DEI EN payments increased from $2373404 to $4057353 an increase of $168 million Amount of Revenue Generated $2373404 $1927104 $3505582 $4057353
31
WORKFORCE SYSTEM RESULTS
ETA Internet-Based Assistance (E-TOOLS) wwwcareerinfonetorg wwwservicelocatororg wwwcareeronestoporg wwwonetonlineorg wwwmyskillsmyfutureorg wwwmynextmoveorg
Program Description Additional Program Year 2013 Quarterly Data
Performance Measure Quarter Ending
093013
Quarter Ending
123113
Quarter Ending
033114
CareerOneStop Portal Visits 5754645 5159240 5340022
ETArsquos Internet-based assistance includes electronic tools that help individuals explore career opportunities and link to job postings either on their own or at local American Job Centers to make informed employment and education choices
The Web sites feature user-friendly occupation and industry information salary data career videos education resources career exploration assistance and other resources that support talent development in todayrsquos fast-paced global marketplace Users can find information some of which is also industry sponsored about occupations that are in-demand in high growth industries Additionally information is available regarding occupational skills and workplace competencies
Quarter Highlights For the year ending June 2014 CareerOneStop launched a new portal for Ex-Offenders added Federal Contractor job tagging a TAACCCT information finder Youth Council information to Americarsquos Service Locator and began working on adding more job feeds
Americarsquos Service Locator (ASL) Visits
730998 758919 724053
ONET Downloads 26646 29407 28505
ONET Visits 7697608 10211177 11500039
Combined Visits 14183251 16129336 17564114
Performance in the Past Eight Quarters
25000000 $36000
Sep-12 Dec-12 Mar-13 Jun-13 Sep-13 Dec-13 Mar-14 Jun-14
n Combined Visits (in millions) n ONET Product Downloads (in thousands)
$31500 20000000
ONE
T Pr
oduc
t Dow
nloa
ds
$27000
Com
bine
d Vi
sits
$2250015000000 $18000
10000000 $13500
$90005000000
$4500
$00
ONET has added web services for developers and increased the available Tools and Technology and Detailed Work Activities information to convey specialized occupational attributes
Program Performance
Performance Measure Quarter
Ending 063013 Quarter
Ending 063014
CareerOneStop Portal Visits 5104850 5472742
Americarsquos Service Locator (ASL)Visits
747114 802148
ONET Downloads 29482 25278
ONET Visits 8716609 13581922
Combined Visits 14568573 19856812
Analysis bull ETA Internet-Based Assistance received 19856812 combined visits for the quarter ending
June 30 2014 an increase of 36 percent over the same period in 2013 bull Visits to CareerOneStop increased to 5472742 or 72 percent over the same period in 2013
with mySkillsmyFuture continuing to be a popular tool with an increase of 23 percent bull Americarsquos Service Locator Visits traffic increased 74 percent over the same period in 2013 bull The ONET traffic received 13581922 visits in this quarter an increase of 558 percent
over the same period in 2013 and the ONET downloads totaled 25278 for the quarter a decrease of 142 percent
32
WORKFORCE SYSTEM RESULTS
Glossary of Performance Measures
Common Performance Measures Common Performance Measures are used by Workforce Investment Act Indian and Native American Program Disability Program Navigator Initiative Wagner-Peyser Trade Adjustment Assistance Senior Community Service Employment Program Reintegration of Ex-Offenders Registered Apprenticeship Program Job Corps National Farmworker Jobs Program High Growth Job Training Initiative and Community-Based Job Training Grants
Adult Measures Entered Employment Of those who are not employed at the date of participation the number of adult participants who are employed in the first quarter after the exit quarter divided by the number of adult participants who exit during the quarter
Employment Retention Of those who are employed in the first quarter after the exit quarter the number of adult participants who are employed in both the second and third quarters after the exit quarter divided by the number of adult participants who exit during the quarter
Six Monthsrsquo Average Earnings Of those adult participants who are employed in the first second and third quarters after the exit quarter total earnings in the second quarter plus the total earnings in the third quarter after the exit quarter divided by the number of adult participants who exit during the quarter
Average Earnings Change in Six Months1
Of those who are employed in Q1 after exit the total post-program earnings (earnings in Q2 + Q3 after exit) minus pre-program earnings (earnings in Q2 + Q3 prior to registration) divided by the number of adults who exit during the quarter
Youth Measures Attainment of a Degree or Certificate Of those enrolled in education (at the date of participation or at any point during the program) the number of youth participants who attain a diploma GED or certificate by the end of the third quarter after the exit quarter divided by the number of youth participants who exit during the quarter
1 This definition was used for earnings in PY 2005 Q=quarter
33
Literacy and Numeracy Gains Of those out-of-school youth who are basic skills deficient the number of youth participants who increase one or more educational functioning levels divided by the number of youth participants who have completed a year in the program (ie one year from the date of first youth program service) plus the number of youth participants who exit before completing a year in the program
Placement in Employment or Education2
Of those who are not in postsecondary education or employment (including the military) at the date of participation the number of youth participants who are in employment (including the military) or enrolled in postsecondary education andor advanced trainingoccupational skills training in the first quarter after the exit quarter divided by the number of youth participants who exit during the quarter
Program-Specific Performance Measures
Disability Employment Initiative (DEI) Number of Tickets Assigned Number of individuals on Social Security Administration (SSA) disability benefits who assigned their Ticket to the workforce board agency or American Job Center as their designated Employment Network under the SSA Ticket to Work program All DEI pilot sites must become an Employment Network under Ticket to Work
Amount of Revenue Generated Under the SSA Ticket to Work program when jobseekers who receive SSA disability benefits assign their Ticket to a workforce board agency or American Job Center as an Employment Network and then achieve certain employment milestones the Employment Network receives money or ldquoTicket revenuerdquo
2 Because of its intensity and duration the YouthBuild performance measure for placement in employment or education does not exclude those who entered the program with a job or in college
WORKFORCE SYSTEM RESULTS
Foreign Labor Certification Percent of H-1B Applications Resolved in Seven Business Days This estimate is based on the total number of applications processed within seven business days divided by the total number of applications processed for a given reporting period An application is considered processed if the last significant event is (1) certified (2) denied or (3) withdrawn
Average Number of Days to Resolve PERM Applications Not Subject to Integrity Review The average processing time between case receipt and decision date for non-audited cases
Average Number of Days to Resolve PERM Applications Subject to Integrity Review The average processing time between case receipt and decision date for audited cases
Percent of Complete H-2A Employer Applications Resolved within 30 Days Before the Date of Need This estimate is based on the total number of complete applications resolved within 30 days before the date of need divided by the total number of applications processed for a given reporting period
Percent of H-2B Applications Processed Within 30 Days of Receipt This estimate is based on the total number of applications processed within 30 days of receipt divided by the total number of applications processed for a given reporting period An application is considered processed if the last significant event is (1) certified (2) denied or (3) withdrawn
Indian and Native American Youth Attainment of Two or More Goals The total number of youth participants enrolled in the Granteersquos Supplemental Youth Services Program who attained at least two of the 14 goals listed below divided by the total number of Supplemental Youth Services participants enrolled during the report period The 14 goals include
1 Completed Job ReadinessOrientation to the World of Work Training 2 Completed Internship or Vocational Exploration Program
3 Completed Career Assessment 4 Entered Unsubsidized Employment 5 Remained in School 6 Returned to School Full Time 7 Enrolled in Job Corps 8 Improved Basic Skills Level By At Least Two Grades 9 Attained High School Diploma 10 Attained GED 11 Completed Occupational Skills Training 12 Completed Leadership Skills Training 13 Entered Other (Non-Supplemental Youth) Training Program 14 Summer Employment
Educational Attainment for Dropouts The number of dropouts who have obtained a high school diploma GED or increased their literacy and numeracy by two grade levels divided by the total number of dropouts
Job Corps Measures Placement in Employment or Education Percent of Job Corps participants3 entering employment or enrolling in post-secondary education andor advanced skills trainingoccupational skills training in the first quarter after exit from the program
Attainment of a Degree or Certificate Percent of students who attain a GED HSD or certificate
Literacy Numeracy Gains Percent of students who achieve literacy or numeracy gains of one or more Adult Basic Education (ABE) levels
3 Calculation of the Placement rate measure does not include outcomes for students who participated in the program for less than 60 days
34
WORKFORCE SYSTEM RESULTS
Internet-Based Assistance Web Site Visits ETArsquos Internet-based assistance includes electronic tools that help individuals make informed employment and education choices The measure for tracking the overall performance and usage of these tools is Web site visits A visit is defined as a series of page requests from the same uniquely identified client with a time of no more than 30 minutes between each page
request
ONet Product Downloads The ONET product downloads count the number of unique users who download an ONET online resource (wwwonetcenterorg) which includes the ONET database (all versions) ONET technical reports (such as on green jobs) supplemental data files (lay titles tools and technology) the ONET Career Exploration Tool files ONET Survey questionnaires and other related materials such as the Toolkit for Business
Registered Apprenticeship Program Entered Employment Rate Percent of apprentices employed in the first quarter after exit who either completed or cancelled from their Registered Apprenticeship Program
Employment Retention Rate Percent of apprentices employed in the first quarter after exit still employed in the second and third quarter after exit who either completed or cancelled from their Registered Apprenticeship Program
Six Monthsrsquo Average Earnings Six month Average Earnings of apprentices employed in the first quarter after exit still employed in the second and third quarter after exit who either completed or cancelled from their Registered Apprenticeship Program
Reintegration of Ex-OffendersmdashAdult Program Recidivism Rate The percentage of participants who are rearrested for a new crime or re-incarcerated for revocation of a parole or probation violation within one year from release from prison
Senior Community Service Employment Program Service Level The count of participants during the report period divided by the total number of authorized grantee community service positions
Community Service The number of community service hours as reported by each grantee divided by the total community service hours funded for the grantee adjusted for minimum wage differences among the states
Most-in-Need Most-in-need means participants with one or more of the following characteristics have a severe disability are frail are age 75 or older are age-eligible but not receiving benefits under Title II of the Social Security Act reside in an area with persistent unemployment and have severely limited employment prospects have limited English proficiency have low literacy skills have a disability reside in a rural area are Veterans have low employment prospects have failed to find employment after utilizing services provided under Title I of the Workforce Investment Act of 1998 (29 USC 2801 et seq) or are homeless or at risk for homelessness (sect 513(b)(1)(E) as amended by Pub L No 109-365)
Unemployment Insurance Percent of Payments Made Timely The percentage of intrastate Unemployment Insurance benefit first payments for full weeks of unemployment issued within 14 days following the first compensable week in states with a waiting week and 21 days in non-waiting week states
Detection of Recoverable Overpayments The amount of overpayments (dollars) established through state operations as a percent of the estimated amount states can detect and establish for recovery
Entered Employment Rate The percent of persons receiving a first payment in a given quarter who had earnings in the next quarter
Percent of Employer Tax Liability Determinations Made Timely The percent of new employer determinations made within 90 days of the end of the quarter in which employers became liable to pay unemployment taxes
35
WORKFORCE SYSTEM RESULTS
YouthBuild Attainment of a Degree or Certificate Of those enrolled the number of youth participants who attain a diploma high school equivalency degree or industry-recognized certificate by the end of the third quarter after the exit quarter divided by the number of youth enrolled (minus youth exited for other reasons)
Literacy and Numeracy Gains Of those youth participants who are basic skills deficient at enrollment the number of youth participants who increase one or more educational functioning levels within one year of enrollment divided by the number of youth participants who have completed a year in the program
Placement in Employment or Education The number of youth participants who are in employment (including the military) or are enrolled in post-secondary education andor advanced trainingoccupational skills training in the first quarter after the exit quarter divided by the number of youth participants who exited during the previous quarter
Youthful Offender Projects Placement Rate The placement rate is the percentage of out-of-school youth ages 18 and above placed in unsubsidized jobs occupational training post-secondary education or the military
Recidivism Rate The recidivism rate is the percentage of youth offenders who have been convicted of a new crime within 12 months of their release of a correctional facility or being placed on probation
36
WORKFORCE SYSTEM RESULTS
2471 American Job Centers formerly known as One-Stop Career Centers
12 VT
9 HI
1 GU
6 DC
2 VI
15 NE
16 SD
12 ME
19 IA
19 AK
19 WV
4 DE
47 AL
55 CO
48 MN
57 WI
89 NC
60 GA
31 MA
23 NM
16 ND
47 AR
70 PA
18 CT 4 RI
12 NV
20 WY
22 KS
18 PR
89 OH
69 TN
102 FL
59 AZ 46
SC
12 NH
29 NJ
52 VA
22 MT
33 OK
39 MS
59 WA
61 IL 34 MD
47 OR
131 KY
62 LA
83 IN
33 UT
44 MO
26 ID 90
NY95 MI
1 to 25
25 to 50
50 to 75
75 to 100
Over 100
203 CA
180 TX
Source Americarsquos Service Locator (wwwServiceLocatororg) Americarsquos Service Locator connects individuals to employment and training opportunities available at local American Job Centers The Web site provides contact information for a range of local work-related services including unemployment benefits career development and educational opportunities As of March 17 2015
37
WORKFORCE SYSTEM RESULTS
United States Department of Labor
200 Constitution Avenue NW
Washington DC 20210
wwwdolgov
- A9RFAFEtmp
- DOL_Workforce_Rprt_Jun_2014_51415-dp
-
- Workforce System Results
-
- Contents
- Quarterly Spotlight
- People Served by Program
- Current Appropriations
- Government Performance and Results Act Goals (GPRA)
- Indian and Native American Adult Program (INAP)
- National Farmworker Jobs Program (NFJP)
- Senior Community Service Employment Program (SCSEP)
- Wagner-Peyser Employment Service
- Workforce Investment Act Adult Program
- Workforce Investment Act Dislocated Worker Program
- H-1B and Permanent Foreign Labor Certification (PERM)
- H-2A and H-2B Foreign Labor Certification Programs
- Reintegration of Ex-Offenders (RExO-ADULT)
- Registered Apprenticeship
- Registered Apprenticeship
- Trade Adjustment Assistance (TAA)
- Unemployment Insurance (UI)
- Unemployment Insurance (UI)
- Job Corps
- Workforce Investment Act Youthful Offender Initiative
- Workforce Investment Act Youth Program
- YouthBuild
- Indian and Native American Youth Program
- H-1B Jobs and Innovation Accelerator Challenge Grants
- H-1B Technical Skills Training Grants
- Community-Based Job Training Grants (CBJT)
- Trade Adjustment Assistance Community College and Career Training (TAACCCT) Grants
- Disability Employment Initiative (DEI)
- ETA Internet-Based Assistance (E-TOOLS)
- Glossary of Performance Measures
- 2471 American Job Centers formerly known as One-Stop Career Centers
-
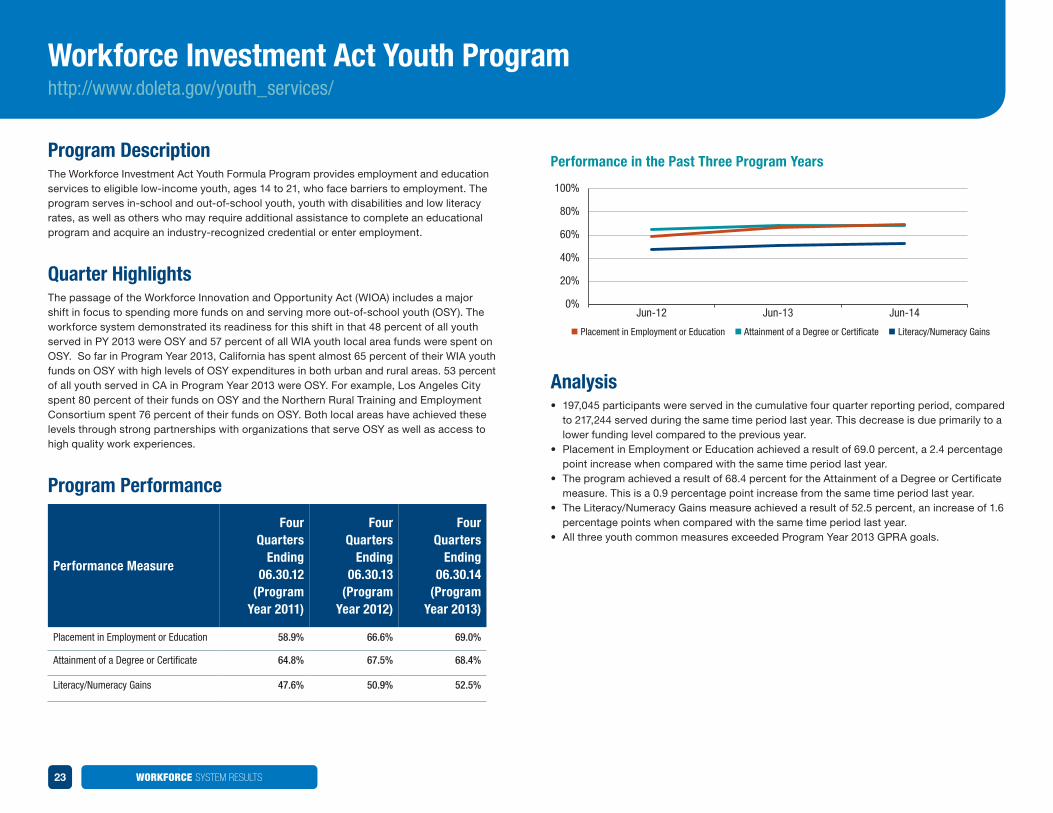
WORKFORCE SYSTEM RESULTS
100
80
60
40
20
0 Sep-12 Dec-12 Mar-13 Jun-13 Sep-13 Dec-13 Mar-14 Jun-14
n Attainment of a High School Diploma GED or improvement of basic skills by at least two grade levels or completed Occupational Skills training n Participants who Attained Two or more Goals
Indian and Native American Youth Program httpwwwdoletagovdinap
Program Description The Indian and Native American Supplemental Youth Services Program provides summer and year-round employment and training activities for Indian Alaska Native and Native Hawaiian individuals between the ages of 14 and 21 Program resources are targeted to at-risk and the neediest youth who face substantial barriers to education and employment success This population includes high school dropouts and youth who are basic-skills deficient
Quarter Highlights Youth summer employment is a high priority for Native American Tribes However most rural reservation areas do not have enough employers to put youth to work during the summer As a result Tribes rely on the annual WIA Section 166 funding to place youth in summer employment where they can earn a wage and receive valuable work experience
Over the past four quarter period 2487 of the 4399 youth that participated in the youth program were placed in summer employment Youth participants come from low income families with little or no opportunity to earn money during the summer months Through the Indian and Native American Youth Program these youth are given an opportunity to work and earn money during the summer which helps them contribute to their familyrsquos income
Performance in the Past Eight Quarters
Program Performance
Performance Measure Four Quarters
Ending 063013 Four Quarters
Ending 063014
Educational Attainment for Dropouts 180 220
Attainment of Two or More Goals 920 927
The data reported reflect the period from April 1 2012 through March 31 2013 The data reported reflect the period from April 1 2013 through March 31 2014
Additional Program Year 2013 Quarterly Data
Performance Measure Four Quarters
Ending 093013 Four Quarters
Ending 123113 Four Quarters
Ending 033114
Educational Attainment for Dropouts
250 250 220
Attainment of Two or More Goals
930 930 927
The data reported reflect the period from April 1 2013 through September 30 2013 The data reported reflect the period from April 1 2013 through March 31 2014
Analysis bull The Attainment of Two or More Goals rate increased slightly from 92 percent in June 2013
to 927 percent in June 2014 bull The Indian and Native American Youth Program served 4310 youth during the period July
1 2013 through June 30 2014 This is a 164 percentage point decrease in youth served one year ago
bull The Education Attainment for Dropouts increased from 18 percent in June 2013 to 22 percent in June 2014
25
WORKFORCE SYSTEM RESULTS
Green Jobs Innovation Fund Grants (GJIF) httpwwwdoletagovBRGGreenJobs
Program Description The Green Jobs Innovation Fund (GJIF) was authorized as a Pilot and Demonstration Project under the Workforce Investment Act (WIA) of 1998 to help workers receive job training in green industry sectors and occupations as well as access green career pathways GJIF is seeking to increase the number of individuals completing training programs who receive industry-recognized credentials and to increase the number of individuals completing training programs for employment in green jobs
With these grants the Department is emphasizing two key workforce programs that move participants along green career pathways by 1) forging linkages between Registered Apprenticeship and pre-apprenticeship programs andor 2) integrating the delivery of technical and basic skills training through community-based partnerships The grantees are building on existing programs that are already established and serving workers and moving workers into and along green career pathways The Green Jobs Innovation Fund (GJIF) grants are all anticipated to end by June 30 2015
Quarter Highlights The Jobs for the Future (JFF) GreenWays grant program made great progress toward their goal of increasing access for women to enter higher-paying non-traditional occupations Women currently comprise 254 of the programs total enrollment and are earning higher placement wages overall than men At the same time their completion rates credential attainment rates and job placement rates lag behind those of men reflecting the ongoing challenges that women experience in non-traditional occupations The JFF GreenWays program continues to focus on raising the visibility of this issue as a key element in regional approaches to addressing poverty in female-headed households
Program Performance
Performance Measure Cumulative
Four Quarters Ending 063013
Cumulative Four Quarters
Ending 063014
Entered Employment Rate 569 642
Employment Retention Rate 750 821
Six Monthsrsquo Average Earnings $16249 $17459
Additional Program Year 2013 Quarterly Data
Performance Measure
Cumulative Four
Quarters Ending
093013
Cumulative Four
Quarters Ending
123113
Cumulative Four
Quarters Ending
033114
Entered Employment Rate 560 626 641
Employment Retention Rate 790 795 785
Six Monthsrsquo Average Earnings $16406 $15228 $15039
Cumulative Credential Outcomes in the Past Three Quarters
Performance Measure Quarter Ending
123113
Quarter Ending
033114
Quarter Ending
063014
Number Completed Education Job Training Activities
5521 6438 7076
Number Completed Training and Received Credential
5343 6242 6849
Attainment Rate 97 97 97
Analysis As of June 30 2014 8360 participants were enrolled in educationtraining Of these participants 600 participated in Registered Apprenticeship 874 participated in Pre-Apprenticeship and 40 participated in On-the-Job Training A total of 7076 participants completed educationtraining A total of 6849 participants received a credential Lastly a total of 4870 participants entered employment and of these participants 4343 entered training-related employment
26
WORKFORCE SYSTEM RESULTS
Dec-13 Mar-14 Jun-14
100 $27000
$2600080
$2500060
$24000 40
$23000
20 $22000
0 $21000
n Entered Employment Rate n Employment Retention Rate n Six Months Average Earnings
H-1B Jobs and Innovation Accelerator Challenge Grants httpwwwdoletagovETA_News_Releases20111398cfm
Program Description The Jobs and Innovation Accelerator Challenge (Jobs Accelerator) is designed to help regions achieve the demonstrated benefits of collaborative cluster-based regional development This initiative represents the implementation of Administration policy priorities to accelerate bottom-up innovation in urban and rural regions as opposed to imposing ldquoone-size-fits-allrdquo solutions The Jobs Accelerator also meets Administration goals for smarter use of government resources through reduction of Federal silos and promotion of coordinated Federal funding opportunities that offer more efficient access to Federal resources Investments from Federal agencies for the Jobs Accelerator projects include The US Department of Laborrsquos Employment and Training Administration (DOL-ETA) the US Department of Commercersquos Economic Development Administration (DOC-EDA) and the National Institutes of Standards and Technologyrsquos Hollings Manufacturing Extension Partnership (NIST-MEP) the Small Business Administration (SBA) the Department of Energy Advanced Manufacturing Office (DOE AMO) and the Delta Regional Authority (DRA)
The objectives of the Jobs Accelerator are to
bull Accelerate the formation of new high-growth businesses and expansion of existing businesses
bull Accelerate the creation of higher-wage jobs bull Advance commercialization of research including Federally-funded research bull Support deployment of new processes new technologies and new products to grow sales
and generate employment bull Enhance the capacity of small businesses in the cluster including small and disadvantaged
businesses bull Increase exports and business interaction with international buyers and suppliers bull Develop the skilled workforce needed to support growing clusters and bull Ensure diverse workforce participation in clusters through outreach training and the
creation of career pathways
Quarter Highlights The Northeast Ohio Speed-To-Market Accelerator (STMA) program administered by Lorain County Community College aims to accelerate the speed-to-market for near production or pilot production prototypes stimulate job creation and increase the global competitiveness of cluster companies attract private capital and attract students incumbent workers and the unemployed
This quarter STMA helped accelerate the introduction of a new dry electrode product for heart monitoring This sensor and electronics will be introduced as part of the next generation of wearable human performance arm band from Pittsburgh based Body Media a subsidiary of Jawbone Further STMA continues to bring new companies into the STMA
program through cluster outreach activities and this quarter three new leads were generated as the result of the existing STMA partners MAGNET JumpStart Lorain County Community College and NorTech
Program Performance
Performance Measure Four Quarters
Ending 123113 Four Quarters
Ending 033114 Four Quarters
Ending 063014
Entered Employment Rate 307 283 359
Employment Retention Rate 907 925 927
Six Monthsrsquo Average Earnings $23310 $22953 $26682
Performance in the Past Three Quarters
Analysis A total of 3702 individuals were served 3632 individuals began educationjob training activities and 2052 individuals completed educationjob training services Of participants completing educationjob training 370 unemployed individuals completed training and entered employment and of these 114 individuals entered training-related employment A total of 204 employed individuals completed training and retained their current position and of these 85 employed individuals completed training and advanced into a new position A total of 2006 individuals completed educationtraining activities and received credentials and of these 2273 total credentials were awarded
This data represents three rounds of the for Jobs Accelerator initiative which includes the Jobs Accelerator Round 1 the Advanced Manufacturing Jobs Accelerator Round 2 and the Make it in America (MIIA) Jobs Accelerator grants program
27
WORKFORCE SYSTEM RESULTS
100 $56000
80 $54000
$52000 60 $50000
40 $48000
$46000 20
$44000
0 $42000 Dec-13 Mar-14 Jun-14
n Entered Employment Rate n Employment Retention Rate n Six Months Average Earnings
H-1B Technical Skills Training Grants httpwwwdoletagovbusinessH1B_Tech_Skillscfm
Program Description The H-1B Technical Skills Training (TST) Grants were authorized by the American Competitiveness and Workforce Improvement Act of 1998 (ACWIA) as amended (29 USC 2916a) to provide education training and job placement assistance in the occupations and industries for which employers are using H-1B visas to hire highly-skilled foreign workers on a temporary basis and the related activities necessary to support such training The H-1B TST Grant Program is intended to raise the technical skill levels of American workers so they can obtain or upgrade employment in high-growth industries and occupations Over time these education and training programs will help businesses reduce their use of skilled foreign professionals permitted to work in the US on a temporary basis under the H-1B visa program The grants represent significant investments in sectors such as information technology advanced manufacturing and health care In addition these grants will focus on serving participants who have been identified as long-term unemployed particularly those who have been unemployed the longest These grants also have an emphasis on providing on-the-job training allowing participants to learn new skills while earning a pay check To date ETA has announced two rounds of TST grants totaling $342 million The first round was announced on October 4 2011 and the second round was announced on February 22 2012
Quarter Highlights The Los Angeles HealthWorks On-the-Job training (OJT) initiative administered by Managed Career Solutions Inc (MCS) provides individuals with training that leads to industry recognized credentials and employment opportunities within the regionrsquos healthcare field MCS maintains several strong partnerships to coordinate outreach recruitment training OJT placements and employment opportunities As of June 30 2014 MCS served nearly 800 long-term unemployed participants and overall 1100 participants In the same period over 650 individuals completed training and earned an industry recognized credential Of those completers 128 were employed at participation however the majority were underemployed and gained the necessary job skills and credentials that allowed 80 percent to advance into a new position In recognition MCS received the Malcom Baldrige and State Eureka awards
Analysis bull 52532 individuals were served and 51071 individuals began educationjob training
activities bull 15185 individuals completed educationjob training activities including 3321 unemployed
individuals who completed training and entered employment bull Of these 2925 individuals entered training-related employment 2902 employed individuals
completed training and retained their current position 1452 employed individuals completed training and advanced into a new position
bull 11944 individuals completed educationjob training activities and received credentials with 14099 total credentials awarded
Program Performance
Performance Measure
Four Quarters
Ending 123113
Four Quarters
Ending 033114
Four Quarters
Ending 063014
Entered Employment Rate 778 725 675
Employment Retention Rate 993 944 926
Six Monthsrsquo Average Earnings $54683 $50833 $46245
Since the H-1B TST program provides training to incumbent unemployed and long-term unemployed workers to prepare them for jobs in a variety H-1B industries andor occupations the Entered Employment Rate and Six Monthsrsquo Average Earnings can vary For the quarter ending on June 30 2014 the H-1B TST program saw a decline in the Entered Employment Rate and Six Monthsrsquo Average Earnings in comparison with the results for the previous rolling four quarters Previous results reflected a large number of incumbent workers who enrolled in short-term high-skilled training and exited early leading to a relatively high Six Monthsrsquo Average Earnings As the projects progress unemployed and long-term unemployed workers who required longer-term training begin to exit the program and search for jobs Ultimately as they enter employment wages may be less than those achieved by the higher-skilled incumbent workers who either retain or advance in their positions after training
Performance in the Past Three Quarters
28
WORKFORCE SYSTEM RESULTS
100 $21000
$19000 80
$17000
$1500060 $13000
40 $11000
$900020
$7000
0 $5000Sep-12 Dec-12 Mar-13 Jun-13 Sep-13 Dec-13 Mar-14 Jun-14
n Entered Employment Rate n Employment Retention Rate n Six Months Average Earnings
Community-Based Job Training Grants (CBJT) httpwwwdoletagovbusinessCommunity-BasedJobTrainingGrantscfm
Program Description Community-Based Job Training Grants (CBJT) seek to strengthen the role of community colleges in promoting the United States workforcersquos competitiveness The program does this by building the capacity of community colleges to train workers in skills required to succeed in regionally based high-growth high-demand industries and occupations Important grant activities include training in the healthcare biotech advanced manufacturing energy automotive transportation construction insurance forestry and aerospace industries The first round of CBJT grants were awarded in October 2005 To date ETA has announced five rounds of CBJT grants awarding 320 grants to community colleges and other organizations All CBJT grants ended as of June 30 2014
Quarter Highlights The 14 remaining projects active in this quarter represent the culmination of another successful DOL initiative Some of the significant accomplishments include the development and sustainability of Roane State Community Collegersquos Lean Manufacturing program designed to meet the needs of local manufacturing employers the San Jacinto Community College Districtrsquos Gulf Coast Healthcare Partners project which developed training to support healthcare career and Central Arizona Collegersquos Pinal County Alternative Energy Project More than half of the CBJT participants who began education and training activities completed their programs 79 percent of them received an industry recognized credential ie certificate or degree Eighty-four percent of the participants who gained employment entered into new training-related positions
Program Performance
Performance Measure Four Quarters
Ending 063013 Four Quarters
Ending 063014
Entered Employment Rate 572 662
Employment Retention Rate 891 899
Six Monthsrsquo Average Earnings $18675 $17027
Additional Program Year 2013 Quarterly Data
Performance Measure
Four Quarters
Ending 093013
Four Quarters
Ending 123113
Four Quarters
Ending 033114
Entered Employment Rate 57 605 655
Employment Retention Rate 891 897 891
Six Monthsrsquo Average Earnings $18675 $18285 $16642
Performance in the Past Eight Quarters
Analysis bull 268359 individuals have been served through the initiative bull 258216 individuals began educationjob training activities bull 165264 individuals completed educationjob training activities Of these
bull 131107 individuals received credentials bull 65089 individuals entered new positions of employment and 54344 individuals entered new
positions of training-related employment
Note All data are cumulative Prior to new reporting requirements implemented in the quarter ending December 31 2011 grantees only reported results for individuals that entered employment and individuals that entered training-related employment (noted above) if those participants entered employment and completed training in the same quarter As a result prior to that quarter participants that entered employment in quarters after they completed training were captured in the Common Measures and the total number of individuals that ultimately entered employment and training-related employment are actually higher than the results above indicate
29
WORKFORCE SYSTEM RESULTS
100 92
7880
5760
40
20
0
n Percent of Target Number of Programs Launched by Round
Round 1 Round 2 Round 3
Trade Adjustment Assistance Community College and Career Training (TAACCCT) Grants httpwwwdoletagovtaaccct
Program Description The Trade Adjustment Assistance Community College and Career Training (TAACCCT) Grant Program is authorized by the Trade Act of 1974 under Chapter 4 of Title II The purpose of this grant program is to provide eligible institutions of higher education with funds to expand and improve their ability to deliver education and career training programs that can be completed in two years or less and that result in skills degrees and credentials that prepare program participants for employment in high-wage high-skill occupations and are suited for workers who are eligible for training under the Trade Adjustment Assistance (TAA) for Workers program under Chapter 2 of Title II of the Trade Act The TAACCCT Grant Program is funded under the Health Care and Education Reconciliation Act of 2010 which appropriated $500 million for the program for each of Fiscal Years 2011-2014 for a total of $2 billion
Round 1 ndash FY 2011 Grants On June 30 2014 grants awarded in Round 1 (FY 2011) had completed all but one quarter of their periods of performance By the end of their final year of the grant the forty-nine (49) Round 1 grantees project that they will offer a total of 906 new programs of study As of June 30 2014 grantees began offering 834 (92 percent) of these programs of study
Round 2 ndash FY 2012 Grants The seventy-nine (79) grants awarded in the Fiscal Year 2012 had completed seven quarters of their grants at the end of June 30 2014 Their period of performance began on October 1 2012 and will end on September 30 2016 however their final year will be dedicated to gathering information and data for reporting outcome measures and completing the requirements for a third-party evaluation They project that by the end of the third year they will have launched 761 programs As of the end of June 30 2014 they had began offering 561 (78 percent) of these programs
Round 3 ndash FY 2013 Grants Grants awarded in FY 2013 had completed the first three quarters of their period of performance Their grants began on October 1 2013 and will end on September 30 2017
In their third year they will have launched all of their programs as their final year will be dedicated to collecting follow up data for evaluation and reporting purposes only The fifty-seven (57) grantees plan to launch 551 programs As of June 30 2014 they had already launched 288 (57 percent) of these programs
Percentage of Target Number of Programs Launched as of June 30 2014 by Grant Round
Performance Information Programmatic data is collected at different intervals throughout the period of performance including
bull Quarterly Narrative Progress Reports (QNPR) Grantees will provide quarterly qualitative data on the capacity building taking place through progress and other implementation measures that grantees defined in their Statements of Work
bull Annual Performance Reports (APR) Grantees will provide annual quantitative data on their training and employment outcomes for TAACCCT program participants that are impacted by the capacity building activities being implemented by their grants
30
WORKFORCE SYSTEM RESULTS
$4500000 3500$4000000 3000$3500000
2500
Jun-13 Dec-13 Mar-14 Jun-14
Amou
nt $3000000 2000$2500000
$2000000 1500 $1500000 1000 $1000000
500$500000 $0 0
n Amount of Revenue Generated n Number of Tickets Assigned
Disability Employment Initiative (DEI) httpwwwdoletagovdisability
Program Description All DEI Workforce Employment Network (EN) Trends
Launched in 2010 the Disability Employment Initiative (DEI) seeks to improve education training and employment opportunities for youth and adults with disabilities who are unemployed underemployed andor receiving Social Security disability benefits The DEI is jointly funded by the US Department of Laborrsquos Employment and Training Administration and Office of Disability Employment Policy DEI projects improve collaboration among employment and training and asset development programs implemented at state and local levels including the Social Security Administrationrsquos Ticket to Work Program and build effective partnerships that leverage resources to better serve individuals with disabilities and improve employment outcomes
Quarter Highlights A variety of Department of Labor programs helped Vietnam-era veteran Richard James navigate through life After servicing B-52 bombers in the Air Force James held a series of sales jobs while putting himself through law school at night He rose to become a successful New England attorney and owner of a boat dock building company when he suffered a terrible head injury which caused spine and nerve damage Addiction to pain medication followed and James ended up homeless While recovering from his injuries James took a college course through the Veterans Retraining Assistance Program managed in part by the Department He received career counseling from a Disabled Veterans Outreach Program representative at a local American Job Center and support from the DEI Disability Resource Coordinator Eventually James was hired as an attorney by a Rhode Island law firm The departments grants and programs made possible the services that put me back in a position of being a productive member of society he said
Program Performance
Performance Measure Quarter Ending 63013
Quarter Ending
123113
Quarter Ending 33114
Quarter Ending 63014
Analysis bull The Exit Rate for Adult and Youth exiters with disabilities in Round one DEI sites is almost
double the national average Adult DEI was 89 percent vs All StatesAll LWIAs 49 percent Older Youth DEI 166 percent vs All StatesAll LWIAs 87 percent Younger Youth DEI 339 percent vs All StatesAll LWIAs 151 percent
bull The CredentialSkill Attainment Rate for older and younger youth with disabilities in Round 1 DEI sites was higher than the national average Older Youth DEI credential rate 568 percent vs All StatesAll LWIAs 383 percent Younger Youth DEI skill rate 902 percent vs All States All LWIAs 834 percent
bull The Exit Rate for Adult and Youth exiters with disabilities in Round two DEI sites is higher than the national average Adult DEI 56 percent vs All StatesAll LWIAs 49 percent Older Youth DEI 163 percent vs All StatesAll LWIAs 87 percent and Younger Youth DEI 167 percent vs All StatesAll LWIAs 151 percent
bull The Entered Employment Rate for Adult DEI sites 657 percent is 20 percent higher than in All StatesAll LWIAs 434 percent
bull DEI Workforce Employment Networks (EN) activity shows that the number of Tickets assigned increased from 1780 to 2903 an increase of 1123 and the amount of revenue
Number of Tickets Assigned 1780 1590 2554 2903 generated from DEI EN payments increased from $2373404 to $4057353 an increase of $168 million Amount of Revenue Generated $2373404 $1927104 $3505582 $4057353
31
WORKFORCE SYSTEM RESULTS
ETA Internet-Based Assistance (E-TOOLS) wwwcareerinfonetorg wwwservicelocatororg wwwcareeronestoporg wwwonetonlineorg wwwmyskillsmyfutureorg wwwmynextmoveorg
Program Description Additional Program Year 2013 Quarterly Data
Performance Measure Quarter Ending
093013
Quarter Ending
123113
Quarter Ending
033114
CareerOneStop Portal Visits 5754645 5159240 5340022
ETArsquos Internet-based assistance includes electronic tools that help individuals explore career opportunities and link to job postings either on their own or at local American Job Centers to make informed employment and education choices
The Web sites feature user-friendly occupation and industry information salary data career videos education resources career exploration assistance and other resources that support talent development in todayrsquos fast-paced global marketplace Users can find information some of which is also industry sponsored about occupations that are in-demand in high growth industries Additionally information is available regarding occupational skills and workplace competencies
Quarter Highlights For the year ending June 2014 CareerOneStop launched a new portal for Ex-Offenders added Federal Contractor job tagging a TAACCCT information finder Youth Council information to Americarsquos Service Locator and began working on adding more job feeds
Americarsquos Service Locator (ASL) Visits
730998 758919 724053
ONET Downloads 26646 29407 28505
ONET Visits 7697608 10211177 11500039
Combined Visits 14183251 16129336 17564114
Performance in the Past Eight Quarters
25000000 $36000
Sep-12 Dec-12 Mar-13 Jun-13 Sep-13 Dec-13 Mar-14 Jun-14
n Combined Visits (in millions) n ONET Product Downloads (in thousands)
$31500 20000000
ONE
T Pr
oduc
t Dow
nloa
ds
$27000
Com
bine
d Vi
sits
$2250015000000 $18000
10000000 $13500
$90005000000
$4500
$00
ONET has added web services for developers and increased the available Tools and Technology and Detailed Work Activities information to convey specialized occupational attributes
Program Performance
Performance Measure Quarter
Ending 063013 Quarter
Ending 063014
CareerOneStop Portal Visits 5104850 5472742
Americarsquos Service Locator (ASL)Visits
747114 802148
ONET Downloads 29482 25278
ONET Visits 8716609 13581922
Combined Visits 14568573 19856812
Analysis bull ETA Internet-Based Assistance received 19856812 combined visits for the quarter ending
June 30 2014 an increase of 36 percent over the same period in 2013 bull Visits to CareerOneStop increased to 5472742 or 72 percent over the same period in 2013
with mySkillsmyFuture continuing to be a popular tool with an increase of 23 percent bull Americarsquos Service Locator Visits traffic increased 74 percent over the same period in 2013 bull The ONET traffic received 13581922 visits in this quarter an increase of 558 percent
over the same period in 2013 and the ONET downloads totaled 25278 for the quarter a decrease of 142 percent
32
WORKFORCE SYSTEM RESULTS
Glossary of Performance Measures
Common Performance Measures Common Performance Measures are used by Workforce Investment Act Indian and Native American Program Disability Program Navigator Initiative Wagner-Peyser Trade Adjustment Assistance Senior Community Service Employment Program Reintegration of Ex-Offenders Registered Apprenticeship Program Job Corps National Farmworker Jobs Program High Growth Job Training Initiative and Community-Based Job Training Grants
Adult Measures Entered Employment Of those who are not employed at the date of participation the number of adult participants who are employed in the first quarter after the exit quarter divided by the number of adult participants who exit during the quarter
Employment Retention Of those who are employed in the first quarter after the exit quarter the number of adult participants who are employed in both the second and third quarters after the exit quarter divided by the number of adult participants who exit during the quarter
Six Monthsrsquo Average Earnings Of those adult participants who are employed in the first second and third quarters after the exit quarter total earnings in the second quarter plus the total earnings in the third quarter after the exit quarter divided by the number of adult participants who exit during the quarter
Average Earnings Change in Six Months1
Of those who are employed in Q1 after exit the total post-program earnings (earnings in Q2 + Q3 after exit) minus pre-program earnings (earnings in Q2 + Q3 prior to registration) divided by the number of adults who exit during the quarter
Youth Measures Attainment of a Degree or Certificate Of those enrolled in education (at the date of participation or at any point during the program) the number of youth participants who attain a diploma GED or certificate by the end of the third quarter after the exit quarter divided by the number of youth participants who exit during the quarter
1 This definition was used for earnings in PY 2005 Q=quarter
33
Literacy and Numeracy Gains Of those out-of-school youth who are basic skills deficient the number of youth participants who increase one or more educational functioning levels divided by the number of youth participants who have completed a year in the program (ie one year from the date of first youth program service) plus the number of youth participants who exit before completing a year in the program
Placement in Employment or Education2
Of those who are not in postsecondary education or employment (including the military) at the date of participation the number of youth participants who are in employment (including the military) or enrolled in postsecondary education andor advanced trainingoccupational skills training in the first quarter after the exit quarter divided by the number of youth participants who exit during the quarter
Program-Specific Performance Measures
Disability Employment Initiative (DEI) Number of Tickets Assigned Number of individuals on Social Security Administration (SSA) disability benefits who assigned their Ticket to the workforce board agency or American Job Center as their designated Employment Network under the SSA Ticket to Work program All DEI pilot sites must become an Employment Network under Ticket to Work
Amount of Revenue Generated Under the SSA Ticket to Work program when jobseekers who receive SSA disability benefits assign their Ticket to a workforce board agency or American Job Center as an Employment Network and then achieve certain employment milestones the Employment Network receives money or ldquoTicket revenuerdquo
2 Because of its intensity and duration the YouthBuild performance measure for placement in employment or education does not exclude those who entered the program with a job or in college
WORKFORCE SYSTEM RESULTS
Foreign Labor Certification Percent of H-1B Applications Resolved in Seven Business Days This estimate is based on the total number of applications processed within seven business days divided by the total number of applications processed for a given reporting period An application is considered processed if the last significant event is (1) certified (2) denied or (3) withdrawn
Average Number of Days to Resolve PERM Applications Not Subject to Integrity Review The average processing time between case receipt and decision date for non-audited cases
Average Number of Days to Resolve PERM Applications Subject to Integrity Review The average processing time between case receipt and decision date for audited cases
Percent of Complete H-2A Employer Applications Resolved within 30 Days Before the Date of Need This estimate is based on the total number of complete applications resolved within 30 days before the date of need divided by the total number of applications processed for a given reporting period
Percent of H-2B Applications Processed Within 30 Days of Receipt This estimate is based on the total number of applications processed within 30 days of receipt divided by the total number of applications processed for a given reporting period An application is considered processed if the last significant event is (1) certified (2) denied or (3) withdrawn
Indian and Native American Youth Attainment of Two or More Goals The total number of youth participants enrolled in the Granteersquos Supplemental Youth Services Program who attained at least two of the 14 goals listed below divided by the total number of Supplemental Youth Services participants enrolled during the report period The 14 goals include
1 Completed Job ReadinessOrientation to the World of Work Training 2 Completed Internship or Vocational Exploration Program
3 Completed Career Assessment 4 Entered Unsubsidized Employment 5 Remained in School 6 Returned to School Full Time 7 Enrolled in Job Corps 8 Improved Basic Skills Level By At Least Two Grades 9 Attained High School Diploma 10 Attained GED 11 Completed Occupational Skills Training 12 Completed Leadership Skills Training 13 Entered Other (Non-Supplemental Youth) Training Program 14 Summer Employment
Educational Attainment for Dropouts The number of dropouts who have obtained a high school diploma GED or increased their literacy and numeracy by two grade levels divided by the total number of dropouts
Job Corps Measures Placement in Employment or Education Percent of Job Corps participants3 entering employment or enrolling in post-secondary education andor advanced skills trainingoccupational skills training in the first quarter after exit from the program
Attainment of a Degree or Certificate Percent of students who attain a GED HSD or certificate
Literacy Numeracy Gains Percent of students who achieve literacy or numeracy gains of one or more Adult Basic Education (ABE) levels
3 Calculation of the Placement rate measure does not include outcomes for students who participated in the program for less than 60 days
34
WORKFORCE SYSTEM RESULTS
Internet-Based Assistance Web Site Visits ETArsquos Internet-based assistance includes electronic tools that help individuals make informed employment and education choices The measure for tracking the overall performance and usage of these tools is Web site visits A visit is defined as a series of page requests from the same uniquely identified client with a time of no more than 30 minutes between each page
request
ONet Product Downloads The ONET product downloads count the number of unique users who download an ONET online resource (wwwonetcenterorg) which includes the ONET database (all versions) ONET technical reports (such as on green jobs) supplemental data files (lay titles tools and technology) the ONET Career Exploration Tool files ONET Survey questionnaires and other related materials such as the Toolkit for Business
Registered Apprenticeship Program Entered Employment Rate Percent of apprentices employed in the first quarter after exit who either completed or cancelled from their Registered Apprenticeship Program
Employment Retention Rate Percent of apprentices employed in the first quarter after exit still employed in the second and third quarter after exit who either completed or cancelled from their Registered Apprenticeship Program
Six Monthsrsquo Average Earnings Six month Average Earnings of apprentices employed in the first quarter after exit still employed in the second and third quarter after exit who either completed or cancelled from their Registered Apprenticeship Program
Reintegration of Ex-OffendersmdashAdult Program Recidivism Rate The percentage of participants who are rearrested for a new crime or re-incarcerated for revocation of a parole or probation violation within one year from release from prison
Senior Community Service Employment Program Service Level The count of participants during the report period divided by the total number of authorized grantee community service positions
Community Service The number of community service hours as reported by each grantee divided by the total community service hours funded for the grantee adjusted for minimum wage differences among the states
Most-in-Need Most-in-need means participants with one or more of the following characteristics have a severe disability are frail are age 75 or older are age-eligible but not receiving benefits under Title II of the Social Security Act reside in an area with persistent unemployment and have severely limited employment prospects have limited English proficiency have low literacy skills have a disability reside in a rural area are Veterans have low employment prospects have failed to find employment after utilizing services provided under Title I of the Workforce Investment Act of 1998 (29 USC 2801 et seq) or are homeless or at risk for homelessness (sect 513(b)(1)(E) as amended by Pub L No 109-365)
Unemployment Insurance Percent of Payments Made Timely The percentage of intrastate Unemployment Insurance benefit first payments for full weeks of unemployment issued within 14 days following the first compensable week in states with a waiting week and 21 days in non-waiting week states
Detection of Recoverable Overpayments The amount of overpayments (dollars) established through state operations as a percent of the estimated amount states can detect and establish for recovery
Entered Employment Rate The percent of persons receiving a first payment in a given quarter who had earnings in the next quarter
Percent of Employer Tax Liability Determinations Made Timely The percent of new employer determinations made within 90 days of the end of the quarter in which employers became liable to pay unemployment taxes
35
WORKFORCE SYSTEM RESULTS
YouthBuild Attainment of a Degree or Certificate Of those enrolled the number of youth participants who attain a diploma high school equivalency degree or industry-recognized certificate by the end of the third quarter after the exit quarter divided by the number of youth enrolled (minus youth exited for other reasons)
Literacy and Numeracy Gains Of those youth participants who are basic skills deficient at enrollment the number of youth participants who increase one or more educational functioning levels within one year of enrollment divided by the number of youth participants who have completed a year in the program
Placement in Employment or Education The number of youth participants who are in employment (including the military) or are enrolled in post-secondary education andor advanced trainingoccupational skills training in the first quarter after the exit quarter divided by the number of youth participants who exited during the previous quarter
Youthful Offender Projects Placement Rate The placement rate is the percentage of out-of-school youth ages 18 and above placed in unsubsidized jobs occupational training post-secondary education or the military
Recidivism Rate The recidivism rate is the percentage of youth offenders who have been convicted of a new crime within 12 months of their release of a correctional facility or being placed on probation
36
WORKFORCE SYSTEM RESULTS
2471 American Job Centers formerly known as One-Stop Career Centers
12 VT
9 HI
1 GU
6 DC
2 VI
15 NE
16 SD
12 ME
19 IA
19 AK
19 WV
4 DE
47 AL
55 CO
48 MN
57 WI
89 NC
60 GA
31 MA
23 NM
16 ND
47 AR
70 PA
18 CT 4 RI
12 NV
20 WY
22 KS
18 PR
89 OH
69 TN
102 FL
59 AZ 46
SC
12 NH
29 NJ
52 VA
22 MT
33 OK
39 MS
59 WA
61 IL 34 MD
47 OR
131 KY
62 LA
83 IN
33 UT
44 MO
26 ID 90
NY95 MI
1 to 25
25 to 50
50 to 75
75 to 100
Over 100
203 CA
180 TX
Source Americarsquos Service Locator (wwwServiceLocatororg) Americarsquos Service Locator connects individuals to employment and training opportunities available at local American Job Centers The Web site provides contact information for a range of local work-related services including unemployment benefits career development and educational opportunities As of March 17 2015
37
WORKFORCE SYSTEM RESULTS
United States Department of Labor
200 Constitution Avenue NW
Washington DC 20210
wwwdolgov
- A9RFAFEtmp
- DOL_Workforce_Rprt_Jun_2014_51415-dp
-
- Workforce System Results
-
- Contents
- Quarterly Spotlight
- People Served by Program
- Current Appropriations
- Government Performance and Results Act Goals (GPRA)
- Indian and Native American Adult Program (INAP)
- National Farmworker Jobs Program (NFJP)
- Senior Community Service Employment Program (SCSEP)
- Wagner-Peyser Employment Service
- Workforce Investment Act Adult Program
- Workforce Investment Act Dislocated Worker Program
- H-1B and Permanent Foreign Labor Certification (PERM)
- H-2A and H-2B Foreign Labor Certification Programs
- Reintegration of Ex-Offenders (RExO-ADULT)
- Registered Apprenticeship
- Registered Apprenticeship
- Trade Adjustment Assistance (TAA)
- Unemployment Insurance (UI)
- Unemployment Insurance (UI)
- Job Corps
- Workforce Investment Act Youthful Offender Initiative
- Workforce Investment Act Youth Program
- YouthBuild
- Indian and Native American Youth Program
- H-1B Jobs and Innovation Accelerator Challenge Grants
- H-1B Technical Skills Training Grants
- Community-Based Job Training Grants (CBJT)
- Trade Adjustment Assistance Community College and Career Training (TAACCCT) Grants
- Disability Employment Initiative (DEI)
- ETA Internet-Based Assistance (E-TOOLS)
- Glossary of Performance Measures
- 2471 American Job Centers formerly known as One-Stop Career Centers
-

WORKFORCE SYSTEM RESULTS
$4500000 3500$4000000 3000$3500000
2500
Jun-13 Dec-13 Mar-14 Jun-14
Amou
nt $3000000 2000$2500000
$2000000 1500 $1500000 1000 $1000000
500$500000 $0 0
n Amount of Revenue Generated n Number of Tickets Assigned
Disability Employment Initiative (DEI) httpwwwdoletagovdisability
Program Description All DEI Workforce Employment Network (EN) Trends
Launched in 2010 the Disability Employment Initiative (DEI) seeks to improve education training and employment opportunities for youth and adults with disabilities who are unemployed underemployed andor receiving Social Security disability benefits The DEI is jointly funded by the US Department of Laborrsquos Employment and Training Administration and Office of Disability Employment Policy DEI projects improve collaboration among employment and training and asset development programs implemented at state and local levels including the Social Security Administrationrsquos Ticket to Work Program and build effective partnerships that leverage resources to better serve individuals with disabilities and improve employment outcomes
Quarter Highlights A variety of Department of Labor programs helped Vietnam-era veteran Richard James navigate through life After servicing B-52 bombers in the Air Force James held a series of sales jobs while putting himself through law school at night He rose to become a successful New England attorney and owner of a boat dock building company when he suffered a terrible head injury which caused spine and nerve damage Addiction to pain medication followed and James ended up homeless While recovering from his injuries James took a college course through the Veterans Retraining Assistance Program managed in part by the Department He received career counseling from a Disabled Veterans Outreach Program representative at a local American Job Center and support from the DEI Disability Resource Coordinator Eventually James was hired as an attorney by a Rhode Island law firm The departments grants and programs made possible the services that put me back in a position of being a productive member of society he said
Program Performance
Performance Measure Quarter Ending 63013
Quarter Ending
123113
Quarter Ending 33114
Quarter Ending 63014
Analysis bull The Exit Rate for Adult and Youth exiters with disabilities in Round one DEI sites is almost
double the national average Adult DEI was 89 percent vs All StatesAll LWIAs 49 percent Older Youth DEI 166 percent vs All StatesAll LWIAs 87 percent Younger Youth DEI 339 percent vs All StatesAll LWIAs 151 percent
bull The CredentialSkill Attainment Rate for older and younger youth with disabilities in Round 1 DEI sites was higher than the national average Older Youth DEI credential rate 568 percent vs All StatesAll LWIAs 383 percent Younger Youth DEI skill rate 902 percent vs All States All LWIAs 834 percent
bull The Exit Rate for Adult and Youth exiters with disabilities in Round two DEI sites is higher than the national average Adult DEI 56 percent vs All StatesAll LWIAs 49 percent Older Youth DEI 163 percent vs All StatesAll LWIAs 87 percent and Younger Youth DEI 167 percent vs All StatesAll LWIAs 151 percent
bull The Entered Employment Rate for Adult DEI sites 657 percent is 20 percent higher than in All StatesAll LWIAs 434 percent
bull DEI Workforce Employment Networks (EN) activity shows that the number of Tickets assigned increased from 1780 to 2903 an increase of 1123 and the amount of revenue
Number of Tickets Assigned 1780 1590 2554 2903 generated from DEI EN payments increased from $2373404 to $4057353 an increase of $168 million Amount of Revenue Generated $2373404 $1927104 $3505582 $4057353
31
WORKFORCE SYSTEM RESULTS
ETA Internet-Based Assistance (E-TOOLS) wwwcareerinfonetorg wwwservicelocatororg wwwcareeronestoporg wwwonetonlineorg wwwmyskillsmyfutureorg wwwmynextmoveorg
Program Description Additional Program Year 2013 Quarterly Data
Performance Measure Quarter Ending
093013
Quarter Ending
123113
Quarter Ending
033114
CareerOneStop Portal Visits 5754645 5159240 5340022
ETArsquos Internet-based assistance includes electronic tools that help individuals explore career opportunities and link to job postings either on their own or at local American Job Centers to make informed employment and education choices
The Web sites feature user-friendly occupation and industry information salary data career videos education resources career exploration assistance and other resources that support talent development in todayrsquos fast-paced global marketplace Users can find information some of which is also industry sponsored about occupations that are in-demand in high growth industries Additionally information is available regarding occupational skills and workplace competencies
Quarter Highlights For the year ending June 2014 CareerOneStop launched a new portal for Ex-Offenders added Federal Contractor job tagging a TAACCCT information finder Youth Council information to Americarsquos Service Locator and began working on adding more job feeds
Americarsquos Service Locator (ASL) Visits
730998 758919 724053
ONET Downloads 26646 29407 28505
ONET Visits 7697608 10211177 11500039
Combined Visits 14183251 16129336 17564114
Performance in the Past Eight Quarters
25000000 $36000
Sep-12 Dec-12 Mar-13 Jun-13 Sep-13 Dec-13 Mar-14 Jun-14
n Combined Visits (in millions) n ONET Product Downloads (in thousands)
$31500 20000000
ONE
T Pr
oduc
t Dow
nloa
ds
$27000
Com
bine
d Vi
sits
$2250015000000 $18000
10000000 $13500
$90005000000
$4500
$00
ONET has added web services for developers and increased the available Tools and Technology and Detailed Work Activities information to convey specialized occupational attributes
Program Performance
Performance Measure Quarter
Ending 063013 Quarter
Ending 063014
CareerOneStop Portal Visits 5104850 5472742
Americarsquos Service Locator (ASL)Visits
747114 802148
ONET Downloads 29482 25278
ONET Visits 8716609 13581922
Combined Visits 14568573 19856812
Analysis bull ETA Internet-Based Assistance received 19856812 combined visits for the quarter ending
June 30 2014 an increase of 36 percent over the same period in 2013 bull Visits to CareerOneStop increased to 5472742 or 72 percent over the same period in 2013
with mySkillsmyFuture continuing to be a popular tool with an increase of 23 percent bull Americarsquos Service Locator Visits traffic increased 74 percent over the same period in 2013 bull The ONET traffic received 13581922 visits in this quarter an increase of 558 percent
over the same period in 2013 and the ONET downloads totaled 25278 for the quarter a decrease of 142 percent
32
WORKFORCE SYSTEM RESULTS
Glossary of Performance Measures
Common Performance Measures Common Performance Measures are used by Workforce Investment Act Indian and Native American Program Disability Program Navigator Initiative Wagner-Peyser Trade Adjustment Assistance Senior Community Service Employment Program Reintegration of Ex-Offenders Registered Apprenticeship Program Job Corps National Farmworker Jobs Program High Growth Job Training Initiative and Community-Based Job Training Grants
Adult Measures Entered Employment Of those who are not employed at the date of participation the number of adult participants who are employed in the first quarter after the exit quarter divided by the number of adult participants who exit during the quarter
Employment Retention Of those who are employed in the first quarter after the exit quarter the number of adult participants who are employed in both the second and third quarters after the exit quarter divided by the number of adult participants who exit during the quarter
Six Monthsrsquo Average Earnings Of those adult participants who are employed in the first second and third quarters after the exit quarter total earnings in the second quarter plus the total earnings in the third quarter after the exit quarter divided by the number of adult participants who exit during the quarter
Average Earnings Change in Six Months1
Of those who are employed in Q1 after exit the total post-program earnings (earnings in Q2 + Q3 after exit) minus pre-program earnings (earnings in Q2 + Q3 prior to registration) divided by the number of adults who exit during the quarter
Youth Measures Attainment of a Degree or Certificate Of those enrolled in education (at the date of participation or at any point during the program) the number of youth participants who attain a diploma GED or certificate by the end of the third quarter after the exit quarter divided by the number of youth participants who exit during the quarter
1 This definition was used for earnings in PY 2005 Q=quarter
33
Literacy and Numeracy Gains Of those out-of-school youth who are basic skills deficient the number of youth participants who increase one or more educational functioning levels divided by the number of youth participants who have completed a year in the program (ie one year from the date of first youth program service) plus the number of youth participants who exit before completing a year in the program
Placement in Employment or Education2
Of those who are not in postsecondary education or employment (including the military) at the date of participation the number of youth participants who are in employment (including the military) or enrolled in postsecondary education andor advanced trainingoccupational skills training in the first quarter after the exit quarter divided by the number of youth participants who exit during the quarter
Program-Specific Performance Measures
Disability Employment Initiative (DEI) Number of Tickets Assigned Number of individuals on Social Security Administration (SSA) disability benefits who assigned their Ticket to the workforce board agency or American Job Center as their designated Employment Network under the SSA Ticket to Work program All DEI pilot sites must become an Employment Network under Ticket to Work
Amount of Revenue Generated Under the SSA Ticket to Work program when jobseekers who receive SSA disability benefits assign their Ticket to a workforce board agency or American Job Center as an Employment Network and then achieve certain employment milestones the Employment Network receives money or ldquoTicket revenuerdquo
2 Because of its intensity and duration the YouthBuild performance measure for placement in employment or education does not exclude those who entered the program with a job or in college
WORKFORCE SYSTEM RESULTS
Foreign Labor Certification Percent of H-1B Applications Resolved in Seven Business Days This estimate is based on the total number of applications processed within seven business days divided by the total number of applications processed for a given reporting period An application is considered processed if the last significant event is (1) certified (2) denied or (3) withdrawn
Average Number of Days to Resolve PERM Applications Not Subject to Integrity Review The average processing time between case receipt and decision date for non-audited cases
Average Number of Days to Resolve PERM Applications Subject to Integrity Review The average processing time between case receipt and decision date for audited cases
Percent of Complete H-2A Employer Applications Resolved within 30 Days Before the Date of Need This estimate is based on the total number of complete applications resolved within 30 days before the date of need divided by the total number of applications processed for a given reporting period
Percent of H-2B Applications Processed Within 30 Days of Receipt This estimate is based on the total number of applications processed within 30 days of receipt divided by the total number of applications processed for a given reporting period An application is considered processed if the last significant event is (1) certified (2) denied or (3) withdrawn
Indian and Native American Youth Attainment of Two or More Goals The total number of youth participants enrolled in the Granteersquos Supplemental Youth Services Program who attained at least two of the 14 goals listed below divided by the total number of Supplemental Youth Services participants enrolled during the report period The 14 goals include
1 Completed Job ReadinessOrientation to the World of Work Training 2 Completed Internship or Vocational Exploration Program
3 Completed Career Assessment 4 Entered Unsubsidized Employment 5 Remained in School 6 Returned to School Full Time 7 Enrolled in Job Corps 8 Improved Basic Skills Level By At Least Two Grades 9 Attained High School Diploma 10 Attained GED 11 Completed Occupational Skills Training 12 Completed Leadership Skills Training 13 Entered Other (Non-Supplemental Youth) Training Program 14 Summer Employment
Educational Attainment for Dropouts The number of dropouts who have obtained a high school diploma GED or increased their literacy and numeracy by two grade levels divided by the total number of dropouts
Job Corps Measures Placement in Employment or Education Percent of Job Corps participants3 entering employment or enrolling in post-secondary education andor advanced skills trainingoccupational skills training in the first quarter after exit from the program
Attainment of a Degree or Certificate Percent of students who attain a GED HSD or certificate
Literacy Numeracy Gains Percent of students who achieve literacy or numeracy gains of one or more Adult Basic Education (ABE) levels
3 Calculation of the Placement rate measure does not include outcomes for students who participated in the program for less than 60 days
34
WORKFORCE SYSTEM RESULTS
Internet-Based Assistance Web Site Visits ETArsquos Internet-based assistance includes electronic tools that help individuals make informed employment and education choices The measure for tracking the overall performance and usage of these tools is Web site visits A visit is defined as a series of page requests from the same uniquely identified client with a time of no more than 30 minutes between each page
request
ONet Product Downloads The ONET product downloads count the number of unique users who download an ONET online resource (wwwonetcenterorg) which includes the ONET database (all versions) ONET technical reports (such as on green jobs) supplemental data files (lay titles tools and technology) the ONET Career Exploration Tool files ONET Survey questionnaires and other related materials such as the Toolkit for Business
Registered Apprenticeship Program Entered Employment Rate Percent of apprentices employed in the first quarter after exit who either completed or cancelled from their Registered Apprenticeship Program
Employment Retention Rate Percent of apprentices employed in the first quarter after exit still employed in the second and third quarter after exit who either completed or cancelled from their Registered Apprenticeship Program
Six Monthsrsquo Average Earnings Six month Average Earnings of apprentices employed in the first quarter after exit still employed in the second and third quarter after exit who either completed or cancelled from their Registered Apprenticeship Program
Reintegration of Ex-OffendersmdashAdult Program Recidivism Rate The percentage of participants who are rearrested for a new crime or re-incarcerated for revocation of a parole or probation violation within one year from release from prison
Senior Community Service Employment Program Service Level The count of participants during the report period divided by the total number of authorized grantee community service positions
Community Service The number of community service hours as reported by each grantee divided by the total community service hours funded for the grantee adjusted for minimum wage differences among the states
Most-in-Need Most-in-need means participants with one or more of the following characteristics have a severe disability are frail are age 75 or older are age-eligible but not receiving benefits under Title II of the Social Security Act reside in an area with persistent unemployment and have severely limited employment prospects have limited English proficiency have low literacy skills have a disability reside in a rural area are Veterans have low employment prospects have failed to find employment after utilizing services provided under Title I of the Workforce Investment Act of 1998 (29 USC 2801 et seq) or are homeless or at risk for homelessness (sect 513(b)(1)(E) as amended by Pub L No 109-365)
Unemployment Insurance Percent of Payments Made Timely The percentage of intrastate Unemployment Insurance benefit first payments for full weeks of unemployment issued within 14 days following the first compensable week in states with a waiting week and 21 days in non-waiting week states
Detection of Recoverable Overpayments The amount of overpayments (dollars) established through state operations as a percent of the estimated amount states can detect and establish for recovery
Entered Employment Rate The percent of persons receiving a first payment in a given quarter who had earnings in the next quarter
Percent of Employer Tax Liability Determinations Made Timely The percent of new employer determinations made within 90 days of the end of the quarter in which employers became liable to pay unemployment taxes
35
WORKFORCE SYSTEM RESULTS
YouthBuild Attainment of a Degree or Certificate Of those enrolled the number of youth participants who attain a diploma high school equivalency degree or industry-recognized certificate by the end of the third quarter after the exit quarter divided by the number of youth enrolled (minus youth exited for other reasons)
Literacy and Numeracy Gains Of those youth participants who are basic skills deficient at enrollment the number of youth participants who increase one or more educational functioning levels within one year of enrollment divided by the number of youth participants who have completed a year in the program
Placement in Employment or Education The number of youth participants who are in employment (including the military) or are enrolled in post-secondary education andor advanced trainingoccupational skills training in the first quarter after the exit quarter divided by the number of youth participants who exited during the previous quarter
Youthful Offender Projects Placement Rate The placement rate is the percentage of out-of-school youth ages 18 and above placed in unsubsidized jobs occupational training post-secondary education or the military
Recidivism Rate The recidivism rate is the percentage of youth offenders who have been convicted of a new crime within 12 months of their release of a correctional facility or being placed on probation
36
WORKFORCE SYSTEM RESULTS
2471 American Job Centers formerly known as One-Stop Career Centers
12 VT
9 HI
1 GU
6 DC
2 VI
15 NE
16 SD
12 ME
19 IA
19 AK
19 WV
4 DE
47 AL
55 CO
48 MN
57 WI
89 NC
60 GA
31 MA
23 NM
16 ND
47 AR
70 PA
18 CT 4 RI
12 NV
20 WY
22 KS
18 PR
89 OH
69 TN
102 FL
59 AZ 46
SC
12 NH
29 NJ
52 VA
22 MT
33 OK
39 MS
59 WA
61 IL 34 MD
47 OR
131 KY
62 LA
83 IN
33 UT
44 MO
26 ID 90
NY95 MI
1 to 25
25 to 50
50 to 75
75 to 100
Over 100
203 CA
180 TX
Source Americarsquos Service Locator (wwwServiceLocatororg) Americarsquos Service Locator connects individuals to employment and training opportunities available at local American Job Centers The Web site provides contact information for a range of local work-related services including unemployment benefits career development and educational opportunities As of March 17 2015
37
WORKFORCE SYSTEM RESULTS
United States Department of Labor
200 Constitution Avenue NW
Washington DC 20210
wwwdolgov
- A9RFAFEtmp
- DOL_Workforce_Rprt_Jun_2014_51415-dp
-
- Workforce System Results
-
- Contents
- Quarterly Spotlight
- People Served by Program
- Current Appropriations
- Government Performance and Results Act Goals (GPRA)
- Indian and Native American Adult Program (INAP)
- National Farmworker Jobs Program (NFJP)
- Senior Community Service Employment Program (SCSEP)
- Wagner-Peyser Employment Service
- Workforce Investment Act Adult Program
- Workforce Investment Act Dislocated Worker Program
- H-1B and Permanent Foreign Labor Certification (PERM)
- H-2A and H-2B Foreign Labor Certification Programs
- Reintegration of Ex-Offenders (RExO-ADULT)
- Registered Apprenticeship
- Registered Apprenticeship
- Trade Adjustment Assistance (TAA)
- Unemployment Insurance (UI)
- Unemployment Insurance (UI)
- Job Corps
- Workforce Investment Act Youthful Offender Initiative
- Workforce Investment Act Youth Program
- YouthBuild
- Indian and Native American Youth Program
- H-1B Jobs and Innovation Accelerator Challenge Grants
- H-1B Technical Skills Training Grants
- Community-Based Job Training Grants (CBJT)
- Trade Adjustment Assistance Community College and Career Training (TAACCCT) Grants
- Disability Employment Initiative (DEI)
- ETA Internet-Based Assistance (E-TOOLS)
- Glossary of Performance Measures
- 2471 American Job Centers formerly known as One-Stop Career Centers
-
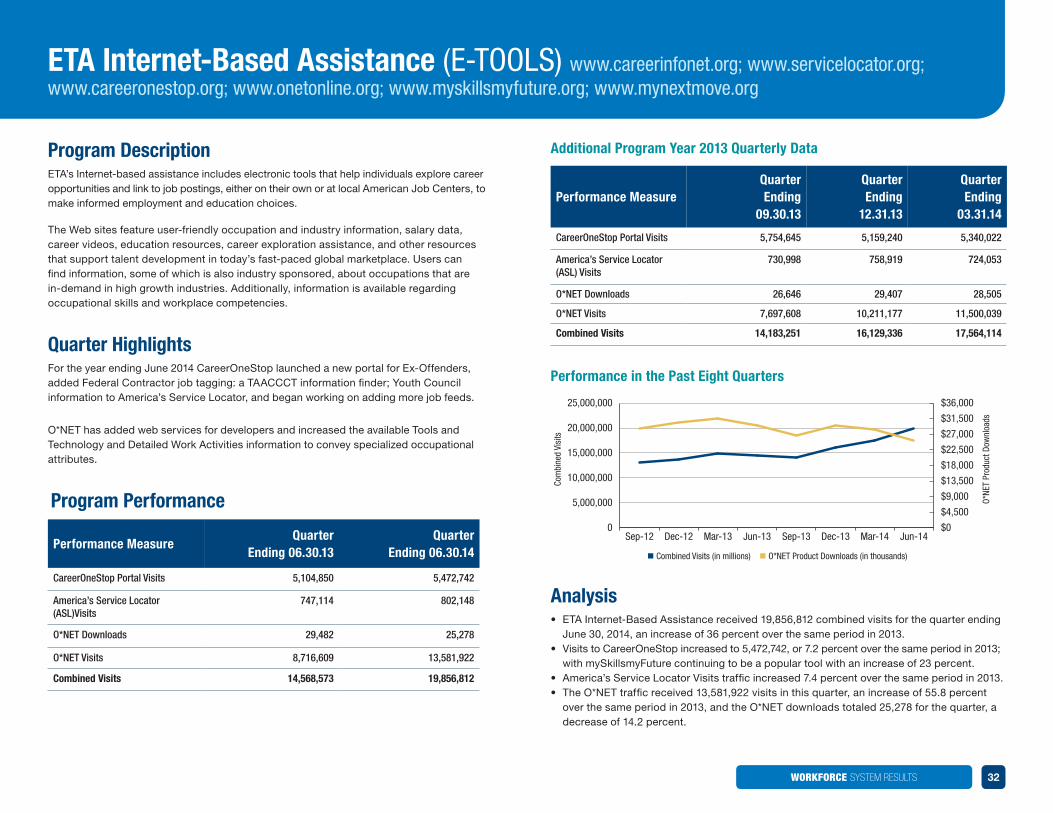
WORKFORCE SYSTEM RESULTS
United States Department of Labor
200 Constitution Avenue NW
Washington DC 20210
wwwdolgov
- A9RFAFEtmp
- DOL_Workforce_Rprt_Jun_2014_51415-dp
-
- Workforce System Results
-
- Contents
- Quarterly Spotlight
- People Served by Program
- Current Appropriations
- Government Performance and Results Act Goals (GPRA)
- Indian and Native American Adult Program (INAP)
- National Farmworker Jobs Program (NFJP)
- Senior Community Service Employment Program (SCSEP)
- Wagner-Peyser Employment Service
- Workforce Investment Act Adult Program
- Workforce Investment Act Dislocated Worker Program
- H-1B and Permanent Foreign Labor Certification (PERM)
- H-2A and H-2B Foreign Labor Certification Programs
- Reintegration of Ex-Offenders (RExO-ADULT)
- Registered Apprenticeship
- Registered Apprenticeship
- Trade Adjustment Assistance (TAA)
- Unemployment Insurance (UI)
- Unemployment Insurance (UI)
- Job Corps
- Workforce Investment Act Youthful Offender Initiative
- Workforce Investment Act Youth Program
- YouthBuild
- Indian and Native American Youth Program
- H-1B Jobs and Innovation Accelerator Challenge Grants
- H-1B Technical Skills Training Grants
- Community-Based Job Training Grants (CBJT)
- Trade Adjustment Assistance Community College and Career Training (TAACCCT) Grants
- Disability Employment Initiative (DEI)
- ETA Internet-Based Assistance (E-TOOLS)
- Glossary of Performance Measures
- 2471 American Job Centers formerly known as One-Stop Career Centers
-