Work Stoppages Caused by Labor- Management … STATES DEPARTMENT OF LABOR L. B. SCHWELLENBACH,...
43
UNITED STATES DEPARTMENT OF LABOR L. B. SCHWELLENBACH, Secretary BUREAU OF LABOR STATISTICS A. F. Hinrichs, Acting Commissioner Work Stoppages Caused by Labor- Management Disputes in 1945 Bulletin No. 878 For sale by the Superintendent of Documents, U. S. Government Printing Office Washington 25, D. C. Price 10 cents
Transcript of Work Stoppages Caused by Labor- Management … STATES DEPARTMENT OF LABOR L. B. SCHWELLENBACH,...

UNITED STATES DEPARTMENT OF LABORL. B. SCHWELLENBACH, Secretary
BUREAU OF LABOR STATISTICSA. F. Hinrichs, Acting Commissioner
Work Stoppages Caused by Labor-Management Disputes in 1945
Bulletin No. 878
For sale by the Superintendent of Documents, U. S. Government Printing OfficeWashington 25, D. C. Price 10 cents

ContentsPage
Summary_ 1Work stoppages during the war 6Work stoppages in 1945:
Monthly trend Industries affected 8States affected 15Cities affected 16Workers involved 17Stoppages involving 10,000 or more workers 18Number of establishments involved 22Unions involved 22Duration of work stoppages 23Major issues involved 25Results of work stoppages 27Methods of terminating work stoppages 29
Strikes under War Labor Disputes Act in 1945 30Work stoppages of concern to the Nationid War Labor Board 30Scope and method 32Appendix:
Table A.—Work stoppages in 1945 in States which had 25 or morestoppages during the year, by industry group 34

Letter of Transmittal
UNITED STATES DEPARTMENT OF LABOR,BIIREA.II OF LABOR STATISTICS,
Washington, D. C., May 29, 1946.The SECRETARY OF LABOR:
I have the honor to transmit herewith a report on work stoppages caused bylabor-management disputes in the United States during 1945.
This report was prepared in the Bureau's Industrial Relations Branch underthe direction of Don Q. Crowther.
A. F. HIN RICHS, Acting Commissioner,Hon. L. B. SCHWELLENBACH,
Secretary of Labor.(IV)

Bulletin No. 878 of theUnited States Bureau of Labor Statistics[Reprinted from the MONTHLY LABOR REVIEW, May 1948, with additional data]
Work Stoppages Caused by Labor-ManagementDisputes in 1945
SummaryThere were 4,750 work stoppages arising from labor-management
disputes in the United States during 1945. This number was greaterthan in any preceding year except 1944, when 4,956 occurred. Thenumber of workers involved in 1945 stoppages (3,467,000) and theresulting idleness (38,025,000 man-days) were greater than in anyyear since 1919—the year following the close of World War I. In1944, the last full year of the war, 2,116,000 workers were involved instoppages, and idleness amounted to less than 9,000,000 man-days.The equivalent of slightly more than 12 percent of the country'semployed wage earners were involved in work stoppages during 1945,and the resulting idleness amounted to about one-half of 1 percent(0.47 percent) of the available working time in American industry.
The total effect of these stoppages on the economy cannot beestimated, for the secondary effects cannot be measured. The38,025,000 man-days of idleness among workers directly involvedwas equivalent to the time that would have been lost by wage earnersin the United States if all industry had ceased to operate for about 1%working days.
These figures for work stoppages during 1945 do not tell the fullstory, as there was a distinct change in the pattern of work stoppagesafter VJ-day (August 14). Also, the comparison with 1919 is notaltogether valid, as 1919 represented a full postwar year, whereasthere were only LIM postwar months in 1945. Most of the stoppagesbefore the end of the war were small, spontaneous and unauthorizedstrikes, many of them over minor issues which were quickly settledor turned over to Government agencies for decisions or settlementsto be worked out after work was resumed. After VJ-day, however,the stoppages, on the average, were bigger, longer, and more difficultof solution, as the disputes involved such fundamental issues as thewage structure and its relation to prices and profits.
With the beginning of reconversion to peacetime production camelay-offs of workers in most war production industries and reductionsin the number of working hours per week, which meant less take-home pay. Most employees had been working a 48-hour week,which, with overtime for the last 8 hours, meant the equivalent ofpay for 52 hours at straight-time rates. The change to a 40-hourweek cut their weekly earnings substantially.
Such reductions naturally intensified the demand for wage-ratechanges which, as a matter of fact, had been more and more insistentlyadvanced by the unions since the fall of 1943. Prior to that time theunions had supported wage stabilization and, in general, even thespecific formulas for stabilization. They had, however, insisted on
(1)

2
more rigorous price control and finally upon a roll-back of prices,for the Bureau of Labor Statistics consumers' price index had con-tinued to advance after the "Little Steel" formula was developed in1942. When it had been demonstrated that prices could not be heldwithin the 15-percent limit that basic wage rates were permitted toadvance, the unions urged more and more strongly a wage-stabiliza-tion policy that would permit general increases in basic wage ratesat least equal to changes in the cost of living. Their demands weretempered by general adherence to the no-strike pledge on the part ofunion leaders and also perhaps by the fact that, with long hours,upgrading and administrative adjustment in the rates paid to indi-viduals, the consequences of the virtual freezing of basic wage ratesunder the "Little Steel" formula were somewhat mitigated. Inaddition, of course, although there was no concession with respect togeneral wage-rate changes, the War Labor Board permitted someimprovement in working conditions through concessions to the unionson a number of "fringe issues." By the end of the war, however,there was less and less opportunity for these adjustments, whileprices continued slowly but persistently to rise. With the ending ofthe war basic wage rates took on added importance, for it was certainthat industry's practice would result in paring away the gains thatindividuals had obtained in a wartime labor market.
It was against this background then that the unions faced a largereduction in take-home pay as a result of the elimination of over-time work. Reductions in the length of the workweek have alwaysstimulated demands for wage-rate increases to maintain take-homepay. In addition to all this there was the belief that profits bothbefore and after taxes were large enough for many companies tosustain some increase of wages without necessitating a price in-crease. Thus some of the larger unions announced soon after VJ-day that they would seek wage increases sufficient to maintain for40 hours of work the weekly earnings their members received duringwartime, contending that employers, with their accumulated wartimeprofits and bright outlook for an era of high production and goodmarkets, could well afford to pay such increases.
During the war the National War Labor Board had been given thefinal authority to determine disputes affecting the war effort, and itwas required to approve substantially all wage increases before theycould be put into effect Almost immediately after the terminationof the war a change in wage policy was announced, permitting em-ployers to increase wages without War Labor Board approval pro-vided the increases were not used as grounds for seeking price in-creases. It was also announced that the National War Labor Boardwould go out of existence at the end of 1945. The Board, therefore,declined to accept any additional dispute cases unless the partiesagreed beforehand that they would abide by its decision. Thesedevelopments opened the way for workers to seek wage increaseswithout specific Government approval and widened the range forfree collective bargaining. Many of the strikes that developed inconnection with the disputes which followed were long and stubborn.The unions were strong and in dead earnest about maintaining highearnings, remembering the reductions in pay and in national incomeafter the last war, which led to a period of hardship and the depres-sion of 1921.
3 •
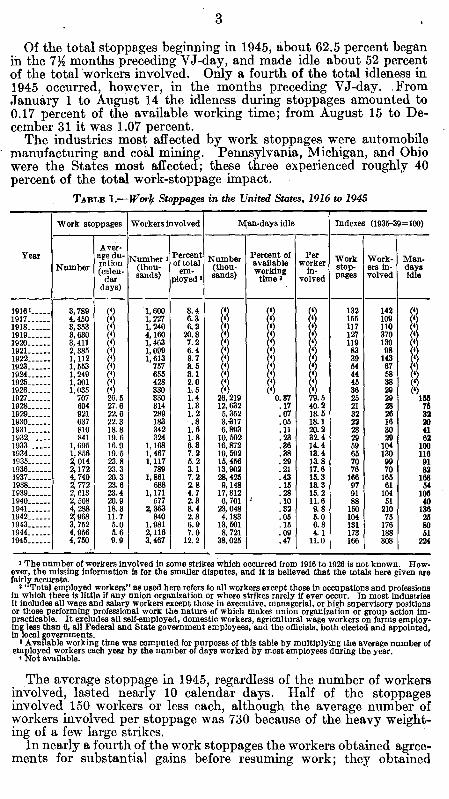
Of the total stoppages beginning in 1945, about 62.5 percent beganin the 7 1/ months preceding VJ-day, and made idle about 52 percentof the total workers involved. Only a fourth of the total idleness in1945 occurred, however, in the months preceding VJ-day. FromJanuary 1 to August 14 the idleness during stoppages amounted to0.17 percent of the available working time; from August 15 to De-cember 31 it was 1.07 percent.
The industries most affected by work stoppages were automobilemanufacturing and coal mining. Pennsylvania, Michigan, and Ohiowere the States most affected; these three experienced roughly 40percent of the total work-stoppage impact.
TABLE 1.—Work Stoppages in the United States, 1916 to 1945
Work stoppages Workers involved Man-days idle Indexes (1935-39=100)
Aver-Year age du- Number 1 Percent Number Percent of Per Work Work- Man-
Number ration (thou- of total (thou- available workerin stop- era in- days
dar sands) ployem.2
sands) workingtime a volved pages volved idle
days)
1916 1 3, 789 1, 600 8.4 (4) 132 142 (4)1917 4,450 0 1,227 6.3 (4) 155 109 (4)1918 8, 353
(41(4 1, 240 6.2 (4 117 110 4
1919 3, 630 (4 4, 160 20.8 0 127 370 41920 3,411 (4) 1,463 7.2 4 119 130 41921 2, 385 (4) 1,099 6.4 4, 83 981922 1,112 (4) 1, 613 8.7 39 143 •1923 1, 553 757 8.5 54 67 41924 1, 249 (4 655 3. 1 4 44 581925 1926
1, 3011,035
(41(4(4
428330
2.01. 6 ) (4)(1 45
363829
(4(4)
1927 707 26. 5 330 1.4 26, 219 0.87 79.5 25 29 1551928 604 27.6 314 1.3 12, 632 .17 40.2 21 28 781929 921 22. 6 289 1. 2 5, 352 .07 18. 5 32 26 al1930 637 22.3 183 .8 3,317 .05 18. 1 22 16 201931 810 18.8 342 1. 6 6, 893 .11 20.2 28 30 411932 841 19. 6 324 L 8 10, 502 .23 32. 4 29 29 611933 1, 695 16.9 1, 168 8.8 16, 872 .38 14.4 59 104 1001934 1, 856 19. 5 1, 467 7. 2 19, 592 .38 13.4 65 130 1161935 2, 014 23. 8 1, 117 3. 2 15, 456 . 29 13. 8 70 99 911936 2,172 23.3 789 3.1 13, 902 .21 17.6 76 70 821937 4, 740 20. 3 1, 861 7. 2 28, 425 A3 15.3 166 165 1681938 2, 772 23. 6 688 2.8 9, 148 .15 13. 3 97 61 541939 2, 613 23.4 1, 171 4. 7 17, 812 .28 15. 2 91 104 me1940 2, 508 20.9 577 2.3 8, 701 ' .10 11.8 88 51 401941 4, 288 18. 3 2, 363 8. 4 23, 048 . 32 9. 8 150 210 1361942 2; 968 11. 7 840 2.8 4, 183 .05 5.0 104 75 261943 3, 752 5.0 1, 981 6. 9 13, 501 . 15 6. 8 131 176 801944 4, 956 5. 6 2,118 7. 0 8, 721 .09 4. 1 173 188 511945 4, 750 9.9 3, 467 12. 2 38, 025 .47 11.0 166 308 224
I The number of workers involved in some strikes which occurred from 1916 to 1926 is not known. How-ever, the missing information is for the smaller disputes, and it is believed that the totals here given arefairly accurate.
2 "Total employed workers" as used here refers to all workers except those in occupations and professionsin which there Is little if any union organization or where strikes rarely if ever occur. In most industriesit includes all wage and salary workers except those in executive, managerial, or high supervisory positionsor those performing professional work the nature of which makes union organization or group action im-practicable. It excludes all self-employed, domestic workers, agricultural wage workers on farms employ-ing less than 6, all Federal and State government employees, and the officials, both elected and appointed,in local governments.
I Available working time was computed for purposes of this table by multiplying the average number ofemployed workers each year by the number of days worked by most employees during the year.
Not available.
The average stoppage in 1945, regardless of the number of workersinvolved, lasted nearly 10 calendar days. Half of the stoppagesinvolved 150 workers or less each, although the average number ofworkers involved per stoppage was 730 because of the heavy weight-ing of a few large strikes.
In nearly a fourth of the work stoppages the workers obtained agree-ments for substantial gains before resuming work; they obtained

CRAM .
INDEX250
200
150
MO
50
MOTO STATESSuR EAU OF
IDLENESS DURING WORK STOPPAGES, EMPLOYMENT,AND INDUSTRIAL PRODUCTION
1935-39100 DEX2
IN 50
200
150
100
50
1
0
II
INDUSTRIAL PRODUCTION
-
MAN -DAYS IOLE-
••ft-.5'EMPLOYMENT
I
1927 1928 1929 1930 1931 1932 1933 1934 1935 1936 1937 1938 1939 1940 1941 1942 1943 1944 1945 1945
DEPARTMENT OF LA MLABOR STATISTICS

N DAYS IDLEIMILUONS
WORK STOPPAGESBY YEARS
THOUSANDS WORK STOPPAGES THOUSANDS
5
tl,r. let • 11 ti 0
1916 1920 1925 1930 1935 1940 _ 1945 1927 1930 1935 1940 1945
1916 1925 193519451920 1930 1935 19451940 19401927 1930
3 30
2
WORKERS INVOLVED
4
3
2
0
UNITED STATE DEPARTMENT OF LABORBUREAU OF LABOR swisncs
■
1 40
30
20
■ 10
■ , • . . • . • . 1. I I 0
MILLIONS5
IDLENESS AS A RERCENTAGE OF
MILLIONS PERCENT AVAILABLE WORKING TI ME PERCRIIT
5 0.5 5
1
/ / I I
C
1. I I e .. I
4
3
.2
4 0.4
3 0.3
2 0.2
1 0.1
0 0

6
compromise settlements in 12 percent of the cases, lost in 16 percent,and in about 45 percent agreed to resume work while the issues werenegotiated further or decided by third parties.
Government agencies assisted in settling about 60 percent of thestoppages. There were 20 Government seizures of plants and facili-ties following work stoppages. Only 213 stoppages (4.5 percent ofthe total) followed strike ballots conducted by the National LaborRelations Board under provisions of the War Labor Disputes Act.
Work Stoppages During the WarUntil VJ-day in 1945, work stoppages generally followed the
pattern of preceding war years; they were numerous but, for the mostpart, small and quickly terminated.. Labor's "no strike" andindustry's "no lock-out" pledge made to the President of the UnitedStates at the inception of the war in December 1941 were generallyobserved by the leaders of both sides. During the entire war periodfew if any strikes were authorized by the national and internationalunions. When local stoppages occurred, union leaders usuallycooperated with Government agencies in securing a resumption ofwork with a minimum loss of production.
There were, however, 14,731 work stoppages from December 8,1941, to August 14, 1945, in which 6,744,000 workers were involved(counting each worker separately each time if involved in two ormore stoppages). Over '36,000,000 man-days of idleness—slightlyover a tenth of 1 percent of the available working time—resulted fromthese stoppages. The record for each war year is given in table 2.
TABLE 2.--=-Work Stoppages During World War II
Period
Work stoppages Man. days idle
Number Workersinvolved Number
Percent ofavailableworking
time
Total—World War II 14,731 6, 744, 000 36, 301, 000 0.11December 8-31, 1941 84 16, 000 303, 000 .061942 2,968 840, 000 4, 183, 000 . 051943 3,752 981, 000 13, 501, 000 .151944 4,956 116, 000 721, 000 . 09January 1-August 14, 1945 2,971 1, 791, 000 593, 000 .17
Work Stoppages in 1945MONTHLY TREND
The concentration, in the few months after VJ-day, of nearly 75percent of the year's work-stoppage idleness was due to the changem the character of strikes (i. e., they involved more workers and werelonger, on the average, than in the preceding period) rather than to asubstantial increase in the number of stoppages. In fact, the monthlytrend in number of stoppages was not unlike the general trend of
I The section covered by pp. 6-21 pertains primarily to stoppages which began during the year; thesucceeding part of the statistical analysts refers to those which ended in 1946.
7
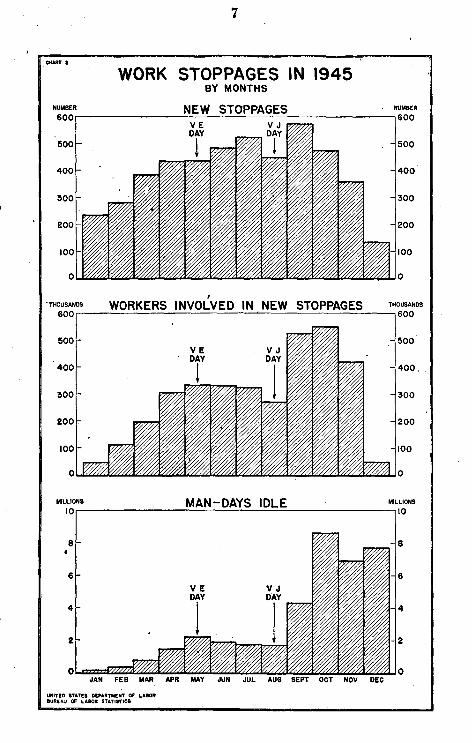
CHART I
WORK STOPPAGES IN 1945BY MONTHS
NUMBER NEW STOPPAGES • NUMBER600
. 500-
400
300-
100-
600
300
-500
-400
VE VJDAY DAY
A .21.
2/- Fi
./..
,
A AA
r-
./AA.
200-r,oryi
.-200
-100
'THOUSANDS WORKERS INVOLVED IN NEW STOPPAGES THOUSANDS600
500
400-
300
200
100
V EDAY
-
600
500
400
300
200
- 100
r
.
V JDAY
A
-
-
-,
A
r
a.
-- rr
,
ZAYA .
r
- r ,r A A ZA Av A
MILLIONS MAN-DAYS IDLE MILLIONS1 0 10
-6
V E V JDAY DAY /
,/- 6
2v.r r/- vez„
v Ar A A A A'Z AA A A AJAN FEB MAR APR MAY JUN JUL AUG SEPT OCT NOV DEC
MUTED STATES DEPARTMENT OF LABORBUREAU OF LABOR STATISTICS

8other recent years. From 234 new stoppages in January the numberincreased each month to 523 in July, dropped to 447 in August, reacheda high of 573 in September, then decreased monthly to a low of 134 inDecember (table 3).
The number of workers involved in new stoppages increased eachmonth from January to May, decreased somewhat during the summermonths, rose in September and October to a high of over half amillion, then declined in November and December Less than two-tenths of 1 percent of the country's wage earners, were involved instoppages in January; in October 3.15 percent were involved some-time during the month.
Idleness ranged by months from about 200,000 man-days in Jan-uary to 8,611,000 in October. The large figure for October wascaused primarily by the strike of supervisory workers in bituminous-coal mines, which was in progress for the first 3 weeks of the month.Idleness in November dropped a little, but increased in December,largely as a result of the strike in General Motors Corp. plants, whichbegan on November 21 and was still in effect at the end of the year.
TABLE 3.—Work Stoppages in 1944 and 1945, by Months
Number of stop-pages— Workers involved in stoppages— May-days idle during
month
In effect during monthMonth Percent
Begin- In effect &avail-ning in during Beg inning
in month Percent Number ablemonth month of total workingNumber em- time 2
ployed 1
•/944
RIM/817 330 363 113,500 133,600 0.44 710,000 0.09February 340 378 146,400 163,200 .54 459,000 .06March 386 429 134, 700 147,800 .49 441, 000 .05April 453 516 165, 500 181, 200 .60 614, 000 .08May 589 666 319,000 343,300 1. 15 1,443,000 .18June 441 519 144, 600 220, 500 . 73 727, 000 .09July 469 538 171,500 208,100 .69 652,000 .08August 501 587 197, 900 238,900 . 79 959,000 . 12September 408 480 207, 400 234, 800 .78 786, 000 . 10October 430 493 221, 900 238, 100 .80 756, 000 . 10November 345 426 201, 400 229, 300 .77 789, 000 . 11December 264 318 91, 700 116, 600 .39 387, 000 .05
/845
January 234 265 46,700 55,100 .19 199,000 .03February ' 279 313 111, 000 118, 300 .41 388, 000 .06March 382 422 196, 900 226,500 .78 775, 000 . 10April 431 486 305,500 327,400 1.13 1, 472, 000 .20May 433 517 332, 700 358, 200 1.24 2, 219, 000 .29June 482 576 331, 600 382, 500 1. 32 1, 886, 000 .25July 523 611 325, 000 413, 000 1.44 1, 769.000 .24August 447 586 270, 900 354, 300 1. 24 1, 712.000 .24September 573 730 525, 600 610, 900 2.26 4, 341, 000 .73October 474 737 550, 500 851, 700 3. 15 8, 611, 000 1.39November 368 619 420, 200 660, 400 2.40 935, 000 1.20December 134 367 50, 400 503, 900 I.82 718, 000 1.39
I See footnote 2 to table 1.2 See footnote 3 to table 1.
INDUSTRIES AFFECTED
Automobile manufacturing was affected by work stoppages in 1945to a greater extent than any other industry group, with idleness

9
during stoppages amounting to more than 4 percent of the availableworking time (table 4). There were several fairly large stoppages inthe industry through the year in addition to the General Motorsstrike, which started in November and involved about 200,000workers. The mining industries (principally coal) came next, with2.88 percent of available time lost.
Counting the workers separately each time when involved in morethan one stoppage, the mining industries had more workers involvedthan any other group and automobiles came second. The rubberindustry had the highest percentage of workers involved-127 percentof the total employed in the industry. Several thousand workers. inAkron plants were involved in more than one stoppage.
Industries manufacturing iron and steel and their products hadmore stoppages (817) than any other group; the mining industriescame next with 670.
TABLE 4.—Work Stoppages Beginning in 1945, by Industry Group 1
Industry group
Numberof stop-Pagesbegin-sing in
Workers involved Man-days idle during 1945
Number1945
Percentof
totalem-
*Ye&
Number
Percentof avail-
ableworkingtime I
All industries 4 4, 750 3, 467, 000 12.2 38, 025, 000 0. 47
Manufacturing 3,185 2, 509, 000 19.6 28, 758, 000 .78Food and kindred products 212 83,900 7.4 959,000 .30Tobacco manufactures 22 15, 800 18.0 284, 000 1. 12Textile-mill products 187 107, 400 9.3 456, 000 .44Apparel and other finished products made from
fabrics and similar materials 118 15, 400 1.7 177, 000 .07Lumber and timber basic products 67 57, 600 11.9 230, 000 1.61Furniture and finished lumber products 90 20, 800 5.9 363, 000 .36Paper and allied products 92 27, 700 8.2 354, 000 .36Printing, publishing, and allied industries 47 13, 200 3. 7 221, 000 . 22Chemicals and allied products 120 43, 600 7.2 427, 000 .25Products of petroleum and coal 38 50, 000 34. 2 450, 000 1.07Rubber products 123 I 258, 400 6 127.3 1, 521, 000 2.61Leather and leather products 111 50, 600 14.9 248, 000 .25Stone, clay, and glass products 104 60, 400 17. 2 1, 203, 000 1. 19Iron and steel and their products 817 425, 100 26.4 3, 731, 000 .81Nonferrous metals and their products 142 75, 000 18. 8 600, 000 .52Machinery (except elactrical) 335 228, 200 20.0 2, 965, 000 .91Electrical machinery 96 121, 200 18.4 390, 000 .74Transportation equipment (except automobiles) _ 223 '360, 500 23.4 430, 000 .55Automobiles and automobile equipment 184 473, 700 75. 9 7, 308, 000 4.08Miscellaneous manufacturing industries 76 20, 600 5.0 441, 000 .37
Nonmanufacturing 1, 569 958, 000 6. 1 9, 267, 000 . 21Agriculture, forestry, and fishing_ 20 5, 000 (9 47, 000 (6)Mining 670 678, 000 89.8 6, 234, 000 2.88Construction 206 45, 800 5.8 447, 000 .20Trade 182 34, 800 .6 336, 000 . 02Finance, insurance, and real estate • 23 15, 700 (4) 80, 000 (6)Transportation, communication, and other pub-
lic utilities 342 157, 000 4 4 1, 551, 000 . 11Services—personal, business and other 97 18, 400 (6) 552, 000 (I)Other nonmanufacturing industries 32 3, 400 (6) 20, 000 (6)
I Work stoppages are classified by industry on the basis of normal or prewar products or services of thefirms involved. Many of the firms were manufacturing other products and doing other types of workduring 1945 because of war needs.
See footnote 2 to table 1.See footnote 3 to table 1.This figure is less than the sum of the figures below. This is because one or more strikes, each affecting
more than one industry, have been counted as separate strikes in each industry affected, with the properallocation of workers and man-days idle to each industry.
The number of workers involved was larger than the total number employed in the industry. This isbecause some workers have participated in more than one work stoppage, and as a consequence have beencounted more than once.
Not available.

10
TABLE 5.-Work Stoppages in 1945, by Specific Industry
IndustryNumber ofstoppagesbeginning
in 1945
Number ofworkers
involved I
Man-daysidle during
1945 1
All industries 2 4, 750 3, 467, 000 38, 025, 000
Manufacturing
Food and kindred products 2 212 83, 900 959, 000Meat products 57 31,800 172,000Dairy products 10 1,130 5,970Canning and preserving fruits, vegetables, and sea foods 24 10, 600 110, 600Grain-mill products 15 3, 200 119, 100Bakery products 52 16, 300 247, 600Sugar 4 3,600 65,000Confectionery and related products 10 3, 330 28,900Beverage industries 35 12,300 188, 600Miscellaneous food preparations and kindred products 10 1, 550 23, 500
Tobacco manufactures 22 15, 800 284, 000Cigarettes 4 4, 390 154, 600Cigars 13 9, 250 117, 200Tobacco (chewing and smoking) and snuff 3 790 9, 190Tobacco stemming 2 1, 430 3,220
Textile-mill products 187 107, 400 1, 456, 000Cotton textile mills 49 40, 300 907, 200Rayon and silk textile mills 19 9, 790 61,900Woolen and worsted textile mills 52 17, 200 54, 100Knitting mills (except hosiery) 9 2, 510 14, 400Dyeing and finishing textiles (except woolen and worsted) 24 24, 700 324, 700Carpets, rugs, and other floor coverings 9 8, 050 34, 800Hats (except cloth and millinery) 2 100 480Hosiery mills 11 2, 340 29,700Miscellaneous 12 2, 330 28,900
Apparel and other finished products made from fabrics and similarmaterials 118 15, 400 177, 000
Men's and boys' suits, coats, and overcoats 5 460 1, 210Men's and boys' shirts, work clothing, and allied garments 41 8,830 122, 700Women's and misses' outerwear 32 2, 730 15, 200Women's undergarments and accessories 3 620 1, 070Millinery 1 60 750Children's and infants' outerwear 8 380 1,110Fur goods 3 830 5,420Miscellaneous apparel and accessories 16 1, 850 12, 700Miscellaneous fabricated textile products 9 1, 690 16, 900
Lumber and timber basic products 67 57, 600 2, 230, 000Sawmill and logging camps 51 53,600 2, 102,200Planing and plywood mills 16 4, 070 67,500
Furniture and finished lumber products 2 90 p0,800 363,000Furniture (household, office, etc.) 43 14, 200 230, 800Office and store fixtures 5 1, 070 27,100Wooden containers 22 2,440 54, 800Wiaf tw and door screens and shades 5 520 7, 520Morticians' goods 3 300 6,220Miscellaneous wood products 13 2, 210 37,000
Paper and allied products 2 92 27, 700 354, 000Pulp, paper, and paperboard 48 16, 200 162, 300Containers-paper and paperboard_ 37 9, 050 169, 300Miscellaneous paper and allied products 8 2, 470 22, 200
•Printing, publishing, and allied industries 47 13, 200 221, 000Newspapers and periodicals 30 7, 940 145,000Books 1 10 10Miscellaneous printing and publishing 16 5,230 - 75,600
Chemicals and allied products 2 120 43, 600 427,000Paints, varnishes, and colors 7 2,810 60,200Vegetable and animal oils 4 450 2,300Drugs, toilet preparations, and insecticides 11 2,870 24,700Soap and glycerin 2 330 2, 680Rayon and other synthetic textile fibers 2 5,500 8,380Wood distillation and naval stores 2 350 3,150Fertilizers 7 980 12, 600Industrial chemicals 74 28,500 284,000Miscellaneous chemical products 12 1,860 29,100See footnotes at end of table.

11
TABLE 5.-Work Stoppages in 1945, by Specific Industry-Continued
IndustryNumber ofstoppagesbeginning
in 1945
Number ofworkers
involved I
Man-daysidle during
1945 1
Manufacturing-TContinued
Products of petroleum and coal 2 38 50, 000 450, 000Petroleum refining 30 48, 800 429,000Coke and byproducts 5 410 3, 400Paving and roofing materials 4 720 18, 000
Rubber products 2 123 258, 400 1, 521, 000Tires and inner tubes 76 215, 600 1, 243, 000Rubber footwear, heels, soles, and related products 10 5, 670 69, 600Industrial rubber goods 30 27, 500 128, 000Rubberized fabrics and vulcanized rubber clothing 6 9,360 79,600Rubber sundries and sponge rubber 1 170 760Miscellaneous rubber industries 1 10 20
Leather and leather products 111 50, 600 248, 000Leather-tanned, curried and finished 37 30,000 74,900Industrial leather belting and packing 6 1, 370 33, 200Footwear (except rubber), including cut stock and findings 60 18,400 133, 000Leather gloves and mittens 1 200 3, 400Luggage 2 360 810Handbags and small leather goods 1 60 60Miscellaneous leather goods 4 230 2, 080
Stone, clay, and glass products 104 60, 400 1, 203, 000Glass and glass products 34 44, 400 1, 058, 000Cement 3 940 16,600Structural clay products 28 6, 510 55, 200Pottery and related products 10 3, 120 34,300Concrete, gypsum, and plaster products 10 1, 010 15, 700Cut-stone and stone products 3 530 4, 870Abrasive asbestos and miscellaneous nonmetallic mineral
products 16 3,920 18, 500
Iron and steel and their products 2 817 425,100 3, 731, 000Ordnance and accessories 27 14,300 236,000Blast furnaces, steel works, and rolling mills 248 181, 700 997, 000Iron and steel foundry products 202 101, 200 731, 0(10Tin cans and other tinware 9 4, 780 67, 000Wire products 26 11, 500 165, 000Hand tools, cutlery, and general IT ardware 33 13, 100 243, 000Heating apparatus, enameled-iron sanitary ware, and boilershop
products 115 41, 100 478, 000Metal stamping and coating 42 9,140 15' , 000,Fabricated structural metal products 28 10,500 40,300Miscellaneous iron and steel products 96 37, 700 623, 000
Nonferrous metals and their products 142 75,000 600,000Smelting, refining, and alloying of nonferrous metals 38 22, 800 202, 000Aluminum and magnesium products 48 29, 800 202, 000Jewelry, silverware, and plated ware 2 3,090 17, 200Watches and clocks 4 2, 130 20, 200Engraving, plating, and polishing 7 1,120 12,200Lighting fixtures 4 300 3, 240Miscellaneous nonferrous-metal products 39 15, 700 143, 000
Machinery (except electrical) 2 335 228, 200 2, 965, 000Engines and turbines 18 34, 500 240,000Agricultural machinery and tractors 46 41, 700 561, 000Construction and mining machinery 42 20, 200 266, 000Metalworking machinery 69 23,300 472,000Special industry machinery (except metalworking machinery) _ _ 35 7, 680 161, 000General industry machinery 95 73, 700 985, 000Office and store machines and devices 6 5, 480 112, 000Household and service-industry machines 31 21, 600 179, 000
Electrical machinery 2 96 121, 200 1, 390, 000Electrical equipment for industrial use 33 , 64, 900 858, 000Electrical appliances 10 - 6, 480 31, 700Insulated wire and cable 11 7, 290 26, 800Automotive electrical equipment 15 16, 700 128, 000Electric lamps - 2 450 900Communications equipment and related products ._ 15 13, 300 136, 000Miscellaneous electrical products 13 12, 100 209, 000
Transportation equipment (except automobiles) 223 360, 500 2, 430, 000Railroad equipment 52 42,800 203, 000Aircraft and parts 85 150, 200 581,000Ship and boat building and repairing 83 164, 300 1, 556, 000Motorcycles, bicycles, and parts 3 3, 250 89, 400
See footnotes at end of table.

12
TABLE 5.-Work Stoppages in 1945, by Specific Industry-Continued
IndustryNumber ofstoppagesbeginning
in 1945
Number ofworkers
involved I
Man-daysidle during
1945 I
Manufacturing-Continued
Automobiles and automobile equipment 184 473,700 7, 308, 000Motor vehicles and motor-vehicle bodies 87 398, 500 6, 471, 000Motor vehicle parts and accessories 96 75,100 837, 000Automobile trailers 1 160 1, 310
Miscellaneous manufacturing industries 76 20, 600 441, 000Professional and scientific instruments, photographic apparatus
and optical goods 24 5,180 23, 400Brooms and brushes 1 400 2, 790Musical instruments 3 1,620 ' 9,160Toys and sporting and athletic goods 10 1,110 10,300Pens, pencils, and other office and artists' materials 2 60 490Costume jewelry and miscellaneous novelties 1 880 5, 160Fabricated plastic products 12 2, 830 24, 800Miscellaneous industries 23 8, 480 364, 000
Nonmanufacturing
Agriculture, forestry, and fishing 20 5, 000 47, 000Agriculture 7 1, 330 6, 870Fishing 13 3,670 40,500
Mining 670 678, 000 6, 234, 000Metal mining 8 I, 950 9, 560Coal mining, anthracite 43 87, 700 1, 163. 000Coal mining, bituminous 598 581, 500 5, 007, 000Crude petroleum and natural gas production 5 5, 630 41, 300Nonmetallic mining and quarrying 16 I, 250 12, 800
Construction 206 45, 800 447, 000Building construction 186 43,500 437,300Highways, streets, bridges, docks, etc 15 950 4,580Miscellaneous 5 1, 350 5, 330
Trade 182 34, 800 336, 000Wholesale 64 5, 730 49, 800Retail 118 29, 000 286, 500
Finance, insurance, and real estate 23 15,700 8,0000Insurance 1 50 2, 100Real estate 22 15, 600 77, 600
Transportation, communication, and other public utilities ' 342 157, 000 1, 551, 000Railroads 13 5, 790 56, 900Streetcar and local bus transportation 69 13,300 62,000Intercity motorbus transportation 33 10,700 258,000Motortruck transportation 116 48,000 560, 000Taxicabs 28 2, 370 14, 600Water transportation 31 48,500 411,000Air transportation 2 2, 690 12, 000Communication 9 15, 200 84, 800Heat, light, and power 13 3, 500 14, 400Miscellaneous 29 7, 040 78, 300
Services-personal, business, and other 97 18, 400 552, 000Hotels 17 1,090 13,900Laundries 25 2, 570 73, 100Cleaning, dyeing, and pressing 8 1, 770 17, 500Barber and beauty shops 4 150 2, 530Business services 7 250 2,680Automobile repair services and garages 6 290 2, 740Amusement and recreation 9 10, 400 419, 000Medical and other health services 8 770 13,600Educational services 4 790 1,910Miscellaneous
•
9 290 5, 220
Other manufacturing industries:Government-administration, protection, and sanitation 32 3,400 20,000
I Owing to rounding of figures, the group totals are not in every case the exact sums of the subgroup totalswhich follow.
2 This figure is less than the sum of the group totals below. This is because a few strikes, each affectingmore than one industry, have been counted as separate strikes in each industry affected, with the properallocation of workers and man-days idle to each industry.

13
In table 6, the work stoppages in each industry group are classifiedaccording to the major issues involved. In nearly all industry groups,wages were the most important issues during the year.
TABLE 6.—Work Stoppages in 1945, by Industry Group and Major Issues Involved
Industrytgroup
Number of stoppages beginning in 1945 in which the majorissues were—
Wagesand
hours
Unionorgan-ration,wages'andhours
Unionorgani-nation
Otherworkingcondi-tions
Int(v•- orinfra-union
matters
Not re-ported
All industries / 2, 021 405 602 I 1, 515 197 10
Manufacturing 1 1, 437 272 393 1 972 108 3Food and kindred products 92 24 33 50 13 Tobacco manufactures 12 5 1 4 Textile-mill products 85 21 37 as 5 1Apparel and other finished products
made from fabrics and similarmaterials 63 20 16 15 4
Lumber and timber basic products__ 38 5 10 8 6
Furniture and finished lumber
products 42 17 18 10 3 Paper and allied products 47 9 18 16 2 Printing, publishing, and allied in-
dustries 23 10 8 3 3 Chemicals and allied products 46 17 11 39 7 Products of petroleum and coal 10 2 9 12 5 Rubber products 60 5 12 43 3 Leather and leather products 70 8 7 22 4 Stone, clay, and glass products 45 15 13 28 3 Iron and steel and their products 371 40 76 307 21 2Nonferrous metals and their products_ , 60 10 17 53 2 Machinery (except electrical) 155 32 32 112 4 Electrical machinery 53 9 10 20 4 Transportation equipment (except
automobiles) 84 6 30 90 13 Automobiles and automobile equip-
ment 66 6 24 . 82 6 Miscellaneous manufacturing indus-
tries 34 11 11 20
Nonmanufacturing 1 587 133 209 1 544 89 7Agriculture, forestry, and fishing 14 1 1 - 4 Mining 179 14 41 412 18 6Construction 94 11 36 24 41 Trade 89 33 39 12 8 1Finance, insurance, and real estate 9 6 4 4 Transportation, communication, and
other public utilities 145 43 58 79 17 Services—personal, business, and
other 40 21 27 5 4 Other nonmanufacturing industries_ _ _ 20 4 3 4 1
I This figure is less than the sum of this column. This is because a few strikes, each affecting more than1 industry, have been,gounted as separate strikes in each industry affected, with the proper allocation ofworkers involved and man-days idle to each industry.
698252° --46----8

14
TABLE 6.-Work Stoppages in 1945, by Industry Group and Major Issues Involved-Con.
Number of workers 'nvolved in stoppages in which the majorissues were-
Industry groupWages
andhour s
Unionorgan-ization,wages,
and hours
Unionorgan-ization
Otherworkingcondi-dons
Inter- orinfra-union
matters
Not re-ported
All industries 1, 689, 000 194, 000 523, 000 891, 000 169, 000 1,400
Manufacturing 1, 248, 000 163, 000 270. 000 691, 000 137, 000 790Food and kindred products 43, 500 5, 220 4, 230 23, 200 7, 720 Tobacco manufactures 9, 850 3, 520 530 1.950 Textile-mill products 45, 900 30. 700 10, 500 18, 000 2, 000 260Apparel and other finished products
made from fabrics and similarmaterials 7, 650 2, 260 3, 150 1, 140 1, 240
Lumber and timber basic products_ __ 52, 200 2, 470 1, 180 890 890 Furniture and finished lumber prod-
ucts 9, 810 7, 090 1, 480 2, 280 100 Paper and allied products 14, 100 5, 710 4, 260 3, 520 140 Printing, publishing, and allied indus-
tries 7, 480 810 3, 520 1, 180 200 Chemicals and allied products 16, 700 3, 890 9, 070 11, 700 2, 270 Products of petroleum and coal _____ _ 39, 000 120 2, 130 7, 660 I, 040 Rubber products 105, 000 38, COO 25, 600 67, 500 21, 500 Leather and leather products 39, 400 1, 690 1, 580 6, 390 1, 470 Stone, clay, and glass products 40, 800 4, 050 6, 480 ,, 8, 370 690 Iron and steel and their products 194, 000 20, 500 27, 200 170, 000 13, 700 530Nonferrous metals and their products 38, 400 5, 490 5, 150 25, 700 210 . _ _Machinery (except electrical) __ 109,000 11,800 11,900 91,000 4,920 Electrical machinery 85, 700 4, 120 19, 700 11, 100 590
Transportation equipment (except
automobiles) 115, 000 9, 070 81, 500 127, 000 28, 500 Automobiles and automobile equip-
ment 262, 000 4, 100 49, 200 108, 000 50, 300 Miscellaneous manufacturing indus-
tries 13, 000 1, 470 1, 220 4, 820
/ kin manufactut ing 442, 000 31,100 253,000 200. 000 31,100 590Agriculture, forestry, and fishing 3, 700 750 20 530 Mining 284, 000 2, 410 236, 000 146, 000 8, 690 500Construction 29, COO 2, 330 4, 060 4, 910 4, 910 Trade 11, 100 16, 800 4,580 1,520 680 90Finance, insurance, and real estate 15, 300 210 50 80 Transportation, communication, and
other public tallith s 91, 300 6, 630 5, 290 47, 300 6, 670 Ser4 ices-personal, business, and
other 3, 720 1, 840 2, 430 180 10, 200 Other nonmanufactui ing industries___ 2, 550 110 380 320 10

15
TABLE 6.-Work Stoppages in 1945, by Industry Group and Major Issues Involved-Con.
Man-c ays idle during 1945 in stoppages in which the majorissues were-
Industry groupWagesand
hours
Unionorgani-zation,wages ,
andhours
Unionorgani-nation
Otherworkingcondi-tions
• Inter-or intra-union
matters
Not re-ported
All industries 22, 732, 000 3, 127, 000 5, 515, 000 5, 301, 000 1, 346, 000 4, 710
Manufacturing 19, 028, 000 2, 818, 000 1, 953, 000 4, 193, 000 764, 000 2,030I ood and kindred products 525, 000 179, 000 74,000 97, 000 84, 500 Tobacco manufactures 131, 000 148, 000 530 5, 150 Textile-mill products 484, 000 438, 000 223, 000 300, 000 10, 900 260Apparel and other finished products
made from fabrics and similar mate-rials 49, 700 79, 300 8, 000 20, 200 19, 900
Lumber and timber basic products_ _ _ 2,129, 000 73, 500 5, 500 10, 700 11, 100 Furniture and finished lumber prod-
ucts 134, 000 188,000 28, 600 11, 000 1, 770 Paper and allied products 216, 000 72, 500 47, 500 16, 900 580 Printing, publishing, and allied indus-
tries 121, 000 34, 400 607 200 1, 690 3, 500 Chemicals and allied products 209,000 83, 200 33, 000 52,600 49,000 Products of petroleum and coal 401, 000 460 9, 470 35, 200 4, 420 Rubber products 400, 000 452, 000 98, 000 492, 000 79, 000 Leather and leather products 179, MO 29, 200 14, 500 22, 200 2, 700 Stone, clay, and glass products 048, 000 49, SOO 42, 600 44, 400 18, 000 Iron and steel and their products 017, 000 384, 000 255, 000 965, 000 107, 000 1, 770Nonferrous metals and their products_ 263, 000 122, 000 27, 100 186, 000 1, 700 Machinery (except electrical) 1, 814, 000 313, 000 146, 000 661, 000 31, 000 Electrical machinery 1,167, 000 61, 500 52, 800 107, 000 2,110
Transportation equipment (except
automobiles) 1, 446, 000 42, 600 411, 000 437, 000 93, 400 Automobiles and automobile equip-
ment 5, 913, 000 36, 200 413, 000 703, 000 244, 000 Miscellaneous manufacturing indus-
tries 381, 000 30, 700 4, 210 24, 400
Nonmanufacturing 3, 704, 000 310, 000 3, 562, 000 1, 108, 000 581, 000 2, 680Agriculture, forestry, and fishing 41, 000 3, 750 210 2, 490 AI ining 2, 151, 000 9, 750 3, 299, 000 691, 000 80, 500 2, 080Construction 305,000 14, 700 73, 400 16, 700 800 Trade 113, 000 171, 000 35, 700 8, 930 7, 240 600Finance, insurance, and real estate 70, 000 7, 200 350 2, 230 Transporation, communication, and
other public utilities 97'0, 000 76, 800 80, 900 384, 000 800 Services-personal, business, and
other 40, 400 26, 800 66, 600 1, 580 417, 000 Other nonmanufacturing industries 13, 400 250 5, 280 810 10
STATES AFFECTED 2
.Pennsylvania, Michigan, and Ohio, all heavily industrialized States,had more workers involved and more resulting idleness than otherStates during 1945 (table 7). Together these three accounted formore than a third of the total stoppages throughout the country,almost 45 percent of the total workers involved, and 40 percent ofthe Nation's idleness during stoppages. Pennsylvania and Michiganeach had about 6,000,000 man-days of idleness during the year, andOhio had well over 3,000,000. Other States with over a million man-days of idleness were California (2,777,000), Illinois (2,559,000),Indiana (1,989,000), New Jersey (1,778,000), West Virginia(1,664,000), and New York (1,396,000).
For more detailed data on work stoppages in the various States, classified according to major industrial groups, see appendix, p. 34.

16
TABLE 7.--Work Stoppages in 1945, by States
StateNumber ofstoppagesbeginning
in 1945
Workers involved Man-days idle during1945
Number Percentof total Number Percent
of total
All States I 4, 750 3, 467, 000 100. 0 38, 025. 000 100. 0Alabama 147 74, 800 2. 2 459, 000 1. 2Arizona 11 4, 100 . 1 59, 000 .2Arkansas 21 3, 200 .1 32, 000 .1California 150 121, 200 3.5 2, 777, 000 7.3Colorado 28 13, 900 .4 86, 000 .2Connecticut 79 39. 300 1. 1 750,000 2.0Delaware 13 3, 600 . 1 . 49, 000 .1District of Columbia 12 5, 100 .1 35, 000 .1Florida 29 13, 100 .4 143, 000 .4Georgia 42 15, 300 .4 149, 000 .4Idaho 12 1,900 .1 75.000 .2Illinois 491 275, 000 7. 9 2, 559. 000 6. 7Indiana 4 203 110, 000 4. 3 1, 807.000 4. 8Iowa 43 18, 200 .5 256, 000 .7Kansas 14 6, 000 .2 43, 000 .1Kentucky 149 99, 100 2. 9 964, 000 2.5Louisiana 50 20, 700 .6 251. 000 . 7Maine 11 14, 300 .4 203,000 .5Maryland 57 33, 300 1. 0 246, 000 .6Massachusetts 239 60. 700 1. 7 397, 000 1. 0Michigan 4 478 528, 000 15.2 6, 143, 000 16. 2Minnesota 29 10, 900 .3 246.000 .6Mississippi 15 9, 100 .3 44, 000 . 1Missouri 148 70, 600 2. 0 901, 000 2. 4Montana 9 3, 000 .1 171, 000 .5Nebraska 11 4,000 .1 52, 000 .1Nevada 6 400 (2) 3, 000 (2)New Hampshire 13 5,4100 .2 63, 000 .2New Jersey 252 168, 100 4.8 1, 778, 000 4. 7New Mexico ' 10 1, 600 (2) ' 22. 000 . 1New York 361 174, 800 5. 0 1, 396.000 3. 7North Carolina 37 17, 500 .5 438, 000 1. 2North Dakota 2 400 (2) 12, 000 (2)Ohio 477 417, 900 12. 1 3, 435.000 9.0Oklahoma 23 5, 300 .2 73.000 .2Oregon 36 25, 900 .7 954,000 2. 5Pennsylvania 743 599,300 17. 5 5, 922, 000 15.6Rhode Island 47 22, 900 .7 456, 000 1. 2South Carolina 14 7, 200 . 2 200. 000 .5South Dakota 3 700 (2) 12,000 (2)Tennessee 118 69, 800 2.0 461, 000 1. 2Texas 72 73, 800 2. 1 510. 000 1. 3Utah 19 3. 100 .1 16,000 (2)Vermont 2 (3) (2) (3) (2)
Virginia 88 40, 300 1.2 255, 000 .7Washington 38 32, 500 .9 812, 000 2. 2West Virginia 128 156, 700 4.5 1, 664, 000 4.4Wisconsin 96 44, 100 1. 3 600, 000 1. 6Wyoming 5 500 (2) 3, 000 (2)
I The sum of this column is more than 4,750, because the stoppages extending across State lines have beencounted as separate stoppages in each State affected, with the proper allocation of workers involved andman-days idle. 2 Less than a tenth of 1 pereent 2 Loss than 100.
4 Figures on workers involved and man-days idle revised since publication in the Monthly LaborReview, May 1946.
CITIES AFFECTED
There were 89 cities in the United States in each of which 10 ormore work stoppages occurred during 1945. New York, with 226,had the highest number; Detroit, v itl 223, was second; and Chicago,with 170, was next in order.
Detroit experienced the most idleness-2,548,000 man-days. SanFrancisco was next, with 1,111,000; and Flint, Mich., followed with1,100,000. The strike at General Motors plants in late 1945 ac-counted largely for the high Detroit and Flint figures, and the sub-stantial San Francisco time loss was due in part to the strike ofmachinists late in the year.

17
Detroit, Akron, and Chicago had the largest numbers of workersinvolved. In Akron many workers in some of the rubber plants wereinvolved in more than one stoppage and were counted separatelyeach time they were so involved.
The figures in table 8 are exclusive of any coal-mining stoppageswhich may have occurred within city limits. Intercity stoppageshave been counted in this table as separate stoppages in each cityaffected, with the proper allocation of the workers involved andman-days idle.
TABLE 8.-Work Stoppages in 1945 in Cities Which Had 10 or More Such StoppagesDuring the Year
City
Numberof stop-opatesbe m-ning in
1945
beginWork-ers in-
Man-daysidle
City
•
Numberof stor-pagesbegin-ning in
1945
Work-erg in-volved
Man-daysidle
Akron, Ohio 57 160, 000 904, 000 Kearny, N. J 13 2, 160 18, 100Aliquippa, Pa 20 5, 020 25, 600 Lawrence, Mass 17 5,870 12, 300Allentown, Pa 12 6,060 39, 500 Linden, N. J 10 4, 170 40, 700Atlanta, da 17 3, 250 34, 200 Los Angeles, Calif_ _ __ 50 44, 000 510, 000Baltimore, Md 19 9, 000 118, 000 Louisville, Ky 16 5,200 24, 900Belleville, Ill 14 2, 020 5, 560 M Lowell, ass 16 4, 600 32, 400Birmingham, Ala 28 10, 800 79, 800 Lynn, Mass 11 1, 240 2, 800Boston, Mass 44 6, 090 63, 800 Memphis, Tenn 28 24, 500 68, 400Buffalo, N. Y 22 3, 660 45, 500 Milwaukee, Wis 37 15, 200 298, 000Camden, N. J 13 26, 900 120, 000 Minneapolis, Minn___ 13 2, 870 41,100Charleston, W. Va 11 5, 220 118, 000 Mobile, Ala 13 6, 250 7, 520Chattanooga, Tenn __ 19 6, 480 61, 700 Muskegon, Mich 22 17, 300 152,000Chicago, Ill 170 109, 800 986, 000 Newark, N. J 48 15, 300 192, 000Cincinnati, Ohio 48 15, 400 129, 000 New Brunswick, N. J_ 10 2, 810 30, 400Cleveland, Ohio 80 28, 400 424, 000 New Haven, Conn_ _ _ 11 1, 300 5, 550Columbus, Ohio 12 7, 170 78, 900 New Orleans, La 23 13, 300 108, 00CCumberland, Md_____ 14 15, 900 80, 800 New York, N. Y 226 96, 600 762, 000Dallas, Tex 13 1, 280 12, 300 Passaic, N. J. 11 1, 770 16, 20CDayton, Ohio 11 17, 800 174, 000 Paterson, N. J 10 13, 300 115, 008Decatur, Ill 12 5, 590 29, 400 Peoria, Ill 12 2, 700 56, 200Dearborn, Mich 17 12, 700 41, 200 Philadelphia, Pa 76 43, 700 727, 00CDenver, (3010 14 6, 400 59, 700 Pittsburgh, Pa 69 26, 000 177, 008Des Moines, Iowa_ _ __ 10 3, 380 28, 100 Pontiac, Mich 11 26, 100 563, 00(Detroit, Mich 223 288, 000 2, 548, 000 Providence, R. I 15 9, 180 253, 00(E. Chicago, Ind 35 25, 100 118, 000 Reading, Pa 17 5, 040 51, 708E. St. Louis, Ill 23 5,420 30,200 Rochester, N. Y 11 1,280 17,30(Elizabeth, N. J 10 4, 620 31, 300 Rockford, Ill 15 4, 680 42,10(Erie, Pa 16 2, 870 41, 500 Saginaw, Mich 11 12, 200 286, 00(Flint, Mich 11 57, 300 1, 100, 000 San Francisco, Calif_ _ 18 30, 300 1, 111, 00(Ft. Wayne, Ind 13 12,200 53, 300 Scranton, Pa 10 2, 760 18,10(Gadsden, Ala 10 9, 280 19, 400 Seattle, Wash 11 7, 120 154, 006Gary, Ind 16 5,260 15, 600 Shreveport, La 11 3,200 108, 008Grand Rapids, Mich_ 23 8, 930 133, 000 South Bend, Ind 10 10, 900 109, 00(Granite City, Ill 10 6, 940 16, 900 Springfield, Mass 14 1, 890 41, 40(Hartford, Conn 11 4, 720 104, 000 St. Louis, Mo 93 45, 500 514, 00(Haverhill, Mass 12 920 2, 500 Toledo, Ohio 43 30, 100 420, 00(Hoboken, N. J 14 11,400 72, 500 Trenton, N. J 19 10, 700 169, 00(Houston, Tex 21 11, 300 84, 500 Washington, D. C____ 12 5, 060 35, 00(Indianapolis, Ind_ 23 12, 600 204, 000 Wilkes Barre, Pa 13 2, 890 17,101Jackson, Mich 25 9,130 132, 000 Williamsport, Pa 10 6, 000 36, 90(Jersey City, N. J 31 10,800 76,800 Wilmington, Del_ __-_ 10 3,400 47,60(Johnstown, Pa 13 2, 880 5, 900 Woonsocket, R. I 14 3, 860 11, 20(Joliet, Ill 15 2, 340 18, 400 Worcester, Mass 18 750 20, 20(Kalamazoo, Mich 13 4, 990 27 500 Youngstown, Ohio____ 18 300 69, 50(Kansas City, Mo 16 10, 200 138, 000
WORKERS INVOLVED
The median number of workers involved in work stoppages duringthe year was 150. The average number involved per strike was 730.Ten percent of the stoppages involved fewer than 20 workers each;at the other end of the scale nearly 12 percent involved more than 1,000workers each (table 9).

18
TABLE 9.— Work Stoppages Beginning in 1945, Classified by Number of Workers Involvedand Industry Group
Industry groupNum-ber ofstop-
pages 1
mew_
_an"in-ber ofwork-,,,,s in_v̀oiv_
"A
Number of stoppages in which the number of workersinvolved was—
6and
under20
20and
under100
100and
under250
250and
under500
500and
under1,000
1,000and
under5,000
5,000and
under10,000
10,000andover-
All industries:Number 4, 750 150 481 1, 441 1, 067 693 508 454 64 42Percent 100.0 10. 1 30.3 22. 5 14. 6 10. 7 9. 6 1. 3 0. 9
ManufacturingFood and kindred products 211 102 34 67 43 27 14 25 1 Tobacco manufactures 21 185 2 7 2 3 3 3 1 Textile-mill products 186 168 17 49 49 24 28 17 2Apparel and other finished products
made from fabrics and similar •materials 117 70 16 59 22 14 6
Lumber and timber basic products_ 67 80 3 35 14 6 5 3 1Furniture and finished lumber pro-
ducts 89 95 12 33 20 16 3 5 Paper and allied products 91 127 4 31 28 13 10 5 Printing, publishing, and allied In-
dustries 47 75 9 19 9 4 2 4 Chemicals and allied products 118 135 10 36 36 13 12 10 1 Products of petroleum and coal 36 125 1 13 13 1 6 2 Rubber products 122 586 4 17 19 16 25 26 7 8Leather and leather products 110 77 18 38 24 12 12 5 1Stone, clay, and glass products 104 149 12 32 17 21 13 7 2Iron and steel and their products_ __ 815 195 44 222 196 135 111 95 12 Nonferrous metals and their prod-
ucts 141 172 6 43 39 17 17 18 1 Machinery (except electrical) 332 279 13 74 69 71 52 45 7 1Electrical machinery 94 380 1 22 20 12 16 20 1 2Transportation equipment (except
automobiles) 221 364 7 52 30 34 34 44 14 6Automobiles and automobile equip-
ment 183 500 4 29 33 25 35 42 9 6Miscellaneous manufacturing in-
dustries 75 83 10 29 17 9 6 4 Nonmanufacturing
Agriculture, forestry, and fishing__ 20 70 4 7 3 1 3 2 Mining 669 194 33 161 205 153 69 39 4 5Construction 206 55 39 100 38 14 5 8 2 Trade 180 43 59 64 31 12 7 6 1 Finance, insurance, and real estate_ 23 14 14 6 2 1Transportation, communication,
and other public utilities 339 60 65 141 67 34 11 15 2 4Services—personal, business, and
other 96 36 32 39 16 4 3 1 1 Other nonmanufacturing industries_ 32 51 8 16 5 2 1
Interindustry 5 12, 600 2 3
1 The total number of stoppages shown for each industry group may differ from the number shown for thecorresponding group in table 4 because of the fact that in that table each stoppage extending into more thanone industry group is counted as a separate stoppage in each group affected. In table 6 such stoppagesare shown at the end as "interindustry" stoppages.
In manufacturing industries the median number of workers involvedranged from 70 in the apparel industries to 586 in the rubber-productsindustries. In nonmanufacturing industries the range was from14 in finance, insurance, and real-estate establishments to 194 in themining industries.
STOPPAGES INVOLVING 10,000 OR MORE WORKERS
There were 42 stoppages during the year in each of which 10,000or more workers were involved. These stoppages, listed separatelyin table 10, accounted for 1,348,000 workers or 39 percent of the totalnumber involved in all stoppages during the year.

TABLE 10.— Work Stoppages Beginning in 1945 in Which 10,000 or More Workers Were Involved
B.,,,,. -'''''--
ningdate
Approx-imate '
duration(days) .
•
Establishment involved Union involved Major issues
Approx-imate
numberof
workersin-
volved
Feb. 23_ _ 11 Chrysler Corp., Dodge Main, and Deeotoplants, Detroit and Hamtramck, Mich.
United Automobile Workers (CIO) Production standards 16,000
Mar. 1___ 10 Briggs Manufacturing Co., Detroit and Ham- tramek, Mich.
do Alleged discriminatory discharges 11, 000
Mar. 26__ 3 A. C. Spark Plug Division of General Motors, Flint, Mich.
do Alleged discriminatory suspensions and dis-charges.
11, 000
Mar. 28__ 4 Hudson Motor Car Co., Detroit, Mich do Alleged discriminatory discharge 13, 000Apr. 3_ __ 13 Bituminous coal mines, 13 States United Mine Workers Portal-to-portal pay, shift differentials, vacation
pay.100, 000
Apr. 5_ _ . 3 B. F. Goodrich Co., Akron, Ohio Foreman's Association of America Union recognition 16, 000Apr. 9_ _ _ 6 Packard Motor Car Co., Detroit, Mich United Automobile Workers (CIO) Change in production standards 12, 000Apr. 20__ 4 B. F. Goodrich Co., Akron, Ohio United Rubber Workers (CIO) Wage increase 15, 000May 1_ _ _ 20 Anthracite mines, Pennsylvania United Mine Workers Portal-to-portal pay, severance pay, increased
overtime, vacation pay, etc.000
May. 1_ __ 3 Bituminous coal mines, 12 States do Portal-to-portal pay, shift differentials, vacationpay.
000
May 14__ 18 32 bituminous-coal mines, Pennsylvania and United Clerical, Technical, and Supervisory Union recognition 10, 000West Virginia. Employees, District 50, United Mine Workers.
June 14__ 17 Chrysler Corp., Ford Motor Co., Packard MotorCar Co., Budd Wheel Co., Detroit and Dear-born, Mich.
United Automobile Workers (CIO) and AFLBuilding Trades.
Jurisdictional dispute over reconversion andbuilding construction.
47, 000
June 15__ 20 Libbey-Owens-Ford Glass Co. and PittsburghPlate Glass Co., Illinois, Louisiana, Ohio,Oklahoma, and West Virginia.
Federation of Glass, Ceramic, and Silica SandWorkers (CIO).
Incentive pay rates, bonus, and seniority in con-nection with new contract.
16, 000
June 16__ 20 Goodyear Tire & Rubber Co., Akron, Ohio United Rubber Workers (CIO) -
Union participation in setting wage rates, wageincreases, revision of merit system in somedepartments.
21, 000
June 16- - 10 Trucking companies, Chicago, Ill., and East Chicago Truck Drivers, Chauffeurs, and Helpers Wage increase, vacation with pay, 48-hour week__ 10, 000Chicago, Ind. (Ind.) and International Brotherhood of
Teamsters, Chauffeurs, Warehousemen, andHelpers (AFL).
July 1-- 14 Firestone Tire & Rubber Co., Akron, Ohio United Rubber Workers (CIO) Wage issues in connection with new contract__ 17, 000

TABLE 10.—Work Stoppages Beginning in 1945 in Which 10,000 or More Workers Were Involved—Continued
Begin-flint,0date
Approx-mate
(days)duration Establishment involved ' Union involved Major issues
Approx-imate
numberof
workersin-
volved
July 20___ 8 Wright Aeronautical Corp., Paterson, East United Automobile Workers (CIO) Discharge of union steward 24, 000Paterson, Fair Lawn, Wood Ridge, N. J. .July 25___ 4 Chrysler Corp., Chicago, Ill do Payment for clean-up time 19, 000
Aug. 3___ 5 Wright Aeronautical Corp., Lockland, Ohio •
do Lay off of workers refusing transfers to lower-paid jobs.
27, 000
Sept. L.- 6 Consolidated Steel Corp., Orange, Tex AFL craft unions Alleged union discrimination 11, 000Sept-3___ 1 Goodyear Tire & Rubber Co., Akron, Ohio United Rubber Workers (CIO) Discharges 16, 000Sept. 4__ 22 B. F. Goodrich Co., Akron, Ohio Foreman's Association of America Lay off of foreman 14, 000Sept. 10__ 19 Westinghouse Electric Corp., Maryland, Mas-
sachusetts, New Jersey, New York, Ohio andFederation of Westinghouse Independent Sala-
ried Unions.Incentive bonus denied by War Labor Board_ _ 40, 000
Pennsylvania.Sept. 17__ 20 Oil Refineries, 20 States Oil Workers International Union (CIO) Wage increase 43, 000Sept. 21__ 30 Bituminous coal mines, 8 States United Clerical, Technical, and Supervisory Union recognition 1209, 000
Employees, District 50, United Mine Workers.Sept. 24__ 6 Midtown Realty Owners, New York City Building Service Employees International Union
(AFL).Unsatisfactory War Labor Board decision on
wages and hours.15, 000
Sept. 24__ 4 New York Shipbuilding Corp., Camden, N. J Industrial Union of Marine and Shipbuilding Discharges 17, 000Workers (CIO).
Sept. 24__ (2) Northwest lumber industry, California, Idaho,Montana, Oregon, and Washington.
Lumber and Sawmill Workers Union (AFL) Wage increase 44,000
Sept. 27__ 13 Textile printing companies, Connecticut, New Federation of Dyers, Finishers, Printers, and do 16, 000Jersey, New York, Pennsylvania, Rhode Bleachers (CIO).Island.
Oct. 1____ 3 Consolidated Steel Corp., Los Angeles, Calif____ International Union of Operating Engineers Jurisdictional dispute over certain jobs 000(AFL) and International Association of Ma-chinists (AFL).
Oct. 1____ 6 General Motors Corp., Frigidaire Division,Dayton, Ohio.
United Electrical Radio and Machine Workers(CIO).
Disciplinary suspension of workers ________ 000
Oct. L___ 19 New York Shipping Association, New York International Longshoremen's Association(AFL)_ Weight of sling load and wages 30, 000City; Hoboken, and Newark, N. J.
Oct. 16_ (2) Libbey-Owens-Ford Glass Co. and Pittsburgh Federation of Glass, Ceramic, and Silica Sand Wage increase 13, 000Plate Glass Co., 7 States. Workers (CIO).
Oct. 29___ 2 Firestone Tire & Eubber Co., Akron, Ohio United Rubber Workers (CIO) do 15, 000Oct. 29___ (2) Machine shops, shipyards, etc., San Francisco
Bay area, Calif.International Association of Machinists (AFL)
and United Steelworkers (CIO).do 37, 000
O

Nov. 1___ (') Textile mills, Connecticut, Maine, Massachu-setts, New Hampshire, and Rhode Island.
Textile Workers Union (CIO) Closed shop, wage increase, shift premiums,vacations.
18, 000
Nov. 8--- 2 Goodyear Tire & Rubber Co., Akron, Ohio United Rubber Workers (CIO) Substitution of 8-hour day for 6-hour day pro-vided,in contract.
15, 000
Nov. 12— (2) Midwest Truck Operators Association, 21 International Brotherhood of Teamsters (AFL)._ Wage increase 10,000States.
Nov. 15_ 1 Leather manufacturers, 15 States International Fur and Leather Workers Union do 25, 000(CIO).
Nov. 19._ 6 Illinois Bell Telephone Co., Illinois and Indiana__ Illinois Telephone Traffic Union do 14, 000Nov. 21__ (2) General Motors Corp., 11 States United Automobile Workers (CIO) do 200, 000Dec. 3_ - _ 1 Steamship and stevedoring companies, Pacific,
Atlantic, and Gulf ports.Maritime workers' unions (CIO) Delay in returning troops from foreign war
theaters.13, 000
About 45,000 workers were idle by September 30. The remainder became idle during October.I Still in effect at end of the year.

22
NUMBER OF ESTABLISHMENTS INVOLVED 3
Only 1 establishment was involved in each of 3,854 stoppages (83.5percent of the total) ending in 1945 (table 11). In 627 or 13.6 percentof the stoppages 2 to 10 establishments were involved, and 135 stop-pages (3 out of each 100) extended to more than 10 establishments.In these classifications an establishment is defined as a single workplace, e. g., a factory, a mine, a construction project, a ship, or a farm.More than half of the total workers involved in the stoppages endingin 1945 were included in the 1-establishment stoppages. At least 41percent of the total idleness resulting from the stoppages ending inthe year was in connection with the single-establishment disputes,and 36 percent was caused by widespread stoppages each of whichinvolved more than 10 establishments.
TABLE 11.—Work Stoppages Ending 1 in 1945, by Number of Establishments Involved
Number of establishments involved
Stoppages Workers involved Man-days idle
Number Po7folanit Number PjtroIaq Number Percent
Total 4, 616 100.0 3, 069, 300 100.0 24, 360, 000 100.0
1 establishment 3, 854 83.5 1, 620, 900 52.8 10, 031, 000 41.22 to 5 establishments 509 11.0 446, 200 14. 5 4, 181, 000 17.26 to 10 establishments 118 2.6 165, 400 5.4 1, 416, 000 5.811 establishments and over 135 2. 9 836, 800 27. 3 8, 732, 000 35.8
I It should be noted that this and subsequent tables are based on the stoppages ending in the year andthat the totals differ from those in preceding tables, which show the number of stoppages beginning in theyear.
UNIONS INVOLVED
The work stoppages which ended in 1945 are classified in table 12according to the affiliations of the unions to which the workers involvedbelonged. This does not mean necessarily that the stoppages werecalled or authorized by the unions. In fact, during the war periodmost of the strikes were unauthorized, and union officials endeavoredto get the strikers back on the job as quickly as possible.
Members of unions affiliated with the Congress of IndustrialOrganizations were involved in 40 percent of the stoppages, whichincluded 49 percent of the total workers involved and accounted for39.5 percent of the resultinwidleness. Members of American Federa-tion of Labor unions were connected with 37 percent of the stoppages,which included 20 percent of the'total workers involved and accountedfor 25 percent of the total idleness. Unions affiliated with neitherAFL nor CIO were involved in about 17 percent of the stoppages,which included more than a fourth of the total workers involved andaccounted for about a third of the idleness. Most of the stoppagesin the latter group were disputes involving the United Mine Workersof America. Single-company unions—labor organizations whoserespective memberships consisted of employees of a single company—were involved in 31 stoppages. Workers belonging to no union wereinvolved in 128 work stoppages.
g The statistical analysis from here to the end of the section (p. 30) refers to stoppages which ended in 1945.

CHART 4
PERCENT
100
DURATION OF WORK STOPPAGES1935 -1945
PERCENT PERCENT OF STRIKES AND LOCKOUTS100
80 80
60
40
20
60
40
20
01935 1936 1937 1938 1939 1940 1941 1942 1943 1944 1945
ONE DAY AND _UNDER ONE WEEKUNITED STATES DEPARTMENT OF LABOR
BUREAU OF LABOR STATISTICS
W`ii■A**.
ONE WEEK AND 197710NE MONTHUNDER ONE MONTH ILLa AND OVERtrN

25
MAJOR ISSUES INVOLVED
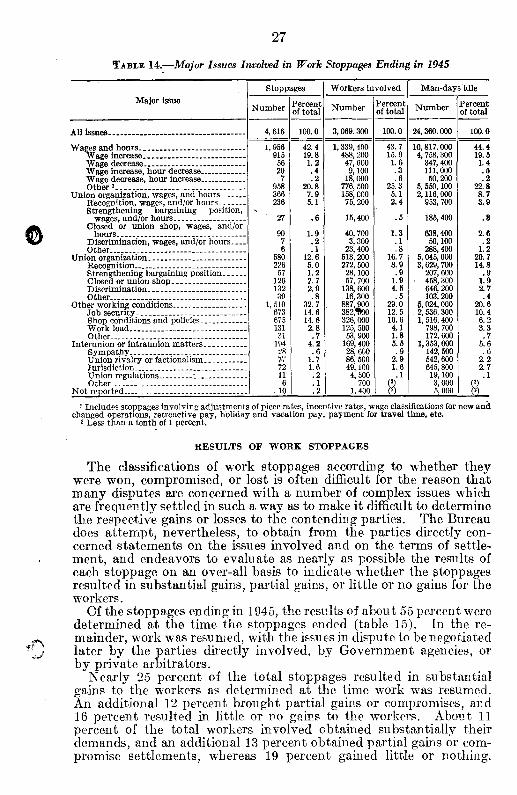
The causes of work stoppages arising from labor-management dis-putes are many and varied, and the issues in any one strike or lock-outare generally numerous and complex. Such major factors as wages,hours, collective-bargaining relations, etc., are the underlying issues,but many stoppages occur because of the human element and lackof skill or apparent good faith in conducting negotiations. Forevery dispute which develops, into a strike or lock-out, hundreds aresettled without work stoppages.
The human elements entering into' the causes of work stoppagesdo not lend themselves to statistical evaluation, and it is realizedthat any effort to classify, for statistical count, the major economicfactors over which individual disputes occur may yield only a partialindication of the real causes. Nevertheless, such a classification ofissues furnishes the best, if not the only available approach to thecauses of labor-management disputes. The issues involved ineach stoppage are examined and evaluated in the Bureau, and thestrikes are classified according to the apparent major issue. Theresults of this classification for 1945 appear in table 14.
Dissatisfaction with existing wages and hours of work, sometimesin conjunction with union organization or other issues, continued in1945 as the most important issue in work stoppages, with 50 percentof the cases concerned with this general problem. Following thetrend begun in 1943, work stoppages concerned with so-called "fringe"wage issues (holiday and vacation pay, adjustment of piece rates,payment for travel time, etc.) have become steadily more important,and in 1945 were responsible for a larger percent of the total workersinvolved and man-days of idleness than those concerned with straightwage increases. In 1942 only 6.0 percent of the total man-days idlewere attributed to the fringe issues; by 1944, the proportion had in-creased to 16.3 percent, and by 1945, to 22.8. An even larger.increasetook place in the number of workers involved.
The issues of union recognition, closed or union shop, discrimination,and other union-organization questions were primarily responsible for12.6 percent of the work stoppages, 16.7 percent of the workers in-volved, and 20.7 percent of the man-days idle in 1945. Some of thelarger stoppages in this category represented efforts to obtain unionrecognition and collective-bargaining rights for supervisory workers.
Other working conditions (including job security, shop conditionsand policies, work load, etc.) continued to be the issues responsible forabout a third of the stoppages, 29 percent of the number of workersinvolved, and a fifth of the idleness in 1945. Stoppages caused byissues concerned with interunion or intraunion matters (union rivalryor factionalism and jurisdiction) have remained relatively low, as inthe past few years (4 to 5 percent).
Since many of the strikes in 1945 were of longer duration than in1944, the actual number of man-days of idleness in each instance ismuch larger, as compared with 1944, than a simple comparison of thepercentages would indicate. For instance, the total number of dayslost in 1944 because of work stoppages over all issues was about9,000,000. In 1945 almost 13,000,000 days were lost as a result ofissues involving wages and hours, and another 10,000,000 days werelost because of stoppages over union organization matters and otherworking conditions.

t\D
CHART 5
MAJOR ISSUES INVOLVED IN WORK STOPPAGES1935-1945
NUMBER OF STRIKES AND LOCKOUTS
■•46, •4 • iv0 .0 0I 9 3 5 1936 I 93 7 1938 1939 1940 1941 I 9 4 2 1943 1944 I 9 4 5
EZI MISCELLANEOUSWORKING CONDITIONS
27
TABLE 14.—Major Issues Involved in Work Stoppages Ending in 1945
Major issueStoppages Workers involved Man-days idle
Number Percentof total Number Percent
of total,umb„,.Number Percent
of total
All issues 4, 616 100. 0 3, 069. 300 100.0 24, 360, 000 100. 0
Wages and hours 1,956 42. 4 1, 339, 400 43. 7 10, 817, 000 44.4Wage increase 915 19.8 488, 200 15. 9 4, 758, 300 19. 9Wage decrease 56 1. 2 47, 600 1. 6 347, 400 1. 4Wage increase, hour decrease 20 .4 9, 100 .3 111, 000 . 5Wage decrease, hour increase 7 .2 18, 000 .6 50, 200 .2Other / 958 20.8 776, 500 25.3 5, 550, 100 22. 8
Union organization, wages, and hours 366 7.9 158, 000 5. 1 2, 116, 000 8. 7Recognition, wages, and/or hours 236 5. 1 75, 200 2.4 953, 700 3.9Strengthening bargaining position,
wages, and/or hours ..
27 .6 15, 400 .5 185, 400 . 8Closed or union shop, wages, and/or
hours 90 1.9 40,700 1. 3 638, 400 2.6Discrimination, wages, and/or hours_ __ _ 7 .2 3, 300 .1 50, 100 .2Other 6 .1 23, 400 .8 288,400 1.2
Union organization 580 12.6 513, 200 16. 7 5, 045, 000 20. 7Recognition 226 5.0 272, 500 8.9 3, 629, 700 14.8Strengthening bargaining position 57 1. 2 28, 100 .9 207, 600 .6Closed or union shop 126 2. 7 57, 700 1.9 , 458,300 1.6Discrimination 132 2.9 138, 600 4. 5 646, 200 2.7Other 39 .8 16, 300 .5 103,200 . 4
Other working conditions 1, 510 32. 7 887, 900 29.0 6, 024, 000 20.6Job security 673 14. 6 382,00 12. 5 2, 536, 300 10. 4Shop conditions and policies 675 14. 6 326, 000 10. 6 1, 516, 400 6.2Work load 131 2.8 125, 500 4. 1 798, 700 3.3Other 31 .7 53, 900 1. 8 172, 600 .7
Interunion or intraunion matters 194 4. 2 169, 400 5.5 1, 353, 000 5. 9Sympathy 28 . 6 28, 600 .9 142, 500 . eUnion rivalry or factionalism 77 1.7 86, 500 2.9 542, 600 2.2Jurisdiction 72 1.6 49, 100 I.6 645, 800 2. 7Union regulations • 11 .2 4,500 .1 19, 100 .1Other 6 .1 700 (2) 3,000 (2)
Not reported 10 .2 1, 400 (2) 5, 000 (2)
! Includes stoppages involving adjustments of piece rates, incentive rates, wage class'fications for new andchanged operations, retroactive pay, holiday and vacation pay, payment for travel time, etc.
2 Less than a tenth of 1 percent.
RESULTS OF WORK STOPPAGES
The classifications of work stoppages according to whether theywere won, compromised, or lost is often difficult for the reason thatmany disputes are concerned with a number of complex issues whichare frequently settled in such a way as to make it difficult to determinethe respective gains or losses to the contending parties. The Bureaudoes attempt, nevertheless, to obtain from the parties directly con-cerned statements on the issues involved and on the terms of settle-ment, and endeavors to evaluate as nearly as possible the results ofeach stoppage on an over-all basis to indicate whether the stoppagesresulted in substantial gains, partial gains, or little or no gains for theworkers.
Of the stoppages ending in 1945, the results of about 55 percent weredetermined at the time the stoppages ended (table 15). In the re-mainder, work was resumed, with the issues in dispute to be negotiatedlater by the parties directly involved, by Government agencies, orby private arbitrators.
Nearly 25 percent of the total stoppages resulted in substantialgains to the workers as determined at the time work was resumed.An additional 12 percent brought partial gains or compromises, and16 percent resulted in little or no gains to the workers. About 11percent of the total workers involved obtained substantially theirdemands, and an additional 13 percent obtained partial gains or com-promise settlements, whereas 19 percent gained little or nothing.

28
About 51 percent of the workers went back to their jobs pending finaldisposition of their disputes through further negotations, mediation,or arbitration.
TABLE 15.-Results of Work Stoppages Ending in 1945
Result
Stoppages Workers involved Man-days idle
NumberPer-
cent oftotal
NumberPer-
cent oftotal
NumberPer-
cent oftotal
Total 4,616 190.0 3, 069, 300 100.0 24, 360, 000 100.0Issues settled at strike termination:
Substantial gains to workers 1,114 24.0 330,100 10.8 3,051,000 12.5Partial gains or compromises 534 11. 6 392, 900 12.8 5, 090, 000 20.9Little or no gains 744 16. 1 - 594, 200 19.4 726, 000 19.4Indeterminate 156 3.4 187, 400 6.1 882, 000 8.6
Issues to be negotiated:By parties concerned 941 20.4 856, 200 21.4 3, 817, 000 15.7By Government agencies 928 20.1 771, 200 25.1 463, 000 22.6By private arbitrators 189 4.1 136,100 4.4 1, 322, 000 5.4
Not reported 12 .3 1, 200 (1) 9, 000 (1)
1 Less than a tenth of 1 percent.
TABLE 16.-Results of Work Stoppages in 1945 in Relation to Major Issues Involved
Major issues
Total Issues settled at termina-tion of stoppage
Issues to be negoti-ated or settled by or
with the help of-
Number Per-cent
Sub-stan-tial
gainsto
work-ers
Par-tial
gainsOr
com-pro-
mises
Littleor nogains
Inde-termi-nate 1
Par-ties
Con-cerned
Gov-ern-
mentagen-cies
Pri-vatearbi-tra-tors
Stoppages Percent of stoppages
All issues 4. 616 100.0 24. 0 11.6 16. 1 3. 7 20. 4 20. 1 4.1
Wages and hours 1, 956 100.0 24.0 13.6 2 1.3 M. 1 25. 1 3. 7Union organization, wages, and
hours 366 100. 0 38. 5 18. 0 6.6 1. 1 14.8 19. 1 1.9Union organization 580 100. 0 31. 0 6.6 16. 4 2.2 15. 7 25.0 3. 1Other working conditions 1,510 100.0 20.7 10.4 24.6 2.4 24.1 11.8 6.0Inter- or intra-union matters 194 100.0 4.6 3. 6 6. 7 43.9 18.6 21.6 1.0Not reported 10 100. 0 10.0 60.0 30.0
Workers in-volved Percent of workers involved
All issues 3, 069, 300 100. 0 10.8 12. 8 19.4 6.1 21.4 25. 1 4.4
Wages and hours 1, 339, 400 100.0 9. 9 22.4 5 2.6 19.2 28.4 4.0Union organization, wages, and
hours 158, 000 100. 0 14.8 17. 5 2.2 5. 2 22.9 36.9 0. 5Union organization 513, 100 100.0 5.9 1.7 49.0 0. 5 14.6 27.2 1. 1Other working conditions 887,900 100.0 14. 1 8.2 16. 8 5.9 29.8 18.7 8. 5Inter- or intra-union matters 169,400 100.0 10.9 1.4 4.8 53.2 13.4 16.2 0.1Not reported 1, 400 100. 0 11. 4 38.4 52.2
1 Includes a few stoppages for which adequate information was not available: also those 'revolving rival-union or jurisdictional disputes, the results of which cannot be evaluated in terms of the r effect on thewelfare of all workers concerned.
•

29
TABLE 17.-Results of Work Stoppages Ending in 1945 in Relation to Number of WorkersInvolved
Number of workers involved Totals
Issues settled at strike termi-nation
Issues to be negotiatedby-
Sub-stantialgains toworkers
Partialgains or
com-promise
Littleor no
gains toworkers
Inde-termi-nate 1
Partiescon-
cerned
Govern-ment
agencies
Privatearbi-
trators
Number of stoppages
All workers involved 4, 616 1, 114 534 744 168 941 926 189
6 and under 20 467 175 47 90 24 52 69 1020 and under 100 1, 416 408 166 224 55 221 279 63100 and under 250 1, 031 241 127 177 33 209 204 40250 and under 500 673 148 75 104 19 170 128 29500 and under 1,000 496 75 63 82 14 132 108 221,000 and under 5,000 4.35 59 51 53 11 134 106 215,000 and under 10,000 10,000 and over
6236
62
14
95 84
176
1913
22
Percent of stoppages
All workers involved 100.0 24.0 11.6 16.1 3. 7 2974 20.1 4. 1
6 and under 20 100.0 37. 5 10. 1 19.3 5. 1 11. 1 14.8 2. 120 and under 100 100.0 28.9 11.7 15.8 3.9 15.6 19. 7 4. 4100 and under 250 100.0 23.3 12.3 17.2 3. 2 20.3 19. 3.9250 and under 500 100. 0 22.0 11. 1 15.5 2. 8 25.3 19.0 4.3500 and under 1,000 100.0 15. 1 12.7 16.5 2.8 26.7 21.8 4. 41,000 and under 5,000 100.0 13. 6 11.7 12.2 2.5 30.8 24.4 4.85,000 and under 10,000 10,000 and over
100. 0100.0
9. 75. 6
1.611. 1
14.513.9 1.1.1 27. 4
16. 730. 736.0
3. 25.6
1 Includes a few stoppages for which adequate information was not available; also those involving rival-union or Jurisdictional disputes, the results of which cannot be evaluated in terms of their effect on thewelfare of all workers concerned.
METHODS OF TERMINATING WORK STOPPAGES
Nearly 60 percent of the stoppages ending in 1945, including 72percent of the total workers involved and accounting fur 81 percentof the total idleness, were terminated with the assistance of Govern-ment agencies (table 18). In some cases the disputes were settledbefore work was resumed, and in others the workers were persuadedto go back to their jobs while the issues were negotiated further.About 32 percent of the stoppages, including 17 percent of the workersinvolved and accounting for 13 percent of the idleness, were settled
TABLE 18.-Methods of Terminating Work Stoppages Ending in 1945
Method of termination
Stoppages Workers involved Man-days idle
Number Percentof total Number Percent
of total Number Percentof total
Total
Agreement of parties arrived at- .Directly With assistance of impartial chairmen__ _With assistance of Government
agencies Terminated without formal settlement Employers discontinued business Not reported
4, 616 100.0 3, 069, 300 100.0 24, 360, 000 100.0
4859
745339
299
32.2.2
59.57.3.6.2
2,
534,41,
203,286,
3,
500 y400
000200400800
17.41.3
71.99.3
. 1(1)
3,
19,1,
098, 000361, 000
765, 000084, 00043,000
9, 000
12.71.5
81.14.5.2
(1)
1 Less than a tenth of 1 percent.

30
directly by the companies and unions concerned. Approximately 8percent of the stoppages, including over 9 percent of the total workersand accounting for nearly 5 percent of the idleness, were terminatedwithout formal settlements. In a few of these cases the employersdiscontinued business at the establishments involved. In most cases,however, the strikes were called off and the employees returned towork with no agreement or settlement of the matters at issue.
There were 20 work stoppages in 1945 which were followed by Gov-ernment seizure of the plants or facilities. Seventeen of these occurredbefore VJ-day; 14 involved company or union failure to comply withdecisions or orders of the National War Labor Board.
Strikes Under War Labor Disputes Act in 1945During 1945 the National Labor Relations Board conducted 1,445
strike ballots under provisions of the War Labor Disputes Act, moregenerally known as the Smith-Connally Act' In 1,249 of these amajority of the employees voted in favor of striking Of the totalvotes cast, 84 percent approved strike action.
There were 213 work stoppages in 1945 which followed strike votes.These comprised 4.5 percent of the total strikes and lock-outs occurringin the year; the number of workers involved in such stoppages was736,000 or 21.2 percent of the workers involved in all stoppages; andidleness in these stoppages amounted to 15,095,000 man-days or 39.7percent of the total idleness during the year.
The average number of workers involved in the 213 strikes was 3,454,as compared with averages of 1,426 during 1944 and 730 workers for allstrikes and lock-outs in 1945. Idleness per worker involved in the 213strikes was 20.5 days as compared with 11.0 days for all 1945 stoppages.On the average, 23 days elapsed between the time the votes were takenand the time the strikes occurred.
Wages were an issue in three-fourths of these strikes, and 30 percentof them resulted from noncompliance by either the workers or manage-ment with directives or decisions of the War Labor Board. In 84instances the War Labor Board was not involved in any way, anddisputes were settled either by the parties themselves or through theaid of State and Federal conciliation services.
Work Stoppages of Concern to the National War Labor Board
The National War Labor Board, which terminated its existenceDecember 3/, 1945, was directly concerned with 1,007 stoppages (21percent of the total) in 1945 which included 992,000 of the total workersinvolved and caused 9,173,000 man-days of idleness. This was adecrease of more than 600 stoppages from 1944. While the numberof workers involved in such stoppages increased somewhat and theidleness was almost double that of 1944, the percentage of total workersinvolved dropped from 45 in 1944 to about 29 in 1945, and the idlenessfrom about 56 percent to 24 percent of the year's total. The numberof stoppages going to the Board decreased sharply following thePresident's issuance of Executive Order 9599 (August 18, 1945)
4 57 Stat. 163 (1943).a These were cases which (1) went to the Board for settlement of the issues; (2) occurred while cases were
pending before the Board; and (3) took place after Board decisions, indicating dissatisfaction of one of theparties with decisions rendered.

31
relaxing wage stabilization controls, and in anticipation of the Board'sdiscontinuance at the end of 1945.TABLE 19.—Work Stoppages of NWLB Concern Compared with all Stoppages in the
United States, 1945
Month '
Stoppages Workers involved Man-days idle
NumberPercent
of allstoppages
NumberPercent
of allstoppages
NumberPercent
of allstoppages
All months 1, 007 21. 2 992, 012 28. 6 9, 172, 645 24. 1
January 66 2 15,113 32. 3 102, 750 51. 5February 82 4 59, 460 53. 5 263, 054 67.8March 112 29. 3 76, 169 38. 7 484, 688 62. 5April 124 28. 8 169, 704 55. 5 1, 099, 909 74. 7May 144 33. 3 141, 371 42. 5 1, 521, 567 68. 6June 132 27. 4 137, 901 41. 6 1, 120, 882 59. 4July 135 25. 8 147, 310 45. 3 1, 142, 172 64. 6August 74 16. 6 88, 504 32. 7 827, 050 48.3September 64 11. 2 82, 728 15. 7 1, 138, 205 28.2October 38 8. 0 39, 104 7. 1 575, 302 6. 7November 28 7. 8 27, 599 6. 6 557, 286 8. 0December 8 6. 0 7, 059 14. 0 339, 780 4.4
Of the 1,007 stoppages of direct concern to the NWLB, 550 or 55percent were referred to the Board after the stoppages began. About15 percent occurred while cases were pending before the Board, com-pared with 22 percent in 1944 and almost 40 percent in 1943; in a largepercentage of these, Board delay in arriving at a decision was givenas one cause of the stoppage. Over 300 stoppages, 30 percent of thetotal, occurred after decisions had been rendered, the workers protest-ing terms of Board decisions or protesting the noncompliance ofemployers with such decisions.
In about 750 stoppages, over 70 percent of the total, wages aloneor in connection with other factors, were given as the major issue indispute.TABLE 20.—Work Stoppages of NWLB Concern, Classified According to Major Issues
Involved and Time Stoppages Occurred, 1945
Major issues involved and time stoppages
Stoppages Workers involved Man-days idle
occurred Per- Per- Per-Num- cent of Number cent of Number cent ofber total total total
Total 1, 007 100.0 992, 012 100.0 9, 172, 645 100. 0W ages 749 74. 4 669, 610 67. 5 6, 502, 574 70.9All other 258 25.6 322, 402 32. 5 2, 670, 071 29. 1
Strikes before cases went to Board 550 54. 6 495, 822 50. 0 4, 118, 867 44.9Wages 341 33. 9 218 733 22.0 990, 501 - 21. 7All Other 209 20.7 277, 089 28.0 2,128, 366 23. 2
Strikes while cases were pending 153 15. 2 279, 462 28.2 723, 143 29. 7Wages , 136 13. 5 257, 901 26.0 2, 566, 707 28.0All other 17 1. 7 21, 561 2. 2 156, 436 1. 7
Strikes after Board decisions 304 30. 2 216, 728 21.8 2, 330, 635 25. 4Wages 272 27.0 192, 976 19. 4 1, 945, 366 21. 2All other- 32 3. 2 23, 752 2.4 385, 269 4. 2

32
Scope and Method
Coverage.—The Bureau's statistics include all known work stoppagesclue to labor-management disputes in the continental United Stateswhich involve as many as six workers and last as long as a full day orshift. All such stoppages, whether initiated by workers or employers,are included. Stoppages involving fewer than six workers and lasting,less than a full workday or shift are excluded from the Bureau'sstatistics, principally because it is impossible to obtain a completerecord of these minor controversies. Furthermore, these disputesare usually of little importance, arising many times from misunder-standings which are cleared up within a few minutes or a few hourswith no significant interruption in production.
Collection of data.—The Bureau receives press clippings on labordisputes from nearly 400 daily newspapers throughout the countryand more than 250 labor and industry papers and journals. It alsoobtains reports directly from Federal and State agencies which dealwith employer-employee disputes. Upon receipt of information asto the existence of a work stoppage detailed questionnaires are sentto the companies, unions, and impartial agencies involved to getfirst-hand and verified information concerning the number of workersinvolved, duration of the stoppage, major issues, methods of settle-ment, results, and other data.
Quantitative measures.--Stoppages due to labor-management dis-putes are measured for statistical purposes by their number, theworkers involved, and total man-days of idleness. The indirecteffects of work stoppages upon related and dependent industries andthe general public, are not reflected by the Bureau's data since nosound basis yet exists, statistically, for the calculation of these secon-dary or tertiary effects of strikes. Thus, the Bureau's figures showthe total number of workers in any plant who are made idle during adispute in that plant, but do not include workers or idleness in otherplants of the same or other companies which may be indirectlyaffected and required to curtail production through failure to getmaterials from the idle plant. For example, if maintenance workersin an automobile-engine plant strike and thereby cause the entireplant to close, all workers idle during the dispute are counted asinvolved in the strike. However, if an automobile-assembly plantcloses or curtails production because it cannot obtain engines fromthe struck plant, idleness in the assembly plant is not counted. Thedifficulties of securing accurate information concerning the indirect,or the secondary and tertiary effects of all stoppages can be furtherillustrated by several additional examples from the transportation orpublic utility field where the number of workers directly engaged in astoppage may be small but the effect far-reaching. In a streetcarand bus strike, in order to determine the number of workers indirectlymade idle, it would be necessary to find out how many persons didnot walk to work or obtain rides by other means. In a strike ofelevator operators, it would be necessary to determine how manyworkers were kept from their offices or shops as opposed to the numberwho climbed the stairs and reported for work. Since it is practicallyimpossible to measure all of these elements accurately, the statistics

33
are limited to basic information which can be obtained uniformlymonth after month so that information for different periods will becomparable and will reflect general trends.
Analysis of data.—Strikes and lock-outs, by their very nature, leadto differences of viewpoint and approach in their measurement andclassification. Since they are controversies in which the employers,the workers, and the public are deeply concerned, each group naturallytends to interpret and evaluate the situation from its own, oftenstrictly partisan, point of view. This divergency of outlook persiststhroughout every phase of the statistical treatment of strikes andlock-outs—definition, unit of measurement, extent, causes, and results.Furthermore, the facts with reference to strikes and lock-outs veryoften are too complex or indeterminate to permit accurate and simpleclassification by any approach. Causes leading up to any one disputemay be many and varied, and the basic causes may never be actuallyvoiced by either party; so also with the outcome, especially when thedispute ends with no written agreement.
In view of these divergencies of approach as well as of the difficultyin securing sufficiently detailed information, a portion of the statisticson strikes and lock-outs is, of necessity, based on estimates and judg-ment. Through the use of specific definitions and the adoption ofpolicies to be followed in the evaluation of the data, the Bureau,however, seeks to obtain the highest possible degree of comparabilityand uniformity of treatment.
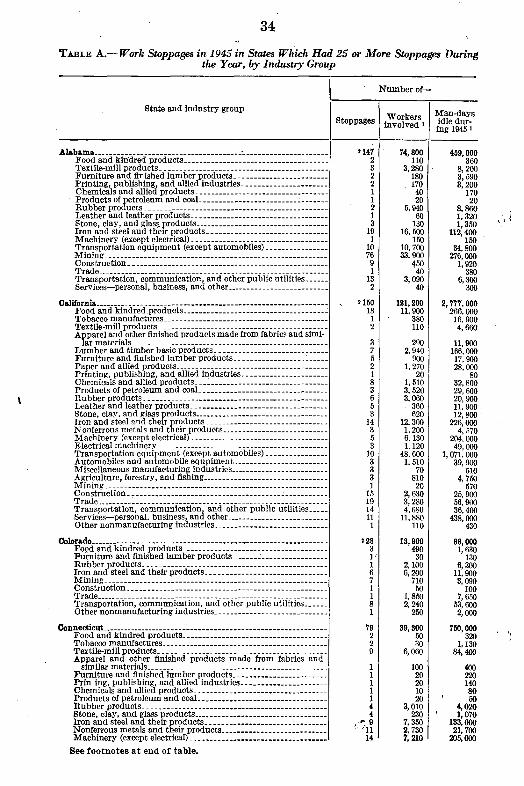
34
TABLE A.-Work Stoppages in 1945 in States Which Had 25 or More Stoppages Duringthe Year, by Industry Group
State and industry group
Number of--
Stoppages Workersinvolved 1
Man-daysidle dur-ing 1945 1
Alabama 2 147 74, 800 459,000Food and kindred products 2 110 360Textile-mill products 3 3,280 8, 200Furniture and finished lumber products 2 180 3, 590Printing, publishing, and allied industries 2 170 3, 200Chemicals and allied products 1 40 170Products of petroleum and coal 20 20Rubber products 2 5,940 8, 860Leather and leather products 1 60 1, 320Stone, clay, and glass products 3 130 1, 350Iron and steel and their products 19 16, 500 112, 400Machinery (except electrical) 1 150 150Transportation equipment (except automobiles) 10 10, 700 34, 800Mining 76 33, 900 276,000Construction 9 450 1, 920Trade 1 40 380Transportation, communication, and other public utilities 13 3, 090 6,300Services-personal, business, and other 2 40 300
California 2 150 121,200 2, 777, 000Food and kindred products 18 11,900 266, 000Tobacco manufactures 1 380 16, 900Textile-mill products 2 110 4, 660Apparel and other finished products made from fabrics and simi-
lar materials 3 290 11,900Lumber and timber basic products 7 2,940 166,000Furniture and finished lumber products 5 900 17,900Paper and allied products 2 1, 270 28, 000Printing, publishing, and allied industries 1 20 80Chemicals and allied products 1, 510 32, 800Products of petroleum and coal 3 3, 520 29, 600Rubber products 6 3, 060 20,900Leather and leather products 5 360 900Stone, clay, and glass products 3 620 800Iron and steel and their products 14 12,300 226, 000Nonferrous metals and their products 3 1,200 4, 570Machinery (except electrical) 5 6,130 204, 000Electrical machinery 3 1,120 49,000Transportation equipment (except automobiles) 10 48,600 1, 071, 000Automobiles and automobile equpiment 3 1,510 39, 900Miscellaneous manufacturing industries 3 70 510Agriculture, forestry, and fishing 3 810 4, 750Mining 1 20 570Construction 15 2,630 25, 900Trade 19 3,280 56, 900Transportation, communication, and other public utilities 14 4,680 36,400Services-personal, business, and other 11 11,880 438,000Other nonmanufacturing industries 1 110 430
Colorado 228 13, 900 88, 000Food and kindred products 3 490 1, 630Furniture and finished lumber products 1' 30 130Rubber products 1 2, 100 6, 300Iron and steel and their products 6 6, 200 11, 900Mining 7 710 3, 090Construction 1 50 100Trade 1 1, 850 7, 650Transportation, communication, and other public utilities 8 2, 240 53, 600Other nonmanufacturing industries 1 250 2, 000
Connecticut 79 39, 300 750,000Food and kindred products 2 50 320Tobacco manufactures 2 30 1, 130Textile-mill products 9 6, 060 84, 400Apparel and other finished products made from fabrics and
similar materials 100 400Furniture and finished lumber products 20 220Erin ing, publishing, and allied industries 20 140Chemicals and allied products 10 80Products of petroleum and coal 20 50Rubber products 4 3, 010 4, 020Stone, clay, and glass products 4 230 1, 070Iron and steel and their products 9 7, 350 133, 000Nonferrous metals and their products '11 2, 730 21, 700Machinery (except electrical) 14 7, 210 205, 000
See footnotes at end of table.

35
TABLE A.-Work Stoppages in 1945 in States Which Had 25 or More Stoppages Duringthe Year, by Industry Group-Continued.
State and industry group
Number of-
Stoppages Workersinvolved 1
Man-daysidle dur-ing 1945 I
Connecticut-Continued.Electrical machinery 2 3, 640 83, 900Transportation equipment (except automobiles) 1 300 900Automobiles and automobile equipment 1 7,530 203,300Miscellaneous manufacturing industries 3 240 4,160Construction 2 90 1,920Trade 3 120 710Transportation, communication, and other public utilities 6 530 2,330Services-personal, business, and other 1 40 190
Florida 29 13, 100 143, 000Tobacco manufactures 3 7, 580 100, 000Lumber and timber basic products 1 100 100Furniture and finished lumber products 2 360 14,600Printing, publishing, and allied industries 1 70 2, 020Iron and steel and their products 1 40 280Transportation equipment (except automobiles) 2 840 2,440Miscellaneous manufacturing industries 1 10 70Agriculture, forestry, and fishing 3 1, 570 14, 400Construction 4 350 2, 760Trade 3 100 960Transportation, communication, and other public utilities 8 2,150 5, 060
Georgia 42 15,300 149,000Food and kindred products 4 410 2, 060Textile-mill products 8 1,110 32, 500Iron and steel and their products 7 1, 150 2, 780Machinery (except electrical) 1 70 200Electrical machinery 1 .140 4,690Transportation equipment (except automobiles) 5 9,320 60,300Automobiles and automobile equipment 1 980 26, 000Agriculture, forestry, and fishing 1 600 13,200Transportation, communication, and other public utilities Other nonmanufacturing industries
131
1,45060
7,730130
Illinois 3 491 275, 000 2, 559, 000Food and kindred products 20 3, 880 53, 500Textile-mill products 2 200 730Apparel and other finished products made from fabrics and
similar materials 9 830 2, 610Lumber and timber basic products 2 1, 340 2, 680Furniture and finished lumber products 11 910 15,800Paper and allied products 6 1, 900 12, 300Printing, publishing, and allied industries 9 4, 500 74, 500Chemicals and allied products 13 5, 350 106, 000Products of petroleum and coal 9 2, 880 30,100Rubber products 2 120 420Leather and leather products 12 6,340 20,500Stone, clay, and glass products 19 5, 300 64, 700Iron and steel and their products 102 52, 600 578, 000Nonferrous metals and their products 15 4, 990 79, 200Machinery (except electrical) 65 47, 600 544, 000Electrical machinery 6 2, 340 35, 300Transportation equipment (except automobiles) 14 37, 100 104, 000Automobiles and automobile equipment 16 18, 100 332, 000Miscellaneous manufacturing industries 8 1,650 17,900Mining 64 37, 100 155, 000Construction 20 1, 360 17, 000Trade 18 4,110 26, 200Finance, insurance, and real estate 3 90 350Transportation, communication, and other public utilities 28 32, 000 265, 000Services-personal, business, and other 17 1, 290 15, 200Other nonmanufacturing industries 3 1, 180 7, 040
Indiana 3 203 157, 100 I, 989, 000Food and kindred products 11 4, 680 12, 600Lumber and timber basic products 1 130 480Furniture and finished lumber products 3 790 780Paper and allied products 2 410 6, 640Printing, publishing, and allied industries 2 110 2, 860Chemicals and allied products 2 140 2, 880Products of petroleum and coal 1 5, 860 49, 800
.. Rubber products 9 13,100 130, 000Leather and leather products 2 130 3, 240Stone, clay, and glass products 6 1,130 11,100
Bee footnotes at end of table.

36
TABLE A.-Work Stoppages in 1945 in States Which Had 25 or More Stoppages Duringthe Year, by Indusuy Group-Continued
State and industry group
Number of-
Stoppages Workersinvolved /
Man-daysidle dur-ing 1945 1
Indiana-Continued.Iron and steel and their products 54 28, 800 144, 000Nonferrous metals and their products 4 3, 730 54, 500Machinery (except electrical) 25 11, 600 217, OMElectrical machinery 10 6, 720 72, 600Transportation equipment (except automobiles) 7 3, 640 11, 800Automobiles and automobile equipment 12 52, 600 1, 049, 000Miscellaneous manufacturing industries 1,400 8, 640Mining 19 18, 000 155, 000Construction 7 1, 850 7, 460Trade 5 180 1, 440Transportation, communication, and other public utilities 16 2, 380 32, 400Services-personal, business, and other 2 130 740Other nonmanufacturing industries 4 550 5, 460
Iowa 43 18,200 258,000Food and kindred products 10 8, 270 67,000Lumber and timber basic products 2 150 1,160Printing, publishing, and allied products 1 130 640Rubber products_ 2 880 1, 750Stone, clay, and glass products 180 5, 220Iron and steel and their products 10 3, 210 21, 270Machinery (except electrical) 6 3, 100 101,000Automobiles and automobile equipment 1 240 5, 860Mining 2 180 3, 390Construction 2 480 2,810Trade 2 50 1, 440Transportation, communication, and other public utilities 3 1, 330 44, 200Services-personal, business, and other 1 50 190
Kentucky 149 99,100 984, 000Food and kindred products 3 800 6, 180Furniture and finished lumber products .2 230 1, 340Chemicals and allied products 2 610 23, 200Products of petroleum and coal 2 930 4, 610Leather and leather products 2 830 7, 130Stone, clay, and glass products 4 380 5, 780Iron and steel and their products 5 2,880 26,100Nonferrous metals and their products 3,130 15,600Machinery (except electrical) 70 200Electrical machinery 2,830 113, 000Transportation equipment (except automobiles) 500 800Automobiles and automobile equipment 1 40 320Mining 100 83,700 734, 000Construction 3 170 200Trade 4 590 17,200Transportation, communication, and other public utilities 14 1,230 8,000Services-personal, business, and other 2 90 590Other nonmanufacturing industries 1 50 100
Louisiana 50 20, 700 251, 000Food and kindred products 2 60 330Paper and allied products 2 580 3, 030Chemicals and allied products 8 1, 830 15, 100Products of petroleum and coal 3 1, 940 13, 800Stone, clay, and glass products 3 1, 620 46, 400Iron and steel and thpir products 3 130 1, 550Machinery (except elbctrical) 1 310 9, 520Transportation equipment (except automobiles) 8 11,300 97, 100Construction 5 1, 320 48, 600Trade 2 110 1,160Transportation, communication, and other public utilities 13 1, 490 13, 700Services-personal, business, and other 1 20 220
Maryland 67 33,300 248, 000Food and kindred products 6 1, 430 8, 950Textile-mill products 1 140 270Apparel and other finished products made from fabrics and
similar materials 2 80 850Furpiture and finished lumber products 2 270 7, 370Paper and allied products 2 3, 090 28, 000Chemicals and allied products 5 6, 000 10, 200Rubber products 6 10, 100 71, 200Leather and leather products 210 210Stone, clay, and glass products 550 9, 880Iron and steel and their products 11 3, 470 7, 140Nonferrous metals and their products 2 670 1, 130
See footnotes at end of table.

37
TABLE A.-Work Stoppages in 1945 in States Which Had 25 or More Stoppages Duringthe Year, by Industry Group-Continued
State and industry group
Number of-
Stoppages Workersinvolved
Man-daysidle dur-ing 1945
Maryland-Continued.Electrical machinery 1 800 11,900Automobiles and automobile equipment 1 850 22,800Mining 3 90 1,250Construction 4 3,360 . 49,800Transportation, communication, and other public utilities 9 2,220 15,400
Massachusetts ' 239 60, 700 397, 000Food and kindred products 13 1, 450 8,820Tobacco manufactures 2 130 3,890Textile-mill products 45 15, 400 77,300Apparel and other finished products made from fabrics and
similar materials 17 1,000 3,100Furniture and finished lumber products 3 250 3,500Paper and allied pioducts 4 940 5,240Printing, publishing, and allied products 1 60 2.800Chemicals and allied products 1 20 70Products of petroleum and coal ,l. 190 970Rubber products 6 5,000 17,000Leather and leather products 47 12,200 29,700Stone, clay, and glass pioducts 1 50 1, 050Iron and steel and their products 17 7,870 76,500Nonferrous metals and their products 3 290 2, 320Machinery (except electrical) 11 4, 780 41, 300Electrical machinery 6 2,910 74,700Miscellaneous manufacturing industries 5 290 2,780Agriculture, forestry, and fishing 7 1, 320 11, 800Construction 8 1,100 7, 850Trade 8 320 1,760Transportation, communication, and other public utilities 29 4,920 22,500Services-personal, business, and other 4 150 590Other nonmanufacturing industries 1 20 50
Michigan 2 478 521, 100 3, 980, 000Food and kindred products 7 3, 340 118, 000Textile-mill products 1 10 10Apparel and other finished products made from fabrics and
similar materials' 2 130 1, 490Lumber and timber basic products 1 70 210Furniture and finished lumber products 8 2,900 40,000Paper and allied products 12 4,680 50,800Printing, publishing, and allied industries 2 290 1,470Chemicals and allied products 9 4,550 67,100Products of petroleum and coal 1 420 7, 180Rubber products 8 15, 600 132,000Leather and leather products 2 1, 500 1, 800Stone, clay, and glass products 1 180 3,480Iron and steel and their products 98 48,600 327, 000Nonferrous metals and their products 20 8, 570 46,200Machinery (except electrical) 76 41, 500 398, 000Electrical machinery 5 14,200 33,700Transportation equipment (except automobiles) 37 34, 900 203, 000Automobiles and automobile equipment 117 318, 000 4, 298,000Miscellaneous manufacturing industries 12 1, 890 96, 700Mining 2 130 1, 680Construction 9 7,260 25,300Trade 22 8,210 82, 400Finance, insurance, and real estate 1 60 2, 110Transportation, communication, and other public utilities 24 4,420 22,200Services-personal, business, and other 1 10 10Other nonmanufacturing industries 2 60 740
Minnesota 29 10,900 246,000Food and kindred products 8 4, 590 72, 300Apparel and other finished products made from fabrics and
similar materials 1 80 2,290Lumber and timber basic products 2 830 3,660Printing, publishing, and allied industries 1 20 290Chemicals and allied products 1 10 950Leather and leather products 1 180 180Iron and steel and their products 4 1,380 52,700Machinery (except electrical) 5 1,090 30,450Construction 2 290 1, 720Trade 1 60 660Transportation, communication, and other public utilities 2 2,370 81,000Other nonmanufacturing industries 1 60 90
See footnotes at end of table.

38
TABLE A.-Work Stoppages in 1945 in States Which Had 25 or More Stoppages Duringthe Year, by Industry Group-Continued
State and industry group
Number of-
Stoppages Workersinvolved 1
Man-daysidle dur-ing 1945 1
Missouri 148 70, 800 901, 000Food and kindred products 12 5, 190 18, 100Tobacco manufactures 1 190 740Textile-mill products 2 250 900Apparel and other finished products made from fabrics and
similar materials 5 2,320 58, 400Lumber and timber basic products 1 50 320Furniture and finished lumber products 3 980 39, 400Paper and allied products 4 780 - 45, 400Printing, publishing, and allied industries 4 2,540 31, 800Chemicals and allied products 1 30 120Products of petroleum and coal 2 790 3, 310Rubber products 2 880 4,380Leather and leather products 14 6,860 23, 000Stone, clay, and glass products 5 3,970 125,000Iron and steel and their products Nonferrous metals and their products
166
6,8702,910
49, 20042, 000
Machinery (except electrical) 9 3,590 61,000Electrical machinery_ 2 600 590Transportation equipment (except automobiles) 11 11,700 57, 800Automobiles and automobile equipment 3 11,500 216, 000Miscellaneous manufacturing industries 6 850 2, 410Agriculture, forestry, and fishing 2 30 230Mining 3 70 1, 530Construction 5 660 12,700Trade 11 4,150 36, 700Transportation, communication, and other public utilities 14 2,790 66, 400Services-personal, business, and other 3 100 1, 810Other nonmanufacturing industries 1 40 1, 850
New Jersey 252 168, 100 I, 778, 000Food and kindred products 17 9, 170 124, 000Tobacco manufactures 6 2, 770 39, 400Textile-mill products 22 12, 100 153, 000Apparel and other finished products made from fabrics and
similar materials 10 • 1, 430 11, 500Furniture and finished lumber products 6 1, 110 16, 800Paper and allied products 11 2, 070 32,900Printing, publishing, and allied industries 5 250 3, 490Chemicals and allied products 11 3, 810 36,800Products of petroleum and coal 3 810 4, 750Rubber products 8 2, 770 41, 660Leather and leather products 3 2, 330 27, 500Stone, clay, and glass products 5 2, 760 17, 700Iron and steel and their products 20 13,000 275, 000Nonferrous metals and their products 10 5, 480 15, 900Machinery (except electrical) 17 10,300 176, 000Electrical machinery 12 6, 650 116, 000Transportation equipment (except automobiles) 14 54, 200 186, 000Automobiles and automobile equipment 5 13, 400 254, 000Miscellaneous manufacturing industries 6 3, 200 58, 900Mining 1 30 170Construction 13 1, 930 14, 700Trade 18 2, 900 33, 900Transportation, communication, and other public utilities 25 15, 600 136, 000Services-personal, business, and other 5 150 780Other nonmanufacturing industries 1 30 80
New York 361 174, 800 1,398,000Food and kindred products 21 8, 380 62,700Tobacco manufactures 1 30 660Textile-mill products 18 14, 000 91,300Apparel and other finished products made from fabrics and
similar materials 33 3, 000 19, 000Furniture and finished lumber products 19 2, 050 30,900Paper and allied products 19 2, 860 33, 200Printing, publishing, and allied industries 3 010 25, 700Chemicals and allied products 10 140 20, 500Products of petroleum and coal_ 3 690 4, 490Rubber products 1 410 7, 380Leather and leather products 8 5, 470 14, 000Stone, clay, and glass products 3 270 2, 150Iron and steel and their products 41 18, 000 104, 000Nonferrous metals and their products 17 9, 340 87, 200Machinery (except electrical) 12 2, 340 24, 300Electrical machinery 16 7, 160 27, 000Transportation equipment (except automobiles) 15 17, 300 58, 400Automobiles and automobile equipment 4 9, 870 266, 000
See footnotes at end of table.

39
TABLE A.- Work Stoppages in 1945 in States Which Had 25 or More Stoppages Duringthe Year, by Industry Group-Continued
State and industry group
Number of-
Stoppages Workersinvolved I
Man-daysidle dur-ing 1945
New York-Continued.Miscellaneous manufacturing industries Agriculture, forestry, and fishing
121
4, 17080
21, 70080
Construction 12 8, 720 121, 000Trade 30 4, 560 32, 400Finance, insurance, and real estate 12 15, 300 70, 100Transportation, communication, and other public utilities 37 34, 100 259, 000Services-personal, business, and other 15 1, 750 12, 800
North Carolina 37 17, 500 438,000Tobacco manufactures 2 1, 430 3, 220Textile-mill products 19 11, 700 363, 000Furniture and finished lumber products 1 50 560Paper and allied products 2 110 960Leather and leather products 3 650 2, 050Iron and steel and their products 2 50 300Machinery (except electrical) 2 220 11, 700Electrical machinery 1 20 40Transportation equipment (except automobiles) 1 1, 620 3, 240Transportation, communication, and other public utilities_ 2 730 2, 400Services-personal, business, and other 2 890 50, 000
Ohio 477 417, 900 5, 435, 000Food and kindred products 13 680 4, 310Tobacco manufactures 1 80 5, 200Textile-mill products 4 3,110 12, 000Apparel and other finished products made from fabrics and
similar materials 2 710 6, 030Furniture and finished lumber products 8 4,130 58,700Paper and allied products 5 2,310 18,100Printing, publishing, and allied industries 1 20 530Chemicals and allied products 15 4, 240 25, 500Products of petroleum and coal 4 4, 010 49, 700Rubber products 45 164, 000 948, 000Leather and leather products 3 1, 790 2, 360Stone, clay, and glass products 22 14, 800 301, 000Iron and steel and their products 127 60, 000 459, 000Nonferrous metals and their products 18 4, 220 II, 800Machinery (except electrical) 32 33,200 351,000Electrical machinery 16 21,800 214,000Transportation equipment (except automobiles) 21 38, 200 162, 000Automobiles and automobile equipment 19 26, 000 449, 000Miscellaneous manufacturing industries 6 1,310 7,060Agriculture, forestry, and fishing 2 100 I, 030Mining 47 26, 300 215, 000Construction 18 1,630 18, 100Trade 10 590 3,910Finance, Insurance, and real estate 2 150 6,480Transportation, communication, and other public utilities 27 3, 900 88, 800Services-personal, business, and other 8 630 16,700Other nonmanufacturing industries 1 10 30
Oregon 38 25, 900 954. 000Food and kindred products 2 310 7,520Lumber and timber basic products 21 21,200 933,000Furniture and finished lumber products 4 980 2, 330Transportation, communication, and other public utilities 6 3, 220 9, 860Agriculture, forestry, and fishing 1 190 1, 290Construction 2 10 20
Pennsylvania 743 599, 300 5. 922. 000Food and kindred products 10 7, 280 78, 600Tobacco manufactures 1 700 37,800Textile-mill products 10 3, 860 11,100Apparel and other finished products made from fabrics and
similar materials 27 3, 380 32, 300Furniture and finished lumber products 6 490 2,200Paper and allied products 6 1, 190 4, 830Printing, publishing, and allied industries 4 1, 400 28, 000Chemicals and allied products 16 5,030 27,000Products of petroleum and coal 7 3, 050 19, 900Rubber products 3 2, 350 42, 500Leather and leather products 9 6, 130 25, 200Stone, clay, and glass products 24 19, 400 361, 000Iron and steel and their products 211 115, 000 947, 000Nonferrous metals and their products 21 11, 400 46, 500Machinery (except electrical) 32 33, 700 247,000Electrical machinery 14 47,500 498,000
See footnotes at end of table.

40TABLE A.-Work Stoppages in 1945 in States Which Had 25 or More Stoppages During
the Year, by Industry Group-Continued
State and industry group
Number of-
Stoppages Workersinvolved 1
Man-daysidle dur-ing 1945 1
Pennsylvania-Continued.Transportation equipment (except automobiles) 38 26, 700 122, 000Automobiles and automobile equipment Miscellaneous manufacturing industries Mining Construction Trade
56
211178
8, 7604, 350
287, 000870
1, 700
118, 000209, 000
2, 946, 0004, 090
16, 700Finance, insurance, and real estate 1 30 450Transportation, communication, and other public utilities 44 7, 580 93, 800Services-personal, business, and other Other nonmanufacturing industries
84
400130
2, 650330
Rhode Island 47 22, 900 458, 000Tobacco manufactures Textile-mill products
126
4014, 000
310214, 000Paper and allied products
Rubber products 23
1501, 070
710480Iron and steel and their products 2 5 390 10Machinery (except electrical) 2 5, 750 235, 000Electrical machinery 2 440 1, 010Transportation equipment (except automobiles) 1 550 550Miscellaneous manufacturing industries
Construction 11
20020
1, 200200Trade 2 40 220
Transportation, communication, and other public utilities 4 250 280Tennessee 118 89, 800 481,000Food and kindred products 1 70 560Textile-mill products 2 190 2, 490Apparel and other finished products made from fabrics and sim-
ilar materials 1 720 18, 600Lumber and timber basic products 4 380 1, 700Furniture and finished lumber products 2 190 920Paper and allied products Chemicals and allied products .5- 4
1,510630
24, 3009, 850Rubber products 8 23, 000 50, 300Leather and leather products 2 650 7, 670Iron and steel and their products 11 4, 240 26, 100Nonferrous metals and their products 4 9, 740 63, 900Machinery (except electrical) 3 1, 430 4, 110Miscellaneous manufacturing industries 1 230 5, 180Mining 38 20, 500 175, 000Construction 6 3, 770 45, 000Trade 5 140 2, 030
Transportation, communication, and other public utilities 20 2, 310 21,200Services-personal, business, and other 1 170 2, 560
Texas 72 73, god 510, 000Food and kindred products 5 1, 570 3, 250Textile-mill products 1 800 17, 400Apparel and other finished products made from fabrics and simi-lar materials 1 200 7, 410Paper and allied products 1 170 340Printing, publishing, and allied industries 5 180 4, 040Chemicals and allied products 7 2, 760 35, 800Products of petroleum and coal 7 21, 100 212, 000Rubber products 2 220 240Stone, clay, and glass products 2 210 2, 520Iron and steel and their products 2 2, 620 12, 900Machinery (except electrical) 2 1, 150 4, 450Transportation equipment (except automobiles) 8 31, 600 103, 000Miscellaneous manufacturing industries 1 80 2, 870Mining 2 2, 520 17, 600Construction 5 550 8, 540Trade 2 20 60Finance, insurance, and real estate 1 10 10Transportation, communication, and other public utilities 19 7, 709 72, 700
Services-personal, business, and other 370 5, 840Other nonmanufacturing industries 30 140Virginia 88 40,300 255, 000Textile-mill products 3 1, 780 5, 160
Apparel and other finished products made from fabrics and simi-lar materials 1 130 250Lumber and timber basic products 1, 240Paper and allied products 3 1, 910 10, 800Leather and leather products 3 2, 280 65, 700Stone, clay, and glass products 1 20 20
See footnotes at end of table.

41TABLE A.-Work Stoppages in 1945 in States Which Had 25 or More Stoppages During
-the Year, by Industry Group-Continued
State and industry group
Number of-
Stoppages workersinvolved I
Man-daysidle dur-ing 1445 1
Virginia-Continued.Nonferrous metals and their products 1 660 3, 450Machinery (except electrical) 1 320 7, 310Transportation equipment (except automobiles) 2 80 490Mining 43 28, 800 138, 900Construction 10 2, 960 11, 100Trade 5 130 520Transportation, communication, and other public utilities 11 1, 000 9, 580Services-personal, business, and other 3 40 320Other nonmanufacturing industries 1 190 190
Washington_ 38 92,500 852, 000Food and kindred products 2 640 1, 750Lumber and timber basic products 13 22, 400 765, 000Furniture and finished lumber products 1 50 90Paper and allied products 1 100 250Printing, publishing, and allied industries 1 1, 270 36, 900Stone, clay, and glass products 1 150 1, 190Iron and steel and their produces 1 40 110Nonferrous metals and their products 1 490 1, 250Transportation equipment (except automobiles) 4 5, 800 34, 100Automobiles and automobile equipment 1 130 260Construction 4 220 1, 310Transportation, communication, and other public utilities 6 1,130 9, 900Services-personal, business, and other 2 20 200
West Virginia 2 128 156, 700 1, 664, OWFood and kindred products 3 340 8, 250Tobacco manufactures 1 330 7, 150Printing, publishing, and allied industries__ 1 20 20Chemicals and allied products 5 3, 650 10, 600Products of petroleum and coal 5 890 8, 800Stone, clay, and glass products 7 7, 030 182, 000Iron and steel and their products 10 5, 880 36, 900Nonferrous metals and their products 4 2, 770 19, 400Machinery (except electrical) 1 270 1, 610Electrical machinery 1 230 2, 070Transportation equipment (except automobiles) 2 1, 180 4, 100Miscellaneous manufacturing industries 1 390 780Mining 72 132, 000 1, 370, 000Construction 6 1, 100 7, 600Trade 2 80 520Transportation, communication, and other public utilities 5 510 2, 620Services-personal, business, and other 2 70 2, 100Other nonmanufacturing industries 1 10 80
Wisconsin 88 44, 100 600, 000Food and kindred products 6 2,020 • 56,300Textile-mill products 1 530 1, 600Apparel and other finished products made from fabrics and
similar materials 2 350 460Lumber and timber basic products 3 640 36, 700Furniture and finished lumber products 5 3, 600 100, 000Paper and allied products 2 220 280Rubber products 4 4, 850 30, 700Leather and leather products 2 1, 010 1,010Iron and steel and their products 21 5, 330 97, 900Nonferrous metals and their products 3 2, 420 82, 400Machinery (except electrical) 12 12, 100 88, 400Electrical machinery 4 2, 910 52, 700Transportation equipment (except automobiles) 3 1, 770 54, 100Automobiles and automobile equipment 6 4,870 27, 400Miscellaneous manufacturing industries ,_ 2 190 440Mining 2 40 70Construction_ 4 230 880Trade 2 100 1, 770Finance, insurance, and real estate 1 10 10Transportation, communication, and other public utilities 4 450 6, 070Services-personal, business, and other 2 20 160Other nonmanufacturing industries 5 450 550
I Due to rounding of figures, the State totals are not in every case the exact suns of the industry grouptotals which follow.
This figure is less than the sum of the figures below. This is because one or more strikes, each affectingmore than one industry, have been counted as separate strikes in each industry affected, with the properallocation of workers and man-days idle to each industry.
3 Most of these workers were involved in an interstate stoppage which began in 1945 although the RhodeIsland workers involved did not,lose time until 1946. U. S. GOVERNMENT PRINTING OFFICE: 1945