Women's Work and Working Women - University Of … · GENDER & SOCIETY / June 2001Cotter et al. /...
24
GENDER & SOCIETY / June 2001 Cotter et al. / WOMEN’S WORK WOMEN’S WORK AND WORKING WOMEN The Demand for Female Labor DAVID A. COTTER Union College JOAN M. HERMSEN University of Missouri, Columbia REEVE VANNEMAN University of Maryland The demand for female labor is a central explanatory component of macrostructural theories of gender stratification. This study analyzes how the structural demand for female labor affects gender differences in labor force participation. The authors develop a measure of the gendered demand for labor by index- ing the degree to which the occupational structure is skewed toward usually male or female occupations. Using census data from 1910 through 1990 and National Longitudinal Sample of Youth (NLSY) data from 261 contemporary U.S. labor markets, the authors show that the gender difference in labor force participation covaries across time and space with this measure of the demand for female labor. The first condition for the liberation of the wife is to bring the whole female sex back into public industry. —Friedrich Engels ([1884] 1942, 66) It is through gainful employment that woman has traversed most of the distance that separated her from the male; and nothing else can guarantee her liberty in practice. Once she ceases to be a parasite the system based on her dependence crumbles; between her and the universe there is no longer any need for a masculine mediator. —Simone De Beauvoir ([1949] 1989, 679) The kids are great. But going to work, that’s like, hmmmm, that’s like another reason to live. Since I went to work I’m more interested in life and life’s more interested in me. Latina store manager and mother of three as quoted by Lillian Rubin (1994, 81) 429 AUTHORS’ NOTE: Authors are listed alphabetically to reflect the equal sharing of work. An early ver- sion of this article was presented at the Population Association of America meetings, March 1999. Sup- port for this research was provided by grants from the National Science Foundation (SBR-9422546, SBR-9870949, SBR-9870980, and SBR-9871204). GENDER & SOCIETY, Vol. 15 No. 3, June 2001 429-452 © 2001 Sociologists for Women in Society
Transcript of Women's Work and Working Women - University Of … · GENDER & SOCIETY / June 2001Cotter et al. /...
GENDER & SOCIETY / June 2001Cotter et al. / WOMEN’S WORK
WOMEN’S WORK AND WORKING WOMENThe Demand for Female Labor
DAVID A. COTTERUnion College
JOAN M. HERMSENUniversity of Missouri, Columbia
REEVE VANNEMANUniversity of Maryland
The demand for female labor is a central explanatory component of macrostructural theories of genderstratification. This study analyzes how the structural demand for female labor affects gender differencesin labor force participation. The authors develop a measure of the gendered demand for labor by index-ing the degree to which the occupational structure is skewed toward usually male or female occupations.Using census data from 1910 through 1990 and National Longitudinal Sample of Youth (NLSY) datafrom 261 contemporary U.S. labor markets, the authors show that the gender difference in labor forceparticipation covaries across time and space with this measure of the demand for female labor.
The first condition for the liberation of the wife is to bring the whole female sex backinto public industry.
—Friedrich Engels ([1884] 1942, 66)
It is through gainful employment that woman has traversed most of the distance thatseparated her from the male; and nothing else can guarantee her liberty in practice.Once she ceases to be a parasite the system based on her dependence crumbles;between her and the universe there is no longer any need for a masculine mediator.
—Simone De Beauvoir ([1949] 1989, 679)
The kids are great. But going to work, that’s like, hmmmm, that’s like another reason tolive. Since I went to work I’m more interested in life and life’s more interested in me.
Latina store manager and mother of threeas quoted by Lillian Rubin (1994, 81)
429
AUTHORS’ NOTE: Authors are listed alphabetically to reflect the equal sharing of work. An early ver-sion of this article was presented at the Population Association of America meetings, March 1999. Sup-port for this research was provided by grants from the National Science Foundation (SBR-9422546,SBR-9870949, SBR-9870980, and SBR-9871204).
GENDER & SOCIETY, Vol. 15 No. 3, June 2001 429-452© 2001 Sociologists for Women in Society
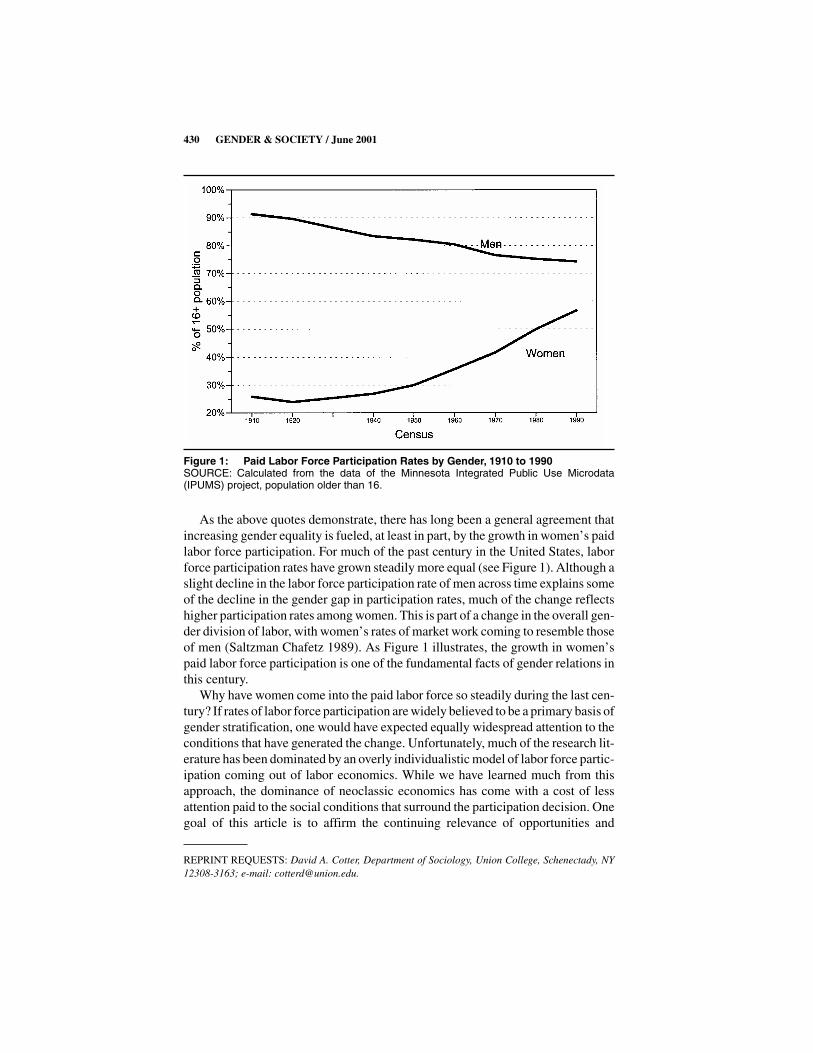
As the above quotes demonstrate, there has long been a general agreement thatincreasing gender equality is fueled, at least in part, by the growth in women’s paidlabor force participation. For much of the past century in the United States, laborforce participation rates have grown steadily more equal (see Figure 1). Although aslight decline in the labor force participation rate of men across time explains someof the decline in the gender gap in participation rates, much of the change reflectshigher participation rates among women. This is part of a change in the overall gen-der division of labor, with women’s rates of market work coming to resemble thoseof men (Saltzman Chafetz 1989). As Figure 1 illustrates, the growth in women’spaid labor force participation is one of the fundamental facts of gender relations inthis century.
Why have women come into the paid labor force so steadily during the last cen-tury? If rates of labor force participation are widely believed to be a primary basis ofgender stratification, one would have expected equally widespread attention to theconditions that have generated the change. Unfortunately, much of the research lit-erature has been dominated by an overly individualistic model of labor force partic-ipation coming out of labor economics. While we have learned much from thisapproach, the dominance of neoclassic economics has come with a cost of lessattention paid to the social conditions that surround the participation decision. Onegoal of this article is to affirm the continuing relevance of opportunities and
430 GENDER & SOCIETY / June 2001
REPRINT REQUESTS: David A. Cotter, Department of Sociology, Union College, Schenectady, NY12308-3163; e-mail: [email protected].
Figure 1: Paid Labor Force Participation Rates by Gender, 1910 to 1990SOURCE: Calculated from the data of the Minnesota Integrated Public Use Microdata(IPUMS) project, population older than 16.
contexts as an explanation of labor force trends by focusing on the demand forfemale labor as an indicator of the employment opportunity structure.
Specifically, in this study, we demonstrate the relationship between the demandfor female labor and the rising female share of the labor force across both time andspace. We begin by defining a measure of the demand for female labor that we firstuse to examine the historical changes in the occupational structure that led to anincreased demand for women’s labor, and then we turn to a series of cross-sectionalanalyses of the relationship between the demand for female labor and women’slabor force participation across contemporary metropolitan areas (MAs).
Background Literature
Standard microeconomic models of labor force participation have emphasizedthe incentive effects of women’s potential wages as indexed by their education, thedisincentives from husbands’ and other family income, and the economic rational-ity of a family division of labor that relegates women more often to unpaid house-hold labor (e.g., Killingsworth and Heckman 1986). Cross-sectional studies thusfocus on education, other family income, and the presence and age of children asprimary determinants of women’s labor force participation (e.g., Cramer 1980;Felmlee 1993). Each of these individual-level factors has its analogue in longitudi-nal explanations of the century-long rise in women’s entry into the labor market.Thus, women’s steadily rising education has raised the opportunity costs of stayingout of paid work, and declining fertility, to the extent it is not itself a consequence ofincreased labor force participation, has removed some of the constraints on women’slabor force decisions (Smith and Ward 1984). More recently, men’s declining earn-ings since the mid-1970s have appeared to validate the popular explanations basedon family economic need (Myers 1985), although an economic-need explanation ishardly consistent with the simultaneous increases in men’s earnings and women’slabor force participation throughout the third quarter of the century.
Consistent with the microeconomic origins of this work, most of these explana-tions focus on characteristics of women or, at best, their immediate families, as thesource of changes in the decisions to participate in the labor force. But whilewomen have undeniably changed during the last century, so too have the situationsin which women find themselves. These changes in opportunity structures havereceived less systematic attention in the research literature. Sometimes, area-levelunemployment rates are included in cross-sectional studies as one concession todemand-side factors (Browne 1997; Figueroa and Melendez 1993; Kahn and Whit-tington 1995), but the fluctuations of unemployment with the business cycle are notuseful as an explanation of the long-term growth in women’s labor force participa-tion. Moreover, the unemployment rate does not adequately capture the concept ofemployment opportunities as it conflates labor supply and labor demand factors.
Rising wage rates during the last century have also been used to explain thenarrowing gender gap in labor force participation. In this analysis, higher wagesaffect genders differently because for men, the increased income causes men to
Cotter et al. / WOMEN’S WORK 431
substitute leisure for work, while for women the incentive effect of higher wagespredominates.
An alternative perspective is found in Oppenheimer’s (1970, 1973) analyses ofthe shifts in the occupational structure in the post–World War II United States. Sheargues that “continued economic development in our society has increased thedemand for female labor, which combined with demographically induced shifts inthe supply of women, has resulted in a considerable” rise in women’s labor forceparticipation (1973, 186). Increases in the demand for female labor resulted fromwomen’s traditional domination of occupations that “were destined to expandenormously with the industrial growth of our society” (p. 189), such as nurses,teachers, and librarians. The rising demand for female labor pulled older and mar-ried women into the labor market. The converse side of this explanation is that thediscrimination that women faced in entering male-dominated occupations severelylimited their economic opportunities in the early part of the century. It is only as thefew positions traditionally open to women happened to expand enormously duringthe twentieth century that women found themselves in situations in which they hadtrue economic choices to make.
A gender-specific demand for labor requires some degree of gender segregation—that within each society at every point in time there are some tasks that are reservedpredominantly for women and others for men. These forms of segregation are quitefixed in the short run but mutable in the long run. For instance, clerical occupationshad long been bastions of male employment until the turn of the century when theyquickly became predominantly female (Reskin and Roos 1990). The same was trueof schoolteachers in an earlier period and bank tellers some years later. The demandfor female labor and the gender segregation of occupations are themselves dynami-cally related, but the nature of this relationship goes beyond the scope of this article.As long as the processes of social closure that restrict women to particular areas ofemployment are in operation, women’s level of market work is limited by the sizeof the occupational sectors to which they are regularly admitted. We return to thisimportant issue in the discussion but make the simplifying assumption here of anexogenously determined occupational structure that determines the demand forfemale labor at any particular point in time and space.
Oppenheimer’s opportunity-based explanation has always been well received inmore sociological discussions of gender stratification. For example, Huber andSpitze (1983) link the growth in women’s labor force participation to the expansionof the service economy and to the growth of large bureaucracies that increase theamount of “paper shuffling”—a task defined as women’s work. Jones and Rosenfeld(1989) found that women’s share of the local labor force is greater in MAs withgreater employment in public administration.
The emphasis on the demand for female labor has also been generalized in moretheoretical explanations of the whole range of gender stratification outcomes.Saltzman Chafetz (1989, 146), for example, contends that
432 GENDER & SOCIETY / June 2001

if the overall demand for women’s labor remains high over a long enough period oftime, then their [women’s] increased access to power resources should begin to affectboth the division of household labor and their entry into more highly coveted laborforce roles, in an equalitarian direction.
Similarly, Lesser Blumberg (1984) argues that it is the “strategic indispensability”of women’s labor that contributes to their overall status. Huber (1990) adapts thosearguments to explain changes in gender stratification in contemporary, industrial-ized societies.
These ideas about the centrality of the demand for female labor can be traced backto Engels who claimed that women’s emancipation would come from the demand fortheir labor—and subsequent employment—in modern industry.
The emancipation of woman will only be possible when woman can take part in pro-duction on a large, social scale, and domestic work no longer claims anything but aninsignificant amount of her time. Only now has that become possible through modernlarge-scale industry, which does not merely permit the employment of female laborover a wide range but positively demands it. (Friedrich Engels [1884] 1942, 148)
Although Engels was correct in highlighting the demand for female labor as animportant element in changing gender stratification, he overstated the potential effectof industrial demand. Indeed, it was not industrial factory work but rather postindus-trial service work that pulled large numbers of women into the labor force. Never-theless, Engels does point to the structural roots of gender stratification.
Economic demand theories are not the only situationally focused explanationsof women’s labor force participation. Politics and culture have changed too duringthe last century, and both types of changes have probably facilitated women’s entryinto the labor force (Gornick, Meyers, and Ross 1998; Valian 1999). For example,equal employment legislation has put employers on notice that gender discrimina-tion in hiring may bring with it legal costs. And as Harriet Nelson and June Cleaverhave yielded their places to Mary Tyler Moore and Murphy Brown, people’s expec-tations of women’s economic roles have also changed. But like explanations basedon fertility and educational changes, it is difficult to sort out cause and effect inobserving the association between women’s rising labor force participation and thepolitical or cultural changes that have accompanied that trend. Oppenheimer’semphasis on the demand for female labor enjoys an advantage in this regard in thatit is more clearly grounded in economic changes outside the system of gender rela-tions. It is the changing shape of the nation’s economy that shifts employment frommanufacturing (and agriculture) to the service sector, and it is growing firm size andits attendant problems of organizational control that leads to bureaucratization andincreases in clerical work. Thus, the demand for female labor has both a theoreticaland methodological appeal as an independent change that may set in motion thevarious other mutually reinforcing political, economic, cultural, and social changesthat reduce gender inequalities.
Cotter et al. / WOMEN’S WORK 433
Opportunity theories of gender stratification are nevertheless difficult to testsince they are best examined over both time and space (Dunn, Almquist, andSaltzman Chafetz 1993). Therefore, despite the theoretical interest, relatively fewempirical studies have addressed the importance of the demand for female labor.Anthropologists have used the Human Relations Area Files to test portions of thetheories on preliterate societies (Lesser Blumberg 1984). And indirect measuressuch as the size of the government sector that appear in some macrolevel studies areconsistent with the female demand explanation.
Finally, although opportunity theories typically describe secular changes, thesetheories are applicable to describing variation across contemporary labor markets.There are numerous analyses of inequality in U.S. labor market areas. For example,as Kodras and Padavic (1993) demonstrate, there is considerable variation inwomen’s occupational employment opportunities across labor market areas. Inaddition, Lorence (1992) has shown that a decline in opportunities for “typical”male employment in some MAs is linked to lower occupational gender segregationin these same areas. And McCall (2000) found that “causalization” (e.g., temporaryemployment, unincorporated self-employed), a potential indicator of a lack ofopportunity, is associated with greater within-gender earnings inequality. Whileimportant contributions to our understanding of the relationship between labormarket opportunity structures and inequality, these articles do not directly test thedemand-for-female-labor thesis we test in this article.
Operationalizing the Demand for Female Labor
Following Oppenheimer (1970), we measure the demand for female labor as theextent to which the occupational structure is skewed toward predominantly femaleoccupations. She reasoned that when employment increased among historicallyfemale occupations such as clerical and service work, the demand for female laborwould grow, and more women would be pulled into the paid labor market.
Oppenheimer’s measure was based on the number of women employed in occu-pations that were at least 70 percent female. We extend her methods in two ways.First, rather than using an arbitrary 70 percent cutoff to separate male from femaleoccupations, we construct a weighted average of all occupations with the weightsgiven by the national female share of the occupation. Second, we use total employ-ment rather than just female employment because we want a measure of the overalloccupational structure of the labor market; a measure based on female employmentincorporates aspects of female labor force participation that we want to measureindependently. A labor market can then be categorized as having a high or lowdemand for female labor.
In the analyses to follow, we develop a demand measure for over-time compari-sons, as well as a demand measure for comparisons across contemporary labor mar-kets. The measure of female demand used in the historical analysis is:
434 GENDER & SOCIETY / June 2001

Demand for Female Labor female Py i iyi
nocc
==∑% ,1950
1
,(1)
where
Demand for female labory = the demand for female labor for a given year y,%femalei, 1950 = the female share of occupation i for a base year (1950 in these analyses),
andPiy = the proportion of all workers (men and women) in occupation i for year y.This number represents the expected proportion of the labor force who are women given
the year’s occupational structure but assuming that the female share of each occupa-tion reflects the national average for that occupation in the base year.
For these analyses, we have chosen 1950 as the base year because the 1950 cen-sus is the source of the occupational codes used by the Minnesota Integrated PublicUse Microdata (IPUMS) project to code occupations for all censuses (Ruggles,Sobek, et al. 1997). There are 269 occupations in the 1950 IPUMS codes. In addi-tion, 1950 is in the center of the time series we are describing (1910 to 1990). Fin-ally, the 1950 sample size is large enough to provide reliable estimates of the per-centage female for each occupation. There are two drawbacks with using the 1950occupation codes. First, for the period prior to 1950, we are using future (1950)occupational gender composition to predict past labor force participation rates.Second, we are using 1950 occupational gender composition to predict labor forcepatterns in the 1970s and 1980s, even though we know gender composition of occu-pations changed significantly during this later period. While the choice of base yearsomewhat affects the plots of the demand for female labor, the same general trendsare observed no matter which base year is chosen. Thus, we opt for the common1950 standard.
The measure varies across years according to changes in the occupational struc-ture, not the observed rate of women’s participation in the labor force. A similarmeasure of demand can be calculated to compare MA labor markets rather thanyears. To do so, the female share of the occupation in 1950 is substituted with thenational female share of the occupation in 1990, and the proportion of workers inoccupation i for year y is substituted with the proportion of workers in occupation ifor MA j.
HISTORICAL ANALYSES
Data
We draw on data from the IPUMS project for the historical analysis. The IPUMSfiles consist of samples of individual-level records from the federal censuses from
Cotter et al. / WOMEN’S WORK 435
1850 to 1990 (Ruggles, Sobek, et al. 1997). Employment data in each census havebeen recoded into a common set of occupational categories based on the 1950 cen-sus codes. We begin the analysis in 1910 because census data prior to that timeseverely undercount women’s participation in the paid labor force, especially infarming, the operation of boarding houses, and in large-scale manufacturing firms(Goldin 1990). No 1930 data are available yet from the IPUMS project.
Results
In Table 1 we present the share of the labor force of the 12 major occupationgroups and of selected detailed occupations from 1910 to 1990. The table also liststhe percentage female in 1950 (the base year) for each of these occupational catego-ries. The demand theory argues that the occupations women dominate grew enor-mously, thereby increasing the demand for female labor. For example, nearly 98percent of nurses in 1950 were women, and nurses as a share of the labor force grewsteadily from 0.27 percent to 1.63 percent during the century. In addition, womenheld a greater share of clerical positions, and these occupational positions grewfrom nearly 5 percent of the labor force in 1910 to more than 19 percent by 1970,consistent with the demand framework.
In contrast, many occupations that were male dominated have declined as ashare of the labor force. Miners, for instance, are almost exclusively male. Theycomprised 2.46 percent of the labor force in 1910 but less than a quarter of a percentin 1990. Skilled craft work, another largely male domain, has declined steadily ifless dramatically since 1950. The largest occupational declines have come fromfarmers and farm laborers, also predominantly male occupations as recorded in thecensus.
There are also important exceptions to the growth of female occupations. House-hold service, an overwhelmingly female occupation, declined from 6.05 percent ofthe labor force in 1910 to only 0.53 percent of the labor force in 1990. Also, theshare of clerical workers in the labor force stopped increasing after 1970.
The many changes illustrated in Table 1 are summarized in a single statistic byour index for the demand for female labor. In Figure 2, we plot this expected femaleshare of the labor force over time. The “femaleness” of the occupational structureincreased over time (as Oppenheimer suggested), consistent with the increase infemale labor force participation shown earlier in Figure 1. Thus, there is historicalevidence to suggest that the growth in the demand for female labor—as measuredby the growth in female occupations—has generated some of the growth in femalelabor force participation.
There are also notable deviations from the general pattern. Change in the occu-pational structure is not responsible for the continued growth in women’s laborforce participation after 1970. That is, it is not the growth of traditionally femaleoccupations that is driving the continuing growth in women’s labor force participa-tion rates in the 1970s and 1980s. After 1970, the growth of integrated occupationsand the desegregation of traditionally male occupations, especially managerial
436 GENDER & SOCIETY / June 2001

TABLE 1: Changes Over Time in the U.S. Occupational Structure (source: IPUMS)a
Percentage of Labor Force in Occupation GroupOccupation Group Percentage(1950 codes) Female 1950 1910 1920 1940 1950 1960 1970 1980 1990
Professional, technical 39.60 4.66 5.73 6.87 8.53 10.41 13.77 15.61 18.44Nurses 97.94 0.27 0.34 0.66 0.68 1.05 1.22 1.33 1.63Teachers, not elsewhere classified 74.45 1.70 1.86 2.09 1.93 2.55 3.39 3.47 3.57Librarians 89.66 0.00 0.04 0.07 0.10 0.13 0.16 0.19 0.20
Farmers 2.65 16.46 16.60 10.16 7.24 3.44 1.70 1.27 0.90Managers 13.36 6.82 6.68 7.54 8.58 7.19 6.56 9.11 11.52Clerical 62.12 5.32 8.19 10.18 12.17 17.01 19.08 19.27 19.05
Office machine operators 83.50 0.00 0.03 0.15 0.26 0.57 0.75 0.88 1.15Stenographers, typists, secretaries 94.71 0.84 1.74 2.29 2.76 4.59 5.50 4.73 3.95
Sales 34.34 4.48 4.95 6.23 6.83 7.87 7.29 6.67 6.78Craft 2.96 11.46 14.09 11.88 13.81 12.10 11.67 11.19 10.00Operatives 27.15 15.97 15.53 18.41 20.06 19.12 17.49 14.99 11.89
Mine operatives, laborers 0.13 2.46 2.46 1.54 0.99 0.49 0.26 0.28 0.17Railroad brakemen 0.44 0.26 0.29 0.15 0.13 0.08 0.05 0.07 0.03
Household service 95.64 6.05 3.62 4.50 2.45 2.95 1.83 0.74 0.53Service 44.26 3.65 4.46 7.11 7.80 9.95 12.24 13.66 14.01
Cooks 52.51 0.00 0.46 0.67 0.80 1.00 1.19 1.81 2.07Waiters, waitresses 82.63 0.57 0.53 1.19 1.22 2.08 1.97 1.79 1.36
Farm laborers 23.04 14.07 8.13 6.44 4.38 2.78 1.64 1.16 0.84Laborers 3.42 10.70 11.46 10.23 6.48 5.10 4.69 4.92 4.90Military 1.98 0.36 0.55 0.46 1.68 2.09 2.04 1.39 1.14
a. IPUMS = Minnesota Integrated Public Use Microdata.
437
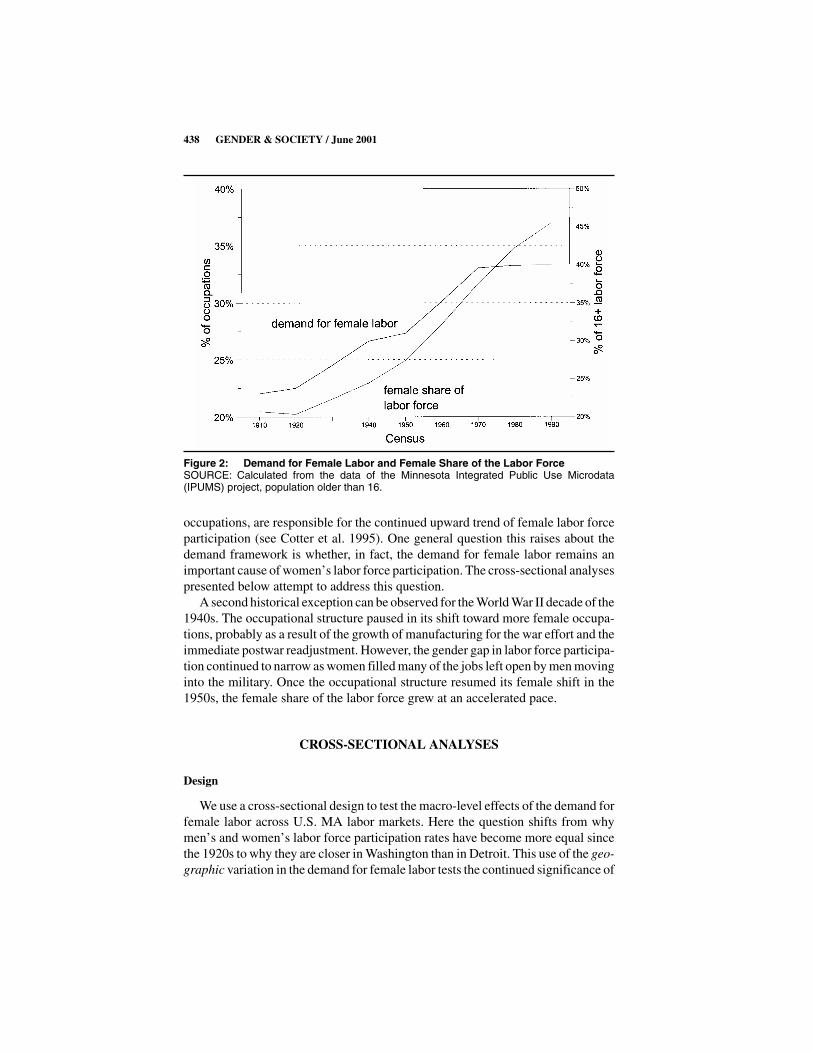
occupations, are responsible for the continued upward trend of female labor forceparticipation (see Cotter et al. 1995). One general question this raises about thedemand framework is whether, in fact, the demand for female labor remains animportant cause of women’s labor force participation. The cross-sectional analysespresented below attempt to address this question.
A second historical exception can be observed for the World War II decade of the1940s. The occupational structure paused in its shift toward more female occupa-tions, probably as a result of the growth of manufacturing for the war effort and theimmediate postwar readjustment. However, the gender gap in labor force participa-tion continued to narrow as women filled many of the jobs left open by men movinginto the military. Once the occupational structure resumed its female shift in the1950s, the female share of the labor force grew at an accelerated pace.
CROSS-SECTIONAL ANALYSES
Design
We use a cross-sectional design to test the macro-level effects of the demand forfemale labor across U.S. MA labor markets. Here the question shifts from whymen’s and women’s labor force participation rates have become more equal sincethe 1920s to why they are closer in Washington than in Detroit. This use of the geo-graphic variation in the demand for female labor tests the continued significance of
438 GENDER & SOCIETY / June 2001
Figure 2: Demand for Female Labor and Female Share of the Labor ForceSOURCE: Calculated from the data of the Minnesota Integrated Public Use Microdata(IPUMS) project, population older than 16.
the demand framework as a significant cause of gender differences in labor forceparticipation even after the leveling off of the demand trend line in the 1970s.
The cross-sectional MA analysis also provides a more rigorous test that incorpo-rates both the conventional individual-level neoclassic factors describing individ-ual characteristics and the macro-level demand factors that reflect situationalopportunities. The historical analysis presented above shows a simple bivariateassociation over time. It does not take into account the changing characteristics oflabor force participants (e.g., the increases in women’s schooling) that also influ-ence declines in the gender gap in labor force participation. The cross-sectional,multilevel analysis includes the individual-level factors and then tests whether thedemand for female labor accounts for the remaining variation across MAs in genderdifferences in labor force participation.
We first use Public Use Microdata Samples (PUMS) from the 1990 census toexamine the bivariate association of the demand for female labor with gender dif-ferences in labor force participation across U.S. metropolitan labor markets (U.S.Bureau of the Census 1992). We then apply multilevel logistic regression tech-niques to data from the National Longitudinal Sample of Youth, 1979 (NLSY).Multilevel models are the appropriate method for this study because they bestincorporate into a single design a standard individual-level labor force participationmodel and macro-level equations that reflect the opportunities available to thoseindividuals.
We restrict these analyses to young workers (ages 25-33 in 1990) because of ourindividual-level data. This represents a strong, yet conservative, test of the demandfor female labor explanation. This younger cohort has only a small gender differ-ence in labor force participation rates and they began their work lives after the level-ing-off of the demand for female labor shown in Figure 2 (Goldin 1997). If thedemand for female labor theory predicts a smaller gender gap in labor force partici-pation for this young group of workers, then one would expect the same to be truefor other cohorts where there is greater variation in labor force participation.
Bivariate Variation across Labor Markets
Among 25- to 33-year-old metropolitan residents, 92 percent of men and 75 per-cent of women were in the labor force in 1990. There is substantial variation acrosslabor markets in these labor force participation rates. Table 2 identifies the means,standard deviations, and “best” and “worst” MAs in terms of male and female laborforce participation rates and the gender difference in participation rates. We are par-ticularly interested in the gender difference in labor force participation rates as itreflects the degree of gender inequality. Male and female labor force participationrates differ most in Steubenville, Ohio and Weirton, West Virginia (a gap of 38 per-centage points) and Laredo, Texas (a gap of 33 percentage points). Labor force par-ticipation rates are more similar, and hence the difference smaller, in Jackson,Michigan (where women have a higher participation rate than men) and Lima, Ohio(a gap of 3 percentage points).
Cotter et al. / WOMEN’S WORK 439

TABLE 2: Metropolitan Labor Market Variation in Labor Force Participation Rates and Relative Demand for Female Labor
Gender Differences in The Expected FemaleMale Labor Force Female Labor Labor Force Participation Rates Share of the OccupationalParticipation Rate Force Participation Rate (male-female) Structure
WorstJackson, MI (.70) Steubenville-Weirton, OH-WV (.52) Steubenville-Weirton, OH-WV (.38) Houma, LA (.39)San Luis Obispo, CA (.74) Houma, LA (.56) Laredo, TX (.33) Decatur, AL (.41)Salinas, CA (.81) Laredo, TX (.56) Parkersburg-Marietta, WV-OH (.32) Bakersfield, CA (.41)Lima, OH (.81) Huntington-Ashland, WV-KY-OH (.56) Huntington-Ashland, WV-KY-OH (.30) Elkhart-Goshen, IN (.41)Glens Falls, NY (.81) Visalia-Tulare-Porterville, CA (.60) Houma, LA (.30) Merced, CA (.41)
BestWausau, WI (.98) Rochester, MN (.88) Jackson, MI (–.03) Columbia, MO (.50)Bloomington-Normal, IL (.97) Sioux Falls, SD (.88) Lima, OH (.03) Gainesville, FL (.50)La Crosse, WI-MN (.97) Madison, WI (.87) San Luis Obispo, CA (.03) Tallahassee, FL (.50)Elkhart-Goshen, IN (.97) Lincoln, NE (.86) Glens Falls, NY (.04) Springfield, IL (.50)Anchorage, AK (.97) Wausau, WI (.85) Madison, WI (.05) Rochester, MN (.50)
M = .93 M = .78 M = .14 M = .45SD = .03 SD = .05 SD = .04 SD = .02
440
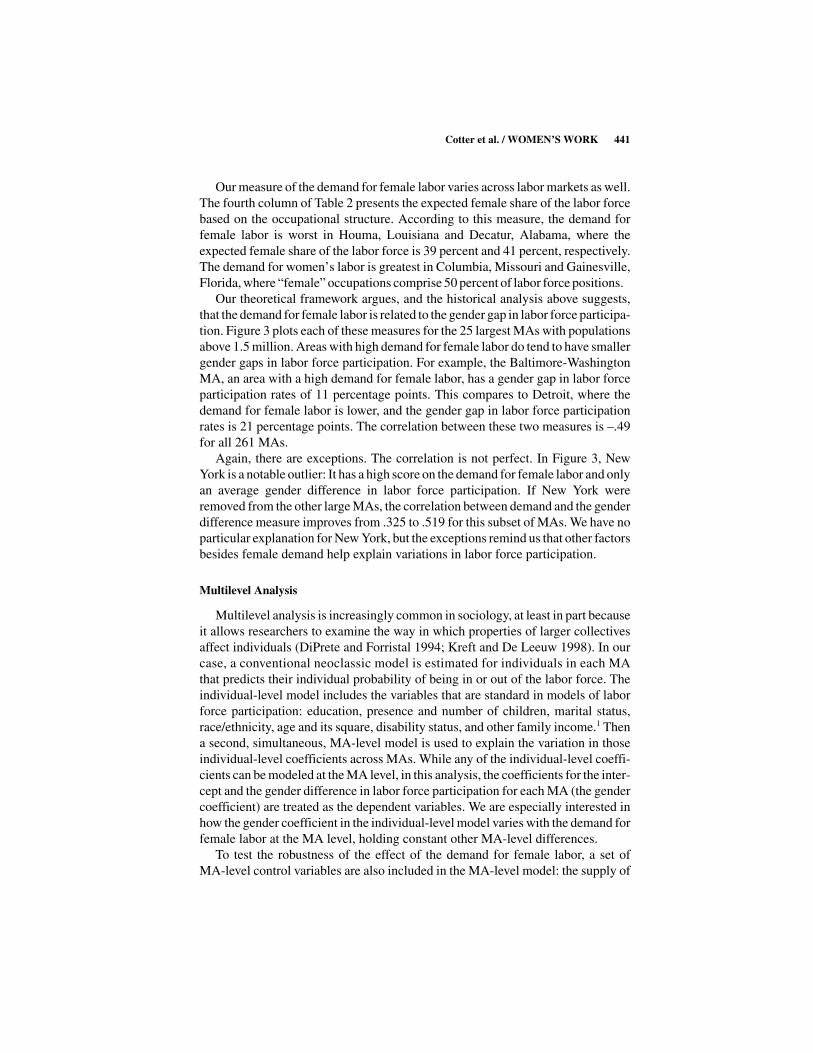
Our measure of the demand for female labor varies across labor markets as well.The fourth column of Table 2 presents the expected female share of the labor forcebased on the occupational structure. According to this measure, the demand forfemale labor is worst in Houma, Louisiana and Decatur, Alabama, where theexpected female share of the labor force is 39 percent and 41 percent, respectively.The demand for women’s labor is greatest in Columbia, Missouri and Gainesville,Florida, where “female” occupations comprise 50 percent of labor force positions.
Our theoretical framework argues, and the historical analysis above suggests,that the demand for female labor is related to the gender gap in labor force participa-tion. Figure 3 plots each of these measures for the 25 largest MAs with populationsabove 1.5 million. Areas with high demand for female labor do tend to have smallergender gaps in labor force participation. For example, the Baltimore-WashingtonMA, an area with a high demand for female labor, has a gender gap in labor forceparticipation rates of 11 percentage points. This compares to Detroit, where thedemand for female labor is lower, and the gender gap in labor force participationrates is 21 percentage points. The correlation between these two measures is –.49for all 261 MAs.
Again, there are exceptions. The correlation is not perfect. In Figure 3, NewYork is a notable outlier: It has a high score on the demand for female labor and onlyan average gender difference in labor force participation. If New York wereremoved from the other large MAs, the correlation between demand and the genderdifference measure improves from .325 to .519 for this subset of MAs. We have noparticular explanation for New York, but the exceptions remind us that other factorsbesides female demand help explain variations in labor force participation.
Multilevel Analysis
Multilevel analysis is increasingly common in sociology, at least in part becauseit allows researchers to examine the way in which properties of larger collectivesaffect individuals (DiPrete and Forristal 1994; Kreft and De Leeuw 1998). In ourcase, a conventional neoclassic model is estimated for individuals in each MAthat predicts their individual probability of being in or out of the labor force. Theindividual-level model includes the variables that are standard in models of laborforce participation: education, presence and number of children, marital status,race/ethnicity, age and its square, disability status, and other family income.1 Thena second, simultaneous, MA-level model is used to explain the variation in thoseindividual-level coefficients across MAs. While any of the individual-level coeffi-cients can be modeled at the MA level, in this analysis, the coefficients for the inter-cept and the gender difference in labor force participation for each MA (the gendercoefficient) are treated as the dependent variables. We are especially interested inhow the gender coefficient in the individual-level model varies with the demand forfemale labor at the MA level, holding constant other MA-level differences.
To test the robustness of the effect of the demand for female labor, a set ofMA-level control variables are also included in the MA-level model: the supply of
Cotter et al. / WOMEN’S WORK 441

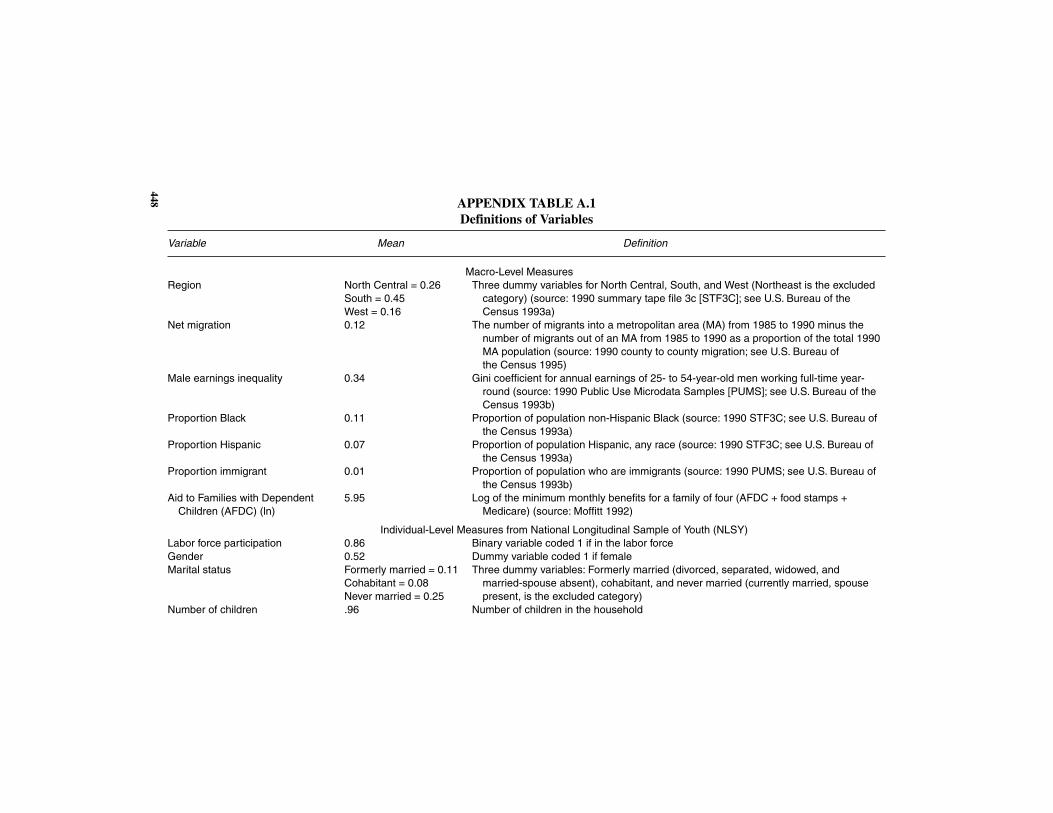
labor, region, net migration during the previous five years, racial/ethnic composi-tion, male income inequality, state Aid to Families with Dependent Children(AFDC) level, and size of immigrant population. The operational definition andsource for each variable are found in Appendix Table A1.
Results: Micro-Level Effects
The results of the multilevel analyses of labor force participation are presentedin Table 3. The bottom panel shows the effects for the standard micro-level models
442 GENDER & SOCIETY / June 2001
Figure 3: Plot of the Gender Difference in Labor Force Participation Rates by theExpected Female Share of the Labor Force (largest 25 metropolitan areas,1990)
NOTE: Data point is the first letter in the name of the metropolitan area.

of labor force participation. Because each individual-level variable (e.g., educa-tion) is interacted with gender, the coefficient in the first column represents theeffect on men and the second, interaction, coefficient represents the differencebetween the effects on women and on men. Therefore, to find the effect for women,one must add the coefficients from the first and second columns. The tests of signif-icance tell us whether the gender differences are statistically significant.
The results reflect the usual individual-level labor supply models. Educationincreases labor force participation rates, slightly more so for women than men.Nonwage family income (including spouse’s earnings) reduces labor force partici-pation rates, again more for women than for men. Disabilities decrease labor forceparticipation rates, more for men than women. Marriage (the comparison group formarital status) increases men’s labor force participation rate, but not women’s,
Cotter et al. / WOMEN’S WORK 443
TABLE 3: Logistic Regression Results for Multilevel Models Predicting Labor ForceParticipation
Effects onEffects on Men Gender Difference
Macro-level effects on labor force participationIntercept 3.014*** –1.457***Demand for female labor –12.368† 17.792*Supply of female labor 1.619 0.157Region: North Central –0.105 0.046Region: South –0.523 0.177Region: West –0.296 0.243Net migration 1.075 1.538Male income inequality –0.261 –6.650Proportion Black 2.954* –4.828**Proportion Hispanic 0.101 –1.590Proportion immigrant 7.094 7.835AFDCa payments (family of four) –0.260 –0.576
Micro-level effects on labor force participationPresence of child age < 2 0.106 –1.150**Presence of child age 2-6 0.172 –0.815*Number of children –0.211† –0.171Cohabitor –0.934*** 0.180Never married –1.687*** 0.877**Formerly married –1.710*** 1.654***African American –0.811*** 1.123***Hispanic –0.279 0.581*Education 0.138*** 0.066†Age 0.072* –0.053Age2 –0.011 0.009Disability –2.826*** 0.958***ln other income –0.091 –0.181*Other income missing –0.261 0.333
a. AFDC = Aid to Families with Dependent Children.†p < .10. *p < .05. **p < .01. ***p < .001.
relative to people who are cohabiting, never married, or formerly married.Children, especially young children, reduce women’s labor force participation butnot men’s. None of these results are surprising; the important point is that all theseeffects are held constant when we look at the MA differences in the intercept (themen’s log-odds of labor force participation) and in the gender coefficient (the dif-ference between the men’s and women’s log-odds).
Results: Macro-Level Effects
The top panel of Table 3 reports the results from the MA-level models. The firstcolumn analyzes the intercept in the individual-level model; it reflects the likeli-hood that men are in the labor force. For example, men are 20.36 times (e3.014) morelikely to be in the labor force as not in the labor force in the average MA. But thisvaries with the occupational structure in the MA. Where the demand for women’slabor is higher (i.e., the relative demand for men’s labor is lower), men are lesslikely to be in the labor force.
The second column analyzes the cross-MA variation in the gender coefficientfrom the individual-level model; it indicates the female-male difference in thelogged odds of labor force participation. In the average MA, gender is a significantpredictor of labor force participation, even after the controls for human capital andfamily status. For example, on average across all MAs, women are nearly five times(3.014 – 1.457 = 1.557, e1.557 = 4.74) more likely to be in the labor force than out ofthe labor force, a figure substantially smaller than that of men (20.36 times). That is,men are approximately 4.3 times (20.36/4.74) more likely than women to be in thelabor force.2 This difference reflects a significant gender gap in labor force partici-pation, even after holding constant other individual-level characteristics.
We are interested in how this gender coefficient varies across metropolitan labormarkets. Our central concern is with the degree to which the relative demand forfemale labor affects the gender gap in labor force participation. The significantcoefficient, 17.792, means that areas with a higher demand for female labor have asmaller gender difference in the odds of labor force participation (i.e., the gendercoefficient is less negative). The effect for the demand for female labor is substan-tively important: It ranges from a prediction that men are 12.5 times more likely tobe in the labor force in places like Houma, Louisiana to just 1.76 times more likelyin places like Columbia, Missouri. That is, in labor markets where there are rela-tively more usually female occupations (as in Columbia, Missouri), the gender dif-ference in labor force participation is markedly smaller.
The marginally significant negative female demand coefficient in the MA-levelequation for the overall intercept (–12.368) suggests that the female demand effectoperates as much through reducing men’s labor force participation as throughincreasing women’s labor force participation. The overall intercept represents thepredicted logged odds of labor force participation for men (i.e., when gender and allthe other variables in the individual-level model are zero). Our measure of femaledemand is a relative measure implying relatively less demand for male labor in
444 GENDER & SOCIETY / June 2001
MAs where female demand is high. Thus, the negative female demand coefficientfor the intercept equation may mean that men’s labor force participation rates arelower where there are many female occupations, few male occupations, or both.
Of the remaining MA-level effects, African American concentration is the onlyfactor to affect the gender differentials in labor force participation. MAs with highproportions of African Americans have larger gender gaps in labor force participa-tion rates. This effect is independent of the racial ethnic characteristics of the per-sons themselves since they are held constant in the micro-level model (and, in fact,have the opposite sign at the individual level). We identify three possible explana-tions for this counterintuitive finding about the effect of an MA’s racial composi-tion. While none of these explanations can be tested adequately within the contextof this article, they deserve further examination.
1. Substitution: What employers may be looking for is simply “devalued” orcheap labor. Either women or African Americans will be sufficient to fill this need.Hence, where there is an ample supply of African Americans, employers have lessneed to tap the pool of potential female workers. However, the level of occupationalsegregation between white women and African American men is nearly equal tothat between white women and white men, so there is little to suggest that employ-ers actually practice this form of substitution.3
2. Stigmatization: African American women have long had higher rates of laborforce participation than white women and have always been relegated to the leastdesirable occupational fields. In areas with large concentrations of African Ameri-cans, there may thus be a significant disincentive for white women to work sincewomen’s working may be associated with the devalued status of AfricanAmericans.
3. Queuing: Labor force participation may be, at least in part, a queuing phe-nomenon for which people fill available slots according to their individual propen-sity to be employed. Since African American women are more likely to enter thelabor force, MAs with many African Americans will fill the female slots morereadily than MAs with few African Americans. A more readily filled queue ofemployment slots will depress a hypothetically average woman’s likelihood ofbeing in the labor force. The queuing interpretation is also consistent with the posi-tive coefficient for African American concentrations on the overall intercept, 2.954,which reflects men’s likelihood of labor force participation. Since African Ameri-can men have a slightly lower individual propensity to be in the labor force, MAswith more African Americans take longer to fill their labor force queues, thus rais-ing the average man’s likelihood of labor force participation.
DISCUSSION
The results of both the cross-sectional and historical analyses provide consider-able support for the role of a specifically female demand for labor in reducing thegender gap in labor force participation. We developed a measure of the gendered
Cotter et al. / WOMEN’S WORK 445

demand for labor by indexing the degree to which the occupational structure isskewed toward usually female occupations, both over time and across contempo-rary labor markets. Consistent with our theoretical framework, the demand forfemale labor grew substantially over much of the twentieth century in concert witha declining gender gap in labor force participation rates. And MA labor marketswith a more female occupational structure in 1990 had more equal labor force par-ticipation rates even after adjusting for individual determinants of labor supply.Together, these results suggest that part of the explanation for the declining gendergap in labor force participation can be found in changing opportunities as well as inchanging characteristics of women themselves.
There are interesting exceptions to each of these analyses. In the cross-sectionalcomparisons, New York has one of the more strongly female occupational struc-tures among large MAs, but the gender gap in labor force participation is still aver-age. Perhaps even more interesting, over time, the demand for workers in typicallyfemale occupations leveled off in the 1970s and 1980s, but the rate of women’s par-ticipation in the paid labor force continued to increase. This does not necessarilymean that the demand for female labor no longer has any causal impact on laborforce participation rates—the multilevel analysis shows that MAs with morefemale occupational structures still have smaller gender gaps in labor force partici-pation. But when the occupational structure unexpectedly stopped shifting towardfemale occupations, that was no longer the engine driving equalizing participationrates.
This suggests that occupational integration has taken over from shifts in theoverall occupational structure as the primary explanation of the declining gendergap in labor force participation. In fact, the occupational structure only began tointegrate in the 1970s. The relative effect of increasing size of female occupations isrelated to the fixity of gender segregation at a given point in time. When the barriersor boundaries between “male” and “female” work are rigid, the only way women’smarket work can expand is through the expansion of “female” occupational spheres.When the barriers to women’s employment in “male” occupations fall, however,women’s employment can increase over and above the growth of “female” occupa-tions.4 There is a causal ordering problem of whether the growth of previously maleoccupations leads to their integration or whether the decline of gender barriersbrings more women into the occupation. That is, does the demand for workers in agiven field increase and, wanting workers, employers deign to hire women? Or, dooccupations become “female” before they begin to expand, and their expansionbrings on this increased demand for women as workers? Most evidence in this areapoints in the direction of mutual causality (Cohn 1999; Reskin and Roos 1990).
A related question is whether the different causes of rising women’s labor forceparticipation have equally beneficial consequences for gender equality. The quotes
446 GENDER & SOCIETY / June 2001
at the outset of this article assume that it is the growth in labor force participationthat pushes other egalitarian changes along. But perhaps the growth in the middle ofthe century that resulted from the increased demand for female labor was not asbeneficial as the growth in the last quarter of the century that resulted from occupa-tional integration. The gender gap in earnings did not decline significantly until the1970s despite the long prior upward trend in women’s labor force participation. Onthis question, the MA evidence suggests a quite different answer than the longitudi-nal trends. Labor markets with female occupational structures not only havesmaller gender gaps in employment; they also have more occupational integrationand smaller earnings gaps (Cotter et al. 1998). Over time, however, occupationalintegration and declining earnings gaps only happened after the occupational struc-ture stopped becoming more female. More analyses are needed of the simultaneouseffect of the demand for female labor on labor force participation, occupationalintegration, earnings, and other aspects of gender stratification.
Another significant limitation of our analysis has been the lack of sufficientattention to the ways in which race, ethnicity, and class may interact with, or over-ride, the effects of the demand for female labor in determining women’s work out-side the home. The contextual effects of racial composition on gender differences inlabor force participation suggest that these interrelationships may be more complexthan the simple additive models used in this analysis. As is well documented,women of color and poor and working-class women have had higher labor forceparticipation for most of the century (Goldin 1990; Kirk Blackwelder 1997). More-over, much of the increase in women’s labor force participation has taken placeamong older women, married women, and mothers—more “unusual” workers—giving rise to politically contentious issues (Rubin 1994). Future research mightattempt to disentangle the demand effects for these subgroups. For us, however, it isthe broad story of increasing labor force participation that is of interest and espe-cially as it is explained by shifts in the occupational structure.
At the macro level, our focus on the demand for female labor in particular, andlabor market characteristics in general, adds a structural component to the extantcultural (Reeves Sanday 1981), political (Burstein 1985), and organizational(Acker 1990) explanations of changing gender labor force patterns. Nevertheless,such a focus on labor market characteristics must avoid a rigid economic determin-ism. Just as too narrow a focus on norms, state regulations, or organizational char-acteristics may limit the explanatory range of our theories, so too is there danger intreating economic structure as more than an important part of the overall explana-tion for gender inequalities. What is needed is more careful attention to the ways inwhich macro-level cultural and structural forces may combine with organizationaland micro-level factors to affect changes in labor market-related behavior.
Cotter et al. / WOMEN’S WORK 447
APPENDIX TABLE A.1Definitions of Variables
Variable Mean Definition
Macro-Level MeasuresRegion North Central = 0.26 Three dummy variables for North Central, South, and West (Northeast is the excluded
South = 0.45 category) (source: 1990 summary tape file 3c [STF3C]; see U.S. Bureau of theWest = 0.16 Census 1993a)
Net migration 0.12 The number of migrants into a metropolitan area (MA) from 1985 to 1990 minus thenumber of migrants out of an MA from 1985 to 1990 as a proportion of the total 1990MA population (source: 1990 county to county migration; see U.S. Bureau ofthe Census 1995)
Male earnings inequality 0.34 Gini coefficient for annual earnings of 25- to 54-year-old men working full-time year-round (source: 1990 Public Use Microdata Samples [PUMS]; see U.S. Bureau of theCensus 1993b)
Proportion Black 0.11 Proportion of population non-Hispanic Black (source: 1990 STF3C; see U.S. Bureau ofthe Census 1993a)
Proportion Hispanic 0.07 Proportion of population Hispanic, any race (source: 1990 STF3C; see U.S. Bureau ofthe Census 1993a)
Proportion immigrant 0.01 Proportion of population who are immigrants (source: 1990 PUMS; see U.S. Bureau ofthe Census 1993b)
Aid to Families with Dependent 5.95 Log of the minimum monthly benefits for a family of four (AFDC + food stamps +Children (AFDC) (ln) Medicare) (source: Moffitt 1992)
Individual-Level Measures from National Longitudinal Sample of Youth (NLSY)Labor force participation 0.86 Binary variable coded 1 if in the labor forceGender 0.52 Dummy variable coded 1 if femaleMarital status Formerly married = 0.11 Three dummy variables: Formerly married (divorced, separated, widowed, and
Cohabitant = 0.08 married-spouse absent), cohabitant, and never married (currently married, spouseNever married = 0.25 present, is the excluded category)
Number of children .96 Number of children in the household
448
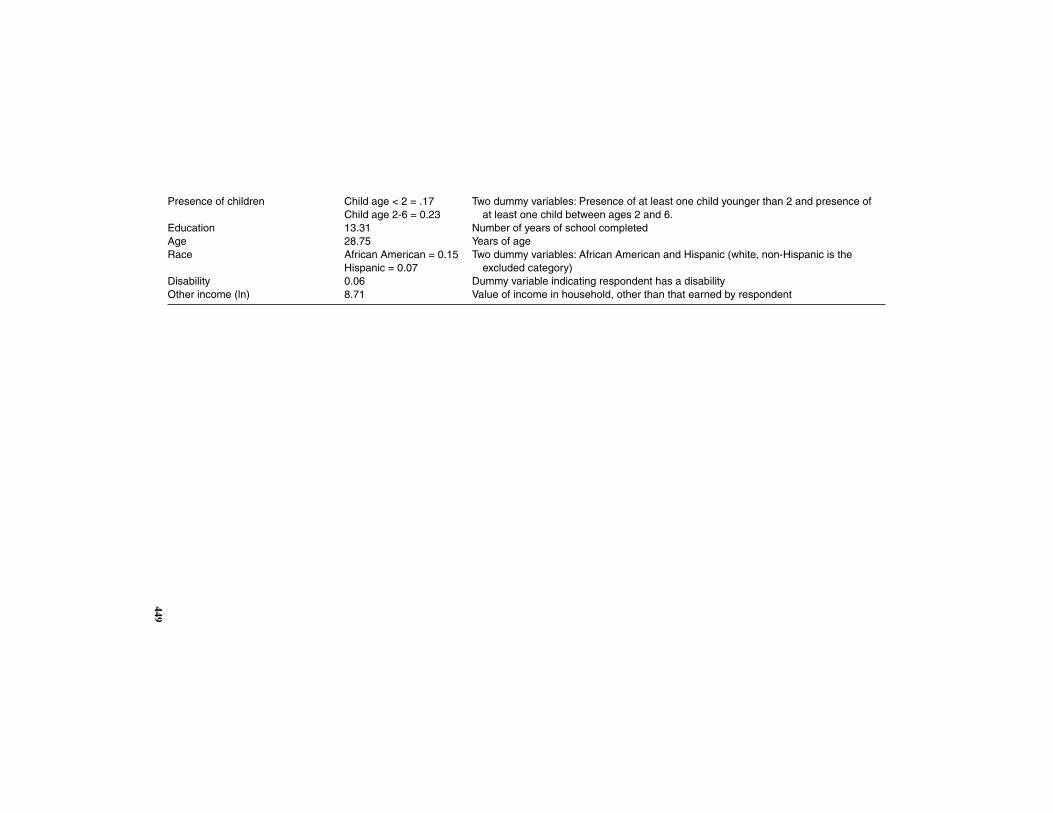
Presence of children Child age < 2 = .17 Two dummy variables: Presence of at least one child younger than 2 and presence ofChild age 2-6 = 0.23 at least one child between ages 2 and 6.
Education 13.31 Number of years of school completedAge 28.75 Years of ageRace African American = 0.15 Two dummy variables: African American and Hispanic (white, non-Hispanic is the
Hispanic = 0.07 excluded category)Disability 0.06 Dummy variable indicating respondent has a disabilityOther income (ln) 8.71 Value of income in household, other than that earned by respondent
449
NOTES
1. Some of these controls, such as the number of children, may themselves be consequences of laborforce participation and thus of the demand for female labor. Including these as control variables biasesthe estimates for the demand for female labor toward zero. So this model is a conservative test of thetheory.
2. Although this figure may seem high, it is consistent with the gross labor force participation ratesshown in Table 2. For example, in Steubenville, Ohio, and Weirton, West Virginia, the metropolitan area(MA) with the lowest women’s labor force participation rate, men are 9.0 (.90/.10) times more likely tobe in the labor force than not, while women are 1.08 (.52/.48) times more likely to be in the labor forcethan not. In other words, in this MA, men are nearly 9 (9.0/1.08) times more likely than women to be inthe labor force. However, in Madison, Wisconsin, an MA with one of the highest rates of women’s laborforce participation, men are just 1.8 times more likely to be in the labor force.
3. We thank an anonymous reviewer for both this possible explanation and for pointing out itsimplausibility.
4. We thank an anonymous reviewer for reminding us of the relationship between gender segregationand sex-specific labor demand.
REFERENCES
Acker, Joan. 1990. Hierarchies, jobs, bodies: A theory of gendered organizations. Gender & Society 4(2): 139-58.
Browne, Irene. 1997. Explaining the Black-white gap in labor force participation among women head-ing households. American Sociological Review 62 (2): 236-52.
Burstein, Paul. 1985. Discrimination, jobs, and politics: The struggle for equal employment opportunityin the United States since the New Deal. Chicago: University of Chicago Press.
Cohn, Samuel. 1999. Race, gender, and discrimination at work. Boulder, CO: Westview.Cotter, David A., JoAnn M. DeFiore, Joan M. Hermsen, Brenda Marsteller Kowalewski, and Reeve
Vanneman. 1995. Occupational desegregation in the 1980s. Work and Occupations 22:3-21.. 1998. The demand for female labor. American Journal of Sociology 103 (May): 1673-1712.Cramer, James C. 1980. Fertility and female employment. American Sociological Review 45:167-90.De Beauvoir, Simone. [1949] 1989. The second sex. Reprint, New York: Vantage Books.DiPrete, Thomas, and Jerry D. Forristal. 1994. Multilevel models: Methods and substance. Annual
Review of Sociology 20:331-57.Dunn, Dana, Elizabeth M. Almquist, and Janet Saltzman Chafetz. 1993. Macrostructural perspectives
on gender inequality. In Theory on gender, feminism on theory, edited by Paula England. New York:Aldine.
Engels, Friedrich. [1884] 1942. The origin of the family, private property and the state. Reprint, NewYork: International Publishers.
Felmlee, Diane H. 1993. The dynamic interdependence of women’s employment and fertility. SocialScience Research 22 (4): 333-60.
Figueroa, Janis Barry, and Edwin Melendez. 1993. The importance of family members in determiningthe labor supply of Puerto Rican, Black, and white single mothers. Social Science Quarterly 74 (4):867-83.
Goldin, Claudia. 1990. Understanding the gender gap: An economic history of American women. NewYork: Oxford University Press.
. 1997. Career and family: College women look to the past. In Gender and family issues in theworkplace, edited by Francine D. Blau and Ronald G. Ehrenberg. New York: Russell Sage Foundation.
Gornick, Janet C., Marcia K. Meyers, and Katherin E. Ross. 1998. Public policies and the employmentof mothers: A cross-national study. Social Science Quarterly 79 (1): 35-54.
450 GENDER & SOCIETY / June 2001

Huber, Joan. 1990. Macro-micro links in gender stratification. American Sociological Review 55:1-10.Huber, Joan, and Glenna Spitze. 1983. Sex stratification: Children, housework and jobs. New York:
Academic Press.Jones, Jo Ann, and Rachel A. Rosenfeld. 1989. Women’s occupations and local labor markets:
1950-1980. Social Forces 67:666-92.Kahn, Joan R., and Leslie A. Whittington. 1995. The labor supply of Latinas in the USA: Comparing
labor force participation, wages, and hours worked with Anglo and Black women. PopulationResearch and Policy Review 15:45-73.
Killingsworth, Mark R., and James J. Heckman. 1986. Female labor supply: A survey. In Handbook oflabor economics, vol. 1, edited by Orley Ashenfelter and Richard Layard.
Kirk Blackwelder, Julia. 1997. Now hiring: The feminization of work in the United States, 1900-1995.College Station: Texas A&M University Press.
Kodras, Janet E., and Irene Padavic. 1993. Economic restructuring and women’s sectoral employment inthe 1970s: A spatial investigation across 380 U.S. labor market areas. Social Science Quarterly 74(1): 1-27.
Kreft, Ita, and Jan De Leeuw. 1998. Introducing multilevel modeling. London: Sage.Lesser Blumberg, Rae. 1984. A general theory of gender stratification. In Sociological theory, edited by
Randall Collins. San Francisco: Jossey-Bass.Lorence, Jon. 1992. Service sector growth and metropolitan occupational sex segregation. Work and
Occupations 19 (2): 128-56.McCall, Leslie. 2000. Explaining levels of within-group wage inequality in U.S. labor markets. Demog-
raphy 7 (4): 415-30.Moffitt, Robert. 1992. Incentive effects of the U.S. welfare system: A review. Journal of Economic Liter-
ature 30 (March): 1-61.Myers, Dowell. 1985. Wives’ earnings and rising costs of homeownership. Social Science Quarterly
66:319-29.Oppenheimer, Valerie K. 1970. The female labor force in the United States. Berkeley: University of Cal-
ifornia Press.. 1973. Demographic influence of female employment and the status of women. American Jour-
nal of Sociology 78:184-99.Reeves Sanday, Peggy. 1981. Female power and male dominance. Cambridge, UK: Cambridge Univer-
sity Press.Reskin, Barbara F., and Patricia A. Roos. 1990. Job queues, gender queues: Explaining women’s
inroads into male occupations. Philadelphia: Temple University Press.Rubin, Lillian B. 1994. Families on the fault line: America’s working class speaks about the family, the
economy, race, and ethnicity. New York: Harper Perennial.Ruggles, Steven, Matthew Sobek, et al. 1997. Integrated public use microdata series: Version 2.0. Min-
neapolis: Historical Census Projects, University of Minnesota (http://www.ipums.umn.edu).Saltzman Chafetz, Janet. 1989. Gender equality: Towards a theory of change. In Feminism and social
theory, edited by Ruth A. Wallace. Newbury Park, CA: Sage.Smith, James P., and Michael P. Ward. 1984. Women’s wages and work in the twentieth century. Santa
Monica, CA: RAND.U.S. Bureau of the Census. 1992. 1990 census of population and housing: Equal employment opportu-
nity (EEO) file. Washington, DC: Government Printing Office.. 1993a. Census of population and housing, 1990, United States: Summary tape file 3c. Washing-
ton, DC: U.S. Bureau of the Census.. 1993b. 1990 Census of population and housing: Public Use Microdata Samples: United States.
Washington, DC: U.S. Bureau of the Census.. 1995. 1990 County to county migration, special project 312. Washington, DC: U.S. Bureau of
the Census.Valian, Virginia. 1999. Why so slow? The advancement of women. Cambridge: MIT Press.
Cotter et al. / WOMEN’S WORK 451
David A. Cotter is an assistant professor of sociology at Union College in Schenectady, NewYork. His research interests include work-related gender inequality and poverty. This articlegrows out of a larger project on the way that the demand for female labor affects gender inequal-ity on a number of fronts, including occupational segregation, earnings differences, labor forceparticipation, and well-being. He is currently working on a project using multilevel methods todetermine how individual religiosity and local religious composition affect women’s labor forceparticipation.
Joan M. Hermsen is an assistant professor of sociology at the University of Missouri. Herresearch investigates gender labor market inequalities, including occupational segregation, thewage gap, and workplace authority. She also recently completed a study of sexual violence inMissouri.
Reeve Vanneman is a professor of sociology at the University of Maryland. In addition to thisongoing work on gender inequality across U.S. metropolitan areas, he is investigating genderinequalities across Indian districts, using Indian census data; and across nations, using demo-graphic and health data.
452 GENDER & SOCIETY / June 2001


![r Women’s Work and the Politics of Homespun in Socialist ......and women accepted, that women could always ‘‘work an extra shift’’ [jia ban], carrying out textile work late](https://static.fdocuments.in/doc/165x107/5ff01c397a31da171728ec45/r-womenas-work-and-the-politics-of-homespun-in-socialist-and-women-accepted.jpg)