Women Working Longer: Facts and Some Explanations · April 10, 2017 revision . For NBER conference...
44
This PDF is a selection from a published volume from the National Bureau of Economic Research Volume Title: Women Working Longer: Increased Employment at Older Ages Volume Author/Editor: Claudia Goldin and Lawrence F. Katz, editors Volume Publisher: University of Chicago Press Volume ISBNs: 978-0-226-53250-9 (cloth); 978-0-226-53264-6 (e-ISBN) Volume URL: http://www.nber.org/books/gold-12 Conference Date: May 21-22, 2016 Publication Date: April 2018 Chapter Title: Women Working Longer: Facts and Some Explanations Chapter Author(s): Claudia Goldin, Lawrence F. Katz Chapter URL: http://www.nber.org/chapters/c13798 Chapter pages in book: (p. 11 – 53)
Transcript of Women Working Longer: Facts and Some Explanations · April 10, 2017 revision . For NBER conference...

This PDF is a selection from a published volume from the National Bureauof Economic Research
Volume Title: Women Working Longer: Increased Employment at Older Ages
Volume Author/Editor: Claudia Goldin and Lawrence F. Katz, editors
Volume Publisher: University of Chicago Press
Volume ISBNs: 978-0-226-53250-9 (cloth); 978-0-226-53264-6 (e-ISBN)
Volume URL: http://www.nber.org/books/gold-12
Conference Date: May 21-22, 2016
Publication Date: April 2018
Chapter Title: Women Working Longer: Facts and Some Explanations
Chapter Author(s): Claudia Goldin, Lawrence F. Katz
Chapter URL: http://www.nber.org/chapters/c13798
Chapter pages in book: (p. 11 – 53)

11
1Women Working LongerFacts and Some Explanations
Claudia Goldin and Lawrence F. Katz
Women have been working longer for a long time in US history. Their labor market participation increased decade after decade during the twentieth century, as more women were drawn into the labor force. But that is an old story. The new story is that a large portion of women are working a lot lon-ger into their sixties and even their seventies. Their increased participation at older ages started in the late 1980s before the turnaround in older men’s labor force participation and before the economic downturns of the first decade of the twenty- first century.1
Claudia Goldin is the Henry Lee Professor of Economics at Harvard University and a research associate of the National Bureau of Economic Research. Lawrence F. Katz is the Elisabeth Allison Professor of Economics at Harvard University and a research associate of the National Bureau of Economic Research.
We are indebted to the University of Michigan, David Wise, and the staff at the NBER, especially Mohan Ramanujan, for enabling use of the restricted- access version of the HRS. We thank our research assistants who labored over the CPS, HRS, and the Social Security earnings files: Amira Abulafi, Natalia Emanuel, Celena (Yuezhou) Huo, and Jonathan Roth. We thank our discussant Katharine Abraham and others at the conference for providing valu-able comments and to Maria Fitzpatrick for the “ever a teacher” variable code. We gratefully acknowledge the financial support of the Alfred P. Sloan Foundation’s Working Longer pro-gram under grant no. 2013-6-16, “Women Working Longer.” For acknowledgments, sources of research support, and disclosure of the author’s or authors’ material financial relationships, if any, please see http:// www .nber .org /chapters /c13798 .ack.
1. According to OECD data, most nations from around 2000 have had increased labor force participation of women in their sixties. These countries include Canada, France, Germany, Sweden, and the United Kingdom. Increases have also been experienced among women sixty- five to sixty- nine years old. In terms of levels for sixty- to sixty- four- year- olds, the United States and Japan had been the highest but most are now at about the 50 percent level. Levels are much lower for sixty- five- to sixty- nine- year- olds and considerably lower than that for the United States. Other than the United States and possibly Sweden, part- time work is reason-ably high for older women in the nations mentioned. In only a few cases are changes in social security regulations obviously related to these increases. (For the data, see the introduction to
You are reading copyrighted material published by University of Chicago Press. Unauthorized posting, copying, or distributing of this work except as permitted under
U.S. copyright law is illegal and injures the author and publisher.

12 Claudia Goldin and Lawrence F. Katz
Women’s increased participation beyond their fifties is a change of real consequence. Rather than being an increase in marginal part- time workers, the higher labor force participation of older women disproportionately con-sists of those working at full- time jobs. Women are remaining on their jobs as they age rather than scaling down or leaving for positions with shorter hours and fewer days.2
Why have women as a group increased their participation at older ages? Increased labor force participation of women in their older ages, we will emphasize, is part of the general increase in cohort labor force participation rates. Successive cohorts, for various reasons, increased their participation at all ages, resulting in an upward shift of participation by birth cohort. As more women graduated from college, held jobs with greater advancement potential, enjoyed their jobs more, were not currently married or were mar-ried to men who also extended employment into their senior years, more remained active in the labor force into their sixties and beyond.
Rising cohort effects in labor force participation across successive birth cohorts of US women are clearly visible in the microdata from the Current Population Survey (CPS) Annual Social and Economic Supplement (ASEC) and the Health and Retirement Survey (HRS). But these cohort effects are considerably dampened when education is considered. Higher participation at all ages has been due to greater levels of education, particularly college graduation. The increase in cohort effects in labor force participation for women in their late fifties and early sixties is also lessened by including work experience at younger ages and by adding information on the main prior occupation. We find some (negative) impact on employment at older ages from having been a teacher and discuss why that is the case.
Most important is that we find that those who “enjoyed” their jobs ear-lier in life remained employed for much longer later in life independent of their hours and earnings on the job six to eight years earlier. The difference between those who agree with the statement about enjoying their job versus those who disagree with the statement is 10 percentage points (on a base of 70) and the effect is twice that between those who strongly disagree with the statement and those who agree. Women who work more hours when fifty- nine to sixty- three years old are far more likely to have worked more hours six years before. But that is in addition to their greater satisfaction in the job earlier and their greater fulfillment contemporaneously. That is clearly not the case for all older workers, but it is the case for most.
Many of the cohorts we consider were those that also experienced greater divorce. Therefore, current marital status is related to employment at older
this volume and OECD.STAT, LFS by Sex and Age, Indicators http:// stats .oecd .org /Index .aspx ?DataSetCode = LFS _SEXAGE _I _R.)
2. Maestas (2010) discusses the emergence of nontraditional retirement paths, including the increasing role for planned transitions out of retirement and the greater fraction of those who state they are retired but who have positive and often substantial hours of work.
You are reading copyrighted material published by University of Chicago Press. Unauthorized posting, copying, or distributing of this work except as permitted under
U.S. copyright law is illegal and injures the author and publisher.

Women Working Longer: Facts and Some Explanations 13
ages. Because couples often coordinate their work and leisure, current employment of the spouse is an additional correlate of whether a woman is working longer.
Most of the factors just mentioned, particularly educational attainment and earlier employment continuity, were determined prior to the employ-ment decision under question. The addition of these factors almost nullifies the cohort effects, except in one important case. For the most recent cohorts of college- graduate women we can study to their sixties (those born from 1949 to 1955), the predetermined, observable factors do not eliminate the cohort effect. Something else, yet undetermined, is keeping them in the labor force at older ages.
Labor force participation rates of women in their early sixties can be observed today for cohorts born up to the mid- 1950s. Participation rates of forty- and fifty- year- old women born in the late 1950s and early 1960s have not increased relative to those of prior cohorts. Life cycle cohort labor force functions are no longer the humped functions they once were. They have become flat lines, more like those of men than they had been. These flat lines, moreover, have intersected the humped life cycle participation functions of prior cohorts, showing the decrease in participation relative to previous cohorts. But these new and flatter participation functions appear not to be decreasing at older ages relative to prior cohorts. That may indicate that women will continue to work longer even though their participation rates at middle age had stagnated relative to prior cohorts.3
Several factors may operate to offset the stagnation or dip in the par-ticipation of US women in middle age. One of the reasons for the dip in women’s participation in their late thirties and early forties is that women in these cohorts have had their children later. Therefore, the dip had been accompanied by an increase in their participation in their twenties relative to previous cohorts.
We find in our exploration of the correlates of participation that college- graduate women currently in their early sixties have positive cohort effects that remain substantial even after controlling for their earlier life cycle participation rates. Today’s younger women will likely retire later than one would have predicted based on their educational attainment and life cycle participation rates. The finding is particularly noteworthy since female college- graduation rates are continuing to increase by birth cohort.4
3. See Goldin and Mitchell (2017) on changes in life cycle labor force participation. Hurd and Rohwedder (2014) use questions in the HRS on subjective probabilities of employment to predict future labor force participation rates. See also Maestas and Zissimopoulos (2010) for participation forecasts at older ages to 2030 and for an excellent summary of the issues.
4. The college graduation rate (the share with a bachelor’s degree) for women age twenty- five to twenty- nine years increased from 30 percent in 2000 (for the 1971 to 1975 birth cohorts) to 39 percent in 2015 (for the 1986 to 1990 birth cohorts). (See US Department of Education 2015, table 104.20.)
You are reading copyrighted material published by University of Chicago Press. Unauthorized posting, copying, or distributing of this work except as permitted under
U.S. copyright law is illegal and injures the author and publisher.

14 Claudia Goldin and Lawrence F. Katz
1.1 Labor Force Participation Rates
1.1.1 By Age, Sex, and Education Level
The central facts concerning the labor force participation of women by age are shown in figure 1.1, which uses the March CPS- ASEC microdata samples and gives contemporaneous labor force participation rates during the survey reference week for women by five- year age groups since 1962. Throughout much of the period shown, participation rates increased for women in the thirty- five- to fifty- four- year- old group. The thirty- five- to forty- nine- year- old group flattens out in the early 1990s. In contrast, rates for women fifty- five years and older were flat until the 1980s, when an almost continuous increase ensued, even for the seventy- to seventy- four- year- old group.
The labor force participation data are also given in figure 1.2 for college- graduate women, since school attainment increases by birth cohort. The series is restricted to currently married women because a large fraction of the earlier cohorts of college- graduate women—those born from the 1890s to the 1910s—never married or married late. In consequence, a large frac-tion of college- graduate women, even those who eventually married, never had children and had higher labor force participation rates (Goldin 1997).
Fig. 1.1 Female labor force participation by five- year age groups, 1962 to 2014Source: CPS- ASEC microdata, March 1962 to 2014.
You are reading copyrighted material published by University of Chicago Press. Unauthorized posting, copying, or distributing of this work except as permitted under
U.S. copyright law is illegal and injures the author and publisher.

Women Working Longer: Facts and Some Explanations 15
Considering only the group who were currently married dampens the selec-tion problem but does not eliminate it because of later marriage ages. Par-ticipation rates for college- graduate women, therefore, decline somewhat over time as their marriage and childbearing rates become more like others in their cohort.
If one ignores cohorts born before around 1920, the series for all women and that for college- graduate women fifty- five years or older are first rela-tively constant and then increase, particularly after the mid- to late 1980s.5 The percentage point increase during the past twenty- five years, shown in table 1.1, is not much different between the aggregate group of women and the college graduates. But because college- graduate women have had consid-erably higher participation rates than less educated women, the shift toward college has increased participation rates for older women and the growth of women’s employment at older ages.
Also clear in table 1.1 is that the increased participation of older women exceeds that of older men in the last twenty- five years, both absolutely and relative to the base levels. Among sixty- to sixty- four- year- old women, for
5. For the sixty- to sixty- four- year- old group, participation rates after 1980 are for individu-als born after 1920.
Fig. 1.2 Female labor force participation by five- year age groups for currently married college graduates, 1965 to 2013 (three- year centered moving averages)Source: CPS- ASEC microdata, March 1962 to 2013.
You are reading copyrighted material published by University of Chicago Press. Unauthorized posting, copying, or distributing of this work except as permitted under
U.S. copyright law is illegal and injures the author and publisher.

16 Claudia Goldin and Lawrence F. Katz
example, participation increased by 17 percentage points on a base of 34 percent, but for males the increase is just 6 percentage points on a base of 55 percent. The percentage point increase for sixty- five- to sixty- nine- year- old males and females is similar in absolute magnitude, but the initial base for women is far lower (15 versus 26 percent).
The relative increase for older women has meant that the gender gap in participation at older ages has greatly decreased, as can be seen in figure 1.3. Differences in participation by sex have, of course, decreased more generally. But the absolute percentage point difference at some of the older ages is now smaller than for the younger age groups. For sixty- to sixty- four- year- olds, for example, the difference in participation rates between men and women was about 50 percentage points in 1962. In 2014, the difference was just 9 percentage points, when that for males and females in their thirties to mid-forties was around 16 percentage points.
Table 1.1 Labor force participation rates for males and females, ages fifty- five to seventy- four: CPS
Age group Educational
group
Labor force participation rate in
Percentage point change c. 1988 to
c. 20131987–89 2012–14
Women 55–59 All 0.522 0.673 15.1
College graduates 0.685 0.779 9.4Not college grad. 0.499 0.627 12.8
60–64 All 0.341 0.514 17.3College graduates 0.454 0.612 15.8Not college grad. 0.330 0.472 14.3
65–69 All 0.153 0.276 12.3College graduates 0.240 0.367 12.7Not college grad. 0.145 0.244 9.9
70–74 All 0.072 0.157 8.6College graduates 0.130 0.214 8.3Not college grad. 0.066 0.142 7.5
Men 55–59 All 0.796 0.779 −1.8
College graduates 0.886 0.896 1.0Not college grad. 0.773 0.728 −4.6
60–64 All 0.548 0.607 5.9College graduates 0.682 0.727 4.5Not college grad. 0.516 0.543 2.8
65–69 All 0.258 0.380 12.2College graduates 0.402 0.491 8.9Not college grad. 0.231 0.321 9.0
70–74 All 0.155 0.232 7.7College graduates 0.254 0.324 7.0
Not college grad. 0.141 0.191 5.0
Sources: CPS- ASEC microdata March 1987, 1988, 1989, 2012, 2013, and 2014.
You are reading copyrighted material published by University of Chicago Press. Unauthorized posting, copying, or distributing of this work except as permitted under
U.S. copyright law is illegal and injures the author and publisher.

Women Working Longer: Facts and Some Explanations 17
Men and women are doing more of the same things throughout their lives, and this is even truer at older ages. But is that also true within couples? The answer is that, for women fifty- nine to sixty- three years old and presently married, far more of these couples are both currently working than cur-rently retired.6 In addition, in 2014 about as many of these couples had a wife who was working and a husband who was not than the reverse. More women are working into their sixties and more are coupled with men who are also working. But there are also substantial numbers of women who are working into their sixties even though their husbands are retired. We return to the issue of joint employment and leisure below.
1.1.2 Full- Time versus Part- Time Employment of Women at Older Ages
The labor force participation rate for older women increased largely because of an increase in those working full time and full year. The expan-sion of full- time employment among participants has been especially evi-dent for the sixty- five years and older group.
As seen in figure 1.4, the fraction of sixty- five- to sixty- nine- year- old women in the labor force who worked full time and full year increased from
6. This statement is true for HRS couples in which the wife is between fifty- nine and sixty- three years old. For couples in which the woman is sixty- two or sixty- three years old, the statement holds beginning in 2008.
Fig. 1.3 Gender gap in labor force participation at older ages, 1962 to 2014: CPSSource: CPS- ASEC microdata, March 1962 to 2014.
You are reading copyrighted material published by University of Chicago Press. Unauthorized posting, copying, or distributing of this work except as permitted under
U.S. copyright law is illegal and injures the author and publisher.

18 Claudia Goldin and Lawrence F. Katz
around 30 percent to almost 50 percent, with much of the increase occurring after 2000.7 The fraction of seventy- to seventy- four- year- old labor force participants working full time and full year increased from 20 percent to almost 40 percent. We emphasize that figure 1.4 gives the fraction working full time, full year among those in the labor force rather than among the population in that age group. Although the timing could indicate the impact of changes in the Social Security earnings test, the increase began before 2000 for both younger and older age groups of women.8
7. The pre- 1970 data also show somewhat high fractions working full time among partici-pants and it is not clear why there was a subsequent decrease.
8. The retirement earnings test was changed in 2000 to apply only to individuals below nor-mal retirement age (NRA). The NRA had been sixty- five, but has been gradually increased to sixty- seven years for those born after 1959. Earnings taxed above the exempt amounts are repaid after NRA. From 1975 to 1982 the upper age was seventy- one and it was decreased to 69 until 2000. See Gelber, Jones, and Sacks (2016) on the retirement earnings test, its history,
Fig. 1.4 Women employed full time, full year among labor force participants during the year, 1963 to 2013: CPSSource: CPS- ASEC microdata, March 1962 to 2013.Notes: Both numerator and denominator refer to the calendar year. A “labor force participant during the year” is anyone who worked during the year. Three- year centered moving averages are shown. Full- time, full- year workers are those who worked forty or more weeks and thirty- five or more hours per week.
You are reading copyrighted material published by University of Chicago Press. Unauthorized posting, copying, or distributing of this work except as permitted under
U.S. copyright law is illegal and injures the author and publisher.

Women Working Longer: Facts and Some Explanations 19
1.1.3 Cohort Trends
Increased employment among older women would appear to be related to their increased participation earlier in their lives. The conclusion can be deduced from the fact that all cohorts in figure 1.5, panel A, that have had increased participation in their sixties, relative to earlier cohorts, also had increased participation relative to the same cohorts when they were younger. That is, the cohorts that have begun to “work longer” had higher participa-tion rates throughout their life cycles than did previous cohorts.
Figure 1.5 begins with the cohort born in 1930, but the pattern just men-tioned is evident as well for some of the earlier birth cohorts not shown. However, cohorts born in the early 1920s show no discernible increase in participation among women in their sixties despite modest increases earlier in their lives.9 The data for college graduates given in figure 1.5, panel B, reveal similar findings, but participation levels are higher.
As will be emphasized later, regressions of the labor force rate at older ages on birth cohort dummies indicate that cohort effects are greatly muted by the addition of various predetermined factors such as education, earlier employ-ment continuity, and women’s past occupations. That is, cohort differences in labor force participation later in life are largely, but not entirely, a function of earlier changes in human capital accumulation. These human capital advances occurred because women perceived that their investments would pay off in the labor market and that their employment would be higher and more continuous than for previous cohorts.
We noted before that the function tracing out life cycle labor force partici-pation was transformed from being hump- shaped to being almost a flat line after the mid- 1950s birth cohorts. Participation rates around age twenty- five to the early thirties greatly increased from the 1930s to the 1950s birth cohorts because women with infants had much higher labor force participa-tion and because the birth rate decreased.
The new flatter cohort life cycle functions have begun to cross each other. The crossing creates an interesting “twist” in participation for the most recent cohorts in figure 1.5, panel A, and more so for college- graduate women in figure 1.5, panel B. The twist is the cohort analog of the oft- mentioned decrease in the participation of women in their thirties and forties.10 One clear way to see the change is to observe that slicing the cohort graphs at ages
and impact. Changes for men may, however, be related to the change in the retirement earnings test (see Gustman and Steinmeier 2009; Mastrobuoni 2009). Gelber, Isen, and Song (chapter 8, this volume) show that a slowdown in the rate of growth of Social Security benefits starting in the mid- 1980s altered women’s retirement.
9. These general trends are also apparent in figure 1.1. For example, the participation line for those sixty- five to sixty- nine years begins to increase around 1987, therefore for women born in the early 1920s.
10. See Goldin and Mitchell (2017) for a discussion of the “new life cycle of women’s employ-ment.”
You are reading copyrighted material published by University of Chicago Press. Unauthorized posting, copying, or distributing of this work except as permitted under
U.S. copyright law is illegal and injures the author and publisher.

Fig. 1.5 Labor force participation rates for women by five- year birth cohorts (1930– 34 to 1970– 74) and five- year age groups (ages twenty- five to twenty- nine to seventy- four to seventy- nine): CPS. (A) All education groups. (B) College graduates.Source: CPS- ASEC microdata, March 1962 to 2013.Note: Every data point in each graph contains twenty- five birth years and ages.
A
B
You are reading copyrighted material published by University of Chicago Press. Unauthorized posting, copying, or distributing of this work except as permitted under
U.S. copyright law is illegal and injures the author and publisher.

Women Working Longer: Facts and Some Explanations 21
thirty and fifty yields the usual cohort progression. Younger cohorts have higher participation rates than older cohorts. But slicing the cohort graphs in between, say at age forty, does not yield higher rates for the most recent cohorts, such as those born from 1959 to 1973. The cohort lines appear to have twisted.
Does this mean that participation rates for these women in their fifties, sixties, and beyond will also be lower? Their increased education and labor force participation in their younger years would argue the opposite. Why they have decreased participation is still an ongoing research question, although some of the answers concern the delay of births, on the one hand, and an absence of mandated leave policy of more than twelve weeks, on the other. The decrease in participation is not large, but the disruption of the increasing trend is clear and could argue for a break in the increase of women working longer.11
The bottom line for cohort change is that increased participation at older ages has occurred for cohorts that had greater attachment to the labor force throughout their lives. The upshot is that greater attachment to the labor force earlier in the work life means longer employment at older ages. We now turn to using longitudinal information from the HRS matched to Social Security earnings records to understand the role of cohort effects.
Because we rely on the CPS for the general trends and the HRS for anal-ysis, we provide evidence that the HRS reasonably tracks general trends in the CPS for these cohorts and age groups. Appendix tables and figures show the close relationship between CPS and HRS participation rates (fig-ure 1A.1), marital status (table 1A.2), education (table 1A.3), and number of children (figure 1A.2). Labor force participation rates in the HRS and the CPS are almost identical for women in their fifties and sixties; however, the HRS has higher participation rates than the CPS for women in their seventies.12
1.2 Exploring the Role of Cohort Effects Using the HRS
Cohorts born later have higher labor force participation rates at older ages than do those born earlier. We explore whether these cohort effects are
11. Hurd and Rohwedder (2014) note that subjective probabilities of future work at ages sixty- two and sixty- five are reliable predictors of actual employment and that current HRS respondents in their early fifties have subjective probabilities of future work that exceed the actual participation rates of individuals in their sixties. Lusardi and Mitchell (chapter 6, this volume) also find using the HRS that the share of women in their early fifties who anticipate working at age sixty- five continues to rise in recent cohorts, even as women’s labor force partici-pation rates in their early fifties has flattened across cohorts. These findings indicate a further increase in the participation rates of older women.
12. The reason for the difference in participation at older ages is not clear since each survey is supposed to cover those in nursing homes and similar care units. The HRS, in addition, has a lower fraction of women who state they never had a first birth.
You are reading copyrighted material published by University of Chicago Press. Unauthorized posting, copying, or distributing of this work except as permitted under
U.S. copyright law is illegal and injures the author and publisher.

22 Claudia Goldin and Lawrence F. Katz
primarily due to changes in factors determined largely prior to the retire-ment option. These variables can include educational attainment, number and ages of children, and earlier life cycle labor force participation. We will also consider the degree to which the individual had relatively high earn-ings when employed, which we term the “career condition.” These largely predetermined characteristics will be measured in our empirical work prior to around age fifty- five, whereas the retirement option is considered from ages fifty- nine to sixty- three.
The retirement decision may instead be determined primarily by factors that are contemporaneous, such as a set of shocks or transitory factors. These factors may have served to increase participation at older years in the post- 1980s period and may include marital status change, fluctuations in the value of real estate or financial assets, pension losses, reductions in Social Security payments, and deteriorating health status.
The evidence points to a large impact of changes in the predetermined factors. Education reduces cohort differences in labor force participation from ages fifty- nine to sixty- three by about a half. Life cycle labor force participation from thirty- five to forty- four years produces an overshooting of the cohort effects. Our measure of high career earnings does not perform better than the simpler measure of life cycle participation.
Once these variables are considered, adding information on the number and birth years of children has no impact. Children serve to reduce par-ticipation in the twenty- five- to forty- four- year range, but have no sepa-rate effect in later life.13 The many contemporaneous factors mentioned are related to the variance within cohorts, but do not do much to explain changes across cohorts.
The one interesting anomaly concerns the most recent of the cohorts of college- graduate women that can be followed to their sixties. Those born from 1949 to 1951 have higher participation at ages fifty- nine to sixty- three, even given measures of their life cycle participation prior to age fifty- five and their educational attainment. That is, the cohort effect for the 1949 to 1951 group remains significant even including the various predetermined factors, including life cycle participation.
The finding that later cohorts have higher participation given their ear-lier life cycle participation may be useful in forecasting what more recent cohorts will be doing when they reach their sixties. Recall that labor force participation rates across the life cycle have become relatively flat from ages twenty- five to forty- five, and that the most recent cohorts of women do not always have higher participation compared with previous cohorts. In fact,
13. Lumsdaine and Vermeer (2015) find that a grandchild’s arrival increases the hazard of a woman’s retirement independent of her opportunity cost. It is not clear that the partial or total grandchild effect has decreased with time, thus that it can help to explain the working longer phenomenon.
You are reading copyrighted material published by University of Chicago Press. Unauthorized posting, copying, or distributing of this work except as permitted under
U.S. copyright law is illegal and injures the author and publisher.

Women Working Longer: Facts and Some Explanations 23
the most recent data indicate a backtracking of younger cohorts of women in their forties. That is, for the college- graduate group, as well as for others, participation rates have not increased relative to prior cohorts and have even decreased at various ages.
The finding about those born between 1949 and 1951 may indicate that participation rates for even younger cohorts may be higher still in their sixties and seventies than prior generations, at least for college- educated women.
To explore the role of cohort and predetermined variables, data from the Health and Retirement Study (HRS) are used together with information on the earnings history of the respondents from Social Security earnings data and W- 2 forms (starting with 1980).14 Each of the respondents to the HRS, beginning with the first cohorts in 1992, was asked whether her Social Security earnings history could be linked. If the individual agreed to the linkage, then all past records were linked.15 If not, then the individual was asked again in the subsequent biennial survey. Therefore, the older cohorts had more chances to agree to a linkage than the younger cohorts and linkage rates are higher in consequence.
Across all cohorts about 80 percent of respondents agreed to the linkage with Social Security (and W- 2) records. For birth cohorts from 1931 to 1945 the response rate ranges from 85 to 90 percent; the range is 71 to 79 percent for birth cohorts from 1946 to 1951. (Linkage rates are given in appendix table 1A.1 by birth cohort.) When we use information on life cycle labor force participation, we must restrict the sample to individuals who gave permission to have their Social Security earnings (and W- 2 forms) linked. Otherwise the full HRS sample is used, given age and other restrictions that may apply.
We mainly explore labor force participation rates of women fifty- nine to sixty- three years old and always include three- year birth cohort dummies. We begin in table 1.2, columns (1) to (5) by including characteristics largely determined prior to age fifty- five, such as educational attainment and life cycle participation during various intervals.16 We add in column (6) current marital status and a summary measure of current health status.
Table 1.3 divides the group into two education levels, college graduates and
14. The W- 2 data are also provided for 1977– 79, but are incomplete in the HRS- SSA linked data.
15. A curious aspect of the HRS is that until 2006 individuals were asked every year if they would continue the linkage to the Social Security earnings data. If at any point they decided not to, the prior data were allowed but the contemporaneous and future data were not. For most HRS respondents, the break in the linkage will not matter since the HRS itself collected information on labor supply and earnings. But the break will matter for a spouse who entered the HRS at a younger age and who was folded when the individual’s birth cohort relevant HRS cohort was added. See the appendix, especially the section “Social Security Earnings Record Linkage in the HRS,” for details.
16. The addition of variables for children ever born adds no explanatory power for older women’s labor force participation after including controls for earlier life cycle participation. Thus, we do not report specifications adding controls for children.
You are reading copyrighted material published by University of Chicago Press. Unauthorized posting, copying, or distributing of this work except as permitted under
U.S. copyright law is illegal and injures the author and publisher.

Tab
le 1
.2
Fem
ale
labo
r fo
rce
part
icip
atio
n at
age
s fif
ty- n
ine
to s
ixty
- thr
ee, a
ll ed
ucat
ion
grou
ps: H
RS
Ful
l sam
ple
Lin
ked
sam
ple
(1)
(2
)
(3)
(4
)
(5)
(6
)
Yea
r of
bir
th
1934
–36
−0.
0081
0−
0.01
10−
0.01
39−
0.01
58−
0.01
28−
0.01
43(0
.019
2)(0
.020
7)(0
.020
3)(0
.019
7)(0
.020
1)(0
.018
6)
1937
–39
0.01
410.
0044
80.
0007
15−
0.01
46−
0.00
357
−0.
0052
1(0
.019
1)(0
.020
6)(0
.020
2)(0
.019
9)(0
.020
2)(0
.018
6)
1940
–42
0.01
630.
0137
−0.
0083
2−
0.03
54−
0.01
78−
0.03
12(0
.020
3)(0
.021
8)(0
.021
1)(0
.020
6)(0
.021
0)(0
.019
5)
1943
–45
0.04
64**
0.03
20−
0.00
461
−0.
0402
−0.
0184
−0.
0321
(0.0
229)
(0.0
247)
(0.0
239)
(0.0
235)
(0.0
237)
(0.0
223)
19
46–4
80.
0635
*0.
0529
**0.
0032
7−
0.03
89−
0.01
41−
0.02
57(0
.021
7)(0
.024
0)(0
.023
8)(0
.023
5)(0
.023
8)(0
.022
0)
1949
–51
0.09
73**
*0.
0888
***
0.03
00−
0.01
100.
0120
0.00
0839
(0.0
217)
(0.0
259)
(0.0
250)
(0.0
246)
(0.0
249)
(0.0
234)
Hig
h sc
hool
gra
d.0.
161*
**0.
121*
**0.
141*
**0.
0583
***
(0.0
180)
(0.0
176)
(0.0
180)
(0.0
171)
Som
e co
llege
0.25
1***
0.19
9***
0.21
7***
0.10
6***
(0.0
205)
(0.0
202)
(0.0
207)
(0.0
195)
Col
lege
gra
duat
e0.
295*
**0.
237*
**0.
251*
**0.
115*
**(0
.025
2)(0
.025
2)(0
.026
0)(0
.025
0)M
A0.
348*
**0.
280*
**0.
292*
**0.
159*
**(0
.028
8)(0
.028
6)(0
.029
8)(0
.027
6)P
hD, M
D, J
D, e
tc.
0.46
8***
0.36
4***
0.40
0***
0.22
7***
(0.0
458)
(0.0
453)
(0.0
458)
(0.0
451)
Lif
e cy
cle
LF
P 3
5–44
0.23
3***
0.21
6***
(0.0
174)
(0.0
165)
You are reading copyrighted material published by University of Chicago Press. Unauthorized posting, copying, or distributing of this work except as permitted under
U.S. copyright law is illegal and injures the author and publisher.

Car
eer
cond
. 35–
440.
128*
**(0
.019
5)C
urre
ntly
mar
ried
−0.
157*
**(0
.030
9)D
ivor
ced
0.08
06**
(0.0
321)
Wid
ow0.
0113
(0.0
324)
Spou
se in
LF
0.18
6***
(0.0
146)
Hea
lth
stat
usN
oN
oN
oN
oN
oY
esA
ge d
umm
ies
Yes
Yes
Yes
Yes
Yes
Yes
Rac
e du
mm
ies
Yes
Yes
Yes
Yes
Yes
Yes
Con
stan
t0.
456*
**0.
430*
**0.
326*
**0.
261*
**0.
323*
**0.
165*
**(0
.033
1)(0
.039
4)(0
.036
5)(0
.036
7)(0
.036
6)(0
.042
6)
N18
,383
15,4
3115
,431
15,4
3115
,431
15,4
31R
‑squ
ared
0.
028
0.
029
0.
073
0.
104
0.
082
0.
183
Sou
rces
: H
ealt
h an
d R
etir
emen
t St
udy
(HR
S) 1
992
to 2
012,
RA
ND
ver
sion
wit
h ad
ded
vari
able
s fr
om o
rigi
nal H
RS
files
. Soc
ial S
ecur
ity
Adm
inis
trat
ion
earn
ings
(and
W- 2
) dat
a ar
e us
ed to
cal
cula
te li
fe c
ycle
labo
r fo
rce
part
icip
atio
n (L
ife
cycl
e L
FP
<ag
es>
) and
the
care
er c
ondi
tion
(Car
eer
cond
. <ag
es>
).N
otes
: T
he d
epen
dent
var
iabl
e is
1 if
the
wom
an is
in th
e la
bor
forc
e an
d 0
othe
rwis
e. T
he H
RS
asks
res
pond
ents
thei
r la
bor
forc
e st
atus
and
a w
oman
is in
th
e la
bor
forc
e if
she
rep
orte
d be
ing
empl
oyed
or
unem
ploy
ed a
nd s
earc
hing
for
wor
k. H
ealt
h st
atus
is s
elf-
repo
rted
and
is c
oded
as
1 if
“go
od”
or b
ette
r an
d 0
othe
rwis
e. M
arit
al s
tatu
s va
riab
les
refe
r to
cur
rent
sta
tus.
“L
ife
cycl
e L
FP
<ag
es>
” is
the
frac
tion
of
the
inte
rval
the
wom
an w
as in
the
labo
r fo
rce
as d
eter
-m
ined
by
a co
mbi
nati
on o
f th
e da
ta s
ourc
es d
escr
ibed
in th
e ap
pend
ix. T
he “
linke
d sa
mpl
e” in
dica
tes
that
the
indi
vidu
al g
ave
perm
issi
on fo
r So
cial
Sec
urit
y ea
rnin
gs d
ata
to b
e lin
ked.
Om
itte
d ba
se g
roup
var
iabl
es a
re 1
931–
33 b
irth
coh
ort,
bel
ow h
igh
scho
ol g
radu
ate
(ove
rall
or fo
r th
e le
ss- t
han
- col
lege
- gra
duat
e gr
oup)
, BA
onl
y fo
r the
col
lege
- gra
duat
e gr
oup,
nev
er m
arri
ed, o
ther
race
, and
age
fift
y- ni
ne. O
mit
ted
from
the
tabl
e ar
e du
mm
y va
riab
les f
or m
issi
ng v
aria
bles
re
gard
ing
spou
se in
labo
r fo
rce,
car
eer
cond
itio
n th
irty
- five
to fo
rty-
four
, and
hea
lth
stat
us. T
he re
gres
sion
s ar
e w
eigh
ted
by H
RS
pers
on w
eigh
ts; t
he w
eigh
ts
are
adju
sted
for
sam
ple
sele
ctio
n in
to th
e lin
ked
sam
ple
in c
olum
ns (2
) to
(6).
Sta
ndar
d er
rors
in p
aren
thes
es h
ave
been
clu
ster
ed a
t the
indi
vidu
al le
vel.
***S
igni
fican
t at t
he 1
per
cent
leve
l.**
Sign
ifica
nt a
t the
5 p
erce
nt le
vel.
*Sig
nific
ant a
t the
10
perc
ent l
evel
.
You are reading copyrighted material published by University of Chicago Press. Unauthorized posting, copying, or distributing of this work except as permitted under
U.S. copyright law is illegal and injures the author and publisher.

Tab
le 1
.3
Fem
ale
labo
r fo
rce
part
icip
atio
n at
age
s fif
ty- n
ine
to s
ixty
- thr
ee, b
y ed
ucat
ion:
HR
S
Not
col
lege
gr
adua
te
(1)
C
olle
ge
grad
uate
(2
)
Not
col
lege
gr
adua
te
(3)
C
olle
ge
grad
uate
(4
)
Not
col
lege
gr
adua
te
(5)
C
olle
ge
grad
uate
(6
)
Yea
r of
bir
th
1934
–36
−0.
0234
0.03
08−
0.02
630.
0346
−0.
0246
0.03
90(0
.021
9)(0
.052
2)(0
.021
2)(0
.050
6)(0
.020
0)(0
.047
2)
1937
–39
−0.
0019
50.
0182
−0.
0218
0.02
34−
0.01
020.
0182
(0.0
217)
(0.0
543)
(0.0
212)
(0.0
545)
(0.0
197)
(0.0
521)
19
40–4
2−
0.01
330.
0357
−0.
0441
**0.
0188
−0.
0388
0.01
60(0
.023
1)(0
.051
5)(0
.022
3)(0
.050
6)(0
.021
2)(0
.047
5)
1943
–45
−0.
0101
0.05
09−
0.04
680.
0219
−0.
0370
0.02
12(0
.026
6)(0
.053
7)(0
.026
0)(0
.054
2)(0
.024
5)(0
.052
6)
1946
–48
−0.
0030
40.
0589
−0.
0470
0.02
35−
0.03
450.
0377
(0.0
268)
(0.0
522)
(0.0
262)
(0.0
527)
(0.0
247)
(0.0
489)
19
49–5
10.
0055
70.
126*
*−
0.03
890.
103*
*−
0.02
100.
0980
**(0
.029
1)(0
.049
8)(0
.028
7)(0
.050
4)(0
.027
2)(0
.048
6)H
igh
scho
ol g
rad.
0.15
8***
0.11
5***
0.05
20*
(0.0
180)
(0.0
176)
(0.0
172)
Som
e co
llege
0.24
9***
0.19
3***
0.10
1***
(0.0
205)
(0.0
202)
(0.0
197)
MA
0.05
020.
0420
0.03
70(0
.031
6)(0
.031
3)(0
.029
5)P
hD, M
D, J
D, e
tc.
0.16
7***
0.13
6*0.
111*
*(0
.048
3)(0
.049
2)(0
.048
9)L
ife
cycl
e L
FP
35–
440.
208*
**0.
0739
0.19
2***
0.07
09(0
.027
3)(0
.057
3)(0
.025
4)(0
.058
9)N
ever
in L
F 3
5–44
−0.
0548
**−
0.15
3**
−0.
0522
**−
0.15
0*(0
.025
4)(0
.073
0)(0
.023
8)(0
.071
6)
You are reading copyrighted material published by University of Chicago Press. Unauthorized posting, copying, or distributing of this work except as permitted under
U.S. copyright law is illegal and injures the author and publisher.

Cur
rent
ly m
arri
ed−
0.14
7***
−0.
243*
**(0
.035
0)(0
.064
9)D
ivor
ced
0.06
130.
119
(0.0
368)
(0.0
638)
Wid
ow0.
0045
8−
0.00
416
(0.0
364)
(0.0
712)
Spou
se in
LF
0.17
7***
0.22
5***
(0.0
160)
(0.0
357)
Hea
lth
stat
usN
oN
oN
oN
oY
esY
esA
ge d
umm
ies
Yes
Yes
Yes
Yes
Yes
Yes
Rac
e du
mm
ies
Yes
Yes
Yes
Yes
Yes
Yes
Con
stan
t0.
285*
**0.
859*
**0.
258*
**0.
841*
**0.
167*
0.63
8***
(0.0
385)
(0.0
629)
(0.0
434)
(0.0
751)
(0.0
508)
(0.0
999)
N12
,789
2,64
212
,789
2,64
212
,789
2,64
2R
‑squ
ared
0.
060
0.
041
0.
097
0.
059
0.
179
0.
140
Sou
rces
: H
ealt
h an
d R
etir
emen
t St
udy
(HR
S) 1
992
to 2
012,
RA
ND
ver
sion
wit
h ad
ded
vari
able
s fr
om o
rigi
nal H
RS
files
. Soc
ial S
ecur
ity
Adm
inis
trat
ion
earn
ings
(and
W- 2
) dat
a ar
e us
ed to
cal
cula
te li
fe c
ycle
labo
r fo
rce
part
icip
atio
n (L
ife
cycl
e L
FP
<ag
es>
).N
otes
: T
he d
epen
dent
var
iabl
e is
1 if
the
wom
an is
in th
e la
bor
forc
e an
d 0
othe
rwis
e. T
he H
RS
asks
res
pond
ents
thei
r la
bor
forc
e st
atus
and
a w
oman
is in
th
e la
bor
forc
e if
she
rep
orte
d be
ing
empl
oyed
or
unem
ploy
ed a
nd s
earc
hing
for
wor
k. H
ealt
h st
atus
is s
elf-
repo
rted
and
is c
oded
as
1 if
“go
od”
or b
ette
r an
d 0
othe
rwis
e. M
arit
al s
tatu
s va
riab
les
refe
r to
cur
rent
sta
tus.
“L
ife
cycl
e L
FP
<ag
es>
” is
the
frac
tion
of
the
inte
rval
the
wom
an w
as in
the
labo
r fo
rce
as d
eter
-m
ined
by
a co
mbi
nati
on o
f th
e da
ta s
ourc
es d
escr
ibed
in th
e ap
pend
ix. “
Nev
er in
LF
” is
1 if
the
indi
vidu
al w
as r
ecor
ded
as h
avin
g no
yea
rs in
the
labo
r fo
rce
duri
ng th
ose
year
s. A
ll co
lum
ns u
se th
e “l
inke
d sa
mpl
e.”
Om
itte
d ba
se g
roup
var
iabl
es a
re 1
931–
33 b
irth
coh
ort,
bel
ow h
igh
scho
ol g
radu
ate
(ove
rall
or fo
r th
e le
ss- t
han
- col
lege
- gra
duat
e gr
oup)
, B
A o
nly
for
the
colle
ge- g
radu
ate
grou
p, n
ever
mar
ried
, ot
her
race
, an
d ag
e fif
ty- n
ine.
Om
itte
d fr
om t
he t
able
are
du
mm
y va
riab
les
for
mis
sing
var
iabl
es r
egar
ding
spo
use
in la
bor
forc
e an
d he
alth
sta
tus.
Reg
ress
ions
are
est
imat
ed s
epar
atel
y fo
r co
llege
gra
duat
es a
nd th
ose
who
did
not
gra
duat
e fr
om c
olle
ge. C
olle
ge- g
radu
ate
degr
ees
beyo
nd a
bac
helo
r’s
are
adde
d (M
A, P
hD, e
tc.)
, whe
re M
A in
clud
es a
ll m
aste
r’s
degr
ees,
and
P
hD, M
D, J
D, a
nd s
o fo
rth
incl
udes
all
grad
uate
and
pro
fess
iona
l deg
rees
. For
thos
e w
ho d
id n
ot g
radu
ate
from
col
lege
, dum
my
vari
able
s ar
e ad
ded
for
thos
e w
ith
a hi
gh s
choo
l dip
lom
a an
d so
me
colle
ge. T
he r
egre
ssio
ns a
re w
eigh
ted
by H
RS
pers
on w
eigh
ts a
djus
ted
for
sam
ple
sele
ctio
n in
to t
he li
nked
sam
ple.
St
anda
rd e
rror
s in
par
enth
eses
hav
e be
en c
lust
ered
at t
he in
divi
dual
leve
l.**
*Sig
nific
ant a
t the
1 p
erce
nt le
vel.
**Si
gnifi
cant
at t
he 5
per
cent
leve
l.*S
igni
fican
t at t
he 1
0 pe
rcen
t lev
el.
You are reading copyrighted material published by University of Chicago Press. Unauthorized posting, copying, or distributing of this work except as permitted under
U.S. copyright law is illegal and injures the author and publisher.

28 Claudia Goldin and Lawrence F. Katz
those who did not graduate college.17 Columns (1) to (4) of table 1.3 include the predetermined characteristics and columns (5) and (6) add current mari-tal status and health status. Table 1.4 includes only college- graduate women. In addition to the previous variables, we add information on whether the individual was ever a teacher. About 45 percent of college- graduate women in the 1930s cohorts were teachers for much of their working lifetimes, and teachers generally had defined- benefit pensions.
The use of the HRS linked to the Social Security earnings records (called the “linked” sample) reduces the number of observations, less so for the earlier than for the more recent cohorts as previously mentioned. When we use the data with Social Security earnings, we adjust the HRS person weights for selection into the linked sample.18 In tables 1.2 and 1.4, we explore the sensitivity of the results to using the full HRS sample and the linked sample. Because the HRS is a longitudinal data set, many of the respondents are in the sample more than once between the ages of fifty- nine and sixty- three, and we cluster the standard errors at the individual level. We also include dummy variables for the single- year ages.
In table 1.2, column (1), the baseline regression is provided for the full sample and column (2) gives the baseline for the smaller linked sample. The variables of interest are those showing the effect of birth cohort in three- year bins from 1931 to 1951 (where 1931– 33 is the omitted cohort group).19
The impacts of birth cohort on labor force participation from ages fifty- nine to sixty- three are highly similar between the two samples and both demonstrate the increase in participation at older ages for birth cohorts after 1943 and especially after 1949. The most recent cohort that can be analyzed for the fifty- nine- to sixty- three- year- old group, born from 1949 to 1951, has a participation rate that is around 10 percentage points higher in the full sample (9 for the linked sample) than for cohorts born in the 1930s. The only additional covariates included in the first two columns are single year of age and race dummies.
Educational attainment is added in column (3) and life cycle participa-tion between ages thirty- five and forty- four is included in column (4). The life cycle labor force variables give the fraction of years in the interval that the woman was in the labor force. These have been computed mainly from the restricted- access Social Security earnings data (since 1951) and W- 2 forms (when available). Additional information is used from the HRS to add labor force data for individuals exempt from Social Security taxes, gener-
17. Similar regressions to those in table 1.3 for women fifty- six to fifty- eight years old are in appendix table 1A.5.
18. The adjustment multiplies the person weight by the inverse of the predicted linkage rate, based on individual predetermined characteristics at the time of their birth cohort’s entry into the HRS. Linkage rates are predicted using a logit model for whether the woman allowed the linkage on HRS cohort wave dummies and HRS measures of employment history, race, marital status, education, and financial wealth at HRS cohort entry.
19. The last year of the HRS available is 2012. The 1952– 54 cohort is incomplete and thus is omitted.
You are reading copyrighted material published by University of Chicago Press. Unauthorized posting, copying, or distributing of this work except as permitted under
U.S. copyright law is illegal and injures the author and publisher.

Women Working Longer: Facts and Some Explanations 29
ally because they were government employees, such as teachers. The HRS provides information concerning two periods prior to the start of the HRS interviews in which the respondent was a government employee. When HRS survey responses are available regarding participation, they are used in place of Social Security earnings and W- 2 data. (For more details, see appen-dix: “Construction of Variables.”) Various life cycle employment variables were created for each of the three decades from age twenty- five to fifty- four and for the entire period.
The addition of educational attainment eliminates the economic and sta-tistical significance of the cohort coefficients for all but the most recent of the birth cohorts. Although only the linked sample coefficients are given, those for the full sample change in the same manner. The addition of the life cycle participation variable in column (4) further reduces the coefficient for the most recent of the birth cohorts to a slightly negative value. It also produces some modest reduction of the impact of educational attainment since the more educated have greater continuity in employment.
Instead of a variable that measures life cycle participation, one that mea-sures the degree to which a woman reaches some career level may be more important in determining future participation. Since women with greater prior employment when first beginning their careers have greater attachment to the labor force later in the lives, those with higher earnings when employed should have even greater attachment.
To test whether employment per se or years of better earning perfor-mance matter, we create a variable giving the fraction of an age interval that a “career condition” was met. The condition used here is achieving an earnings level that is some fraction (50 percent in this case) of the median earnings of a full- time, year- round male worker for the ten- year age group considered during the relevant period.20 That is, the career condition for a woman when she was in an age group is judged relative to the earnings of the median male in the same age group during the identical period. Women who were never in the labor force in the age interval are assigned a value of zero, as do those who never earned more than the condition but were in the labor force. We find that the variable giving the career condition (in column [5]) is related to later employment, but less strongly than the simpler variable giving the fraction of the interval a woman was employed.
Column (6) augments the column (4) specification by adding two con-temporaneous variables: current marital status and current health status. The birth cohort coefficients were already extinguished with controls for
20. Earnings of the median male, in the same age group and year, are used. These data are available in published documents (US Census Bureau P‑ 60 Reports) prior to the microdata for the CPS, which begins in 1962. The calculation of all the career conditions considered requires data from 1956 (1931 + twenty- five years). A fraction of the male median is used because the median is too high a bar for employed women during much of the period considered. Women in the exempt occupations are assumed to exceed the bar. See appendix: “Health and Retirement Survey: Construction of Variables.”
You are reading copyrighted material published by University of Chicago Press. Unauthorized posting, copying, or distributing of this work except as permitted under
U.S. copyright law is illegal and injures the author and publisher.
30 Claudia Goldin and Lawrence F. Katz
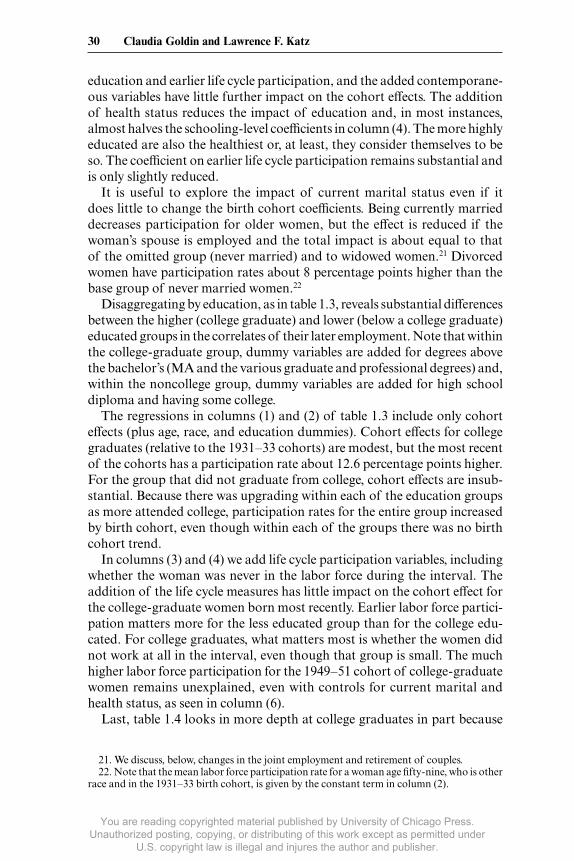
education and earlier life cycle participation, and the added contemporane-ous variables have little further impact on the cohort effects. The addition of health status reduces the impact of education and, in most instances, almost halves the schooling- level coefficients in column (4). The more highly educated are also the healthiest or, at least, they consider themselves to be so. The coefficient on earlier life cycle participation remains substantial and is only slightly reduced.
It is useful to explore the impact of current marital status even if it does little to change the birth cohort coefficients. Being currently married decreases participation for older women, but the effect is reduced if the woman’s spouse is employed and the total impact is about equal to that of the omitted group (never married) and to widowed women.21 Divorced women have participation rates about 8 percentage points higher than the base group of never married women.22
Disaggregating by education, as in table 1.3, reveals substantial differences between the higher (college graduate) and lower (below a college graduate) educated groups in the correlates of their later employment. Note that within the college- graduate group, dummy variables are added for degrees above the bachelor’s (MA and the various graduate and professional degrees) and, within the noncollege group, dummy variables are added for high school diploma and having some college.
The regressions in columns (1) and (2) of table 1.3 include only cohort effects (plus age, race, and education dummies). Cohort effects for college graduates (relative to the 1931– 33 cohorts) are modest, but the most recent of the cohorts has a participation rate about 12.6 percentage points higher. For the group that did not graduate from college, cohort effects are insub-stantial. Because there was upgrading within each of the education groups as more attended college, participation rates for the entire group increased by birth cohort, even though within each of the groups there was no birth cohort trend.
In columns (3) and (4) we add life cycle participation variables, including whether the woman was never in the labor force during the interval. The addition of the life cycle measures has little impact on the cohort effect for the college- graduate women born most recently. Earlier labor force partici-pation matters more for the less educated group than for the college edu-cated. For college graduates, what matters most is whether the women did not work at all in the interval, even though that group is small. The much higher labor force participation for the 1949– 51 cohort of college- graduate women remains unexplained, even with controls for current marital and health status, as seen in column (6).
Last, table 1.4 looks in more depth at college graduates in part because
21. We discuss, below, changes in the joint employment and retirement of couples.22. Note that the mean labor force participation rate for a woman age fifty- nine, who is other
race and in the 1931– 33 birth cohort, is given by the constant term in column (2).
You are reading copyrighted material published by University of Chicago Press. Unauthorized posting, copying, or distributing of this work except as permitted under
U.S. copyright law is illegal and injures the author and publisher.

Table 1.4 Labor force participation among college- graduate women at ages fifty- nine to sixty- three: HRS
Full sample Linked sample
(1) (2) (3) (4) (5)
Year of birth 1934–36 0.00774 0.0272 0.0308 0.0458 0.0294
(0.0497) (0.0524) (0.0507) (0.0470) (0.0508) 1937–39 0.00217 0.0169 0.0221 0.0212 0.00996
(0.0503) (0.0543) (0.0544) (0.0508) (0.0538) 1940–42 0.0389 0.0327 0.0154 0.0193 0.00204
(0.0484) (0.0518) (0.0508) (0.0473) (0.0509) 1943–45 0.0370 0.0402 0.00983 0.0179 −0.0172
(0.0503) (0.0541) (0.0543) (0.0526) (0.0550) 1946–48 0.0465 0.0482 0.0114 0.0110 −0.0256
(0.0475) (0.0525) (0.0528) (0.0503) (0.0544) 1949–51 0.0957** 0.117** 0.0931 0.105** 0.0524
(0.0452) (0.0500) (0.0505) (0.0460) (0.0510)Ever a teacher −0.0477 −0.0483 −0.0545 −0.0892* −0.0591
(0.0288) (0.0315) (0.0309) (0.0294) (0.0305)MA 0.0538 0.0578 0.0504 0.0381 0.0405
(0.0296) (0.0326) (0.0322) (0.0306) (0.0319)PhD, MD, JD, etc. 0.160*** 0.164*** 0.133* 0.107* 0.111**
(0.0447) (0.0470) (0.0479) (0.0411) (0.0461)Life cycle LFP 35–44 0.0673
(0.0573)Never in LF 35–44 −0.164**
(0.0731)Life cycle LFP 45–54 0.379***
(0.0710)Never in LF 45–54 −0.178
(0.0973)Life cycle LFP 25–54 0.355***
(0.0655)
Health status No No No No NoAge dummies Yes Yes Yes Yes YesRace dummies Yes Yes Yes Yes YesMarital status dummies Yes Yes Yes Yes YesJob status of husband Yes Yes Yes Yes YesConstant 0.855*** 0.876*** 0.866*** 0.580*** 0.675***
(0.0591) (0.0629) (0.0755) (0.0857) (0.0708)
N 3,137 2,642 2,642 2,642 2,642R‑squared 0.040 0.044 0.062 0.141 0.080
Sources: Health and Retirement Study (HRS) 1992 to 2012, RAND version with added variables from original HRS files. Social Security Administration earnings (and W- 2) data are used to calculate life cycle labor force participation (Life cycle LFP <ages>) and the career condition (Career cond. <ages>).
(continued)
You are reading copyrighted material published by University of Chicago Press. Unauthorized posting, copying, or distributing of this work except as permitted under
U.S. copyright law is illegal and injures the author and publisher.

32 Claudia Goldin and Lawrence F. Katz
their participation rates are the highest at all ages, especially among those in their sixties. In addition, the fraction of older women who are college gradu-ates has greatly expanded and will continue to do so given the increase of college graduates at younger ages. Both the increase of college graduation for future cohorts and their higher participation at older ages would imply an increase in the future employment of older women.
Table 1.4 includes the predetermined (life cycle participation and educa-tion) and contemporaneous (marital and health status) variables. In addi-tion, we include whether the woman was ever employed as a teacher.
Cohort effects are large for the most recent in table 1.4, echoing the finding for college- graduate women in table 1.3. The coefficient remains large and statistically significant despite the inclusion of current marital status and life cycle participation variables. Only in column (5), with the inclusion of the fraction of years from twenty- five to fifty- four that the woman was in the labor force does the coefficient greatly decline.
Teaching was the single most important occupation for college- graduate women among many of the HRS cohorts. Around 45 percent of college- graduate women in the cohorts born from 1931 to 1941 were teachers at some point, as seen in figure 1.6. A much smaller fraction of women (around 30 percent) for the later cohorts considered here, 1945 to 1951, were teachers. And an even smaller fraction (around 20 percent) were teachers in the late 1950s birth cohort, a group still too young to be observed in their sixties.
Those who were ever a teacher had participation rates when they were fifty- nine to sixty- three years old that were about 5 percentage points lower than other college- graduate women. The impact of ever being a teacher increases when controlling for life cycle participation, showing that teachers work more than others earlier in their lives but are less likely to work later in their lives. Their earlier work would indicate they would be more likely
Table 1.4 (continued)
Notes: The dependent variable is 1 if the woman is in the labor force and 0 otherwise. The HRS asks re-spondents their labor force status and a woman is in the labor force if she reported being employed or unemployed and searching for work.
Health status is self- reported and is coded as 1 if “good” or better and 0 otherwise. Marital status variables refer to current status. “Life cycle LFP <ages>” is the fraction of the interval the woman was in the labor force as determined by a combination of the data sources described in the appendix. “Never in LF” is 1 if the individual was recorded as having no years in the labor force during those years. The “linked sample” indicates that the individual gave permission for Social Security earnings data to be linked. Omitted base group variables are 1931–33 birth cohort, BA only for the college- graduate group, never married, other race, and age fifty- nine. Omitted from the table are dummy variables for missing variables regarding spouse in labor force and health status. The regressions are weighted by the HRS person weights; the weights are adjusted for sample selection into the linked sample in columns (2) to (5). Standard errors in parentheses have been clustered at the individual level.***Significant at the 1 percent level.**Significant at the 5 percent level.*Significant at the 10 percent level.
You are reading copyrighted material published by University of Chicago Press. Unauthorized posting, copying, or distributing of this work except as permitted under
U.S. copyright law is illegal and injures the author and publisher.

Women Working Longer: Facts and Some Explanations 33
to work later, but they are less likely. Part of the reason why teachers have lower employment as they age is due to their defined- benefit pensions, and thus their long- term plans to retire after a fixed period. Other possibilities include “burnout” on the job and lack of advancement.23
The table 1.4 analysis reinforces the findings from table 1.3 that the cohort effect for the most recent birth group is not extinguished by the other covari-ates, even when the life cycle participation rate variable is included, as in col-umns (3), (4), and (5). The coefficient for the 1949– 51 birth cohort is around 10 to 12 percentage points, a bit smaller than without the “ever a teacher” variable, but still large and significant.
Another important finding for forecasting women’s future participation at older ages is that employment in the forty- five- to fifty- four- year- old range is the best predictor of whether an individual will remain employed into her early sixties. Therefore, even though participation rates have twisted, as noted in the discussion of figure 1.5, the fact that participation is still higher
23. Fitzpatrick (chapter 7, this volume) explores reasons for the decrease in employment at older ages among those who were ever a teacher.
Fig. 1.6 Fraction of college- graduate women ever employed in teaching, for 1931 to 1959 birth cohorts: HRSSource: HRS, restricted- access data.Note: “Ever employed in teaching” is calculated with code provided by Maria Fitzpatrick (see chapter 7, this volume), which uses detailed occupations of respondents prior to their first HRS interview. The dashed line is the three- year centered moving average.
You are reading copyrighted material published by University of Chicago Press. Unauthorized posting, copying, or distributing of this work except as permitted under
U.S. copyright law is illegal and injures the author and publisher.

34 Claudia Goldin and Lawrence F. Katz
for the most recent cohorts when they have reached their fifties suggests that recent cohorts of college- graduate women will remain in the labor force through their sixties and seventies even more than did their predecessors. The same does not appear true for the non- college- graduate group.
We have also run the same regressions as in tables 1.2, 1.3, and 1.4 where the outcome is working full time, rather than just being in the labor force. The results (given in appendix table 1A.4 for the table 1.3 comparison) for full- time work, for both college graduates and those below college- graduation level, reveal similar cohort trends.24 Thus, the cross- cohort increases in labor force participation for older women are substantially driven by increases in full- time work. These findings are consistent with those from the CPS, given in figure 1.4, showing an increase in the fraction of female labor force participants employed full time among those fifty- five to seventy- four years old.
What about the role of job enjoyment? The HRS allows us to explore the answer for women fifty- nine to sixty- three years old for whom information exists on their attitude toward their job six years previously. Because of the restriction on having a job six years ago, we omit the earlier birth cohorts and include those born from 1937 to 1951. We ask how a woman’s attitude about her job six years earlier impacts her contemporaneous employment. The attitude variable inquired in all years except 1992 whether an employed person enjoyed her job a lot or not at all in four gradations of strength.
We present the analysis in several ways. In table 1.5, columns (1) to (5), we include all who were employed six years before, and in column (6) we add those not employed six years previously and give them a separate dummy for the job- attitude response. Columns (1), (2), (4), and (6) contain the basic variables and columns (3) and (5) add the life cycle labor force variable, marital status, spousal work, and health status.
Column (1) provides baseline results excluding the attitude variable but using the same sample limited to those employed six years ago. Columns (4) and (5) explore the characteristics of the job held six years prior by adding the hours and earnings on that job.
Those who had expressed greater enjoyment about their jobs six years pre-viously have a higher probability of being in the labor force from fifty- nine to sixty- three years old.25 The differences, moreover, are large: 10 percentage points (on a base of around 70) between those who agree and disagree with
24. We also run the same labor force regressions as in tables 1.2, 1.3, and 1.4 for women fifty- six to fifty- eight years old and give the table 1.3 results in appendix table 1A.5. Using women fifty- six to fifty- eight years old allows us to include another birth cohort, 1952– 54. Like the table 1.3 results, college- graduate women in cohorts born after 1948 show larger cohort effects than for earlier cohorts. Including the full set of preexisting characteristics lowers the cohort effect estimates for the more recent cohorts at age fifty- six to fifty- eight somewhat more than for the older group of women in table 1.3.
25. We have also done the same regressions for work eight years previously with similar results.
You are reading copyrighted material published by University of Chicago Press. Unauthorized posting, copying, or distributing of this work except as permitted under
U.S. copyright law is illegal and injures the author and publisher.

Tab
le 1
.5
Rol
e of
pas
t wor
k at
titu
de fo
r em
ploy
men
t of
wom
en a
ges
fifty
- nin
e to
six
ty- t
hree
: HR
S
Lab
or fo
rce
part
icip
atio
n at
age
s fif
ty- n
ine
to s
ixty
- thr
ee
Wor
ked
six
year
s ag
o
All
(1)
(2
)
(3)
(4
)
(5)
(6)
Enj
oy jo
b 6
yrs.
ago
Stro
ngly
agr
ee0.
223*
0.20
3*0.
235*
0.21
2*0.
229*
(0.0
720)
(0.0
694)
(0.0
723)
(0.0
693)
(0.0
718)
A
gree
0.19
8*0.
189*
0.20
9*0.
198*
0.20
2*(0
.070
9)(0
.068
0)(0
.071
3)(0
.068
0)(0
.070
8)
Dis
agre
e0.
101
0.09
320.
105
0.09
830.
103
(0.0
710)
(0.0
686)
(0.0
715)
(0.0
686)
(0.0
709)
N
o jo
b 6
yrs.
ago
−0.
322*
**(0
.070
8)Y
ear
of b
irth
19
40–4
20.
0046
6−
0.00
237
−0.
0113
−0.
0000
308
−0.
0069
1−
0.00
659
(0.0
253)
(0.0
255)
(0.0
243)
(0.0
255)
(0.0
243)
(0.0
182)
19
43–4
5−
0.00
0282
−0.
0051
8−
0.00
894
0.00
0100
−0.
0000
508
−0.
0014
7(0
.028
1)(0
.028
1)(0
.027
1)(0
.028
0)(0
.027
0)(0
.021
0)
1946
–48
0.00
712
0.00
303
0.00
475
0.00
565
0.01
160.
0007
06(0
.028
5)(0
.028
5)(0
.027
0)(0
.028
6)(0
.027
1)(0
.021
3)
1949
–51
0.01
530.
0081
50.
0102
0.01
570.
0210
0.00
376
(0.0
290)
(0.0
291)
(0.0
282)
(0.0
289)
(0.0
280)
(0.0
224)
Hig
h sc
hool
gra
d.0.
0859
*0.
0865
*0.
0342
0.07
99**
0.03
040.
0549
*(0
.032
6)(0
.032
5)(0
.032
9)(0
.032
5)(0
.032
9)(0
.019
9)So
me
colle
ge0.
145*
**0.
138*
**0.
0682
**0.
130*
**0.
0632
0.09
72**
*(0
.033
5)(0
.033
5)(0
.034
0)(0
.033
9)(0
.034
1)(0
.021
7)B
A0.
164*
**0.
153*
**0.
0594
0.14
3***
0.05
500.
119*
**(0
.037
7)(0
.037
8)(0
.038
5)(0
.038
4)(0
.038
9)(0
.027
3)M
A0.
218*
**0.
210*
**0.
118*
0.19
8***
0.11
2*0.
171*
**(0
.038
4)(0
.038
1)(0
.039
0)(0
.039
2)(0
.039
7)(0
.029
6)L
ife
cycl
e L
FP
35–
440.
0456
0.01
65(0
.026
5)(0
.027
1)(c
onti
nued
)
You are reading copyrighted material published by University of Chicago Press. Unauthorized posting, copying, or distributing of this work except as permitted under
U.S. copyright law is illegal and injures the author and publisher.

Tab
le 1
.5
(con
tinu
ed)
Lab
or fo
rce
part
icip
atio
n at
age
s fif
ty- n
ine
to s
ixty
- thr
ee
Wor
ked
six
year
s ag
o
All
(1)
(2
)
(3)
(4
)
(5)
(6)
(ln)
Ear
ning
s−
0.00
252
−0.
0055
8(0
.009
66)
(0.0
0932
)
Hea
lth
stat
usN
oN
oY
esN
oY
esN
oA
ge d
umm
ies
Yes
Yes
Yes
Yes
Yes
Yes
Rac
e du
mm
ies
Yes
Yes
Yes
Yes
Yes
Yes
Mar
ital
sta
tus
dum
mie
sN
oN
oY
esN
oY
esN
oJo
b st
atus
of
husb
and
No
No
Yes
No
Yes
No
Con
stan
t0.
560*
**0.
385*
**0.
293*
*0.
0942
0.07
850.
450*
**(0
.065
2)(0
.093
6)(0
.099
1)(0
.136
)(0
.136
)(0
.079
4)
N5,
050
5,05
05,
050
5,05
05,
050
7,73
6R
‑squ
ared
0.
032
0.
041
0.
104
0.
051
0.
112
0.
288
Sou
rces
: H
ealt
h an
d R
etir
emen
t St
udy
(HR
S) 1
992
to 2
012,
RA
ND
ver
sion
wit
h ad
ded
vari
able
s fr
om o
rigi
nal H
RS
files
. Soc
ial S
ecur
ity
Adm
inis
trat
ion
earn
ings
(and
W- 2
) dat
a ar
e us
ed to
cal
cula
te li
fe c
ycle
labo
r fo
rce
part
icip
atio
n (L
ife
cycl
e L
FP
<ag
es>
).N
otes
: The
dep
ende
nt v
aria
ble
is 1
if th
e w
oman
is in
the
labo
r fo
rce
and
0 ot
herw
ise.
In
colu
mns
(1) t
hrou
gh (5
) onl
y th
ose
wit
h po
siti
ve p
erso
n w
eigh
ts a
nd
wor
king
six
yea
rs a
go (
or w
ho h
ad a
mis
sing
job
- att
itud
e qu
esti
on)
are
incl
uded
; col
umn
(6)
incl
udes
tho
se n
ot w
orki
ng. F
or v
aria
bles
tha
t ar
e id
enti
cal t
o th
ose
in t
able
s 1.
2 to
1.4
, see
not
es t
o th
ose
tabl
es. A
ll co
lum
ns u
se t
he “
linke
d sa
mpl
e.”
Om
itte
d ba
se g
roup
var
iabl
es a
re “
enjo
y jo
b 6
yrs.
ago
” st
rong
ly
disa
gree
, 193
7–39
bir
th c
ohor
t, b
elow
hig
h sc
hool
gra
duat
e, o
ther
rac
e, a
nd a
ge fi
fty-
nine
. Om
itte
d fr
om th
e ta
ble
are
the
coeffi
cien
ts o
n du
mm
y va
riab
les
for
vari
ous
mis
sing
var
iabl
es. T
hese
incl
ude
mis
sing
(or
zer
o) h
ours
six
yea
rs a
go a
nd m
issi
ng e
arni
ngs
six
year
s ag
o. I
n ad
diti
on, t
he d
umm
y va
riab
le fo
r th
e “o
ther
” jo
b at
titu
de c
ateg
ory
(tog
ethe
r w
ith
the
smal
l fra
ctio
n of
mis
sing
obs
erva
tion
s fo
r th
at v
aria
ble)
is o
mit
ted
in th
e ta
ble.
“E
njoy
job
6 yr
s. a
go”
is fr
om
a qu
esti
on a
sked
of
resp
onde
nts
wit
h a
curr
ent j
ob w
ho a
re a
sked
to e
xpre
ss a
leve
l of
agre
emen
t wit
h th
e qu
esti
on “
I re
ally
enj
oy g
oing
to w
ork.
” C
olum
ns
(4) a
nd (5
) add
(ln)
hou
rs (h
ours
wor
ked
per
wee
k in
mai
n jo
b) a
nd (l
n) a
nnua
l ear
ning
s (s
um o
f w
age
or s
alar
y in
com
e pl
us a
dded
pay
and
ear
ning
s fr
om a
se
cond
job
as w
ell a
s th
ose
from
pro
fess
iona
l pra
ctic
e or
tra
de in
com
e). E
arni
ngs
are
defla
ted
to 1
992
usin
g th
e C
PI.
The
reg
ress
ions
are
wei
ghte
d by
HR
S pe
rson
wei
ghts
adj
uste
d fo
r sa
mpl
e se
lect
ion
into
the
linke
d sa
mpl
e. S
tand
ard
erro
rs in
par
enth
eses
hav
e be
en c
lust
ered
at t
he in
divi
dual
leve
l.**
*Sig
nific
ant a
t the
1 p
erce
nt le
vel.
**Si
gnifi
cant
at t
he 5
per
cent
leve
l.*S
igni
fican
t at t
he 1
0 pe
rcen
t lev
el.
You are reading copyrighted material published by University of Chicago Press. Unauthorized posting, copying, or distributing of this work except as permitted under
U.S. copyright law is illegal and injures the author and publisher.

Women Working Longer: Facts and Some Explanations 37
the statement and 20 to 22 percentage points between those who strongly disagree and those who agree or strongly agree.26
The addition of the job- attitude question results in few changes in the other coefficients. Most important is that the impact of education is about the same, as can be seen by comparing the coefficients for education in col-umns (1) and (2). Therefore, the impact of job enjoyment adds to the influ-ence on working longer of the type of jobs that more highly educated women have. Self- reported job enjoyment is not the mediating factor for why edu-cation matters in women working longer.
The results are not materially altered by the addition of various covari-ates including current health, marital status, and the fraction of years the woman worked from age thirty- five to forty- four. Also of interest is that the additions of the hours and earnings in the job six years prior have little impact on the attitudinal coefficients. Those who worked longer hours in the past are more likely to work now, and that is in addition to their enjoyment on that job.
The summary finding is that older women have had substantial increases in labor force participation. The inclusion of covariates, such as education and life cycle participation, reduces the pattern of rising cohort effects. But for the college- graduate group, the labor force increase for the most recent cohorts now in their sixties is not reduced by the inclusion of the addi-tional covariates. The most recent cohorts with less than college completion, however, have had smaller increases and these do get extinguished with the expanded set of predetermined covariates (detailed education attainment and earlier labor force participation), although the increase in education within the non- college- graduate group served to increase participation rates.
Another finding of note is that job enjoyment six years earlier has a strong influence on women’s later employment. As jobs become less onerous and more enjoyable and as occupations become part of one’s identity, women work longer.
1.3 Life Cycle Labor Force Participation
Given the importance of life cycle labor force participation for later work, we now explore how lifetime employment changed across cohorts born from 1931 to 1954.27 We divide lifetime employment into five quintiles—from 0 to 20 percent of the years under consideration to 80 to 100 percent. Figure 1.7, panel A, shows the percentage in the labor force in the five quintiles
26. The fraction agreeing with the statement about enjoying a current job is large, around 60 percent. An additional 25 to 30 percent strongly agreed with the statement. Only about 10 to 15 percent did not agree with the statement and college- graduate women had a somewhat larger fraction who greatly agreed with the statement.
27. For a detailed discussion of life cycle labor force participation, see Goldin and Mitchell (2017).
You are reading copyrighted material published by University of Chicago Press. Unauthorized posting, copying, or distributing of this work except as permitted under
U.S. copyright law is illegal and injures the author and publisher.

A
B
Fig. 1.7 Life cycle labor force participation in the HRS and Social Security earnings data for selected birth cohorts. (A) All women, ages twenty-five to fifty-four. (B) All women, ages twenty-five to thirty-four.Sources: HRS and Social Security earnings data.Notes: Figures give the distribution of years spent in the labor force by women in various cohorts and by age group. Labor force participation is defined as having at least one of the following: (a) having SS earnings above (ten hours × fifty- two weeks × minimum wage in that year) in the years prior to the HRS survey of the respondent; (b) responding in the HRS that the person was “in the labor force” when the person has a positive HRS weight; (c) having W- 2 earnings above minimum yearly wage in that year; and (d) working for the state, federal, or municipal government in years prior to the HRS survey. The HRS person weights are use- adjusted for sample selection into the linked sample.
You are reading copyrighted material published by University of Chicago Press. Unauthorized posting, copying, or distributing of this work except as permitted under
U.S. copyright law is illegal and injures the author and publisher.

Women Working Longer: Facts and Some Explanations 39
covering the thirty years from age twenty- five to fifty- four for all women. Panel B gives these figures for the group in the youngest ten- year grouping, twenty- five to thirty- four years old. To avoid complicating the figure, we show only the earliest and the most recent cohorts: 1931– 1936 and 1949– 1954 in two- year brackets.
The fraction of women in the labor force 80 to 100 percent of the time when they were twenty- five to fifty- four years old expanded from 20 percent to more than 50 percent across these cohorts (see figure 1.7, panel A). The flip side is the sharp decrease of those who spent fewer than 20 percent of the thirty- year period shown in the labor force. The middle three quintiles changed little in terms of the fraction of the total.
More extreme changes occurred for women in the twenty- five- to thirty- four- year- old group (see figure 1.7, panel B) than for the other ten- year age groups (not shown). Once again, the middle three quintiles show little change. All the change arises because of an increase in the highest and a decrease in the lowest quintiles.
The earliest cohorts shown had life cycle participation rates that were almost uniformly distributed across the quintiles. But by the 1949 to 1954 cohorts, about 50 percent were in the labor force for more than 80 percent of the thirty years and few were in the labor force for less than 20 percent of the interval.
To make sense of these life cycle trajectories, the concepts of heterogeneity and homogeneity will be useful.28 When participation rates for a birth cohort increase with age, all women in the cohort could be working more weeks per year or more women could be entering the labor force. That is, change could be at the intensive or extensive margins (or a combination). The group that exhibits more of the former is termed “homogeneous,” since all women are increasing their work level, and the group that exhibits more of the latter is termed “heterogeneous,” because only some women increase their par-ticipation. The weight of the evidence historically is that most women are “heterogeneous” and that persistence is substantial.
Looking back at the constructed cohort lines in figure 1.5, the most recent cohorts display flat and even somewhat decreasing participation rates over their brief life cycles. That is, participation rates are higher at the lower ages than at the middle. But if most working women persist in the labor force, then the finding that early participation matters significantly implies that the reduction in participation, or the absence of an increase, for the most recent cohorts in their middle years will not matter much for their employment later in life. The key point is that for earlier cohorts, women who entered (or reentered) the labor force in midlife were probably the least persistent.
28. See Goldin (1989) and Heckman and Willis (1977) on the concepts of heterogeneity and homogeneity applied to labor force participation over the life cycle. Olivetti (2006) models an underlying reason for greater persistence in the returns to experience and demonstrates the increased returns from the 1970s to the 1990s.
You are reading copyrighted material published by University of Chicago Press. Unauthorized posting, copying, or distributing of this work except as permitted under
U.S. copyright law is illegal and injures the author and publisher.

40 Claudia Goldin and Lawrence F. Katz
1.4 Working Women, Working Couples
The regressions revealed a commonly known relationship that couples generally work together and enjoy leisure and consumption together. Cur-rently married women are far more likely to be in the labor force in their older years if their husbands are also working. In the table 1.2, column (6) regression, married women with a working spouse are 20 percentage points more likely to be in the labor force than are other married women.
Figure 1.8 demonstrates two additional points. The data use three cate-gories of women fifty- nine to sixty- three years old: those currently married with a husband working, those currently married with a nonworking hus-band, and those not currently married. Participation rates of all currently married women rose relative to the third group. In addition, the rates for currently married women with a working spouse increased the most.
A greater fraction of married couples today are both working rather than being retired together, whereas twenty years ago a greater percentage was retired together.29 For married couples in which the wife was born from 1931 to 1936, 34 percent were both retired and 25 percent were both working when she was fifty- nine to sixty- three years old. Those fractions have changed to just 22 percent retired together for the most recent cohorts (1949 to 1951 birth years) and 41 percent both working. Furthermore, in the most recent cohorts an almost equal fraction had the wife working and the husband not working (18 percent) as had the husband working and the wife not working (19 percent).
1.5 Concluding Remarks
We have explored the increase in the labor force participation of older women. Our main findings and conclusions regarding “women working longer” are
• Increased participation of women from their late fifties and beyond began in the late 1980s, before the rise in older men’s labor force par-ticipation and long before the economic downturns of the first decade of the twenty- first century, especially the Great Recession.
• The increases have been large. Among women sixty to sixty- four years old, participation increased from 34 to 51 percent during the last twenty- five years and from 45 to 61 percent for college graduates.
• Increased labor force participation of older women has been dispropor-tionately for those working full time and full year.
29. These findings are consistent with the complementarity of the leisure time of older hus-bands and wives. Schirle (2008) demonstrates, for three countries, that the increase in women’s labor force participation at older ages has led to increased men’s participation (see also Blau 1998).
You are reading copyrighted material published by University of Chicago Press. Unauthorized posting, copying, or distributing of this work except as permitted under
U.S. copyright law is illegal and injures the author and publisher.

Women Working Longer: Facts and Some Explanations 41
• Women who worked more when young, work more when they are older.• Women are working longer not mainly because of an insufficiency in
retirement savings, although that is an important issue for many in recent years. Better health is a mediating factor; those with low wealth are far more often in worse physical condition.
• A greater fraction of married couples are now working together rather than being retired together, whereas twenty years ago a greater fraction of couples were both retired.
• Women who enjoyed their jobs six to eight years before their sixties are far more likely to remain employed.
What about the future of women working longer? The two- decade stag-nation of participation rates for women in their thirties and forties could indicate that increases at later ages will not continue. But the stagnation may not impact working longer because there have been upticks for cohorts in their forties and there is an increased fraction of the population who are college graduates. The cohort effect for college graduates in the most recent birth cohort that can be explored, that from 1949 to 1951, remains large
Fig. 1.8 Labor force participation by year of birth, current marital status, and husband’s employment for women ages fifty-nine to sixty-threeSource: HRSNotes: All women ages fifty- nine to sixty- three are included; HRS person weights applied.
You are reading copyrighted material published by University of Chicago Press. Unauthorized posting, copying, or distributing of this work except as permitted under
U.S. copyright law is illegal and injures the author and publisher.

42 Claudia Goldin and Lawrence F. Katz
and statistically significant even after controlling for earlier labor force par-ticipation. The current challenge is to understand how the various factors included in our analysis are likely to impact the labor force participation of current cohorts as they age.
Appendix
Health and Retirement Study: General Comments
The Health and Retirement Study (known as the HRS and as the Uni-versity of Michigan Health and Retirement Study) is a widely used data set. (More information can be found at http:// hrsonline .isr .umich .edu/ and in the volume appendix on the HRS.)
Health and Retirement Study: Construction of Variables
Life Cycle Labor Force Participation
Life cycle labor force participation is intended to measure the fraction of a period during which the individual was in the labor force. The time period we consider is from twenty- five to fifty- four years, and we subdivide that into three decades. We primarily use the information from the Social Security earnings records (and the W- 2 forms after 1977) to figure out whether an individual was employed during a year. We can do this only for individuals who gave permission to the HRS to link their survey to their Social Security earnings records. On average, 80 percent of the sample agree to this linkage.
In general, we define someone as a labor force participant if during a year their annual earnings were at least equal to the federal minimum wage in that year times ten hours times fifty- two weeks. Complications arise because some individuals were exempt from the Social Security earnings tax. These exempt employees were generally government workers and for our sample of women, teachers would have been an important exempt category. During the initial interview the HRS asked whether the individual had been employed by the government (including municipal, state, and federal government posi-tions) and if that was the case, the person could list two periods of employ-ment. We count the individual in the labor force if the person did not pay the Social Security earnings tax in some year but stated that their employment was in the government for that period. It should be noted that when the W- 2 forms become available, there is no problem with exempt status since the forms include all W- 2 income. In addition, some HRS respondents were surveyed when they were in their early fifties and we use the HRS survey data when it exists. Thus we determine labor force status on the basis of various pieces of information including the HRS survey, the Social Security earnings records, and the W- 2 forms.
You are reading copyrighted material published by University of Chicago Press. Unauthorized posting, copying, or distributing of this work except as permitted under
U.S. copyright law is illegal and injures the author and publisher.

Women Working Longer: Facts and Some Explanations 43
Career Condition Variable
Similar to the construction of the life cycle labor force variable, we create a “career condition” variable that assesses whether individuals who were in the labor force earned above some amount. The amount is given by some fraction (we have used both 0.5 and 0.75) of the median annual wage of a (full- time, full- year) male worker in the given year. Because the period we are considering predates the microdata for the CPS, we use the published surveys to obtain the male median annual wage. In our empirical work we define the career condition between ages thirty- five and forty- four years (“Career cond. 35– 44”) as the fraction of years in the age interval the indi-vidual exceeded 50 percent of the earnings of the median male full- time, full- year worker.
Earnings data for this calculation are obtained primarily from the Social Security earnings records, the W- 2 forms when available, and the HRS earnings data when it exists for the individual. If the individual was in a tax- exempt employment (and did not have W- 2 or HRS earnings data), we assume that the income was sufficient to exceed the given “career condition.”
Social Security Earnings Record Linkage in the HRS
The fraction of female HRS respondents who agreed at some point to the linkage of their HRS study to their Social Security earnings record is high. Just around 11 percent are not linked from the 1931 to 1942 birth cohorts. The fraction increases to 15 percent for 1943 to 1945 and then to 21 percent for 1946 to 1948. The high rate of nonlinkage for the 1950s cohorts is prob-ably because they have had fewer years to agree to have their records linked since respondents are asked during each wave. The fraction not linked will probably fall during the next waves of the HRS as more respondents agree to the linkage.
Individuals who did not agree to the linkage do not differ based on educa-tional attainment and current marital status with those who did agree. The main determinant of linkage is the number of years the individual has been in the data set and, therefore, how many times the individual has been asked permission for the linkage.
Comparisons of the HRS and the CPS
Labor Force Participation Rates
The HRS closely tracks the labor force participation rates given by the CPS for the same age groups and birth cohorts. The only major differences occur for those sixty- five years and older. The HRS labor force data are always greater than the CPS data in every year from 1992 to 2010 for these age groups, but are not for the younger groupings. The precise reason is unclear. One possibility is that the CPS does a better job interviewing indi-viduals in group quarters.
You are reading copyrighted material published by University of Chicago Press. Unauthorized posting, copying, or distributing of this work except as permitted under
U.S. copyright law is illegal and injures the author and publisher.

44 Claudia Goldin and Lawrence F. Katz
Marital Status and Education
Both the HRS marital status and education variables track the CPS well for individuals fifty- one to fifty- six years old. Cohorts born from 1935 to 1952 are given in appendix tables 1A.2 and 1A.3. The HRS samples are fairly small and are subject to considerable sampling error. It should be noted that the education distributions for fifty- one- to fifty- six- year- old women differ from those for younger women in the same birth cohorts due to a common phenomenon that individuals gain education, for real or fictitious reasons, as they age.
The HRS contains a potential complication because some people did not list a degree and their highest degree was inferred. According to the RAND HRS Codebook (Chien et al. 2015, 132– 33): “The highest degree is assigned by looking at reports from Tracker and all waves of data. The first non- missing value is used.” When the actual degree is missing, it is imputed and a bachelor’s degree is given to those with RAEDYRS = 16 or 17. Interestingly, the HRS and the CPS data for the same age groups and birth cohorts is remarkably similar.
Children Ever Born
The information on children ever born in the HRS differs in various ways from that in the CPS June Fertility Supplements. But the mean number of children for the same cohorts in each of the two sources is not much dif-ferent. It appears that the main difference is that the fraction of women who report no births in the HRS is lower than reported in the CPS. For example, for women with a college degree born from 1947 to 1951 the fraction with zero births in the HRS (all of the respondents are older than forty- four years) is 19 percent. But in the CPS the fraction with zero births at forty to forty- four years old is about 25 percent. For women with less than a college degree, the fraction with no births in the HRS for those born for 1947 to 1951 is 10 percent but is 13 percent in the CPS June Fertility Supplements.
Even though HRS respondents report a lower fraction with no birth, the mean number of children ever born, as given in appendix figure 1A.2, is similar to that given in the CPS June Fertility Supplements. The HRS num-ber is almost always slightly higher, especially for cohorts from after 1945.
One possibility is that women in the HRS are also including adopted and stepchildren. That possibility has been explored and does not appear to be the source of the difference.
You are reading copyrighted material published by University of Chicago Press. Unauthorized posting, copying, or distributing of this work except as permitted under
U.S. copyright law is illegal and injures the author and publisher.

Table 1A.1 Fraction of female HRS respondents linked to Social Security earnings records by birth cohort
Birth years Fraction linked
1931–33 0.8861934–36 0.8881937–39 0.8681940–42 0.8931943–45 0.8521946–48 0.7901949–51 0.714
1952–54 0.682
Source: HRS, restricted- access data.Note: Person weights used. Linkage uses HRS to 2012.
You are reading copyrighted material published by University of Chicago Press. Unauthorized posting, copying, or distributing of this work except as permitted under
U.S. copyright law is illegal and injures the author and publisher.

Tab
le 1
A.2
C
ompa
ring
mar
ital
sta
tus
for
the
HR
S a
nd C
PS
: Wom
en a
ges
fifty
- one
to fi
fty-
six
Yea
r of
bir
th
Fra
ctio
n cu
rren
tly
mar
ried
Fra
ctio
n ev
er m
arri
ed b
ut n
ot
curr
entl
y m
arri
ed
Fra
ctio
n ne
ver
mar
ried
HR
S- SS
F
ull H
RS
C
PS
HR
S- SS
F
ull H
RS
C
PS
HR
S- SS
F
ull H
RS
C
PS
1931
–32
——
0.73
0—
—0.
230
——
0.04
019
33–3
4—
—0.
731
——
0.22
5—
—0.
044
1935
–36
0.73
70.
730
0.71
60.
236
0.24
60.
237
0.02
60.
024
0.04
719
37–3
80.
741
0.73
00.
712
0.23
00.
240
0.24
40.
029
0.02
90.
044
1939
–40
0.73
90.
734
0.70
40.
214
0.22
20.
244
0.04
70.
043
0.05
119
41–4
20.
641
0.64
70.
684
0.33
00.
322
0.26
20.
030
0.03
00.
054
1943
–44
0.55
20.
537
0.67
80.
378
0.38
70.
273
0.07
00.
075
0.04
919
45–4
60.
716
0.73
10.
683
0.22
90.
221
0.25
90.
054
0.04
70.
058
1947
–48
0.64
70.
643
0.66
90.
302
0.30
50.
269
0.05
20.
052
0.06
319
49–5
00.
628
0.60
40.
666
0.31
40.
328
0.25
90.
058
0.06
70.
075
1951
–52
0.
676
0.
684
0.
661
0.
266
0.
266
0.
261
0.
058
0.
049
0.
078
Sou
rces
: HR
S, r
estr
icte
d- a
cces
s da
ta fo
r H
RS
- SS
colu
mns
; CP
S.N
otes
: The
HR
S- S
S co
lum
ns re
fer
to th
e sa
mpl
e lin
ked
to th
e So
cial
Sec
urit
y A
dmin
istr
atio
n ea
rnin
gs d
ata.
The
num
ber
of o
bser
vati
ons
for
the
HR
S sa
mpl
e is
abo
ut 5
00 fo
r th
e 19
49–5
0 an
d 19
51–5
2 bi
rth
coho
rts
and
1,00
0 fo
r th
e 19
37–3
8 an
d 19
39–4
0 bi
rth
coho
rts.
Mis
sing
val
ues
(—) i
ndic
ate
lack
of
cove
rage
us
ing
the
part
icul
ar H
RS
coho
rts.
You are reading copyrighted material published by University of Chicago Press. Unauthorized posting, copying, or distributing of this work except as permitted under
U.S. copyright law is illegal and injures the author and publisher.

Tab
le 1
A.3
C
ompa
ring
edu
cati
on fo
r th
e H
RS
and
CP
S: W
omen
age
s fif
ty- o
ne to
fift
y- si
x
Yea
r of
bir
th
Fra
ctio
n co
llege
edu
cati
on
and
abov
e
Fra
ctio
n so
me
colle
ge
Fra
ctio
n hi
gh s
choo
l dip
lom
a
Fra
ctio
n le
ss th
an a
hig
h sc
hool
dip
lom
a
HR
S- SS
F
ull
HR
S
CP
SH
RS-
SS
Ful
l H
RS
C
PS
HR
S- SS
F
ull
HR
S
CP
SH
RS-
SS
Ful
l H
RS
C
PS
1931
–32
——
0.12
1—
—0.
146
——
0.45
0—
—0.
282
1933
–34
——
0.12
7—
—0.
161
——
0.45
4—
—0.
258
1935
–36
0.15
00.
145
0.14
30.
183
0.19
10.
174
0.45
30.
435
0.43
20.
214
0.22
90.
251
1937
–38
0.12
90.
125
0.15
70.
172
0.17
60.
181
0.44
50.
454
0.44
30.
254
0.24
50.
219
1939
–40
0.17
60.
171
0.17
20.
225
0.22
40.
206
0.37
60.
379
0.43
10.
222
0.22
60.
191
1941
–42
0.18
60.
181
0.19
00.
275
0.26
90.
231
0.34
50.
349
0.40
50.
194
0.20
00.
174
1943
–44
0.25
40.
251
0.21
10.
214
0.21
70.
245
0.36
90.
378
0.39
50.
163
0.15
50.
148
1945
–46
0.24
60.
236
0.24
00.
276
0.27
30.
245
0.32
70.
338
0.37
90.
150
0.15
30.
137
1947
–48
0.19
70.
227
0.26
50.
334
0.30
40.
272
0.36
00.
371
0.35
80.
109
0.09
80.
105
1949
–50
0.30
50.
298
0.27
70.
263
0.28
00.
276
0.32
50.
317
0.34
60.
108
0.10
50.
101
1951
–52
0.
295
0.
288
0.
296
0.
275
0.
282
0.
288
0.
339
0.
333
0.
315
0.
091
0.
097
0.
102
Sou
rces
: HR
S, r
estr
icte
d- a
cces
s da
ta fo
r H
RS
- SS
colu
mns
. CP
S- A
SEC
mic
roda
ta, M
arch
196
3 to
201
4.N
ote:
The
HR
S- S
S co
lum
ns r
efer
to th
e sa
mpl
e lin
ked
to th
e So
cial
Sec
urit
y A
dmin
istr
atio
n ea
rnin
gs d
ata.
You are reading copyrighted material published by University of Chicago Press. Unauthorized posting, copying, or distributing of this work except as permitted under
U.S. copyright law is illegal and injures the author and publisher.

Tab
le 1
A.4
F
ull-
tim
e pa
rtic
ipat
ion
for
wom
en a
t age
s fif
ty- n
ine
to s
ixty
- thr
ee, b
y ed
ucat
ion:
HR
S
Not
col
lege
gr
adua
te
(1)
Col
lege
gr
adua
te
(2)
Not
col
lege
gr
adua
te
(3)
Col
lege
gr
adua
te
(4)
Not
col
lege
gr
adua
te
(5)
Col
lege
gr
adua
te
(6)
Yea
r of
bir
th
1934
–36
−0.
0340
0.04
23−
0.03
64**
0.04
65−
0.03
75**
0.04
63(0
.019
2)(0
.052
4)(0
.018
3)(0
.051
6)(0
.017
7)(0
.048
1)
1937
–39
0.00
0660
0.01
51−
0.01
790.
0205
−0.
0102
0.01
11(0
.019
6)(0
.052
4)(0
.019
0)(0
.052
1)(0
.018
4)(0
.048
7)
1940
–42
−0.
0047
60.
0349
−0.
0343
0.01
20−
0.03
130.
0040
2(0
.020
9)(0
.052
3)(0
.020
2)(0
.051
8)(0
.019
8)(0
.048
1)
1943
–45
−0.
0097
20.
0168
−0.
0448
−0.
0238
−0.
0364
−0.
0265
(0.0
242)
(0.0
532)
(0.0
235)
(0.0
552)
(0.0
232)
(0.0
523)
19
46–4
80.
0096
90.
0360
−0.
0329
−0.
0128
−0.
0246
−0.
0027
6(0
.025
0)(0
.050
1)(0
.024
0)(0
.049
9)(0
.023
3)(0
.047
6)
1949
–51
0.00
881
0.12
0**
−0.
0347
0.08
60−
0.02
310.
0853
(0.0
285)
(0.0
521)
(0.0
279)
(0.0
506)
(0.0
273)
(0.0
479)
Hig
h sc
hool
gra
d.0.
107*
**0.
0659
***
0.02
76(0
.015
1)(0
.014
9)(0
.014
9)So
me
colle
ge0.
177*
**0.
124*
**0.
0677
***
(0.0
187)
(0.0
184)
(0.0
183)
MA
0.08
10**
0.07
06**
0.06
12(0
.033
6)(0
.033
2)(0
.032
2)P
hD, M
D, J
D, e
tc.
0.19
0*0.
146*
*0.
118
(0.0
670)
(0.0
677)
(0.0
640)
Lif
e cy
cle
LF
P 3
5–44
0.24
0***
0.13
9**
0.22
5***
0.12
7**
(0.0
247)
(0.0
584)
(0.0
240)
(0.0
610)
Nev
er in
LF
35–
44−
0.00
226
−0.
152*
*−
0.00
113
−0.
156*
*(0
.021
1)(0
.066
0)(0
.020
6)(0
.063
9)
You are reading copyrighted material published by University of Chicago Press. Unauthorized posting, copying, or distributing of this work except as permitted under
U.S. copyright law is illegal and injures the author and publisher.

Cur
rent
ly m
arri
ed−
0.11
0*−
0.25
8***
(0.0
397)
(0.0
703)
Div
orce
d0.
0322
0.07
36(0
.041
4)(0
.074
6)W
idow
−0.
0118
−0.
0473
(0.0
406)
(0.0
784)
Spou
se in
LF
0.06
88**
*0.
158*
**(0
.014
9)(0
.035
7)
Hea
lth
stat
usN
oN
oN
oN
oY
esY
esA
ge d
umm
ies
Yes
Yes
Yes
Yes
Yes
Yes
Rac
e du
mm
ies
Yes
Yes
Yes
Yes
Yes
Yes
Con
stan
t0.
177*
**0.
653*
**0.
114*
0.59
3***
0.07
760.
505*
**(0
.032
6)(0
.084
9)(0
.037
3)(0
.093
1)(0
.047
7)(0
.120
)
N12
,789
2,64
212
,789
2,64
212
,789
2,64
2R
‑squ
ared
0.
043
0.
052
0.
084
0.
079
0.
125
0.
134
Sou
rces
: Hea
lth
and
Ret
irem
ent S
tudy
(HR
S) 1
992
to 2
012,
RA
ND
ver
sion
wit
h ad
ded
vari
able
s fr
om o
rigi
nal H
RS
files
. Soc
ial S
ecur
ity
Adm
inis
trat
ion
earn
ings
(and
W- 2
) dat
a ar
e us
ed to
cal
cula
te li
fe c
ycle
labo
r fo
rce
part
icip
atio
n (L
ife
cycl
e L
FP
<ag
es>
).N
otes
: The
dep
ende
nt v
aria
ble
is 1
if th
e w
oman
is in
the
labo
r fo
rce
full
tim
e an
d 0
othe
rwis
e. A
wom
an is
in th
e la
bor
forc
e fu
ll ti
me
if s
he r
epor
ted
bein
g em
ploy
ed fo
r thi
rty-
five
or m
ore
hour
s per
wee
k. H
ealt
h st
atus
is se
lf- r
epor
ted
and
is c
oded
as 1
if “
good
” or
bet
ter a
nd 0
oth
erw
ise.
Mar
ital
stat
us v
aria
bles
re
fer
to c
urre
nt s
tatu
s. “
Lif
e cy
cle
LF
P <
ages
>”
is th
e fr
acti
on o
f th
e in
terv
al th
e w
oman
was
in th
e la
bor
forc
e as
det
erm
ined
by
a co
mbi
nati
on o
f th
e da
ta
sour
ces
desc
ribe
d in
the
appe
ndix
. “N
ever
in L
F”
is 1
if th
e in
divi
dual
was
rec
orde
d as
hav
ing
no y
ears
in th
e la
bor
forc
e du
ring
thos
e ye
ars.
All
colu
mns
us
e th
e “l
inke
d sa
mpl
e.”
Om
itte
d ba
se g
roup
var
iabl
es a
re 1
931–
33 b
irth
coh
ort,
bel
ow h
igh
scho
ol g
radu
ate
(ove
rall
or fo
r th
e le
ss- t
han
- col
lege
- gra
duat
e gr
oup)
, BA
onl
y fo
r th
e co
llege
- gra
duat
e gr
oup,
nev
er m
arri
ed, o
ther
rac
e, a
nd a
ge fi
fty-
nine
. Om
itte
d fr
om t
he t
able
are
dum
my
vari
able
s fo
r m
issi
ng
vari
able
s re
gard
ing
spou
se in
labo
r fo
rce
and
heal
th s
tatu
s. R
egre
ssio
ns a
re e
stim
ated
sep
arat
ely
for
colle
ge g
radu
ates
and
thos
e w
ho d
id n
ot g
radu
ate
from
co
llege
. Col
lege
- gra
duat
e de
gree
s be
yond
a b
ache
lor’
s ar
e ad
ded
(MA
, PhD
, etc
.), w
here
MA
incl
udes
all
mas
ter’
s de
gree
s an
d P
hD, M
D, J
D, a
nd s
o fo
rth
incl
udes
all
grad
uate
and
pro
fess
iona
l deg
rees
. For
tho
se w
ho d
id n
ot g
radu
ate
from
col
lege
, dum
my
vari
able
s ar
e ad
ded
for
thos
e w
ith
a hi
gh s
choo
l di-
plom
a an
d so
me
colle
ge. T
he r
egre
ssio
ns a
re w
eigh
ted
by H
RS
pers
on w
eigh
ts a
djus
ted
for
sam
ple
sele
ctio
n in
to t
he li
nked
sam
ple.
Sta
ndar
d er
rors
in
pare
nthe
ses
have
bee
n cl
uste
red
at th
e in
divi
dual
leve
l.**
*Sig
nific
ant a
t the
1 p
erce
nt le
vel.
**Si
gnifi
cant
at t
he 5
per
cent
leve
l.*S
igni
fican
t at t
he 1
0 pe
rcen
t lev
el.
You are reading copyrighted material published by University of Chicago Press. Unauthorized posting, copying, or distributing of this work except as permitted under
U.S. copyright law is illegal and injures the author and publisher.

Tab
le 1
A.5
Fe
mal
e la
bor
forc
e pa
rtic
ipat
ion
at a
ges
fifty
- six
to fi
fty-
eigh
t, b
y ed
ucat
ion:
HR
S
Not
col
lege
gr
adua
te
(1)
Col
lege
gr
adua
te
(2)
Not
col
lege
gr
adua
te
(3)
Col
lege
gr
adua
te
(4)
Not
col
lege
gr
adua
te
(5)
Col
lege
gr
adua
te
(6)
Yea
r of
bir
th
1937
–39
0.00
933
0.01
28−
0.01
840.
0170
−0.
0141
0.01
20(0
.023
8)(0
.055
2)(0
.022
5)(0
.053
1)(0
.021
4)(0
.050
9)
1940
–42
0.05
58**
−0.
0112
0.01
20−
0.03
110.
0257
−0.
0248
(0.0
245)
(0.0
519)
(0.0
227)
(0.0
491)
(0.0
221)
(0.0
454)
19
43–4
50.
0170
0.05
04−
0.04
190.
0071
8−
0.03
340.
0063
3(0
.029
6)(0
.052
9)(0
.028
1)(0
.051
6)(0
.027
2)(0
.050
5)
1946
–48
0.00
282
0.02
69−
0.06
07**
−0.
0217
−0.
0348
−0.
0139
(0.0
283)
(0.0
529)
(0.0
267)
(0.0
507)
(0.0
259)
(0.0
483)
19
49–5
10.
0357
0.07
63−
0.02
960.
0324
0.00
586
0.03
09(0
.030
1)(0
.048
6)(0
.028
9)(0
.048
2)(0
.027
4)(0
.046
0)
1952
–54
0.00
537
0.11
0**
−0.
0599
0.05
16−
0.02
190.
0484
(0.0
326)
(0.0
510)
(0.0
316)
(0.0
500)
(0.0
286)
(0.0
498)
Hig
h sc
hool
gra
d.0.
212*
**0.
144*
**0.
0719
***
(0.0
223)
(0.0
220)
(0.0
216)
Som
e co
llege
0.26
6***
0.18
8***
0.09
99**
*(0
.024
7)(0
.024
9)(0
.023
9)M
A0.
0227
0.01
370.
0189
(0.0
310)
(0.0
305)
(0.0
287)
PhD
, MD
, JD
, etc
.0.
109*
*0.
0751
0.05
17(0
.045
6)(0
.045
4)(0
.044
6)L
ife
cycl
e L
FP
35–
440.
302*
**0.
0818
0.28
0***
0.04
30(0
.031
5)(0
.056
5)(0
.029
7)(0
.067
4)N
ever
in L
F 3
5–44
−0.
0711
**−
0.25
8*−
0.07
21**
−0.
275*
**(0
.032
1)(0
.080
2)(0
.030
3)(0
.082
0)C
urre
ntly
mar
ried
−0.
104*
*−
0.27
6***
(0.0
525)
(0.0
696)
You are reading copyrighted material published by University of Chicago Press. Unauthorized posting, copying, or distributing of this work except as permitted under
U.S. copyright law is illegal and injures the author and publisher.

Div
orce
d0.
0796
0.01
20(0
.053
1)(0
.045
7)W
idow
0.03
13−
0.01
32(0
.054
0)(0
.059
2)Sp
ouse
in L
F0.
168*
**0.
200*
**(0
.020
7)(0
.057
8)
Hea
lth
stat
usN
oN
oN
oN
oY
esY
esA
ge d
umm
ies
Yes
Yes
Yes
Yes
Yes
Yes
Rac
e du
mm
ies
Yes
Yes
Yes
Yes
Yes
Yes
Con
stan
t0.
341*
**0.
662*
**0.
302*
**0.
672*
**0.
149*
*0.
612*
**(0
.044
9)(0
.123
)(0
.048
4)(0
.124
)(0
.066
3)(0
.124
)
N7,
354
1,64
97,
354
1,64
97,
354
1,64
9R
‑squ
ared
0.
049
0.
022
0.
123
0.
060
0.
199
0.
130
Sou
rces
: H
ealt
h an
d R
etir
emen
t St
udy
(HR
S) 1
992
to 2
012,
RA
ND
ver
sion
wit
h ad
ded
vari
able
s fr
om o
rigi
nal H
RS
files
. Soc
ial S
ecur
ity
Adm
inis
trat
ion
earn
ings
(and
W- 2
) dat
a ar
e us
ed to
cal
cula
te li
fe c
ycle
labo
r fo
rce
part
icip
atio
n (L
ife
cycl
e L
FP
<ag
es>
).N
otes
: T
he d
epen
dent
var
iabl
e is
1 if
the
wom
an is
in th
e la
bor
forc
e an
d 0
othe
rwis
e. T
he H
RS
asks
res
pond
ents
thei
r la
bor
forc
e st
atus
and
a w
oman
is in
th
e la
bor
forc
e if
she
rep
orte
d be
ing
empl
oyed
or
unem
ploy
ed a
nd s
earc
hing
for
wor
k. H
ealt
h st
atus
is s
elf-
repo
rted
and
is c
oded
as
1 if
“go
od”
or b
ette
r an
d 0
othe
rwis
e. M
arit
al s
tatu
s va
riab
les
refe
r to
cur
rent
sta
tus.
“L
ife
cycl
e L
FP
<ag
es>
” is
the
frac
tion
of
the
inte
rval
the
wom
an w
as in
the
labo
r fo
rce
as d
eter
-m
ined
by
a co
mbi
nati
on o
f th
e da
ta s
ourc
es d
escr
ibed
in th
e ap
pend
ix. “
Nev
er in
LF
” is
1 if
the
indi
vidu
al w
as r
ecor
ded
as h
avin
g no
yea
rs in
the
labo
r fo
rce
duri
ng th
ose
year
s. A
ll co
lum
ns u
se th
e “l
inke
d sa
mpl
e.”
Om
itte
d ba
se g
roup
var
iabl
es a
re 1
934–
36 b
irth
coh
ort,
bel
ow h
igh
scho
ol g
radu
ate
(ove
rall
or fo
r th
e le
ss- t
han
- col
lege
- gra
duat
e gr
oup)
, BA
onl
y fo
r the
col
lege
- gra
duat
e gr
oup,
nev
er m
arri
ed, o
ther
race
, and
age
fift
y- si
x. O
mit
ted
from
the
tabl
e ar
e du
mm
y va
riab
les
for
mis
sing
var
iabl
es re
gard
ing
spou
se in
labo
r fo
rce
and
heal
th s
tatu
s. R
egre
ssio
ns a
re e
stim
ated
sep
arat
ely
for
colle
ge g
radu
ates
and
thos
e w
ho d
id
not g
radu
ate
from
col
lege
. Col
lege
- gra
duat
e de
gree
s be
yond
a b
ache
lor’
s ar
e ad
ded
(MA
, PhD
, etc
.), w
here
MA
incl
udes
all
mas
ter’
s de
gree
s an
d P
hD, M
D,
JD, a
nd s
o fo
rth
incl
udes
all
grad
uate
and
pro
fess
iona
l deg
rees
. For
tho
se w
ho d
id n
ot g
radu
ate
from
col
lege
, dum
my
vari
able
s ar
e ad
ded
for
thos
e w
ith
a hi
gh sc
hool
dip
lom
a an
d so
me
colle
ge. T
he re
gres
sion
s are
wei
ghte
d by
the
HR
S pe
rson
wei
ghts
adj
uste
d fo
r sam
ple
sele
ctio
n in
to th
e lin
ked
sam
ple.
Sta
ndar
d er
rors
in p
aren
thes
es h
ave
been
clu
ster
ed a
t the
indi
vidu
al le
vel.
***S
igni
fican
t at t
he 1
per
cent
leve
l.**
Sign
ifica
nt a
t the
5 p
erce
nt le
vel.
*Sig
nific
ant a
t the
10
perc
ent l
evel
.
You are reading copyrighted material published by University of Chicago Press. Unauthorized posting, copying, or distributing of this work except as permitted under
U.S. copyright law is illegal and injures the author and publisher.

Fig. 1A.1 Comparing labor force participation for the HRS and the CPS: Women ages fifty to fifty- four and seventy to seventy- fourSources: CPS- ASEC microdata, March 1963 to 2014; HRS.Notes: The HRS is a biennial survey. Some age groups are not shown for the HRS because the group is incomplete and the participation rate would be biased since it would omit some of the older ages in the group.
Fig. 1A.2 Children ever born for women ages fifty- one to fifty- six in HRS and forty to forty- four in CPS in birth cohorts 1936 to 1951Sources: CPS June Fertility Supplements, microdata (1973 to 2014); HRS.Notes: HRS person weights are used; no weights are used for the CPS. Children ever born is truncated below ten in both samples. In both data sets, the variable is supposed to give the number of children ever born to the respondent and not the number of live children or adopted or stepchildren.
You are reading copyrighted material published by University of Chicago Press. Unauthorized posting, copying, or distributing of this work except as permitted under
U.S. copyright law is illegal and injures the author and publisher.

Women Working Longer: Facts and Some Explanations 53
References
Blau, David M. 1998. “Labor Force Dynamics of Older Married Couples.” Journal of Labor Economics 16 (3): 595– 629.
Chien, Sandy, Nancy Campbell, Chris Chan, Orla Hayden, Michael Hurd, Regan Main, Joshua Mallett, et al. 2015. HRS Data Documentation, Version O. Labor and Population Program. October. Santa Monica, CA: RAND. http:// hrsonline .isr .umich .edu /modules /meta /rand /randhrso /randhrs _O .pdf.
Gelber, Alexander M., Damon Jones, and Daniel W. Sacks. 2016 “Earnings Adjust-ment Frictions: Evidence from the Social Security Earnings Test.” Working Paper. August. https:// dansacks .files .wordpress .com /2015 /08 /adjustment081716 .pdf.
Goldin, Claudia. 1989. “Life- Cycle Labor- Force Participation of Married Women: Historical Evidence and Implications.” Journal of Labor Economics 7 (1) January:20– 47.
———. 1997. “Career and Family: College Women Look to the Past.” In Gender and Family Issues in the Workplace, edited by F. Blau and R. Ehrenberg, 20– 58. New York: Russell Sage Press.
Goldin, Claudia, and Joshua Mitchell. 2017. “The New Lifecycle of Women’s Employment: Disappearing Humps, Sagging Middles, Expanding Tops.” Journal of Economic Perspectives 31 (Winter): 161– 82.
Gustman, Alan, and Thomas Steinmeier. 2009. “How Changes in Social Security Affect Recent Retirement Trends.” Research on Aging 31 (2): 261– 90.
Heckman, James J., and Robert J. Willis. 1977. “A Beta- Logistic Model for the Anal-ysis of Sequential Labor Force Participation by Married Women.” Journal of Political Economy 85 (February): 27– 58.
Hurd, Michael, and Susann Rohwedder. 2014. “Predicting Labor Force Participa-tion of the Older Population.” Discussion Paper no. 14-011, Stanford Institute for Economic Policy Research.
Lumsdaine, Robin L., and Stephanie J. C. Vermeer. 2015. “Retirement Timing of Women and the Role of Care Responsibilities for Grandchildren.” Demography 52 (2): 433– 54.
Maestas, Nicole. 2010. “Back to Work: Expectations and Realizations of Work after Retirement.” Journal of Human Resources 45 (3): 718– 48.
Maestas, Nicole, and Julie Zissimopoulos. 2010. “How Longer Working Lives Ease the Crunch of Population Aging.” Journal of Economic Perspectives 24 (1): 139– 60.
Mastrobuoni, Giovanni. 2009. “Labor Supply Effects of the Recent Social Secu-rity Benefit Cuts: Empirical Estimates Using Cohort Discontinuities.” Journal of Public Economics 93:1224– 33.
Olivetti, Claudia. 2006. “Changes in Women’s Hours of Market Work: The Role of Returns to Experience.” Review of Economic Dynamics 9 (4): 557– 87.
Schirle, Tammy. 2008. “Why Have the Labor Force Participation Rates of Older Men Increased since the Mid-1990s?” Journal of Labor Economics 26 (4): 249– 94.
US Department of Education. 2015. Digest of Education Statistics. https:// nces .ed .gov /programs /digest /d15 /tables /dt15 _104 .20 .asp.
You are reading copyrighted material published by University of Chicago Press. Unauthorized posting, copying, or distributing of this work except as permitted under
U.S. copyright law is illegal and injures the author and publisher.