with Erin Troia The Nonprofit Academy
33
“You can have virtually anything you want if you’re willing to hear ‘NO’ often enough!” -Richard Fenton & Andrea Waltz The Nonprofit Academy PRESENTS! PRESENTS TAKING THE PLUNGE: DATA ANALYSIS DEEP DIVE with Erin Troia #npapresents
Transcript of with Erin Troia The Nonprofit Academy

“You can have virtually anything you want if you’re willing to hear ‘NO’ often enough!” -Richard Fenton & Andrea Waltz
The Nonprofit AcademyPRESENTS!
PRESENTS
TAKING THE PLUNGE: DATA ANALYSIS DEEP DIVEwith Erin Troia
#npapresents

“You can have virtually anything you want if you’re willing to hear ‘NO’ often enough!” -Richard Fenton & Andrea Waltz
GoToWebinar Attendee HousekeepingUsing the Control Panel1. The orange arrow opens &
hides your control panel
2. To listen, join the audio– Choose “Mic & Speakers to join
through your computer
– Choose “Telephone” to dial in using the information provided
3. Ask questions via the “Questions” panel or by tweeting with the hashtag #npapresents
The recording of this session should be available in the Online Vault a few hours after this session is over. http://thenonprofitacademy.com/vault/

Taking the Plunge:Data Analytics Deep Dive

Hello!Erin Troia, The Munshine GroupSenior Vice PresidentErin is a puzzle solver Her ability to listen and quickly prioritize, has allowed her to significantly impact fundraising growth across organizations, breakdown and revitalize data solutions, and exceed annual revenue goals. Throughout her eighteen years of nonprofit management experience she has brought creativity, energy and analytical skills to those organizations she has had the opportunity to serve.
You can find her at [email protected]
4

Deep Dive Topics
➝ Choose and Define Tracking Mechanisms➝ Extract Data from your System➝ Set up Tracking Charts ➝ Maintain and Measure
The price of light is less than the cost of darkness.Arthur C. Nielsen
5

Choose and Define Tracking
6

Erin’s Essential Metrics
7
➝ Funds raised vs. Last 3 years➝ Goal vs. actuals on all initiatives ➝ Annual Giving Watch List ➝ Annual Giving Targets vs. Actuals➝ Annual Giving Pyramid➝ Major Gift Pyramid➝ Campaign Capacity Rating ➝ Donor Assignments

Perceived Why
8
Organization Department
Personal External
GOALS

REAL Why
9
Show Progress
Allow Expertise to
Shine
Direct the Convo
Answer BEFORE you
are Asked
REALITIES

Extract Data from your System
10

What are Databases?
11
Tables of Information
Historical Records
Reporting Tools

The Questions:What do I want from you? AND where do I find it?
12

Tabs and Tables: One in the Same
BiographicalIncludes immediate biographical data on each individual or organization in your system.
AddressCurrent, seasonal, and past addresses. Sometimes includes phone and email.
GiftsRecord of all gifts given by an individual or organization.
13
RelationshipsEstablished connections between individuals and organizations.
Attributes Trackable STUFF with no other home within the database.
ProspectManagement of a prospect that will lead to a larger gift.

Methods of Extraction
Queries
The WHO?
Review or toggle to records within query
Review for accuracy of report
Save for exports and reports
Exports
Provide Detail
Complex Outputs
Mailing lists
Donor lists
Most manipulation needed
Reports
Analysis Tool
“Canned” information as predetermined by the system
Some manipulation available
“Pretty”
14

Things to Keep in Mind
15
➝ Remember: there are a million ways to get there from here
➝ Whenever you enter information, fill in as much as you can
➝ Practice makes perfect – the more often you do it, the better off you will be
➝ Start with screenshots of all screens as a booklet to work from

Goals vs. ActualsWhere? Gifts.
16

Goals vs. ActualsHow? Canned Reports.
17

TargetsWhere? Bio 2 and Giving
18

TargetsHow? Queries and Exports
19

Set up Tracking Charts
20

Tracking Chart Musings
Why?
Never looks JUST perfect in system formats
Data is old the second you extract
A manipulatable tool is essential
What?
Translatable Tool
Built in formulas, design, and charting
Industry standard for cross-department conversations
How?
Start where you are
Make mistakes
Take a Class
Read a Book
21
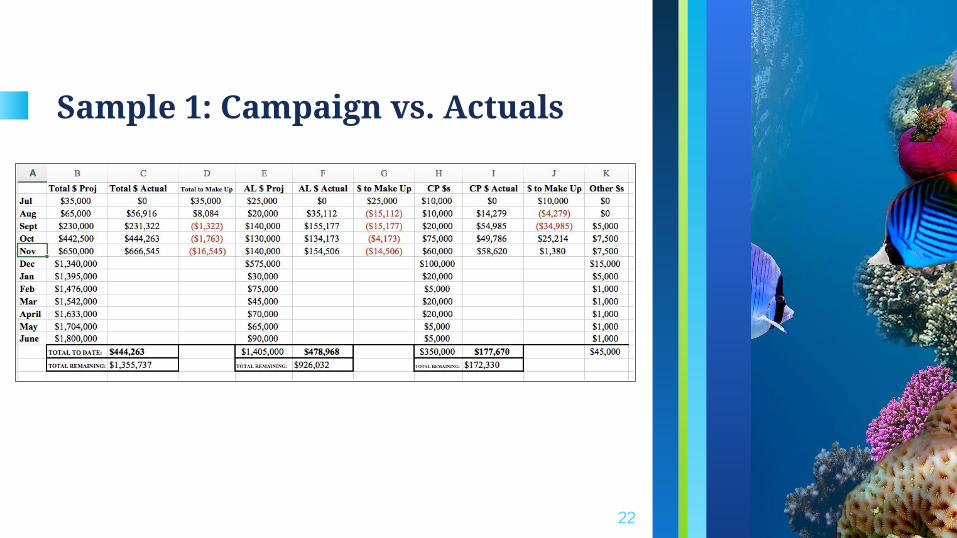
Sample 1: Campaign vs. Actuals
22

Sample 1b: Campaign vs. Actuals
23

Sample 2: Target Ask Amounts
24

Sample 3: Week to Week
25

Sample 4: Showing Progress
26

Sample 5: Monthly Growth
27

Maintain and Measure
28

29

30

Now What?
31
➝ How do you remember?� Calendar = block time� Create Tasks� Create Internal or External Accountability
➝ What does this do long term?� Trends and Patterns Emerge� Allows for Stronger Decision Making� Builds for the Future

“You can have virtually anything you want if you’re willing to hear ‘NO’ often enough!” -Richard Fenton & Andrea Waltz
PRESENTS
http://thenonprofitacademy.com/vault/
#npapresents