Wireless Telephone Service Providers Rachel Yan Bennet Heidenreich Lindsey Ludwig Lucas Hartman.
50
Wireless Telephone Service Providers Rachel Yan Bennet Heidenreich Lindsey Ludwig Lucas Hartman
-
Upload
russell-knight -
Category
Documents
-
view
219 -
download
0
Transcript of Wireless Telephone Service Providers Rachel Yan Bennet Heidenreich Lindsey Ludwig Lucas Hartman.
Wireless Telephone Service Providers
Rachel YanBennet HeidenreichLindsey LudwigLucas Hartman

Quick Question…
That’s Why!
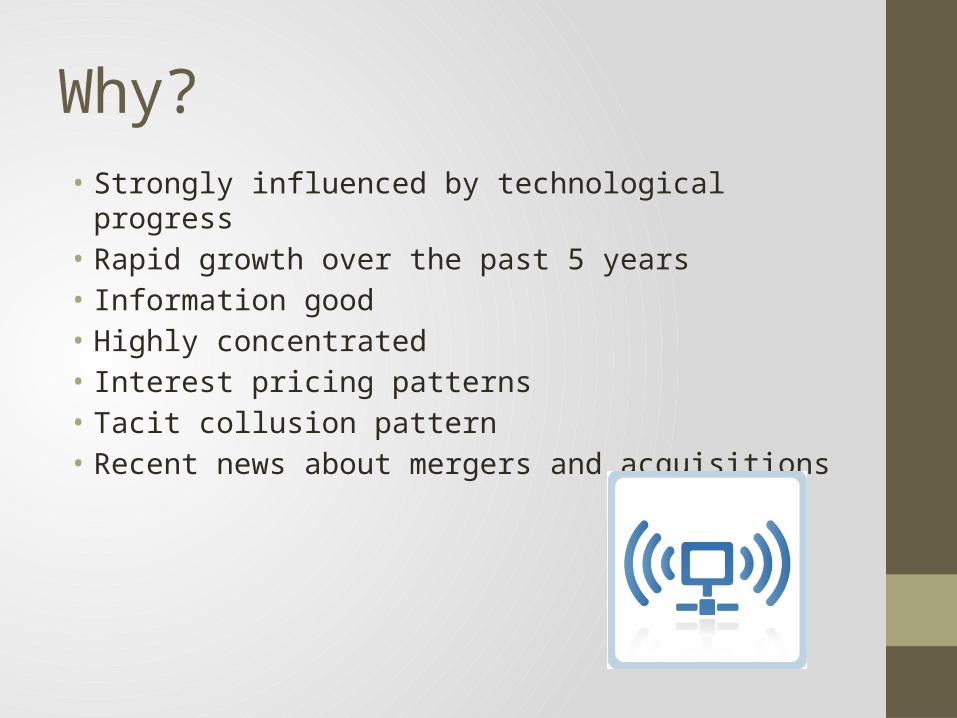
Why?• Strongly influenced by technological progress• Rapid growth over the past 5 years• Information good• Highly concentrated• Interest pricing patterns• Tacit collusion pattern• Recent news about mergers and acquisitions

Industry Structure
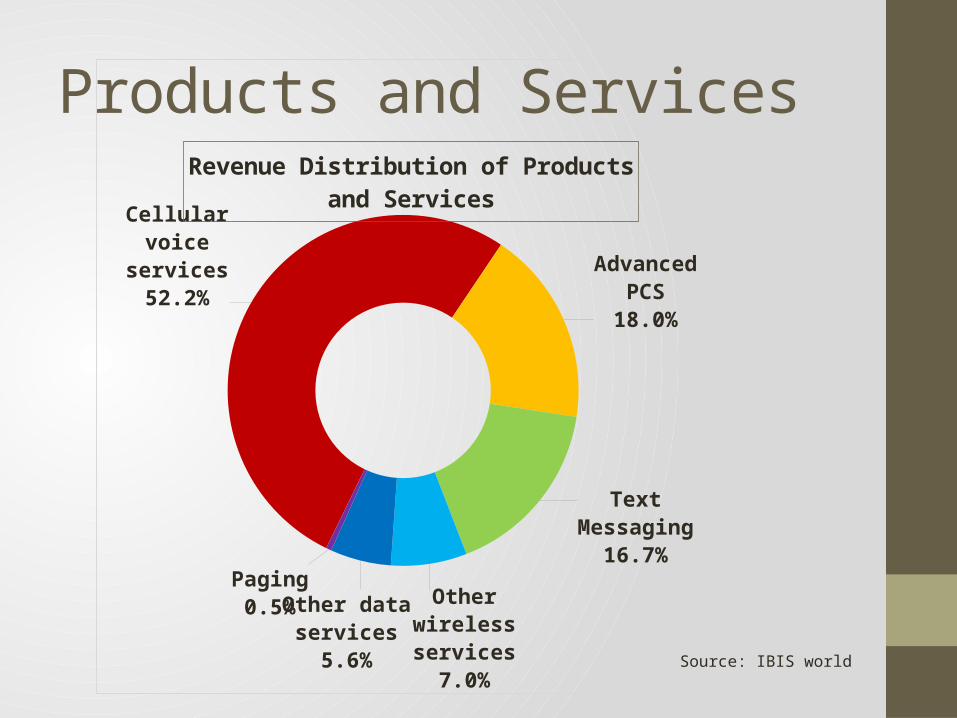
Products and Services
Cellular voice services52.2% Advanced PCS
18.0%
Text Messaging16.7%
Other wireless services
7.0%
Other data services
5.6%
Paging0.5%
Revenue Distribution of Products and Services
Source: IBIS world
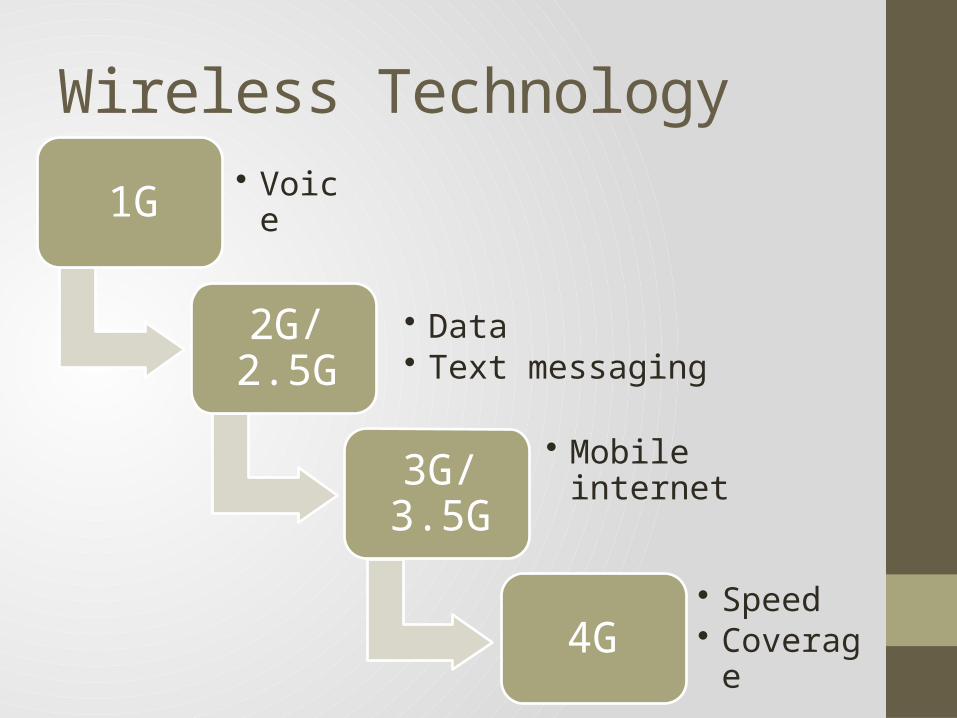
Wireless Technology
1G • Voice
2G/2.5G• Data• Text messaging
3G/3.5G• Mobile internet
4G• Speed• Coverage
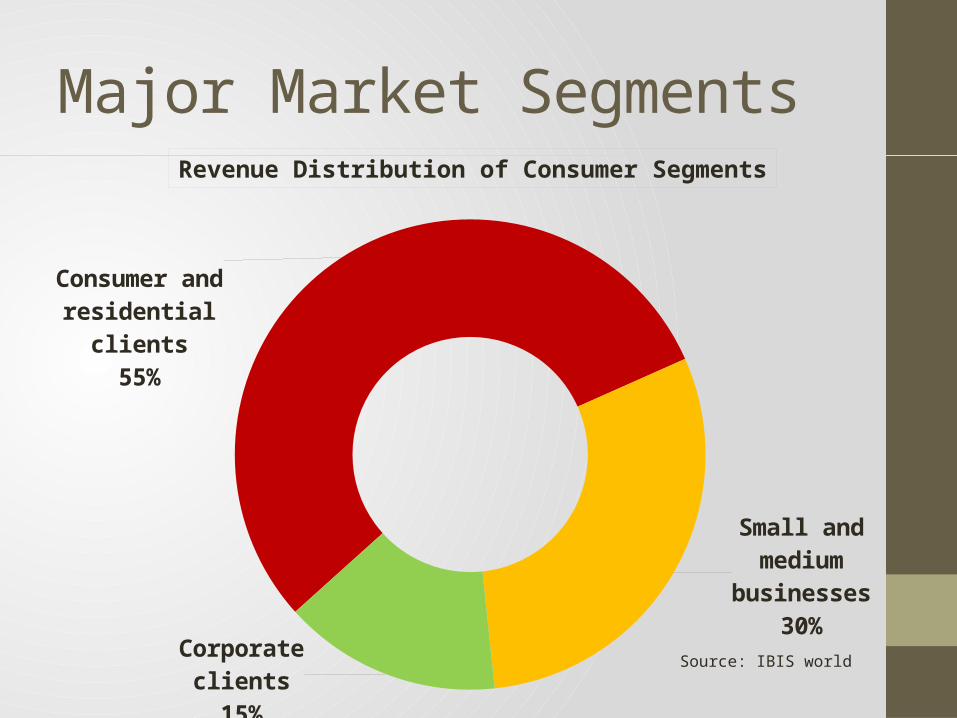
Major Market Segments
Consumer and res-idential clients
55%
Small and medium businesses
30%
Corporate clients15%
Source: IBIS world
Revenue Distribution of Consumer Segments
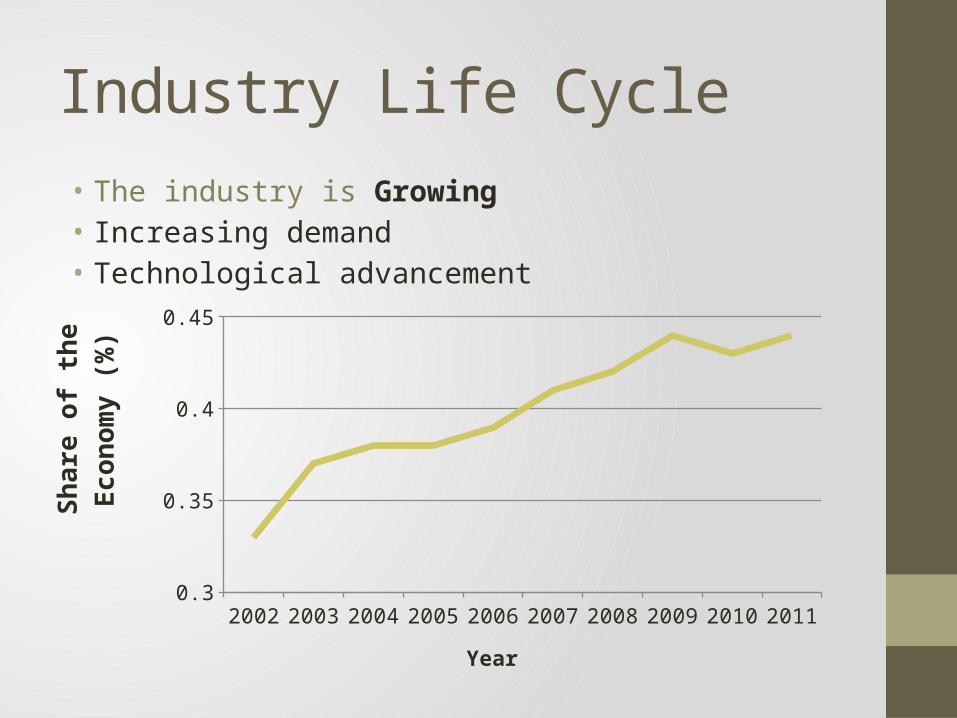
Industry Life Cycle• The industry is Growing• Increasing demand• Technological advancement
2002 2003 2004 2005 2006 2007 2008 2009 2010 20110.3
0.35
0.4
0.45
Year
Shar
e of
the
Econ
omy
(%)
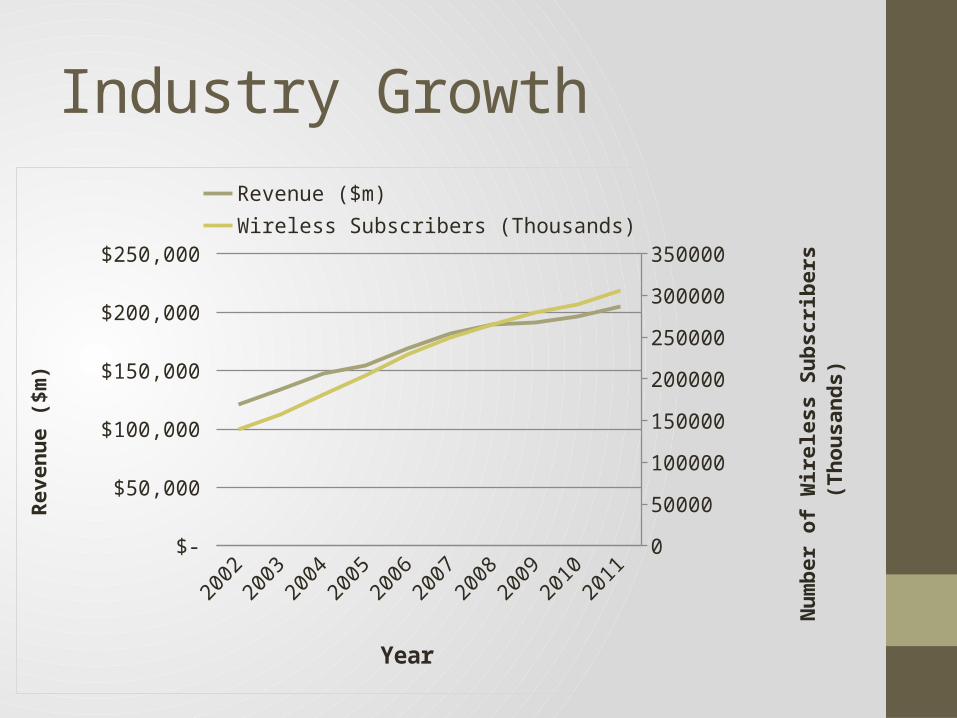
Industry Growth
2002 2003 2004 2005 2006 2007 2008 2009 2010 2011 $-
$50,000
$100,000
$150,000
$200,000
$250,000
0
50000
100000
150000
200000
250000
300000
350000
Revenue ($m) Wireless Subscribers (Thousands)
Year
Reve
nue
($m
)
Num
ber o
f Wire
less
Sub
scrib
ers (
Thou
sand
s)
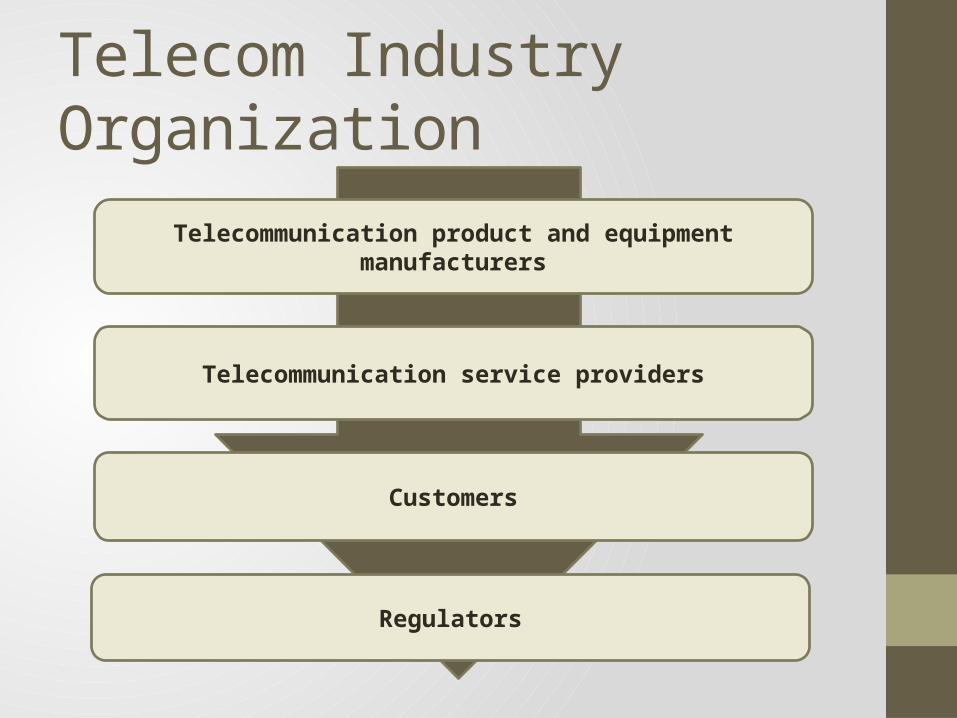
Telecom Industry Organization
Telecommunication product and equipment manufacturers
Telecommunication service providers
Customers
Regulators
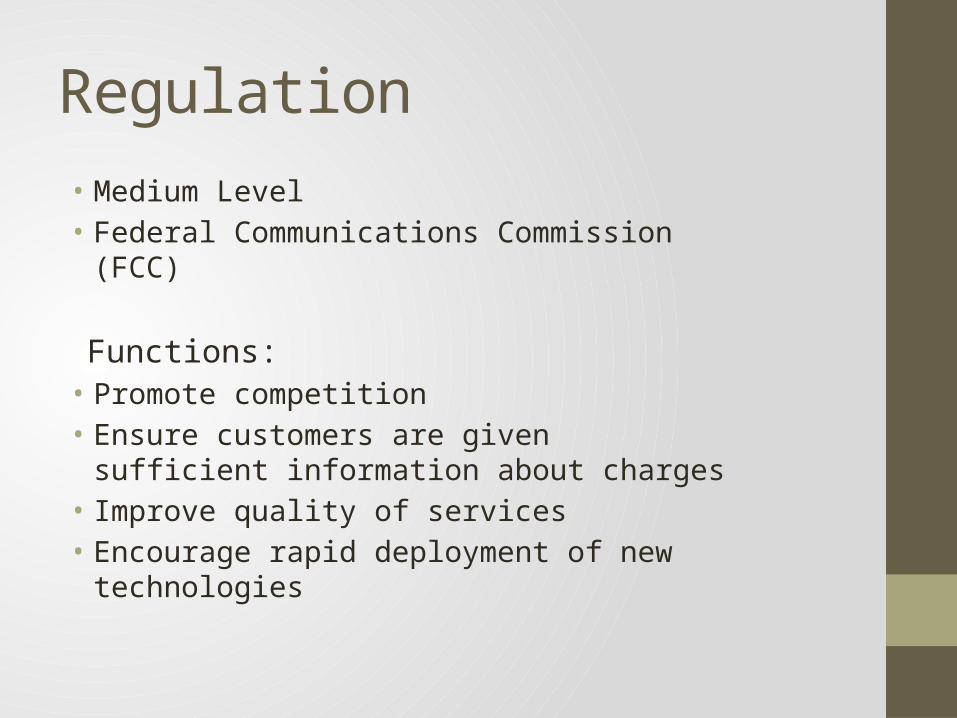
Regulation• Medium Level• Federal Communications Commission (FCC)
Functions:• Promote competition• Ensure customers are given sufficient information
about charges• Improve quality of services• Encourage rapid deployment of new technologies
Competition
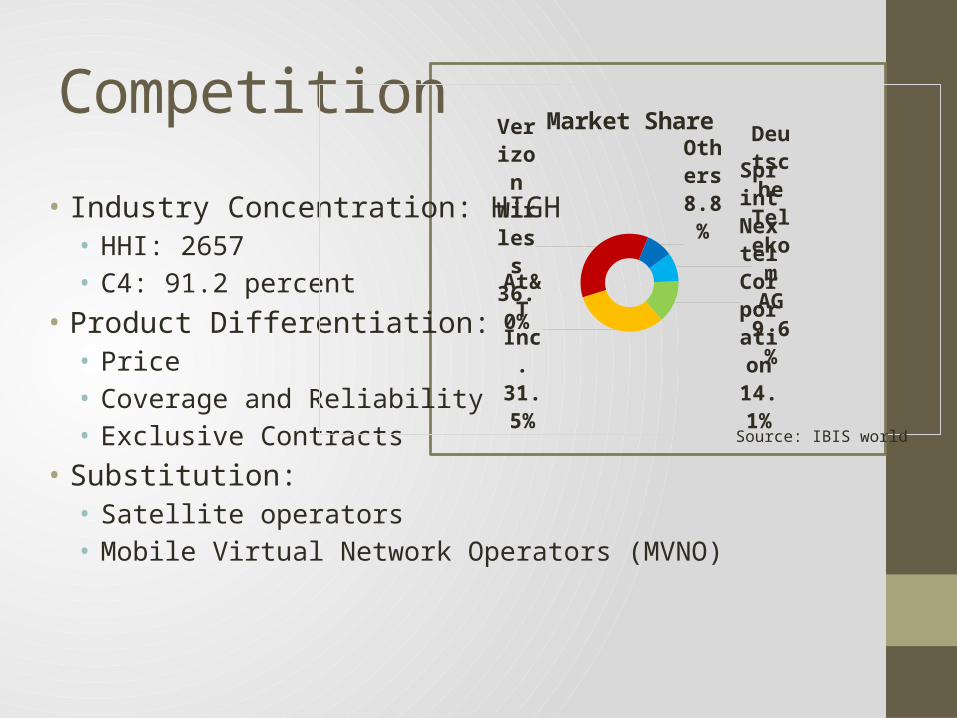
• Industry Concentration: HIGH• HHI: 2657• C4: 91.2 percent
• Product Differentiation:• Price• Coverage and Reliability• Exclusive Contracts
• Substitution:• Satellite operators• Mobile Virtual Network Operators (MVNO)
Deutsche Telekom
AG9.6%
Sprint Nextel
Corpora-tion
14.1%At&T Inc.31.5%
Verizon Wirless36.0%
Others8.8%
Market Share
Source: IBIS world
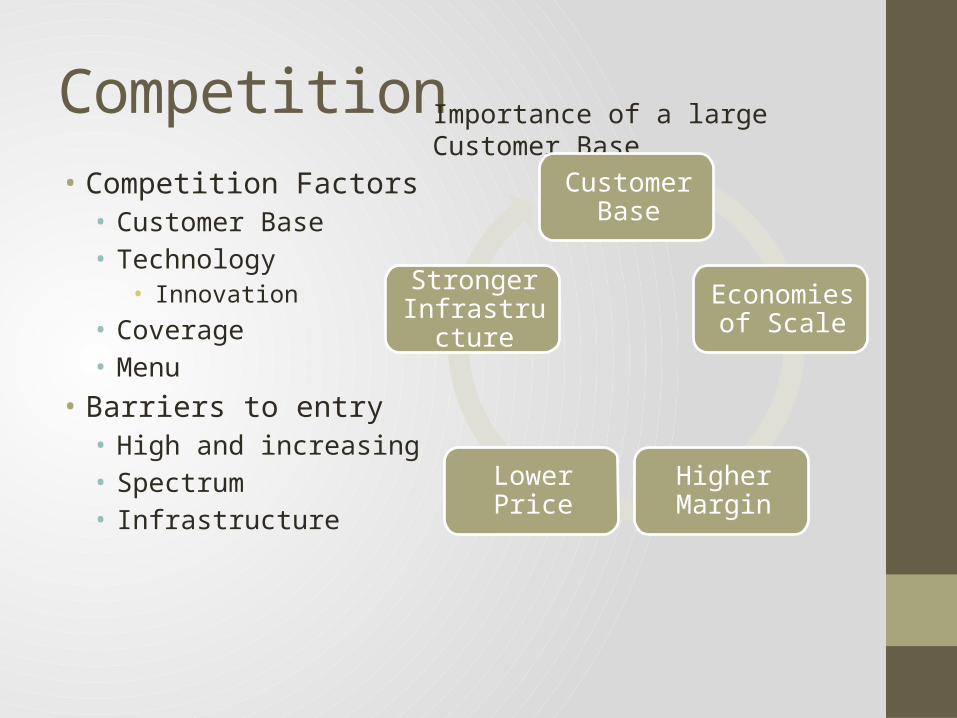
Competition• Competition Factors• Customer Base• Technology
• Innovation• Coverage• Menu
• Barriers to entry• High and increasing• Spectrum• Infrastructure
Importance of a large Customer Base
Customer Base
Economies of Scale
Higher MarginLower Price
Stronger Infrastructure
Major companies
• Verizon• AT&T• Sprint• T-Mobile
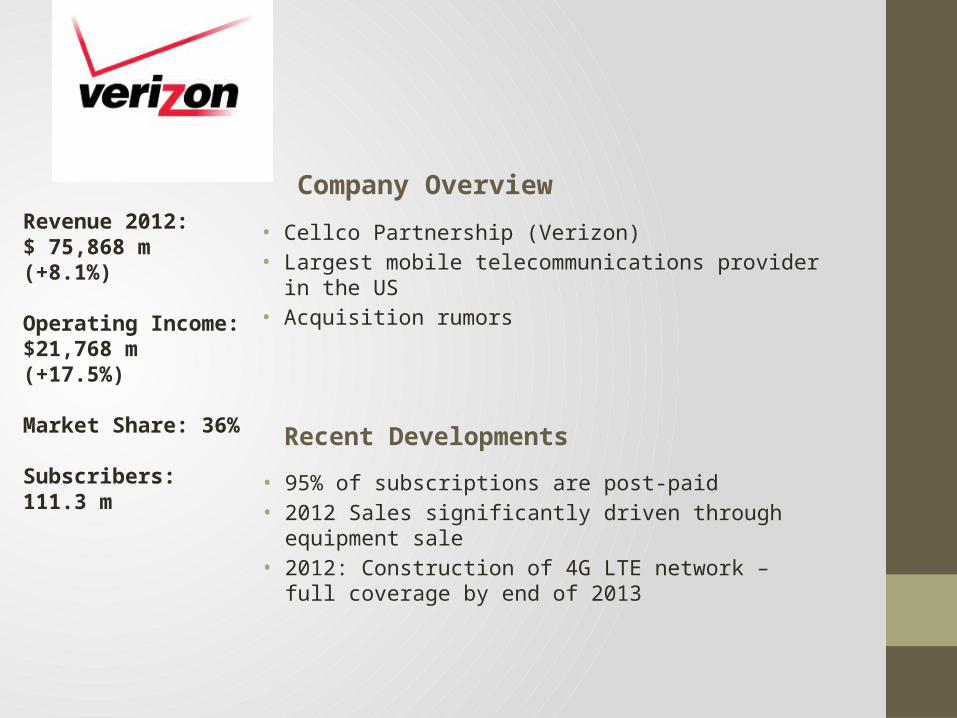
Revenue 2012: $ 75,868 m (+8.1%)
Operating Income: $21,768 m (+17.5%)
Market Share: 36%
Subscribers: 111.3 m
Company Overview
• Cellco Partnership (Verizon)• Largest mobile telecommunications provider in the US• Acquisition rumors
• 95% of subscriptions are post-paid• 2012 Sales significantly driven through equipment sale• 2012: Construction of 4G LTE network – full coverage by end
of 2013
Recent Developments
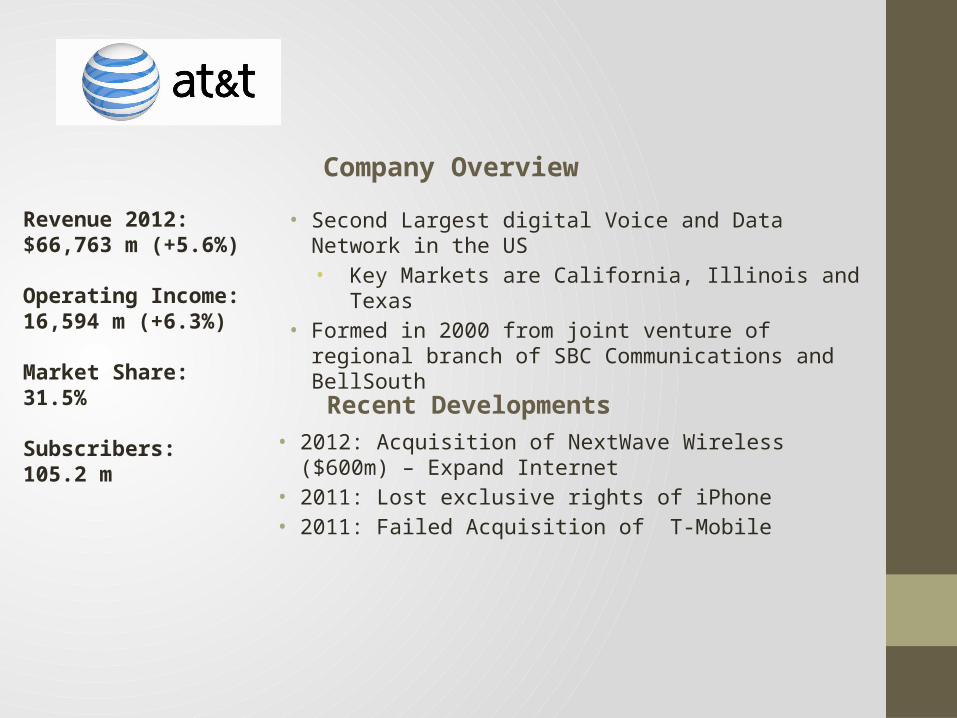
Company Overview
• Second Largest digital Voice and Data Network in the US• Key Markets are California, Illinois and Texas
• Formed in 2000 from joint venture of regional branch of SBC Communications and BellSouth
Revenue 2012:$66,763 m (+5.6%)
Operating Income: 16,594 m (+6.3%)
Market Share: 31.5%
Subscribers: 105.2 mRecent Developments
• 2012: Acquisition of NextWave Wireless ($600m) – Expand Internet
• 2011: Lost exclusive rights of iPhone• 2011: Failed Acquisition of T-Mobile
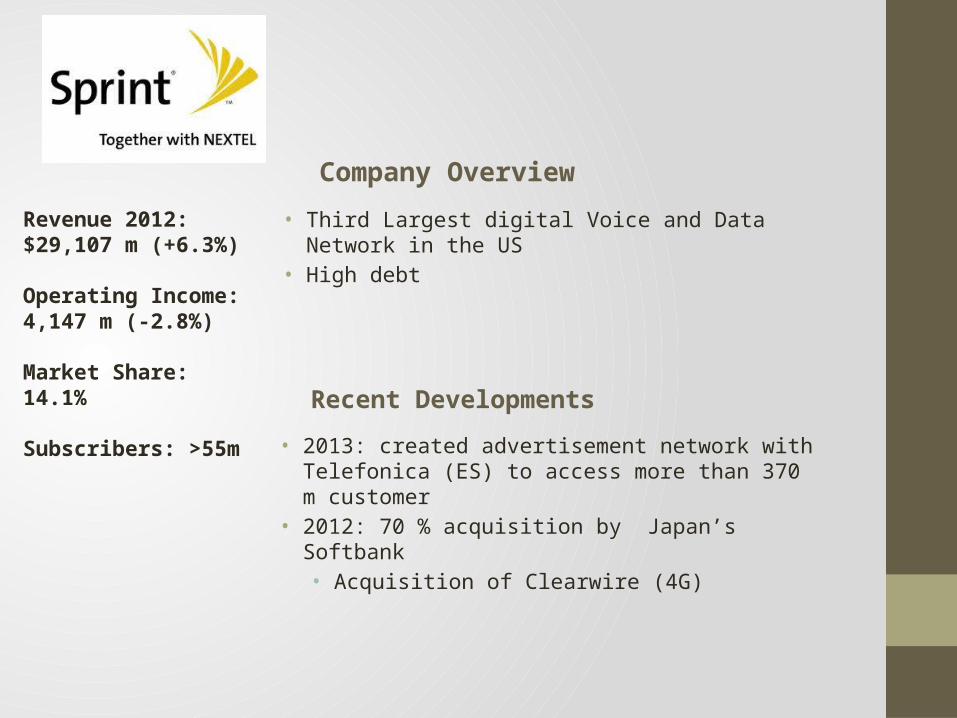
Company Overview
• Third Largest digital Voice and Data Network in the US• High debt
Revenue 2012:$29,107 m (+6.3%)
Operating Income: 4,147 m (-2.8%)
Market Share: 14.1%
Subscribers: >55m Recent Developments
• 2013: created advertisement network with Telefonica (ES) to access more than 370 m customer
• 2012: 70 % acquisition by Japan’s Softbank• Acquisition of Clearwire (4G)
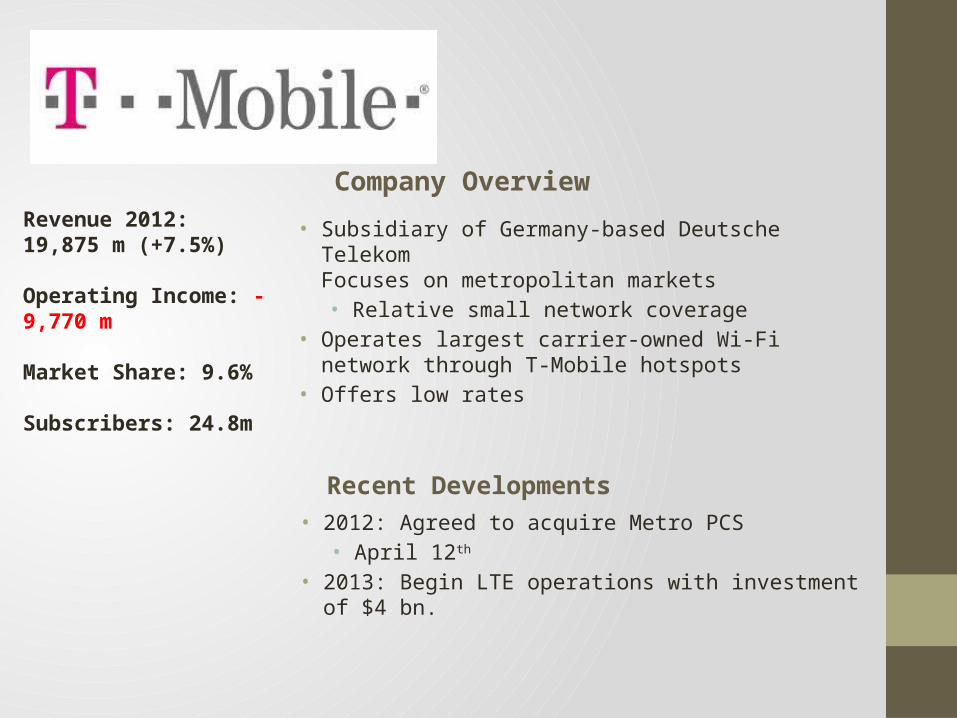
Company Overview
• Subsidiary of Germany-based Deutsche TelekomFocuses on metropolitan markets• Relative small network coverage
• Operates largest carrier-owned Wi-Fi network through T-Mobile hotspots
• Offers low rates
Revenue 2012:19,875 m (+7.5%)
Operating Income: -9,770 m
Market Share: 9.6%
Subscribers: 24.8m
Recent Developments• 2012: Agreed to acquire Metro PCS• April 12th
• 2013: Begin LTE operations with investment of $4 bn.

Pricing Strategies
Outline• Importance and
Pricing Goal• 2nd Degree Pricing• 3rd Degree Pricing• Verizon and AT&T• Sprint and T-Mobile• Advertising Wars • Survey Data Analysis
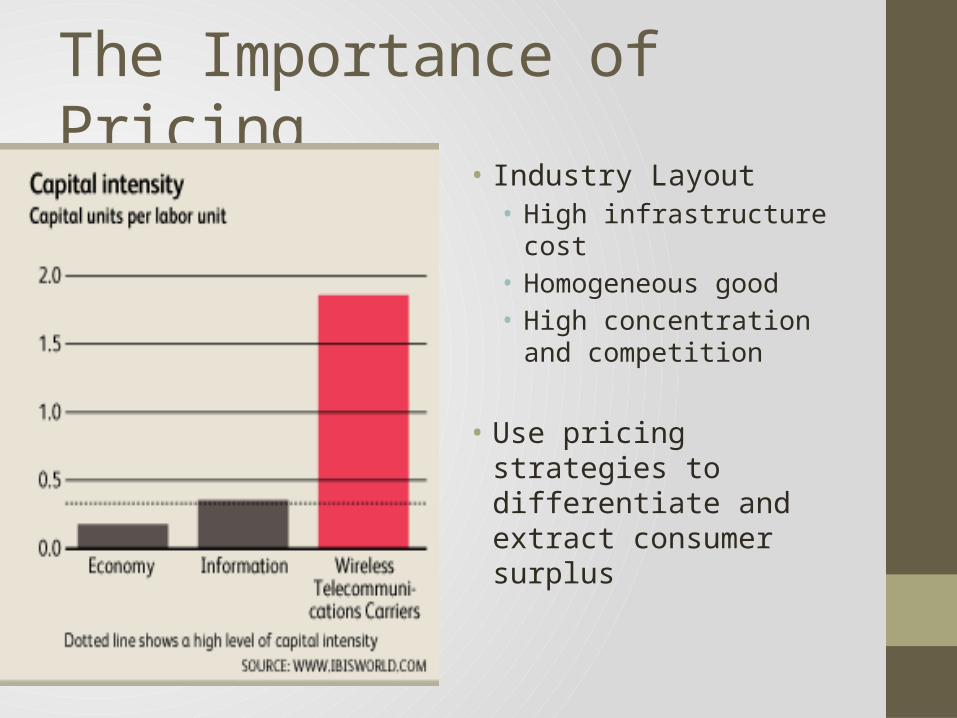
The Importance of Pricing
• Industry Layout • High infrastructure cost• Homogeneous good• High concentration and
competition
• Use pricing strategies to differentiate and extract consumer surplus
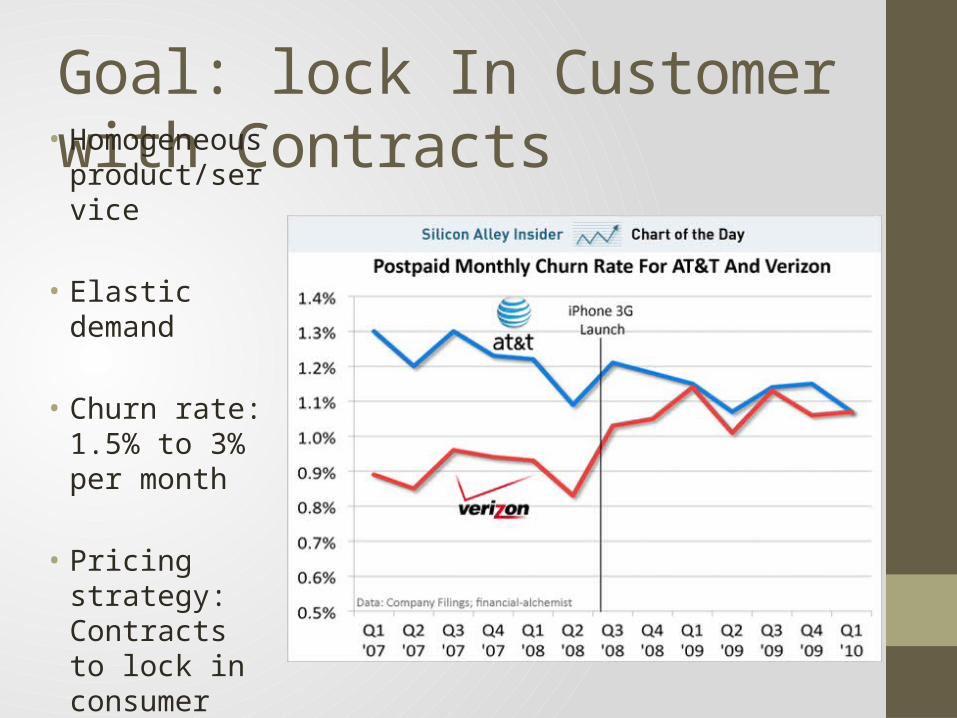
Goal: lock In Customer with Contracts• Homogeneous
product/service
• Elastic demand
• Churn rate: 1.5% to 3% per month
• Pricing strategy: Contracts to lock in consumer
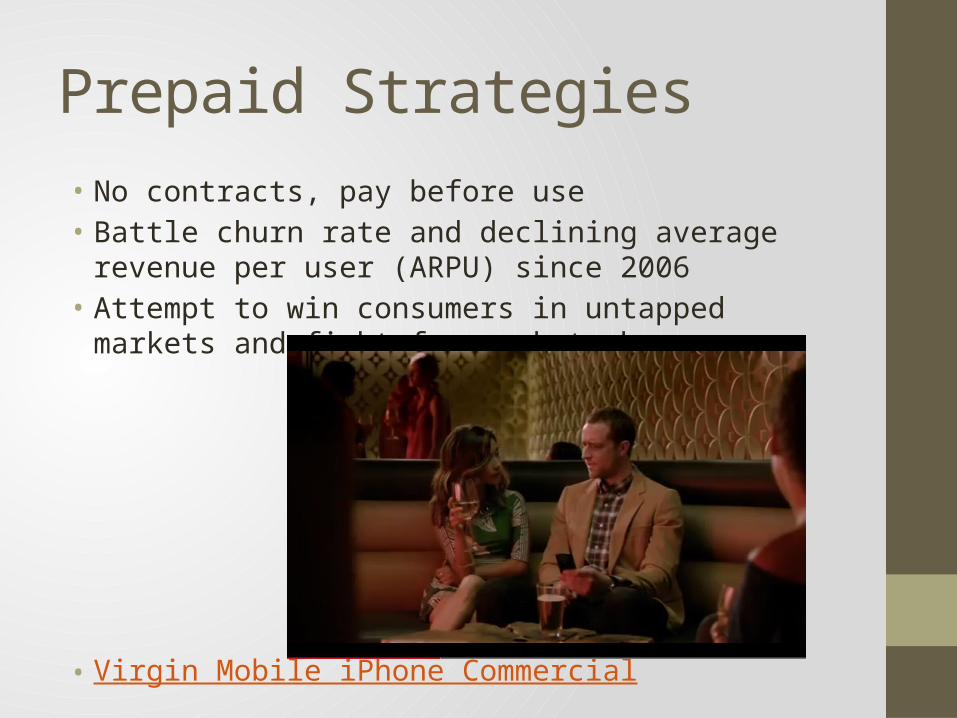
Prepaid Strategies • No contracts, pay before use • Battle churn rate and declining average revenue per user
(ARPU) since 2006• Attempt to win consumers in untapped markets and fight for
market share
• Virgin Mobile iPhone Commercial
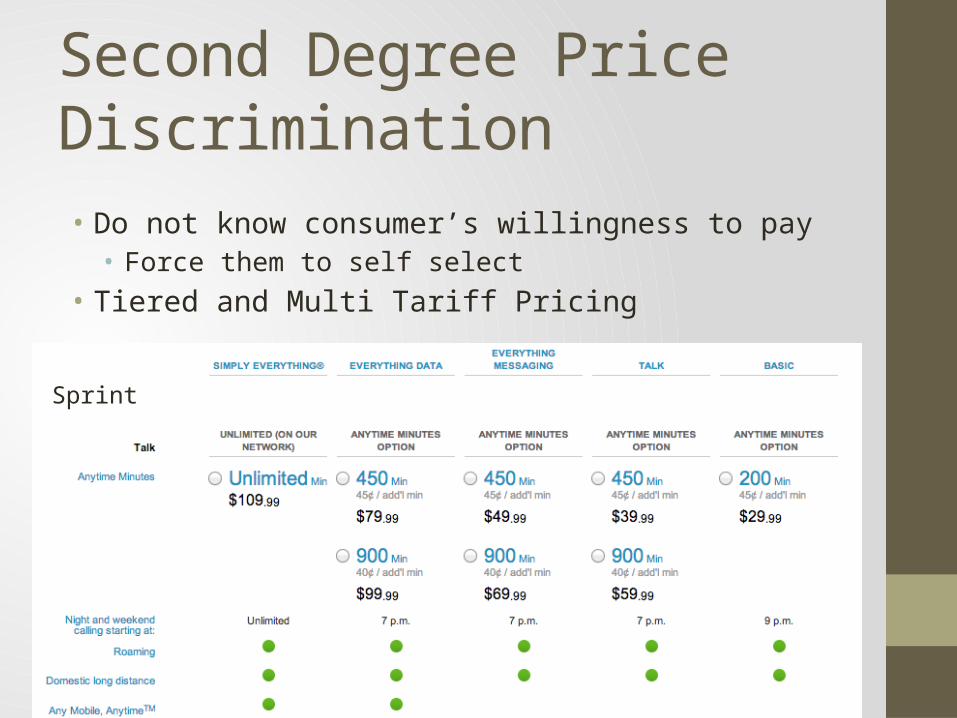
Second Degree Price Discrimination • Do not know consumer’s willingness to pay• Force them to self select
• Tiered and Multi Tariff Pricing
Sprint
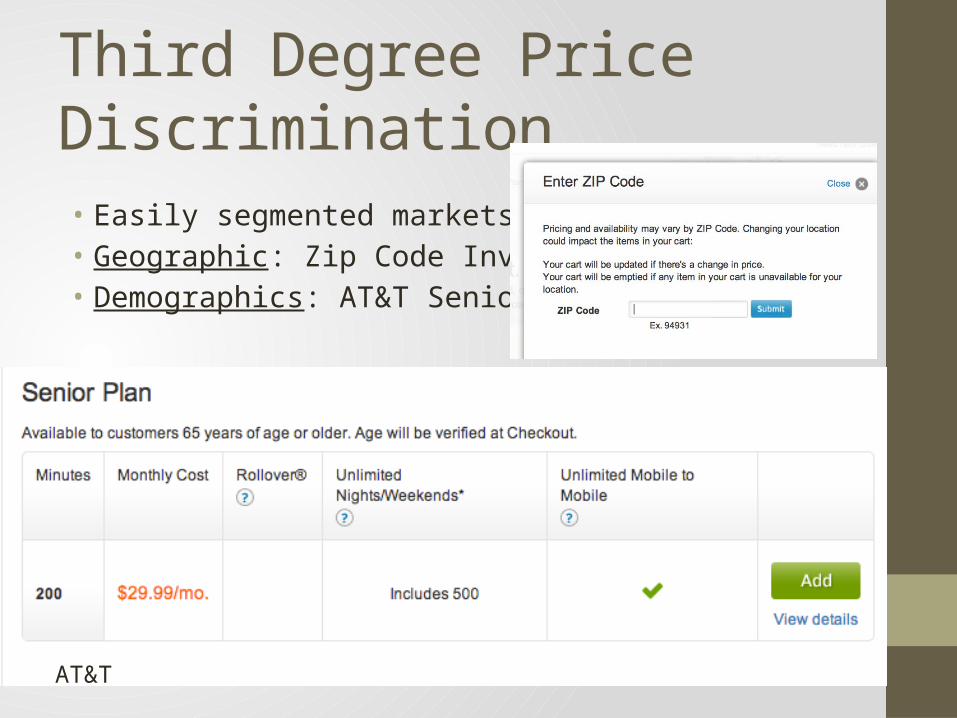
Third Degree Price Discrimination• Easily segmented markets • Geographic: Zip Code Investigation • Demographics: AT&T Senior Plan
AT&T
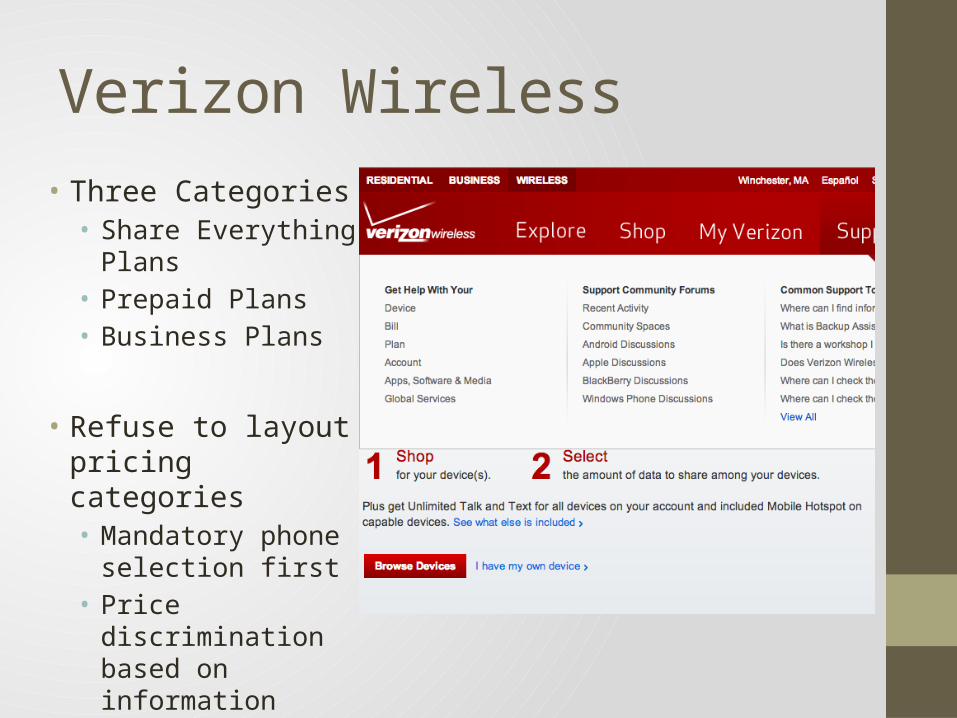
Verizon Wireless• Three Categories• Share Everything Plans• Prepaid Plans• Business Plans
• Refuse to layout pricing categories• Mandatory phone
selection first • Price discrimination
based on information
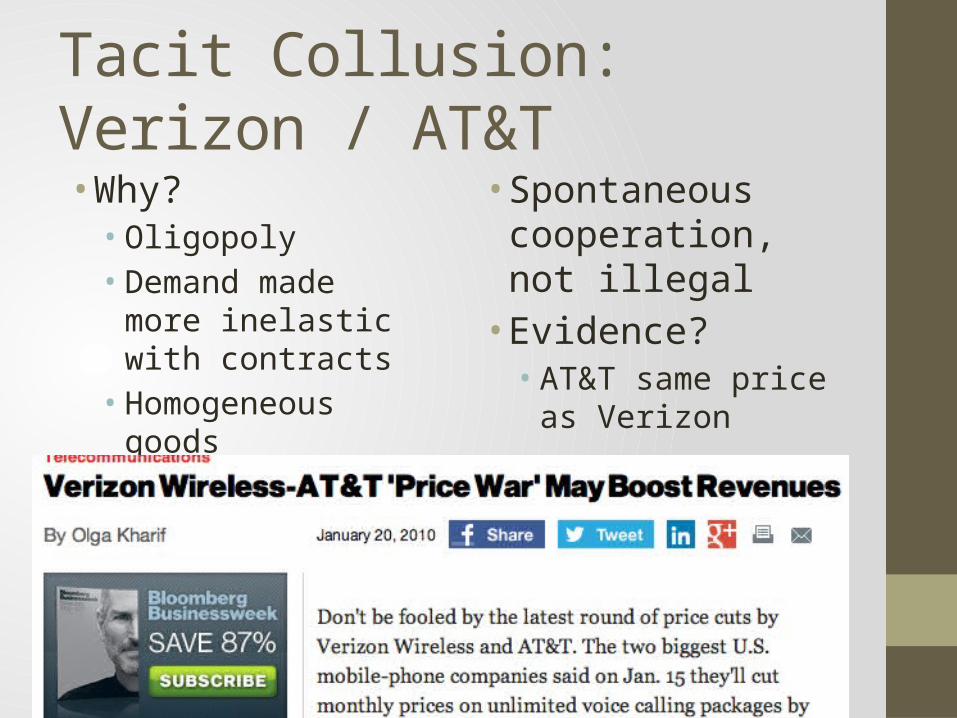
Tacit Collusion: Verizon / AT&T• Why? • Oligopoly• Demand made more
inelastic with contracts• Homogeneous goods
• Spontaneous cooperation, not illegal• Evidence?• AT&T same price as
Verizon
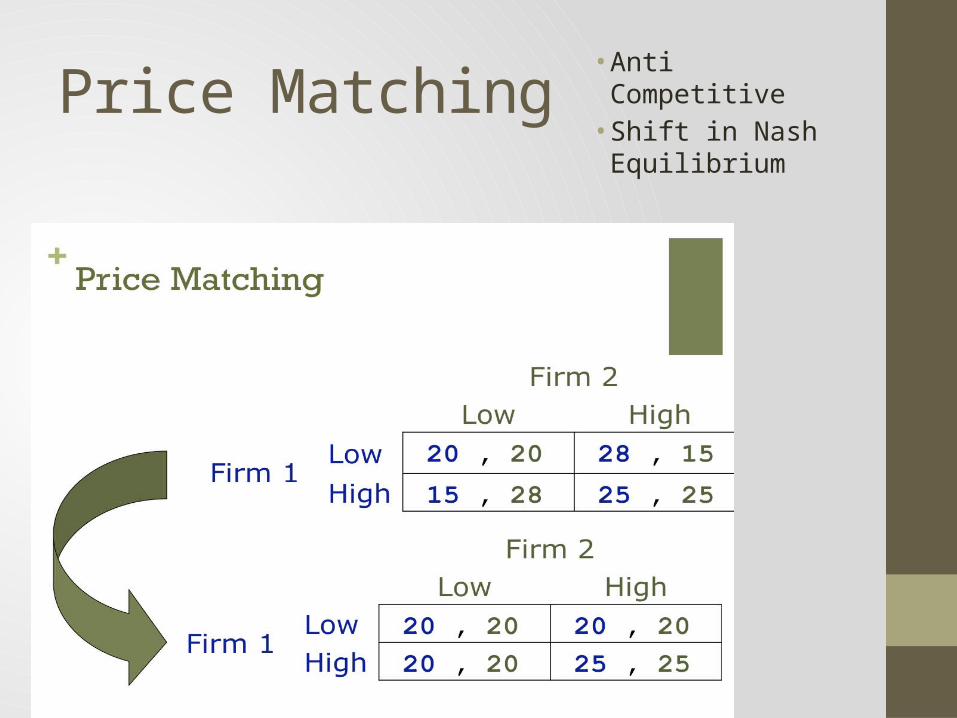
Price Matching • Anti Competitive• Shift in Nash
Equilibrium
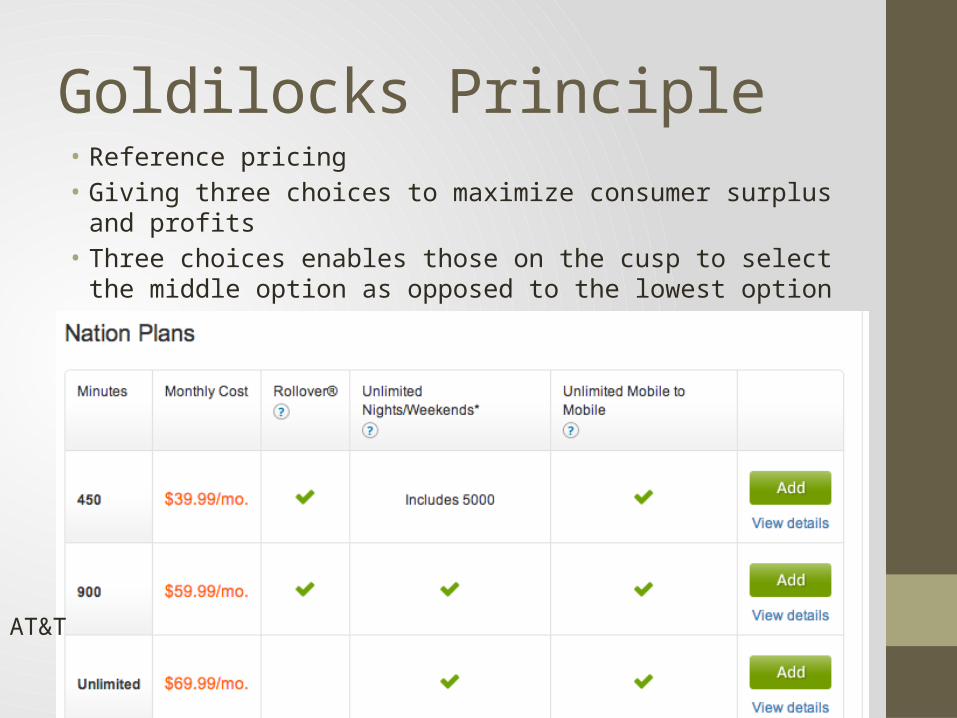
Goldilocks Principle • Reference pricing • Giving three choices to maximize consumer surplus and profits• Three choices enables those on the cusp to select the middle
option as opposed to the lowest option
AT&T
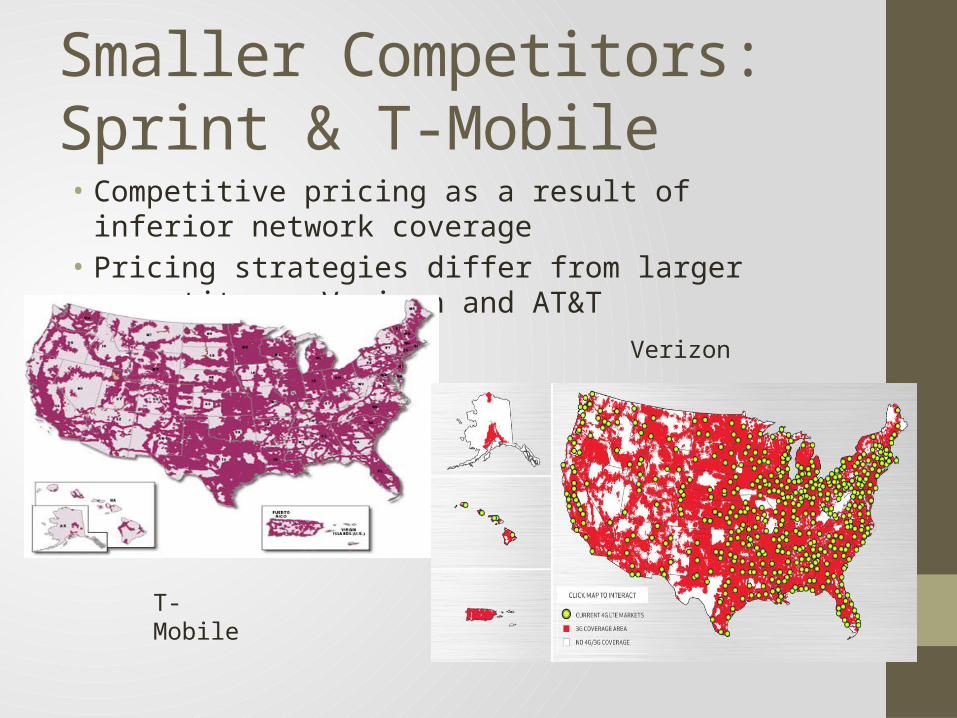
Smaller Competitors: Sprint & T-Mobile • Competitive pricing as a result of inferior network coverage• Pricing strategies differ from larger competitors: Verizon and
AT&T
T-Mobile
Verizon
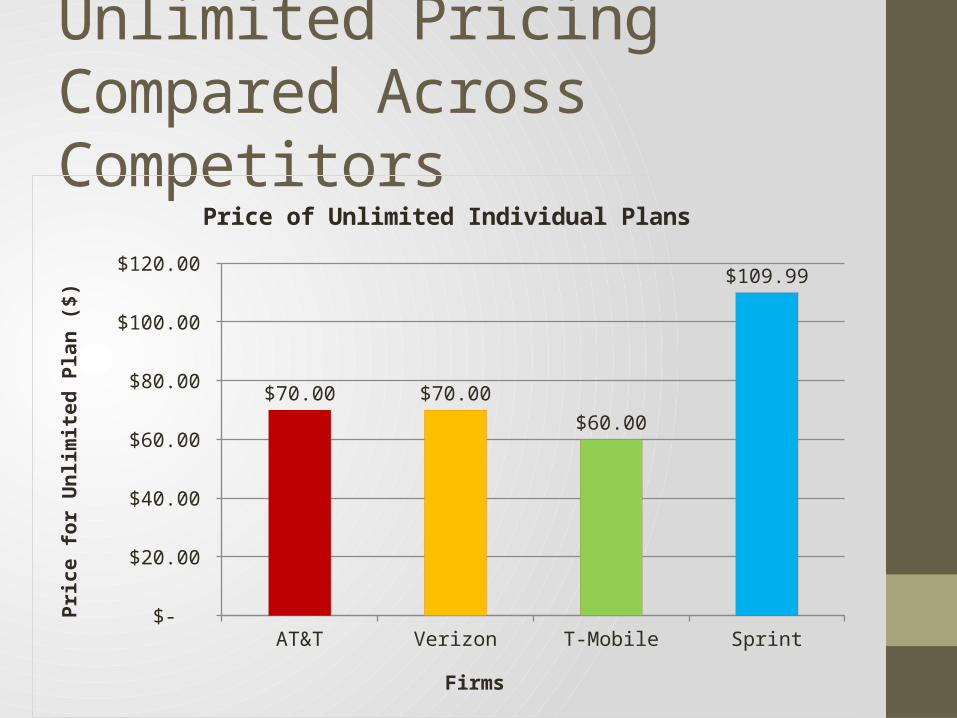
Unlimited Pricing Compared Across Competitors
AT&T Verizon T-Mobile Sprint $-
$20.00
$40.00
$60.00
$80.00
$100.00
$120.00
$70.00 $70.00
$60.00
$109.99
Price of Unlimited Individual Plans
Firms
Pric
e fo
r Unl
imite
d Pl
an ($
)
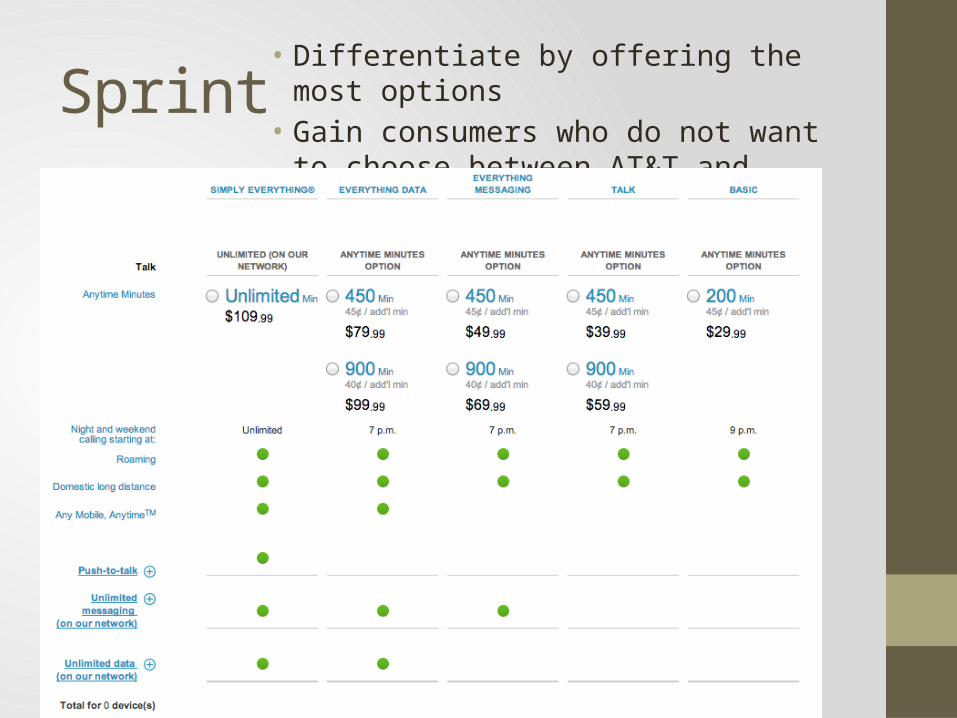
Sprint• Differentiate by offering the most options• Gain consumers who do not want to choose
between AT&T and Verizon’s three plans
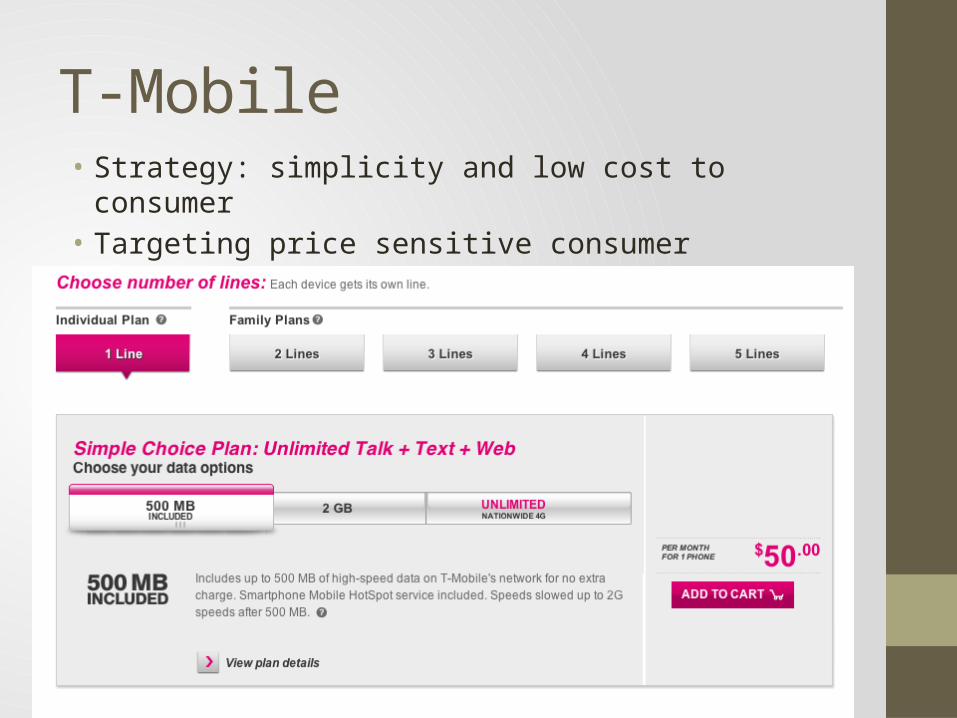
T-Mobile• Strategy: simplicity and low cost to consumer • Targeting price sensitive consumer
Advertising Wars
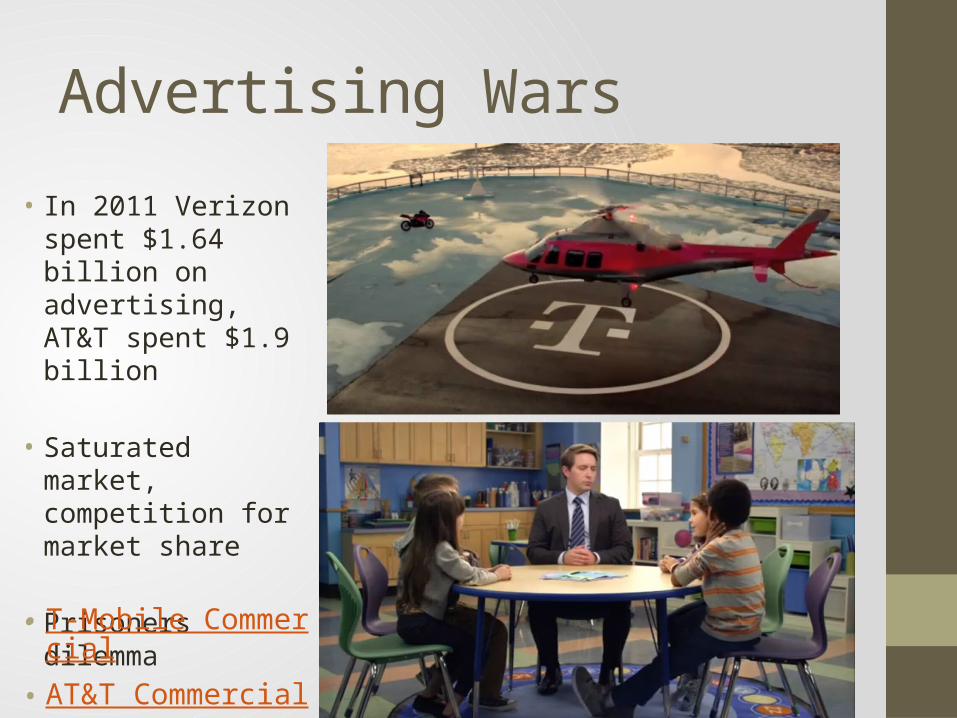
• In 2011 Verizon spent $1.64 billion on advertising, AT&T spent $1.9 billion
• Saturated market, competition for market share
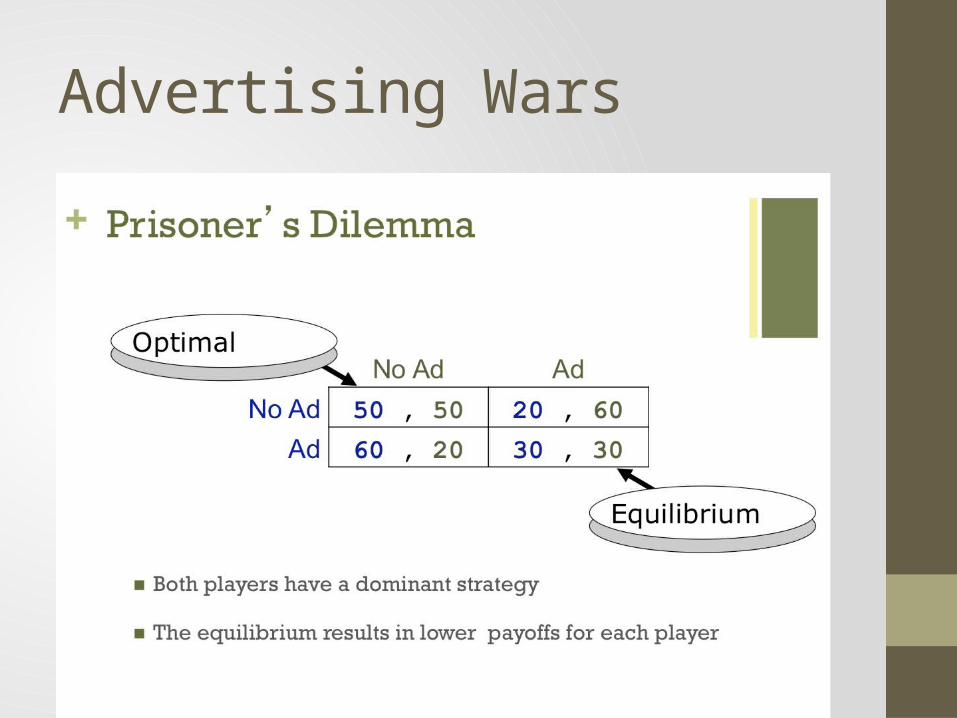
• Prisoners dilemma
• T-Mobile Commercial• AT&T Commercial
Advertising Wars

Cornell Survey
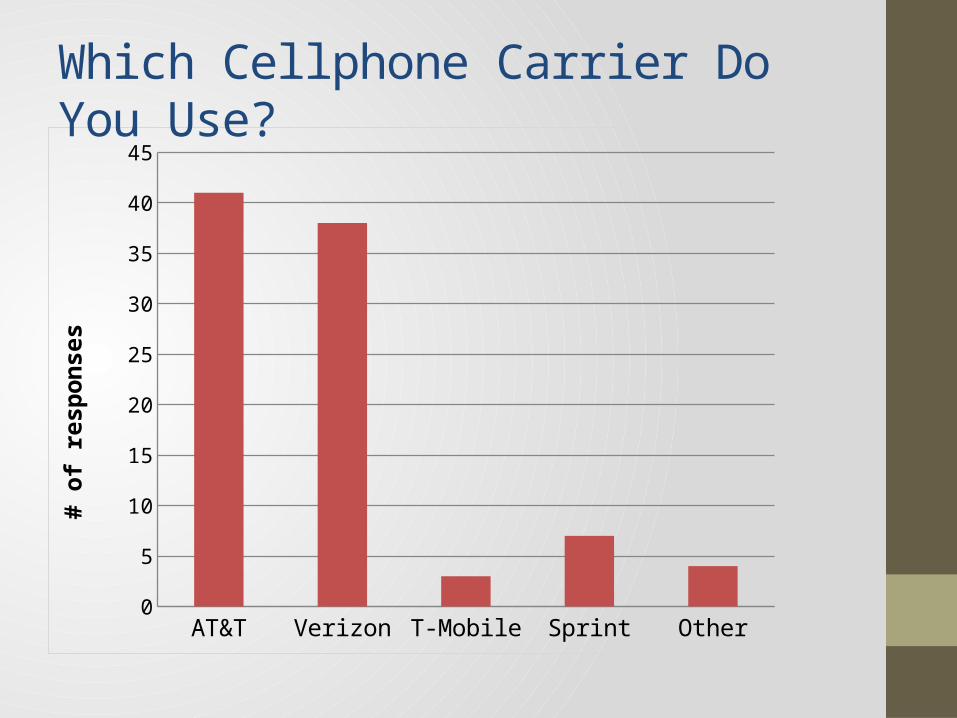
AT&T Verizon T-Mobile Sprint Other0
5
10
15
20
25
30
35
40
45
# of
resp
onse
sWhich Cellphone Carrier Do You Use?
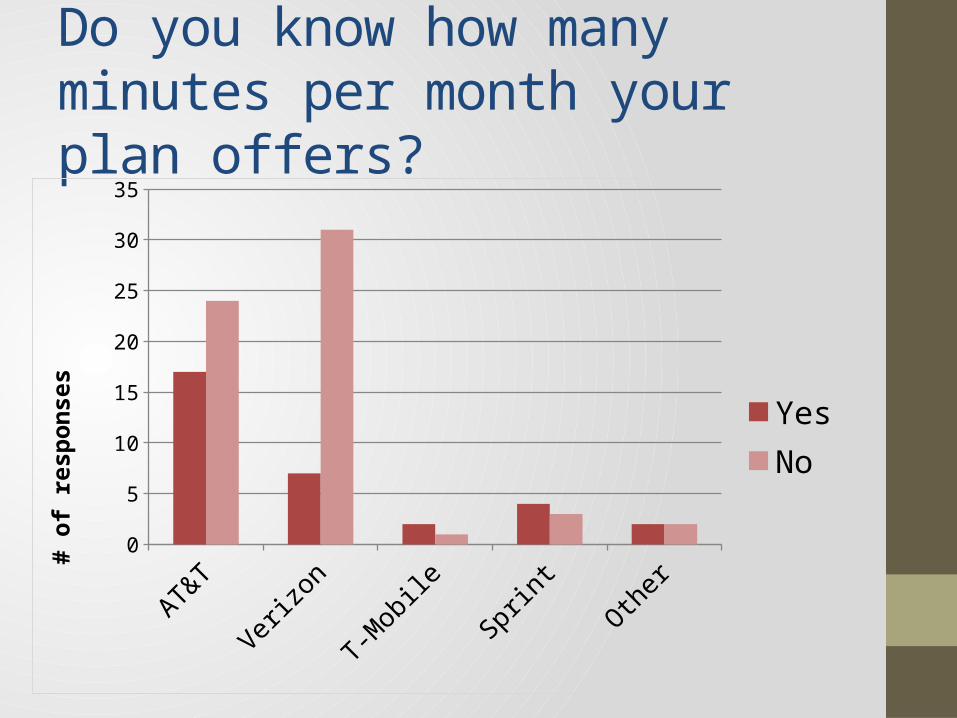
Do you know how many minutes per month your plan offers?
AT&T Verizon T-Mobile Sprint Other0
5
10
15
20
25
30
35
Yes No
# of
resp
onse
s
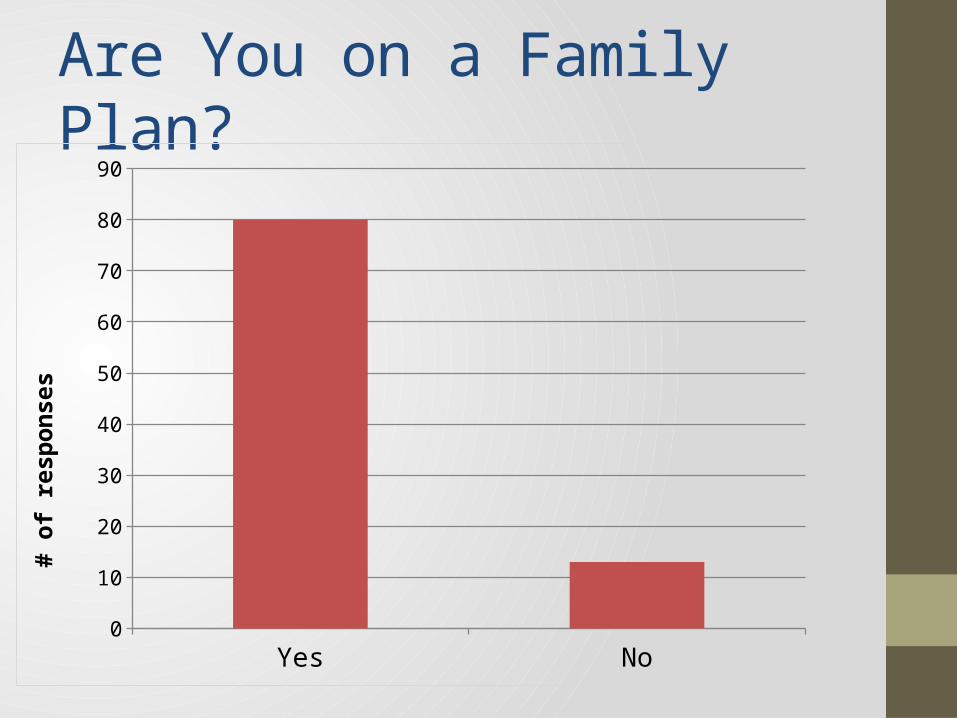
Are You on a Family Plan?
Yes No0
10
20
30
40
50
60
70
80
90
# of
resp
onse
s
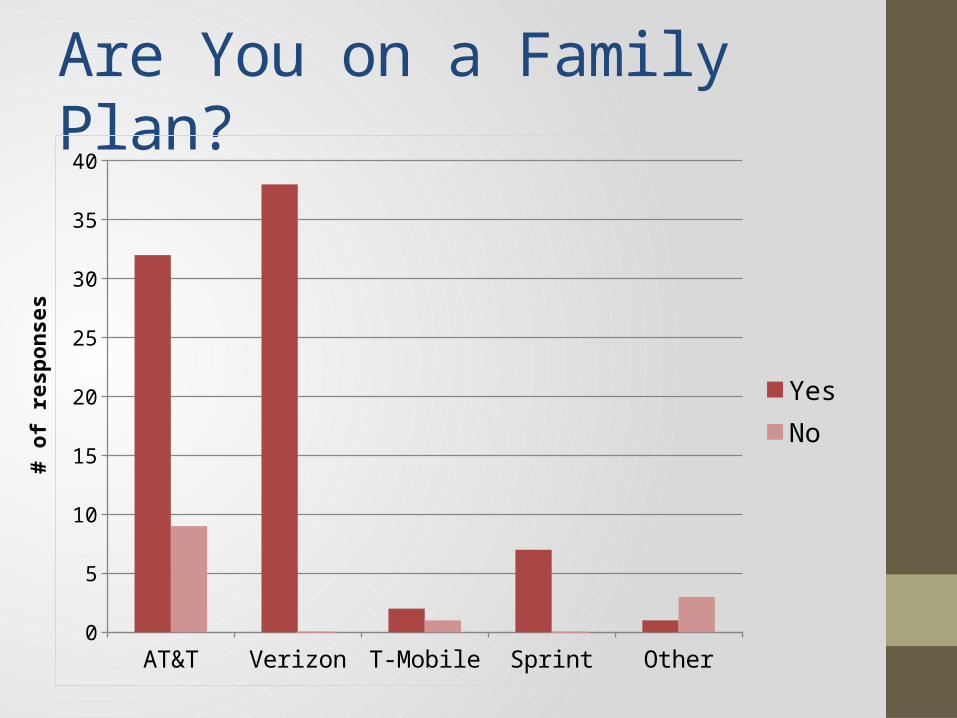
Are You on a Family Plan?
AT&T Verizon T-Mobile Sprint Other0
5
10
15
20
25
30
35
40
Yes No
# of
resp
onse
s
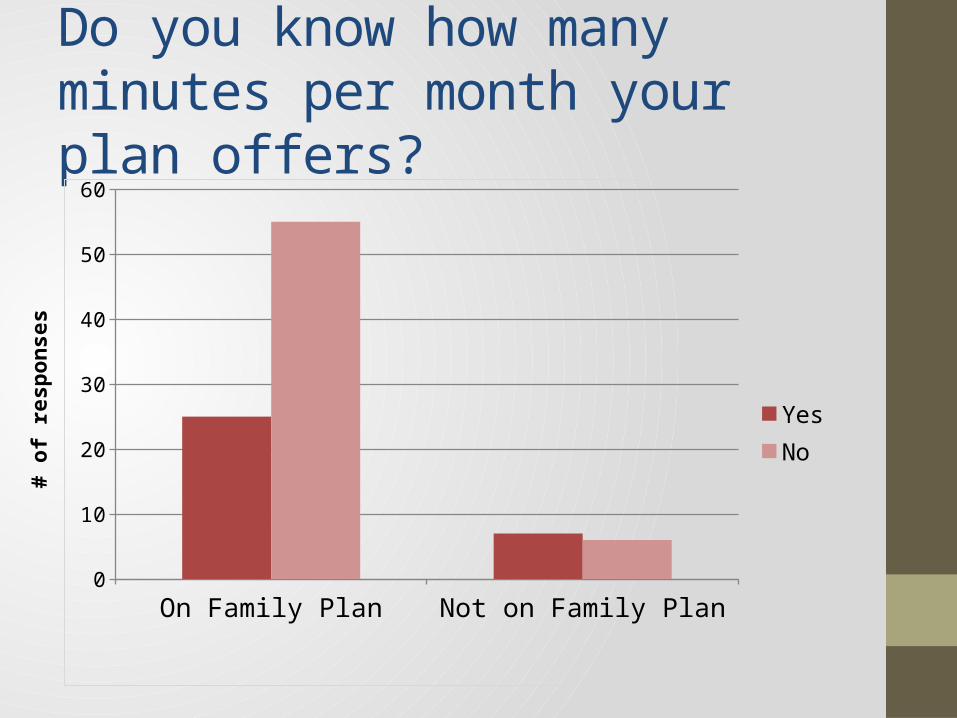
Do you know how many minutes per month your plan offers?
On Family Plan Not on Family Plan0
10
20
30
40
50
60
Yes No#
of re
spon
ses
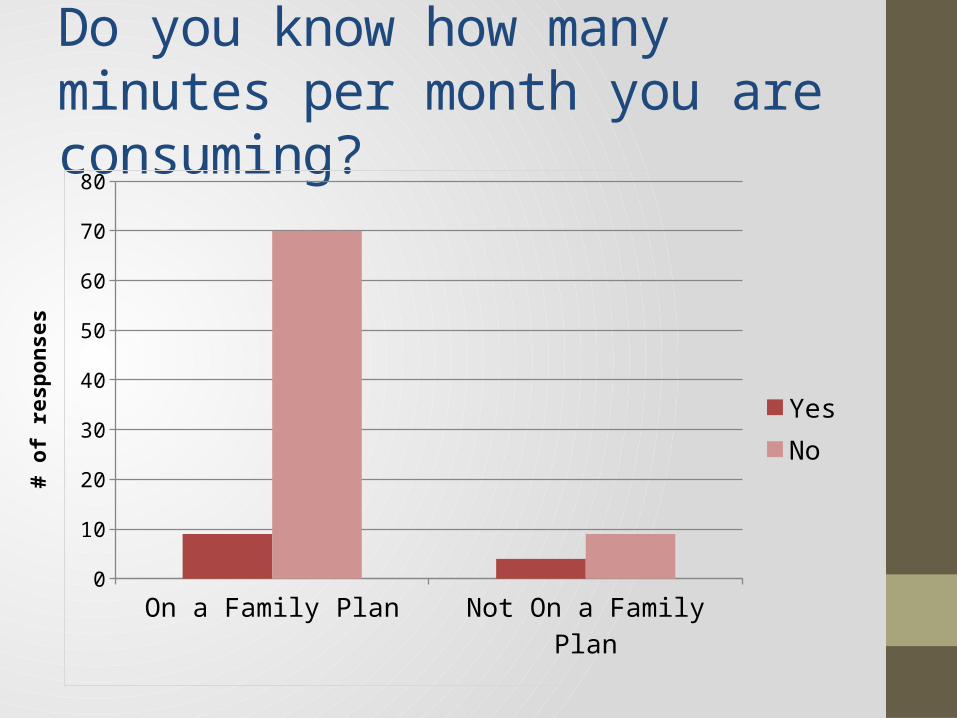
Do you know how many minutes per month you are consuming?
On a Family Plan Not On a Family Plan0
10
20
30
40
50
60
70
80
YesNo
# of
resp
onse
s
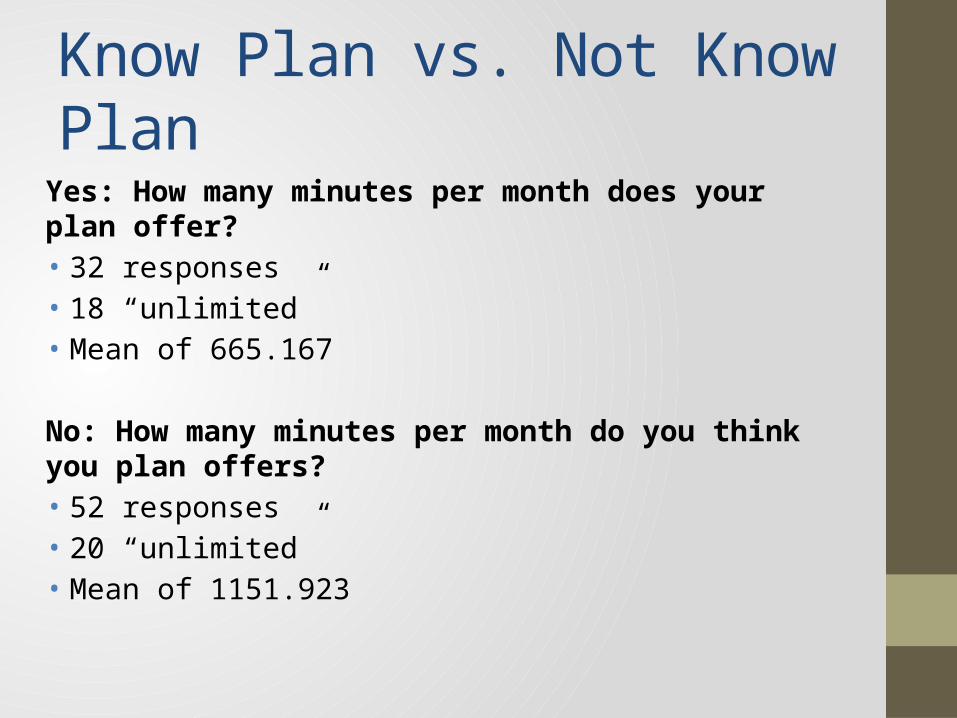
Know Plan vs. Not Know Plan
Yes: How many minutes per month does your plan offer?• 32 responses• 18 “unlimited”• Mean of 665.167
No: How many minutes per month do you think you plan offers?• 52 responses• 20 “unlimited”• Mean of 1151.923
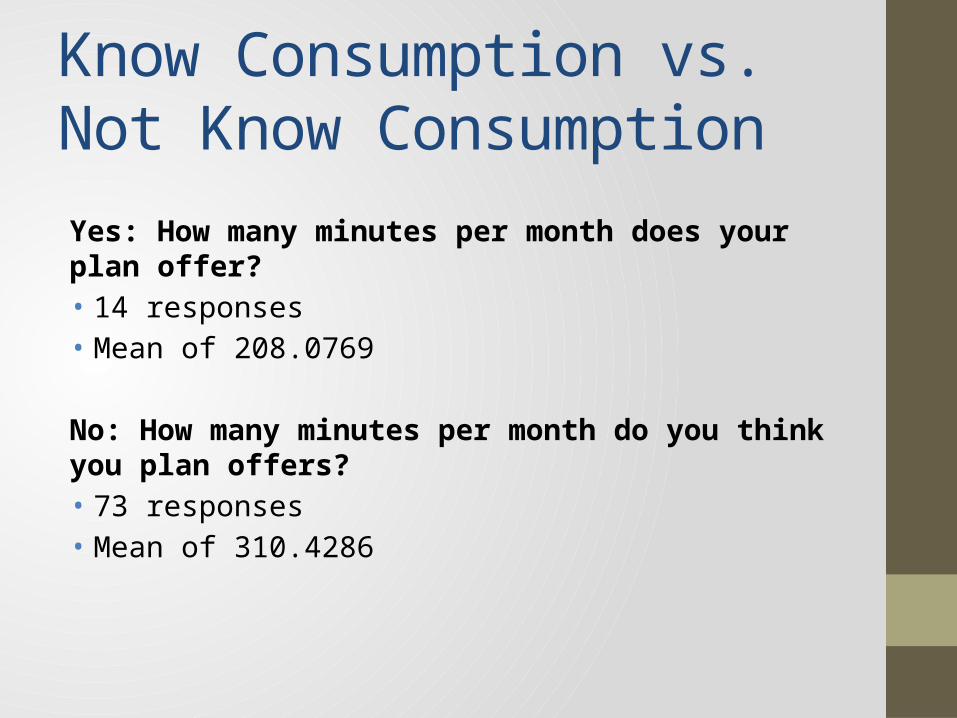
Know Consumption vs. Not Know Consumption
Yes: How many minutes per month does your plan offer?• 14 responses• Mean of 208.0769
No: How many minutes per month do you think you plan offers?• 73 responses• Mean of 310.4286

Recommendation
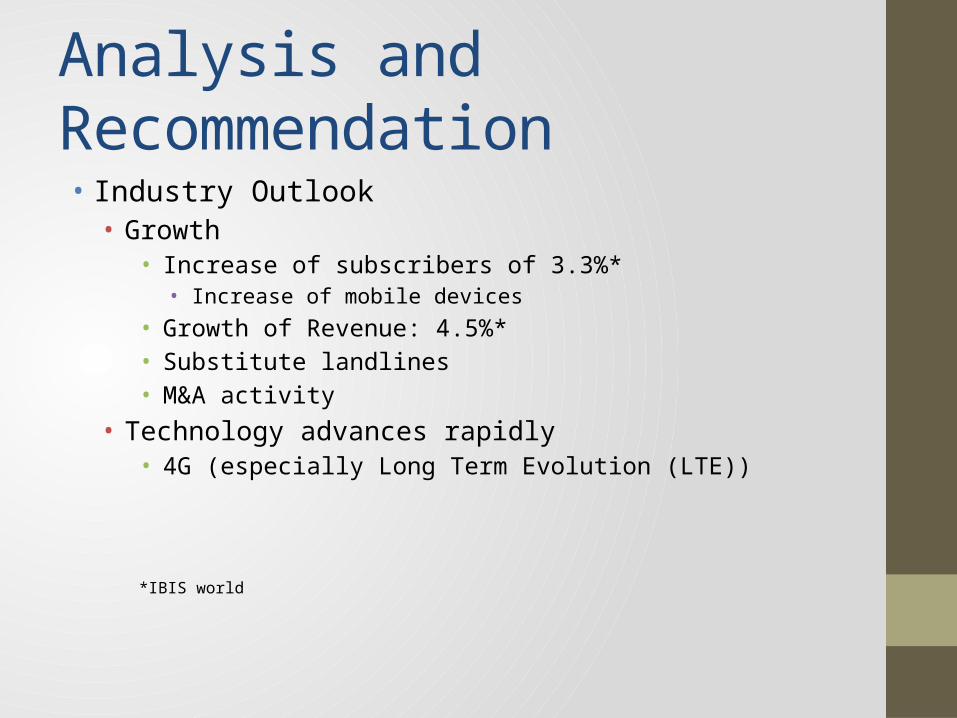
Analysis and Recommendation• Industry Outlook• Growth
• Increase of subscribers of 3.3%*• Increase of mobile devices
• Growth of Revenue: 4.5%*• Substitute landlines• M&A activity
• Technology advances rapidly• 4G (especially Long Term Evolution (LTE))
*IBIS world
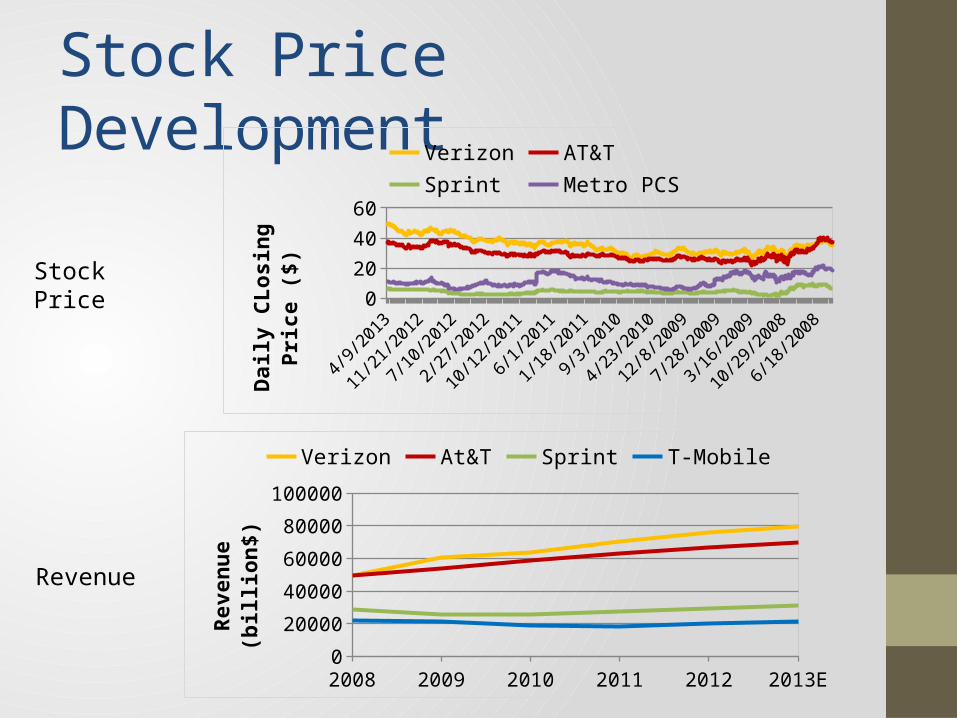
Stock Price Development
2008 2009 2010 2011 2012 2013E0
20000
40000
60000
80000
100000Verizon At&T Sprint T-Mobile
Reve
nue
(bill
ion$
)
Stock Price
Revenue
4/10/2
008
7/17/2
008
10/23/2
008
1/29/2
009
5/7/2
009
8/13/2
009
11/19/2
009
2/25/2
010
6/3/2
010
9/9/2
010
12/16/2
010
3/24/2
011
6/30/2
011
10/6/2
011
1/12/2
012
4/19/2
012
7/26/2
012
11/1/2
012
2/7/2
0130
20
40
60Verizon AT&T Sprint Metro PCS
Daily
CLo
sing
Pric
e ($
)
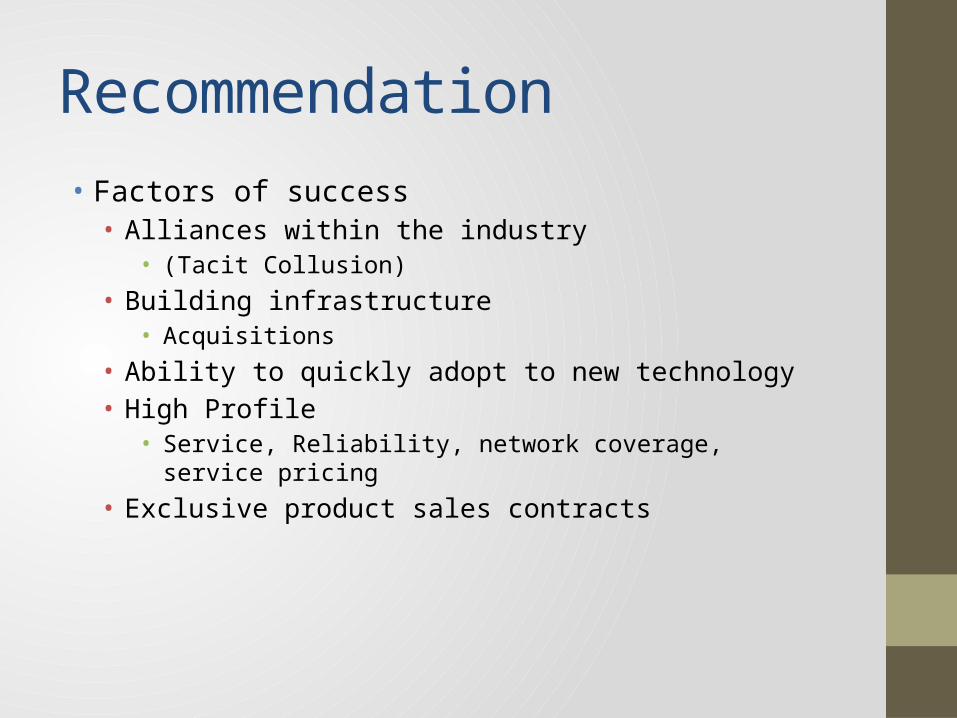
Recommendation• Factors of success• Alliances within the industry
• (Tacit Collusion)• Building infrastructure
• Acquisitions• Ability to quickly adopt to new technology• High Profile
• Service, Reliability, network coverage, service pricing• Exclusive product sales contracts
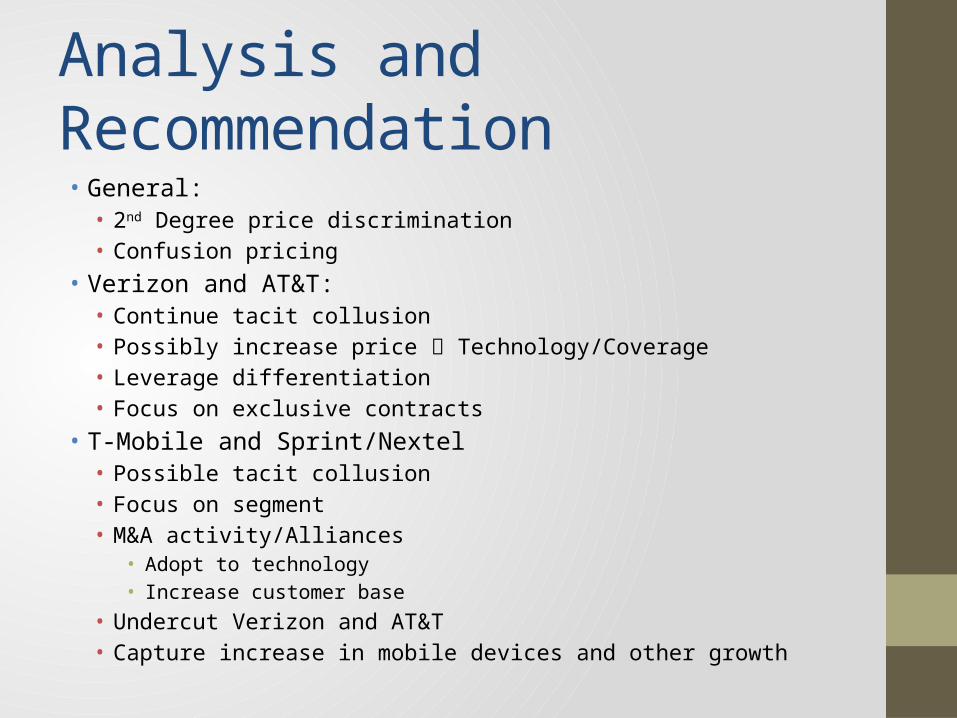
Analysis and Recommendation• General:• 2nd Degree price discrimination• Confusion pricing
• Verizon and AT&T: • Continue tacit collusion• Possibly increase price Technology/Coverage• Leverage differentiation• Focus on exclusive contracts
• T-Mobile and Sprint/Nextel• Possible tacit collusion• Focus on segment• M&A activity/Alliances
• Adopt to technology• Increase customer base
• Undercut Verizon and AT&T• Capture increase in mobile devices and other growth

The End