Wirecard AG Investor...
28
6 Months Results 2011 Wirecard AG – Investor Presentation
Transcript of Wirecard AG Investor...

6 Months Results 2011
Wirecard AG – Investor Presentation

© 2011 Wirecard AG 2
Agenda
1
2
3 Financial Data
© 2011 Wirecard AG 3
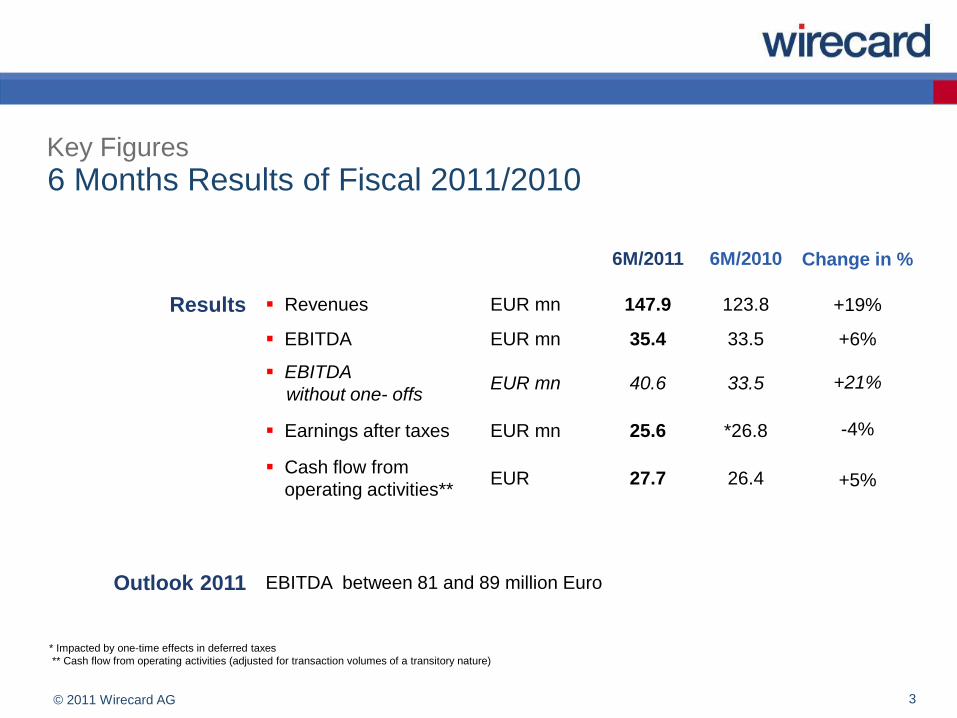
6 Months Results of Fiscal 2011/2010Key Figures
6M/2011 6M/2010
Results Revenues EUR mn 147.9 123.8
EBITDA EUR mn 35.4 33.5
EBITDA
without one- offsEUR mn 40.6 33.5
Earnings after taxes EUR mn 25.6 *26.8
Cash flow from
operating activities**EUR 27.7 26.4
Outlook 2011 EBITDA between 81 and 89 million Euro
Change in %
+19%
+6%
+21%
-4%
+5%
* Impacted by one-time effects in deferred taxes
** Cash flow from operating activities (adjusted for transaction volumes of a transitory nature)

© 2011 Wirecard AG 4
Key Figures
The Company
> 12,000 corporate customers from various industries
< 500 employees
120 transaction currencies
85 payment and risk management solutions
7.1 billion euros in transaction volume as at June 30, 2011
© 2011 Wirecard AG 5
Highlights 1st Half of Fiscal Year 2011
The Company
Unchanged positive development on new customer gains, such as Berner Group, QVC Italy,
airberlin, MEDION
Sustainable cross- and up-selling of products and services into existing customer base
New features/enhancement of product lines services, e.g. launch of adjusted mywirecard.com-
platform, white-label solution for co-branded cards
Acquisiton of Procard (Dubai) as a new hub in the Middle East region
Key Asian alliances with China UnionPay and Alipay – new Asian customer relationships based on
China UnionPay online payment service

© 2011 Wirecard AG 6
Products and Services
Company
Credit Card Acquiring Wirecard Bank Principal Member of Visa, MasterCard,
licensed acquirer for China UnionPay, Discover/Diners and JCB
Funds Transfer SWIFT, SEPA, IZV/AZV and domestic direct debit via Wirecard Bank
Payment Processing Support of all major international payment methods
Risk Management Comprehensive protection for merchants
Bank Accounts Corporate and private bank accounts
Alternative payments e.g. Alipay, giropay, iDEAL, eps, paysafecard
Issuing Prepaid cards, virtual or physical, Co-branded and payout cards
Point-of-Sale (PoS) Support of all (!) sales channels, including stationary retail stores
Call Center Operation of own call center facility, 24/7 in 16 languages

© 2011 Wirecard AG 7
USPs
The Company
A particular unique selling point of the Wirecard Group is the centralization of payment transactions from
many different distribution and procurement channels on a single platform
Combination of software technology and bank products
International orientation – a single platform for all services
Centralization of payment transactions from many and different distribution and
procurement channels to a single platform
Online-oriented acquiring bank in the Group (e.g. in 15 payout currencies)
Continuing expansion of payment acceptance services (e.g. China UnionPay)
Innovative software-based banking products (SCP-virtual credit cards, payout cards, co-branded cards)
© 2011 Wirecard AG 8
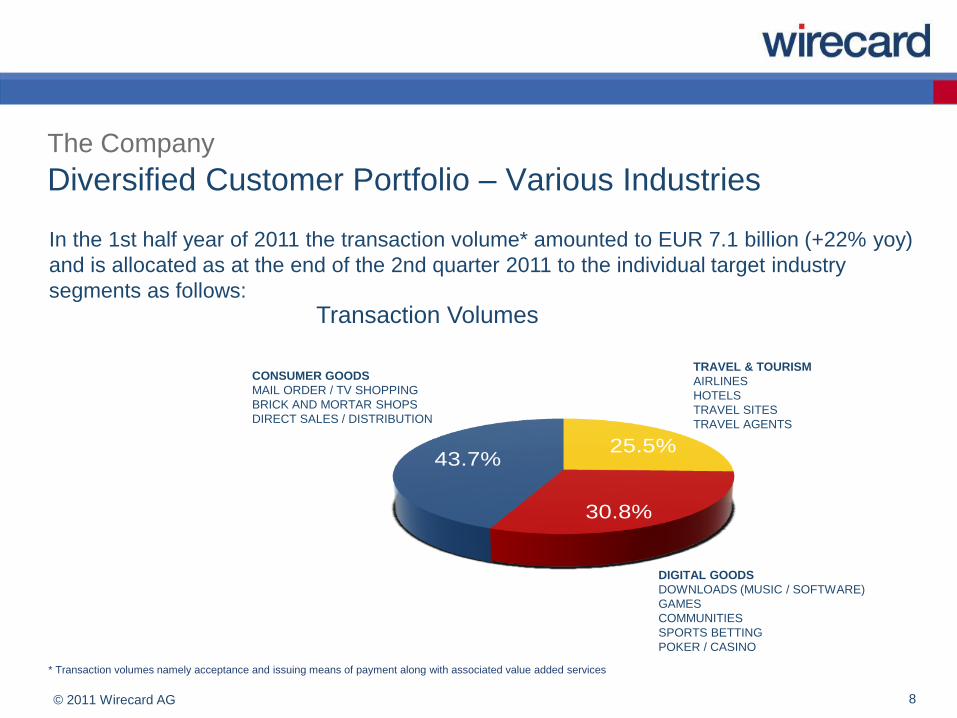
Diversified Customer Portfolio – Various Industries
The Company
* Transaction volumes namely acceptance and issuing means of payment along with associated value added services
In the 1st half year of 2011 the transaction volume* amounted to EUR 7.1 billion (+22% yoy)
and is allocated as at the end of the 2nd quarter 2011 to the individual target industry
segments as follows:
25.5%
30.8%
43.7%
Transaction Volumes
CONSUMER GOODS
MAIL ORDER / TV SHOPPING
BRICK AND MORTAR SHOPS
DIRECT SALES / DISTRIBUTION
TRAVEL & TOURISM
AIRLINES
HOTELS
TRAVEL SITES
TRAVEL AGENTS
DIGITAL GOODS
DOWNLOADS (MUSIC / SOFTWARE)
GAMES
COMMUNITIES
SPORTS BETTING
POKER / CASINO

© 2011 Wirecard AG 9
80
90
100
110
120
130Wirecard AG, indexed
TecDAX, indexed
Q2
January MarchFebruary JulyJuneMayApril
%
2011:
Stock Performance YTD 2011
Wirecard Stock
ISIN DE0007472060
WKN 747206
Ticker Symbol WDI
Market Segment Prime Standard
Index TecDAX
Number of Shares 101,803,139
Year High 2011 EUR 13.28
Year Low 2011 EUR 9.43
Closing Price (Xetra)
June 30th, 2011EUR 12.33
Market Cap. EUR bn 1.26

© 2011 Wirecard AG 10
Shareholder Structure | August 18, 2011
Wirecard Stock
*92.40%F r e e f l o a t
MB Beteiligungsgesellschaft mbH
7.6 % (DE)
*Jupiter Asset Management Limited
6.26 % (UK)
*Alken Fund SICAV
5 % (LU)
*Wasatch Holdings Inc.
3.1 % (US)
*Columbia Wanger AM LLC
3.08 % (US)
*Henderson Group Plc
3.04 % (UK)
*Ameriprise Financial, Inc.
3.04 % (US)
* F r e e f l o a t i n a c c o r d a n c e w i t h D e u t s c h e B o e r s e r e g u l a t i o n s

© 2011 Wirecard AG 11
Agenda
1 Results, Company and Stock
2 Growth Drivers, Trends and Outlook 2011
3 Financial Data

© 2011 Wirecard AG 12
The Internet has established itself as a key distribution channel
Growth drivers
In 2011 Europe’s eCommerce market will continue to record a 13% growth (based on the outlook for the
individual target sectors)
Consumer goods: two-digit growth yoy by ~10% 2010 to 2015 (EU-17 states) (Forrester 2011)
Online retail in Germany to grow by 15.5% in 2011 (bvh 2011)
In 2011 a 9%-growth rate predicted for the European Online Travel market ( PhoCusWright 2010)
Streaming media business: world annual growth rate of 27% expected by 2014(Insight Research Corp. 2010)

© 2011 Wirecard AG 13
Challenges for online merchants
Growth drivers
To benefit from significant savings potential by outsourcing their payment processing services
Continual new challenges with regards to payment systems and risk management solutions to combat
fraud and minimize payment default, especially in cross border retail
The ratio between the POS and online business is shifting in favor of the Internet. Merchants are
responding to this trend by employing so-called multi-channel retailing services
New, alternative payment solutions gain ground, such as bank-based solutions e.g. giropay, iDEAL or
eps; soon the SEPA direct debit payments. At the same time the Maestro (MasterCard) debit card,
based almost entirely on chip and PIN technologies, can increasingly be used for online commerce

© 2011 Wirecard AG 14
Key operative measures
Wirecard Strategy
To continue
strategy
Extension of new customer relationships / Cross- / Up-Selling
potential within existing customer portfolio
Evolutionary expansion of customer relationships by providing new
payment- and risk management solutions
To continually add international payment acceptances (e.g. China
UnionPay), additional banking services (e.g. SEPA direct debit, currency
management)
Innovative bank based prepaid card products (SCP, Co-Branded Cards)
New potentials Based on additional partnerships in Europe and Asia
Expansion of Asian business
Wirecard AG as European partner for merchants with global reach
Extension of prepaid card business within Europe

© 2011 Wirecard AG 15
Asia – Future growth market
Wirecard Strategy
New hubs in Singapore and Dubai
Expansion of banking network and partner network
Wirecard AG as European partner for internationally oriented Asian merchants
New partnerships in China
China UnionPay:
China‘s credit card brand is UNIONPAY:
2.38 billion cards issued within Asia Pacific Area;
nearly 50% market share in APAC
Alipay – a subsidiary of the Chinese Alibaba Group:
China‘s leading internet payment system;
550 million users registered;
daily transaction volume at around USD 298 million
© 2011 Wirecard AG 16
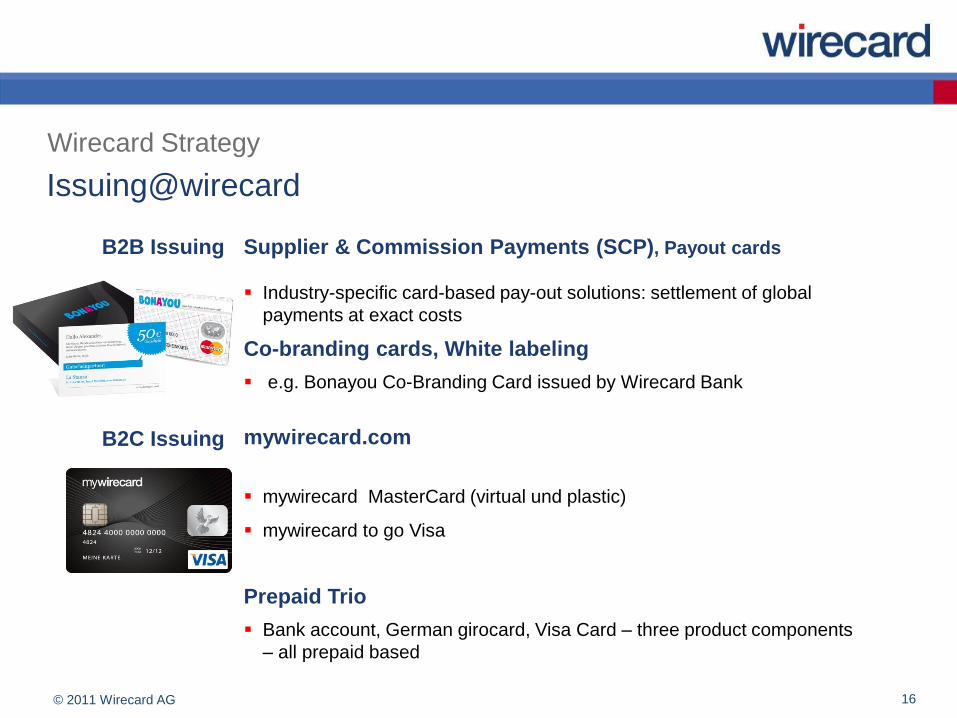
Issuing@wirecard
Wirecard Strategy
B2B Issuing Supplier & Commission Payments (SCP), Payout cards
Industry-specific card-based pay-out solutions: settlement of global
payments at exact costs
Co-branding cards, White labeling
e.g. Bonayou Co-Branding Card issued by Wirecard Bank
B2C Issuing mywirecard.com
mywirecard MasterCard (virtual und plastic)
mywirecard to go Visa
Prepaid Trio
Bank account, German girocard, Visa Card – three product components
– all prepaid based

© 2011 Wirecard AG 17
Guidance
Outlook
Fiscal 2011: EBITDA between 81 and 89 million Euro
1st half of 2011: 5.2 mn euros one-off extraordinary expenses
included in EBITDA outlook
one-offs have been taken care of conclusively
2nd half of 2011:
Additional positive impact to be expected from Chinese partnerships and the Germany-wide
spread of the mywirecard 2go Visa prepaid card at the point of sale
European E-Commerce market to remain strong
© 2011 Wirecard AG 18
Agenda
1 Results, Company and Stock
2 Growth Drivers, Trends and Outlook 2011
3 Financial Data

© 2011 Wirecard AG 19
Key Figures 6 Months 2010/2011
Financial Data
in TEUR 6M/2011 6M/2010
Revenues 147,872 123,845
EBITDA 35,350 33,546
EBIT 31,810 30,866
Taxes 6,170 *3,769
Profit after Taxes 25,607 *26,776
EPS** 0.25 *0.26
Operating Cash flow*** 27,722 26,408
Shareholders’ Equity 305,215 262,720
Total Equity and Liabilities 601,547 517,364
Employees – annual average 487 509
thereof full-time employees 357 376
thereof part-time employees 130 133
* Impacted by one-time effects in deferred taxes
** Earnings per share – in EUR (diluted)
*** Cash flow from operating activities (adjusted for transaction volumes of a transitory nature)

© 2011 Wirecard AG 20
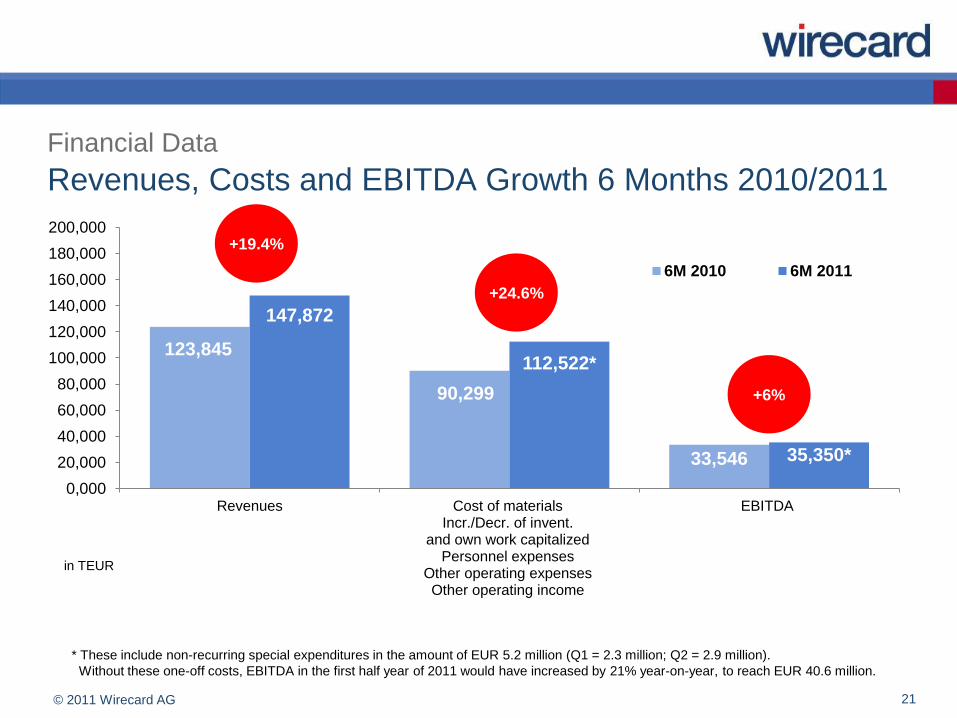
Revenues, Costs and EBITDA Growth 6 Months 2010/2011
Financial Data
* Figures without non-recurring special expenditures in the amount of EUR 5.2 million.
Without these one-off costs, EBITDA in the first half year of 2011 would have increased by 21% year-on-year, to reach EUR 40.6 million.
in TEUR
+19.4%
+18.9%
+20.9%
without one-off extraordinary expenses
123,845
90,299
33,546
147,872
107,322*
40,550*
0,000
20,000
40,000
60,000
80,000
100,000
120,000
140,000
160,000
180,000
200,000
Revenues Cost of materialsIncr./Decr. of invent.
and own work capitalizedPersonnel expenses
Other operating expensesOther operating income
EBITDA
6M 2010 6M 2011
© 2011 Wirecard AG 21
in TEUR
+19.4%
+24.6%
+6%
123,845
90,299
33,546
147,872
112,522*
35,350*
0,000
20,000
40,000
60,000
80,000
100,000
120,000
140,000
160,000
180,000
200,000
Revenues Cost of materialsIncr./Decr. of invent.
and own work capitalizedPersonnel expenses
Other operating expensesOther operating income
EBITDA
6M 2010 6M 2011
Revenues, Costs and EBITDA Growth 6 Months 2010/2011
Financial Data
* These include non-recurring special expenditures in the amount of EUR 5.2 million (Q1 = 2.3 million; Q2 = 2.9 million).
Without these one-off costs, EBITDA in the first half year of 2011 would have increased by 21% year-on-year, to reach EUR 40.6 million.

© 2011 Wirecard AG 22
Consolidated Income Statement 6 Months 2010/2011
Financial Data
in TEUR 6M/2011of
Sales6M/2010
of
Sales
Revenues 147,872 123,845
Own work capitalized 3,435 2,531
Cost of materials (85,969) (58%) (67,137) (54%)
Personnel expenses (14,042) (9%) (14,217) (11%)
Other operating expenses (16,653) (11%) (12,005) (10%)
Other operating income 707 529
EBITDA 35,350 23.9% 33,546 27.1%
Depreciation (3,540) (2%) (2,680) (2%)
EBIT 31,810 21.5% 30,866 24.9%
Financial results (33) (321)
Income tax (6,170) (3,769)
Profit after taxes 25,607 26,776
Diluted earnings per share 0.25 0.26

© 2011 Wirecard AG 23
Financial comments 6 Months 2011/2010
Financial Data
Income tax expenses 2010/2011
in TEUR 6M/2011 in % of profit
before taxes6M/2010 in % of profit
before taxes
Earnings before taxes 31,777 30,545
Taxes on income and profit (6,170) (19,4%) (3,769) (12,3%)
thereof impact from deferred taxes
from outside basis differences - 684
from other deferred taxes 127 (2,193)
thereof actual income taxes (6,297) (19,8%) (2,260) (7,4%)

© 2011 Wirecard AG 24
Payment Services Directive (PSD): new legislation
Financial Data
EU Payment Services Directive (PSD) to be implemented in the local laws of the member states: in Germany
from April 30, 2011. Payment Services Provider need a license to provide payment services
Wirecard Bank as a full licensed German bank has the license subject to PSD
Invoicing for acquiring transferred into Wirecard Bank, instead of the PSP units
No impact on revenues and profitability of the Group
No impact on profitability of the segments PP&RM and A&I
Impact on PP&RM and A&I segment revenues and on consolidation (intersegment revenues)

© 2011 Wirecard AG 25
Changes in Accounting – Example of a Card Transaction
Financial Data
Acquirer
A & I
Payment
Service
Provider
PP&RM
Un
til A
pril 2
011
Me
rch
an
tF
rom
Ma
y 2
011
Me
rch
an
t
2.0% 1.0%
0.5 %
1.0%1.5%2.0%
Result
Rev. 2.0 %
Gross 1.0%
For demonstration purposes only: percentage payable to….
Acquirer
A & I
Red = inter-company revenues
Rev. 2.0 %
Gross 1.0%
Payment
Service
Provider
PP&RM
Card Organization/
Issuer
Card Organization/
Issuer

© 2011 Wirecard AG 26
Balance Sheet as of June 30th, 2011 / Dec. 31, 2010
Financial Data
ASSETS 06/30/2011 12/31/2010EQUITY AND
LIABILITIES06/30/2011 12/31/2010
NON-CURRENT ASSETS 239,055 235,224SHAREHOLDERS´
EQUITY305,215 289,844
- Goodwill 111,851 101,340 LIABILITIES 296,332 260,015
- Deferred tax assets 1,523 1,205 - Current provisions 1,206 1,652
- Self-provided intangible assets 19,128 16,901 - Tax provisions 6,040 3,733
- Other intangible assets 14,912 13,050 - Trade payables 147,093 98,444
- Customer-relationships 63,133 62,451 - Interest-bearing bank loans 32,002 22,001
- Other assets 28,508 40,277 - Deferred income taxes 6,775 6,584
CURRENT ASSETS 362,492 314,635 - Other liabilities 10,708 8,856
- Trade receivables 134,212 118,741 - Customer deposits 92,508 118,745
- Cash and cash equivalents 217,335 185,355
- Interest-bearing securities 9,000 10,000
- Other 1,945 0,539
Total ASSETS 601,547 549,859Total EQUITY and
LIABILITIES601,547 549,859
in TEUR

© 2011 Wirecard AG 27
Disclaimer
This presentation contains explicit and implicit forward-looking statements concerning Wirecard AG, its affiliated
companies and their business. These statements are subject to various known and unknown risks, uncertainties and
other factors due to which the actual events, financial conditions, performances and achievements of Wirecard AG may
differ substantially from those expressed in such explicit or implicit statements. Wirecard AG makes these statements
at the time of the publication of the presentation and is under no obligation to update the forward-looking statements in
this presentation including on receipt of new information or on occurrence of future events or for other reasons.
However, Wirecard AG, may change in its own free discretion any forward-looking statements should relevant factors
change.
The forward-looking statements from third parties’ surveys, in particular without being limited to research reports and
analysts’ statements, may prove to be incorrect. Reference to such third parties’ surveys is provided for information
only and does not imply any agreement with or consent to the content of such surveys or the information, opinions or
conclusions contained therein. Wirecard AG accepts no liability for the selection, completeness or correctness of third
parties’ studies.
This presentation is no offer for the sale and no invitation for offers of purchase or for subscription to of shares of
Wirecard AG but is provided for information only.
Financial data (IAS/IFRS) refers to the Reports of Wirecard AG published on our website:
http://www.wirecard.com/investor-relations

Contact