Windmill Trend Evolution Fund - priviumfund.com · Windmill Trend Evolution Fund Annual Report 2018...
33
Windmill Trend Evolution Fund The Netherlands ANNUAL REPORT for the year ended 30 June 2018
Transcript of Windmill Trend Evolution Fund - priviumfund.com · Windmill Trend Evolution Fund Annual Report 2018...
Windmill Trend Evolution Fund
The Netherlands
ANNUAL REPORT
for the year ended 30 June 2018
Windmill Trend Evolution Fund
Annual Report 2018
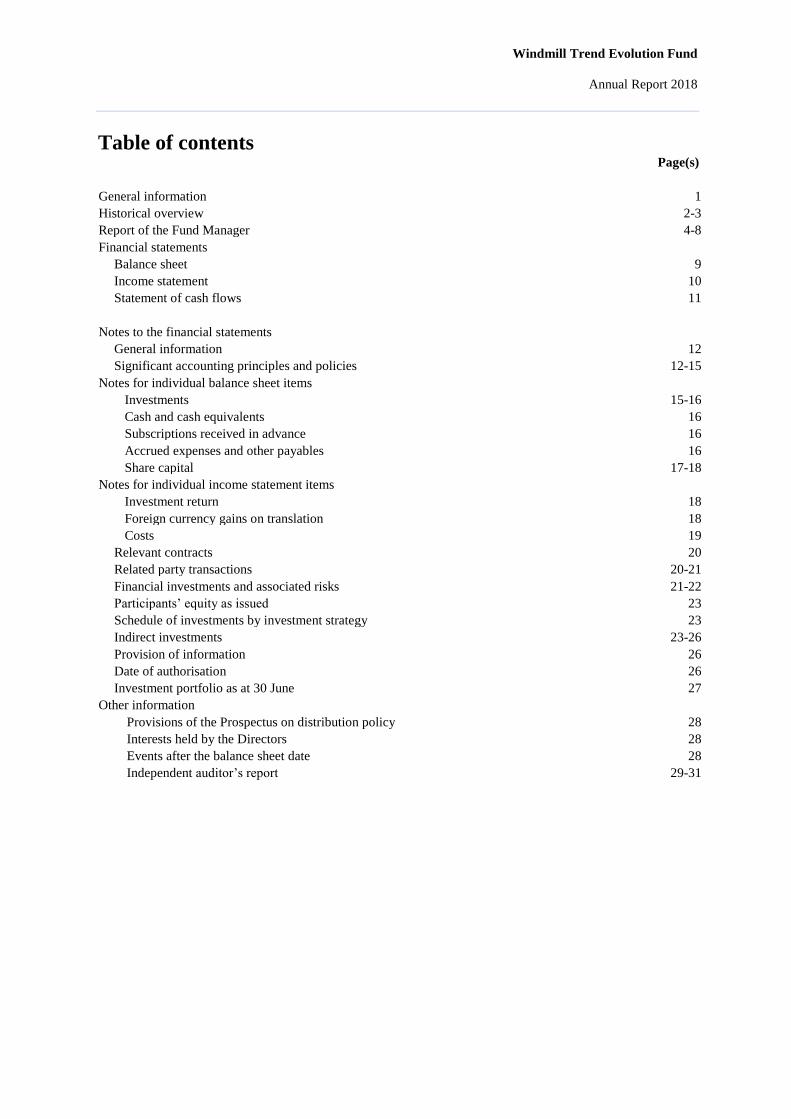
Table of contents Page(s)
General information 1
Historical overview 2-3
Report of the Fund Manager 4-8
Financial statements
Balance sheet 9
Income statement 10
Statement of cash flows 11
Notes to the financial statements
General information 12
Significant accounting principles and policies 12-15
Notes for individual balance sheet items
Investments 15-16
Cash and cash equivalents 16
Subscriptions received in advance 16
Accrued expenses and other payables 16
Share capital 17-18
Notes for individual income statement items Investment return 18
Foreign currency gains on translation 18
Costs 19
Relevant contracts 20
Related party transactions 20-21
Financial investments and associated risks 21-22
Participants’ equity as issued 23
Schedule of investments by investment strategy 23
Indirect investments 23-26
Provision of information 26
Date of authorisation 26
Investment portfolio as at 30 June 27
Other information
Provisions of the Prospectus on distribution policy 28
Interests held by the Directors 28
Events after the balance sheet date 28
Independent auditor’s report 29-31
Windmill Trend Evolution Fund
Annual Report 2018
Page | 1
General information
Registered Office Gustav Mahlerplein 3
Symphony Offices, 26th Floor
1082 MS Amsterdam
The Netherlands
Fund Manager Privium Fund Management B.V.
Gustav Mahlerplein 3
Symphony Offices, 26th Floor
1082 MS Amsterdam
The Netherlands
Delegate/Investment Advisor HJCO Capital Partners B.V.
Beurs-World Trade Center, 19th Floor
Beursplein 37
3011 AA Rotterdam
The Netherlands
Legal Owner TMF Bewaar B.V.
Herikerbergweg 238
1101 CM Amsterdam Zuidoost
The Netherlands
Administrator Custom House Fund Services (Netherlands) B.V.
Westblaak 89
P.O. Box 25121
3001 HC Rotterdam
The Netherlands
Independent Auditor Ernst & Young Accountants LLP
Wassenaarseweg 80
2596 CZ Den Haag
The Netherlands
Legal and Tax Counsel Van Campen Liem
J.J. Viottastraat 52
1071 JT Amsterdam
The Netherlands
Custody Bank ABN AMRO Bank N.V.
Gustav Mahlerlaan 10
1082 PP Amsterdam
The Netherlands
Depositary Darwin Depositary Services B.V.
Barbara Strozzilaan 101
1083 HN Amsterdam
The Netherlands
Windmill Trend Evolution Fund
Annual Report 2018
Page | 2
Historical overview
Key figures
2018 2017
EUR EUR
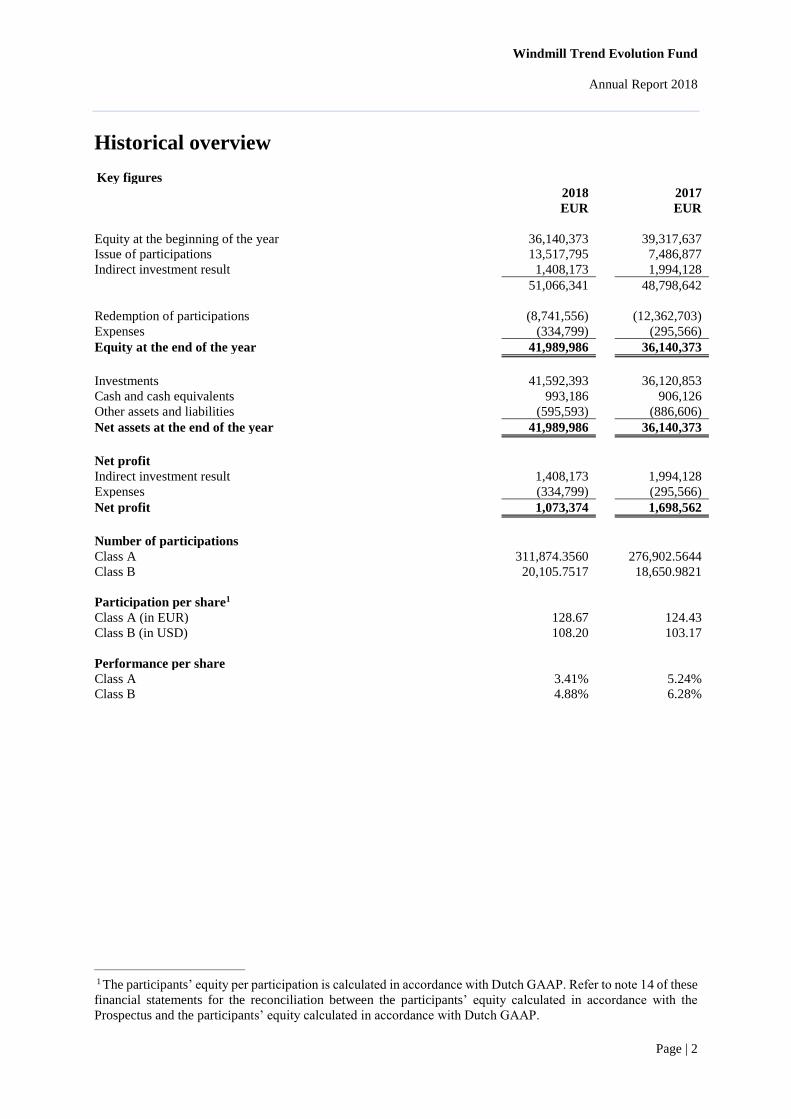
Equity at the beginning of the year 36,140,373 39,317,637
Issue of participations 13,517,795 7,486,877
Indirect investment result 1,408,173 1,994,128 51,066,341 48,798,642
Redemption of participations (8,741,556) (12,362,703)
Expenses (334,799) (295,566)
Equity at the end of the year 41,989,986 36,140,373
Investments 41,592,393 36,120,853
Cash and cash equivalents 993,186 906,126
Other assets and liabilities (595,593) (886,606)
Net assets at the end of the year 41,989,986 36,140,373
Net profit
Indirect investment result 1,408,173 1,994,128
Expenses (334,799) (295,566)
Net profit 1,073,374 1,698,562
Number of participations
Class A 311,874.3560 276,902.5644
Class B 20,105.7517 18,650.9821
Participation per share1
Class A (in EUR) 128.67 124.43
Class B (in USD) 108.20 103.17
Performance per share
Class A 3.41% 5.24%
Class B 4.88% 6.28%
1 The participants’ equity per participation is calculated in accordance with Dutch GAAP. Refer to note 14 of these
financial statements for the reconciliation between the participants’ equity calculated in accordance with the
Prospectus and the participants’ equity calculated in accordance with Dutch GAAP.
Windmill Trend Evolution Fund
Annual Report 2018
Page | 3
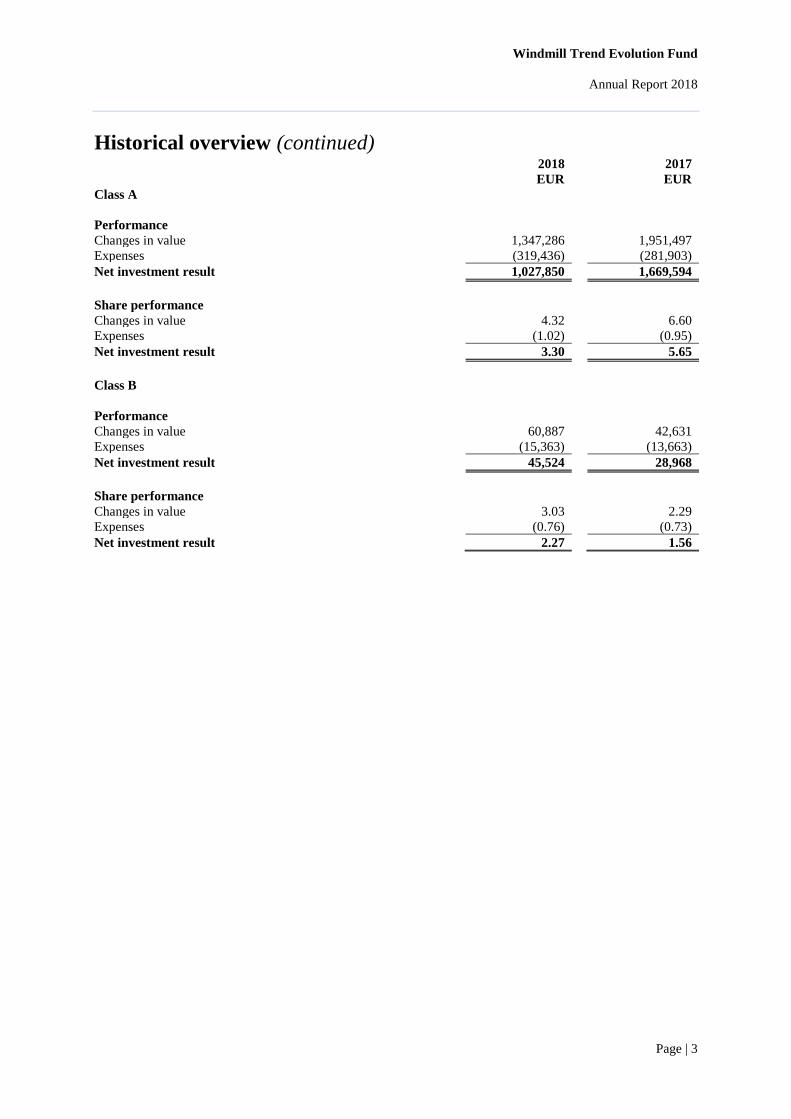
Historical overview (continued)
2018 2017
EUR EUR
Class A
Performance
Changes in value 1,347,286 1,951,497
Expenses (319,436) (281,903)
Net investment result 1,027,850 1,669,594
Share performance
Changes in value 4.32 6.60
Expenses (1.02) (0.95)
Net investment result 3.30 5.65
Class B
Performance
Changes in value 60,887 42,631
Expenses (15,363) (13,663)
Net investment result 45,524 28,968
Share performance
Changes in value 3.03 2.29
Expenses (0.76) (0.73)
Net investment result 2.27 1.56
Windmill Trend Evolution Fund
Annual Report 2018
Page | 4
Report of the Fund Manager
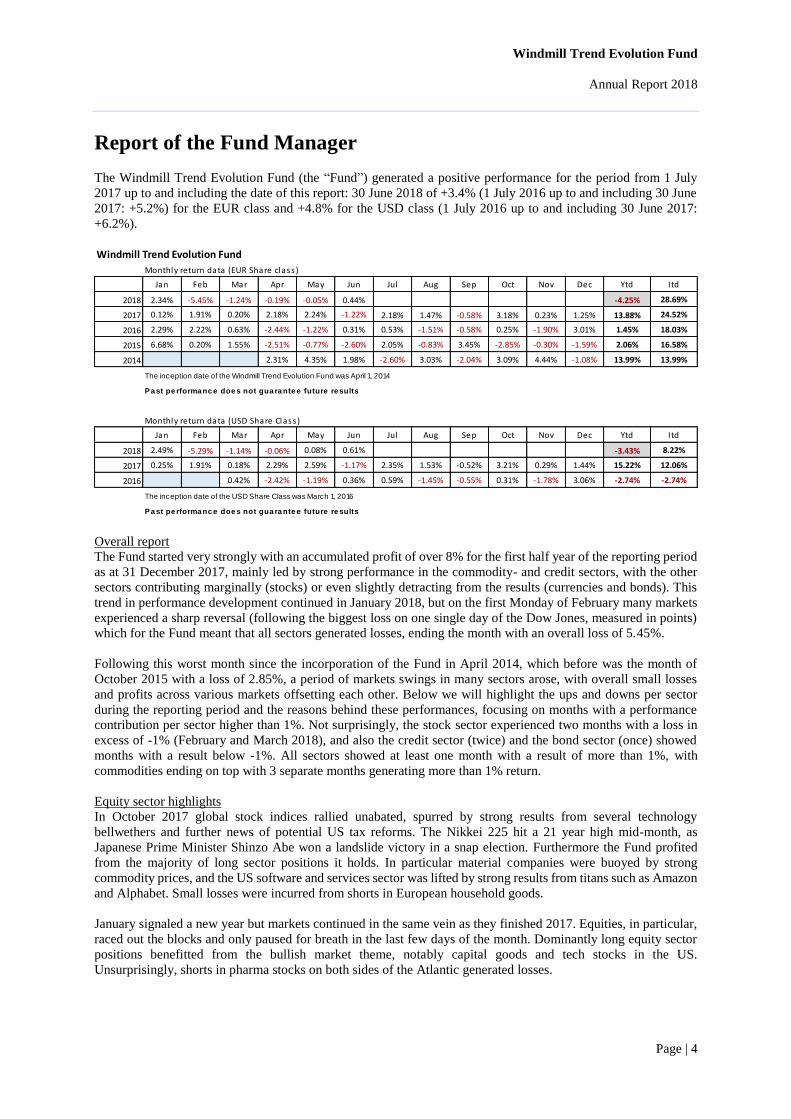
The Windmill Trend Evolution Fund (the “Fund”) generated a positive performance for the period from 1 July
2017 up to and including the date of this report: 30 June 2018 of +3.4% (1 July 2016 up to and including 30 June
2017: +5.2%) for the EUR class and +4.8% for the USD class (1 July 2016 up to and including 30 June 2017:
+6.2%).
Overall report
The Fund started very strongly with an accumulated profit of over 8% for the first half year of the reporting period
as at 31 December 2017, mainly led by strong performance in the commodity- and credit sectors, with the other
sectors contributing marginally (stocks) or even slightly detracting from the results (currencies and bonds). This
trend in performance development continued in January 2018, but on the first Monday of February many markets
experienced a sharp reversal (following the biggest loss on one single day of the Dow Jones, measured in points)
which for the Fund meant that all sectors generated losses, ending the month with an overall loss of 5.45%.
Following this worst month since the incorporation of the Fund in April 2014, which before was the month of
October 2015 with a loss of 2.85%, a period of markets swings in many sectors arose, with overall small losses
and profits across various markets offsetting each other. Below we will highlight the ups and downs per sector
during the reporting period and the reasons behind these performances, focusing on months with a performance
contribution per sector higher than 1%. Not surprisingly, the stock sector experienced two months with a loss in
excess of -1% (February and March 2018), and also the credit sector (twice) and the bond sector (once) showed
months with a result below -1%. All sectors showed at least one month with a result of more than 1%, with
commodities ending on top with 3 separate months generating more than 1% return.
Equity sector highlights
In October 2017 global stock indices rallied unabated, spurred by strong results from several technology
bellwethers and further news of potential US tax reforms. The Nikkei 225 hit a 21 year high mid-month, as
Japanese Prime Minister Shinzo Abe won a landslide victory in a snap election. Furthermore the Fund profited
from the majority of long sector positions it holds. In particular material companies were buoyed by strong
commodity prices, and the US software and services sector was lifted by strong results from titans such as Amazon
and Alphabet. Small losses were incurred from shorts in European household goods.
January signaled a new year but markets continued in the same vein as they finished 2017. Equities, in particular,
raced out the blocks and only paused for breath in the last few days of the month. Dominantly long equity sector
positions benefitted from the bullish market theme, notably capital goods and tech stocks in the US.
Unsurprisingly, shorts in pharma stocks on both sides of the Atlantic generated losses.
Windmill Trend Evolution Fund
Monthly return data (EUR Share class )
Jan Feb Mar Apr May Jun Jul Aug Sep Oct Nov Dec Ytd Itd
2018 2.34% -5.45% -1.24% -0.19% -0.05% 0.44% -4.25% 28.69%
2017 0.12% 1.91% 0.20% 2.18% 2.24% -1.22% 2.18% 1.47% -0.58% 3.18% 0.23% 1.25% 13.88% 24.52%
2016 2.29% 2.22% 0.63% -2.44% -1.22% 0.31% 0.53% -1.51% -0.58% 0.25% -1.90% 3.01% 1.45% 18.03%
2015 6.68% 0.20% 1.55% -2.51% -0.77% -2.60% 2.05% -0.83% 3.45% -2.85% -0.30% -1.59% 2.06% 16.58%
2014 2.31% 4.35% 1.98% -2.60% 3.03% -2.04% 3.09% 4.44% -1.08% 13.99% 13.99%
Pa st pe rforma nc e doe s not gua ra nte e future re sults
Monthly return data (USD Share Class )
Jan Feb Mar Apr May Jun Jul Aug Sep Oct Nov Dec Ytd Itd
2018 2.49% -5.29% -1.14% -0.06% 0.08% 0.61% -3.43% 8.22%
2017 0.25% 1.91% 0.18% 2.29% 2.59% -1.17% 2.35% 1.53% -0.52% 3.21% 0.29% 1.44% 15.22% 12.06%
2016 0.42% -2.42% -1.19% 0.36% 0.59% -1.45% -0.55% 0.31% -1.78% 3.06% -2.74% -2.74%
Pa st pe rforma nc e doe s not gua ra nte e future re sults
The inception date of the Windmill Trend Evolution Fund was April 1, 2014
The inception date of the USD Share Class was March 1, 2016
Windmill Trend Evolution Fund
Annual Report 2018
Page | 5
Report of the Fund Manager (continued)
Equity sector highlights (continued)
The largest ever one-day points loss in the Dow Jones Industrial Average, on the first Monday of February, woke
sleepy, optimistic markets with an explosive return of volatility. It was Jerome Powell’s first day as Chairman of
the Federal Reserve, although the moves were perhaps sparked by the previous Friday’s US wage inflation data
showing the fastest annual rise in almost a decade. The moves sent ripples that spread to risk assets across the
globe. While equity indices managed to claw back some of the selloff by the end of the month, the initial market
moves and jump in volatility proved challenging. The Fund entered the month with overall net long exposure
across cyclical sectors (capital goods, materials), and much smaller shorts in defensive stocks (utilities and
consumer staples). With all sectors selling off, the largest losses came from the capital goods and materials
companies in both the USA and Europe, while the short utilities positions did offset somewhat.
Any hopes that in March we would see global risk markets recover from their February correction were dashed,
as US President Donald Trump unsettled the markets and volatility remained elevated. While senior departures
from the administration, such as Rex Tillerson and Gary Cohn, are perhaps part of the new normal, the
announcement of tariffs on steel and aluminum imports sparked fears a global trade war. Despite significantly
reduced risk exposure, the increasingly volatile stock markets saw losses coming from both short positions in
defensive sectors such as US and European utilities as well as long positions in consumer services and retail.
Smaller gains were made on short positions in telecoms, media and material company stocks.
Credit sector highlights
In October 2017 the general surge of the stock markets fueled tightening of credit spreads, benefitting long credit
positions across the board with top performers coming from Europe. Sharp reversals in trends during February
2018 impacted the Fund, with long positions and European credit hit in particular. Credit indices saw losses on all
long positions, and as a result of heighted volatility, the Fund significantly reduced exposure.
Credit spread widening hit the Fund’s long credit positions in May 2018, particularly in Europe where the political
uncertainty in Italy unsettled markets. The investment-grade iTraxx main index widened 15 points, the most in
more than two and a half years.
Commodities sector highlights
Commodity prices soared in general over the month of October, and the Fund’s commodities were no exception.
News of a strike in South Africa further propelled coal prices, making the Fund’s long position the best performer
over the month, and gains were also made in European electricity and natural gas. Small losses were incurred from
a long in iron ore.
In April 2018 UK natural gas prices, in particular, rose over 16% on the month as sources were squeezed as a
result of the cold winter. Long positions here and in European electricity were significantly profitable.
May was a strong month for commodities, largely driven by long positions in European natural gas and power
markets. European power prices have been driven up by very low hydro stocks in the Nordic region, where 50%
of power generation originates from hydro sources. The coldest winter since 2012 depleted European gas storage
to the lowest in at least a decade, driving up prices.
Bonds sector highlights
Fixed income markets enjoyed a strong month in July 2017 with gains in most markets, in particular Brazilian and
Canadian swaps. Brazilian swaps generated positive returns as the Fund increased long receiver positioning during
the month while rates fell further. The Fund also profited from short payer positioning in Canada as the central
bank raised its key interest rate to 0.75% citing strong economic growth despite low inflation.
Windmill Trend Evolution Fund
Annual Report 2018
Page | 6
Report of the Fund Manager (continued)
Bonds sector highlights (continued)
As 2017 drew to a close, in December 2017 several themes from earlier in the year persisted, with the fixed income
rollercoaster continuing, as US 10-year yields approached March highs. Europe was no better, with 10-year Bund
yields rising over ten basis points in two days on a hawkish tone from ECB policymakers. The election of Cyril
Ramaphosa as new leader of the South African National Congress was clearly seen by the market as likely to help
eradicate corruption and kick-start the economy. This news did not suit the Fund’s payer position in interest-rate
swaps (“IRS”), however, which ended the month of December as both fixed income’s and the Fund’s worst
performer.
Currency sector highlights
Currency attributions dominated the Fund’s returns in June 2018 as the Fund’s short EM positioning, in place
since the start of the quarter, bore fruit. The JP Morgan EM Currency Index fell 2.5% on the month, taking the
quarterly loss to around 10%. Top Fund performer was the Brazilian real, which fell 4% against the US dollar
despite two rounds of intervention by the central bank over the month, and there were no meaningful losing trades.
Outlook
The Fund Manager is positive about the future of the Windmill Trend Evolution Fund. We expect the selected
investments funds to be able to generate positive performance in the period ahead. Especially when compared with
long-only investments in traditional asset classes like equities and bonds we see the Windmill Trend Evolution
Fund as a good alternative as well as a diversifier in a total investment portfolio.
No changes are expected to be made to the investment strategy or investment style of the Windmill Trend
Evolution Fund.
General principles of remuneration policy Privium Fund Management B.V. (“Privium”)
Privium Fund Management B.V. has a careful, controlled and sustainable remuneration policy which meets all the
requirements included in the Alternative Investment Fund Managers Directive (AIFMD) and the guidelines on
sound remuneration policies under the AIFMD (ESMA Guidelines). The remuneration policy is consistent with
and contributes to a sound and effective risk management framework and does not encourage risk taking beyond
what is acceptable for Privium Fund Management B.V..
The Board of Privium Fund Management B.V. is responsible for establishing the Remuneration policy. The Board
of Privium Fund Management B.V. reviews the Remuneration policy at least once a year and the policy may be
amended if circumstances warrant that.
Remunerations at Privium Fund Management B.V. may consist out of a fixed salary (this may include a payment
to cover certain expenses of staff members) and a variable remuneration.
Privium Fund Management B.V. may reclaim all or part of the variable remuneration paid if (i) this payment was
made on the basis of incorrect information, (ii) in the event of fraud by the employee, (iii) in the event of serious
improper behaviour by the employee or serious negligence in the performance of his tasks, or (iv) in the event of
behaviour that has resulted in considerable losses for the institution.
Remuneration policy 2017
This policy is based on the situation as of December 31, 2017 and no information is yet available for the full year
of 2018. The financial year of the Fund Manager ends on December 31 of any year. The financial year of the
Windmill Trend Evolution Fund ends on June 30 of any year, while the financial year of all other Funds of which
Privium is the Fund Manager will end on December 31 of any year.
Windmill Trend Evolution Fund
Annual Report 2018
Page | 7
Report of the Fund Manager (continued)
Remuneration policy 2017 (continued)
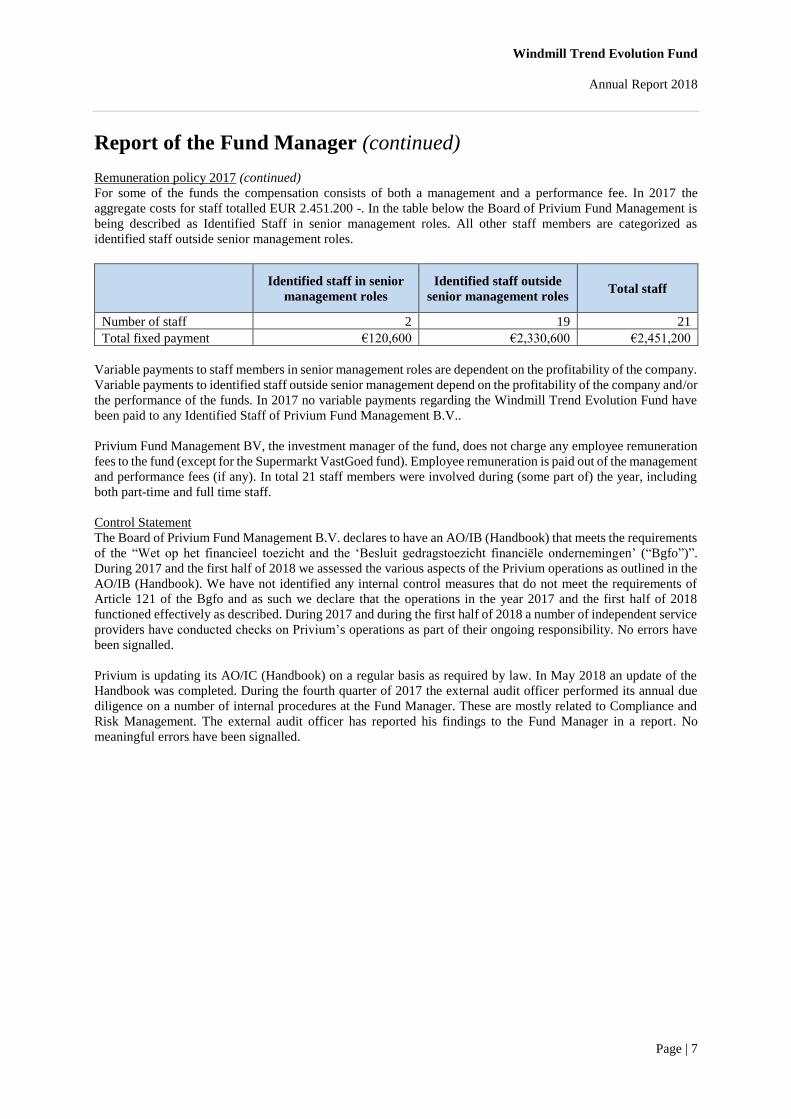
For some of the funds the compensation consists of both a management and a performance fee. In 2017 the
aggregate costs for staff totalled EUR 2.451.200 -. In the table below the Board of Privium Fund Management is
being described as Identified Staff in senior management roles. All other staff members are categorized as
identified staff outside senior management roles.
Identified staff in senior
management roles
Identified staff outside
senior management roles Total staff
Number of staff 2 19 21
Total fixed payment €120,600 €2,330,600 €2,451,200
Variable payments to staff members in senior management roles are dependent on the profitability of the company.
Variable payments to identified staff outside senior management depend on the profitability of the company and/or
the performance of the funds. In 2017 no variable payments regarding the Windmill Trend Evolution Fund have
been paid to any Identified Staff of Privium Fund Management B.V..
Privium Fund Management BV, the investment manager of the fund, does not charge any employee remuneration
fees to the fund (except for the Supermarkt VastGoed fund). Employee remuneration is paid out of the management
and performance fees (if any). In total 21 staff members were involved during (some part of) the year, including
both part-time and full time staff.
Control Statement
The Board of Privium Fund Management B.V. declares to have an AO/IB (Handbook) that meets the requirements
of the “Wet op het financieel toezicht and the ‘Besluit gedragstoezicht financiële ondernemingen’ (“Bgfo”)”.
During 2017 and the first half of 2018 we assessed the various aspects of the Privium operations as outlined in the
AO/IB (Handbook). We have not identified any internal control measures that do not meet the requirements of
Article 121 of the Bgfo and as such we declare that the operations in the year 2017 and the first half of 2018
functioned effectively as described. During 2017 and during the first half of 2018 a number of independent service
providers have conducted checks on Privium’s operations as part of their ongoing responsibility. No errors have
been signalled.
Privium is updating its AO/IC (Handbook) on a regular basis as required by law. In May 2018 an update of the
Handbook was completed. During the fourth quarter of 2017 the external audit officer performed its annual due
diligence on a number of internal procedures at the Fund Manager. These are mostly related to Compliance and
Risk Management. The external audit officer has reported his findings to the Fund Manager in a report. No
meaningful errors have been signalled.
Windmill Trend Evolution Fund
Annual Report 2018
Page | 8
Report of the Fund Manager (continued)
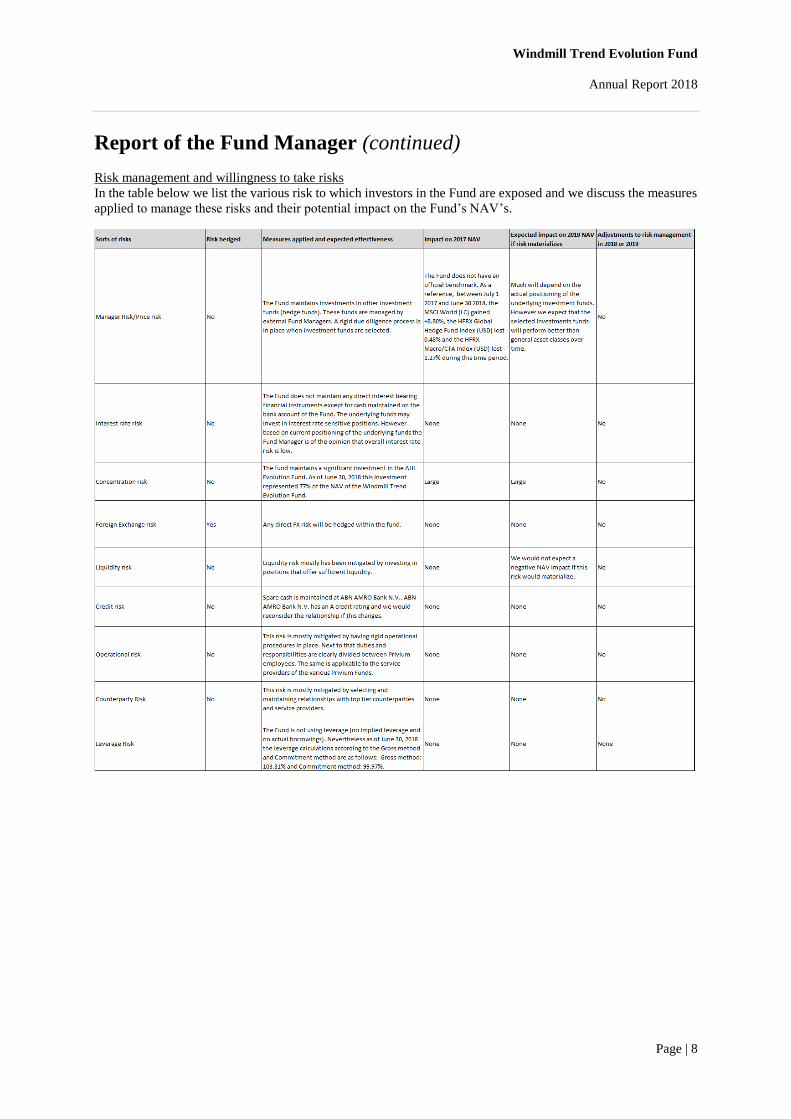
Risk management and willingness to take risks
In the table below we list the various risk to which investors in the Fund are exposed and we discuss the measures
applied to manage these risks and their potential impact on the Fund’s NAV’s.
Windmill Trend Evolution Fund
Annual Report 2018
Page | 9
Financial statements
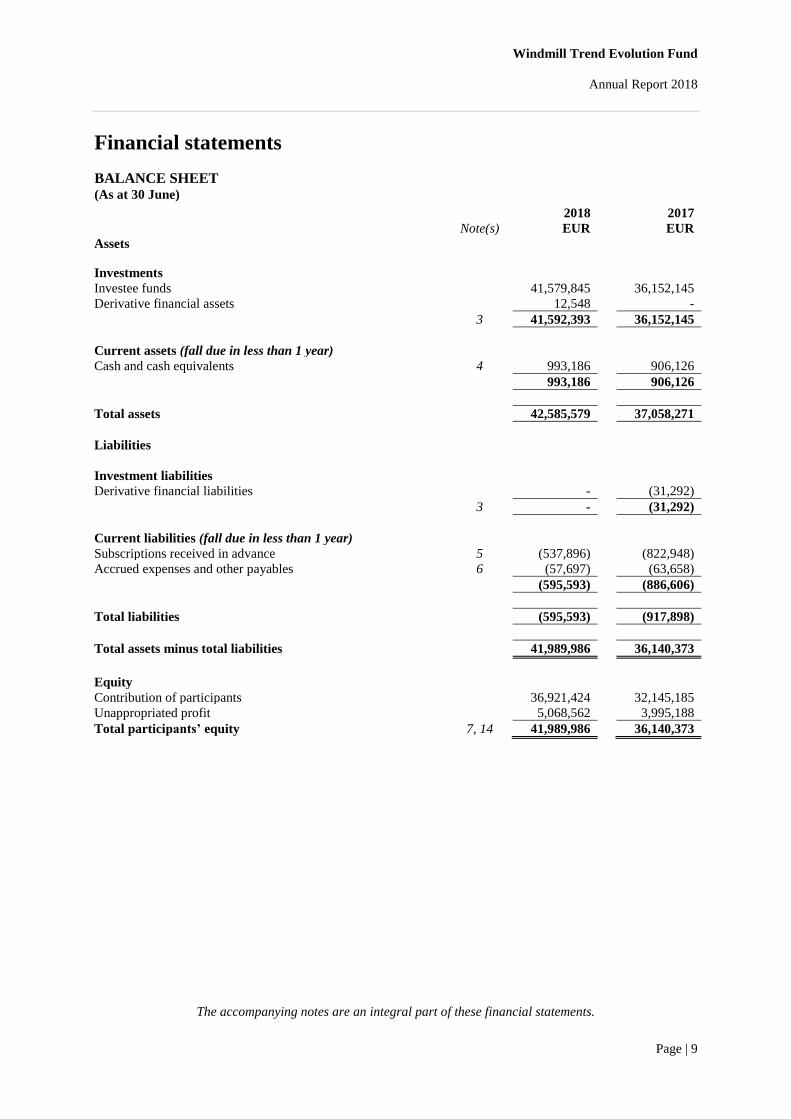
BALANCE SHEET (As at 30 June)
The accompanying notes are an integral part of these financial statements.
2018 2017
Note(s) EUR EUR
Assets Investments Investee funds 41,579,845 36,152,145
Derivative financial assets 12,548 -
3 41,592,393 36,152,145
Current assets (fall due in less than 1 year)
Cash and cash equivalents 4 993,186 906,126
993,186 906,126
Total assets 42,585,579 37,058,271
Liabilities
Investment liabilities
Derivative financial liabilities - (31,292)
3 - (31,292)
Current liabilities (fall due in less than 1 year)
Subscriptions received in advance 5 (537,896) (822,948)
Accrued expenses and other payables 6 (57,697) (63,658)
(595,593) (886,606)
Total liabilities (595,593) (917,898)
Total assets minus total liabilities 41,989,986 36,140,373
Equity
Contribution of participants 36,921,424 32,145,185
Unappropriated profit 5,068,562 3,995,188
Total participants’ equity 7, 14 41,989,986 36,140,373
Windmill Trend Evolution Fund
Annual Report 2018
Page | 10
Financial statements
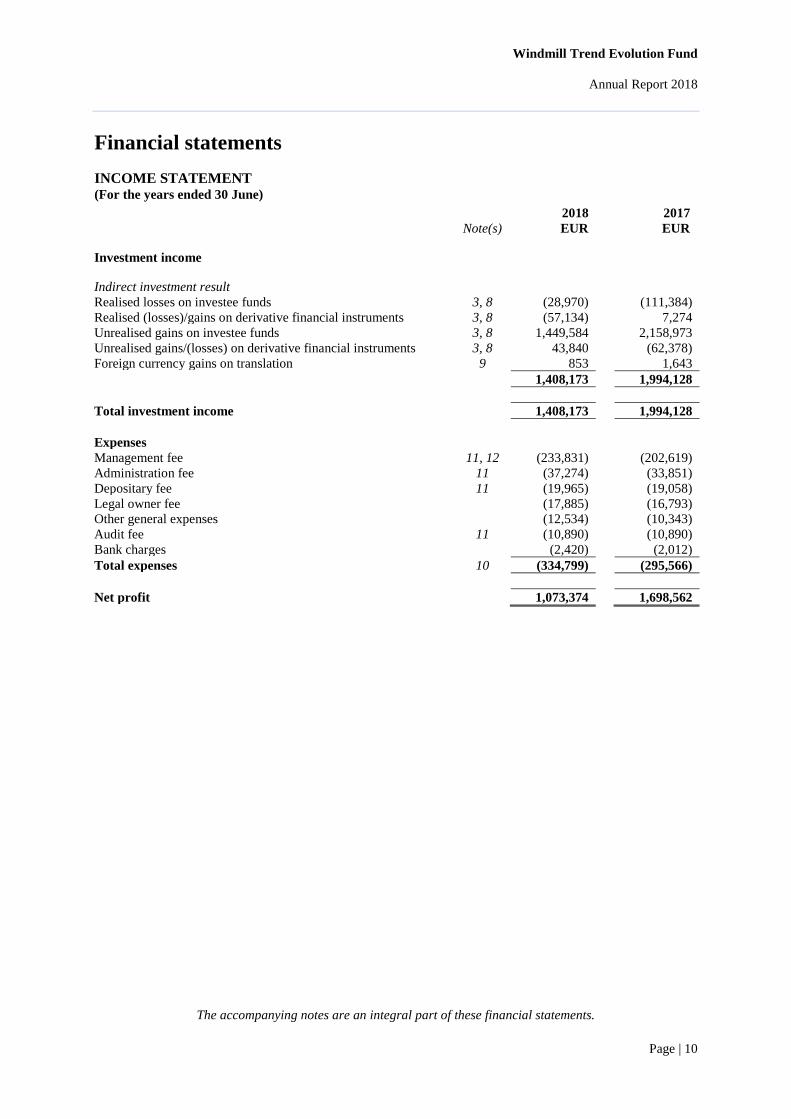
INCOME STATEMENT (For the years ended 30 June)
The accompanying notes are an integral part of these financial statements.
2018 2017
Note(s) EUR EUR
Investment income Indirect investment result Realised losses on investee funds 3, 8 (28,970) (111,384)
Realised (losses)/gains on derivative financial instruments 3, 8 (57,134) 7,274
Unrealised gains on investee funds 3, 8 1,449,584 2,158,973
Unrealised gains/(losses) on derivative financial instruments 3, 8 43,840 (62,378)
Foreign currency gains on translation 9 853 1,643
1,408,173 1,994,128
Total investment income 1,408,173 1,994,128
Expenses
Management fee 11, 12 (233,831) (202,619)
Administration fee 11 (37,274) (33,851)
Depositary fee 11 (19,965) (19,058)
Legal owner fee (17,885) (16,793)
Other general expenses (12,534) (10,343)
Audit fee 11 (10,890) (10,890)
Bank charges (2,420) (2,012)
Total expenses 10 (334,799) (295,566)
Net profit 1,073,374 1,698,562
Windmill Trend Evolution Fund
Annual Report 2018
Page | 11
Financial statements
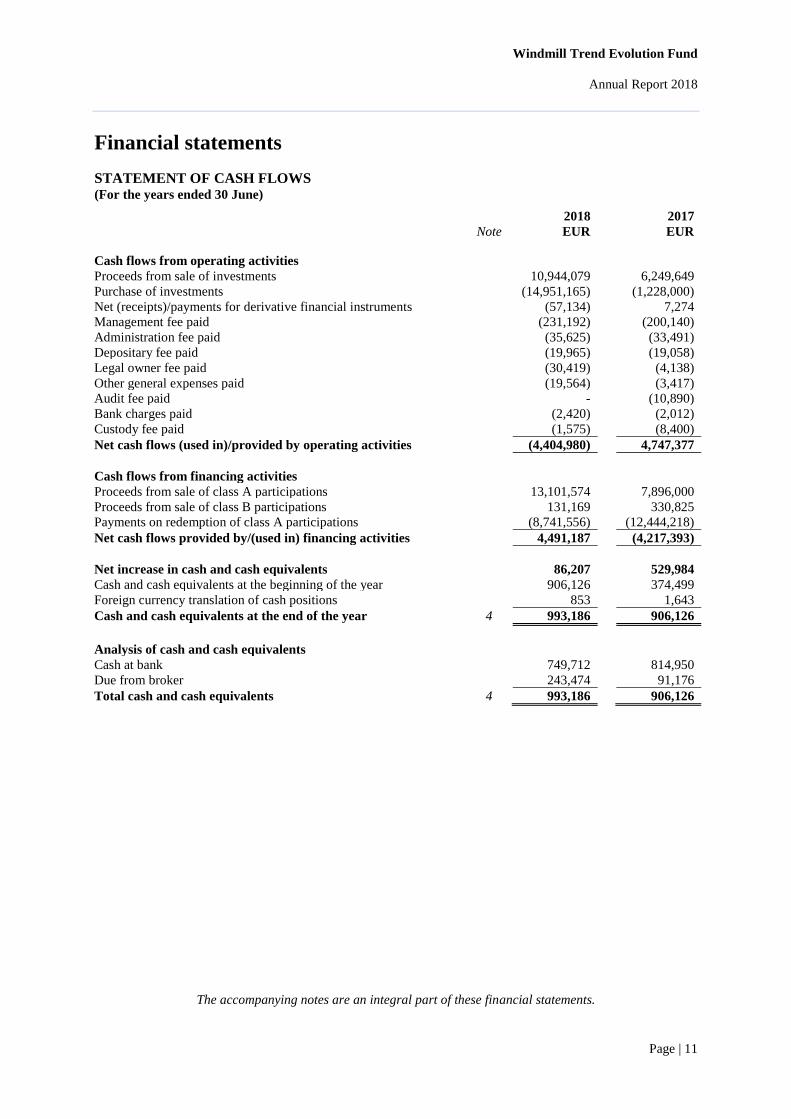
STATEMENT OF CASH FLOWS (For the years ended 30 June)
The accompanying notes are an integral part of these financial statements.
2018 2017
Note EUR EUR
Cash flows from operating activities Proceeds from sale of investments 10,944,079 6,249,649
Purchase of investments (14,951,165) (1,228,000)
Net (receipts)/payments for derivative financial instruments (57,134) 7,274
Management fee paid (231,192) (200,140)
Administration fee paid (35,625) (33,491)
Depositary fee paid (19,965) (19,058)
Legal owner fee paid (30,419) (4,138)
Other general expenses paid (19,564) (3,417)
Audit fee paid - (10,890)
Bank charges paid (2,420) (2,012)
Custody fee paid (1,575) (8,400)
Net cash flows (used in)/provided by operating activities (4,404,980) 4,747,377
Cash flows from financing activities
Proceeds from sale of class A participations 13,101,574 7,896,000
Proceeds from sale of class B participations 131,169 330,825
Payments on redemption of class A participations (8,741,556) (12,444,218)
Net cash flows provided by/(used in) financing activities 4,491,187 (4,217,393)
Net increase in cash and cash equivalents 86,207 529,984
Cash and cash equivalents at the beginning of the year 906,126 374,499
Foreign currency translation of cash positions 853 1,643
Cash and cash equivalents at the end of the year 4 993,186 906,126
Analysis of cash and cash equivalents
Cash at bank 749,712 814,950
Due from broker 243,474 91,176
Total cash and cash equivalents 4 993,186 906,126
Windmill Trend Evolution Fund
Annual Report 2018
Page | 12
Notes to the financial statements
1. GENERAL INFORMATION
Windmill Trend Evolution Fund (the “Fund”) is structured as a contractual fund with an open-ended redemption
structure under Dutch law. The Fund is a closed fund for joint account for Dutch tax purposes (besloten fonds voor
gemene rekening) and is not a legal entity but a contractual arrangement sui generis between the Fund Manager,
the Legal Owner and the participants. The Fund commenced operations on 1 April 2014. The Fund will be
managed by Privium Fund Management B.V. as sole Alternative Investment Fund Manager (AIFM) of the Fund.
The Fund Manager is responsible for the entire management of the Fund in accordance with the provisions of the
Fund Documents and applicable laws. The Fund Manager is also responsible for maintaining records and
furnishing or causing to be furnished all required records or other information of the Fund to the extent such
records, reports and other information are not maintained or furnished by the Administrator, the Legal Owner, the
Depositary or other service providers.
Privium Fund Management B.V. is a private limited liability company (besloten vennootschap met beperkte
aansprakelijkheid) incorporated under the laws of the Netherlands having its official seat (zetel) in Amsterdam,
the Netherlands and its principal offices at Gustav Mahlerplein 3, Symphony Offices, 26th Floor, 1082 MS
Amsterdam, the Netherlands. The Fund Manager is registered in the Dutch trade register (handelsregister) under
file number 34268930.
The investment objective of the Fund is to achieve medium-term capital gains for the participants. To achieve this
objective, the Fund primarily invests in Class A1 Evolution EUR shares (the “AHL shares”) issued from the Class
A Segregated Portfolio of AHL (Cayman) SPC (the “AHL Fund”). The Fund may acquire interests in other
investment funds mainly focused on innovative systematic strategies that invest outside the mainstream markets.
The Fund may issue Class A and Class B participations. As at 30 June 2018 and 2017, both the Class A
participations and Class B participations are in issue. Prospective participants can subscribe for Class A
participations in EUR and for Class B participations in USD.
The Fund’s investment activities are managed by Privium Fund Management B.V. (the “Fund Manager”), with
the administration delegated to Custom House Fund Services (Netherlands) B.V. (the “Administrator”).
The Fund had no employees during the years ended 30 June 2018 and 2017.
The Fund Manager is subject to supervision by the AFM (Stichting Autoriteit Financiële Markten) and DNB
(Central Bank of the Netherlands). On 22 July 2014, the AFM licence of the Fund Manager was automatically
converted into an Alternative Investment Fund Managers Directive (“AIFMD”) licence by the AFM.
The financial statements have been authorised for issue by the Fund Manager on 1 November 2018.
2. SIGNIFICANT ACCOUNTING PRINCIPLES AND POLICIES
Basis of preparation
The financial statements of the Fund have been prepared in accordance with accounting principles generally
accepted in the Netherlands (“Dutch GAAP”) including the guidelines for annual reporting RJ 615 and the
statutory provisions concerning annual accounts contained in Part 9, Book 2 of the Dutch Civil Code.
The financial statements are prepared on a fair value basis for financial investments, except those for which a
reliable measure of fair value is not available. Other financial assets and liabilities and non-financial assets and
liabilities are stated at amortised cost or historical cost.
Below and overleaf is a summary of the accounting policies of the Fund.
Functional currency
The financial statements are presented in Euro (“EUR”), which is the Fund’s functional currency.
Windmill Trend Evolution Fund
Annual Report 2018
Page | 13
Notes to the financial statements
2. SIGNIFICANT ACCOUNTING PRINCIPLES AND POLICIES (CONTINUED)
Recognition and measurement
An asset is recognised in the balance sheet when it is probable that future economic benefits of the asset will flow
to the Fund and the amount of the asset can be reliably measured. A liability is recognised in the balance sheet
when it is probable that an outflow of resources embodying economic benefits will result from the settlement of a
present obligation and the amount at which the settlement will take place can be measured reliably. Income is
recognised in the income statement when an increase in future economic benefit related to an increase in an asset
or decrease in a liability has arisen that can be measured reliably.
Expenses (including value added tax (“VAT”), where applicable) are recognised in the income statement when a
decrease in future economic benefit related to a decrease in an asset or an increase in a liability has arisen that can
be measured reliably.
Estimates
The preparation of financial statements in conformity with the relevant rules requires the use of certain critical
accounting estimates. It also requires management to exercise its judgement in the process of applying the Fund’s
accounting policies. If necessary, for the purposes of providing the view required under Section 362, subsection
1, Book 2 of the Dutch Civil Code, the nature of these estimates and judgements, including related assumptions,
is disclosed in the notes to the financial statements in question.
Foreign exchange
Transactions in foreign currency are converted at the rates prevailing on the date of the transaction. Monetary
assets and liabilities denominated in currencies other than EUR are converted to EUR at the exchange rates
prevailing on the balance sheet date. Foreign currency exchange gains and losses resulting from the settlement of
such transactions and from the translation at year end exchange rates are recognised in the income statement.
Translation differences on non-monetary assets held at cost are recognised using the exchange rates prevailing at
the dates of transactions.
Translation differences in non-monetary assets such as investment in investee funds held at fair value through
profit or loss are recognised through profit or loss as part of the fair value gain or loss.
Classification of participations
The participations of the Fund are classified as equity. These participations are recognised and measured at the
redemption amount. Any distribution of equity is recognised through equity.
Basis of valuation - policies in preparing the balance sheet
Financial investments and financial derivatives are initially measured at fair value which is the fair value of the
consideration given or received. Financial investments are subsequently re-measured at fair value.
Gains and losses arising from fair value changes are recognised in the income statement as ‘realised losses on
investee funds’ and ‘realised (losses)/gains on derivative financial instruments’ or ‘unrealised gains on investee
funds’ and ‘unrealised gains/(losses) on derivative financial instruments’.
The Fund’s investment in investee funds are valued based on the reporting received from the administrators of
those funds. As at 30 June 2018, the value of investment in investee funds is the aggregate of the Fund’s attributable
share of the latest available (unaudited) net asset value (“NAV”) of the investee funds.
The profit or loss of the Fund on its investment in investee funds is the aggregate of the Fund’s attributable share
of the result of the investee funds. The Fund Manager may, if it thinks fit, make adjustments as a result of the
different bases of determination of results applied by the investee funds. As at 30 June 2018 and 2017, no such
adjustments were made.

Windmill Trend Evolution Fund
Annual Report 2018
Page | 14
Notes to the financial statements
2. SIGNIFICANT ACCOUNTING PRINCIPLES AND POLICIES (CONTINUED)
Basis of valuation - policies in preparing the balance sheet (continued)
Where an up-to-date value of an underlying investment is not available, or the valuation date does not coincide
with that of the Fund, the Fund Manager will use an estimated value.
Forward currency contracts
The Fund may use forward currency contracts to hedge the currency exposure. A forward currency contract
involves an obligation to purchase or sell a specific currency at a future date, at a price set at the time the contract
is made. Forward currency contracts are valued by reference to the forward price at which a new forward currency
contract of the same size and maturity could be undertaken at the valuation date. The unrealised gain or loss on
open forward currency contracts is calculated as the difference between the contract rate and this forward price.
Payables and accruals
Payables and accruals are included at fair value.
Cash and cash equivalents
Cash comprises cash on hand and demand deposits. Cash equivalents are short-term, highly liquid investments
that are readily convertible to known amounts of cash and which are subject to insignificant changes in value and
are held for the purpose of meeting short-term cash commitments rather than for investment or other purposes.
Statement of cash flows
The statement of cash flows is prepared according to the direct method. The statement of cash flows shows the
Fund’s cash flows for the year divided into cash flows from operations and financing activities and how the cash
flows have affected cash funds.
For the purposes of the statement of cash flows, financial instruments at fair value through profit or loss are
included under operating activities. Cash flows from financing activities include proceeds from subscriptions and
payments for redemptions of shares of the Fund. As the nature of the Fund is to invest in financial instruments, all
cash flows related to investments are classified as cash flows from operating activities.
Participants’ equity
All references to net assets and NAV throughout the financial statements are equivalent to total participants’ equity.
Principles for determining the result
The Fund recognises financial assets and liabilities on the date it becomes a party to the contractual provisions of
the instrument. A regular way purchase and sale of investments is recognised using trade date accounting.
The changes in value of the investments held by the Fund are accounted for in the income statement.
Dividends from investee funds, if any, are included at the date when they are declared.
Expenses are accounted for in the income statement on the accrual basis. Transaction costs in relation to investee
funds are capitalised. Income and expenses are allocated to the share classes of the Fund on a pro-rata basis, except
for costs specific to a particular class of shares.
Tax position
The Fund qualifies as a transparent or “closed” fund for joint-account for Dutch tax purposes. This implies that
the Fund is not subject to corporate income tax. Distributions made by the Fund are not subject to Dutch dividend
withholding tax.
Windmill Trend Evolution Fund
Annual Report 2018
Page | 15
Notes to the financial statements
NOTES FOR INDIVIDUAL BALANCE SHEET ITEMS
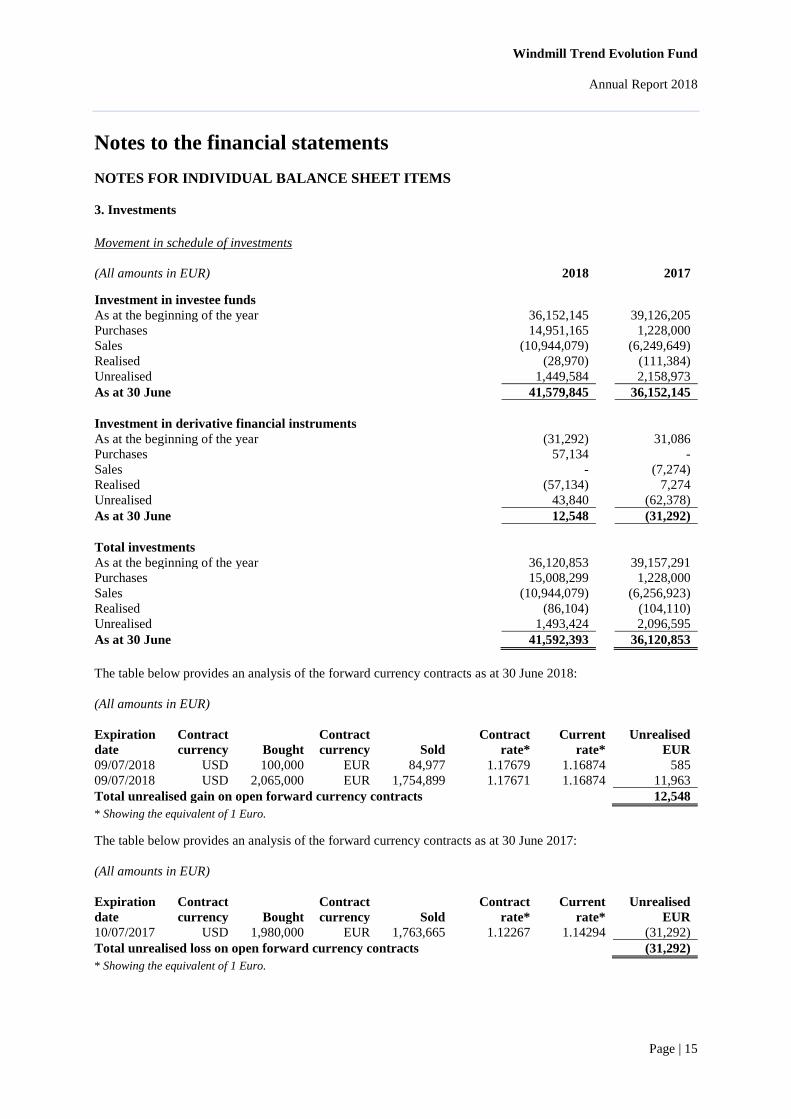
3. Investments
Movement in schedule of investments
(All amounts in EUR) 2018 2017 Investment in investee funds As at the beginning of the year 36,152,145 39,126,205
Purchases 14,951,165 1,228,000
Sales (10,944,079) (6,249,649)
Realised (28,970) (111,384)
Unrealised 1,449,584 2,158,973
As at 30 June 41,579,845 36,152,145
Investment in derivative financial instruments
As at the beginning of the year (31,292) 31,086
Purchases 57,134 -
Sales - (7,274)
Realised (57,134) 7,274
Unrealised 43,840 (62,378)
As at 30 June 12,548 (31,292)
Total investments
As at the beginning of the year 36,120,853 39,157,291
Purchases 15,008,299 1,228,000
Sales (10,944,079) (6,256,923)
Realised (86,104) (104,110)
Unrealised 1,493,424 2,096,595
As at 30 June 41,592,393 36,120,853
The table below provides an analysis of the forward currency contracts as at 30 June 2018:
(All amounts in EUR)
Expiration
date
Contract
currency Bought
Contract
currency Sold
Contract
rate*
Current
rate*
Unrealised
EUR
09/07/2018 USD 100,000 EUR 84,977 1.17679 1.16874 585
09/07/2018 USD 2,065,000 EUR 1,754,899 1.17671 1.16874 11,963
Total unrealised gain on open forward currency contracts 12,548
* Showing the equivalent of 1 Euro.
The table below provides an analysis of the forward currency contracts as at 30 June 2017:
(All amounts in EUR)
Expiration
date
Contract
currency Bought
Contract
currency Sold
Contract
rate*
Current
rate*
Unrealised
EUR
10/07/2017 USD 1,980,000 EUR 1,763,665 1.12267 1.14294 (31,292)
Total unrealised loss on open forward currency contracts (31,292)
* Showing the equivalent of 1 Euro.
Windmill Trend Evolution Fund
Annual Report 2018
Page | 16
Notes to the financial statements
NOTES FOR INDIVIDUAL BALANCE SHEET ITEMS (CONTINUED)
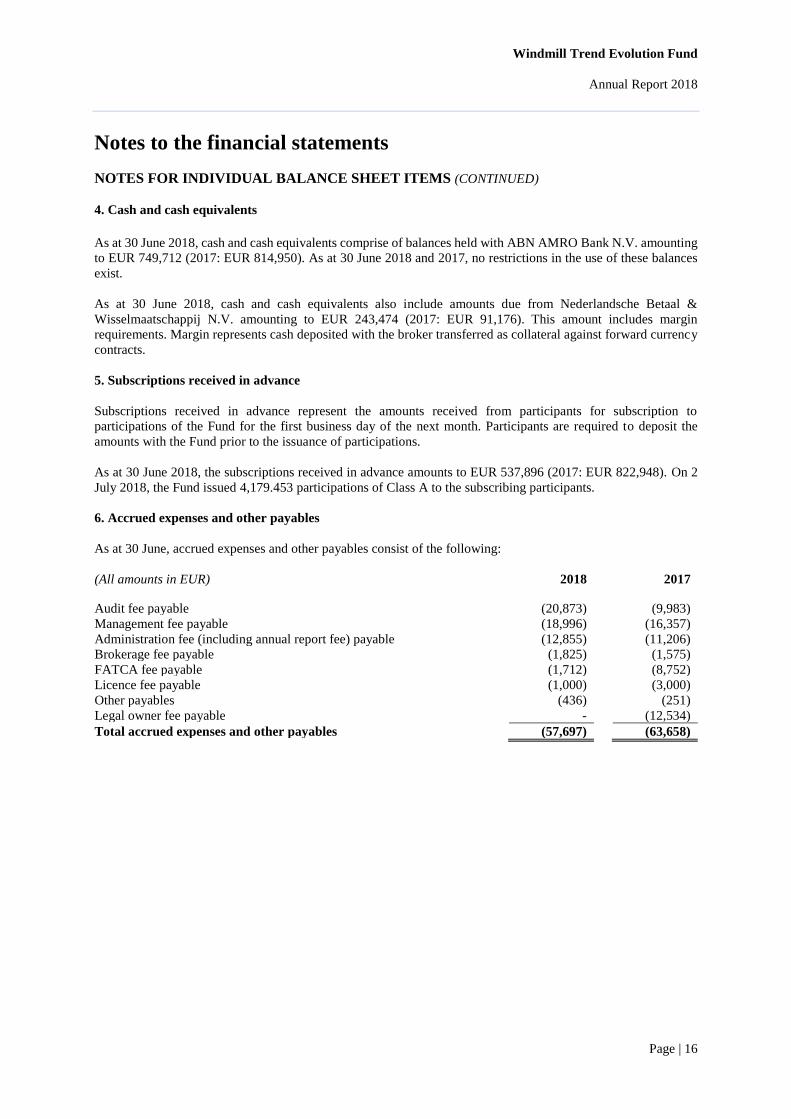
4. Cash and cash equivalents
As at 30 June 2018, cash and cash equivalents comprise of balances held with ABN AMRO Bank N.V. amounting
to EUR 749,712 (2017: EUR 814,950). As at 30 June 2018 and 2017, no restrictions in the use of these balances
exist.
As at 30 June 2018, cash and cash equivalents also include amounts due from Nederlandsche Betaal &
Wisselmaatschappij N.V. amounting to EUR 243,474 (2017: EUR 91,176). This amount includes margin
requirements. Margin represents cash deposited with the broker transferred as collateral against forward currency
contracts.
5. Subscriptions received in advance
Subscriptions received in advance represent the amounts received from participants for subscription to
participations of the Fund for the first business day of the next month. Participants are required to deposit the
amounts with the Fund prior to the issuance of participations.
As at 30 June 2018, the subscriptions received in advance amounts to EUR 537,896 (2017: EUR 822,948). On 2
July 2018, the Fund issued 4,179.453 participations of Class A to the subscribing participants.
6. Accrued expenses and other payables
As at 30 June, accrued expenses and other payables consist of the following:
(All amounts in EUR) 2018 2017
Audit fee payable (20,873) (9,983)
Management fee payable (18,996) (16,357)
Administration fee (including annual report fee) payable (12,855) (11,206)
Brokerage fee payable (1,825) (1,575)
FATCA fee payable (1,712) (8,752)
Licence fee payable (1,000) (3,000)
Other payables (436) (251)
Legal owner fee payable - (12,534)
Total accrued expenses and other payables (57,697) (63,658)
Windmill Trend Evolution Fund
Annual Report 2018
Page | 17
Notes to the financial statements
NOTES FOR INDIVIDUAL BALANCE SHEET ITEMS (CONTINUED)
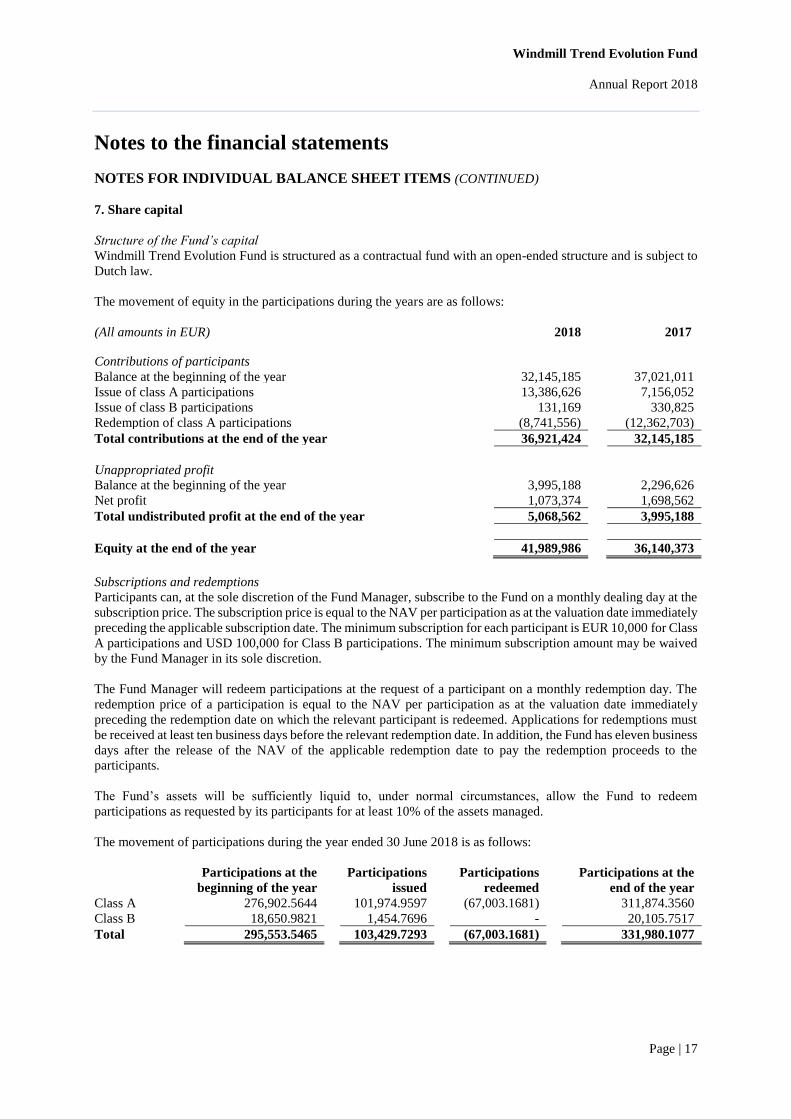
7. Share capital
Structure of the Fund’s capital
Windmill Trend Evolution Fund is structured as a contractual fund with an open-ended structure and is subject to
Dutch law.
The movement of equity in the participations during the years are as follows:
(All amounts in EUR) 2018 2017
Contributions of participants Balance at the beginning of the year 32,145,185 37,021,011
Issue of class A participations 13,386,626 7,156,052
Issue of class B participations 131,169 330,825
Redemption of class A participations (8,741,556) (12,362,703)
Total contributions at the end of the year 36,921,424 32,145,185
Unappropriated profit
Balance at the beginning of the year 3,995,188 2,296,626
Net profit 1,073,374 1,698,562
Total undistributed profit at the end of the year 5,068,562 3,995,188
Equity at the end of the year 41,989,986 36,140,373
Subscriptions and redemptions
Participants can, at the sole discretion of the Fund Manager, subscribe to the Fund on a monthly dealing day at the
subscription price. The subscription price is equal to the NAV per participation as at the valuation date immediately
preceding the applicable subscription date. The minimum subscription for each participant is EUR 10,000 for Class
A participations and USD 100,000 for Class B participations. The minimum subscription amount may be waived
by the Fund Manager in its sole discretion.
The Fund Manager will redeem participations at the request of a participant on a monthly redemption day. The
redemption price of a participation is equal to the NAV per participation as at the valuation date immediately
preceding the redemption date on which the relevant participant is redeemed. Applications for redemptions must
be received at least ten business days before the relevant redemption date. In addition, the Fund has eleven business
days after the release of the NAV of the applicable redemption date to pay the redemption proceeds to the
participants.
The Fund’s assets will be sufficiently liquid to, under normal circumstances, allow the Fund to redeem
participations as requested by its participants for at least 10% of the assets managed.
The movement of participations during the year ended 30 June 2018 is as follows:
Participations at the
beginning of the year
Participations
issued
Participations
redeemed
Participations at the
end of the year
Class A 276,902.5644 101,974.9597 (67,003.1681) 311,874.3560
Class B 18,650.9821 1,454.7696 - 20,105.7517
Total 295,553.5465 103,429.7293 (67,003.1681) 331,980.1077
Windmill Trend Evolution Fund
Annual Report 2018
Page | 18
Notes to the financial statements
NOTES FOR INDIVIDUAL BALANCE SHEET ITEMS (CONTINUED)
7. Share capital (continued)
Subscriptions and redemptions (continued)
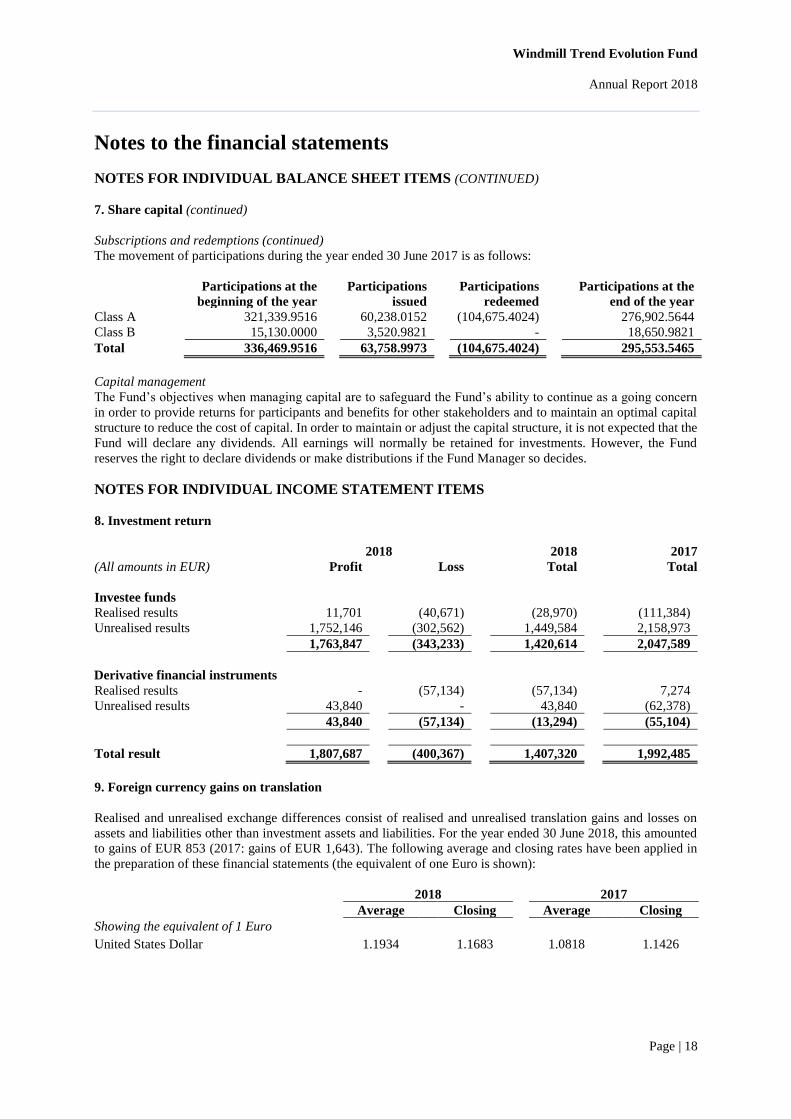
The movement of participations during the year ended 30 June 2017 is as follows:
Participations at the
beginning of the year
Participations
issued
Participations
redeemed
Participations at the
end of the year
Class A 321,339.9516 60,238.0152 (104,675.4024) 276,902.5644
Class B 15,130.0000 3,520.9821 - 18,650.9821
Total 336,469.9516 63,758.9973 (104,675.4024) 295,553.5465
Capital management
The Fund’s objectives when managing capital are to safeguard the Fund’s ability to continue as a going concern
in order to provide returns for participants and benefits for other stakeholders and to maintain an optimal capital
structure to reduce the cost of capital. In order to maintain or adjust the capital structure, it is not expected that the
Fund will declare any dividends. All earnings will normally be retained for investments. However, the Fund
reserves the right to declare dividends or make distributions if the Fund Manager so decides.
NOTES FOR INDIVIDUAL INCOME STATEMENT ITEMS
8. Investment return
2018 2018 2017
(All amounts in EUR) Profit Loss Total Total
Investee funds
Realised results 11,701 (40,671) (28,970) (111,384)
Unrealised results 1,752,146 (302,562) 1,449,584 2,158,973
1,763,847 (343,233) 1,420,614 2,047,589
Derivative financial instruments
Realised results - (57,134) (57,134) 7,274
Unrealised results 43,840 - 43,840 (62,378)
43,840 (57,134) (13,294) (55,104)
Total result 1,807,687 (400,367) 1,407,320 1,992,485
9. Foreign currency gains on translation
Realised and unrealised exchange differences consist of realised and unrealised translation gains and losses on
assets and liabilities other than investment assets and liabilities. For the year ended 30 June 2018, this amounted
to gains of EUR 853 (2017: gains of EUR 1,643). The following average and closing rates have been applied in
the preparation of these financial statements (the equivalent of one Euro is shown):
2018 2017
Average Closing Average Closing
Showing the equivalent of 1 Euro United States Dollar 1.1934 1.1683 1.0818 1.1426
Windmill Trend Evolution Fund
Annual Report 2018
Page | 19
Notes to the financial statements
NOTES FOR INDIVIDUAL INCOME STATEMENT ITEMS (CONTINUED)
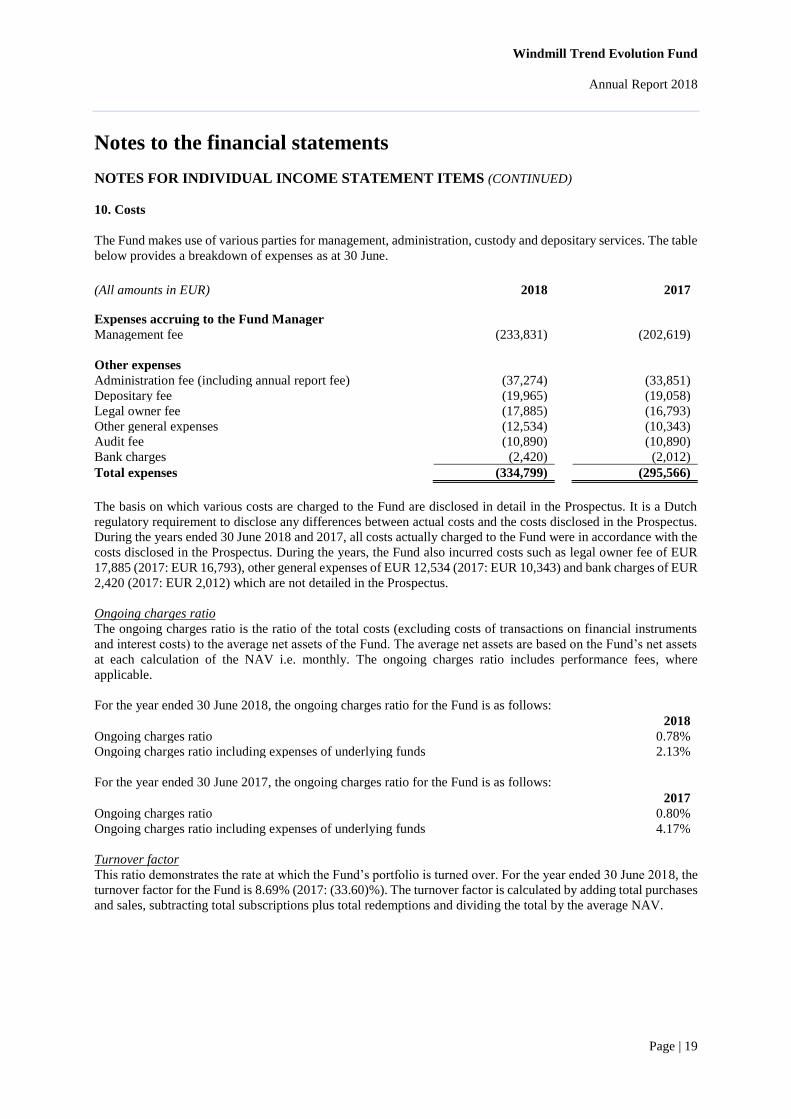
10. Costs
The Fund makes use of various parties for management, administration, custody and depositary services. The table
below provides a breakdown of expenses as at 30 June.
The basis on which various costs are charged to the Fund are disclosed in detail in the Prospectus. It is a Dutch
regulatory requirement to disclose any differences between actual costs and the costs disclosed in the Prospectus.
During the years ended 30 June 2018 and 2017, all costs actually charged to the Fund were in accordance with the
costs disclosed in the Prospectus. During the years, the Fund also incurred costs such as legal owner fee of EUR
17,885 (2017: EUR 16,793), other general expenses of EUR 12,534 (2017: EUR 10,343) and bank charges of EUR
2,420 (2017: EUR 2,012) which are not detailed in the Prospectus.
Ongoing charges ratio
The ongoing charges ratio is the ratio of the total costs (excluding costs of transactions on financial instruments
and interest costs) to the average net assets of the Fund. The average net assets are based on the Fund’s net assets
at each calculation of the NAV i.e. monthly. The ongoing charges ratio includes performance fees, where
applicable.
For the year ended 30 June 2018, the ongoing charges ratio for the Fund is as follows:
For the year ended 30 June 2017, the ongoing charges ratio for the Fund is as follows:
Turnover factor
This ratio demonstrates the rate at which the Fund’s portfolio is turned over. For the year ended 30 June 2018, the
turnover factor for the Fund is 8.69% (2017: (33.60)%). The turnover factor is calculated by adding total purchases
and sales, subtracting total subscriptions plus total redemptions and dividing the total by the average NAV.
(All amounts in EUR) 2018 2017
Expenses accruing to the Fund Manager Management fee (233,831) (202,619)
Other expenses
Administration fee (including annual report fee) (37,274) (33,851)
Depositary fee (19,965) (19,058)
Legal owner fee (17,885) (16,793)
Other general expenses (12,534) (10,343)
Audit fee (10,890) (10,890)
Bank charges (2,420) (2,012)
Total expenses (334,799) (295,566)
2018
Ongoing charges ratio 0.78%
Ongoing charges ratio including expenses of underlying funds 2.13%
2017
Ongoing charges ratio 0.80%
Ongoing charges ratio including expenses of underlying funds 4.17%
Windmill Trend Evolution Fund
Annual Report 2018
Page | 20
Notes to the financial statements
11. RELEVANT CONTRACTS
Fund Manager
Management fee
Privium Fund Management B.V. acts as the Fund Manager to the Fund. The Fund Manager is entitled to a
management fee of 0.55% of the NAV of the Fund (before deduction of management fee), as at the last calendar
day of each month. The management fee is subject to a minimum of EUR 50,000 per annum and is payable monthly
in arrears. The Fund Manager pays a delegation fee to the Delegate from the management fee.
Details of management fees charged for the years are disclosed in the income statement.
Administrator
The Fund has entered into an administration agreement with Custom House Fund Services (Netherlands) B.V. The
Administrator charges a fee based on 0.08% of the NAV of the Fund up to EUR 30 million, 0.06% of the NAV
between EUR 30 million and EUR 50 million, 0.04% of the NAV between EUR 50 million and EUR 100 million
and 0.02% of the NAV above EUR 100 million, to be calculated monthly and paid quarterly in arrears and with a
minimum annual fee of EUR 15,000 per annum. The Administrator also charges a fee of EUR 5,000 per annum
for the preparation of the Fund’s annual report.
In addition, effective 1 February 2015, certain trading duties were transferred from TMF Bewaar B.V. to the
Administrator. The Administrator charges a fee of EUR 250 per initial trade, EUR 175 per subsequent trade and
EUR 75 per tax document required for an underlying investment.
Details of administration fees (including annual report fees) charged for the years are disclosed in the income
statement.
Custom House Fund Services (Netherlands) B.V. provide FATCA services for the fund and charge an annual fee
of USD 4,000.
Depositary
Darwin Depositary Services B.V. charges a fee of 1.4 basis points of the assets under management. This fee is
subject to a minimum of EUR 16,500 per annum and is payable quarterly in advance.
Independent Auditor
The Fund appointed Ernst & Young Accountants LLP as the Independent Auditor. The Independent Auditor’s
remuneration consists of EUR 10,890 (2017: EUR 10,890) audit fee for the audit of the financial statements. The
Independent Auditor does not provide any non-audit services or other audit services to the Fund.
12. RELATED PARTY TRANSACTIONS
Related party transactions are transfers of resources, services or obligations between related parties and the Fund,
regardless of whether a price has been charged. Parties are considered to be related if one party has the ability to
control the other party or exercise significant influence over the other party in making financial or operational
decisions or is part of key management of the Fund. The following provides details on the related parties of the
Fund and transactions with the related parties.
The Fund Manager is considered a related party.
Windmill Trend Evolution Fund
Annual Report 2018
Page | 21
Notes to the financial statements
12. RELATED PARTY TRANSACTIONS (CONTINUED)
The following transactions occurred between the Fund and the Fund Manager during the reporting years.
Transactions from 1 July 2017 to 30 June 2018 and balances as at 30 June 2018
Paid Balance
EUR EUR
Management fee (231,192) (18,996)
Transactions from 1 July 2016 to 30 June 2017 and balances as at 30 June 2017
Paid Balance
EUR EUR
Management fee (200,140) (16,357)
The Delegate is also considered a related party. As at 30 June 2018, the Investment Advisor and/or its employees
held 4,758.0351 Class A shares in the Fund (2017: 6,838.2538) and 256.5200 Class B shares in the Fund (2017:
152.7056).
13. FINANCIAL INVESTMENTS AND ASSOCIATED RISKS
The Fund’s investment objective is to achieve medium-term capital gains for the participants.
The Fund attempts to accomplish its objective by primarily investing in AHL shares issued from the AHL Fund
and may acquire interests in other investee funds established worldwide mainly focused on similar innovative
systematic strategies that invest outside the mainstream markets.
The Fund’s activities expose it to a variety of financial risks: market risk (including market price risk, currency
risk and interest rate risk), credit risk and liquidity risk.
The investee funds, to which the fund subscribes, may also indirectly expose the Fund to the financial risks as
detailed above and because of this indirect exposure the financial risks discussed herein may not fully indicate the
total exposure of the Fund.
Market risk
Market risk is the risk that the fair value or future cash flows of a financial instrument will fluctuate as a result of
changes in market prices whether those changes are caused by factors specific to the individual security or its
issuer or factors affecting all securities traded in the market. Market risk comprises interest rate risk, currency risk
and market price risk. The Fund’s exposure to market risk relates to the Fund’s investment in investee funds.
Interest rate risk
Interest rate risk is the risk that the fair value or future cash flows of a financial instrument will fluctuate because
of changes in market interest rates. The Fund has no interest bearing financial instruments except for cash at bank
which is subject to normal market related short-term interest rates. Therefore, the Fund is not exposed to significant
interest rate risks.
Currency risk
Currency risk is the risk that the fair value or future cash flows of a financial instrument will fluctuate because of
changes in foreign exchange rates. Currency risk exposure arises from the Fund investing in financial instruments
and entering into transactions which are denominated in currencies other than its functional currency.
As at 30 June 2018, 100% (2017: 100%) of the assets and liabilities of the Fund are denominated in the functional
currency and therefore the Fund is not exposed to currency risk from its assets and liabilities as at the reporting
dates.
Windmill Trend Evolution Fund
Annual Report 2018
Page | 22
Notes to the financial statements
13. FINANCIAL INVESTMENTS AND ASSOCIATED RISKS (CONTINUED)
Market risk (continued)
Currency risk (continued)
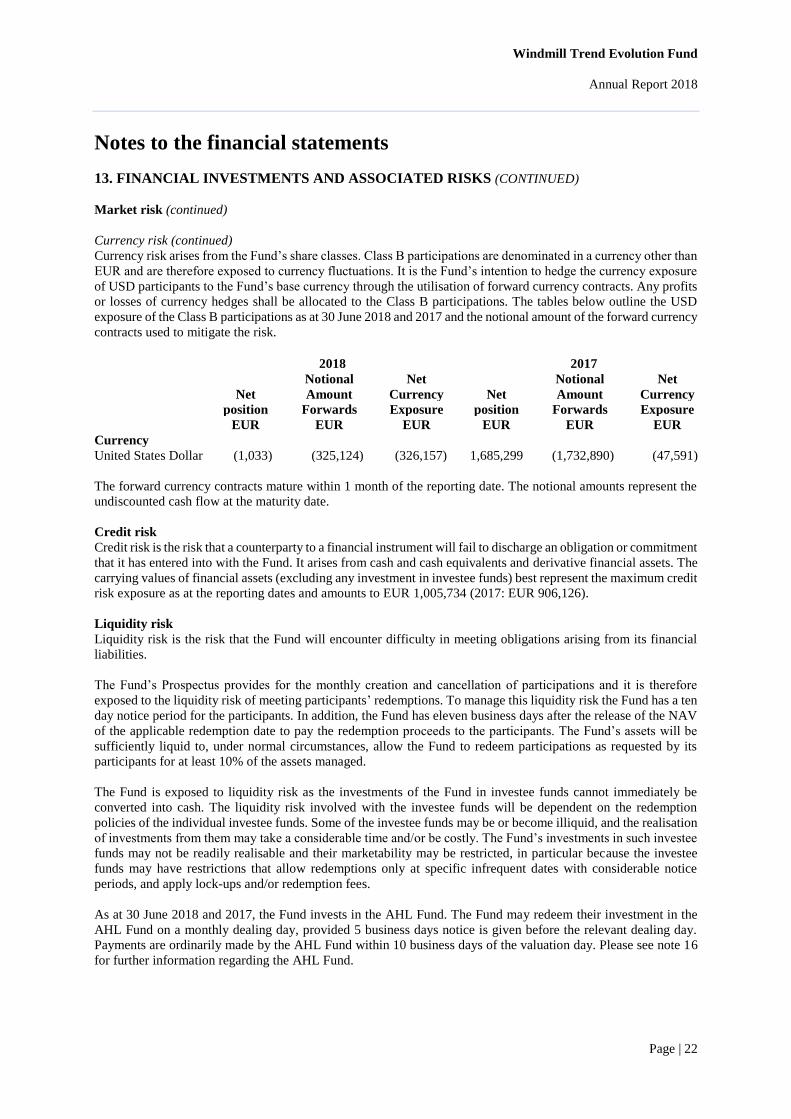
Currency risk arises from the Fund’s share classes. Class B participations are denominated in a currency other than
EUR and are therefore exposed to currency fluctuations. It is the Fund’s intention to hedge the currency exposure
of USD participants to the Fund’s base currency through the utilisation of forward currency contracts. Any profits
or losses of currency hedges shall be allocated to the Class B participations. The tables below outline the USD
exposure of the Class B participations as at 30 June 2018 and 2017 and the notional amount of the forward currency
contracts used to mitigate the risk.
The forward currency contracts mature within 1 month of the reporting date. The notional amounts represent the
undiscounted cash flow at the maturity date.
Credit risk
Credit risk is the risk that a counterparty to a financial instrument will fail to discharge an obligation or commitment
that it has entered into with the Fund. It arises from cash and cash equivalents and derivative financial assets. The
carrying values of financial assets (excluding any investment in investee funds) best represent the maximum credit
risk exposure as at the reporting dates and amounts to EUR 1,005,734 (2017: EUR 906,126).
Liquidity risk
Liquidity risk is the risk that the Fund will encounter difficulty in meeting obligations arising from its financial
liabilities.
The Fund’s Prospectus provides for the monthly creation and cancellation of participations and it is therefore
exposed to the liquidity risk of meeting participants’ redemptions. To manage this liquidity risk the Fund has a ten
day notice period for the participants. In addition, the Fund has eleven business days after the release of the NAV
of the applicable redemption date to pay the redemption proceeds to the participants. The Fund’s assets will be
sufficiently liquid to, under normal circumstances, allow the Fund to redeem participations as requested by its
participants for at least 10% of the assets managed.
The Fund is exposed to liquidity risk as the investments of the Fund in investee funds cannot immediately be
converted into cash. The liquidity risk involved with the investee funds will be dependent on the redemption
policies of the individual investee funds. Some of the investee funds may be or become illiquid, and the realisation
of investments from them may take a considerable time and/or be costly. The Fund’s investments in such investee
funds may not be readily realisable and their marketability may be restricted, in particular because the investee
funds may have restrictions that allow redemptions only at specific infrequent dates with considerable notice
periods, and apply lock-ups and/or redemption fees.
As at 30 June 2018 and 2017, the Fund invests in the AHL Fund. The Fund may redeem their investment in the
AHL Fund on a monthly dealing day, provided 5 business days notice is given before the relevant dealing day.
Payments are ordinarily made by the AHL Fund within 10 business days of the valuation day. Please see note 16
for further information regarding the AHL Fund.
2018 2017
Notional Net Notional Net
Net Amount Currency Net Amount Currency
position Forwards Exposure position Forwards Exposure
EUR EUR EUR EUR EUR EUR
Currency
United States Dollar (1,033) (325,124) (326,157) 1,685,299 (1,732,890) (47,591)
Windmill Trend Evolution Fund
Annual Report 2018
Page | 23
Notes to the financial statements
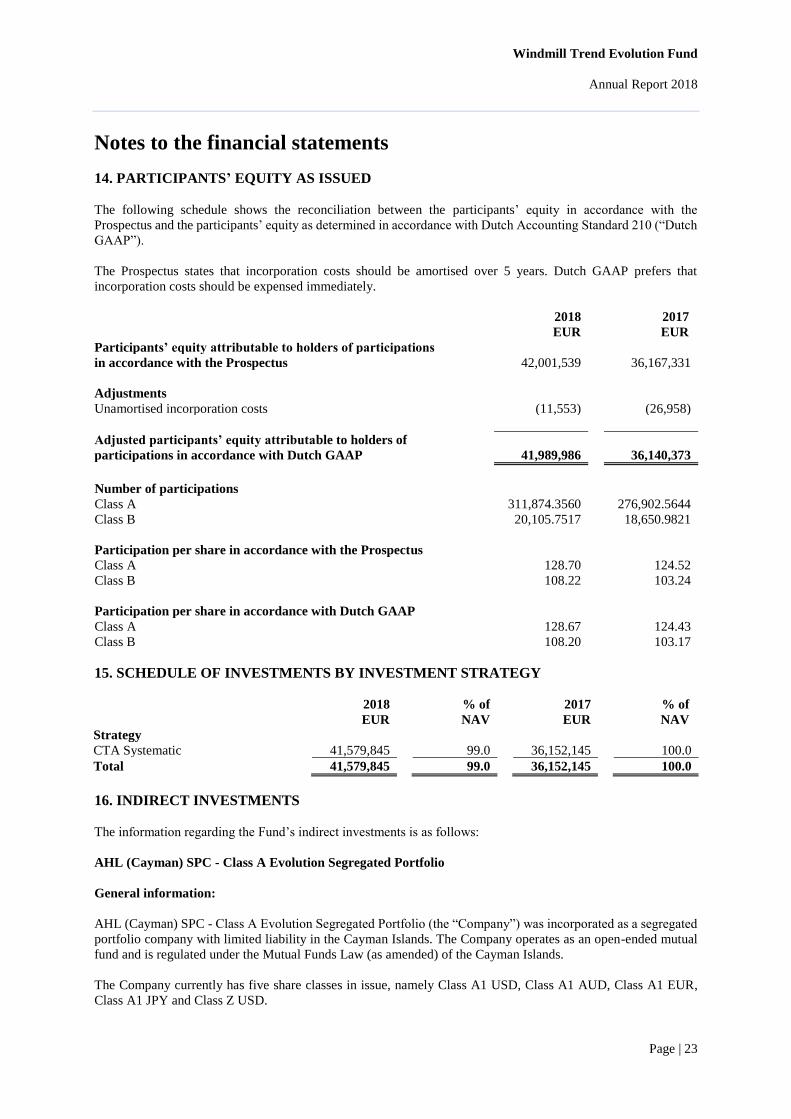
14. PARTICIPANTS’ EQUITY AS ISSUED
The following schedule shows the reconciliation between the participants’ equity in accordance with the
Prospectus and the participants’ equity as determined in accordance with Dutch Accounting Standard 210 (“Dutch
GAAP”).
The Prospectus states that incorporation costs should be amortised over 5 years. Dutch GAAP prefers that
incorporation costs should be expensed immediately.
2018 2017
EUR EUR
Participants’ equity attributable to holders of participations in accordance with the Prospectus 42,001,539 36,167,331
Adjustments
Unamortised incorporation costs (11,553) (26,958)
Adjusted participants’ equity attributable to holders of
participations in accordance with Dutch GAAP 41,989,986 36,140,373
Number of participations
Class A 311,874.3560 276,902.5644
Class B 20,105.7517 18,650.9821
Participation per share in accordance with the Prospectus
Class A 128.70 124.52
Class B 108.22 103.24
Participation per share in accordance with Dutch GAAP
Class A 128.67 124.43
Class B 108.20 103.17
15. SCHEDULE OF INVESTMENTS BY INVESTMENT STRATEGY
2018 % of 2017 % of
EUR NAV EUR NAV
Strategy
CTA Systematic 41,579,845 99.0 36,152,145 100.0
Total 41,579,845 99.0 36,152,145 100.0
16. INDIRECT INVESTMENTS
The information regarding the Fund’s indirect investments is as follows:
AHL (Cayman) SPC - Class A Evolution Segregated Portfolio
General information:
AHL (Cayman) SPC - Class A Evolution Segregated Portfolio (the “Company”) was incorporated as a segregated
portfolio company with limited liability in the Cayman Islands. The Company operates as an open-ended mutual
fund and is regulated under the Mutual Funds Law (as amended) of the Cayman Islands.
The Company currently has five share classes in issue, namely Class A1 USD, Class A1 AUD, Class A1 EUR,
Class A1 JPY and Class Z USD.
Windmill Trend Evolution Fund
Annual Report 2018
Page | 24
Notes to the financial statements
16. INDIRECT INVESTMENTS (CONTINUED)
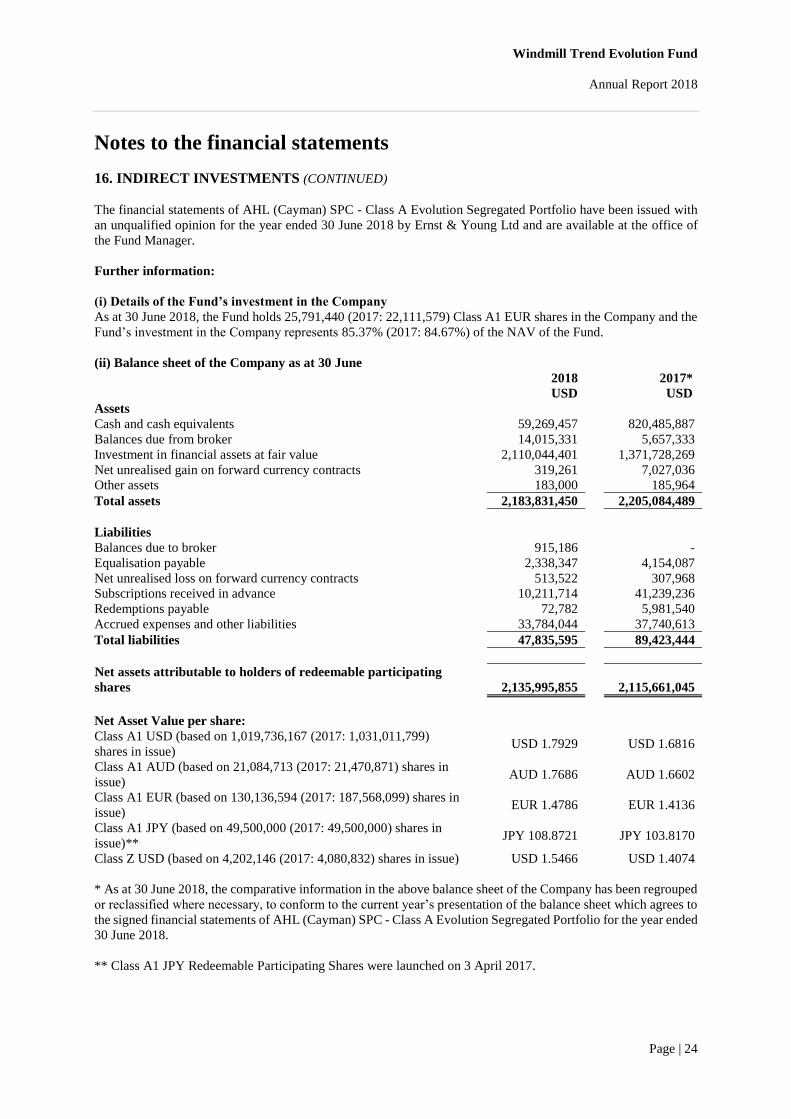
The financial statements of AHL (Cayman) SPC - Class A Evolution Segregated Portfolio have been issued with
an unqualified opinion for the year ended 30 June 2018 by Ernst & Young Ltd and are available at the office of
the Fund Manager.
Further information:
(i) Details of the Fund’s investment in the Company
As at 30 June 2018, the Fund holds 25,791,440 (2017: 22,111,579) Class A1 EUR shares in the Company and the
Fund’s investment in the Company represents 85.37% (2017: 84.67%) of the NAV of the Fund.
(ii) Balance sheet of the Company as at 30 June 2018 2017* USD USD
Assets
Cash and cash equivalents 59,269,457 820,485,887
Balances due from broker 14,015,331 5,657,333
Investment in financial assets at fair value 2,110,044,401 1,371,728,269
Net unrealised gain on forward currency contracts 319,261 7,027,036
Other assets 183,000 185,964
Total assets 2,183,831,450 2,205,084,489
Liabilities
Balances due to broker 915,186 -
Equalisation payable 2,338,347 4,154,087
Net unrealised loss on forward currency contracts 513,522 307,968
Subscriptions received in advance 10,211,714 41,239,236
Redemptions payable 72,782 5,981,540
Accrued expenses and other liabilities 33,784,044 37,740,613
Total liabilities 47,835,595 89,423,444
Net assets attributable to holders of redeemable participating
shares
2,135,995,855
2,115,661,045
Net Asset Value per share:
Class A1 USD (based on 1,019,736,167 (2017: 1,031,011,799)
shares in issue) USD 1.7929 USD 1.6816
Class A1 AUD (based on 21,084,713 (2017: 21,470,871) shares in
issue) AUD 1.7686 AUD 1.6602
Class A1 EUR (based on 130,136,594 (2017: 187,568,099) shares in
issue) EUR 1.4786 EUR 1.4136
Class A1 JPY (based on 49,500,000 (2017: 49,500,000) shares in
issue)** JPY 108.8721 JPY 103.8170
Class Z USD (based on 4,202,146 (2017: 4,080,832) shares in issue) USD 1.5466 USD 1.4074
* As at 30 June 2018, the comparative information in the above balance sheet of the Company has been regrouped
or reclassified where necessary, to conform to the current year’s presentation of the balance sheet which agrees to
the signed financial statements of AHL (Cayman) SPC - Class A Evolution Segregated Portfolio for the year ended
30 June 2018.
** Class A1 JPY Redeemable Participating Shares were launched on 3 April 2017.
Windmill Trend Evolution Fund
Annual Report 2018
Page | 25
Notes to the financial statements
16. INDIRECT INVESTMENTS (CONTINUED)
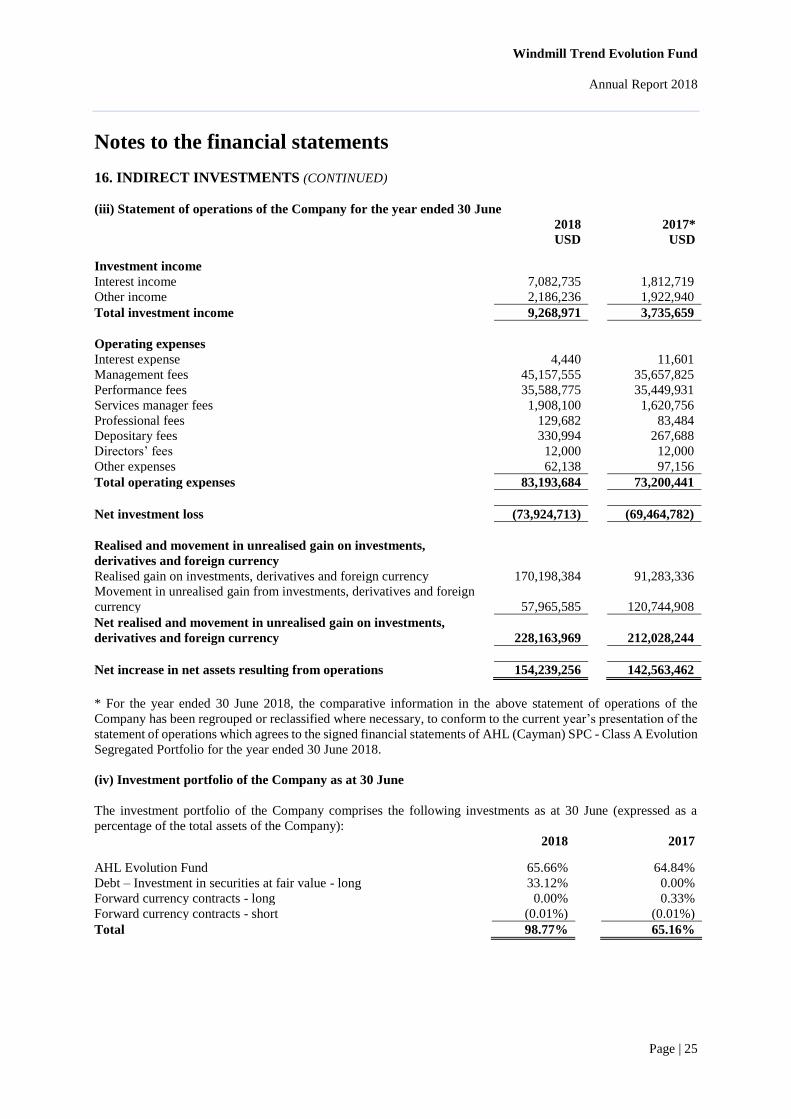
(iii) Statement of operations of the Company for the year ended 30 June 2018 2017* USD USD
Investment income
Interest income 7,082,735 1,812,719
Other income 2,186,236 1,922,940
Total investment income 9,268,971 3,735,659
Operating expenses
Interest expense 4,440 11,601
Management fees 45,157,555 35,657,825
Performance fees 35,588,775 35,449,931
Services manager fees 1,908,100 1,620,756
Professional fees 129,682 83,484
Depositary fees 330,994 267,688
Directors’ fees 12,000 12,000
Other expenses 62,138 97,156
Total operating expenses 83,193,684 73,200,441
Net investment loss (73,924,713) (69,464,782)
Realised and movement in unrealised gain on investments,
derivatives and foreign currency
Realised gain on investments, derivatives and foreign currency 170,198,384 91,283,336
Movement in unrealised gain from investments, derivatives and foreign
currency 57,965,585 120,744,908
Net realised and movement in unrealised gain on investments,
derivatives and foreign currency 228,163,969
212,028,244
Net increase in net assets resulting from operations 154,239,256 142,563,462
* For the year ended 30 June 2018, the comparative information in the above statement of operations of the
Company has been regrouped or reclassified where necessary, to conform to the current year’s presentation of the
statement of operations which agrees to the signed financial statements of AHL (Cayman) SPC - Class A Evolution
Segregated Portfolio for the year ended 30 June 2018.
(iv) Investment portfolio of the Company as at 30 June
The investment portfolio of the Company comprises the following investments as at 30 June (expressed as a
percentage of the total assets of the Company): 2018 2017
AHL Evolution Fund 65.66% 64.84%
Debt – Investment in securities at fair value - long 33.12% 0.00%
Forward currency contracts - long 0.00% 0.33%
Forward currency contracts - short (0.01%) (0.01%)
Total 98.77% 65.16%
Windmill Trend Evolution Fund
Annual Report 2018
Page | 26
Notes to the financial statements
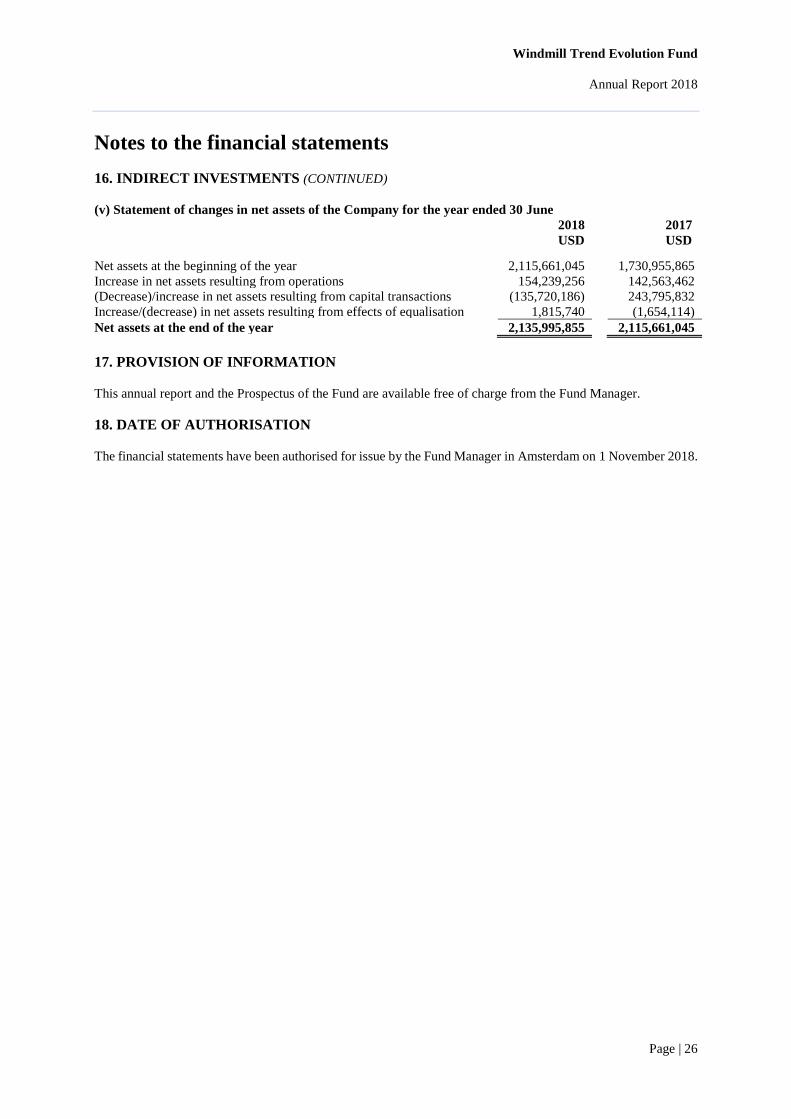
16. INDIRECT INVESTMENTS (CONTINUED)
(v) Statement of changes in net assets of the Company for the year ended 30 June 2018 2017 USD USD
Net assets at the beginning of the year 2,115,661,045 1,730,955,865
Increase in net assets resulting from operations 154,239,256 142,563,462
(Decrease)/increase in net assets resulting from capital transactions (135,720,186) 243,795,832
Increase/(decrease) in net assets resulting from effects of equalisation 1,815,740 (1,654,114)
Net assets at the end of the year 2,135,995,855 2,115,661,045
17. PROVISION OF INFORMATION
This annual report and the Prospectus of the Fund are available free of charge from the Fund Manager.
18. DATE OF AUTHORISATION
The financial statements have been authorised for issue by the Fund Manager in Amsterdam on 1 November 2018.
Windmill Trend Evolution Fund
Annual Report 2018
Page | 27
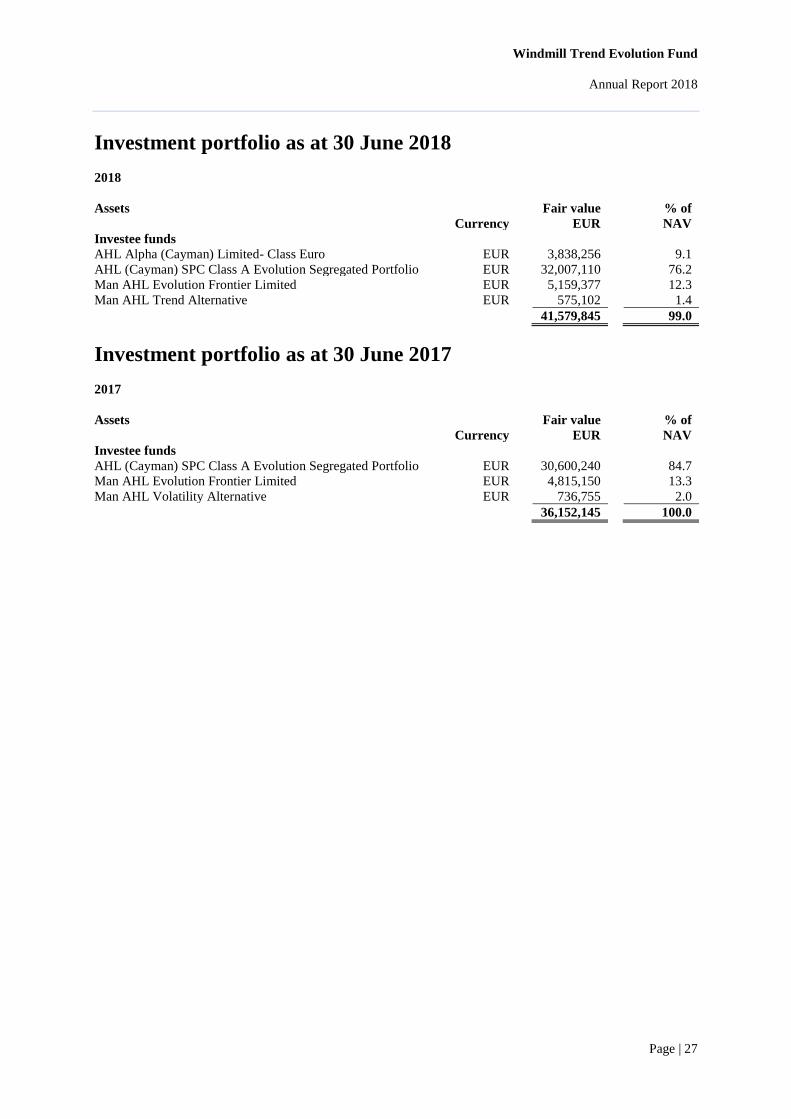
Investment portfolio as at 30 June 2018
2018
Assets Fair value % of
Currency EUR NAV
Investee funds AHL Alpha (Cayman) Limited- Class Euro EUR 3,838,256 9.1
AHL (Cayman) SPC Class A Evolution Segregated Portfolio EUR 32,007,110 76.2
Man AHL Evolution Frontier Limited EUR 5,159,377 12.3
Man AHL Trend Alternative EUR 575,102 1.4
41,579,845 99.0
Investment portfolio as at 30 June 2017
2017
Assets Fair value % of
Currency EUR NAV
Investee funds AHL (Cayman) SPC Class A Evolution Segregated Portfolio EUR 30,600,240 84.7
Man AHL Evolution Frontier Limited EUR 4,815,150 13.3
Man AHL Volatility Alternative EUR 736,755 2.0
36,152,145 100.0

Windmill Trend Evolution Fund
Annual Report 2018
Page | 28
Other information
Provisions of the Prospectus on distribution policy
The Fund Manager shall have sole discretion whether to distribute any income of the Fund or whether to retain it
within the Fund. Any amounts which it determines to distribute shall be paid to participants pro rata to the number
of participations held by each of them.
Interests held by the Directors
As at 30 June 2018 and 2017, none of the Directors of the Fund Manager hold shares in the Fund.
Events after the balance sheet date
There were no material events which occurred after the balance sheet date that could influence the transparency of
these financial statements.
Page | 29
Independent auditor’s report
To: The shareholders and the directors of Privium Fund Management B.V. as investment manager of
Windmill Trend Evolution Fund.
Report on the audit of the financial statements for the year ended 30 June 2018 included in the
annual report
Our opinion
We have audited the financial statements for the year ended 30 June 2018 of Windmill Trend Evolution Fund,
based in Amsterdam, The Netherlands.
In our opinion the accompanying financial statements give a true and fair view of the financial position of Windmill
Trend Evolution Fund as at 30 June 2018, and of its result and its cash flows for the period ending on 30 June 2018
in accordance with Part 9 of Book 2 of the Dutch Civil Code.
The financial statements comprise:
• The Financial statements as at 30 June 2018
• The following statements for the period ending on 30 June 2018: Profit and loss statement and cash flow
statement
• The notes comprising a summary of the significant accounting policies and other explanatory information
Basis for our opinion
We conducted our audit in accordance with Dutch law, including the Dutch Standards on Auditing.
Our responsibilities under those standards are further described in the Our responsibilities for the audit of the
financial statements section of our report.
We are independent of Windmill Trend Evolution Fund in accordance with the Wet toezicht
accountantsorganisaties (Wta, Audit firms supervision act), the Verordening inzake de onafhankelijkheid van
accountants bij assurance-opdrachten (ViO, Code of Ethics for Professional Accountants, a regulation with respect
to independence) and other relevant independence regulations in the Netherlands. Furthermore we have complied
with the Verordening gedrags- en beroepsregels accountants (VGBA, Dutch Code of Ethics).
We believe the audit evidence we have obtained is sufficient and appropriate to provide a basis for our opinion.
Report on other information included in the annual report
In addition to the financial statements and our auditor’s report thereon, the annual report contains other information
that consists of:
• Management Report
• Other information pursuant to Part 9 of Book 2 of the Dutch Civil Code
• General information
Based on the following procedures performed, we conclude that the other information:
• Is consistent with the financial statements and does not contain material misstatements
• Contains the information as required by Part 9 of Book 2 of the Dutch Civil Code
We have read the other information. Based on our knowledge and understanding obtained through our audit of the
financial statements or otherwise, we have considered whether the other information contains material
misstatements. By performing these procedures, we comply with the requirements of Part 9 of Book 2 of the Dutch
Civil Code and the Dutch Standard 720. The scope of the procedures performed is substantially less than the scope
of those performed in our audit of the financial statements.
Page | 30
Independent auditor’s report (continued)
Report on other information included in the annual report (continued)
The board of directors is responsible for the preparation of the other information, including the board of director’s
report in accordance with Part 9 of Book 2 of the Dutch Civil Code and other information pursuant to Part 9 of
Book 2 of the Dutch Civil Code.
Description of responsibilities for the financial statements
Responsibilities of the board of directors for the financial statements
The board of directors of the investment entity is responsible for the preparation and fair presentation of the
financial statements in accordance with Part 9 of Book 2 of the Dutch Civil Code. Furthermore, the board of
directors is responsible for such internal control as the board of directors determines is necessary to enable the
preparation of the financial statements that are free from material misstatement, whether due to fraud or error.
As part of the preparation of the financial statements, the manager is responsible for assessing the investment
entity’s ability to continue as a going concern. Based on the financial reporting framework mentioned, the manager
should prepare the financial statements using the going concern basis of accounting unless the manager either
intends to liquidate the investment entity or to cease operations, or has no realistic alternative but to do so. The
manager should disclose events and circumstances that may cast significant doubt on the investment entity’s ability
to continue as a going concern in the financial statements.
Our responsibilities for the audit of the financial statements
Our objective is to plan and perform the audit assignment in a manner that allows us to obtain sufficient and
appropriate audit evidence for our opinion.
Our audit has been performed with a high, but not absolute, level of assurance, which means we may not have
detected all material errors and fraud.
Misstatements can arise from fraud or error and are considered material if, individually or in the aggregate, they
could reasonably be expected to influence the economic decisions of users taken on the basis of these financial
statements. The materiality affects the nature, timing and extent of our audit procedures and the evaluation of the
effect of identified misstatements on our opinion.
We have exercised professional judgment and have maintained professional skepticism throughout the audit, in
accordance with Dutch Standards on Auditing, ethical requirements and independence requirements. Our audit
included e.g.:
• Identifying and assessing the risks of material misstatement of the financial statements, whether due to fraud
or error, designing and performing audit procedures responsive to those risks, and obtaining audit evidence that
is sufficient and appropriate to provide a basis for our opinion. The risk of not detecting a material misstatement
resulting from fraud is higher than for one resulting from error, as fraud may involve collusion, forgery,
intentional omissions, misrepresentations, or the override of internal control
• Obtaining an understanding of internal control relevant to the audit in order to design audit procedures that are
appropriate in the circumstances, but not for the purpose of expressing an opinion on the effectiveness of the
investment entity’s internal control
• Evaluating the appropriateness of accounting policies used and the reasonableness of accounting estimates and
related disclosures made by the board of directors
Page | 31
Independent auditor’s report (continued)
Description of responsibilities for the financial statements (continued)
Our responsibilities for the audit of the financial statements (continued)
• Concluding on the appropriateness of the board of director’s use of the going concern basis of accounting, and
based on the audit evidence obtained, whether a material uncertainty exists related to events or conditions that
may cast significant doubt on the investment entity’s ability to continue as a going concern. If we conclude that
a material uncertainty exists, we are required to draw attention in our auditor’s report to the related disclosures
in the financial statements or, if such disclosures are inadequate, to modify our opinion. Our conclusions are
based on the audit evidence obtained up to the date of our auditor’s report. However, future events or conditions
may cause an investment entity to cease to continue as a going concern
• Evaluating the overall presentation, structure and content of the financial statements, including the disclosures
• Evaluating whether the financial statements represent the underlying transactions and events in a manner that
achieves fair presentation
We communicate with the board of directors regarding, among other matters, the planned scope and timing of the
audit and significant audit findings, including any significant findings in internal control that we identify during
our audit.
The Hague, 1 November 2018
Ernst & Young Accountants LLP
signed by R.J. Bleijs