MIRROR-MIRROR · Title: MIRROR-MIRROR Author: Dave Created Date: 4/20/2020 2:53:19 PM
38 Int. J. Vehicle Noise and Vibration, Vol. 14, No. 1, 2018
Copyright © 2018 Inderscience Enterprises Ltd.
Wind noise from A-pillar and side view mirror of a realistic generic car model, DriAver
Mohamed Sukri Mat Ali* Wind Engineering Laboratory, Malaysia-Japan International Institute of Technology (MJIIT), Universiti Teknologi Malaysia, Kuala Lumpur, 54100, Malaysia Fax: +603-2203-1266 Email: [email protected] *Corresponding author
Jafirdaus Jalasabri and Anwar Mohd Sood Computational Fluid Dynamics, CAE, Vehicle Integration and Analysis, Proton Holdings Berhad, Shah Alam, 40918, Malaysia Fax: +603-5102-6146 Email: [email protected] Email: [email protected]
Shuhaimi Mansor Faculty of Mechanical Engineering, Universiti Teknologi Malaysia, UTM Skudai, Johor, 81310, Malaysia Fax: +607-555-7097 Email: [email protected]
Haziqah Shaharuddin Wind Engineering Laboratory, Malaysia-Japan International Institute of Technology (MJIIT), Universiti Teknologi Malaysia, Kuala Lumpur, 54100, Malaysia Fax: +603-2203-1266 Email: [email protected]

Wind noise from A-pillar and side view mirror 39
Sallehuddin Muhamad Engineering Department, Razak School of Engineering and Advanced Technology, Universiti Teknologi Malaysia, Kuala Lumpur, 54100, Malaysia Fax: +603-2180-5380 Email: [email protected]
Abstract: Interior noise of a production car is a total contribution mainly from engine, tyres and aerodynamics. At high speed, wind noise can dominate the total interior noise. Wind noise is associated with the unsteadiness of the flow. For most production cars, A-pillar and side view mirror are the regions where the highly separated and turbulent flows are observed. This study quantifies the wind noise contribution from A-pillar and side view mirror with respect to the interior noise of a generic realistic model, DrivAer. The noise sources are obtained numerically from the flow-structure interactions based on the unsteady Reynolds averaged Navier stokes (URANS) while the noise propagation is estimated using Curle’s equation of Lighthill acoustic analogy. The sound pressure frequency spectrum of the interior noise is obtained by considering the sound transmission loss from the side glass by using the mass law for transmission loss. The study found that the noise from the A-pillar is higher than the noise from the side view mirror in the whole frequency range. Near the end of the A-pillar component contributes the highest radiated noise level with up to 20 dB louder than that at the front part of the A-pillar.
Keywords: DrivAer; A-pillar; side view mirror; wind noise.
Reference to this paper should be made as follows: Ali, M.S.M., Jalasabri, J., Sood, A.M., Mansor, S., Shaharuddin, H. and Muhamad, S. (2018) ‘Wind noise from A-pillar and side view mirror of a realistic generic car model, DriAver’, Int. J. Vehicle Noise and Vibration, Vol. 14, No. 1, pp.38–61.
Biographical notes: Mohamed Sukri Mat Ali received his PhD in Mechanical Engineering at the University of Adelaide. He is a Senior Lecturer at the Malaysia-Japan International Institute of Technology, UTM. His research interests include flow and noise on bluff bodies, flow induced vibration for energy harvesting system, and also aerodynamic issues related to the safety of high speed trains.
Jafirdaus Jalasabri is a CAE Engineer at the Proton Sdn. Bhd. He received his Bachelor degree from the Universiti Putra Malaysia (UPM). He has been involved significantly in new developments of many new Proton cars. His research interests include design of experiments and vehicle wind noise. He has expertise in computational fluids dynamics (CFD) using commercial and open source software. Currently, he is writing a code for aeroacoustics performance using Octave GNU. He also published papers related to CFD, including in the aeronautics field.
Anwar Mohd Sood received his Master’s degree from the Islamic International University Malaysia (IIUM). His Master degree project is on Drag Reductions of Passenger Cars. He is currently the Lead Engineer of CFD Group at Proton Sdn. Bhd. He has also involved significantly in new developments of many new Proton cars. He has a strong passion on aerodynamic issues related to cars. He is expert in computational fluids dynamics, with an experience of more than ten years.
40 M.S.M. Ali et al.
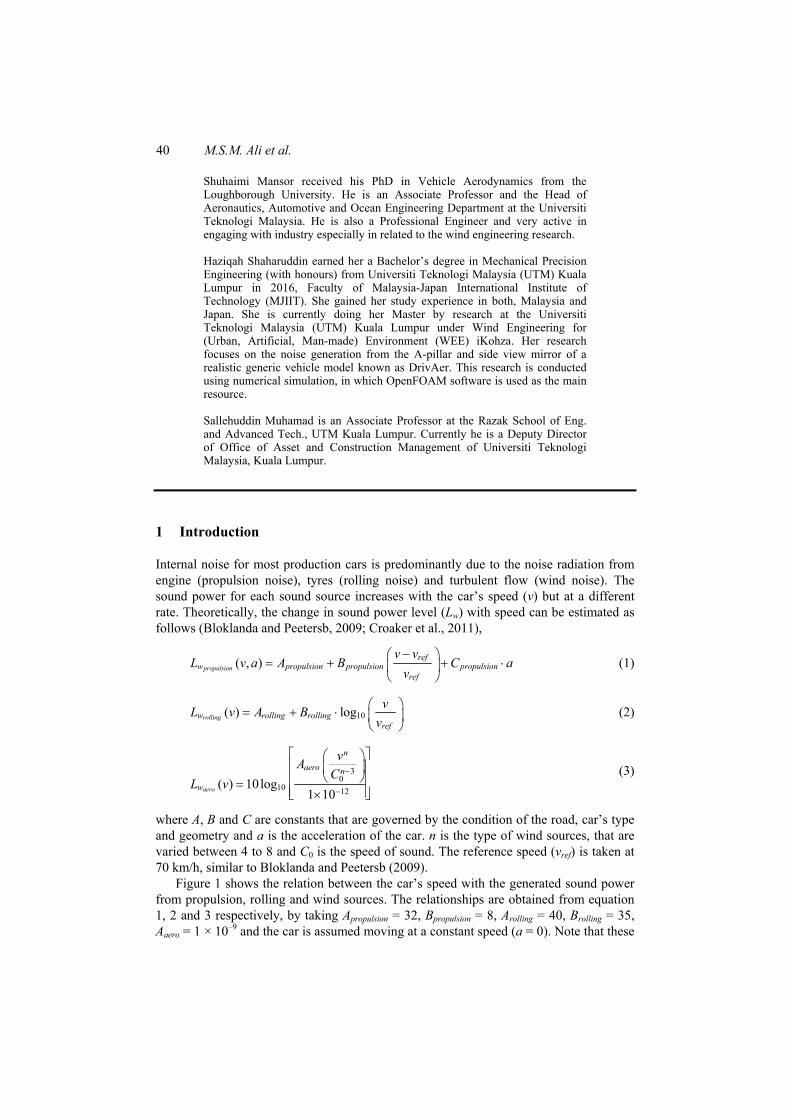
Shuhaimi Mansor received his PhD in Vehicle Aerodynamics from the Loughborough University. He is an Associate Professor and the Head of Aeronautics, Automotive and Ocean Engineering Department at the Universiti Teknologi Malaysia. He is also a Professional Engineer and very active in engaging with industry especially in related to the wind engineering research.
Haziqah Shaharuddin earned her a Bachelor’s degree in Mechanical Precision Engineering (with honours) from Universiti Teknologi Malaysia (UTM) Kuala Lumpur in 2016, Faculty of Malaysia-Japan International Institute of Technology (MJIIT). She gained her study experience in both, Malaysia and Japan. She is currently doing her Master by research at the Universiti Teknologi Malaysia (UTM) Kuala Lumpur under Wind Engineering for (Urban, Artificial, Man-made) Environment (WEE) iKohza. Her research focuses on the noise generation from the A-pillar and side view mirror of a realistic generic vehicle model known as DrivAer. This research is conducted using numerical simulation, in which OpenFOAM software is used as the main resource.
Sallehuddin Muhamad is an Associate Professor at the Razak School of Eng. and Advanced Tech., UTM Kuala Lumpur. Currently he is a Deputy Director of Office of Asset and Construction Management of Universiti Teknologi Malaysia, Kuala Lumpur.
1 Introduction
Internal noise for most production cars is predominantly due to the noise radiation from engine (propulsion noise), tyres (rolling noise) and turbulent flow (wind noise). The sound power for each sound source increases with the car’s speed (v) but at a different rate. Theoretically, the change in sound power level (Lw) with speed can be estimated as follows (Bloklanda and Peetersb, 2009; Croaker et al., 2011),
( , )propulsionref
w propulsion propulsion propulsionref
v vL v a A B C a
v (1)
10( ) logrollingw rolling rollingref
vL v A Bv
(2)
30
10 12( ) 10log
1 10aero
n
aero n
w
vAC
L v (3)
where A, B and C are constants that are governed by the condition of the road, car’s type and geometry and a is the acceleration of the car. n is the type of wind sources, that are varied between 4 to 8 and C0 is the speed of sound. The reference speed (vref) is taken at 70 km/h, similar to Bloklanda and Peetersb (2009).
Figure 1 shows the relation between the car’s speed with the generated sound power from propulsion, rolling and wind sources. The relationships are obtained from equation 1, 2 and 3 respectively, by taking Apropulsion = 32, Bpropulsion = 8, Arolling = 40, Brolling = 35, Aaero = 1 × 10⁻⁹ and the car is assumed moving at a constant speed (a = 0). Note that these

Wind noise from A-pillar and side view mirror 41
values are just estimation for a typical production car and the values vary between car types and also between various road and wind conditions. However, the trends of the sound power levels are the same for most production cars, where the sound power from the wind noise is increasingly dominant at high speed (> 80 km/h). If the rolling noise is further reduced by using low rolling noise tyres, wind noise is the major contribution to the internal noise level. The important for reducing wind noise for vehicle comfort is also discussed by Wang (2010). Thus, investigation on the noise due to the wind is the focus of the current study.
Figure 1 A typical sound power level (dB) for most production cars as a function of car’s speed (see online version for colours)
At high speed, the flow around the car is fully turbulent. The flow is complex and always fluctuating. It is the nature of flow over bluff bodies, where flow separations induce free shear layers that are unsteady. These shear layers may reattach to the body and whirl downstream as a large scale eddy. It is well known that flow separations and vortex flows are potential aerodynamic noise sources (Stapleford and Carr, 1970; Stapleford, 1970; Buchheim et al., 1982). Gloerfelt (2009) divides the aerodynamic noise mechanisms on a car into four parts:
1 wind noise from fluctuating forces acting on bluff body components (side view mirror, A-pillar, wipers, etc.)
2 cavity noise from small gaps (sunroof, open glass window, door-body gap, rain gutter, etc.)
3 boundary layer noise from wall (windshield, glass window, roof, etc.)
4 fan noise and ducting noise (engine cooling system, blowers, axial fans, etc.).
Bluff body components (side view mirror, wipers and aerial) attached to the main body of the production cars are an efficient vortex generator. The flow separations on the bluff body components initiate free shear layers that roll downstream and forming von Kármán

42 M.S.M. Ali et al.
vortices. The periodic formation of the vortices generates fluctuating aerodynamic forces acting on the bluff body components. Referring to the Curle’s (1955) analogy, fluctuating aerodynamic forces is a dipole sound source. Thus, the sound frequency peak corresponds to the vortex shedding frequency (St = ftonalD / U∞, where D is the diameter of the side view mirror). For turbulent flow over an isolated side view mirror, the corresponding tonal noise is at a low frequency region (ftonal ~ 40 Hz) that gives St ~ 0.2 (Bowes and Hasan, 2015). However, in real driving conditions, the flow over the side view mirror is more complex predominantly due to the A-pillar vortex interacting with the side view mirror. The flow not only contains von Kármán vortices but also A-pillar vortices (conical vortex) of various time and length scales. Consequently, the tonal noise is contaminated by other sound sources that makes the total sound pressure level is emitted at a broader frequency range.
Figure 2 A-pillar vortex structure. the direction of the free stream flow is out of the page (see online version for colours)
Source: Taken from Levy and Brancher (2013)
The edge between the windshield and the front side window for most production cars is a blunt shape. This component is known as A-pillar. The flow bypassing the A-pillar is highly three dimensional where the flow from the windshield is forced to separate. This is due to the sudden change in the geometry. The flow separations induce free rolling shear layer along the A-pillar in the form of a conical vortex. Figure 2 shows a cross section for a typical structure of the A-pillar vortex, suggested by Levy and Brancher (2013). The A-pillar vortex consists of a primary vortex that is formed from the flow separation on the A-pillar’s edge which travels downstream and upwards along the side window and roofline. Spectrum analysis of fluctuating pressure at the A-pillar by Hoarau et al. (2008) found two peaks that correspond to the size of the primary vortex at a high frequency and the total length of the conical vortex at a low frequency. Taking these length scales (L)
Wind noise from A-pillar and side view mirror 43
for the Strouhal number calculation, St = fpeaksL / U∞, a unity value is obtained for both frequencies.
The fluctuating pressure on the side view mirror and the A-pillar of a production car can radiates wind noise. Hamel and Ahuja (1996) compared the fluctuating sound pressure of a quarter cars with and without the side view mirror. They found that the noise due to the side view mirror was only significant at a low frequency (<1 kHz). Additionally, they also found that by changing the A-pillar’s height (measured normal from the windshield) the generated sound level was also changed. However, the changes were depended on the installation of the side view mirror. Without the side view mirror, increasing the A-pillar height by 13 mm had reduced the sound pressure level up to ~8 dB. Contrary, with the side view mirror installed on the car, increasing the height of the A-pillar made the sound pressure level increased up to ~5 dB especially at the high frequency region. However, no explanation was given on the fluid flow that was responsible for these phenomena.
The exact noise contribution from the A-pillar and the side view mirror to the total cabin noise is still not being discussed widely in open literature. It is the aims of the current study to discuss the characteristic of noise spectrum due to the side view mirror and also due to the A-pillar vortex. This paper is structured as follows. The model chosen for the current study is explained in the next section (Section 2). Then, the methodology and its validity are presented in Sections 3 and 4, respectively. The results of the current study are discussed in Section 5 before a conclusions in Section 6.
2 Problem geometry
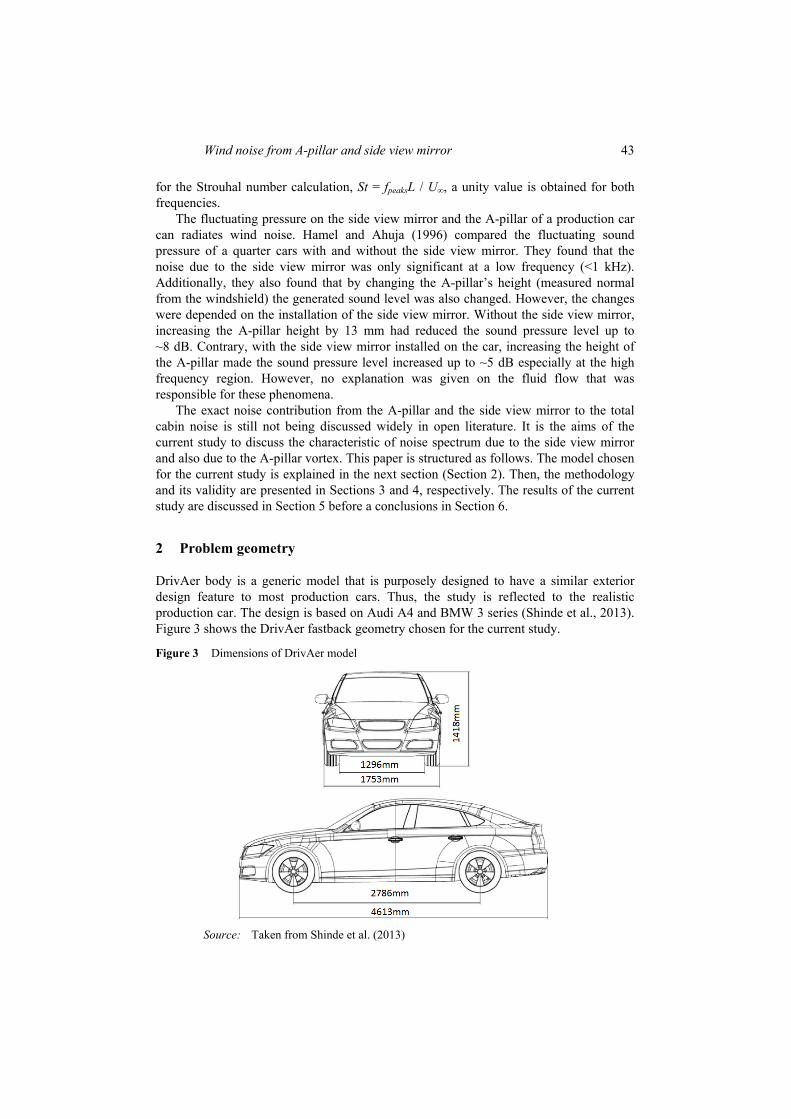
DrivAer body is a generic model that is purposely designed to have a similar exterior design feature to most production cars. Thus, the study is reflected to the realistic production car. The design is based on Audi A4 and BMW 3 series (Shinde et al., 2013). Figure 3 shows the DrivAer fastback geometry chosen for the current study.
Figure 3 Dimensions of DrivAer model
Source: Taken from Shinde et al. (2013)

44 M.S.M. Ali et al.
DrivAer model has been used by many ([Heft et al., 2012a, 2012b; Strangfeld et al., 2013; Forbes et al., 2016) as a benchmark case. The original study on DrivAer is done by Technical University of Munich (TUM) and the CAD design for the geometry is also made available to the public by the institute. While there are many studies on DrivAer for the exterior aerodynamics, the study on the wind noise is still not available, at least to the authors’ knowledge.
3 Methodology
3.1 Flow simulation
The governing equations for the flow are continuity and momentum equations. The flow is assumed incompressible as the Mach number of the current study is low, i.e., Ma = 0.118. Reynolds number based on the height of the car (Re = U∞H / v) is 3.78 × 10⁶ which makes the flow fully turbulent. To complete the simulation within a reasonable computational time, the turbulent flow is modelled using the unsteady Reynolds averaged Navier stokes (URANS) equations.
From Menter et al. (2003), the governing equation is reformulated in the form of the time averaged value:
ji i ij ij i j
j j j i
UU U Uρ ρU pδ μ ρu ut x x x x
(4)
0i
j
Uρx
(5)
where ( )i jρu u is the Reynolds stress. The Reynolds stress is solved by using eddy-viscosity model based on the Boussinesq
assumption,
2 23 3
ji ki j t ij ij
j i k
UU Uρu u u δ ρkδx x x
(6)
where the turbulent kinetic energy (k) and the specific dissipation rate (ω) are solved using the two equation models that are based on k – ωSST (Menter, 1994),
*j k k Tj j jproduction destruction
diffusion
k k kU P kω v σ vt x x x (7)
2 2
1 212 1
j ω Tj j jproduction destruction
diffusion
ωi i
cross diffusion
ω ω ωU S ω v σ vt x x x
k ωF σω x x
(8)

Wind noise from A-pillar and side view mirror 45
where vT is turbulence eddy viscosity and it is defined as:
1
1 2max ,Ta kva ω SF
(9)
In the software of OpenFOAM 22 ,S S where S2 = |Sij|2, (source or strain rate of the mean flow).
The following closure coefficient is used in this study: 2
2 2
2 500tanh max ,k vFωy y ω
(10)
where y is the distance to the next surface,
min , 10 *ik ij
j
UP τ kωx
(11)
4
21 2 2
500 4tanh min max , ,*
ω
kω
k v σ kFωy y ω CD y
(12)
102
1max 2 , 10kω ωi i
k ωCD ρσω x x
(13)
1 1 2 11F F (14)
where i = i, i
1 25 , 0.44039
(15)
1 23 9, 0.0828, *
40 100 (16)
1 2 20.85034, 1, 0.85616k k ωσ σ σ (17)
The 2nd-order backward scheme (Jasak, 1996) is used for temporal discretisation, the convection term is discretised using the 2nd-orderQUICK scheme (Leonard, 1979) and 2nd-order unbounded Gauss linear differencing scheme is used for the viscous term. The Courant-Fredichs-Lewy (CFL) number (Courant et al., 1967) is kept below 0.8.
3.2 Noise calculation
Lighthill’s acoustic analogy is used in the estimation of the sound propagation to the observer positions. Lighthill rearranged the Navier-Stokes equations into the form of inhomogeneous wave equation, where the sound source is due to the unsteadiness of the flow. Lighthill’s equation is an exact representation of the sound propagation, where no approximation is made in its derivation.

46 M.S.M. Ali et al.
The solution for the Lighthill’s equation requires a Green function, so that the effect of sound sources, boundary condition and the initial condition on the sound field can be included. In the present study of a rigid body, Curle’s equation provides the solution. For a compact sound source, Curle’s equation is:
2
1 ( ) ( , )( , ) ( )4 ( ) So
x y n p y tp x t dS yπC x y t
(18)
where p is the sound pressure fluctuation with time (t) at the observer position (x). The
sound source is the time gradient of the hydrodynamic pressure fluctuation ( )pt
of a
small surface element dS measured at the sound source (y) and at the retarded time of ( ) .
o
x yt tC
The sound radiation is also affected by the speed of sound Co and the
angle between the sound source and the observer, (x – y) ꞏ n. See Figure 4 for the sketch representation of the notations.
Figure 4 The notation of the noise radiation
4 Comparison and validation
4.1 Aerodynamics
Table 1 compares the mean drag coefficient mean( )DC between the current study and previous available similar studies. A good agreement with the experimental study by Guilmineau (2014) with only 2.1% difference is obtained. Note that the current study has defined slip boundary condition on the ground so that there is no boundary layer development on the upstream of the model. Similar treatment has been used by Guilmineau (2014), where the floor under the model is made moving with the freestream velocity. A higher meanDC is obtained when the floor under the model is made as no-slip condition (Shinde et al., 2013; Ashton et al., 2016), i.e., the boundary layer is allowed to developed upstream of the model, where up to 7.0% difference in meanDC is observed.

Wind noise from A-pillar and side view mirror 47
Table 1 Comparison of mean drag coefficient meanDC between current study and previous available data
Method meanDC %Δ Remarks
Current k − ω SST (unsteady) 0.248 2.1% 1.99M cells Shinde et al. (2013) k − ω SST (steady) 0.260 7.0% 11M cells Ashton et al. (2016) k − ω SST (steady) 0.260 7.0% 80M cells Ashton et al. (2016) Realisable k − (steady) 0.244 0.4% 80M cells
Shinde et al. (2013) Exp. 0.254 4.5% non-moving wall Guilmineau (2014) Exp. 0.243 Ref. moving wall
4.2 Wind noise
The method used to calculate the wind noise in the current study is validated with the experimental measurement of Hartmann et al. (2012). The condition chosen is for freestream velocity of 140km/h. The validation involves comparisons of the sound pressure level of the sound source at the side window and the sound pressure level inside the cabin.
The model chosen for the validation study is a simplified generic car model that is based on the SAE type 4 body (fullback). The geometry and its dimension are taken identical to the model investigated by a group of German automotive manufacturers consortium (Audi, Daimler, Porsche and Volkswagen) ([Islam et al., 2008a, 2008b; Hartmann et al., 2012). It is intentionally made so that comparisons of results can be made in a fair and informative manner between the current numerical study and the experimental measurement made by them. Figure 5 shows the geometry and its dimension of the model. The CAD design is prepared by using CATIA V5 and the surface mesh is constructed by using HyperMesh V12.0.
Figure 5 Dimension of generic vehicle model derived from SAE type 4 body (see online version for colours)
Source: Taken from Islam et al. (2008a)
The A-pillar is made from a fillet of radius 0.25 m between the side and the front surfaces and it is inclined at an angle of 30.39º from the longitudinal axis. The range of inclination angle for most passenger cars is between 29º to 50º with an averaged of 33º (Quigley et al., 2001). The height and width of the model are 1:20m and 1:60m, respectively that

48 M.S.M. Ali et al.
give a frontal area of 1.92 m2. The average frontal area for most passenger cars is 2.09 m2 [ecomodder.com]. However, unlike for most passenger cars, no inclination from the vertical plane is made on the side window of the current model. Table 2 compares some features of the current model with most production passenger cars. Table 2 Comparison of geometry between generic model SAE fullback type 4 (Hartmann
et al., 2012) and most passenger cars (Quigley et al., 2001)
Model SAE Most passenger cars
Mean Minimum Maximum
A-pillar length (m) 1.62 0.76 0.60 0.89 A-pillar inclination (º) 30.4º 33.0º 29.0º 50.0º Side window inclination (º) 0º 25.0º 11.0º 35.0º Frontal Area (m2) 1.92 2.09 1.41 3.26
4.2.1 Sound source
The time gradient fluctuating pressure (∂p / ∂t) is used as the sound source. 14 measurement points at the side window have been made and the sound source is measured individually. For comparison with Hartmann et al. (2012), the averaged SPL is calculated;
1 2 310 10 10 1010
110 log 10 10 10 10 NL L L LaverageSPL
N… (19)
where Li is the noise source level at a measurement point i and N is the number of measurement point, i.e., 14 points for the current study.
Figure 6 Comparison of sound source pressure level (average) at the window glass between current simulation and experimental measurement of Hartmann et al. (2012) (see online version for colours)
Wind noise from A-pillar and side view mirror 49
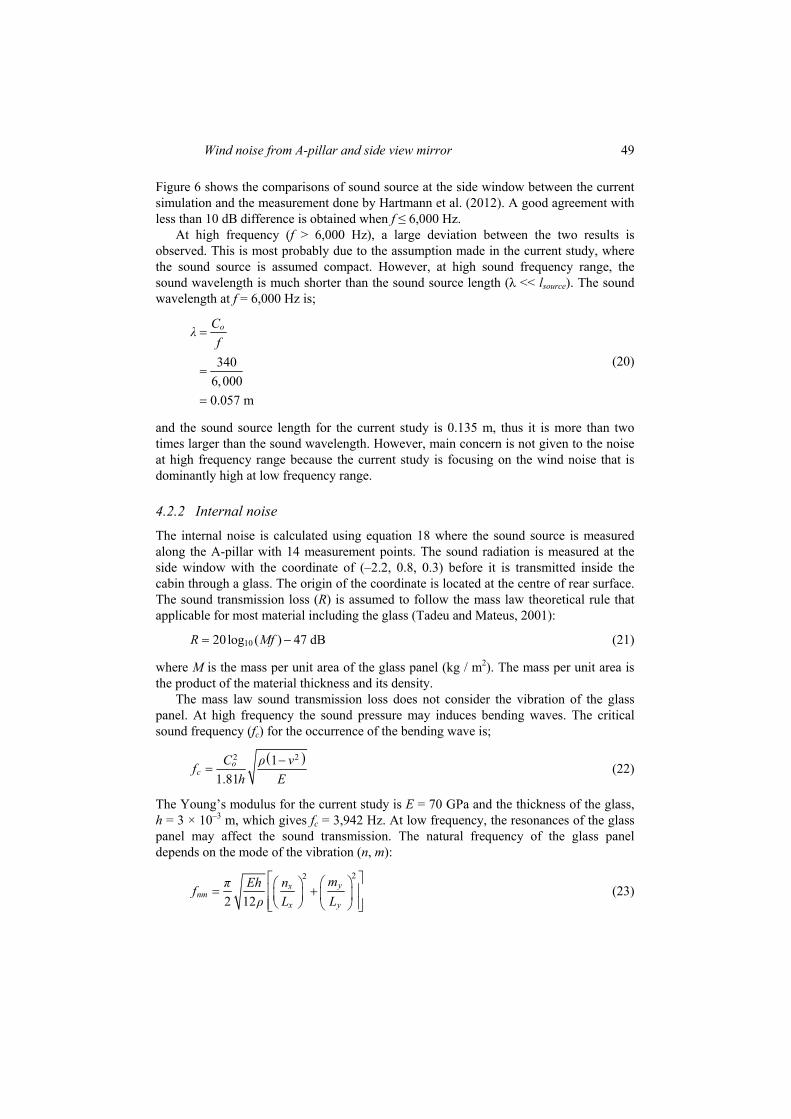
Figure 6 shows the comparisons of sound source at the side window between the current simulation and the measurement done by Hartmann et al. (2012). A good agreement with less than 10 dB difference is obtained when f ≤ 6,000 Hz.
At high frequency (f > 6,000 Hz), a large deviation between the two results is observed. This is most probably due to the assumption made in the current study, where the sound source is assumed compact. However, at high sound frequency range, the sound wavelength is much shorter than the sound source length (λ << lsource). The sound wavelength at f = 6,000 Hz is;
3406,0000.057 m
oCλf
(20)
and the sound source length for the current study is 0.135 m, thus it is more than two times larger than the sound wavelength. However, main concern is not given to the noise at high frequency range because the current study is focusing on the wind noise that is dominantly high at low frequency range.
4.2.2 Internal noise
The internal noise is calculated using equation 18 where the sound source is measured along the A-pillar with 14 measurement points. The sound radiation is measured at the side window with the coordinate of (–2.2, 0.8, 0.3) before it is transmitted inside the cabin through a glass. The origin of the coordinate is located at the centre of rear surface. The sound transmission loss (R) is assumed to follow the mass law theoretical rule that applicable for most material including the glass (Tadeu and Mateus, 2001):
1020 log ( ) 47 dBR Mf (21)
where M is the mass per unit area of the glass panel (kg / m2). The mass per unit area is the product of the material thickness and its density.
The mass law sound transmission loss does not consider the vibration of the glass panel. At high frequency the sound pressure may induces bending waves. The critical sound frequency (fc) for the occurrence of the bending wave is;
2 211.81
oc
C ρ vfh E
(22)
The Young’s modulus for the current study is E = 70 GPa and the thickness of the glass, h = 3 × 10⁻³ m, which gives fc = 3,942 Hz. At low frequency, the resonances of the glass panel may affect the sound transmission. The natural frequency of the glass panel depends on the mode of the vibration (n, m):
22
2 12yx
nmx y
mπ Eh nfρ L L
(23)

50 M.S.M. Ali et al.
where nx and my, are the mode index in x and y axes, respectively and Lx and Ly are the length of the glass panel in x and y axes, respectively. Taking the vibration modes as 1 for both axes, the size of the glass panel is 0.4m × 0.6m and the density of 2,500 kg/m3, the corresponding natural frequency for the current study is 66.32 Hz.
These two frequencies (fc and fnm) determine the regions where the mass law can be reasonable applied to predict the sound transmission loss when the noise passes through the glass window. The resonance frequency region usually extends until 2fnm while the coincidence frequency region may start at fc / 2. Thus, the mass law of sound transmission loss is valid in the range of 132.6 ≤ f (Hz) ≤ 1971. However, a maximum of 14 dB deviation is observed at f = 198.4 (see Figure 7). This frequency is very near to the region of resonance frequency, at which the deviation may due to the vibration of the panel that is not considered in the current study.
Figure 7 Comparison of SPL inside the cabin between current simulation and experimental measurement of Hartmann et al. (2012) (see online version for colours)
Notes: The smoothed line (red-solid line) is obtained by applying robust local regression with residual of 0.35.
5 Results
5.1 Sound from A-pillar
The current study concerns on the noise contribution from the A-pillar to the internal noise. As the length of the A-pillar is relatively larger than the size of the sound wave, it is appropriate to make the A-pillar into various smaller sections. For the current study, the A-pillar has been divided into 14 sections of similar size. Figure 8 shows the fluctuating sound pressure measured at the side window (at the position of the driver’s height) from each of the A-pillar segment.

Wind noise from A-pillar and side view mirror 51
Figure 8 Fluctuating sound pressure ( ( ))p pa measured at the observer position (near the driver) radiated from sound sources located at various locations of the A-pillar, (a) base (b) middle (c) end (see online version for colours)
(a)
(b)
(c)
52 M.S.M. Ali et al.
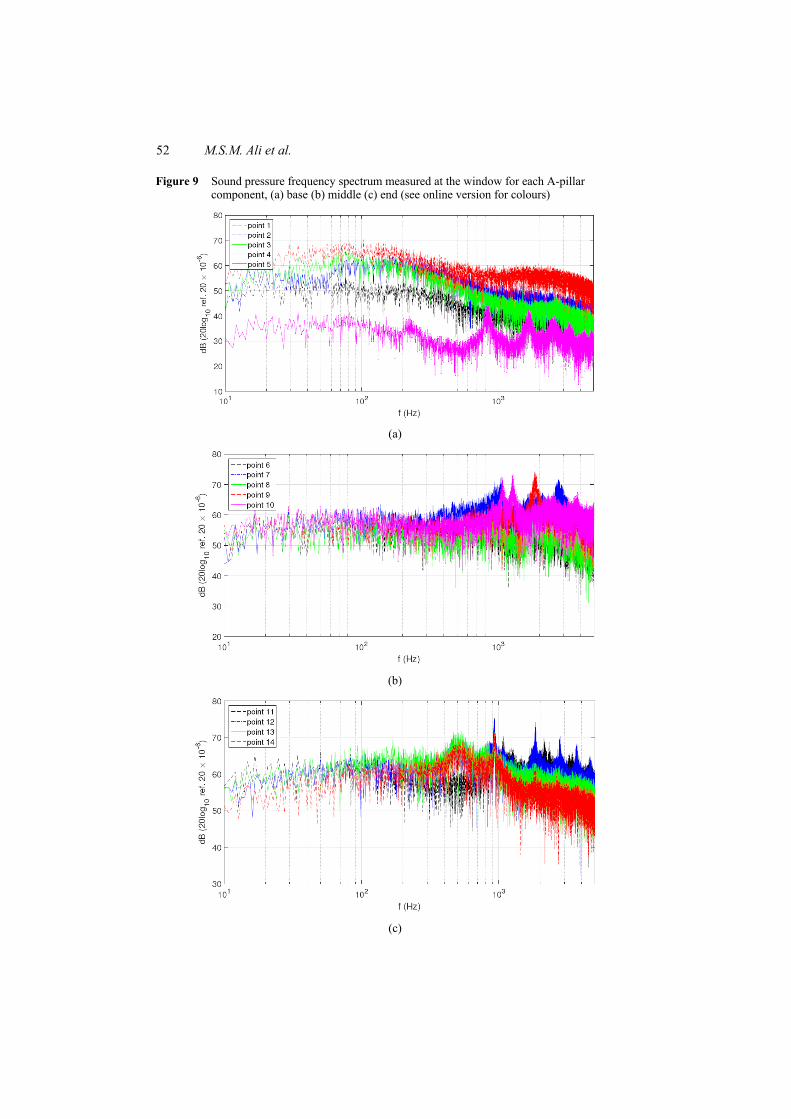
Figure 9 Sound pressure frequency spectrum measured at the window for each A-pillar component, (a) base (b) middle (c) end (see online version for colours)
(a)
(b)
(c)

Wind noise from A-pillar and side view mirror 53
Near the base of the A-pillar, the rate of fluctuating sound pressure is high but the amplitude of the sound pressure is small. At this region, the A-pillar vortex is expected to develop and as the base of the A-pillar is located upstream of the side view mirror, the A-pillar vortex does not interacts with the side view mirror wake yet. Therefore, the amplitude of fluctuating sound pressure is in a regular pattern. Near the middle of the A-pillar, the fluctuating sound pressure is generally high if compared to the near base of the A-pillar. At this region, the A-pillar vortex is fully formed and the wake of the side view mirror interacts with the A-pillar vortex. Therefore, the fluctuating pressure signals are more random. Near the end of the A-pillar, the A-pillar vortex is expected to dissipate. Its strength starts to decrease that makes the amplitude fluctuating decreasing downstream.
Inspections of the sound pressure frequency spectrum on the sound radiated from each A-pillar segment found three behaviours, according to the location of the A-pillar segment. Near the base of the A-pillar, the sound pressure level is high at frequency ~100 Hz. If taking the Strouhal number as 0.2 [St for a general bluff body shape (Wang and Watkins, 2010)], St = fL / U∞ = 100L / 40, gives the length scale of L ~80 mm. This is the size of the A-pillar. Thus, the sound generation at this region is mainly due to the A-pillar vortex. Near the middle of the A-pillar, a frequency peak is observed at 1,500 Hz. A similar analysis can be done from the Strouhal number calculation. St = fL / U∞ = 1,500 L / 40, gives L ~5:3 mm. This is the height of the step between the windshield and the A-pillar. Thus, it can be deduced that the noise generation at these points is mainly due to the vortex shedding from the step of the A-pillar. Near the end of the A-pillar, the frequency peak is shifted to a lower frequency, ~500 Hz. However, at this stage, the reason for the development of frequency peak is still unknown. Inspection of the flow structure of the A-pillar vortex may help in explaining the behaviour.
Figure 10 Fluctuating sound pressure, ( ),p Pa at the observer position (near the driver) radiated from sound sources located at various locations on the A-pillar (see online version for colours)
Figure 10 shows the total noise due to the A-pillar noise sources. The total noise is dominated mainly by the noise source at point 7 (near the middle of the A-pillar) and also noise source at point 12 (near the end of the A-pillar). Thus, these areas should be refined if the total noise into the cabin is to be reduced. However, A-pillar is one of the integral components that modifying in one area will be impossible without also affecting the flow

54 M.S.M. Ali et al.
structure of the neighbouring area. Additionally, the sound pressure frequency spectrum of the total sound from the A-pillar (see Figure 11) shows that the other points also contribute to the broadband sound level. Therefore, it is important to observe the overall trend of SPL along the A-pillar. This is plotted in Figure 12, where the trend is well observed when a regression analysis is applied on the raw SPL data distribution. It is clearly shown that the end segments of the A-pillar are the major noise source to the internal noise. Thus, this should be the area of improvement for the internal noise reduction.
Figure 11 Sound pressure frequency spectrum measured at the window due to the total sound radiation from the A-pillar
Figure 12 Sound pressure level, SPL (dB), measured at the observer position (near the driver) for different sound sources located at various locations on the A-pillar (see online version for colours)

Wind noise from A-pillar and side view mirror 55
Referring to equation 18, there are several parameters that influence the noise level at the observer points. There are the noise source (∂p / ∂t), distance between the noise source and the observer (x) and also the sound directivity ((x – y) ꞏ n). By only considering the noise source at each segment, Figure 13 shows the distribution of noise source (∂p / ∂t) level along the A-pillar. The sound source level near the end of the A-pillar is actually about the same level as the sound source level near the base of the A-pillar. This indicates that the distance between the A-pillar and the observer and also the directivity of the noise are the main reason for the high level of noise from these noise source points. Increasing the height of the A-pillar, so that its distance is far from the driver position, may help in reducing the total internal noise.
Figure 13 Sound source level, SPL (dB), measured at various locations on the A-pillar (see online version for colours)
5.2 Sound from side view mirror
The fluctuating surface pressure acting on the side view mirror is also efficient sound source. In this section, the sound generation from the side view mirror is discussed. The length scale of the side view mirror is relatively smaller than the overall length scale of the A-pillar. The sound wavelength is initially estimated less than the length scale of the side view mirror. Taking the height of the side view mirror as the length scale, the sound frequency under consideration is,
3400.13
1,700 Hz
o
L λCLf
ff
(24)

56 M.S.M. Ali et al.
The estimated sound frequency is greater than the frequency peak observed by Bowes and Hasan (ftonal ~ 40 Hz). Thus, for the noise calculation on the side view mirror, it is valid to use the compact sound source assumption where the sound wavelength must be greater than the length of the sound source. In the compact sound source assumption, the
noise source is fluctuating aerodynamic force ( ).Ft
Figure 14 Fluctuating forces (N), acting on the side view mirror (see online version for colours)
Note: The resultant force acting at –21.5º from the streamwise direction.
Figure 14 shows time history of the fluctuating aerodynamic forces acting on the side view mirror. Fluctuating lift acting in the down force while drag acting in the direction of the free stream. These two forces result in a net force acting –21.5º from the streamwise direction. The magnitude of the net force is about two times larger than the drag force and the rate of fluctuation is more severe than fluctuating drag and lift.
Figure 15 Fluctuating sound pressure, ( ),p Pa at the observer position (near the driver) radiated from the side view mirror (see online version for colours)
Wind noise from A-pillar and side view mirror 57
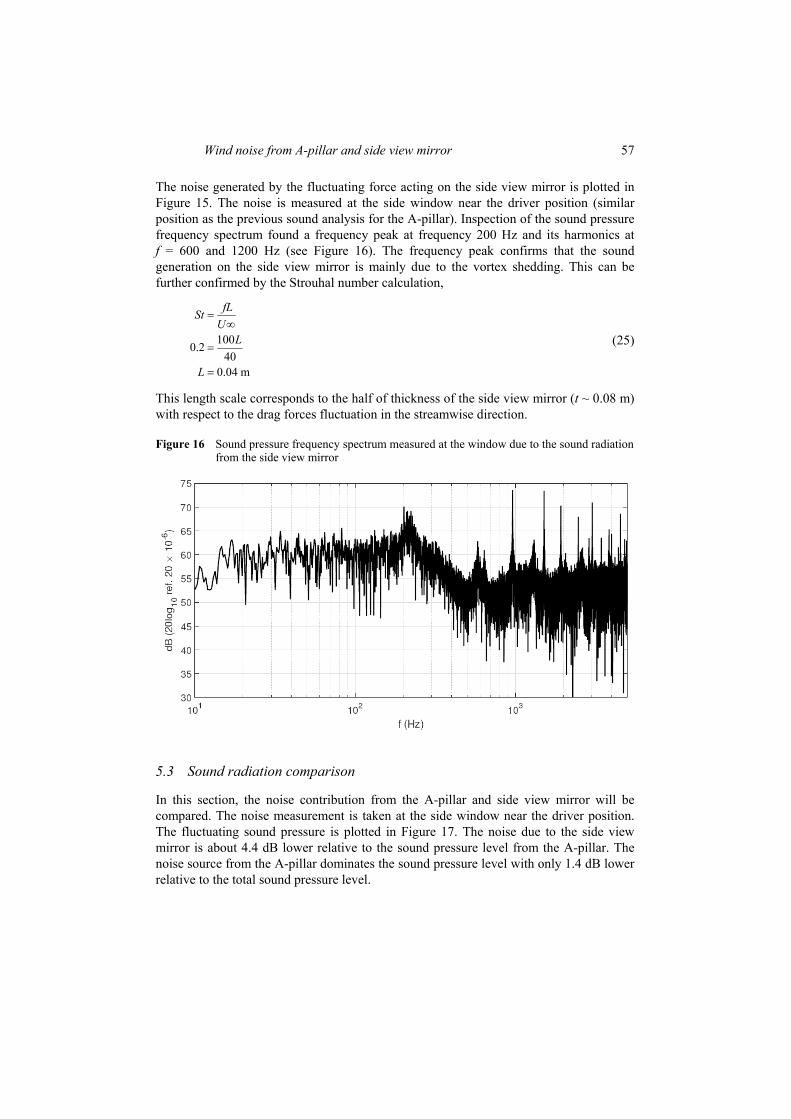
The noise generated by the fluctuating force acting on the side view mirror is plotted in Figure 15. The noise is measured at the side window near the driver position (similar position as the previous sound analysis for the A-pillar). Inspection of the sound pressure frequency spectrum found a frequency peak at frequency 200 Hz and its harmonics at f = 600 and 1200 Hz (see Figure 16). The frequency peak confirms that the sound generation on the side view mirror is mainly due to the vortex shedding. This can be further confirmed by the Strouhal number calculation,
1000.240
0.04 m
fLStU
L
L
(25)
This length scale corresponds to the half of thickness of the side view mirror (t ~ 0.08 m) with respect to the drag forces fluctuation in the streamwise direction.
Figure 16 Sound pressure frequency spectrum measured at the window due to the sound radiation from the side view mirror
5.3 Sound radiation comparison
In this section, the noise contribution from the A-pillar and side view mirror will be compared. The noise measurement is taken at the side window near the driver position. The fluctuating sound pressure is plotted in Figure 17. The noise due to the side view mirror is about 4.4 dB lower relative to the sound pressure level from the A-pillar. The noise source from the A-pillar dominates the sound pressure level with only 1.4 dB lower relative to the total sound pressure level.

58 M.S.M. Ali et al.
Figure 17 Fluctuating total sound pressure, ( ),p Pa at the observer position (near the driver). the sound radiations from the A-pillar and side view mirror are also shown (see online version for colours)
Notes: SPLtotal = 72.79 dB, SPLpillar = 71.43 dB and SPLmirror = 67.03 dB.
Figure 18 Sound pressure frequency spectrum comparison measured at the side glass and considering the sound transmission loss through the side glass (see online version for colours)
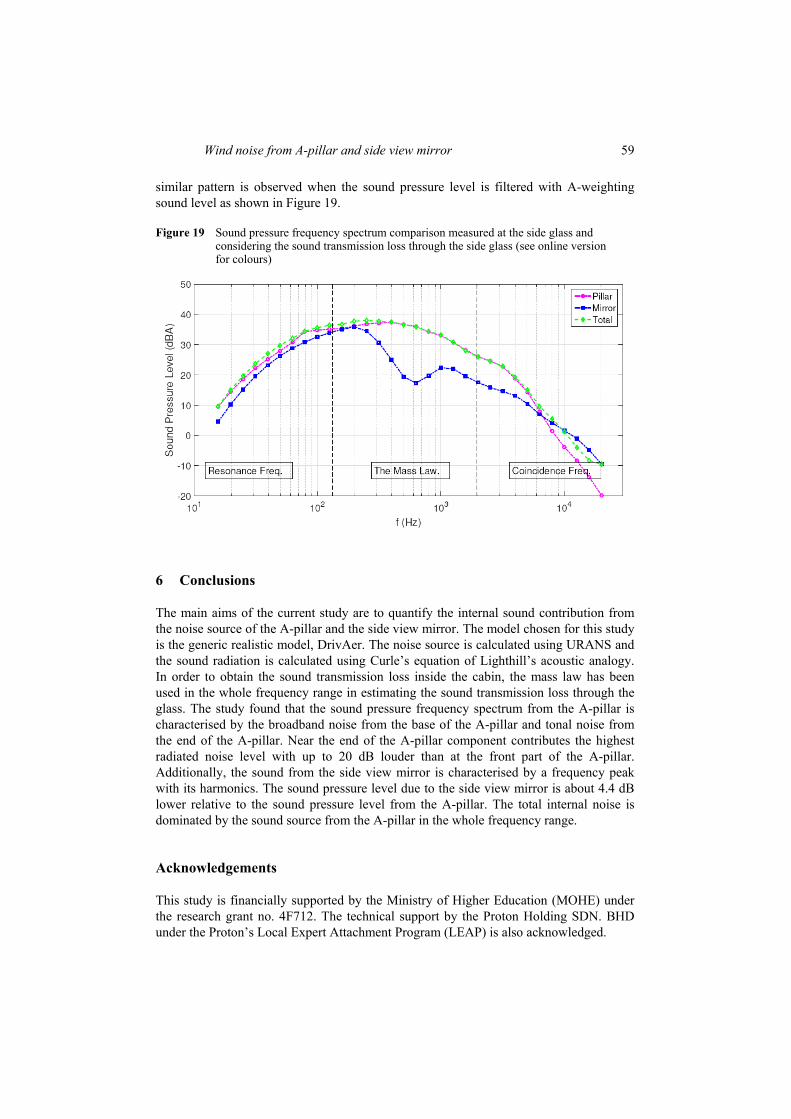
Figure 18 compares the estimated sound transmission into the cabin between the sound generated from the A-pillar and the sound generated by the side view mirror. The transmitted sound due to the side view mirror noise source has a small effect on the total transmitted sound, especially at the intermediate frequency region (200 ≤ f Hz ≤ 2,000) with up to 15 dB lower relative to the total sound. The noise source from the A-pillar dominates the total sound pressure frequency spectrum for whole frequency range. A
Wind noise from A-pillar and side view mirror 59
similar pattern is observed when the sound pressure level is filtered with A-weighting sound level as shown in Figure 19.
Figure 19 Sound pressure frequency spectrum comparison measured at the side glass and considering the sound transmission loss through the side glass (see online version for colours)
6 Conclusions
The main aims of the current study are to quantify the internal sound contribution from the noise source of the A-pillar and the side view mirror. The model chosen for this study is the generic realistic model, DrivAer. The noise source is calculated using URANS and the sound radiation is calculated using Curle’s equation of Lighthill’s acoustic analogy. In order to obtain the sound transmission loss inside the cabin, the mass law has been used in the whole frequency range in estimating the sound transmission loss through the glass. The study found that the sound pressure frequency spectrum from the A-pillar is characterised by the broadband noise from the base of the A-pillar and tonal noise from the end of the A-pillar. Near the end of the A-pillar component contributes the highest radiated noise level with up to 20 dB louder than at the front part of the A-pillar. Additionally, the sound from the side view mirror is characterised by a frequency peak with its harmonics. The sound pressure level due to the side view mirror is about 4.4 dB lower relative to the sound pressure level from the A-pillar. The total internal noise is dominated by the sound source from the A-pillar in the whole frequency range.
Acknowledgements
This study is financially supported by the Ministry of Higher Education (MOHE) under the research grant no. 4F712. The technical support by the Proton Holding SDN. BHD under the Proton’s Local Expert Attachment Program (LEAP) is also acknowledged.

60 M.S.M. Ali et al.
References Ashton, N., West, A., Lardeau, S. and Revell, A. (2016) ‘Assessment of RANS and DES methods
for realistic automotive models’, Computers and Fluids, Vol. 128, pp.1–15. Bloklanda, G.V. and Peetersb, B. (2009) ‘Modeling the noise emission of road vehicles and results
of recent experiments’, Inter-Noise Conference Proceedings. Bowes, A.J. and Hasan, R. (2015) ‘A computational analysis of flow and acoustics around a car
wing mirror’, in Proceedings of the World Congress on Engineering and Computer Science, Vol. 2, No. 1, pp.1052–1057.
Buchheim, R., Dobrzynski, W., Mankau, H. and Schwabe, D. (1982) ‘Vehicle interior noise related to external aerodynamics’, International Journal of Vehicle Design, Vol. 3, No. 4, pp.398–410,.
Courant, R., Friedrichs, K. and Lewy, H. (1967) ‘On the partial difference equations of mathematical physics’, IBM Journal, Vol. 11, No. 2, pp.215–234.
Croaker, P., Skvortsov, A. and Kessissoglou, N. (2011) ‘A simple approach to estimate flow-induced noise from steady state CFD data’, in Proceedings of Acoustics, pp.1–8.
Curle, N. (1955) ‘The influence of solid boundaries upon aerodynamic sound’, in Proceedings of the Royal Society of London A: Mathematical, Physical and Engineering Sciences, Vol. 231, No. 1187, pp.505–514, The Royal Society.
Forbes, D.C., Page, G.J., Passmore, M.A. and Gaylard, A.P. (2016) A Fully Coupled, 6 Degree-of-Freedom, Aerodynamic and Vehicle Handling Crosswind Simulation Using the DrivAer Model..
Gloerfelt , X. (2009) ‘Noise from automotive components’, in Aerodynamic Noise from Wall-Bounded Flows, coll. VKI Lectures, Von Karman Institute, Belgium, 9–13 March.
Guilmineau, E. (2014) ‘Numerical simulations of flow around a realistic generic car model’, SAE International Journal of Passenger Cars-Mechanical Systems, Vol. 7, No. 2014-01-0607, pp.646–653.
Hamel, T. and Ahuja, K. (1996) ‘Wind-noise measurements on an automobile side glass with A-pillars of different height’, in 34th Aerospace Sciences Meeting and Exhibit, p.879.
Hartmann, M., Ocker, J., Lemke, T., Mutzke, A., Schwarz, V., Tokuno, H., Toppinga, R., Unterlechner, P. and Wickern, G. (2012) ‘Wind noise caused by the a-pillar and the side mirror flow of a generic vehicle model’, in 18th AIAA/CEAS Aeroacoustic Conference, AIAA paper, Vol. 2205.
Heft, A.I., Indinger, T. and Adams, N.A. (2012a) ‘Experimental and numerical investigation of the drivaer model’, in ASME 2012 Fluids Engineering Division Summer Meeting collocated with the ASME 2012 Heat Transfer Summer Conference and the ASME 2012 10th International Conference on Nanochannels, Microchannels, and Minichannels, American Society of Mechanical Engineers, pp.41–51.
Heft, A.I., Indinger, T. and Adams, N.A. (2012b) Introduction of a New Realistic Generic Car Model for Aerodynamic Investigations, Technical report, SAE Technical Paper.
Hoarau, C., Borée, J., Laumonier, J. and Gervais, Y. (2008) ‘Unsteady wall pressure field of a model a-pillar conical vortex’, International Journal of Heat and Fluid Flow, Vol. 29, No. 3, pp.812–819.
Islam, M., Decker, F., Hartmann, M., Jaeger, A., Lemke, T., Ocker, J., Schwarz, V., Ullrich, F., Schröder, A. and Heider, A. (2008a) ‘Investigations of sunroof buffeting in an idealised generic vehicle model-part I: experimental results’, in 29th AIAA Aeroacoustics Conference, Vol. 2900.
Islam, M., Decker, F., Hartmann, M., Jaeger, A., Lemke, T., Ocker, J., Schwarz, V., Ullrich, F., Crouse, B., Balasubramanian, G. et al. (2008b) ‘Investigations of sunroof buffeting in an idealised generic vehicle model-part II: numerical simulations’, in 29th AIAA Aeroacoustics Conference.

Wind noise from A-pillar and side view mirror 61
Jasak, H. (1996) Error Analysis and Estimation for the Finite Volume Method with Applications to Fluid Flows, PhD thesis, June, Department of Mechanical Engineering, Imperial College of Science, Technology and Medicine.
Leonard, B.P. (1979) ‘A stable and accurate convective modelling procedure based on quadratic upstream interpolation’, Computer Methods in Applied Mechanics and Engineering, Vol. 19, No. 1, pp.59–98.
Levy, B. and Brancher, P. (2013) ‘Topology and dynamics of the a-pillar vortex’, Physics of Fluids (1994–present), Vol. 25, No. 3, p.037102.
Menter, F.R. (1994) ‘Two-equation eddy-viscosity turbulence models for engineering applications’, AIAA Journal, Vol. 32, No. 8, pp.1598–1605.
Menter, F.R., Kuntz, M. and Langtry, R. (2003) ‘Ten years of industrial experience with the SST turbulence model’, Turbulence, Heat and Mass Transfer, Vol. 4, No. 1, pp.625–632.
Quigley, C., Cook, S. and Tait, R. (2001) Field of Vision (A-Pillar Geometry) – A Review of the Needs of Drivers: Final Report.
Shinde, G., Joshi, A. and Nikam, K. (2013) Numerical Investigations of the DrivAer Car Model using Opensource CFD solver Openfoam.
Stapleford, W. (1970) Aerodynamic Noise in Road Vehicles, Part 2: A Study of the Sources and Significance of Aerodynamic Noise in Saloon Cars, pp.1972, The Motor Industry Research Association.
Stapleford, W.R. and Carr, G.W. (1970) Aerodynamic Noise in Road Vehicles, MIRA. Strangfeld, C., Wieser, D., Schmidt, H-J., Woszidlo, R., Nayeri, C. and Paschereit, C. (2013)
Experimental Study of Baseline Flow Characteristics for the Realistic Car Model DrivAer, Technical report, SAE Technical Paper,.
Tadeu, A.J.B. and Mateus, D.M.R. (2001) ‘Sound transmission through single, double and triple glazing. experimental evaluation’, Applied Acoustics, Vol. 62, No. 3, pp.307–325.
Wang, X. (2010) Vehicle Noise and Vibration Refinement. Wang, X. and Watkins, S. (2010) ‘Reduction of roof rack noise and vibration’, International
Journal of Vehicle Noise and Vibration, Vol. 6, Nos. 2–4, pp.105–117.
Nomenclature
p Pressure of fluid propulsionwL Sound power level
δ Kronecker Delta Re Reynolds number μt Fluid dynamic viscosity SPL Sound pressure level vT Turbulence Eddy viscosity SST Shear stress transport v Kinematic viscosity St Strouhal number ρ Density of fluid U∞ Freestream velocity σ Stress tensor v Speed of car τ Reynolds shear stress vref Reference speed ftonal Tonal frequency