Wind Data Analysis - GIZgizenergy.org.vn/media/app/media/PDF-Docs/... · Wind Data Analysis EaPhe...
49
Ministry of Industry and Trade General Directorate of Energy FINAL REPORT Wind Data Analysis EaPhe District, Dak Lak Province November 2014
Transcript of Wind Data Analysis - GIZgizenergy.org.vn/media/app/media/PDF-Docs/... · Wind Data Analysis EaPhe...
Ministry of Industry and Trade
General Directorate of Energy
FINAL REPORT
Wind Data Analysis
EaPhe District,
Dak Lak Province
November 2014

Owner: Project “Establishment of legal framework and technical assistance to
grid connected wind power development in Viet Nam” (GIZ/MoIT)
5th Floor, 85 Nguyen Du, Hai Ba Trung, Ha noi, Viet Nam
T: + 84 4 3941 2605 - (14)
F: + 84 4 3941 2606
I: www.giz.de/vietnam
www.renewableenergy.org.vn
National
Consultant
Individual
consultant
Power Engineering Consulting Joint Stock Company 3 (PECC3)
32 Ngo Thoi Nhiem, District 3, Ho Chi Minh City
Person in charge: Nguyen Hoang Dung
Nguyen Quoc Khanh
Hanoi
International
Consultant:
German ProfEC GmbH
Südring 13, 26125 Oldenburg, Germany

Final report of wind measurement – GIZ/MoIT Wind Energy Project
Page | 3
Content
1 EXECUTIVE SUMMARY 4
2 BACKGROUND AND SCOPE 5
3 METHODOLOGY 7
3.1 Considered Requirements within the Wind Potential Analysis 9
3.1.1 Documentation of the measurement station 9
3.1.2 Measurement mast 10
3.1.3 Extension arms (Horizontal Booms) 10
3.1.4 Tower height and measurement heights 10
3.1.5 Duration of the measurement campaigns 10
3.1.6 Equipment 10
3.1.7 Data recording 11
3.1.8 Maintenance and monitoring of measurement station 11
4 MEASUREMENT RESULTS 12
5 LONG TERM CORRECTION 16
6 UNCERTAINTIES OF THE WIND MEASUREMENT CAMPAIGN 18
7 DETAILED WIND MEASUREMENT DATA ANALYSIS AND EVALUATION 19
8 REFERENCES 20
APPENDIX A – DETAILED WIND MEASUREMENT DATA ANALYSIS AND
EVALUATION 21
APPENDIX B – CALIBRATION SHEETS EAPHE 34

Final report of wind measurement – GIZ/MoIT Wind Energy Project
Page | 4
1 Executive Summary
PECC3 was commissioned by GIZ to conduct assessment of long term wind resource at 10 sites
under the Program “Wind Measurement for Developing Wind Power Plan and Wind Power
Project”. For this purpose, it was planned at first that a wind speed measurement would be per-
formed with 80m measurement tower and high quality measurement sensors at each of these
sites for one year. However during the evaluation of measured data it was found out that long
term wind data from nearby meteorological stations showed little correlation with measured data
thus it would be lack of grounds to give a statement about the representativeness of the meas-
urement period regarding the long-term wind climate of the region. Therefore, it was decided to
extend the wind measurement at those sites for another.
The results of wind measurements for year 1 and for both years are summarized Table 1, which
presents wind climatological characteristics as Wind Speed, Weibull A-Parameter, Weibull k-
Parameter and Turbulence Intensity at each measurement height as well as general climatological
site characteristics such as temperature, air pressure and
The following results can be highlighted for site EaPhe:
Measured average wind speed at 80m in the second year was 4.98 m/s, 7% lower than the
average wind speed recorded in the first year of 5.36 m/s.
Attempt was then made to make long term correction of measured data. Having conduct-
ed the measurement for a longer period, it now shows that the measured wind speeds
seem to correlate reasonably with long term wind data from the Da Lat meteorological
station. It revealed that the measurement period fell into low wind speed period (78%
long term average). Interpreting differently, actual data could be as large as 128% higher.
Correcting measured data with this wind index, the average wind speed at 80 m at EaPhe
could be as high as 6.63 m/s which is “good” by classification in wind energy industry:
Year 1 Two years
80m
Wind Speed [m/s] 5.36 5.17
Weibull A-Parameter [m/s] 5.912 5.76
Weibull k-Parameter [-] 2.339 2.23
Turbulence Intensity [-] 0.153 0.156
60m
Wind Speed [m/s] 4.78 4.66
Weibull A-Parameter [m/s] 5.387 5.25
Weibull k-Parameter [-] 2.286 2.19
Turbulence Intensity [-] 0.170 0.172
40m
Wind Speed [m/s] 4.19 4.08
Weibull A-Parameter [m/s] 4.728 4.61
Weibull k-Parameter [-] 2.229 2.15
Turbulence Intensity [-] 0.194 0.195
Site meteorological pa-
rameters
Temperature 14m [°C] 24.55 24.11
Pressure 6m [hPa] 958.00 958.1
Relative humidity 14m [%] 83.30 83.5
Table 1: Results of the wind measurement campaign in [EaPhe / VietNam].

Final report of wind measurement – GIZ/MoIT Wind Energy Project
Page | 5
2 Background and Scope
The assessment of long term wind resource at EaPhe is carried out under the program “Wind
measurement for developing wind power plan and wind power projects” within the frame-
work of the project “Establishment of legal framework and technical assistance to gird con-
nected wind power development in Viet Nam”. The program is financed by the German Fed-
eral Ministry for Environment, Nature Conservation and Nuclear Safety (BMU) and The Minis-
try of Industry and Trade of Vietnam (MoIT) and is implemented by Deutsche Gesellschaft fuer
International Zusammenarbeit (GIZ) and the Ministry of Industry and Trade (MoIT) of Vietnam.
The objectives of the program are to support local governments to conduct wind power planning
in their provinces and at the same time support private developers in their wind project develop-
ments.
The program covers 10 sites scattering from North to South. For the purpose of supporting pri-
vate developers of wind power projects, some of the sites are on areas with existing wind pro-
jects - those that have not undertaken wind measurement. Details of these sites are provided in
Table 2.
Province Commune-District Existing
wind project
on the site?
Quang Binh Hai Ninh – Quang Ninh Yes
Binh Dinh My Thanh – Phu My No
Phu Yen Xuan Hoa–Song Ca Yes
An Ninh Dong –Tuy An No
Gia Lai IaDer – IA GRAI No
Kon Dong – Mang Yang No
Daklak Eaphe –Krong Pak No
Ea Drang – EAHLEO Yes
Lam Dong Da Loan- Duc Trong No
Ben Tre Thanh Hai – Thanh Phu No
Table 2: List of sites under the program
Implementers of the project with their roles and re-
sponsibilities are briefly introduced below.
German ProfEC as the international consultant has
the following responsibilities: giving advice on site
selection; providing specifications for traverse,
booms and geometry of installations; giving advice
on installation strategy; on-site supervision, commissioning, documentation for the first system
and transfer know-how in the process of conducting the work; remote supervision, advice, com-
missioning, documentation for each subsequent systems. The representative and contact person
within German ProfEC GmbH is Mr. Andreas Jansen who is the Managing Director.

Final report of wind measurement – GIZ/MoIT Wind Energy Project
Page | 6
The Power Engineering Consulting Company No 3 (PECC3) is the local consultant with de-
tailed responsibilities as follows: design of measurement mast, site selection, supervision of mast
erection, installation of sensors for 10 systems, making electrical connections and commission-
ing of the systems, on-going supervision of the measurement and realization of one year wind
and energy assessment. The representative and contact person within PECC3 is Mr. Nguyen
Hoang Dung, who is the Head of Power Network Development.
To back up the program Mr. Nguyen Quoc Khanh was selected. Mr. Khanh provides technical
supports to PECC3 while implementing the program including preparation of the final reports of
the 10 wind measurement stations.
Nam Kinh Co Ltd is the local mast manufacturer and installer. The representative and contact
person within Nam Kinh Co. Ltd. is Mr. Phan Quoc Hao who is the Head of Management
Board.
This assessment of wind resource at EaPhe is based on a 2 complete year data at the site, starting
from the commission date. The long term reference data at the nearby meteorological station is
provided by the program owner. The assessment is supported by a number of technical docu-
ments which are outputs of the previous steps, to be described in the next sections.
The assessment like previous works has benefited from the technical guidance of German
ProfEC which was provided to ensure the assessment to conform to relevant standards and
common practices of professional wind evaluators.
Lastly, since a detailed prediction of the wind resource of future periods, including the influence
of climate change, is not possible on the basis of present knowledge, it is assumed that the wind
resource to be expected is in average similar to that of the past about 10 to 20 years.
Final report of wind measurement – GIZ/MoIT Wind Energy Project
Page | 7
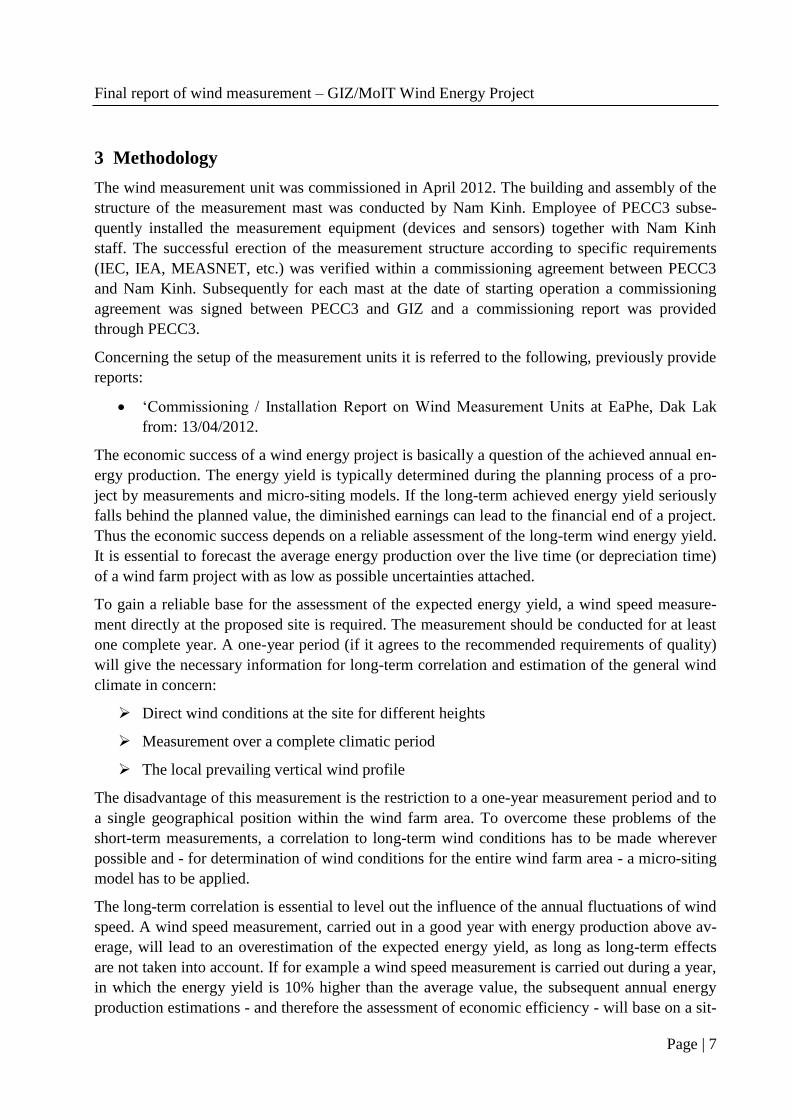
3 Methodology
The wind measurement unit was commissioned in April 2012. The building and assembly of the
structure of the measurement mast was conducted by Nam Kinh. Employee of PECC3 subse-
quently installed the measurement equipment (devices and sensors) together with Nam Kinh
staff. The successful erection of the measurement structure according to specific requirements
(IEC, IEA, MEASNET, etc.) was verified within a commissioning agreement between PECC3
and Nam Kinh. Subsequently for each mast at the date of starting operation a commissioning
agreement was signed between PECC3 and GIZ and a commissioning report was provided
through PECC3.
Concerning the setup of the measurement units it is referred to the following, previously provide
reports:
‘Commissioning / Installation Report on Wind Measurement Units at EaPhe, Dak Lak
from: 13/04/2012.
The economic success of a wind energy project is basically a question of the achieved annual en-
ergy production. The energy yield is typically determined during the planning process of a pro-
ject by measurements and micro-siting models. If the long-term achieved energy yield seriously
falls behind the planned value, the diminished earnings can lead to the financial end of a project.
Thus the economic success depends on a reliable assessment of the long-term wind energy yield.
It is essential to forecast the average energy production over the live time (or depreciation time)
of a wind farm project with as low as possible uncertainties attached.
To gain a reliable base for the assessment of the expected energy yield, a wind speed measure-
ment directly at the proposed site is required. The measurement should be conducted for at least
one complete year. A one-year period (if it agrees to the recommended requirements of quality)
will give the necessary information for long-term correlation and estimation of the general wind
climate in concern:
Direct wind conditions at the site for different heights
Measurement over a complete climatic period
The local prevailing vertical wind profile
The disadvantage of this measurement is the restriction to a one-year measurement period and to
a single geographical position within the wind farm area. To overcome these problems of the
short-term measurements, a correlation to long-term wind conditions has to be made wherever
possible and - for determination of wind conditions for the entire wind farm area - a micro-siting
model has to be applied.
The long-term correlation is essential to level out the influence of the annual fluctuations of wind
speed. A wind speed measurement, carried out in a good year with energy production above av-
erage, will lead to an overestimation of the expected energy yield, as long as long-term effects
are not taken into account. If for example a wind speed measurement is carried out during a year,
in which the energy yield is 10% higher than the average value, the subsequent annual energy
production estimations - and therefore the assessment of economic efficiency - will base on a sit-

Final report of wind measurement – GIZ/MoIT Wind Energy Project
Page | 8
uation that results 10% better than the long-term conditions would permit. The assessment of re-
liable long-term wind speed conditions therefore is of vital importance for wind energy projects.
Figure 1 shows how the short-term measurements are used in combination with the long-term
measurement. The upper bar represents the duration of the long-term measurement taken at the
Reference Site for several years (here: 10 years). Within this bar a small partition is depicted
(yellow), indicating a short-term measurement period (here one year), recorded at an identical
time period as the short-term measurement, which is carried out at the proposed wind farm site
(Prediction Site). The red bar indicates this short-term period at the Prediction Site. The lower,
blue bar represents the long-term prediction that results from the Measurement Correlation and
Prediction (MCP) procedure.
Figure 1: Long-term correlation of wind speed measurement data conform the procedure measurement, correlation
and prediction (MCP)
A short-term measurement performed at the Prediction Site is first correlated with a data set of
the Reference Site (long-term measurement station) for the identical time period, producing a set
of correlation parameter, which will have even lower uncertainties attached the more stable the
conditions at the Reference Site has been during measurement. In a second step the long-term
prediction is performed for the Prediction Site by using the gained set of correlation parameter
and the long-term measured data from the Reference Site.
In brief, in terms of long-term correlation three data records are required:
A short-term measurement at the Prediction Site (one-year period)
A long-term measurement at the Reference Site
A short-term data set at the Reference Site, recorded within the same period as the
short-term measurement at the Prediction Site.
A long-term measurement station at the so-called Reference Site, should have a recording time of
5 to 10 years or even more and should be located in an area, which
Reference Site: Long-term measurement, including period of short-term measurement
94 95 96 97 98 99 00 01 02 03 04
Prediction Site: Long-term prediction
94 95 96 97 98 99 00 01 02 03 04
M
C
P
Short-term measurement

Final report of wind measurement – GIZ/MoIT Wind Energy Project
Page | 9
Is near the site of the short-term measurement
Is characterised by the same wind climatological conditions (same regional wind climate)
In most countries wind speed measurements from meteorological weather services, airports or
military stations exist. These measurements usually are performed at low heights above ground
level (commonly 10 to 15m height above ground level) and are therefore strongly influenced by
the surrounding terrain and obstacles. These measurements thus have a big disadvantage; they
are of limited accuracy and not representative for greater height levels. Their big advantage is
that they are recorded over a long time period, often under stable operation conditions. This ad-
vantage makes them suitable for long-term correlation and data alignment as long as the data
were recorded in a stable situation.
3.1 Considered Requirements within the Wind Potential Analysis
The measurements were performed according to the current international standards IEC 61400-
121 [Ref. 1]. The most important parameters to be considered for a high quality wind speed
measurement shall be given in brief.
IEC 61400-121 [Ref. 1] is a standard for measuring the behaviour between wind speed and pow-
er out-put of a wind turbine (P-V curve). Therefore it is not solely dealing with wind speed
measurements, but also with required data logging and power measuring of the turbine. Nonethe-
less, this standard – due to its importance concerning reliable statements about wind turbines’
power - contains the widest accepted requirements within its parts over wind speed measure-
ment.
3.1.1 Documentation of the measurement station
Being able to evaluate and process the measurement data in an appropriate way and at any given
time, a complete documentation about the measurement is indispensable. Therefore Table 3 be-
low represents the most important points that were considered during wind speed measurement.
Exact positions of the measurement station Geographical, UTM or similar rectangular co-
ordinates
Description of the measurement set-up Exact measurement heights
Orientation of booms and wind vane-north-
mark (given as offset to the geographical
North-Pole)
Used recorder type (strip chart, digital etc.)
Installed sensors (temperature, air pressure etc.)
inclusive ID-numbers
Documentation of gaps in data recording Total annual missing hours
Lengths of each missing period
Detailed information about changes in
measurement equipment Reconstruction
Shift of location
Changes in surrounding

Final report of wind measurement – GIZ/MoIT Wind Energy Project
Page | 10
Data sheets (if available) Calibration data of the measurement sensors
used
Changes of calibration curves and parameters
Numbers of calibration report
Table 3: Recommended documentation of the measurement station
3.1.2 Measurement mast
The measurement mast itself already influences the wind’s flow. This influence was kept as low
as possible. The anemometers were installed at the mast in such a way that the influence by the
mast and the extension arms (booms) was kept as low as possible. Therefore the anemometers
were installed in a minimum required distance to the tower. Already during calibration of ane-
mometers the mounting shaft of these was be identical with the later outdoor installation in term
of fixing mechanism and diameter.
The electric cables of the sensors were protected against influence of the weather and mechanical
abrasion. Cables were laid within the tubes of the shaft and were fixed to the mast by cable ties
in short distance.
3.1.3 Extension arms (Horizontal Booms)
Booms are necessary wherever measurements need to be conducted at other heights than solely
at the top of the mast. The distance between mast and anemometer was kept to be more than six
times the mast’s diameter for lattice towers [ Ref. 2].
3.1.4 Tower height and measurement heights
The ideal height of the measurement would be the hub height of the wind turbines suggested for
installation. In this case, a 80 m tower is used which is the hub height of wind turbines most de-
manded in the market however wind parameters are also measured at other heights 60 and 40 m
– so ready for interpolation or extrapolation of wind data in case the hub height of the wind tur-
bine is different.
3.1.5 Duration of the measurement campaigns
The measurement campaign with the wind measurement mast originally performed for a period
of one-year as recommend by the relevant standard and professional wind evaluation. However,
it was extended for another year to lower uncertainty of the assessment (pls. see above for further
information).
3.1.6 Equipment
Wind speed measurements are carried out for a long period ( one year). Therefore, the chosen
sensors were suitable for durable use. They can even work under extreme weather conditions.
The equipment consists of components with high quality performances and reliable characteris-
tics. An error of 1 % in wind speed means an error of 2 to 3 % in energy yield. The anemometers
and wind vanes have for this reason been calibrated in a wind tunnel suitable for wind energy

Final report of wind measurement – GIZ/MoIT Wind Energy Project
Page | 11
purposes. Data sheets and calibration data of the sensors were documented and can be found in
Appendix B.
3.1.7 Data recording
The time series recorded consist of average values, standard deviations, minimum and maximum
values for 10- minute averages. The sampling interval was 1/s (1Hz) according to [Ref. 1].
The retrieval of of measurement data can be done by two ways, (i) manual read out and direct
connection of a Laptop to the data logger by a technical staff, and (ii) via GSM mobile phone da-
ta transfer. In the present program, sites which are located remotely (relative to Ho Chi Minh
city) are installed with GSM mobile phone data transfer, which totals 5 (out of 10 systems). Pri-
or to that (which data retrieval option to be used), telecom signals at those sites were checked to
ensure the systems work.
3.1.8 Maintenance and monitoring of measurement station
To get secured measurement data a quarter-annual investigation and maintenance of the meas-
urement station and the measurement data was performed. Due to the permanent influence of the
weather the met mast and the sensors are subject to natural wear and tear.

Final report of wind measurement – GIZ/MoIT Wind Energy Project
Page | 12
4 Measurement Results
The following Table 34 shows the starting date of operation for each measurement site. The fin-
ishing date represents the ceiling of this final report.
Site Starting date Finishing date
Eaphe 13.04.2012 00:00 30.04.2014 23:50
Table 3: Periods of evaluation of measurement data
The following Table 5 - Error! Reference source not found.6 represent the most relevant pa-
rameters describing the wind climatological characteristics for each measurement site. The wind
speed values in this report represent Weibull fitted averages. For some monthly evaluations no
Weibull-Fit was possible as due to strong prevailing main wind directions not all sectors were
covered by a sufficient number of measurement data (there was just no wind coming out of these
directions) or the measured wind speeds were too high for an accurate derivation of a Weibull
function. This however does not cause a problem for the annual consideration, which is relevant
for energy yield calculations, as for this period a Weibull-Fit was possible for all stations and az-
imuth sectors.

Final report of wind measurement – GIZ/MoIT Wind Energy Project
Page | 13
The following Table 5 represents the orientation, type, serial number and calibration parameters
of the wind measurement equipment used at Eaphe station.
Sensor Type Serial Calibration-
Number
H.a.g.l.
[m]
Boom ori-
entation
[°]
North
label
[°] /
Offset
Slope Offset
EaPhe Coordinates (UTM WGS84) X / Y: 213303.43 / 1408896.40
Top Ane-
mometer Thies 1st Class 11102444 10/8169 80 - - 0.04591 0.241
Mid Ane-
mometer Thies 1st Class 11102434 10/8197 60 - - 0.04579 0.264
Bottom An-
emometer Thies 1st Class 11102433 10/8198 40 - - 0.04572 0.274
Wind Vane Wind Vane
Thies4.3128.00.xxx 11100809 - 80 350 170 - -
Data Logger Ammonit Meteo32 C100649 6 - - - -
Temperature
Sensor 1 P6312 14 - - - -
Humidity
Sensor 1 P6312 14 - - - -
Barometer Air Pressure sensor
AB60 6 - - - -
Table 5: Orientation, type, serial number and calibration parameters of measurement equipment at EaPhe station
Final report of wind measurement – GIZ/MoIT Wind Energy Project
Page | 14
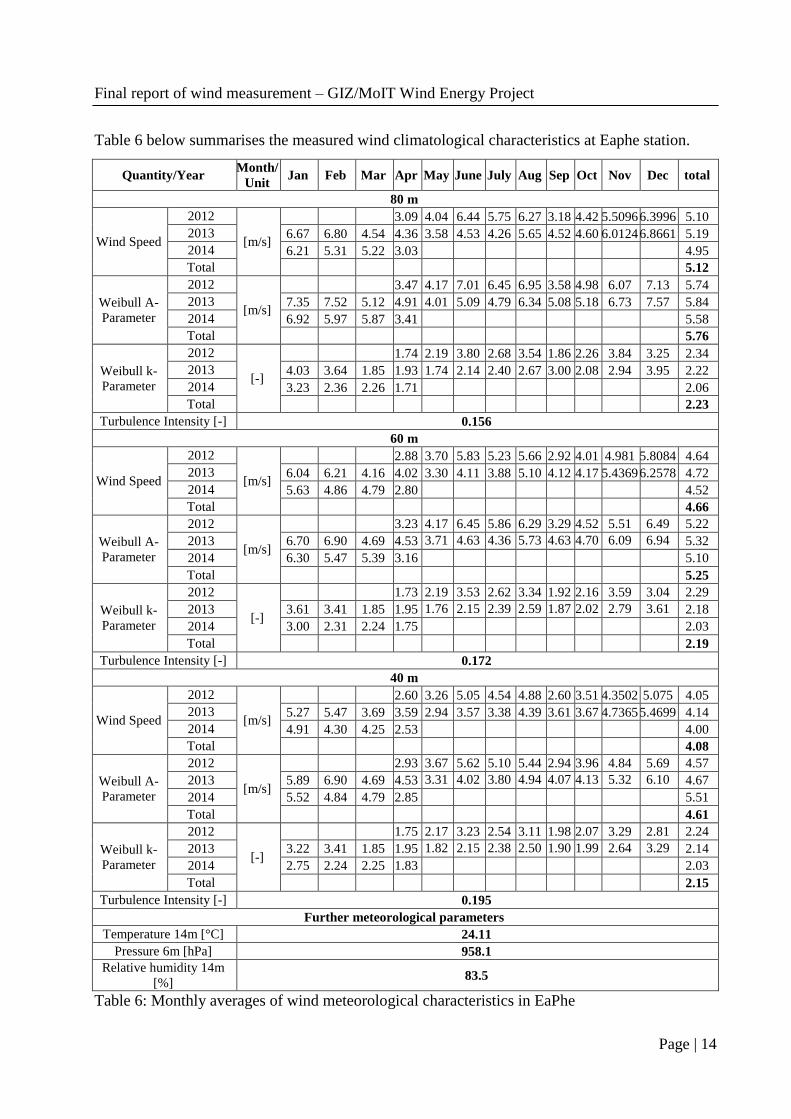
Table 6 below summarises the measured wind climatological characteristics at Eaphe station.
Quantity/Year Month/
Unit Jan Feb Mar Apr May June July Aug Sep Oct Nov Dec total
80 m
Wind Speed
2012
[m/s]
3.09 4.04 6.44 5.75 6.27 3.18 4.42 5.5096 6.3996 5.10
2013 6.67 6.80 4.54 4.36 3.58 4.53 4.26 5.65 4.52 4.60 6.0124 6.8661 5.19
2014 6.21 5.31 5.22 3.03 4.95
Total 5.12
Weibull A-
Parameter
2012
[m/s]
3.47 4.17 7.01 6.45 6.95 3.58 4.98 6.07 7.13 5.74
2013 7.35 7.52 5.12 4.91 4.01 5.09 4.79 6.34 5.08 5.18 6.73 7.57 5.84
2014 6.92 5.97 5.87 3.41 5.58
Total 5.76
Weibull k-
Parameter
2012
[-]
1.74 2.19 3.80 2.68 3.54 1.86 2.26 3.84 3.25 2.34
2013 4.03 3.64 1.85 1.93 1.74 2.14 2.40 2.67 3.00 2.08 2.94 3.95 2.22
2014 3.23 2.36 2.26 1.71 2.06
Total 2.23
Turbulence Intensity [-] 0.156
60 m
Wind Speed
2012
[m/s]
2.88 3.70 5.83 5.23 5.66 2.92 4.01 4.981 5.8084 4.64
2013 6.04 6.21 4.16 4.02 3.30 4.11 3.88 5.10 4.12 4.17 5.4369 6.2578 4.72
2014 5.63 4.86 4.79 2.80 4.52
Total 4.66
Weibull A-
Parameter
2012
[m/s]
3.23 4.17 6.45 5.86 6.29 3.29 4.52 5.51 6.49 5.22
2013 6.70 6.90 4.69 4.53 3.71 4.63 4.36 5.73 4.63 4.70 6.09 6.94 5.32
2014 6.30 5.47 5.39 3.16 5.10
Total 5.25
Weibull k-
Parameter
2012
[-]
1.73 2.19 3.53 2.62 3.34 1.92 2.16 3.59 3.04 2.29
2013 3.61 3.41 1.85 1.95 1.76 2.15 2.39 2.59 1.87 2.02 2.79 3.61 2.18
2014 3.00 2.31 2.24 1.75 2.03
Total 2.19
Turbulence Intensity [-] 0.172
40 m
Wind Speed
2012
[m/s]
2.60 3.26 5.05 4.54 4.88 2.60 3.51 4.3502 5.075 4.05
2013 5.27 5.47 3.69 3.59 2.94 3.57 3.38 4.39 3.61 3.67 4.7365 5.4699 4.14
2014 4.91 4.30 4.25 2.53 4.00
Total 4.08
Weibull A-
Parameter
2012
[m/s]
2.93 3.67 5.62 5.10 5.44 2.94 3.96 4.84 5.69 4.57
2013 5.89 6.90 4.69 4.53 3.31 4.02 3.80 4.94 4.07 4.13 5.32 6.10 4.67
2014 5.52 4.84 4.79 2.85 5.51
Total 4.61
Weibull k-
Parameter
2012
[-]
1.75 2.17 3.23 2.54 3.11 1.98 2.07 3.29 2.81 2.24
2013 3.22 3.41 1.85 1.95 1.82 2.15 2.38 2.50 1.90 1.99 2.64 3.29 2.14
2014 2.75 2.24 2.25 1.83 2.03
Total 2.15
Turbulence Intensity [-] 0.195
Further meteorological parameters
Temperature 14m [°C] 24.11
Pressure 6m [hPa] 958.1
Relative humidity 14m
[%] 83.5
Table 6: Monthly averages of wind meteorological characteristics in EaPhe

Final report of wind measurement – GIZ/MoIT Wind Energy Project
Page | 15
In terms of system performance, the system function properly– no missing data recorded. A
summary on the measurement result is given below while details are in the Appendix.
Effectively, from 01.05.2012 to 30.04.2013 mean wind speed recorded at 80 m high was 5.17
m/s. Main wind directions were between 45 to 75 degrees. Wind speed is distributed according
to Weibull equation with parameter A=5.91 m/s and k=2.34.
Wind is stronger during December and February and weak during the remaining months, espe-
cially in April, May and in September. This monthly pattern complements hydro quite well
which is plentiful during April-September, and presently accounting for 40% of national sys-
tem’s generation output.
In terms of mean diurnal profile, wind is strong during daytime and weak during night time. This
characteristic is desirable as it can contribute to meeting noon peak which is becoming higher
than evening peak where the drivers are increasing consumption of the commercial sector and
industry.
Despite these salient features, by classification in wind energy industry, this wind is just “medi-
um”, not so attractive unless the measurement was undertaken in a low wind speed year – this
topic will be dealt in the next section.

Final report of wind measurement – GIZ/MoIT Wind Energy Project
Page | 16
5 Long Term Correction
The above results came from the two-year measurement from 01/05/2012 till 30/04/2014 which
does not necessarily represent the long term wind climate at the site. Thus, a long term correction
of the results is necessary. The only available long-term data are from meteorological stations
which are measured in cities or towns at 10 m high and usually with only 4 readings per day and
available only as monthly average values.
By an investigation, it was found out that measured data shows a reasonable correlation to long
term data from Da Lat meteorological station (correlation factor: 0.78).
-
1.00
2.00
3.00
4.00
5.00
6.00
7.00
8.00
Jan
Mar
May
July
Sep
No
v
Jan
Mar
May
July
Sep
No
v
Jan
Mar
May
2012 2013 2014
DaLat
Eaphe
Figure 2: Correlation between measured data and long term data from meteorological station
Further study of meteorological data shows that the period of measurement fell into low wind
speed period, equivalent to 78% of long term average values was shown in Figure 3 which shows
annual average wind speed from 1997 to 2013.
0.00
0.50
1.00
1.50
2.00
2.50
3.00
m/s
Figure 3: Annual average wind speed at Da Lat meteorological station
Interpreting this phenomenon differently, actual wind speed could be as much as 128% higher
than the measured data.

Final report of wind measurement – GIZ/MoIT Wind Energy Project
Page | 17
Assuming this relationship held true in the past and in the future, it is then possible to make cor-
rection to measured data using this wind index, the average wind speed at 80 m at EaPhe then
could be as high as 6.63 m/s which is good by classification of wind energy industry. Certainly,
there is uncertainty with this which will be dealt with in the next section.

Final report of wind measurement – GIZ/MoIT Wind Energy Project
Page | 18
6 Uncertainties of the wind measurement campaign
While measuring wind speed data diverse reasons may lead to uncertainties that are attached to
the measured data. Within the wind measurement campaign it was strived to reduce the uncer-
tainties to a minimum due to application of acknowledged standards and procedures concerning
the measurement equipment, the installation of the equipment, the structure of the measurement
mast as well as the data checking and correction methods. Moreover, calibrated wind measure-
ment equipment was used. However, even by considering the above means some remaining un-
certainties cannot be brought to a level of zero. These uncertainties may be of systematic or sta-
tistic nature. Uncertainties belonging to the long-term variations are referring to possible devia-
tion of the wind characteristics within the measurement period from the long term value and any
statistical and systematic uncertainty introduced by the procedure, based on which data gaps
were filled.
Table 7 represents the relative uncertainties attached to the wind database at the EaPhe:
Uncertainty Component Comment
Uncertainty
of Wind
Speed [%]
Wind speed measurement
Anemometer calibration Uncertainty applied for whole wind tunnel cali-
bration range 1.90%
Anemometer mounting effects
- Flow distortion
- Shadow effect
Non ideal anemometer mounting
0.6%
0.5%
Anemometer characteristics relative
Uncertainty of correction of aerodynamic over-
speeding including other effects of anemometer
properties
1.0%
Long-term variations
Estimated uncertainty due to possible deviation
of the wind characteristics within the measure-
ment period from the long term value and possi-
ble deviations of the wind characteristics within
the measurement period from the missing period
that was filled by statistical means
2.29%
Data acquisition relative to mean wind speed Uncertainty of data recording 0.1 %
Total uncertainty wind data base 3.24%
Table 7: Relative uncertainty of the meteorological data at EaPhe station in terms of wind speed. All values denote
the standard uncertainty in accordance to the International Standards Organisation1.
1 International Standards Organisation, Guide to the Expression of Uncertainty in Measurement, 1995

Final report of wind measurement – GIZ/MoIT Wind Energy Project
Page | 19
7 Detailed Wind Measurement Data Analysis and Evaluation
Within Appendix A for each measurement height a detailed analysis report is provided.
The important features that describe the characteristics of the wind climate at the site and the cor-
responding Appendix are described below
Measurement height
Analysis issue 80m 60m 40m
Statistics of records I II III
Frequency Distribution
of Wind Direction at 80
m
IV
Frequency Distribution
of Wind Speed V VI VII
Course of Wind Speed
(80m) and Wind Direc-
tion (80m) over the day
VIII
Course of Wind Speed
(80m) and Wind Direc-
tion (80m) over the
months
IX
Table 4: Wind data analysis and evaluation for all measurement stations within Appendix A

Final report of wind measurement – GIZ/MoIT Wind Energy Project
Page | 20
8 References
Ref. 1 IEC 61400-121: WIND TURBINES – Part 121: Power performance measure-
ments of grid connected wind turbines
Ref. 2 IEA 1st Ed. 1999: Recommended Practices for Wind Turbine Testing and Evalua-
tion 11. Wind Speed Measurement and use of Cup Anemometry

Final report of wind measurement – GIZ/MoIT Wind Energy Project
Page | 21
Appendix A – Detailed Wind Measurement Data Analysis and Evaluation
I - Statistics of records
80m height
Day 4.12 5.12 6.12 7.12 8.12 9.12 10.12 11.12 12.12
1 0 144 144 144 144 144 144 144 144
2 0 144 144 144 144 144 144 144 144
3 0 144 144 144 144 144 144 144 144
4 0 144 144 144 144 144 144 144 144
5 0 144 144 144 144 144 144 144 144
6 0 144 144 144 144 144 144 144 144
7 0 144 144 144 144 144 144 144 144
8 0 144 144 144 144 144 144 144 144
9 0 144 144 144 144 144 144 144 144
10 0 144 144 144 144 144 144 144 144
11 0 144 144 144 144 144 144 144 144
12 0 144 144 144 144 144 144 144 144
13 144 144 144 144 144 144 144 144 144
14 144 144 144 144 144 144 144 144 144
15 144 144 144 144 144 144 144 144 144
16 144 144 144 144 144 144 144 144 144
17 144 144 144 144 144 144 144 144 144
18 144 144 144 144 144 144 144 144 144
19 144 144 144 144 144 144 144 144 144
20 144 144 144 144 144 144 144 144 144
21 144 144 144 144 144 144 144 144 144
22 144 144 144 144 144 144 144 144 144
23 144 144 144 144 144 144 144 144 144
24 144 144 144 144 144 144 144 144 144
25 144 144 144 144 144 144 144 144 144
26 144 144 144 144 144 144 144 144 144
27 144 144 144 144 144 144 144 144 144
28 144 144 144 144 144 144 144 144 144
29 144 144 144 144 144 144 144 144 144
30 144 144 144 144 144 144 144 144 144
31
144
144 144
144
144
% 60.0 100.0 100.0 100.0 100.0 100.0 100.0 100.0 100.0

Final report of wind measurement – GIZ/MoIT Wind Energy Project
Page | 22
Day 1.13 2.13 3.13 4.13 5.13 6.13 7.13 8.13 9.13 10.13 11.13 12.13
1 144 144 144 144 144 144 144 144 142 144 144 144
2 144 144 144 144 144 144 144 144 144 144 144 144
3 144 144 144 144 144 144 144 144 144 142 144 144
4 144 144 144 144 144 143 144 144 144 140 144 144
5 144 144 144 144 144 144 143 144 144 144 144 144
6 144 144 144 144 144 144 144 144 144 144 144 144
7 144 144 144 144 144 143 144 144 144 144 144 144
8 144 144 144 144 144 144 144 144 144 144 144 144
9 144 144 144 144 144 144 144 144 144 144 144 144
10 144 144 144 144 144 144 144 144 144 144 144 144
11 144 144 144 144 143 144 144 144 144 144 144 144
12 144 144 144 144 144 144 144 144 144 144 144 144
13 144 144 144 144 144 144 144 144 144 144 144 144
14 144 144 144 144 144 144 144 144 144 144 144 144
15 144 144 144 144 144 144 144 144 144 144 144 144
16 144 144 144 144 144 144 144 144 144 144 144 144
17 144 144 144 144 144 144 144 144 144 144 144 144
18 144 144 144 144 144 144 144 144 144 144 144 144
19 144 144 144 144 144 144 144 144 144 144 144 144
20 144 144 144 144 144 144 144 144 144 144 144 144
21 144 144 144 144 144 144 144 144 144 144 144 144
22 144 144 144 143 144 144 144 144 144 144 144 144
23 144 144 144 144 144 144 144 144 144 144 144 144
24 144 144 144 144 144 144 144 144 144 144 144 144
25 144 144 143 144 144 144 144 144 144 144 144 144
26 144 144 144 144 144 144 144 144 144 144 144 144
27 144 144 144 144 144 144 144 144 144 144 144 144
28 144 144 144 144 142 144 144 144 144 144 144 144
29 144 0 144 144 144 144 144 144 144 144 144 144
30 144 0 144 144 144 144 144 144 144 144 144 144
31 144 0 144 0 144 0 144 144 0 144 0 144
% 100.0 100.0 100.0 100.0 99.9 100.0 100.0 100.0 100.0 99.9 100.0 100.0

Final report of wind measurement – GIZ/MoIT Wind Energy Project
Page | 23
Day 1.14 2.14 3.14 4.14 5.14 6.14 7.14 8.14 9.14 10.14 11.14 12.14
1 144 144 144 144 0 0 0 0 0 0 0 0
2 144 144 144 144 0 0 0 0 0 0 0 0
3 144 141 144 144 0 0 0 0 0 0 0 0
4 144 144 144 144 0 0 0 0 0 0 0 0
5 144 144 144 144 0 0 0 0 0 0 0 0
6 144 144 144 144 0 0 0 0 0 0 0 0
7 144 144 144 144 0 0 0 0 0 0 0 0
8 144 144 144 144 0 0 0 0 0 0 0 0
9 144 144 144 144 0 0 0 0 0 0 0 0
10 144 144 144 144 0 0 0 0 0 0 0 0
11 144 144 144 144 0 0 0 0 0 0 0 0
12 144 144 144 144 0 0 0 0 0 0 0 0
13 144 144 144 144 0 0 0 0 0 0 0 0
14 144 144 144 144 0 0 0 0 0 0 0 0
15 144 144 144 144 0 0 0 0 0 0 0 0
16 144 144 144 144 0 0 0 0 0 0 0 0
17 144 144 144 144 0 0 0 0 0 0 0 0
18 144 144 144 144 0 0 0 0 0 0 0 0
19 144 144 144 144 0 0 0 0 0 0 0 0
20 144 144 144 144 0 0 0 0 0 0 0 0
21 144 144 144 144 0 0 0 0 0 0 0 0
22 144 144 144 144 0 0 0 0 0 0 0 0
23 144 144 144 143 0 0 0 0 0 0 0 0
24 144 144 144 144 0 0 0 0 0 0 0 0
25 144 144 144 144 0 0 0 0 0 0 0 0
26 144 144 144 144 0 0 0 0 0 0 0 0
27 144 144 144 144 0 0 0 0 0 0 0 0
28 144 144 144 144 0 0 0 0 0 0 0 0
29 144 0 144 144 0 0 0 0 0 0 0 0
30 144 0 144 144 0 0 0 0 0 0 0 0
31 144 0 143 0 0 0 0 0 0 0 0 0
% 100.0 99.9 100.0 100.0 0.0 0.0 0.0 0.0 0.0 0.0 0.0 0.0

Final report of wind measurement – GIZ/MoIT Wind Energy Project
Page | 24
60m height
Day 4.12 5.12 6.12 7.12 8.12 9.12 10.12 11.12 12.12
1 0 144 144 144 144 144 144 144 144
2 0 144 144 144 144 144 144 144 144
3 0 144 144 144 144 144 144 144 144
4 0 144 144 144 144 144 144 144 144
5 0 144 144 144 144 144 144 144 144
6 0 144 144 144 144 144 144 144 144
7 0 144 144 144 144 144 144 144 144
8 0 144 144 144 144 144 144 144 144
9 0 144 144 144 144 144 144 144 144
10 0 144 144 144 144 144 144 144 144
11 0 144 144 144 144 144 144 144 144
12 0 144 144 144 144 144 144 144 144
13 144 144 144 144 144 144 144 144 144
14 144 144 144 144 144 144 144 144 144
15 144 144 144 144 144 144 144 144 144
16 144 144 144 144 144 144 144 144 144
17 144 144 144 144 144 144 144 144 144
18 144 144 144 144 144 144 144 144 144
19 144 144 144 144 144 144 144 144 144
20 144 144 144 144 144 144 144 144 144
21 144 144 144 144 144 144 144 144 144
22 144 144 144 144 144 144 144 144 144
23 144 144 144 144 144 144 144 144 144
24 144 144 144 144 144 144 144 144 144
25 144 144 144 144 144 144 144 144 144
26 144 144 144 144 144 144 144 144 144
27 144 144 144 144 144 144 144 144 144
28 144 144 144 144 144 144 144 144 144
29 144 144 144 144 144 144 144 144 144
30 144 144 144 144 144 144 144 144 144
31
144
144 144
144
144
% 60.0 100.0 100.0 100.0 100.0 100.0 100.0 100.0 100.0

Final report of wind measurement – GIZ/MoIT Wind Energy Project
Page | 25
Day 1.13 2.13 3.13 4.13 5.13 6.13 7.13 8.13 9.13 10.13 11.13 12.13
1 144 144 144 144 144 144 144 144 143 144 144 144
2 144 144 144 144 144 144 144 144 144 143 144 144
3 144 144 144 144 144 144 144 144 144 141 144 144
4 144 144 144 144 144 144 144 144 144 142 144 144
5 144 144 144 144 144 144 144 144 144 144 144 144
6 144 144 144 144 144 144 144 144 144 144 144 144
7 144 144 144 144 144 144 144 144 144 144 144 144
8 144 144 144 144 144 144 144 144 144 144 144 144
9 144 144 144 144 144 144 144 144 144 144 144 144
10 144 144 144 144 144 144 144 144 144 144 144 144
11 144 144 144 144 142 144 144 144 144 144 144 144
12 144 144 144 144 144 143 144 144 144 143 144 144
13 144 144 144 144 144 144 144 144 144 144 144 144
14 144 144 144 144 144 144 144 144 144 144 144 144
15 144 144 144 144 144 144 144 144 144 144 144 144
16 144 144 144 144 144 144 144 144 144 144 144 144
17 144 144 144 144 144 144 144 144 144 144 144 144
18 144 144 144 144 144 144 144 144 144 144 144 144
19 144 144 144 144 144 144 144 144 144 144 144 144
20 144 144 144 144 144 144 144 144 144 144 144 144
21 144 144 144 144 144 144 144 144 144 144 144 144
22 144 144 144 144 144 144 144 144 144 144 144 144
23 144 144 144 144 144 144 144 144 144 144 144 144
24 144 144 144 144 144 144 144 144 144 144 144 144
25 144 144 142 144 144 144 144 144 144 144 144 144
26 144 144 144 144 144 144 144 144 144 144 144 144
27 144 144 144 144 144 144 144 144 144 144 144 144
28 144 144 144 143 144 144 144 144 144 144 144 144
29 144 0 144 144 144 144 144 144 144 144 144 144
30 144 0 144 144 144 144 144 144 144 144 144 144
31 144 0 144 0 144 0 144 144 0 144 0 144
% 100.0 100.0 100.0 100.0 100.0 100.0 100.0 100.0 100.0 99.8 100.0 100.0

Final report of wind measurement – GIZ/MoIT Wind Energy Project
Page | 26
Day 1.14 2.14 3.14 4.14 5.14 6.14 7.14 8.14 9.14 10.14 11.14 12.14
1 144 144 144 144 0 0 0 0 0 0 0 0
2 144 144 144 144 0 0 0 0 0 0 0 0
3 144 144 144 144 0 0 0 0 0 0 0 0
4 144 144 144 144 0 0 0 0 0 0 0 0
5 144 144 144 144 0 0 0 0 0 0 0 0
6 144 144 144 144 0 0 0 0 0 0 0 0
7 144 144 144 144 0 0 0 0 0 0 0 0
8 144 144 144 144 0 0 0 0 0 0 0 0
9 144 143 144 144 0 0 0 0 0 0 0 0
10 144 144 144 144 0 0 0 0 0 0 0 0
11 144 144 144 144 0 0 0 0 0 0 0 0
12 144 144 144 144 0 0 0 0 0 0 0 0
13 144 144 144 144 0 0 0 0 0 0 0 0
14 144 144 144 144 0 0 0 0 0 0 0 0
15 144 144 144 144 0 0 0 0 0 0 0 0
16 144 144 144 144 0 0 0 0 0 0 0 0
17 144 144 144 144 0 0 0 0 0 0 0 0
18 144 144 144 144 0 0 0 0 0 0 0 0
19 144 144 144 144 0 0 0 0 0 0 0 0
20 144 144 144 144 0 0 0 0 0 0 0 0
21 144 144 144 144 0 0 0 0 0 0 0 0
22 144 144 144 144 0 0 0 0 0 0 0 0
23 144 144 144 144 0 0 0 0 0 0 0 0
24 144 144 144 144 0 0 0 0 0 0 0 0
25 144 144 144 144 0 0 0 0 0 0 0 0
26 144 144 144 144 0 0 0 0 0 0 0 0
27 144 144 144 144 0 0 0 0 0 0 0 0
28 144 144 144 144 0 0 0 0 0 0 0 0
29 144 0 144 144 0 0 0 0 0 0 0 0
30 144 0 144 144 0 0 0 0 0 0 0 0
31 144 0 144 0 0 0 0 0 0 0 0 0
% 100.0 100.0 100.0 100.0 0.0 0.0 0.0 0.0 0.0 0.0 0.0 0.0

Final report of wind measurement – GIZ/MoIT Wind Energy Project
Page | 27
40m height
Day 4.12 5.12 6.12 7.12 8.12 9.12 10.12 11.12 12.12
1 0 144 144 144 144 144 144 144 144
2 0 144 144 144 144 144 144 144 144
3 0 144 144 144 144 144 144 144 144
4 0 144 144 144 144 144 144 144 144
5 0 144 144 144 144 144 144 144 144
6 0 144 144 144 144 144 144 144 144
7 0 144 144 144 144 144 144 144 144
8 0 144 144 144 144 144 144 144 144
9 0 144 144 144 144 144 144 144 144
10 0 144 144 143 144 144 144 144 144
11 0 144 144 144 144 144 144 144 144
12 0 144 144 144 144 144 144 144 144
13 144 144 144 144 144 144 144 144 144
14 144 144 144 144 144 144 144 144 144
15 144 144 144 144 144 144 144 144 144
16 144 144 144 144 144 144 144 144 144
17 144 144 144 144 144 144 144 144 144
18 144 144 144 144 144 144 144 144 144
19 144 144 144 144 144 144 144 144 144
20 144 144 144 144 144 144 144 144 144
21 143 144 144 144 144 144 144 144 144
22 143 144 144 144 144 144 144 144 144
23 144 144 144 144 144 144 144 144 144
24 144 144 144 144 144 144 144 144 144
25 144 144 144 144 144 144 144 144 144
26 144 144 144 144 144 144 144 144 144
27 144 144 144 144 144 144 144 144 144
28 144 144 144 144 144 144 144 144 144
29 144 144 144 144 144 144 144 144 144
30 144 144 144 144 144 144 144 144 144
31
144
144 144
144
144
% 60.0 100.0 100.0 100.0 100.0 100.0 100.0 100.0 100.0

Final report of wind measurement – GIZ/MoIT Wind Energy Project
Page | 28
Day 1.13 2.13 3.13 4.13 5.13 6.13 7.13 8.13 9.13 10.13 11.13 12.13
1 144 144 144 144 144 144 144 144 144 144 144 144
2 144 144 144 144 144 144 144 144 144 144 144 144
3 144 144 144 144 144 143 144 144 144 144 144 144
4 144 144 144 144 144 144 144 144 144 144 144 144
5 144 144 144 144 144 142 140 144 144 143 144 144
6 144 144 144 144 144 144 144 144 144 144 144 144
7 144 144 144 144 144 137 144 144 144 144 144 144
8 144 144 144 144 144 144 144 144 144 143 144 144
9 144 144 144 144 142 144 144 142 144 140 144 144
10 144 144 144 144 144 144 144 143 143 144 144 144
11 144 144 144 144 138 144 144 144 144 144 139 144
12 144 144 144 144 143 143 144 144 142 144 144 144
13 144 144 144 144 144 144 144 144 144 144 144 144
14 144 144 144 144 144 144 144 144 144 144 144 144
15 144 144 144 144 143 144 144 144 144 144 144 144
16 144 144 144 144 143 144 144 144 144 144 144 144
17 144 144 144 144 144 144 144 144 144 144 144 144
18 144 144 144 144 144 144 144 144 144 144 144 144
19 144 144 144 143 144 144 144 144 144 144 144 144
20 144 144 144 144 144 144 144 144 144 144 144 144
21 144 144 143 144 144 144 144 144 144 144 144 144
22 144 144 144 144 144 144 144 144 144 144 144 144
23 144 144 144 144 144 144 144 144 144 144 144 144
24 144 144 144 144 144 144 144 144 144 144 144 144
25 144 144 144 144 144 144 144 144 144 144 144 144
26 144 144 144 144 144 144 144 144 144 144 144 144
27 144 144 144 144 144 144 144 144 144 144 144 144
28 144 144 144 139 140 144 144 144 144 144 144 144
29 144 0 144 144 144 144 144 144 144 144 144 144
30 144 0 144 144 143 144 144 144 144 144 144 144
31 144 0 144 0 144 0 144 144 0 144 0 144
% 100.0 100.0 100.0 99.9 99.6 99.7 99.9 99.9 99.9 99.9 99.9 100.0
Day 1.14 2.14 3.14 4.14 5.14 6.14 7.14 8.14 9.14 10.14 11.14 12.14
1 144 144 144 144 0 0 0 0 0 0 0 0
2 144 144 144 144 0 0 0 0 0 0 0 0
3 144 143 144 144 0 0 0 0 0 0 0 0
4 144 144 144 144 0 0 0 0 0 0 0 0
5 144 144 144 144 0 0 0 0 0 0 0 0
6 144 144 144 144 0 0 0 0 0 0 0 0
7 144 144 144 144 0 0 0 0 0 0 0 0
8 144 144 144 144 0 0 0 0 0 0 0 0

Final report of wind measurement – GIZ/MoIT Wind Energy Project
Page | 29
9 144 143 144 144 0 0 0 0 0 0 0 0
10 144 140 144 144 0 0 0 0 0 0 0 0
11 144 144 144 144 0 0 0 0 0 0 0 0
12 144 144 144 144 0 0 0 0 0 0 0 0
13 144 144 143 144 0 0 0 0 0 0 0 0
14 144 144 144 144 0 0 0 0 0 0 0 0
15 144 144 144 144 0 0 0 0 0 0 0 0
16 144 144 144 144 0 0 0 0 0 0 0 0
17 144 144 144 144 0 0 0 0 0 0 0 0
18 144 144 144 144 0 0 0 0 0 0 0 0
19 144 144 144 144 0 0 0 0 0 0 0 0
20 144 144 144 144 0 0 0 0 0 0 0 0
21 144 144 144 144 0 0 0 0 0 0 0 0
22 144 144 144 144 0 0 0 0 0 0 0 0
23 144 144 144 144 0 0 0 0 0 0 0 0
24 144 144 144 144 0 0 0 0 0 0 0 0
25 144 144 144 144 0 0 0 0 0 0 0 0
26 144 144 144 144 0 0 0 0 0 0 0 0
27 144 144 144 144 0 0 0 0 0 0 0 0
28 144 144 144 144 0 0 0 0 0 0 0 0
29 144 0 144 144 0 0 0 0 0 0 0 0
30 144 0 144 144 0 0 0 0 0 0 0 0
31 144 0 144 0 0 0 0 0 0 0 0 0
% 100.0 99.9 100.0 100.0 0.0 0.0 0.0 0.0 0.0 0.0 0.0 0.0
Final report of wind measurement – GIZ/MoIT Wind Energy Project
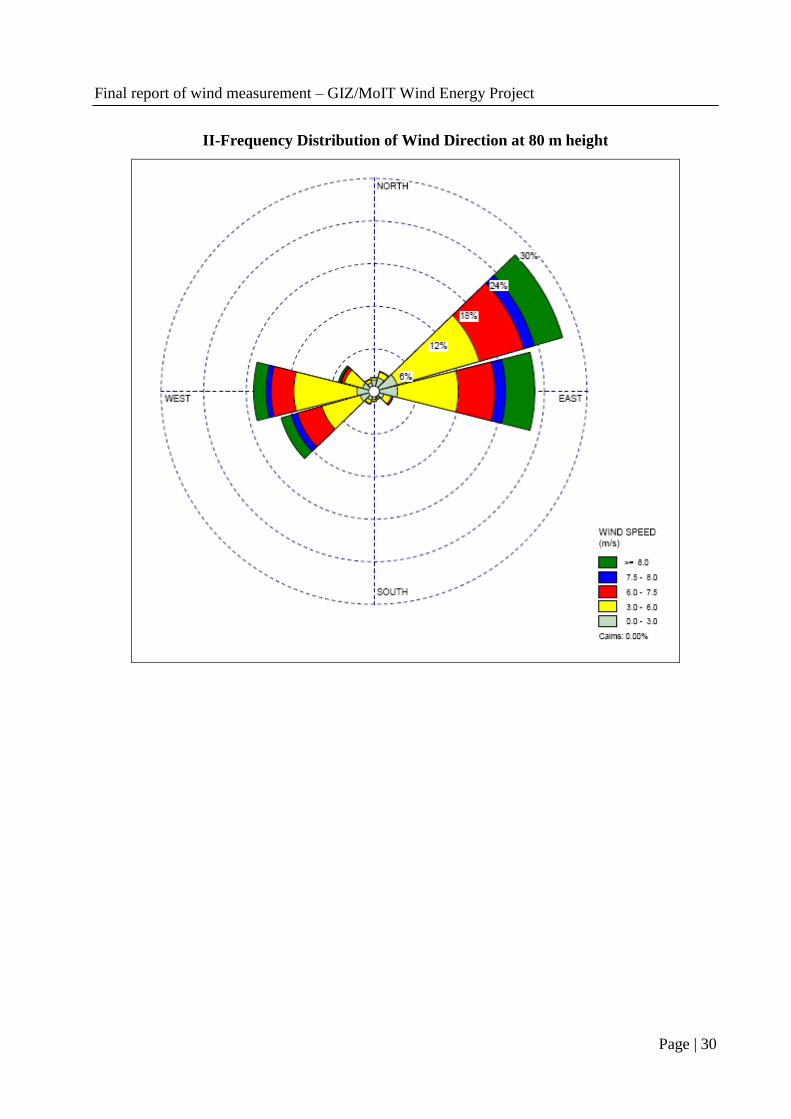
Page | 30
II-Frequency Distribution of Wind Direction at 80 m height
Final report of wind measurement – GIZ/MoIT Wind Energy Project
Page | 31
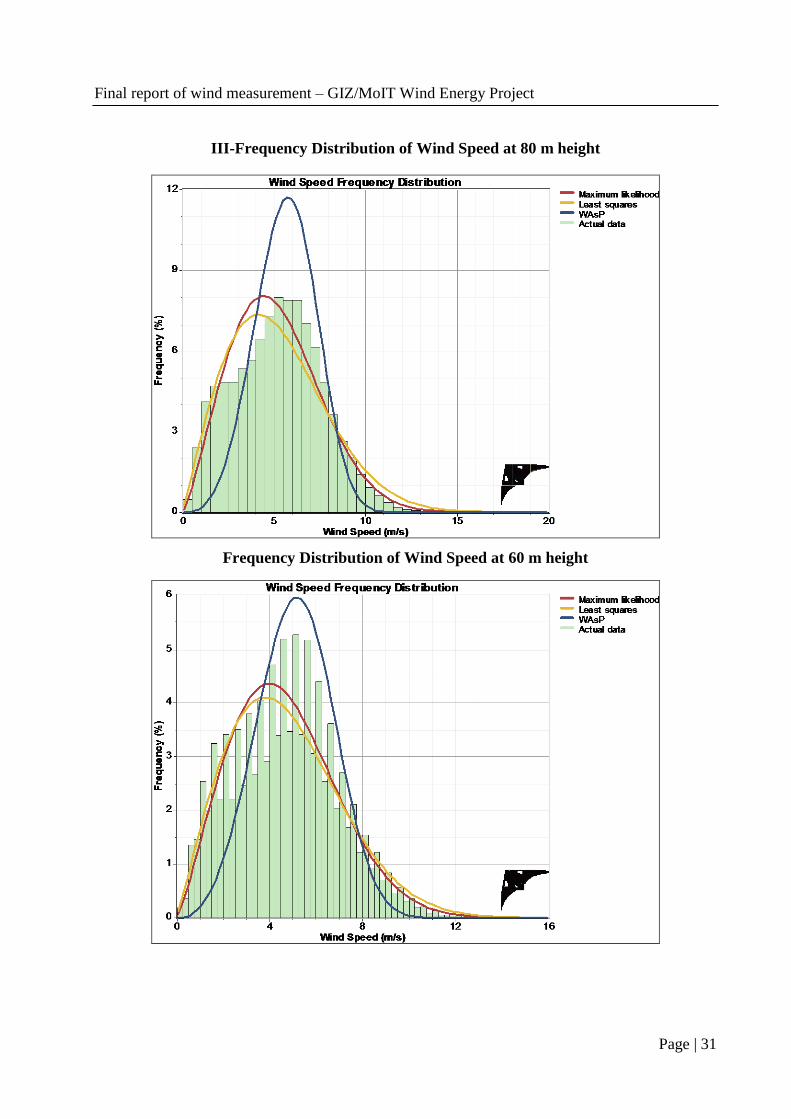
III-Frequency Distribution of Wind Speed at 80 m height
Frequency Distribution of Wind Speed at 60 m height

Final report of wind measurement – GIZ/MoIT Wind Energy Project
Page | 32
Frequency Distribution of Wind Speed at 40 m height

Final report of wind measurement – GIZ/MoIT Wind Energy Project
Page | 33
IV-Course of Wind Speed 80m, 60m and 40m over the day
V-Course of Wind Speed 80m and Wind Direction 80m over the months

Final report of wind measurement – GIZ/MoIT Wind Energy Project
Page | 34
Appendix B – Calibration sheets EaPhe
EaPhe Thies 1st Class Anemometer at 80m:

Final report of wind measurement – GIZ/MoIT Wind Energy Project
Page | 35

Final report of wind measurement – GIZ/MoIT Wind Energy Project
Page | 36

Final report of wind measurement – GIZ/MoIT Wind Energy Project
Page | 37

Final report of wind measurement – GIZ/MoIT Wind Energy Project
Page | 38

Final report of wind measurement – GIZ/MoIT Wind Energy Project
Page | 39

Final report of wind measurement – GIZ/MoIT Wind Energy Project
Page | 40
EaPhe Thies 1st Class Anemometer at 60m:

Final report of wind measurement – GIZ/MoIT Wind Energy Project
Page | 41

Final report of wind measurement – GIZ/MoIT Wind Energy Project
Page | 42

Final report of wind measurement – GIZ/MoIT Wind Energy Project
Page | 43

Final report of wind measurement – GIZ/MoIT Wind Energy Project
Page | 44
Final report of wind measurement – GIZ/MoIT Wind Energy Project
Page | 45
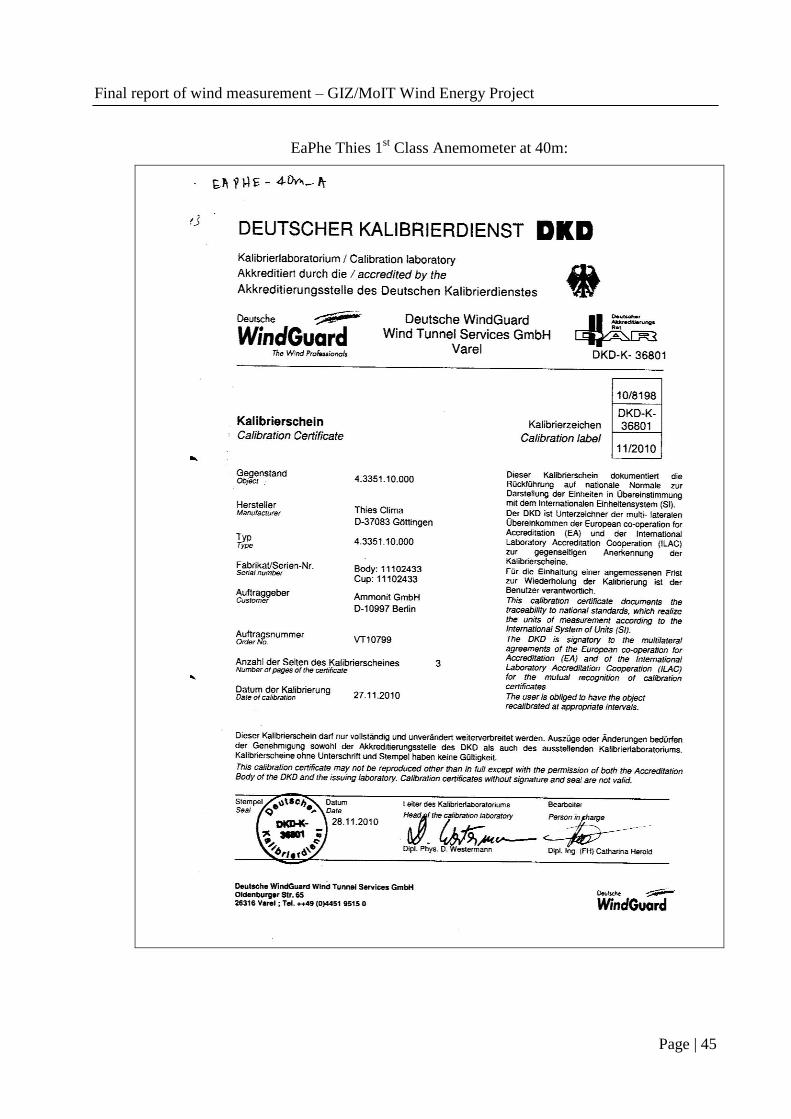
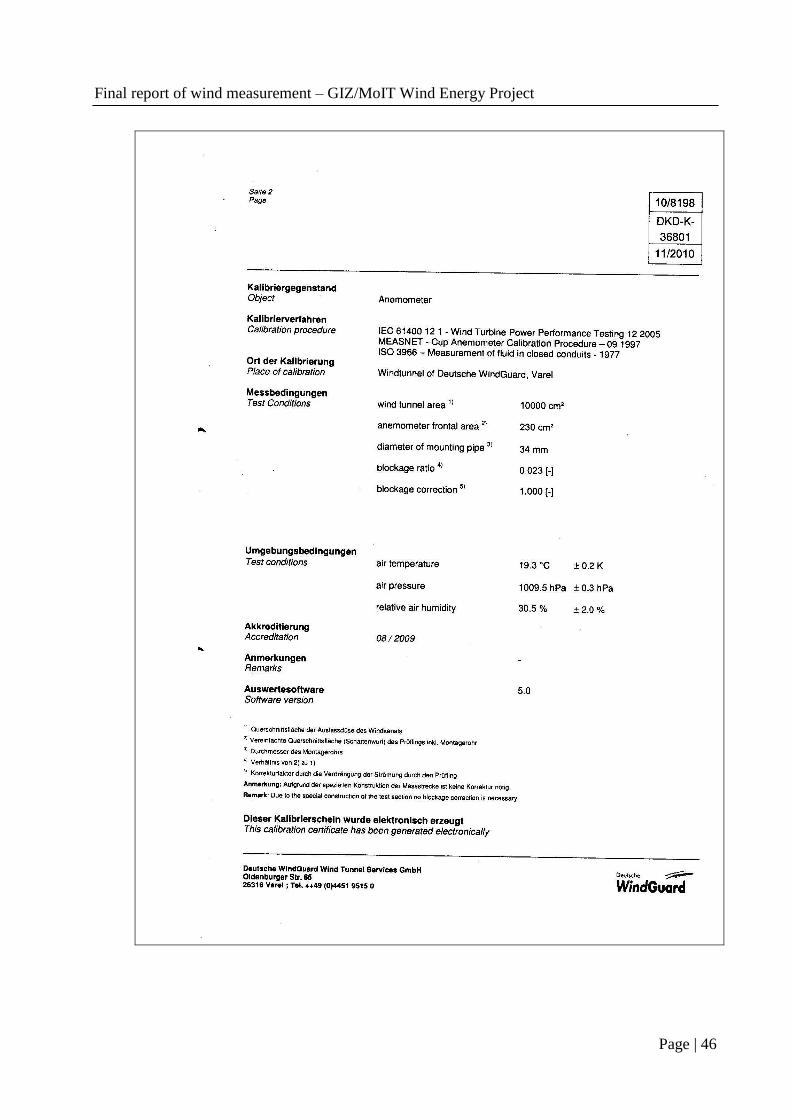
EaPhe Thies 1st Class Anemometer at 40m:
Final report of wind measurement – GIZ/MoIT Wind Energy Project
Page | 46

Final report of wind measurement – GIZ/MoIT Wind Energy Project
Page | 47

Final report of wind measurement – GIZ/MoIT Wind Energy Project
Page | 48

Final report of wind measurement – GIZ/MoIT Wind Energy Project
Page | 49