
(will be inserted by the editor) - University of...
35
http://wrap.warwick.ac.uk Original citation: Liu, Jun, Strangwood, Martin, Davis, Claire L. and Peyton, Anthony J.. (2013) Magnetic evaluation of microstructure changes in 9Cr-1Mo and 2.25Cr-1Mo steels using electromagnetic sensors. Metallurgical and Materials Transactions A - Physical Metallurgy and Materials Science, Volume 44 (Number 13). pp. 5897-5909. ISSN 1073- 5623 Permanent WRAP url: http://wrap.warwick.ac.uk/67568 Copyright and reuse: The Warwick Research Archive Portal (WRAP) makes this work by researchers of the University of Warwick available open access under the following conditions. Copyright © and all moral rights to the version of the paper presented here belong to the individual author(s) and/or other copyright owners. To the extent reasonable and practicable the material made available in WRAP has been checked for eligibility before being made available. Copies of full items can be used for personal research or study, educational, or not-for profit purposes without prior permission or charge. Provided that the authors, title and full bibliographic details are credited, a hyperlink and/or URL is given for the original metadata page and the content is not changed in any way. Publisher’s statement: “The final publication is available at Springer via http://dx.doi.org/10.1007/s11661-013- 1938-x ." A note on versions: The version presented here may differ from the published version or, version of record, if you wish to cite this item you are advised to consult the publisher’s version. Please see the ‘permanent WRAP url’ above for details on accessing the published version and note that access may require a subscription. For more information, please contact the WRAP Team at: [email protected]
Transcript of (will be inserted by the editor) - University of...
http://wrap.warwick.ac.uk
Original citation: Liu, Jun, Strangwood, Martin, Davis, Claire L. and Peyton, Anthony J.. (2013) Magnetic evaluation of microstructure changes in 9Cr-1Mo and 2.25Cr-1Mo steels using electromagnetic sensors. Metallurgical and Materials Transactions A - Physical Metallurgy and Materials Science, Volume 44 (Number 13). pp. 5897-5909. ISSN 1073-5623
Permanent WRAP url: http://wrap.warwick.ac.uk/67568 Copyright and reuse: The Warwick Research Archive Portal (WRAP) makes this work by researchers of the University of Warwick available open access under the following conditions. Copyright © and all moral rights to the version of the paper presented here belong to the individual author(s) and/or other copyright owners. To the extent reasonable and practicable the material made available in WRAP has been checked for eligibility before being made available. Copies of full items can be used for personal research or study, educational, or not-for profit purposes without prior permission or charge. Provided that the authors, title and full bibliographic details are credited, a hyperlink and/or URL is given for the original metadata page and the content is not changed in any way. Publisher’s statement: “The final publication is available at Springer via http://dx.doi.org/10.1007/s11661-013-1938-x ." A note on versions: The version presented here may differ from the published version or, version of record, if you wish to cite this item you are advised to consult the publisher’s version. Please see the ‘permanent WRAP url’ above for details on accessing the published version and note that access may require a subscription. For more information, please contact the WRAP Team at: [email protected]

Metallurgical and Materials Transactions A manuscript No.(will be inserted by the editor)
Magnetic evaluation of microstructure changes in 9Cr–1Mo
and 2.25Cr–1Mo steels using electromagnetic sensors
Jun Liu · Martin Strangwood · Claire L Davis ·
Anthony J Peyton
Received: date / Revised version: date
Abstract This paper presents results from a multi-frequency electromagnetic sensor used to
evaluate the microstructural changes in 9Cr–1Mo and 2.25Cr–1Mo power generation steels
after tempering and elevated temperature service exposure. Electromagnetic sensors detect
microstructural changes in steels due to changes in the relative permeability and resistivity.
It was found that the low frequency inductance value is particularly sensitive to the different
relative permeability values of both steels in the different microstructural conditions. The
changes in relative permeability have been quantitatively correlated with the microstruc-
Jun Liu ·Martin Strangwood · Claire L Davis
School of Metallurgy & Materials, University of Birmingham, Edgbaston, Birmingham B15 2TT, UK
Jun Liu E-mail: [email protected], [email protected]
Martin Strangwood E-mail: [email protected]
Claire L Davis E-mail: [email protected]
Anthony J Peyton
School of Electrical and Electronic Engineering, University of Manchester, Manchester M60 1QD, UK
E-mail: [email protected]

2 Jun Liu et al.
tural changes due to tempering and long term thermal exposure, in particular to changes in
martensitic/bainitic lath size and number density of carbide precipitates that determine the
mean free path to reversible domain wall motion. The role of these microstructural features
on pinning of magnetic domain wall motion is discussed.
Keywords EM sensor · magnetic properties · electrical resistivity · ferritic heat resistant
steels · magnetic domains
1 Introduction
Microstructural changes during operation of elevated temperature power generation steels
alter their properties and their remaining safe operating life (remnant life) [1]. Efficient
operation of power generation plant requires the microstructural condition to be assessed
during service. Currently the microstructural state is assessed using replicas of the surface or
inferred from hardness measurements, both taken during shut down periods. Non-destructive
evaluation (NDE) of the microstructural state of power plant steels during their service life is
of interest in order to give a more accurate assessment of safe remnant life. Amongst a wide
range of NDE techniques available, electromagnetic (EM) methods are of particular interest
in evaluation of ferromagnetic ferritic heat resistant steels. EM sensors can be used in a
non-contact fashion (with stand-off distances of over 10 mm [2] ) and can survey through
(non-magnetic, non-conducting) coatings. Ferritic Cr-Mo alloy steels are commonly used
for heavy section power plant components such as steam line pipes, boiler tubes and turbine
rotors operating at temperatures from around 833 K (560 °C) to 903 K (630 °C). Future
operating temperatures may increase to 923 K (650 °C) in order to increase the thermal
efficiency of power plant [3].

Title Suppressed Due to Excessive Length 3
Cr-Mo-based creep-resisting steels, such as the 2.25 Cr–1 Mo and 9 Cr–1Mo families,
are normalized, quenched and tempered, or normalized and tempered at service entry with
their microstructures consisting of a tempered lath martensite (lath widths about 0.3 µm–
0.5 µm) strengthened by alloy carbides [4]. During elevated temperature service (usually for
tens of years) the microstructure evolves gradually. Firstly, the fine tempered martensite laths
coarsen into broader ferrite laths. For example, Sawada et al. [5] observed, by in-situ TEM,
the distribution of the lath size for a 9Cr creep resistant steel broadening with initially a mode
of less than 0.2 µm for as-normalized martensite laths into about 0.4 µm during recovery.
Secondly, the M2X fine carbides coarsen into larger, more equilibrium M23C6 and/or M6C
carbides [6–9]. Abdel-Latif et al. [10] reported a decrease in the volume fraction of acicular
particles and an increase in the overall inter-particle spacing in a T22 steel after prolonged
service. Gope et al. [11] observed coarsening of M23C6 from 0.5 µm to 0.8 µm and M6C
from 0.2 µm to 0.4 µm subject to creep tests at 853 K (580 °C) for about 15,000 hours.
Byeon et al. [12] reported globular and rectangular parallelepiped carbides in commercial
T22 growing by > 45% subject to accelerated aging at 903 K (650 °C) with the number
density decreasing by over 60%. Finally, a ferrite grain structure forms with grain growth
and the concentration of coarser carbides on ferrite grain boundaries [6,13].
Ferromagnetic materials such as ferritic steels contain magnetic domains, consisting of
aligned magnetic moments, separated by domain walls. Each magnetic moment has asso-
ciated with it a certain amount of free energy. The existence of domains is a consequence
of energy minimisation. As a magnetic field is applied domains will be re–aligned through
domain wall motion, domain nucleation and growth, and/or domain rotation until a new
minimum free energy state is reached. Microstructural features can interact with these pro-
cesses to modify the energy balance and ease of domain re-alignment and hence affect the
magnetic properties of ferromagnetic materials. More details on the domain theory and the

4 Jun Liu et al.
effects of microstructure of ferromagnetic materials on their magnetic domains and prop-
erties can be found elsewhere [14]. EM–based sensors use applied magnetic fields with
different magnitudes and directions and pick up the EM signals in a variety of forms de-
pending on the type of the EM technique used and the nature of the domain movement. For
example, irreversible domain wall motion past pinning features in a ferromagnetic mate-
rial can be detected as a sharp pulse voltage in a search coil wound around the specimen,
which is known as Magnetic Barkhausen Emission (MBE) or Barkhausen Noise (BHN)
[15]. It has been reported that microstructural changes involving grain size, martensitic lath
size, precipitation and dislocation density result in changes in the magnetic properties of
steel [12,16–21]. For example, Moothy et al. [17,18] correlated grain/lath size coarsening
and precipitation in 0.2C steel, 9Cr–1Mo and 2.25Cr–1Mo steels with MBE parameters. A
maximum MBE peak occurred at an intermediate tempering time (around 10 hours at 923
K (650 °C) when there was a certain combination of particle size distribution (affecting
magnetic domain pinning strength) and interparticle spacing (affecting mean free path of
the domain wall displacement). Dissolution of M2C or M2X precipitates in 9Cr–1Mo [17,
18] and 2.25Cr–1Mo [12,19] steels was indicated by a large decrease in MBE peak values
after a long tempering time. Yamaura [22] found that for pure iron, in which grain bound-
aries are the predominant domain wall pinning points, the BHN power voltage obeyed a
Hall-Petch-type relationship with grain size, which was in agreement with Sakamoto’s the-
oretical prediction [23]. Nevertheless, it should be noted that MBE parameters are not only
affected by microstructure but are also dependent on the geometry of test samples/sensors,
experimental conditions and signal processing. There is no explicit linkage between MBE
parameters and magnetic properties whilst relationships between EM sensor signals and
relative permeability and resistivity can be mathematically described in classical electro-
magnetics. Moreover, MBE systems operate at a low singular frequency in a magnetic field

Title Suppressed Due to Excessive Length 5
of relatively high amplitude where MBE signals, being affected by the microstructural fea-
tures that affect irreversible domain wall movements, are insensitive to those only affecting
reversible domain wall movements. Chen et al. [24] modeled reversible domain wall motion
with pinning by general point defects and determined that the initial permeability is propor-
tional to ρ−2/3, where ρ is the number density of the pinning sites. This relationship was
found to be in reasonable agreement with experimental results for a series of carbon steels
of different carbon contents, where pinning was due to ferrite grain boundaries only for a
0.006 wt % carbon steel or spheroidized cementite particles and grain boundaries for the
steels of carbon content from 0.2 wt % to 0.95 wt %. Whilst there has been significant work
looking at the effects of microstructural features on magnetic properties an analysis of com-
plex microstructures where many microstructural parameters are changing, such as power
generation steels in service has not been presented; a systematic study of the microstructural
features that particularly affect reversible domain wall movements in a small applied field,
such as applied by a multi-frequency EM sensor, has not been reported. There has been little
experimental work relating microstructural features directly to the initial relative permeabil-
ity, a fundamental magnetic property that is sensor-independent, as opposed to sensor- or
sample-geometry- dependent parameters such as MBE parameters.
Multi-frequency EM sensors have proved sensitive to the change of ferrite/austenite
fraction [25,26], shown using model alloys, in-situ analysis and modeling. Prototype EM
sensors are being used for in-situ monitoring of the γ → α transformation during steel pro-
cessing [27]. EM sensors have also been used to detect decarburisation [28,29], shown with
high carbon steels for on-line and off-line monitoring. The theory as to how the relative per-
meability and resistivity of a sample affect the multi-frequency EM response, for any sensor
geometry, is presented elsewhere [30]. It has been shown that the multi-frequency EM sen-
sors are able to detect the initial relative permeability and resistivity changes, resulting from

6 Jun Liu et al.
microstructural changes in power plant steels during service at high temperatures [31]. How-
ever, the role of different microstructural feature changes was not considered in detail before.
To assess the sensitivity of a multi-frequency EM sensor to the changes in power generation
steel microstructures this paper has studied the EM sensor response to P9 and T22 steel
samples representative of initial service entry and long-term exposure microstructures. It is
also necessary to correlate the relatively small yet complex microstructural changes during
service exposure in these steels with changes in their fundamental magnetic and electrical
properties i.e. the initial relative permeability and resistivity. The overall aim of this research
is the development of appropriate EM sensor geometries for monitoring power plant steels
and providing useful and interpretable information for a reliable prediction of safe remnant
life.
2 Materials and experimental details
The P9 and T22 steels (P9ES and T22ES) studied were removed from a refinery furnace
at a petrochemical plant after approximately 11 years at 793 K (520 °C) (comparable with
a similar time of elevated temperature exposure during service in power generation plant
[32]). Their chemical compositions are given in Table 1. Selected samples (approx. 70 mm×
15 mm×7 mm) were heat treated to simulate the service entry microstructure, i.e. tempered
martensite / bainite, by normalizing at 1223 K (950 °C) for 1 hour or 1213 K (940 °C) for
1 hour followed by air cooling to room temperature and then tempering at 1033 K (760 °C)
for 1 hour or 993 K (720 °C) for 1.5 hours for P9 and T22 respectively (P9T and T22T).
As-normalized samples were also examined (P9N and T22N). The heat treatment conditions
have been determined as per ASTM standards A335 [33] and A213 [34] as well as literature
data [6,35–37].

Title Suppressed Due to Excessive Length 7
Table 1 Chemical composition (wt %) of the P9 and T22 steels studied
Cr Mo C Si Mn P S
P9 8.40 0.97 0.12 0.52 0.44 0.006 0.010
T22 2.14 1.01 0.15 0.28 0.44 0.017 0.011
Metallographic samples were polished to a 0.25 µm finish and etched (in Kallings [38]
for P9 and in 2% nital for T22). A JEOL–7000 Field Emission Gun Scanning Electron Mi-
croscope (FEG–SEM) and an Oxford Inca EDS was used to obtain SEM micrographs and
analyse alloy contents at selected points/areas. Additional metallographic samples were pol-
ished to a 1 µm finish followed by several etching-polishing cycles and a final polishing with
OPS (Oxide Polishing Suspension) for 10 minutes for electron backscattering diffraction
(EBSD) analysis using an Oxford Inca EBSD in a JEOL–7000 FEG–SEM. Lath boundaries
and outlines of carbide particles in SEM micrographs were reconstructed as trace features
and objects respectively using Image–Pro Plus. Average distances between two neighbour-
ing trace features were taken as lath width and average length of diameters measured at
2–degree intervals passing through objects centroid as equivalent diameter of particles.
A four-point probe technique was employed to independently measure the resistivity of
the steels with a direct current Cropico DO5000 microhmmeter at room temperature using
machined cylinder specimens, 4.95 mm in diameter and 50.0 mm in length. The resistivity
values were used as input into a Comsol model (described later) to determine the relative
permeability values.
A cylindrical EM sensor, similar to that used in [28], consisting of one exciting coil and
one sensing coil both wound around an insulating tube of 5.5 mm and 6.5 mm inner and
outer diameters respectively was used in this study. EM sensor tests were carried out on the
same cylindrical specimens as for the resistivity measurements. The sensor was operated at 3

8 Jun Liu et al.
V and over a range of frequencies from 10 Hz to 1 MHz. Signals detected by the sensing coil
were recorded and processed by a Solartron Analytical Model S1260 Impedance Analyzer
to give the complex trans-impedance Z, from which the mutual inductance L was calculated
as L = Z/ jω , where ω is angular frequency and j the imaginary unit.
3 Microstructural changes
3.1 9Cr–1Mo steels
The microstructure of as-normalized P9 consists of martensite (of a typical lath width at
297 ± 46 nm, which is close to literature values [39], as measured from EBSD image
quality maps, shown in Figure 1) and bainite as shown in Figure 2(a) (reproduced from
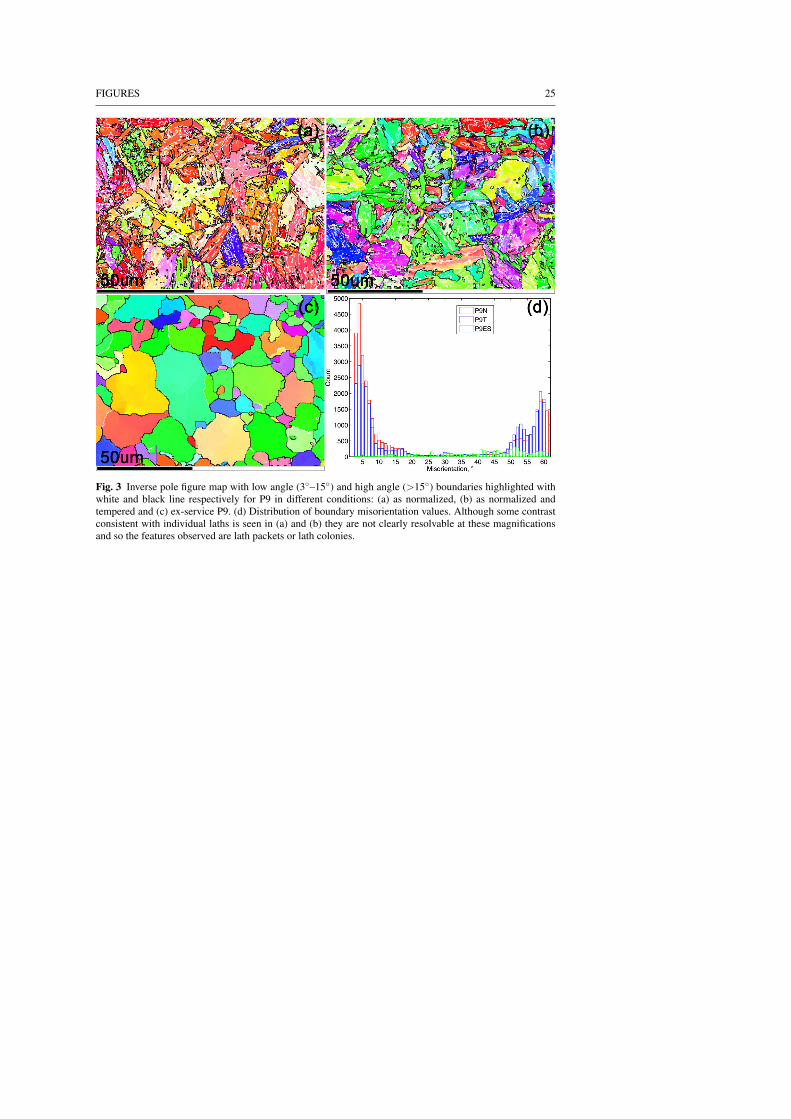
[31]). There are a high density of high angle (> 15) boundaries including all the marten-
sitic/bainitic colony/packet boundaries and some lath boundaries and a lower density of low
angle (3–15) lath boundaries as shown in Figure 3(a), an inverse pole figure (IPF) map
overlaid with a grain boundary map, and Figure 3(d), a boundary misorientation distribution
histogram, for the as-normalized P9.
Subsequent tempering produced a simulated service entry microstructure, i.e. tempered
martensite / bainite as shown in Figure 2(b) (reproduced from [31]) with majority of the laths
measuring around 380±149 nm wide (consistent with previous data [4]) as measured from
SEM images whilst some areas without clear lath features present in the SEM images (prob-
ably due to non-uniformity in etching) are not considered in the measurement. Compared to
the as-normalized P9, there is a significant decrease in the density of low angle boundaries
as observed from Figure 3 (b) and Figure 3(d) due to the coarsening of martensitic laths.
Many fine alloy carbides are present along the lath boundaries, together with some coarse
equiaxed precipitates. The size of the latter is inconsistent with their formation during tem-
Title Suppressed Due to Excessive Length 9
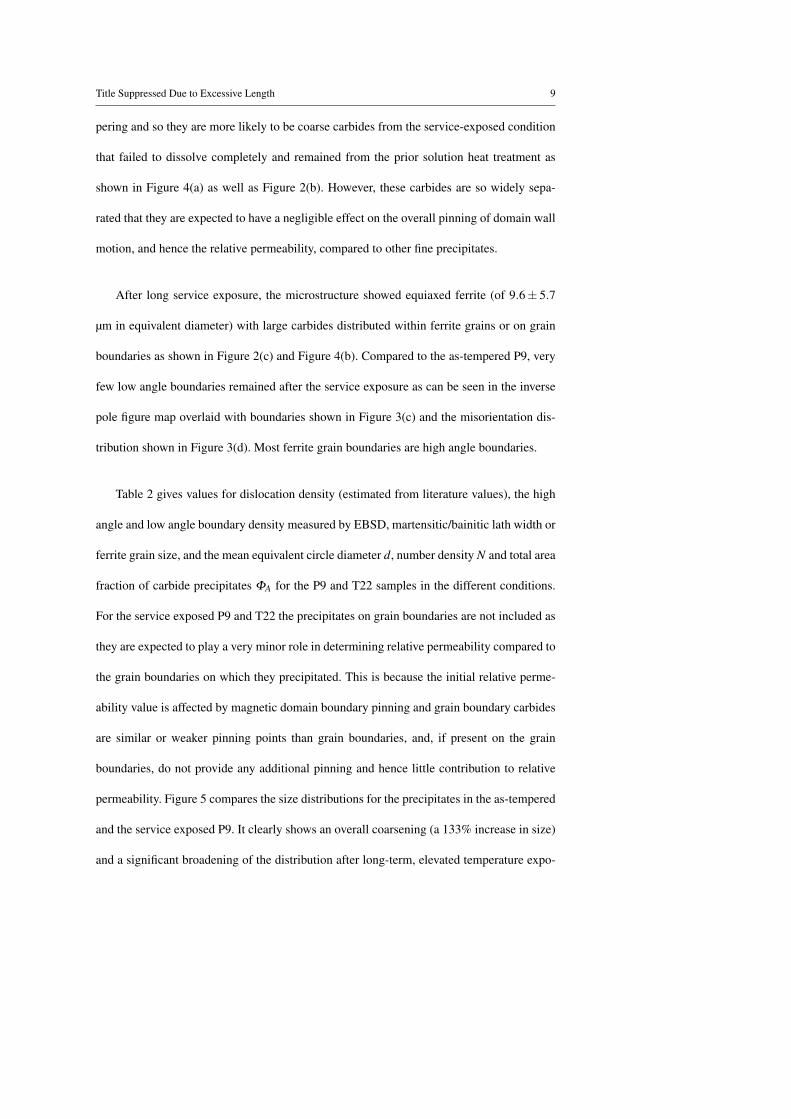
pering and so they are more likely to be coarse carbides from the service-exposed condition
that failed to dissolve completely and remained from the prior solution heat treatment as
shown in Figure 4(a) as well as Figure 2(b). However, these carbides are so widely sepa-
rated that they are expected to have a negligible effect on the overall pinning of domain wall
motion, and hence the relative permeability, compared to other fine precipitates.
After long service exposure, the microstructure showed equiaxed ferrite (of 9.6± 5.7
µm in equivalent diameter) with large carbides distributed within ferrite grains or on grain
boundaries as shown in Figure 2(c) and Figure 4(b). Compared to the as-tempered P9, very
few low angle boundaries remained after the service exposure as can be seen in the inverse
pole figure map overlaid with boundaries shown in Figure 3(c) and the misorientation dis-
tribution shown in Figure 3(d). Most ferrite grain boundaries are high angle boundaries.
Table 2 gives values for dislocation density (estimated from literature values), the high
angle and low angle boundary density measured by EBSD, martensitic/bainitic lath width or
ferrite grain size, and the mean equivalent circle diameter d, number density N and total area
fraction of carbide precipitates ΦA for the P9 and T22 samples in the different conditions.
For the service exposed P9 and T22 the precipitates on grain boundaries are not included as
they are expected to play a very minor role in determining relative permeability compared to
the grain boundaries on which they precipitated. This is because the initial relative perme-
ability value is affected by magnetic domain boundary pinning and grain boundary carbides
are similar or weaker pinning points than grain boundaries, and, if present on the grain
boundaries, do not provide any additional pinning and hence little contribution to relative
permeability. Figure 5 compares the size distributions for the precipitates in the as-tempered
and the service exposed P9. It clearly shows an overall coarsening (a 133% increase in size)
and a significant broadening of the distribution after long-term, elevated temperature expo-

10 Jun Liu et al.
sure in service. The number density of precipitates decreased to only 11% of the as-tempered
P9 value accompanied by a 52% reduction in area fraction.
Table 2 Measurements on microstructural features for P9 and T22 in different conditions.
Sample
codea
ξdb gh
c gld De Carbide precipitates
×1014
m−2
×105
m−1
×105
m−1
µm d(nm) N(×1012m−2) ΦA(%)
P9N 41 [40] 8.56 8.78 0.297±0.046 − − −
P9T 9 [40] 6.47 6.06 0.380±0.149 105±61 4.80±0.24 5.44±0.5
P9ES 0.06 [41] 2.20 0.16 9.6±5.7 239±114 0.55±0.12 2.74±0.76
T22N 1.74 [42] 5.30 2.92 − 50 [43] − −
T22T 1.27 [42] 5.64 2.53 0.443±0.136 59±29 18.36±0.33 5.79±0.09
T22ES 0.02 [44] 0.91 0.00 27.5±17.1 181±83 1.88±0.22 5.04±0.01
a Suffixes N = as normalized, T = as normalized and tempered and ES = ex-service.
b ξd , Dislocation density. Values are estimated based on literature values for 9Cr–1Mo or 2.25Cr–1Mo
steels subject to similar thermal exposure.
c gh, high angle boundary (> 15) density.
d gl , low angle boundary (3–15) density.
e D, lath size for P9N, P9T and T22T or ferrite grain size in equivalent circular diameter for P9ES and
T22ES.
Figure 6 plots Cr, Mo and Fe contents (weight percent) measured by EDS on a number
of selected typical precipitates at different locations for the studied P9 samples, which shows
a consistent enrichment of Cr and Mo alloying elements after the tempering and the service
exposure. The trend lines (solid lines) indicate the rate of the enrichment of Cr and Mo
elements and the rate of the increase in Cr content and the decrease in Fe content remained
more or less constant as shown in Figure 6(a) and (b), respectively, which seems to indicate
a progressive formation of Cr–based carbides. Given the sub-micron size of the precipitates,
Title Suppressed Due to Excessive Length 11
Table 2, then some of this may reflect varying overlap of the beam with the Fe–rich matrix
during SEM–EDS measurements. The type of the selected carbides was identified as M23C6
based on the literature data for the Cr/Mo ratio of M23C6 carbides [45,46] plotted as dotted
lines in Figure 6.
3.2 2.25Cr–1Mo steel
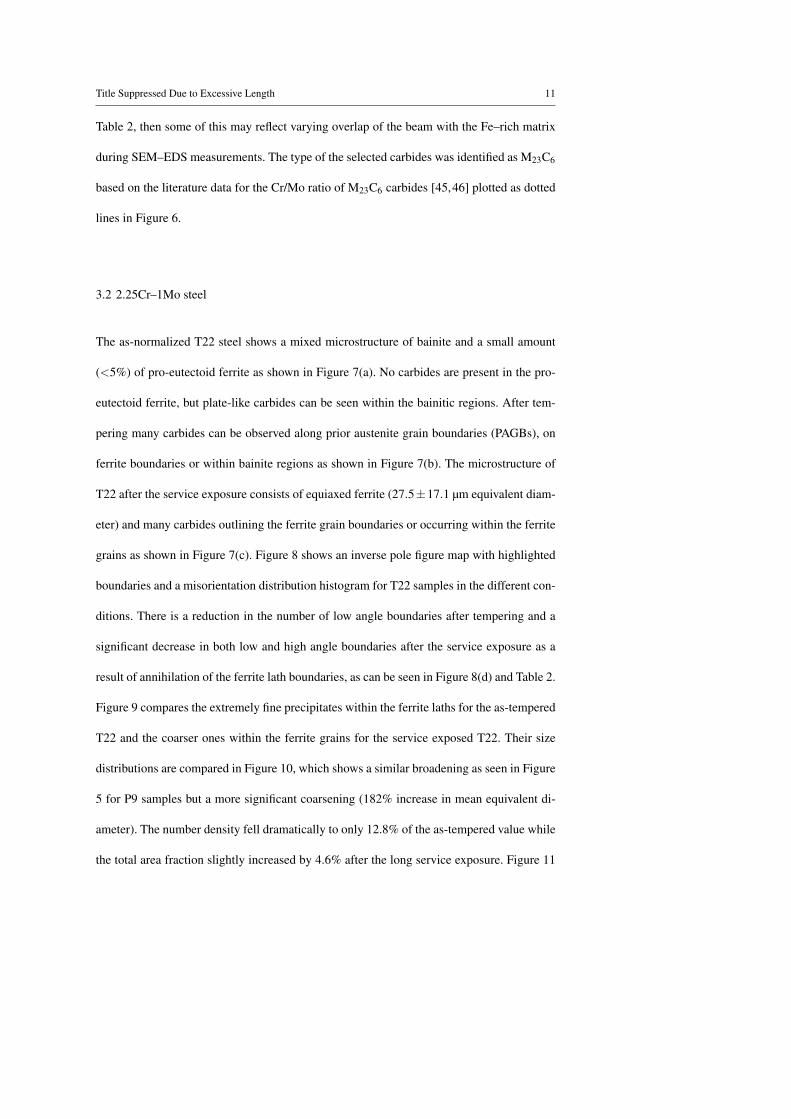
The as-normalized T22 steel shows a mixed microstructure of bainite and a small amount
(<5%) of pro-eutectoid ferrite as shown in Figure 7(a). No carbides are present in the pro-
eutectoid ferrite, but plate-like carbides can be seen within the bainitic regions. After tem-
pering many carbides can be observed along prior austenite grain boundaries (PAGBs), on
ferrite boundaries or within bainite regions as shown in Figure 7(b). The microstructure of
T22 after the service exposure consists of equiaxed ferrite (27.5±17.1 µm equivalent diam-
eter) and many carbides outlining the ferrite grain boundaries or occurring within the ferrite
grains as shown in Figure 7(c). Figure 8 shows an inverse pole figure map with highlighted
boundaries and a misorientation distribution histogram for T22 samples in the different con-
ditions. There is a reduction in the number of low angle boundaries after tempering and a
significant decrease in both low and high angle boundaries after the service exposure as a
result of annihilation of the ferrite lath boundaries, as can be seen in Figure 8(d) and Table 2.
Figure 9 compares the extremely fine precipitates within the ferrite laths for the as-tempered
T22 and the coarser ones within the ferrite grains for the service exposed T22. Their size
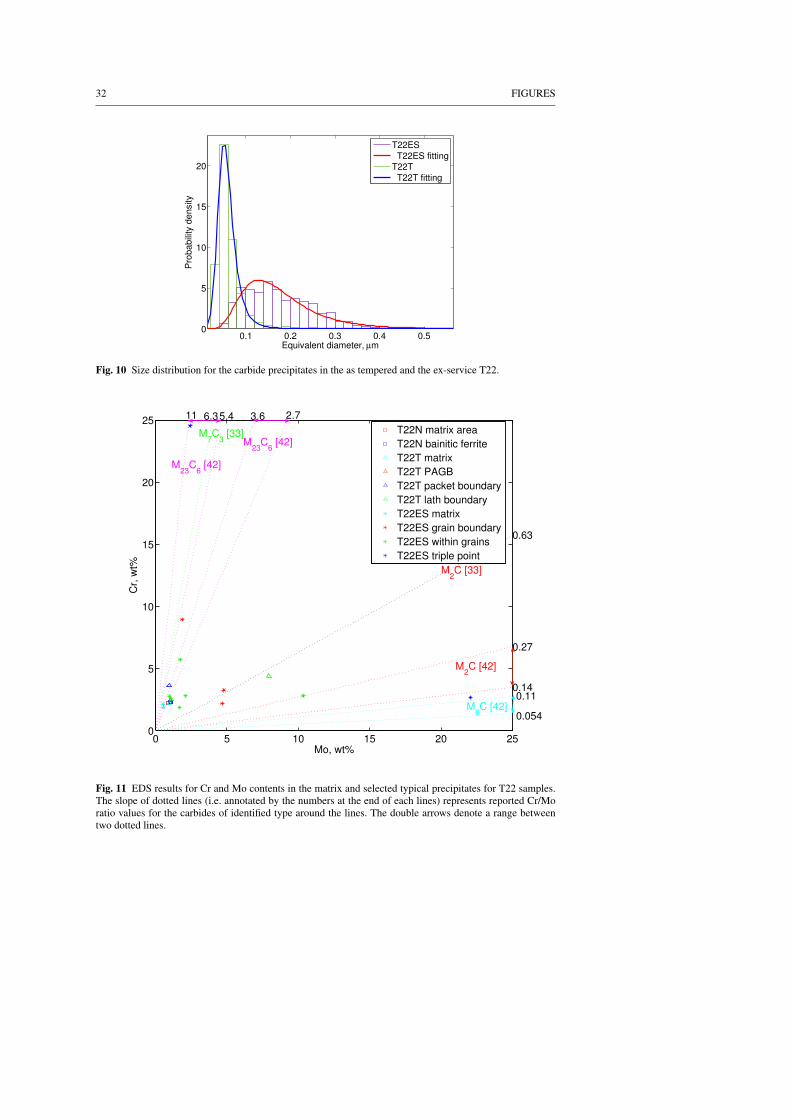
distributions are compared in Figure 10, which shows a similar broadening as seen in Figure
5 for P9 samples but a more significant coarsening (182% increase in mean equivalent di-
ameter). The number density fell dramatically to only 12.8% of the as-tempered value while
the total area fraction slightly increased by 4.6% after the long service exposure. Figure 11

12 Jun Liu et al.
shows a scatter plot of Cr and Mo content measured by EDS on the precipitates at various
locations in the studied T22 samples, together with literature data on the values of Cr/Mo
ratio of different identified types of carbides in 2.25Cr–1Mo steels plotted as dotted lines.
Therefore the types of the selected carbide particles in the studied T22 steels can be accord-
ingly identified based on the data shown in Figure 11 as well as the reported precipitation
sequence in T22 steels [9,47]. These carbides include a) Mo-rich M2C occurring on lath
boundaries in the as-tempered condition as well as some remained/enriched after service
exposure; b) Cr-rich M23C6 (and possibly some M7C3) including most carbides after the
service exposure and some present on lath boundaries after the tempering; c) possible Mo-
rich and equilibrium M6C only present at triple boundaries. It should be noted that there was
a notable depletion of Mo in the matrix after long service exposure as described in Table 3.
4 Resistivity
4.1 9Cr–1Mo steels
The electrical resistivity measurements for all the samples are given in Table 4 (reproduced
from [31]). The tempering heat treatment resulted in a 7.49 % resistivity drop compared to
the as-normalized P9 value. In contrast, the ex-service resistivity decrease compared with
the normalized and tempered value is only 0.46 % despite the large microstructural changes
as described above. This is due to the resistivity value being most affected by the change
in dislocation density [48] and elements (for example carbon) in solution [49] between the
as-normalized condition and tempered condition, with the service exposure for P9 resulting
in very limited further change in these factors.

Title Suppressed Due to Excessive Length 13
4.2 2.25Cr–Mo steels
Compared to P9 the T22 steel samples have much lower resistivity values due to a much
lower content of solute alloy elements. However, the resistivity decrease due to service ex-
posure and tempering are more significant than in P9, being 9.00 % and 17.79 % respec-
tively. This different behaviour compared to P9 is attributed to a notable depletion of Mo
in the matrix after service exposure. As an alloying element in solution, Mo element has a
more significant effect than Cr on resistivity values owing to a greater difference in atom
radius from Fe and two valence electrons (as can be seen in Table 3) giving rise to more
significant conduction electron scattering.
Table 3 Resistivity-related information for the solute alloy elements in T22.
ElementAtomic
radius (nm)Valence
Elemental resistivity in
ferritic steels
(nΩ ·m/wt%)[50]
Content in matrix (wt%)
T22N T22T T22ES P9N P9T P9ES
C 0.077 – 521 – – – – – –
Fe 0.126 +2 109 95.89 96.05 96.70 88.97 88.48 89.79
Cr 0.128 +2 35 2.30 2.19 2.01 8.8 9.31 8.43
Mo 0.139 +4 71 1.00 0.96 0.53 1.07 1.02 0.88
5 EM sensor test and determination of relative permeability
Figure 12(a) (reproduced from [31]) shows the real part of the mutual inductance from EM
sensor measurements of the P9 samples as a function of frequency. The real inductance
is essentially independent of frequency over the low frequency (approx 10 – 100 Hz) range
then drops continuously with increasing frequency until it approaches a small negative value
at very high frequencies (over approximately 0.1 MHz). For conciseness the inductance

14 Jun Liu et al.
Table 4 Electrical resistivity, real inductance at low frequencies and fitted relative permeability values for P9
and T22 steels in the different heat treated conditions [31].
Sample Electrical resistivity
(10−7Ω ·m)
L0 (×10−5H) Fitted relative permeability
P9N 5.896±0.008 1.4947±0.0020 37
P9T 5.485±0.003 2.3914±0.0032 66
P9ES 5.460±0.003 3.4655±0.0058 133
T22N 3.337±0.005 2.2691±0.0057 61
T22T 2.833±0.003 2.6114±0.0111 75
T22ES 2.578±0.002 2.8028±0.0149 86
value at low frequencies (here taken as the mean value for the first 5 data points from 10
to 25 Hz) has been used as a characteristic inductance parameter L0 (as this is known to be
sensitive to the relative permeability of the material); the values of which are given in Table
4.
The inductance L0 of the as-tempered P9 is 45 % lower than that of the service exposed
value and 37.5 % higher than the as-normalized value. Over the low frequency range, the
relative permeability dominates the L0 value as the effects of induced eddy currents are
insignificant. As the frequency increases eddy currents strengthen (and the effect of the ma-
terial resistivity strengthens accordingly) and reduce the mutual inductance, which accounts
for the decreasing (damping) part of real inductance as shown in Figure 12(a).
A 2D axisymmetric finite element (FE) model was developed for modeling the sensor
signal output in response to a steel sample of given resistivity and relative permeability us-
ing Comsol Multiphysics. The model is broadly similar to that described in [28] and exploits
the inherent cylindrical symmetry of this sensor design. The resistivity values of modeled
samples were taken from the experimental measurements and the relative permeability val-
ues determined by fitting the modeled real inductance with the experimental measurement
Title Suppressed Due to Excessive Length 15
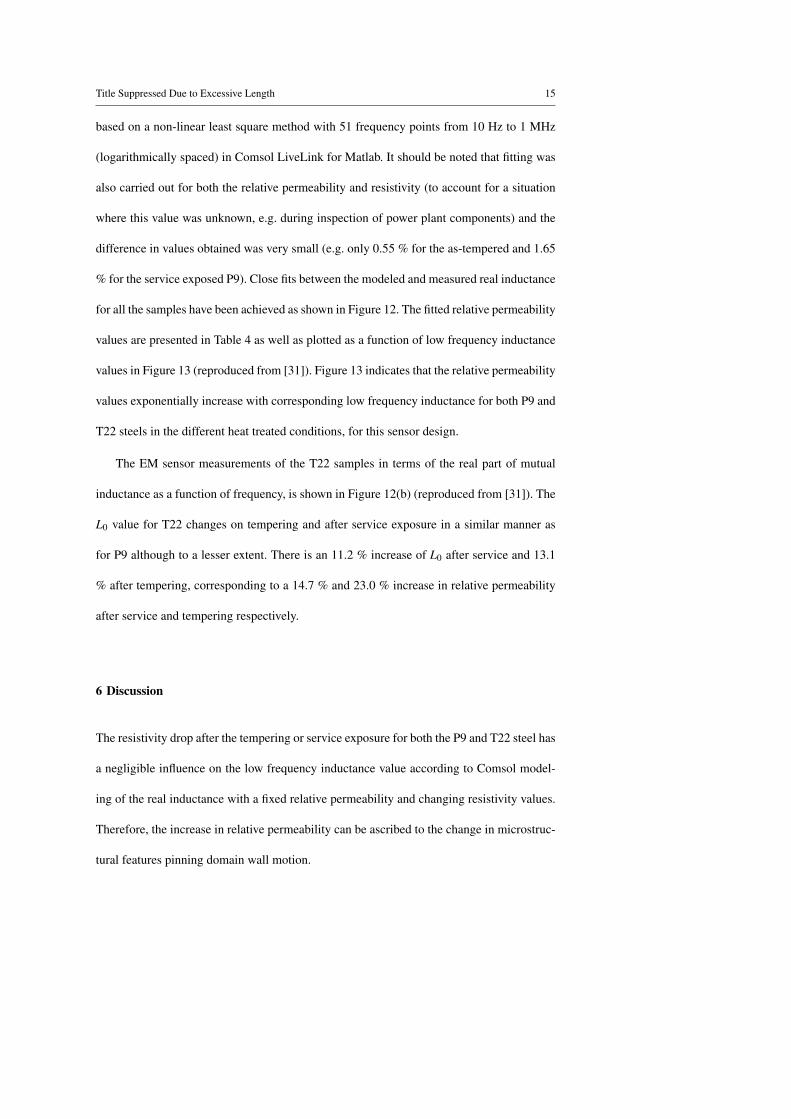
based on a non-linear least square method with 51 frequency points from 10 Hz to 1 MHz
(logarithmically spaced) in Comsol LiveLink for Matlab. It should be noted that fitting was
also carried out for both the relative permeability and resistivity (to account for a situation
where this value was unknown, e.g. during inspection of power plant components) and the
difference in values obtained was very small (e.g. only 0.55 % for the as-tempered and 1.65
% for the service exposed P9). Close fits between the modeled and measured real inductance
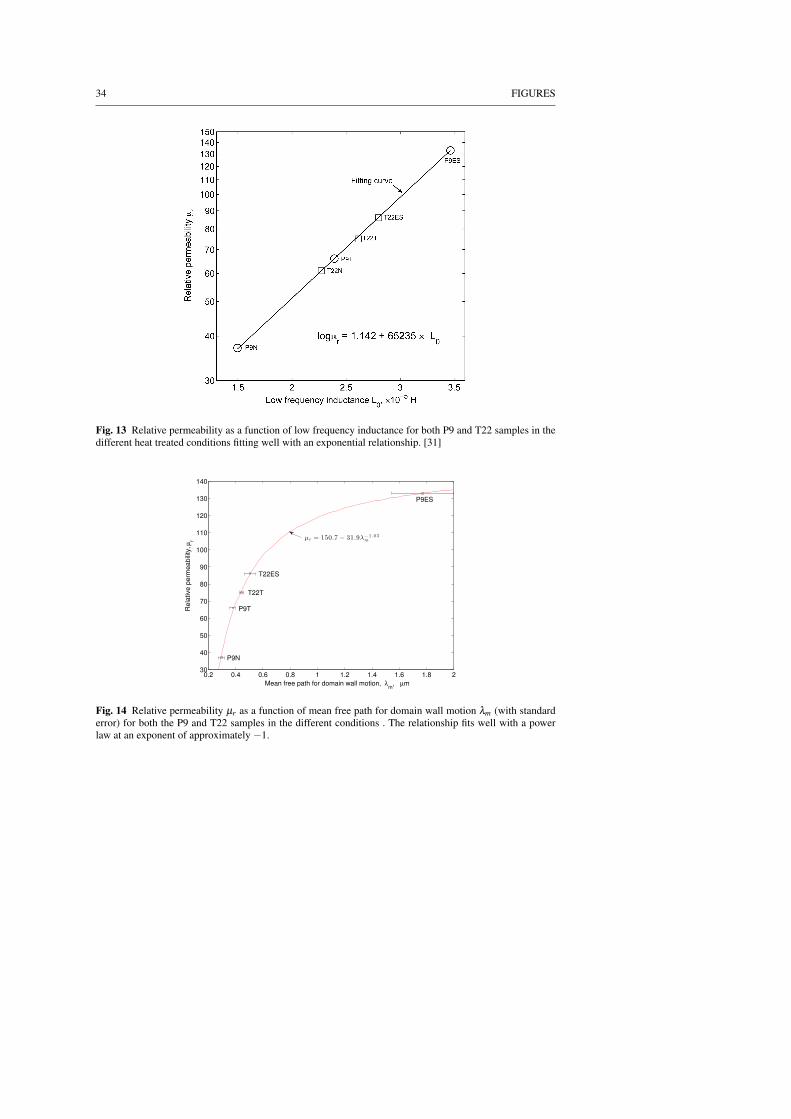
for all the samples have been achieved as shown in Figure 12. The fitted relative permeability
values are presented in Table 4 as well as plotted as a function of low frequency inductance
values in Figure 13 (reproduced from [31]). Figure 13 indicates that the relative permeability
values exponentially increase with corresponding low frequency inductance for both P9 and
T22 steels in the different heat treated conditions, for this sensor design.
The EM sensor measurements of the T22 samples in terms of the real part of mutual
inductance as a function of frequency, is shown in Figure 12(b) (reproduced from [31]). The
L0 value for T22 changes on tempering and after service exposure in a similar manner as
for P9 although to a lesser extent. There is an 11.2 % increase of L0 after service and 13.1
% after tempering, corresponding to a 14.7 % and 23.0 % increase in relative permeability
after service and tempering respectively.
6 Discussion
The resistivity drop after the tempering or service exposure for both the P9 and T22 steel has
a negligible influence on the low frequency inductance value according to Comsol model-
ing of the real inductance with a fixed relative permeability and changing resistivity values.
Therefore, the increase in relative permeability can be ascribed to the change in microstruc-
tural features pinning domain wall motion.
16 Jun Liu et al.
It should be noted that the relative permeability values for the studied steels determined
in this paper only apply to small magnetic fields, where domain wall motion can be treated
as approximately reversible. That is, domain walls return to their original positions after ap-
plication and removal of an applied field or, in an alternated current field, oscillate between
neighbouring pinning sites. Reversible domain wall motion could incorporate translation
(or planar motion) before being pinned and bowing of domain walls (i.e. expanding like an
elastic membrane) between neighbouring pinning points [51]. During translation, domain
walls are subject to varied potential energy associated with defects such as dislocations, in-
clusions and boundaries within the material. Once they encounter a potential well associated
with strong pinning features steep enough that they cannot overcome it there will be no fur-
ther reversible translation of domain walls. The mean free path for domain wall translation
should, therefore, determine the relative permeability in the case of pure translation approx-
imation, e.g. when a domain wall translates along its normal direction and is pinned by a
lath boundary that is parallel with it. If a domain wall is allowed to further bow between pin-
ning sites, e.g. between neighbouring carbide precipitates, the relative permeability should
be based on a pure bowing approximation and so is determined by inter-particle spacing
(or equivalently the inverse of the number density of the particles for a random distribution
[24]) and domain wall energy [52].
For the as-normalized P9, the high-density martensitic/bainitic lath boundaries (formed
of high density dislocation networks) are predominant pinning sites to planar domain wall
motion between laths. It has been reported that most (> 90 % [41]) dislocations in the as-
normalized P9 make up martensitic/bainitic lath boundaries whilst the intra-lath dislocations
are of relatively low density and expected to generate only insignificant potential energy well
compared to the domain wall energy because they are far smaller than domain wall thickness
(approximately 160 atomic layers for pure iron). Therefore domain walls can move more
Title Suppressed Due to Excessive Length 17
or less reversibly between martensitic or upper bainitic laths in the as-normalized and as-
tempered P9. It follows that lath width determines the mean free path for reversible domain
wall motion.
During the tempering of P9, precipitation of carbides occurs mostly on lath or grain
boundaries, which play a relatively minor role in pinning domain walls as explained earlier
that the grain/lath boundaries are the major pinning features in this case [53]. Therefore, the
mean free path for domain wall motion, and hence the relative permeability, is still governed
by lath width. Accordingly, the significant increase in relative permeability (from 37 to 66)
after tempering can be ascribed to a coarsening of lath boundaries increasing the mean free
path for domain wall translation and reducing the number density of boundaries eventually
pinning domain wall motion. As the lath boundaries disappear after service exposure, the
carbide precipitates that were on the lath boundaries become effective pinning points. The
carbides that were originally distributed along lath boundaries after long service exposure
are distributed more randomly within the ferrite grains as a result of a coarsening. The mean
inter-particle (edge to edge) spacing λm, which can be estimated by λm = (1−ΦA)/N [54]
as a first approximation to a random distribution, becomes the mean free path to domain
wall motion. The enrichment of alloying elements (Cr and Mo) in the precipitates during
long service exposure, Figure 6, reduces their ferromagnetism [55], whilst this will increase
their domain wall pinning strength, it is not expected to change their effect on the reversible
domain wall motion for the small fields applied during EM testing. Therefore, during the
service exposure for P9 the significant increase (>100%) in relative permeability can be
attributed to a coarsening of the ferrite lath widths reducing the number of planar pinning
features and allowing further domain wall bowing after encountering pinning points, and a
coarsening of carbide precipitates increasing the mean free path and reducing the number of
pinning points to domain wall motion.

18 Jun Liu et al.
Compared to the as-normalized P9, the higher relative permeability (66 compared to 37)
for the as-normalized T22 is expected of a) a greater bainite lath width as can be observed
from Figure 2(a) and Figure 7(a) increasing the mean free path to domain wall motion, or
equivalently, a significantly lower density of both low angle and high angle boundaries re-
ducing the number of available pinning sites; b) some pro-eutectoid ferrite, whose grain size
are much larger than the lath width allowing more reversible domain wall motion. After
tempering at least a certain proportion of fine precipitates within ferrite laths (lower bai-
nite) are expected to be weak pinning points to domain wall motion for two reasons. First,
these precipitates (mostly cementite) are ferromagnetic owing to a high content of Fe and
are expected to generate a lower demagnetising field and hence cause less disturbance to
domain walls trying to pass through them, which makes them weaker pinning points than
the equilibrium precipitates M23C6 (almost non-magnetic [56]) to domain wall motion ac-
cording to Neel’s theory [57]. Second, many of them may be too small to effectively pin
domain wall motion as it has been reported [58,59] that very fine precipitates have no effect
on domain wall motion. Therefore lath boundaries are expected to be major pinning sites
to domain wall motion and lath width a determinant parameter to relatively permeability.
After long service exposure, however, significantly coarsened precipitates (compared to the
as-tempered condition) occurring within ferrite grains become effective and predominant
pinning points to domain wall motion. Therefore, the mean inter-particle spacing determine
the mean free path to domain wall motion and hence the relative permeability.
In summary, the mean free path for domain wall motion in the case of the boundary-
dominated pinning e.g. for the as-normalized and as-tempered conditions, is approximately
the martensitic or bainitic lath width, or the inter-particle spacing in the case of precipitate-
dominated pinning, e.g. for the service exposed P9 and T22. Figure 14 plots the initial rela-
tive permeability values as a function of the mean free path to domain wall motion for both
Title Suppressed Due to Excessive Length 19
P9 and T22 steels in the different conditions. It indicates the initial relative permeability in-
creases with the mean free path to domain wall motion approximately by µr = µm−A/λm.
This is close to, but greater than the mean free path dependence determined by modeling
(with an exponent of -2/3 [24]), and is closer to that expected if the reversible pinning of
domain walls was similar to Orowan pinning of dislocations. Accordingly, one would ex-
pect the initial relative permeability values to approach µm at a large λm, e.g. for a P9 or T22
steel without any pinning sites to domain wall motion such as precipitates or lath bound-
aries, within the ferrite grains. Despite free of intra-grain pinning, domain wall motion is
still subject to a tendency to minimum energy state of the domains, where an increase in
magnetostatic energy (or demagnetising energy) balances against a decrease in the energy
due to the applied field, as a consequence of an increase in domain wall spacing. Domain
wall spacing is found to be affected by grain size when there are no other pinning sites
present within grains in Si-iron [60]. The pre-exponential factor A may be related to ma-
terial constants (probably the saturated magnetisation) and domain wall energy that affect
domain wall bowing.
7 Conclusions
In conclusion, the present multi-frequency EM sensor has proved sensitive to relatively small
microstructural changes in both P9 and T22 steels after tempering and service exposure
that can be related to the changes in their resistivity (minor effect) and relative permeabil-
ity (dominant effect). The real inductance at low frequencies L0 is particularly affected by
differences in the relative permeability of the steels studied, which is found to increase
exponentially with the L0 values in the range studied. The change in the microstructural
features that determine the mean free path to reversible domain wall motion include marten-

20 Jun Liu et al.
sitic/bainitic lath boundaries for the as-normalized and as-tempered P9 and T22 or the num-
ber density of carbide precipitates for the ex-service P9 and T22 governs the change in the
relative permeability values. It was found that the relative permeability values increase with
the mean free path to domain wall motion for both the P9 and T22 in the different conditions
by a power law at an exponent of −1 and approaches to a certain value corresponding to a
P9 or T22 steel without any intra-grain lath boundaries or precipitates pinning domain wall
motion.
Acknowledgements This work was carried out with financial support from EPSRC under the grant EP/H023429/1.
References
1. B. Raj, V. Moorthy, T. Jayakumar, and K. B. S. Rao: Int. Mater. Rev., 2003, vol. 48, pp. 273–325.
2. C. L. Davis, S. J. Dickinson, and A. J. Peyton: Ironmak. Steelmak., 2005, vol. 32, pp. 381–384.
3. F. Masuyama: ISIJ Int., 2001, vol. 41, pp. 612–625.
4. P. Ennis and A. Czyrska-Filemonowicz: Sadhana-Acad. P. Eng. S., 2003, vol. 28, pp. 709–730.
5. K. Sawada, M. Taneike, K. Kimura, and F. Abe: Mater. Sci. Tech., 2003, vol. 19, pp. 739–742.
6. S. Saroja, M. Vijayalakshmi, and V. S. Raghunathan: Mater. T. JIM, 1993, vol. 34, pp. 901–906.
7. B. A. Senior, F. W. Noble, and B. L. Eyre: Acta Metall. Mater., 1986, vol. 34, pp. 1321–1327.
8. S. Saroja, P. Parameswaran, M. Vijayalakshmi, and V. S. Raghunathan: Acta Metall. Mater., 1995,
vol. 43, pp. 2985–3000.
9. R. Baker and J. Nutting: J. Iron Steel I., 1959, vol. 192, pp. 257–268.
10. A. Abdel-Latif, J. Corbett, and D. Taplin: Met. Sci., 1982, vol. 16, pp. 90–96.
11. N. Gope, A. Chatterjee, T. Mukherjee, and D. Sarma: Metall. Mater. Trans. A, 1993, vol. 24, pp. 315–326.
12. J. W. Byeon and S. I. Kwun: J. Korean Phys. Soc., 2004, vol. 45, pp. 733–737.
13. V. Thomas Paul, S. Saroja, and M. Vijayalakshmi: J. Nucl. Mater., 2008, vol. 378, pp. 273–281.
14. D. Jiles: Introduction to Magnetism and Magnetic Materials, 2 nd edn., Chapman and Hall/CRC, Lon-
don; New York, 1998.
15. D. J. Buttle, G. A. D. Briggs, J. P. Jakubovics, E. A. Little, C. B. Scruby, G. Busse, C. M. Sayers and R.
E. Green: Phil. Trans. R. Soc. Lond. A, 1986, vol. 320, pp. 363–378.
Title Suppressed Due to Excessive Length 21
16. N. Nakai, Y. Furuya, and M. Obata: Mater. T. JIM, 1989, vol. 30, pp. 197–199.
17. V. Moorthy, S. Vaidyanathan, B. Raj, T. Jayakumar, and B. Kashyap: Metall. Mater. Trans. A, 2000,
vol. 31, pp. 1053–1065.
18. V. Moorthy, S. Vaidyanathan, T. Jayakumar, and B. Raj: Philos. Mag. A, 1998, vol. 77, pp. 1499 – 1514.
19. J. W. Byeon and S. I. Kwun: Mater. Lett., 2003, vol. 58, pp. 94–98.
20. D. C. Jiles: J. Phys. D Appl. Phys., 1988, vol. 21, p. 1186.
21. C. S. Kim and S. I. Kwun: Mater. Trans., 2007, vol. 48, pp. 3028–3030.
22. S. Yamaura, Y. Furuya, and T. Watanabe: Acta Mater., 2001, vol. 49, pp. 3019–3027.
23. H. Sakamoto, M. Okada, and M. Homma: IEEE T. Magn., 1987, vol. 23, pp. 2236–2238.
24. Z. J. Chen and D. C. Jiles: IEEE T. Magn., 1993, vol. 29, pp. 2554–2556.
25. W. Yin, X. J. Hao, A. J. Peyton, M. Strangwood, and C. L. Davis: NDE&E Int., 2009, vol. 42, pp. 64–68.
26. S. J. Dickinson, R. Binns, W. Yin, C. Davis, and A. J. Peyton: IEEE T. Instrum. Meas., 2007, vol. 56, pp.
879–886.
27. A. J. Peyton, W. Yin, S. J. Dickinson, C. L. Davis, M. Strangwood, X. Hao, A. J. Douglas, and P. F.
Morris: Ironmak. Steelmak., 2010, vol. 37, pp. 135–139.
28. X. Hao, W. Yin, M. Strangwood, A. Peyton, P. Morris, and C. Davis: Metall. Mater. Trans. A, 2009,
vol. 40, pp. 745–756.
29. X. J. Hao, W. Yin, M. Strangwood, A. J. Peyton, P. F. Morris, and C. L. Davis: Script. Mater., 2008,
vol. 58, pp. 1033–1036.
30. R. J. Haldane, W. Yin, M. Strangwood, A. J. Peyton, and C. L. Davis: Script. Mater., 2006, vol. 54, pp.
1761–1765.
31. J. Liu, X. J. Hao, L. Zhou, M. Strangwood, C. L. Davis, and A. J. Peyton: Script. Mater., 2012, vol. 66,
pp. 367–370.
32. H. C. Furtado, L. H. de Almeida, and I. Le May: Mater. Charact., 2007, vol. 58, pp. 72–77.
33. ASTM: Standard Specification for Seamless Ferritic Alloy-Steel Pipe for High-Temperature Service,
2009, a335/A335M -09a.
34. ASTM: Standard Specification for Seamless Ferritic and Austenitic Alloy-Steel Boiler, Superheater, and
Heat-Exchanger Tubes, 2009, a213/A213M–09b.
35. J. R. Yang, C. Y. Huang, C. N. Yang, and J. L. Horng: Mater. Charact., 1993, vol. 30, pp. 75–88.
36. B. Arivazhagan, R. Prabhu, S. Albert, M. Kamaraj, and S. Sundaresan: J. Mater. Eng. Perform., 2009,
vol. 18, pp. 999–1004.

22 Jun Liu et al.
37. G. Sangdahl and M. Semchyshen: Application of 2.25Cr–1Mo Steel for Thick-Wall Pressure Vessels,
ASTM, 1982.
38. B. L. Bramfitt, O. A. Benscoter: Metallographer’s guide: practice and procedures for irons and steels,
p. 238, ASM International; Materials Park, OH, 2001.
39. H. Ghassemi-Armaki, R. P. Chen, K. Maruyama, M. Yoshizawa, and M. Igarashi: Mater. Lett., 2009,
vol. 63, pp. 2423–2425.
40. A. Zielinska-Lipiec, A. Czyrska-Filemonowicz, P. J. Ennis, and O. Wachter: J. Mater. Process. Tech.,
1997, vol. 64, pp. 397–405.
41. J. Pesicka, R. Kuzel, A. Dronhofer, and G. Eggeler: Acta Mater., 2003, vol. 51, pp. 4847–4862.
42. J. Sternberk, E. Kratochvılova, A. Gemperle, V. Faja, and V. Walder: Czech J. Phys., 1985, vol. 35, pp.
1259–1266.
43. M. Yoshino, Y. Mishima, Y. Toda, H. Kushima, K. Sawada, and K. Kimura: Mater. High Temp., 2008,
vol. 25, pp. 149–158.
44. J. Sternberk, E. Kratochvılova, J. Hrebık, J., and A. Gemperle: Phys. Status Solidi A, 1983, vol. 79, pp.
523–529.
45. J. M. Race and H. K. D. H. Bhadeshia: Mater. Sci. Tech., 1992, vol. 8, pp. 875–882.
46. J. Hucinska: Mater. Corros, 2000, vol. 51, pp. 173–176.
47. J. Pilling and N. Ridley: Metall. Mater. Trans. A, 1982, vol. 13, pp. 557–563.
48. B. R. Watts: J. Phys. F Met. Phys., 1988, vol. 18, pp. 1183–1195.
49. R. A. Brown: J. Phys. F Met. Phys., 1977, vol. 7, pp.1283–1295.
50. U. Bohnenkamp, R. Sandstrom, and G. Grimvall: J. Appl. Phys., 2002, vol. 92, pp. 4402–4407.
51. D. Jiles: Introduction to Magnetism and Magnetic Materials, 2 nd edn., pp. 171-175, Chapman and
Hall/CRC, London; New York, 1998.
52. D. C. Jiles: J. Magn. Magn. Mater., 2002, vol. 242-245, pp. 116–124.
53. J. A. Baldwin Jr, P. W. Smith Jr, and F. Milstein: Solid State Commun., 1975, vol. 17, pp. 973–974.
54. G. V. Voort: Introduction to Quantitative Metallography, 1997, buehler Ltd.
55. Z. N. Zhou and K. M. Wu: Script. Mater., 2009, vol. 61, pp. 670–673.
56. M. Ceretti, R. Coppola, F. Fiori, and M. Magnani: Phys. B, 1997, vol. 234-236, pp. 999–1002.
57. L. Neel: Cah. Phys., 1944, vol. 25, pp. 21–44.
58. T. Ishikawa, Y. Hamada, and K. Ohmori: IEEE T. Magn., 1989, vol. 25, pp. 3434–3436.
59. S. Turner, A. Moses, J. Hall, and K. Jenkins: J. Appl. Phys., 2010, vol. 107, p. 09A307.
60. J. Shilling and J. Houze, G.: IEEE T. Magn., 1974, vol. 10, pp. 195–223.

FIGURES 23
Fig. 1 Image quality map of as-normalized P9.

24 FIGURES
Fig. 2 SEM micrograph of P9 in different conditions: a) as normalized b) as normalized and tempered andc) ex-service. The small white arrows on (b) mark some examples of coarse carbides that failed to dissolvecompletely during the prior solution heat treatment. [31]
FIGURES 25
Fig. 3 Inverse pole figure map with low angle (3–15) and high angle (>15) boundaries highlighted withwhite and black line respectively for P9 in different conditions: (a) as normalized, (b) as normalized andtempered and (c) ex-service P9. (d) Distribution of boundary misorientation values. Although some contrastconsistent with individual laths is seen in (a) and (b) they are not clearly resolvable at these magnificationsand so the features observed are lath packets or lath colonies.

26 FIGURES
Fig. 4 SEM micrographs of precipitates for a) as tempered P9 and b) service exposed P9. The white arrowsmark examples of coarse carbide precipitates on prior austenite grain boundaries.

FIGURES 27
0.1 0.2 0.3 0.4 0.5 0.6 0.7 0.80
2
4
6
8
10
12
Equivalent diameter, µm
Pro
babili
ty d
ensity
P9ES
P9ES fitting
P9T
P9T fitting
Fig. 5 Size distributions of the carbide precipitates in the P9T and the P9ES samples.

28 FIGURES
0 1 2 3 4 5 6 7 8 9
10
20
30
40
50
Mo, wt%
Cr,
wt%
(a)
5.4
117.8
12
M23
C6 [33]
M23
C6 [8]
M23
C6 [42−43]
P9N matrix
P9N undissolved
P9T matrix
P9T undissolved
P9T lath boundary
P9ES matrix
P9ES grain boundary
P9ES within grains
5 10 15 20 25 30 35 40 45 5040
50
60
70
80
90
Cr, wt%
Fe
, w
t%
(b)
P9N matrix
P9N undissolved
P9T matrix
P9T undissolved
P9T lath boundary
P9ES matrix
P9ES grain boundary
P9ES within grains
Fig. 6 EDS results for (a) Cr as a function of Mo content and (b) Fe as a function of Cr content in the matrixand precipitates for P9 samples. The solid trend line shows a least square fitting of all the data points. Theslope of the dotted lines (i.e. the number annotation at their lines) represent corresponding Cr/Mo ratio values.The double arrows denote ranges between two dotted lines.

FIGURES 29
Fig. 7 SEM micrograph for T22 in different conditions: a) as normalized b) as normalized and tempered andc) ex-service.

30 FIGURES
Fig. 8 Inverse pole figure with low angle (3–15) boundaries highlighted by white line and high angle(>15) boundaries by black lines for T22 in different conditions: (a) as normalized, (b) as normalized andtempered and (c) ex-service. (d) Misorientation distribution.

FIGURES 31
Fig. 9 Precipitates within ferrite laths/grains and at the grain boundaries for (a) the as tempered and (b) theex-service T22.
32 FIGURES
0.1 0.2 0.3 0.4 0.50
5
10
15
20
Equivalent diameter, µm
Pro
babili
ty d
ensity
T22ES
T22ES fitting
T22T
T22T fitting
Fig. 10 Size distribution for the carbide precipitates in the as tempered and the ex-service T22.
0 5 10 15 20 250
5
10
15
20
25
Mo, wt%
Cr,
wt%
0.14
0.27
2.73.65.411
0.63
6.3
0.054
0.11M
6C [42]
M2C [42]
M2C [33]
M23
C6 [42]
M23
C6 [42]
M7C
3 [33] T22N matrix area
T22N bainitic ferrite
T22T matrix
T22T PAGB
T22T packet boundary
T22T lath boundary
T22ES matrix
T22ES grain boundary
T22ES within grains
T22ES triple point
Fig. 11 EDS results for Cr and Mo contents in the matrix and selected typical precipitates for T22 samples.The slope of dotted lines (i.e. annotated by the numbers at the end of each lines) represents reported Cr/Moratio values for the carbides of identified type around the lines. The double arrows denote a range betweentwo dotted lines.

FIGURES 33
101
102
103
104
105
106
0
0.5
1
1.5
2
2.5
3
3.5x 10
−5
Frequency, Hz
Re
al in
du
cta
nce
, H
(a)
P9N
P9T
P9ES
Fitting
101
102
103
104
105
106
0
0.5
1
1.5
2
2.5
3x 10
−5
Frequency, Hz
Re
al in
du
cta
nce
, H
(b)
T22N
T22T
T22ES
Fitting
Fig. 12 Real mutual inductance of EM sensor coils as a function of frequency for (a) P9 and (b) T22. [31]
34 FIGURES
Fig. 13 Relative permeability as a function of low frequency inductance for both P9 and T22 samples in thedifferent heat treated conditions fitting well with an exponential relationship. [31]
0.2 0.4 0.6 0.8 1 1.2 1.4 1.6 1.8 230
40
50
60
70
80
90
100
110
120
130
140
Mean free path for domain wall motion, λm
, µm
Re
lative
pe
rme
ab
ility
, µr
µr = 150.7 − 31.9λ− 1 .03
m
P9N
P9T
P9ES
T22T
T22ES
Fig. 14 Relative permeability µr as a function of mean free path for domain wall motion λm (with standarderror) for both the P9 and T22 samples in the different conditions . The relationship fits well with a powerlaw at an exponent of approximately −1.