Why Test Materials???
77
1 Why Test Materials??? Very early material test. Archimedes in Greece ~ 250 BC used grappling hooks for the defense of Syracuse. Why Test Materials??? Course Outline Mechanical Properties of Materials Viscoelasticity Creep Relaxation Hyperelasticity ElectroForce Technology Dynamic Mechanical Analysis (DMA/DMTA) Fatigue Fracture Mechanics Crack Growth & Fracture Toughness Why Test Materials??? Course Outline Biomaterial Stimulation and Testing Bone Tissue Spinal Devices Dental Wear System Stent – Graft Testing
Transcript of Why Test Materials???
1
Why Test Materials???
Very early material test. Archimedes in Greece ~ 250 BC used grappling hooks for the defense of Syracuse.
Why Test Materials???
Course OutlineMechanical Properties of MaterialsViscoelasticity
CreepRelaxationHyperelasticity
ElectroForce TechnologyDynamic Mechanical Analysis (DMA/DMTA)
FatigueFracture Mechanics
Crack Growth & Fracture Toughness
Why Test Materials???
Course OutlineBiomaterial Stimulation and TestingBone TissueSpinal DevicesDental Wear SystemStent – Graft Testing
2
Mechanical Properties of Materials
One of the earliest material testing systems from Leonardo da Vinci.
Mechanical Properties of Materials
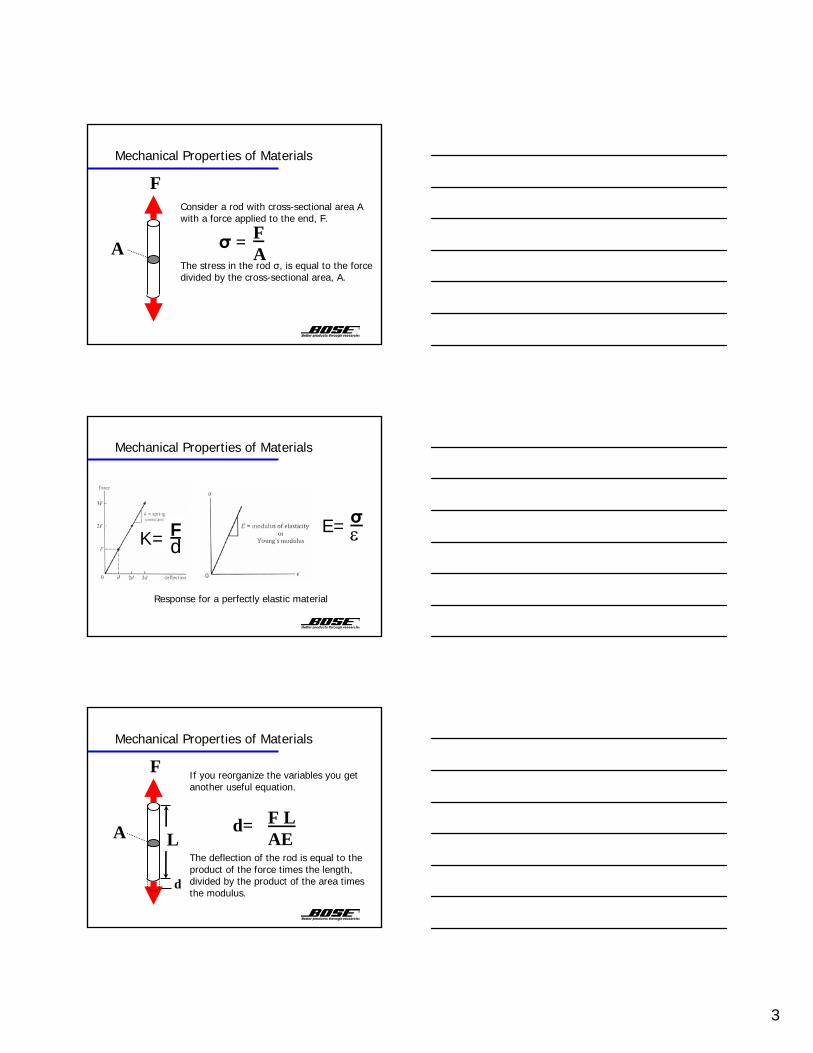
Linear response of force and displacement in spring element.
Mechanical Properties of Materials
Consider a rod with initial length L which is stretched to a length L'.
The strain measure e, a dimensionless ratio, is defined as the ratio of elongation with respect to the original length.
3
Mechanical Properties of Materials
Consider a rod with cross-sectional area A with a force applied to the end, F.
The stress in the rod σ, is equal to the force divided by the cross-sectional area, A.
FA
σ =
F
A
Mechanical Properties of Materials
σεE=
Response for a perfectly elastic material
FdK=
Mechanical Properties of Materials
If you reorganize the variables you get another useful equation.
The deflection of the rod is equal to the product of the force times the length, divided by the product of the area times the modulus.
F LAE
d=
F
A
d
L
4
Mechanical Properties of Materials
d
LOriginalRadius εtransverseεaxial
= -
FinalRadius
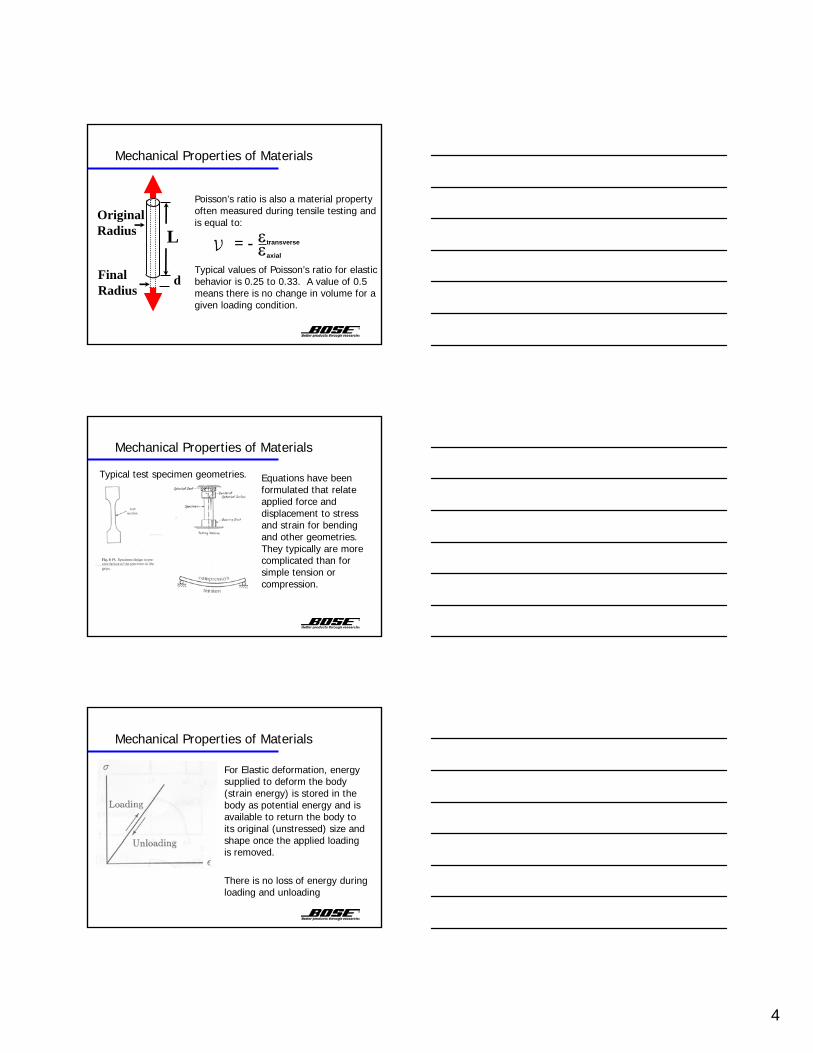
Poisson’s ratio is also a material property often measured during tensile testing and is equal to:
Typical values of Poisson’s ratio for elastic behavior is 0.25 to 0.33. A value of 0.5 means there is no change in volume for a given loading condition.
Equations have been formulated that relate applied force and displacement to stress and strain for bending and other geometries. They typically are more complicated than for simple tension or compression.
Mechanical Properties of Materials
Typical test specimen geometries.
Mechanical Properties of Materials
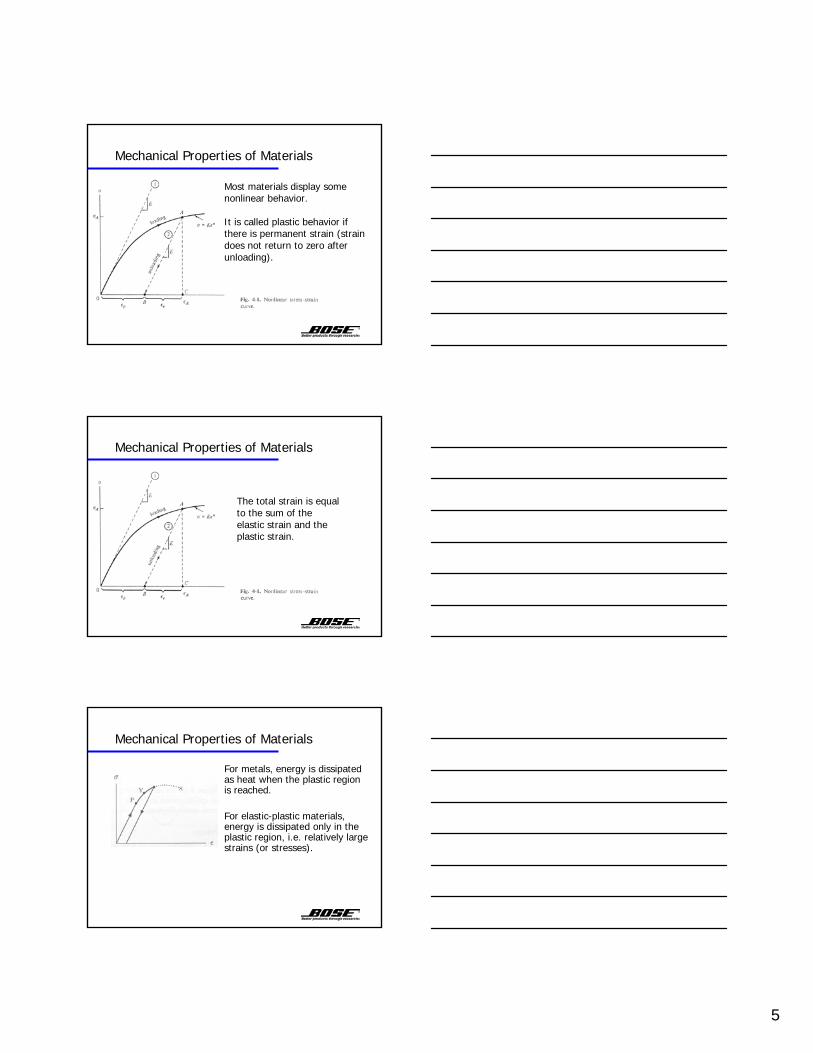
For Elastic deformation, energy supplied to deform the body (strain energy) is stored in the body as potential energy and is available to return the body to its original (unstressed) size and shape once the applied loading is removed.
There is no loss of energy during loading and unloading
5
Mechanical Properties of Materials
Most materials display some nonlinear behavior.
It is called plastic behavior if there is permanent strain (strain does not return to zero after unloading).
Mechanical Properties of Materials
The total strain is equal to the sum of the elastic strain and the plastic strain.
Mechanical Properties of Materials
For metals, energy is dissipated as heat when the plastic region is reached.
For elastic-plastic materials, energy is dissipated only in the plastic region, i.e. relatively large strains (or stresses).
6
Mechanical Properties of Materials
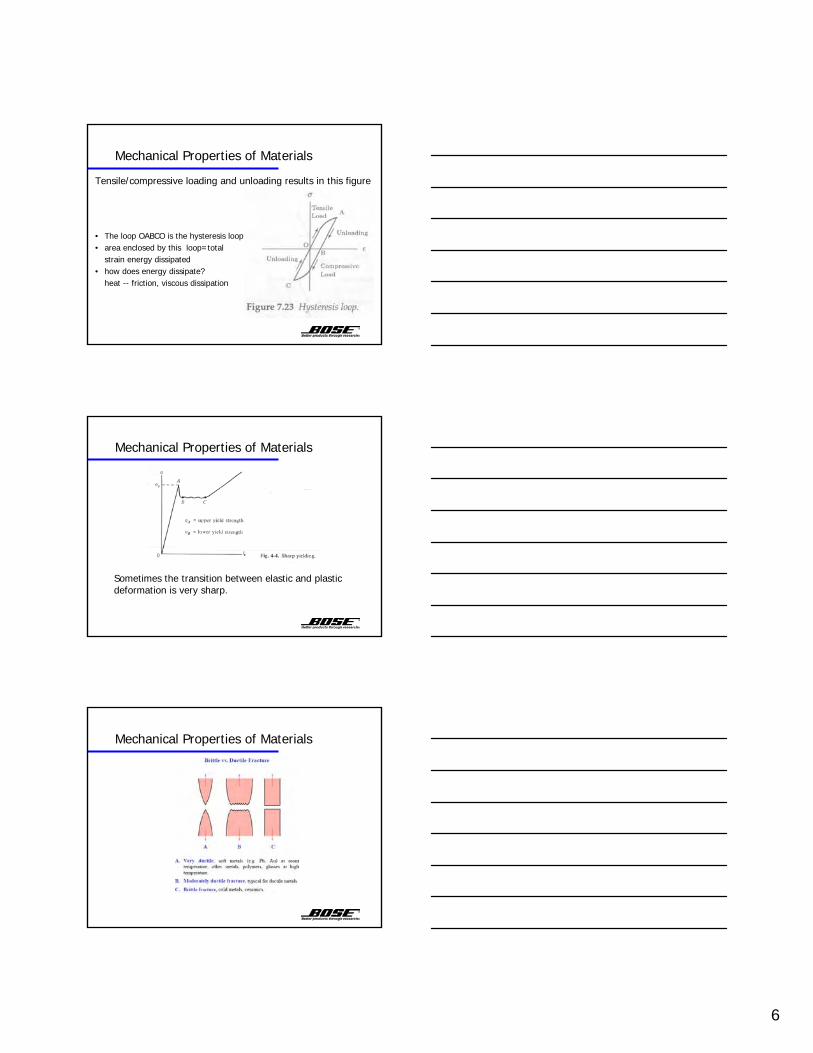
Tensile/compressive loading and unloading results in this figure
• The loop OABCO is the hysteresis loop• area enclosed by this loop=total
strain energy dissipated• how does energy dissipate?
heat -- friction, viscous dissipation
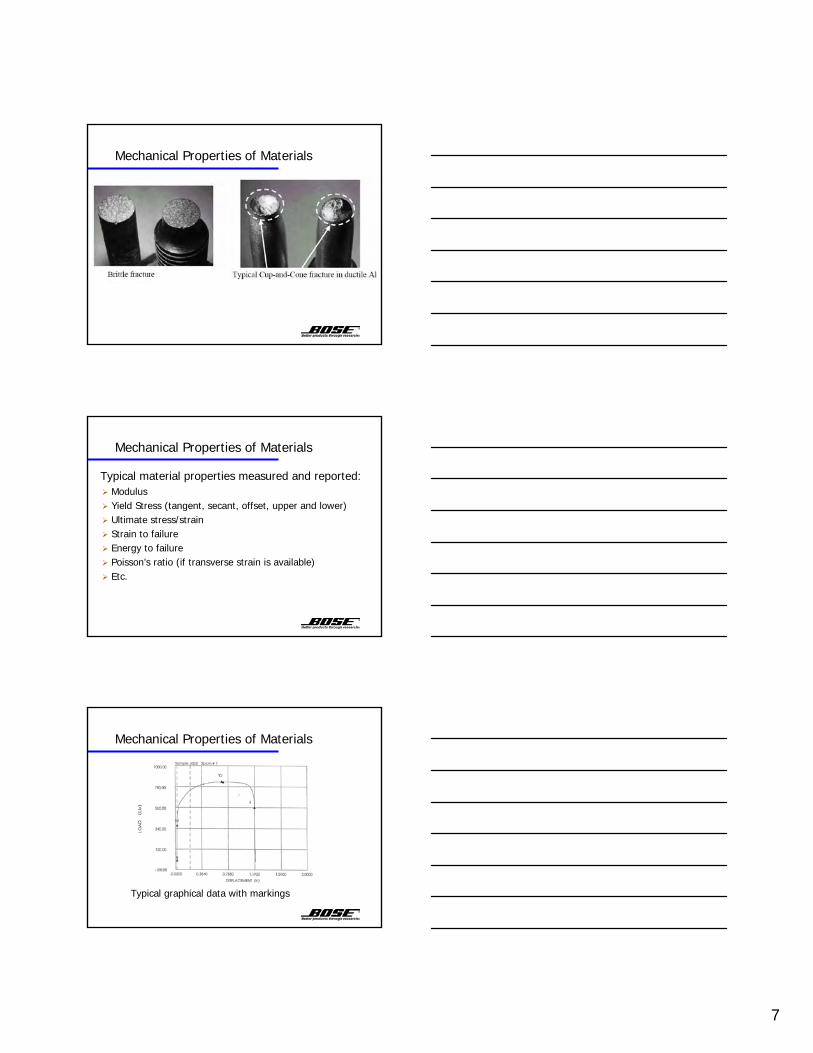
Sometimes the transition between elastic and plastic deformation is very sharp.
Mechanical Properties of Materials
Mechanical Properties of Materials
7
Mechanical Properties of Materials
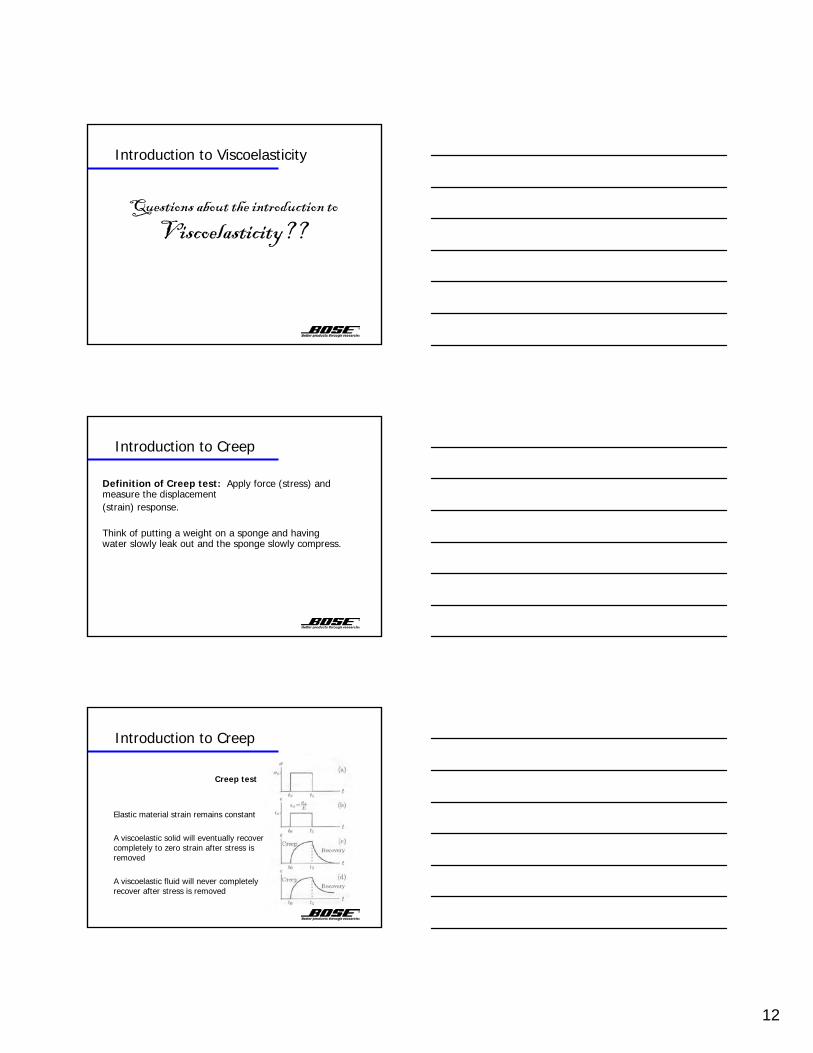
Typical material properties measured and reported:
Mechanical Properties of Materials
ModulusYield Stress (tangent, secant, offset, upper and lower)Ultimate stress/strainStrain to failureEnergy to failurePoisson’s ratio (if transverse strain is available)Etc.
Typical graphical data with markings
Mechanical Properties of Materials

8
Mechanical Properties of Materials
Shear versus Axial
For small deformations, shear strain is defined by=d/l
Shear strains cause a change in shape but not in volume.
Shear stress is equal to the shear force divided by the shear area.
Shear stress is proportional to shearstrain by the shear modulus, G in the elastic region. G~E/3
Mechanical Properties of Materials
γ
• Torsional shear strain (γ)
θa
h
No volume change …
γ = θ a / h
Questions about the introduction to Mechanical Properties of
Materials??
Mechanical Properties of Materials

9
What is Viscoelasticity?
If you apply a force to a solid, it deforms to some extent.
If you apply a force to a liquid it deforms continuously. It flows.
A viscoelastic material is part solid, part liquid.
Introduction to Viscoelasticity
Introduction to Viscoelasticity
ViscoelasticityDefinition: time-dependent material behavior where the
stress response of that material depends on both the strain applied and the strain rate at which it was applied!
�Examples:
biological materialspolymersmetals at high temperatures
Introduction to Viscoelasticity
10
Elastic versus viscoelastic behaviorsFor a constant applied strain
An elastic material has a unique material responseA viscoelastic material has infinite material responses depending on the strain-rate
Introduction to Viscoelasticity
Introduction to Viscoelasticity
Elastic SolidStress is only a function of strain σ=σ(ε)For linearly elastic, we have a single modulus, E or G
Viscous FluidStress is only a function of strain rate σ=σ(dε/dt)Proportionality constant is the viscosity, η
Introduction to Viscoelasticity
Maxwell ModelStress is a function of strain and strain-rate σ=σ(ε, dε/dt)2 Constants -- k,c
Kelvin-Voigt ModelStress is a function of strain and strain-rate σ=σ(ε, dε/dt)2 Constants -- k,c

11
• Under repetitive loading, a viscoelastic material will heat up. Energy is dissipated regardless of whether strains (or stresses) are small or large;– some energy is dissipated
with dashpots (as heat)– some energy is stored in
springs– area in the hysteresis loop is
a function of loading rate
Introduction to Viscoelasticity
Viscoelastic behavior -- MemoryBecause of the time dependent material behavior of viscoelastic materials, their behavior is dependent on the history of loading and are said to have a ‘memory.’That is, viscoelastic materials remember the history of deformations they undergo and then react accordingly.
This means that you must know the sequence of applied loading to create tests that predict real life performance or match data from other test protocols.
Introduction to Viscoelasticity
Introduction to Viscoelasticity
Because the mechanical response of a viscoelastic material is a function of load magnitude and rate, we must specify both during a theoretical analysis or experimental study.
Ramp rate and levelFrequency and end levels
12
Questions about the introduction to Viscoelasticity??
Introduction to Viscoelasticity
Definition of Creep test: Apply force (stress) and measure the displacement(strain) response.
Think of putting a weight on a sponge and having water slowly leak out and the sponge slowly compress.
Introduction to Creep
Introduction to Creep
Creep test
Elastic material strain remains constant
A viscoelastic solid will eventually recover completely to zero strain after stress is removed
A viscoelastic fluid will never completely recover after stress is removed
13
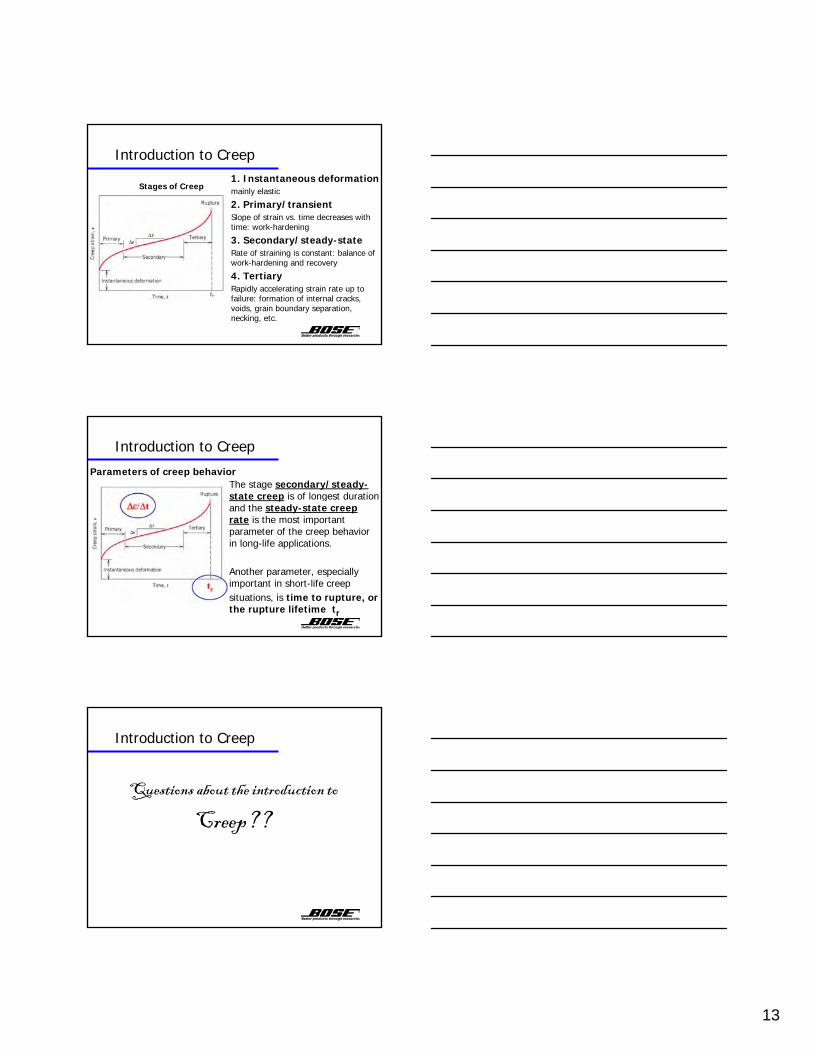
Introduction to Creep1. Instantaneous deformationmainly elastic
2. Primary/transientSlope of strain vs. time decreases with time: work-hardening
3. Secondary/steady-state Rate of straining is constant: balance of work-hardening and recovery
4. Tertiary Rapidly accelerating strain rate up to failure: formation of internal cracks, voids, grain boundary separation, necking, etc.
Stages of Creep
Introduction to Creep
Parameters of creep behaviorThe stage secondary/steady-state creep is of longest duration and the steady-state creep rate is the most important parameter of the creep behavior in long-life applications.
Another parameter, especially important in short-life creepsituations, is time to rupture, or the rupture lifetime tr
Questions about the introduction to
Creep??
Introduction to Creep
14
Introduction to Stress Relaxation
Definition of Stress-relaxation test:Apply displacement (strain) and measure the force (stress) response.
Think of a long walk on the beach . . .
Introduction to Stress Relaxation
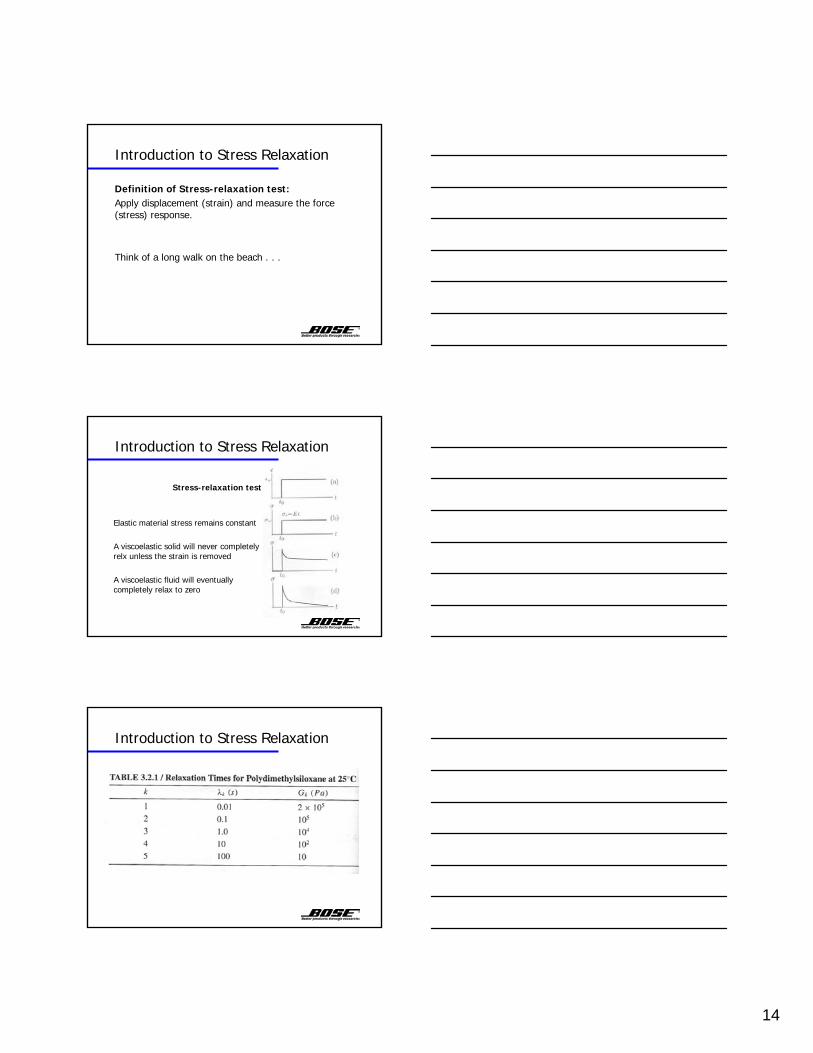
Stress-relaxation test
Elastic material stress remains constant
A viscoelastic solid will never completely relx unless the strain is removed
A viscoelastic fluid will eventually completely relax to zero
Introduction to Stress Relaxation
15
Introduction to Stress Relaxation
Relaxation data
0
10
20
30
40
50
60
70
80
90
0 2 4 6 8 10 12 14 16 18 20
Time (sec)
Forc
e (N
)
0
0.5
1
1.5
2
2.5
3
3.5
4
4.5
Dis
plac
emen
t (m
m)
Force Displacement
Introduction to Stress Relaxation
Introduction to Stress Relaxation
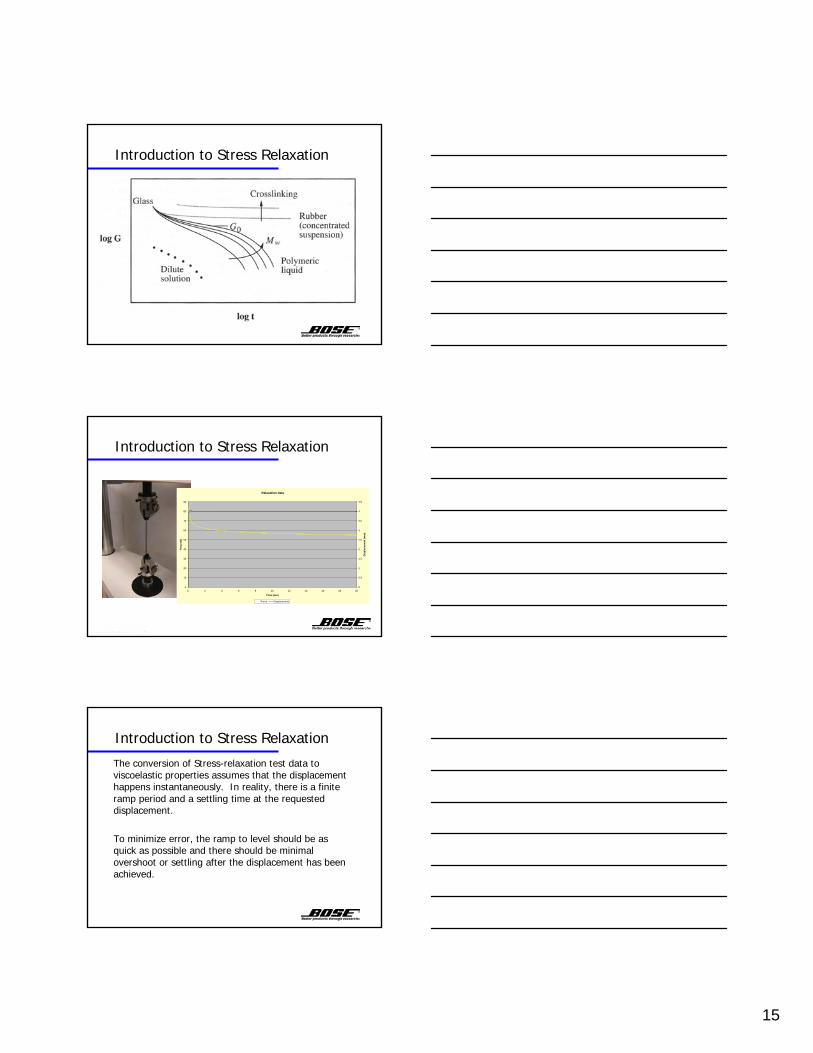
The conversion of Stress-relaxation test data to viscoelastic properties assumes that the displacement happens instantaneously. In reality, there is a finite ramp period and a settling time at the requested displacement.
To minimize error, the ramp to level should be as quick as possible and there should be minimal overshoot or settling after the displacement has been achieved.
16
Questions about the introduction to Creep/Relaxation??
Introduction to Stress Relaxation
Cyclic data on rubber
0
5
10
15
20
25
0 2 4 6 8 10 12 14
Displacement (mm)
Load
(N)
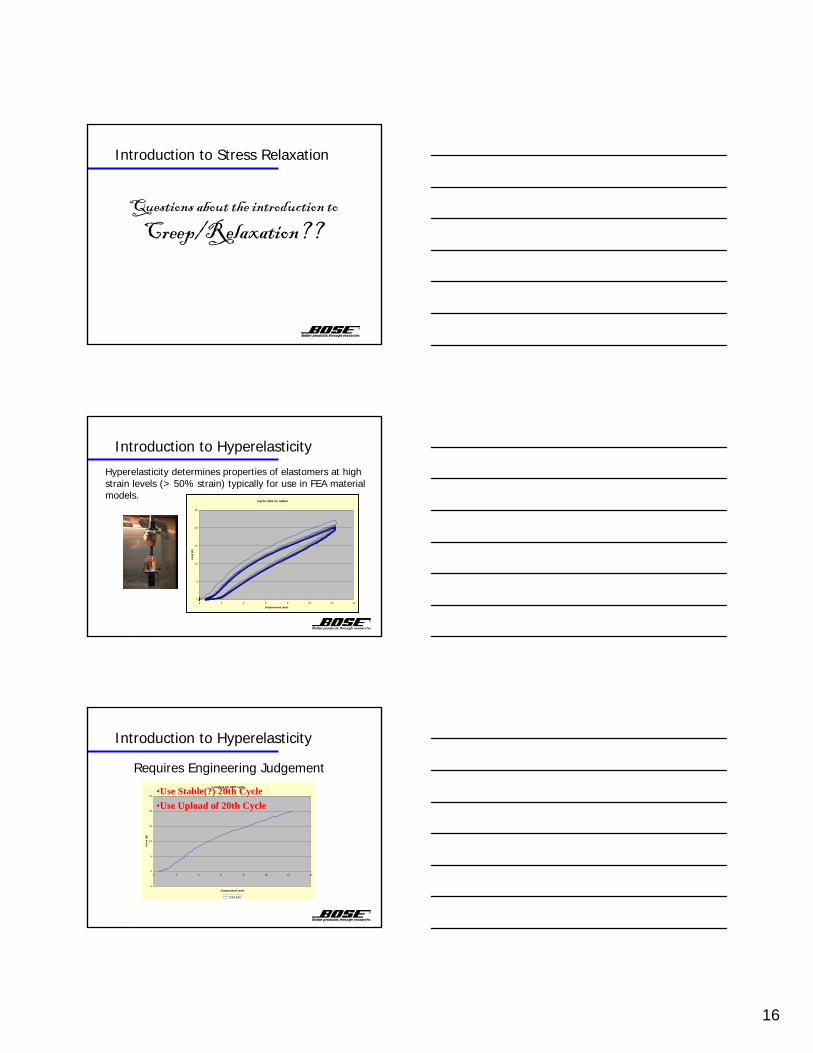
Introduction to Hyperelasticity
Hyperelasticity determines properties of elastomers at high strain levels (> 50% strain) typically for use in FEA material models.
Cycle 20
0
5
10
15
20
25
0 2 4 6 8 10 12 14
Displacement (mm)
Forc
e (N
)
Cycle 20
Loading for 20th cycle
-5
0
5
10
15
20
25
0 2 4 6 8 10 12 14
Displacement (mm)
Forc
e (N
)
Initial data
Requires Engineering Judgement
•Use Stable(?) 20th Cycle•Use Upload of 20th Cycle
Introduction to Hyperelasticity

17
Loading for 20th cycle
0
5
10
15
20
25
0 2 4 6 8 10 12 14
Displacement (mm)
Forc
e (N
)
Initial data Corrected data
•Correct for offset
Introduction to Hyperelasticity
Bi-axial material characterization
Introduction to Hyperelasticity
Planar shear (Pure shear)
Introduction to Hyperelasticity

18
Questions about the introduction to
Hyperelasticity??
Introduction to Hyperelasticity
ElectroForce®
Linear Motor
Moving magnet -stationary coil design
Rare earth magnets
Advanced flexure design
No friction & no stiction = frictionless operation
No hydraulic oil or air required
Bose ElectroForce® Technology
19
ElectroForce® Advantages
High performance: Static/One cycle a day to 200 Hz
High-resolution control and measurability: millinewton & nanometers
No hoses, no oil - just plug it in and start testing
Some motors can be place in an incubator and run at 100% humidity
Billions of cycles with minimum maintenance
Quiet operation
Reduces your operating costs
10 year warranty on ElectroForce Linear Motor
ElectroForce® Advantages
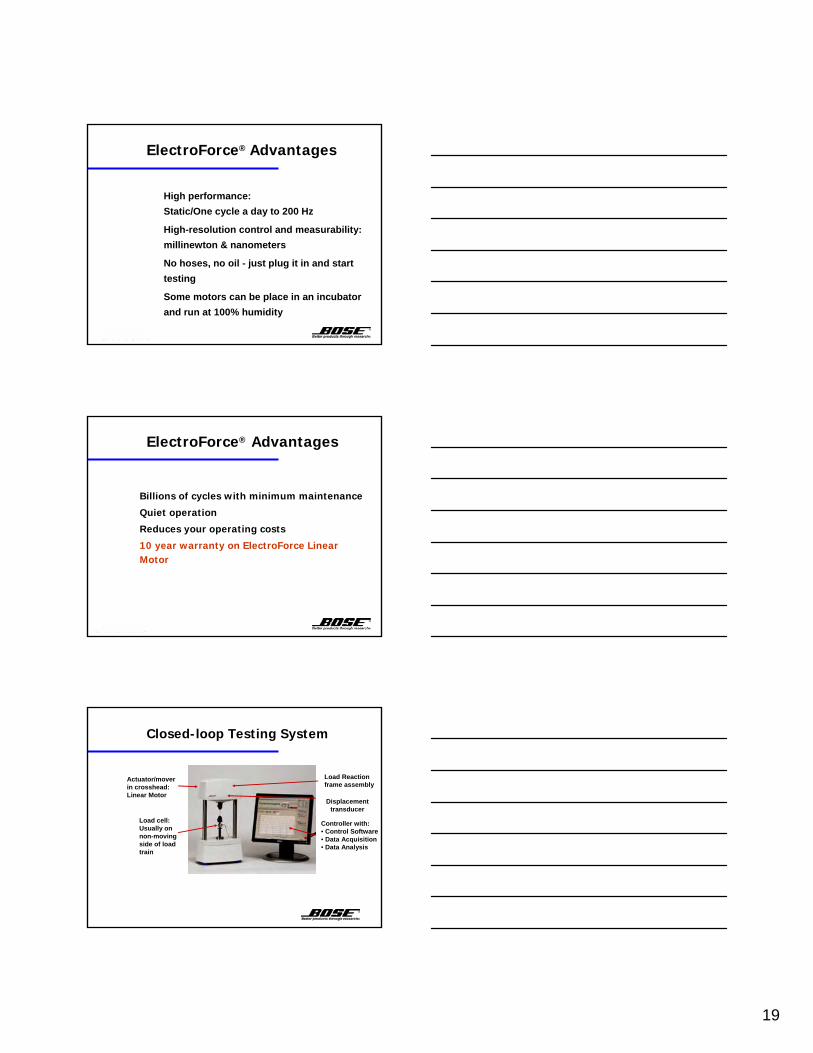
Closed-loop Testing System
Actuator/mover in crosshead:Linear Motor
Load Reaction frame assembly
Load cell:Usually on non-moving side of load train
Displacement transducer
Controller with: • Control Software• Data Acquisition• Data Analysis
20
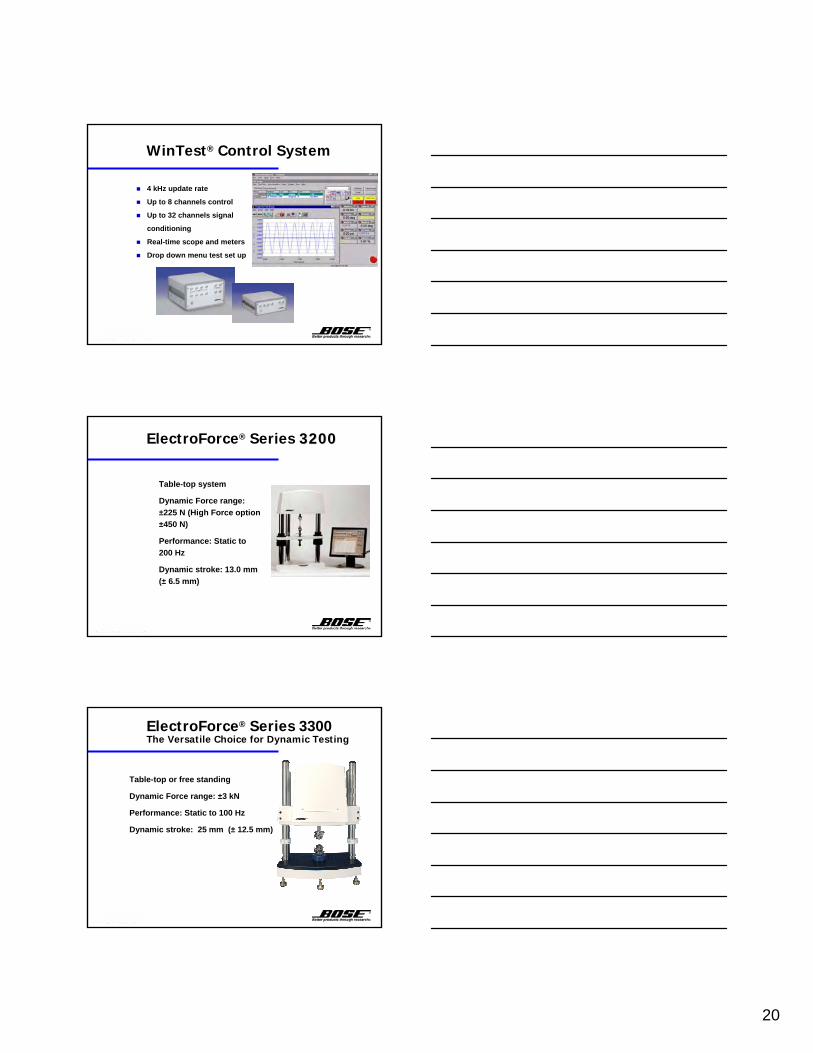
WinTest® Control System
4 kHz update rate
Up to 8 channels control
Up to 32 channels signal
conditioning
Real-time scope and meters
Drop down menu test set up
Table-top system
Dynamic Force range: ±225 N (High Force option ±450 N)
Performance: Static to 200 Hz
Dynamic stroke: 13.0 mm (± 6.5 mm)
ElectroForce® Series 32003200
Table-top or free standing
Dynamic Force range: ±3 kN
Performance: Static to 100 Hz
Dynamic stroke: 25 mm (± 12.5 mm)
ElectroForce® Series 3300The Versatile Choice for Dynamic Testing
21
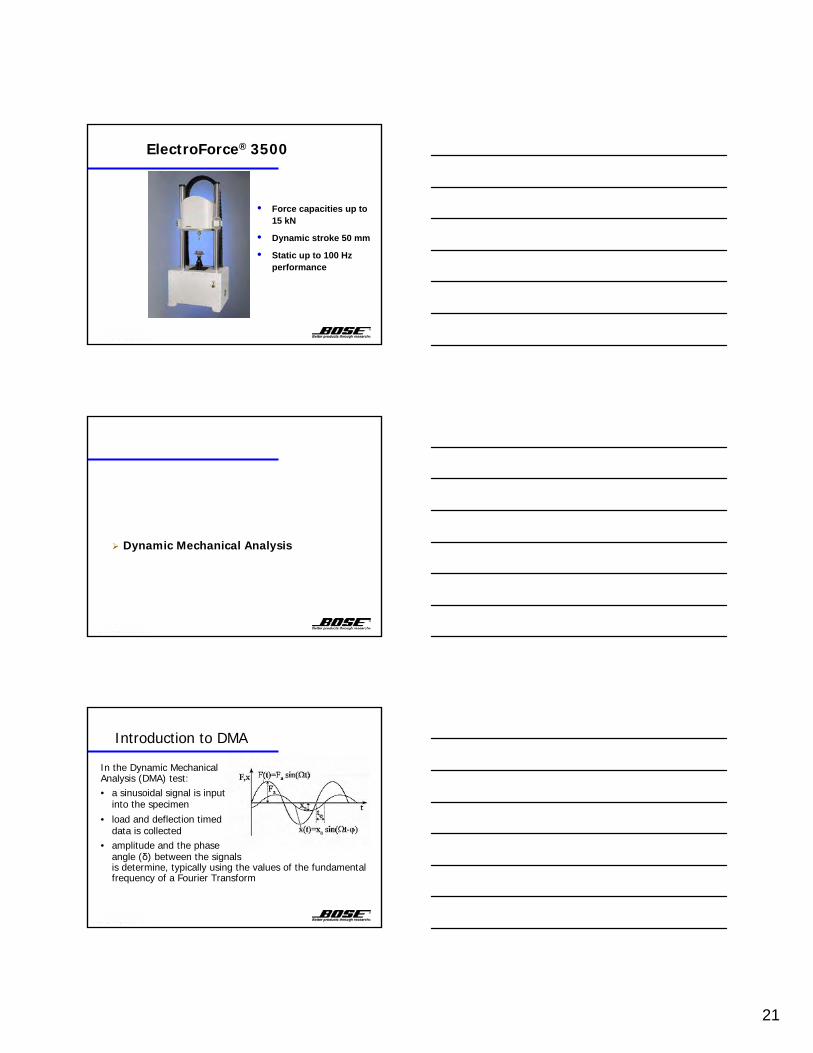
• Force capacities up to 15 kN
• Dynamic stroke 50 mm
• Static up to 100 Hz performance
ElectroForce® 3500
Dynamic Mechanical Analysis
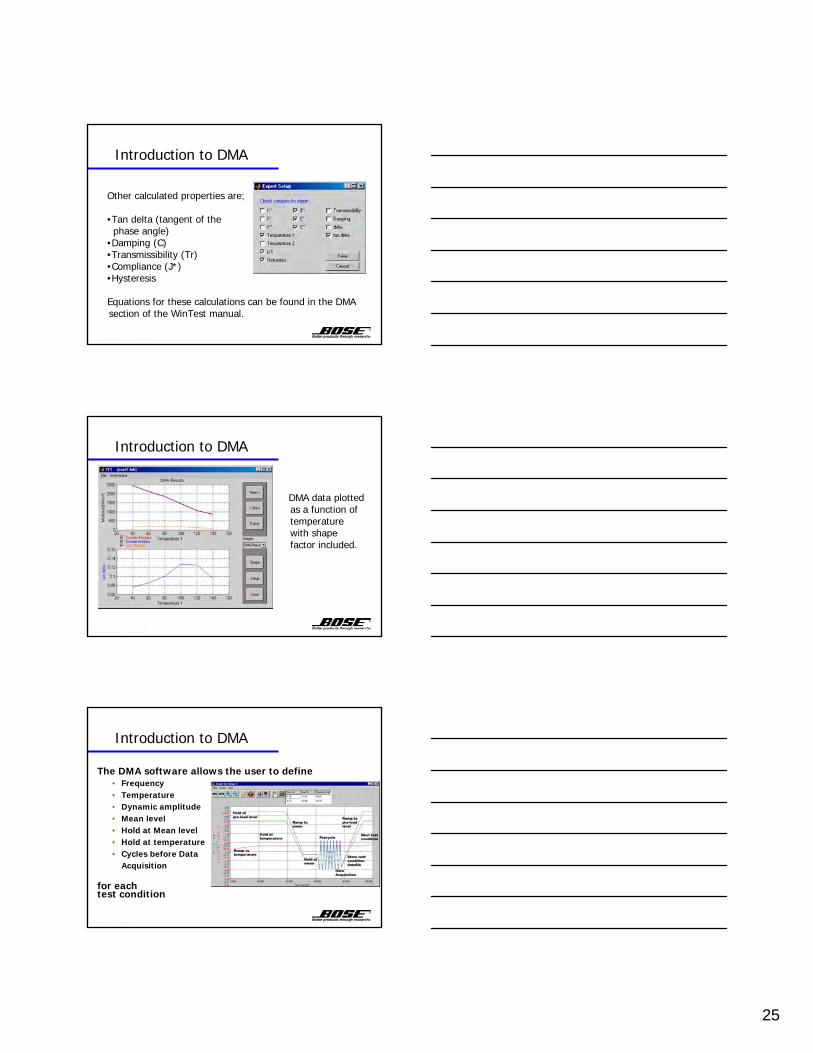
In the Dynamic Mechanical Analysis (DMA) test:• a sinusoidal signal is input
into the specimen • load and deflection timed
data is collected• amplitude and the phase
angle (δ) between the signals is determine, typically using the values of the fundamental frequency of a Fourier Transform
Introduction to DMA

22
DMA properties are used to predict the behavior of materials or components as a function of
• temperature, • frequency, • dynamic vibration • mean condition
Introduction to DMA
DMA properties can be used to: • Monitor the state of cure of an elastomer• Determine the glass transition of a polymer• Predict vibration isolation performance• Predict traction and rolling resistance of tires• Predict seal performance• Monitor changes as a function of fatigue
The DMA software has even been used to measure the coefficient of thermal expansion!
Introduction to DMA
Polypropylene and Clay Composite as a function of compound
Composite versus pure pp
0
500
1000
1500
2000
2500
3000
3500
-40 -30 -20 -10 0 10 20 30 40
Temperature (C)
Mod
ulus
(N/m
m^2
)
0
0.02
0.04
0.06
0.08
0.1
0.12
0.14
0.16
0.18
E* composite E* pure pp tan delta composite tan delta pure pp
Introduction to DMA
Glass transition test on polypropolene and polypropolene-based-nanocomposite
23
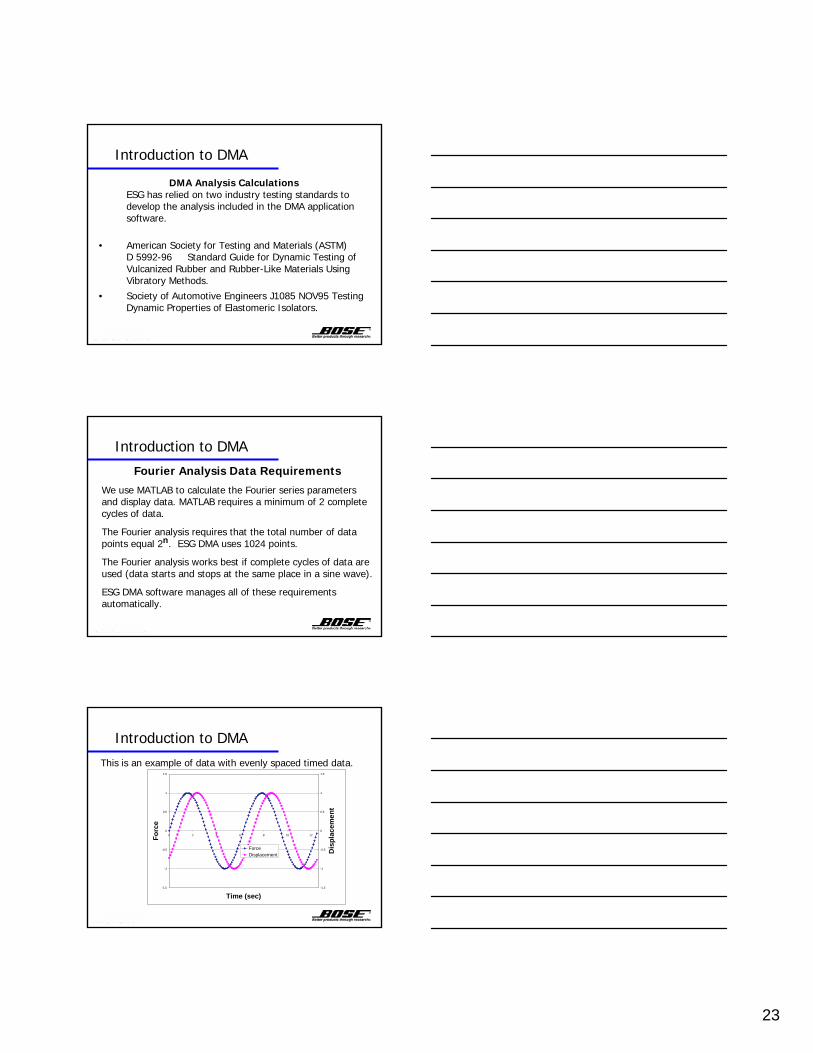
DMA Analysis CalculationsESG has relied on two industry testing standards to develop the analysis included in the DMA application software.
• American Society for Testing and Materials (ASTM) D 5992-96 Standard Guide for Dynamic Testing of Vulcanized Rubber and Rubber-Like Materials Using Vibratory Methods.
• Society of Automotive Engineers J1085 NOV95 Testing Dynamic Properties of Elastomeric Isolators.
Introduction to DMA
Introduction to DMA
Fourier Analysis Data Requirements
We use MATLAB to calculate the Fourier series parameters and display data. MATLAB requires a minimum of 2 complete cycles of data.
The Fourier analysis requires that the total number of data points equal 2n. ESG DMA uses 1024 points.
The Fourier analysis works best if complete cycles of data are used (data starts and stops at the same place in a sine wave).
ESG DMA software manages all of these requirements automatically.
Introduction to DMA
This is an example of data with evenly spaced timed data.
-1.5
-1
-0.5
0
0.5
1
1.5
0 2 4 6 8 10 12
Time (sec)
Forc
e
-1.5
-1
-0.5
0
0.5
1
1.5
Dis
plac
emen
t
ForceDisplacement
24
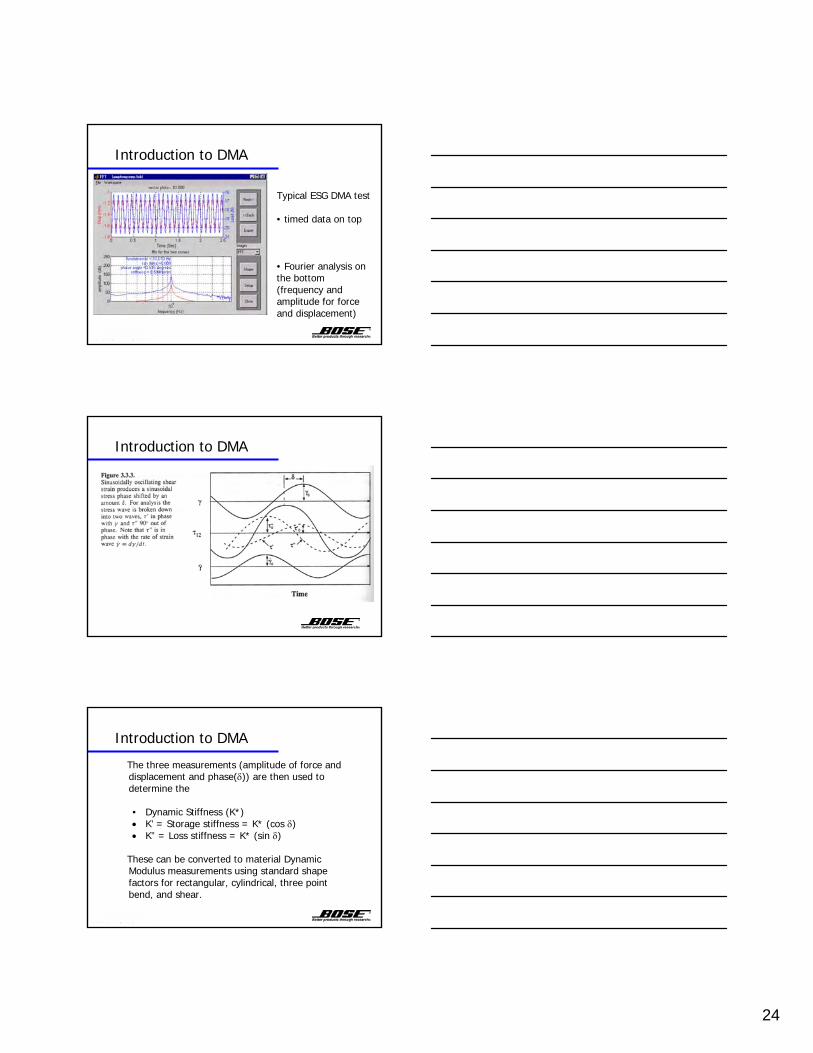
Typical ESG DMA test
• timed data on top
• Fourier analysis on the bottom (frequency and amplitude for force and displacement)
Introduction to DMA
Introduction to DMA
The three measurements (amplitude of force and displacement and phase(δ)) are then used to determine the
• Dynamic Stiffness (K*)• K’ = Storage stiffness = K* (cos δ)• K” = Loss stiffness = K* (sin δ)
These can be converted to material Dynamic Modulus measurements using standard shape factors for rectangular, cylindrical, three point bend, and shear.
Introduction to DMA
25
Other calculated properties are;
•Tan delta (tangent of the phase angle)
•Damping (C) •Transmissibility (Tr)•Compliance (J*)•Hysteresis
Equations for these calculations can be found in the DMA section of the WinTest manual.
Introduction to DMA
DMA data plotted as a function of temperature with shape factor included.
Introduction to DMA
The DMA software allows the user to define• Frequency• Temperature• Dynamic amplitude• Mean level• Hold at Mean level• Hold at temperature• Cycles before Data
Acquisition
for eachtest condition
Introduction to DMA

26
In addition to timed data or spectral analysis, the DMA software allows the display of
X vs. Y (Hysteresis loops)
Amplitude results
Calculated DMA results
Introduction to DMA
X vs. Y (Hysteresis loops) Amplitude results
Introduction to DMA
Example of Stiffness or Modulus as a function of a changing control parameter.
Example of Tg determination
Introduction to DMA
27
Exported to an ASCII file with all the test information.
Introduction to DMA
Questions about the introduction to
Dynamic Mechanical Analysis??
Introduction to DMA
What is Fatigue???
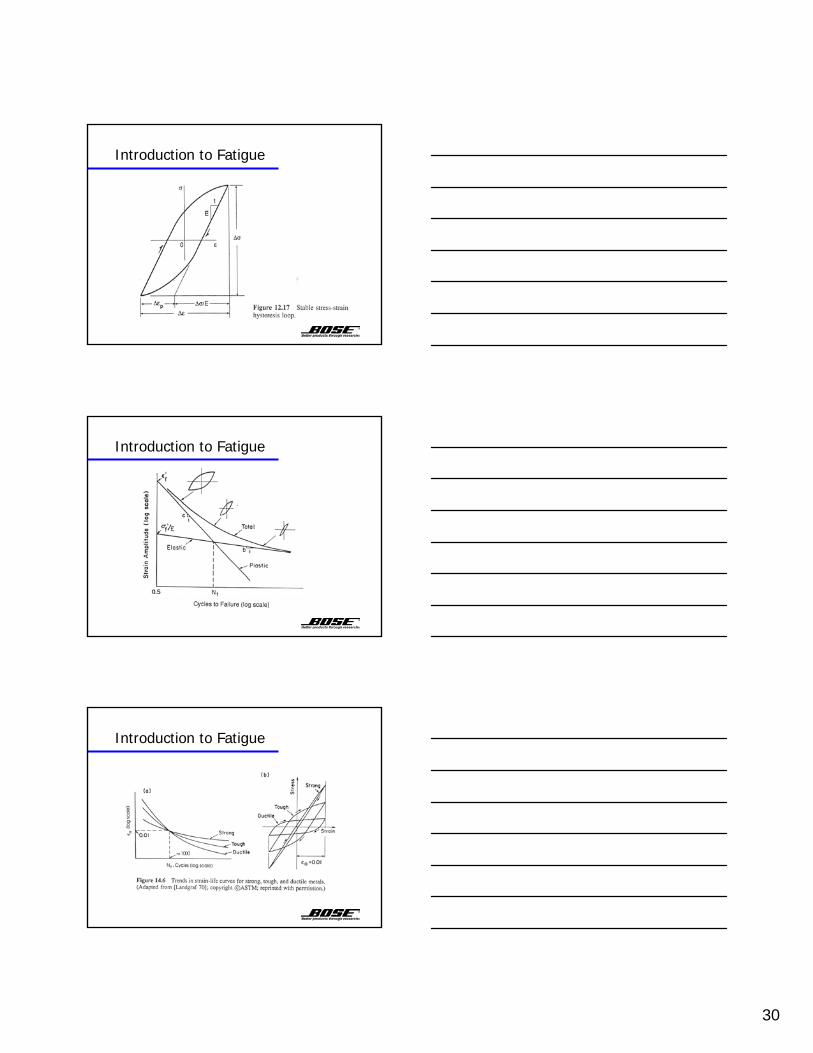
Fatigue is failure of a component or structure from cyclic loading at stresses below the materials ultimate strength, and in some cases, below the materials yield strength.
Introduction to Fatigue
28
Introduction to Fatigue
Introduction to Fatigue
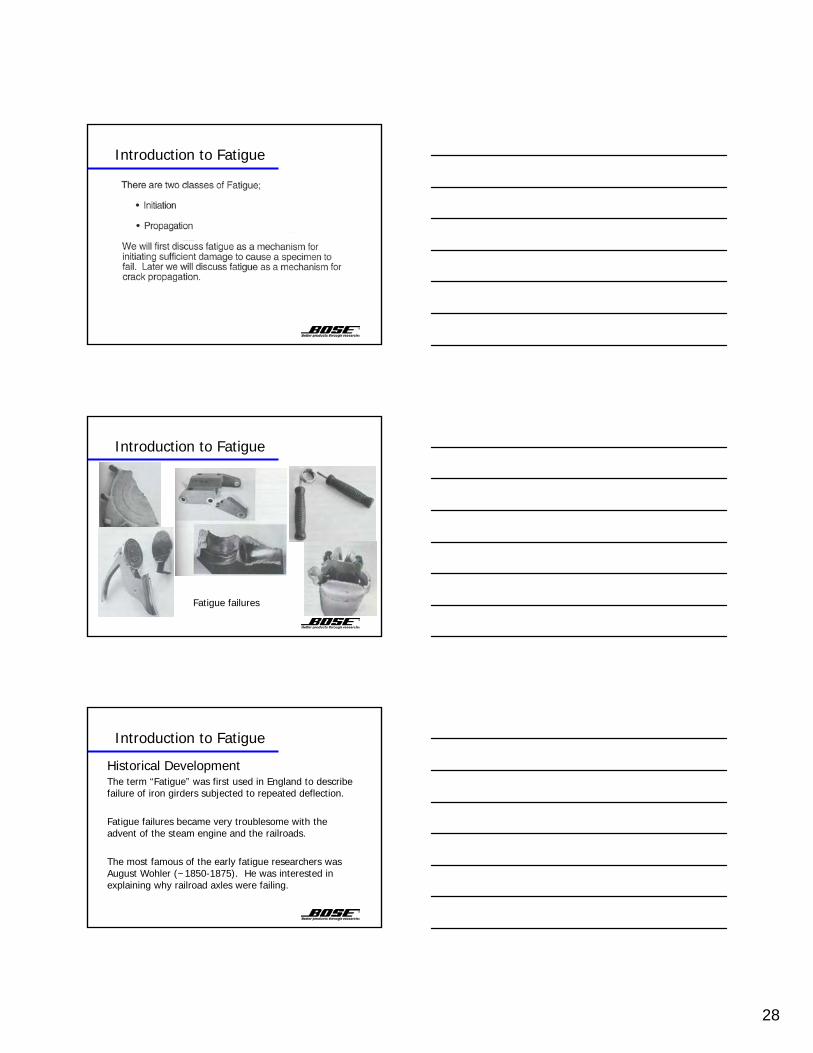
Fatigue failures
Introduction to Fatigue
Historical DevelopmentThe term “Fatigue” was first used in England to describe failure of iron girders subjected to repeated deflection.
Fatigue failures became very troublesome with the advent of the steam engine and the railroads.
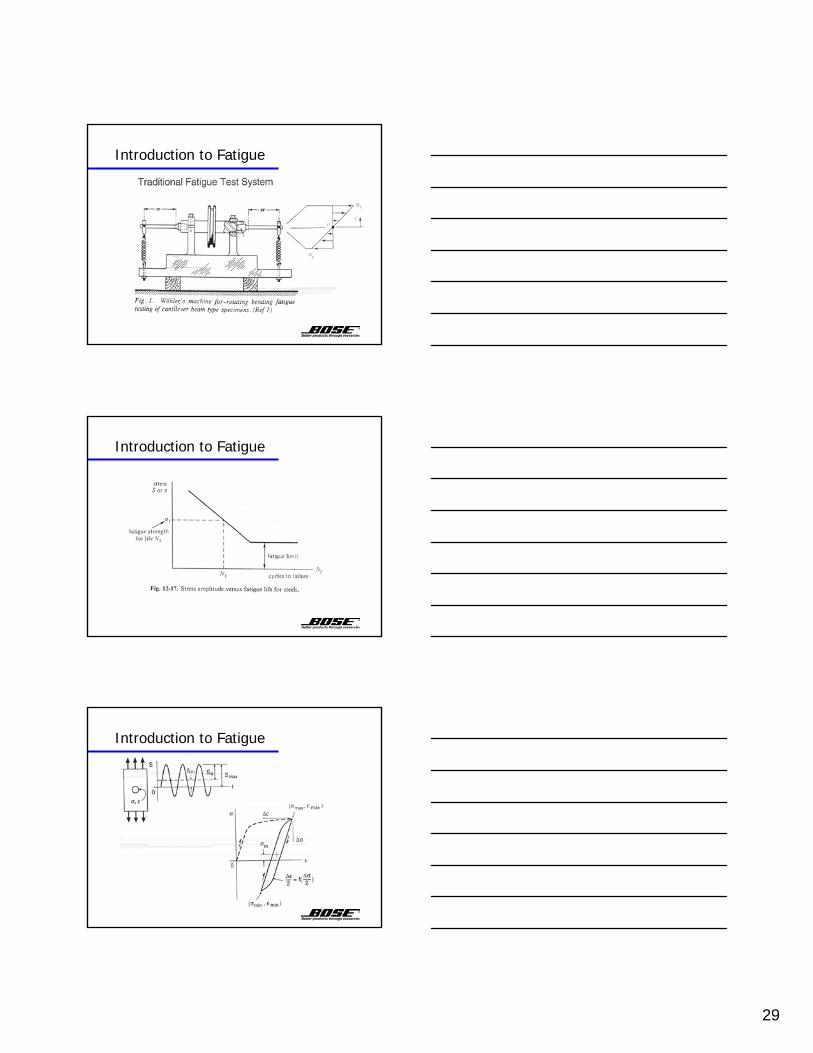
The most famous of the early fatigue researchers was August Wohler (~1850-1875). He was interested in explaining why railroad axles were failing.
29
Introduction to Fatigue
Introduction to Fatigue
Introduction to Fatigue
30
Introduction to Fatigue
Introduction to Fatigue
Introduction to Fatigue
31
Introduction to Fatigue
Introduction to Fatigue
Introduction to Fatigue
32
Introduction to Fatigue
Introduction to Fatigue
Most testing is single axis. The real world is multi-axial. No standard currently exists for this testing. WinTest provides good tools to conduct both single and multi-axial testing.
Thermal effects are also important. TMF (Thermal Mechanical Fatigue) combines the effects of both and is often used for predicting fatigue life of components such as turbine blades. Specialized application software is required to manage the function generation and data acquisition requirements of TMF.
Introduction to Fatigue
33
Questions about the introduction to Fatigue??
Introduction to Fatigue
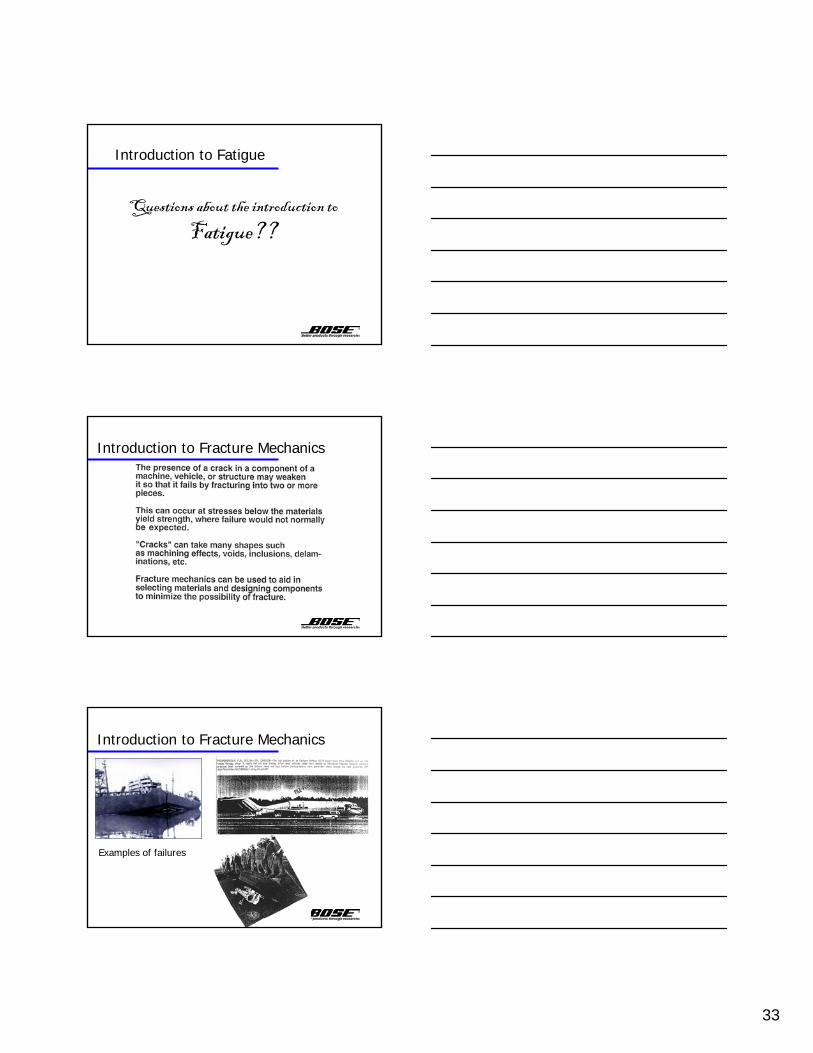
Introduction to Fracture Mechanics
Examples of failures
Introduction to Fracture Mechanics
34
Who uses Fracture Mechanics?Pressure vessels (leak before fail)
Power generationOil-Gas industry
Material producersNaval industryCivil Engineering (bridges, buildings, etc.)AerospaceAutomotiveBiomedicalOthers?
Introduction to Fracture Mechanics
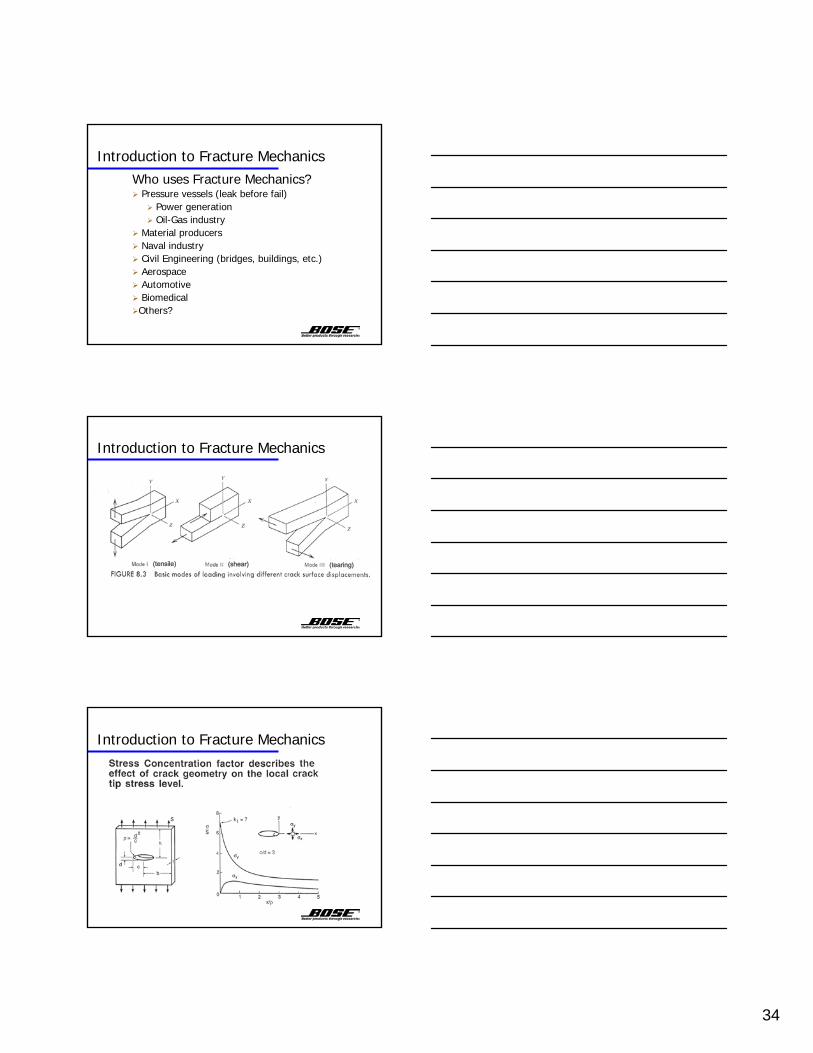
Introduction to Fracture Mechanics
(tensile) (shear) (tearing)
Introduction to Fracture Mechanics
35
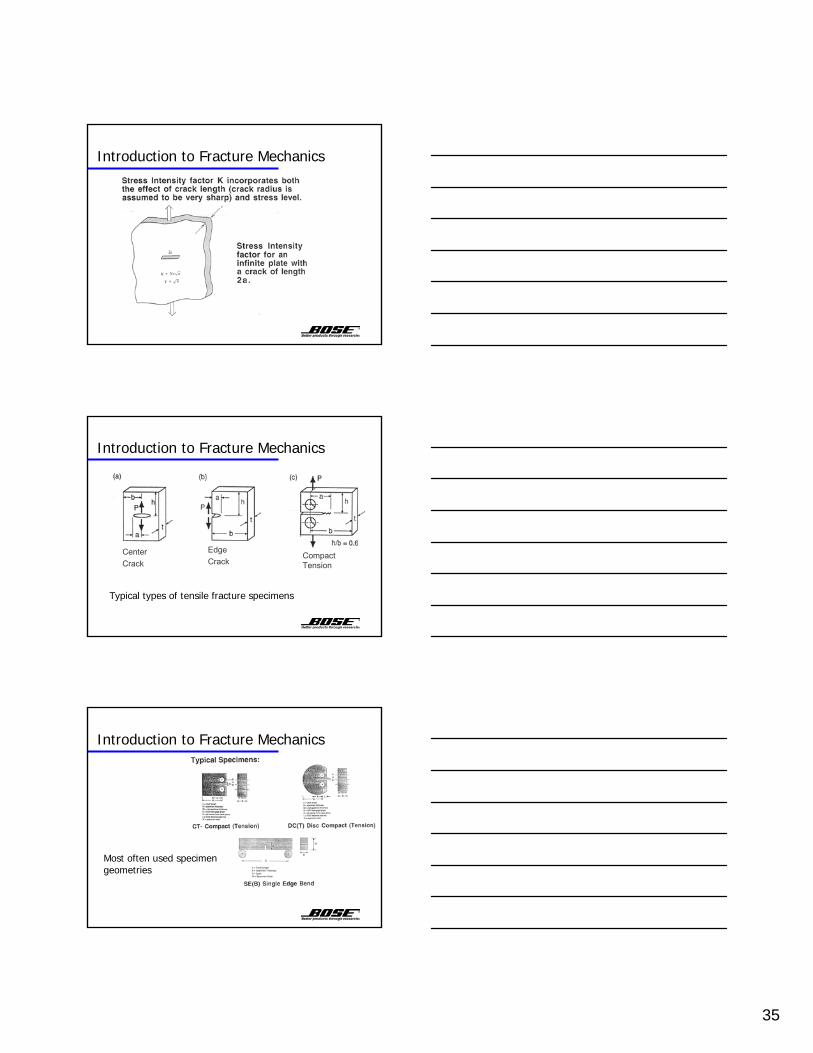
Introduction to Fracture Mechanics
Typical types of tensile fracture specimens
Introduction to Fracture Mechanics
Compact Tension
Edge Crack
Center Crack
Introduction to Fracture Mechanics
Most often used specimen geometries
36
Introduction to Fracture Mechanics
Introduction to Fracture Mechanics
There are two related fields of study in Fracture Mechanics;
Crack growthFracture toughness
Crack growth studies help predict how quickly a crack will grow when a structure is subjected to typical loading.
Fracture toughness studies help predict the conditions where an existing crack will grow in an unstable manner.
The combination of the two help determine inspection requirements to detect critical cracks prior to catastrophic failures like those shown in the introduction to this section.
Questions about the introduction to Fracture Mechanics??
Introduction to Fracture Mechanics

37
Introduction to Crack Growth
Typical Crack growth data.
Crack length as a function of cycles and applied force
Introduction to Crack Growth
Typical Crack growth data.
Crack growth rate as a function of Stress Intensity
F = geometry effect∆S = Stress Amplitudeaavg = average crack length
Introduction to Crack Growth
Crack growth curve including initiation, stable growth, and unstable growth to failure.
38
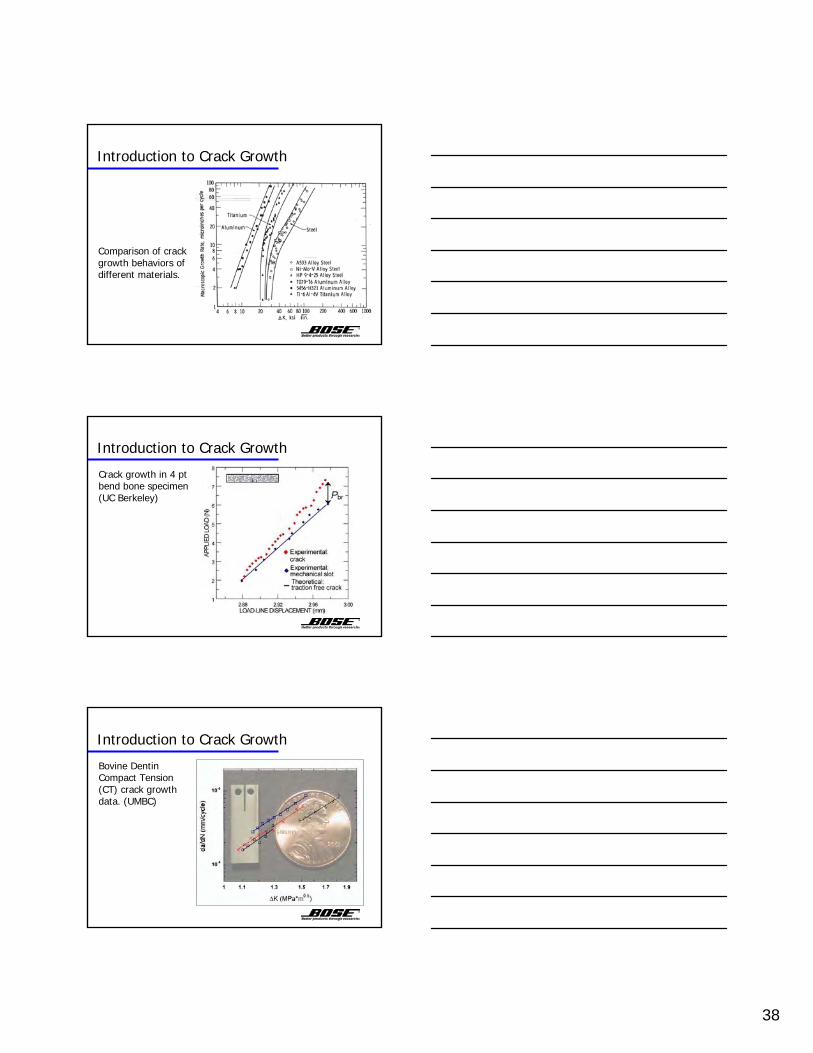
Introduction to Crack Growth
Comparison of crack growth behaviors of different materials.
Introduction to Crack Growth
Crack growth in 4 pt bend bone specimen (UC Berkeley)
Introduction to Crack Growth
Bovine Dentin Compact Tension (CT) crack growth data. (UMBC)
39
Introduction to Crack Growth
Crack growth tests can include the influence of environment (hydrogen embrittlement, corrosion, temperature, etc.). It can also include strain rate or viscoelastic dependencies (vary frequency, vary hold times, vary ramp rates, etc.)
Crack growth tests are typically K controlled (constant K, K shed, K increasing) so some real-time measure or estimate of the crack length is required.
Questions about the introduction to Crack Growth??
Introduction to Crack Growth
Biomaterial Stimulation and Growth
40
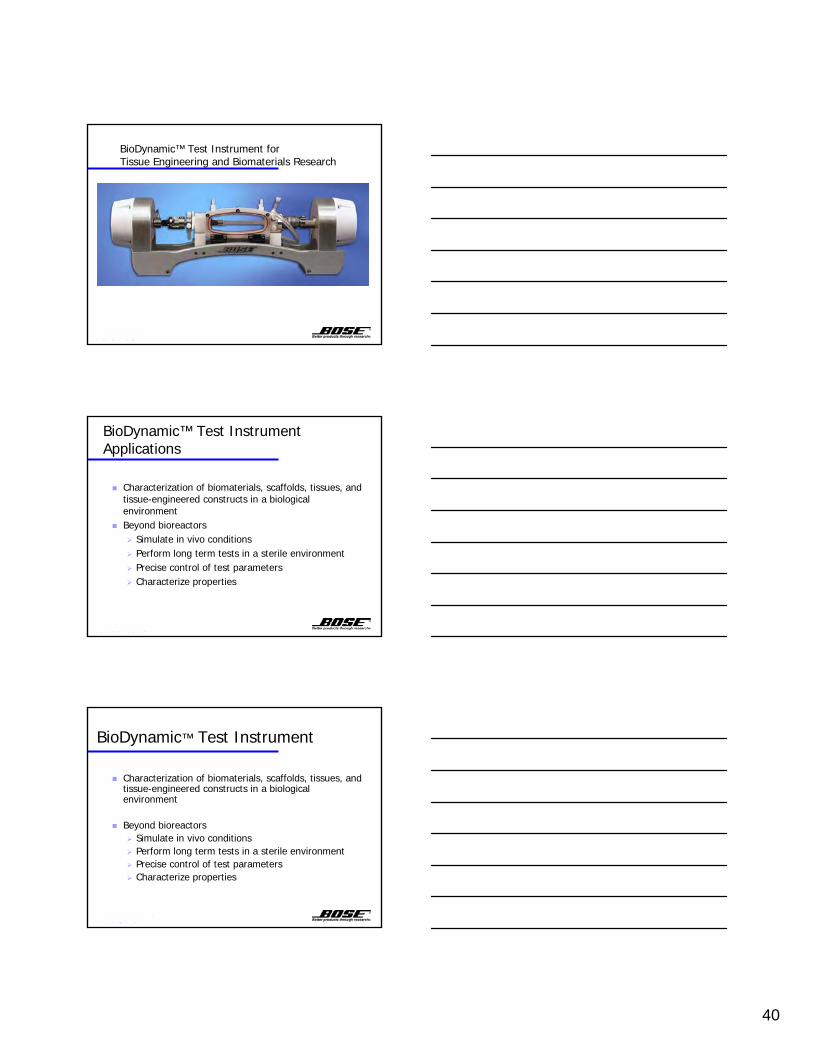
BioDynamic™ Test Instrument for Tissue Engineering and Biomaterials Research
BioDynamic™ Test Instrument Applications
Characterization of biomaterials, scaffolds, tissues, and tissue-engineered constructs in a biological environmentBeyond bioreactors
Simulate in vivo conditionsPerform long term tests in a sterile environmentPrecise control of test parametersCharacterize properties
BioDynamic™ Test Instrument
Characterization of biomaterials, scaffolds, tissues, and tissue-engineered constructs in a biological environment
Beyond bioreactorsSimulate in vivo conditionsPerform long term tests in a sterile environmentPrecise control of test parametersCharacterize properties

41
Compact Vertical Frames
20 N and 5 mm displacement 200 N and 12.7 mm displacement
BioDynamic™ Test Instrument Components
Frame with motorsChamber with manifoldsSensors• Load cells of different capacities and resolutions with axial motors• Displacement transducers in each motor• Two catheter-type pressure transducers with each vascular
systemFlow perfusion loopEnvironment (cell culture incubator)WinTest software
Transparent Full-View sides for observation or strain measurements
Multiple chamber ports for filling/draining chamber, flow inlets/outlets, fluid sampling, sensors
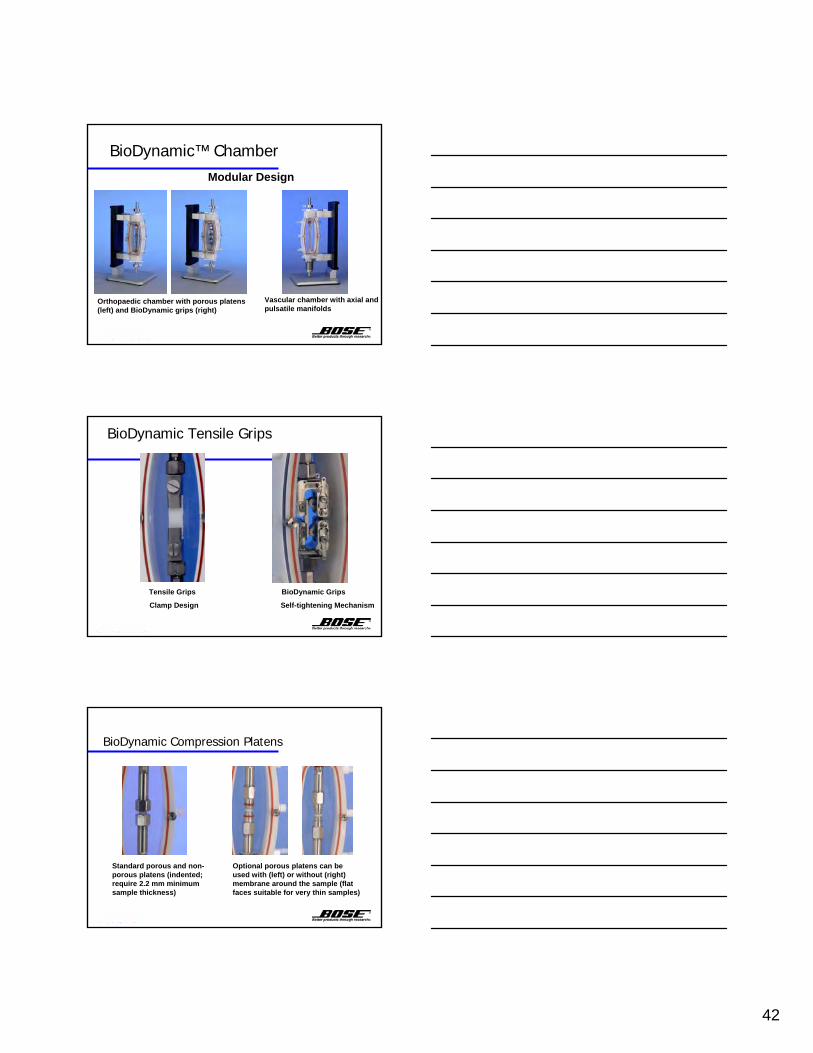
BioDynamic™ Chamber
Locks on the push rods hold specimen in stable position
42
Vascular chamber with axial and pulsatile manifolds
Modular Design
BioDynamic™ Chamber
Orthopaedic chamber with porous platens (left) and BioDynamic grips (right)
BioDynamic Tensile Grips
Tensile Grips BioDynamic Grips
Clamp Design Self-tightening Mechanism
BioDynamic Compression Platens
Standard porous and non-porous platens (indented; require 2.2 mm minimum sample thickness)
Optional porous platens can be used with (left) or without (right) membrane around the sample (flat faces suitable for very thin samples)
43
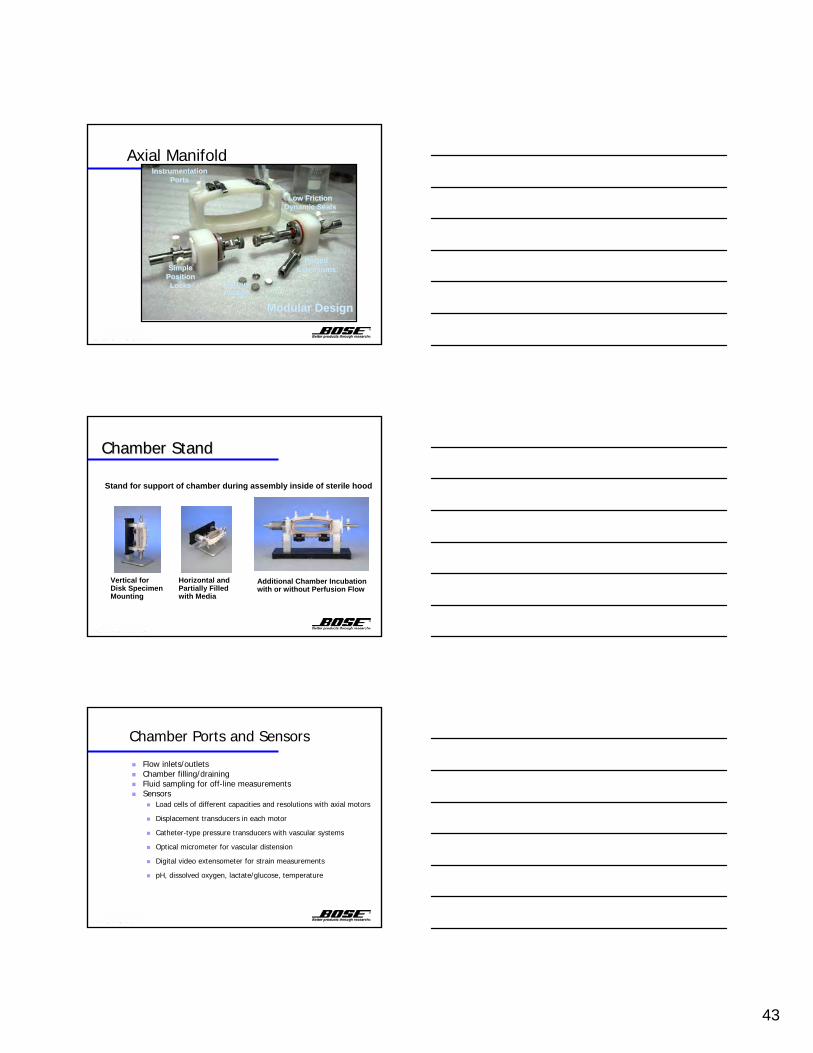
Porous Porous PlatensPlatens
Ported Ported ExtensionsExtensions
Low Friction Low Friction Dynamic SealsDynamic Seals
Modular DesignModular Design
Instrumentation Instrumentation PortsPorts
Simple Simple Position Position LocksLocks
Axial Manifold
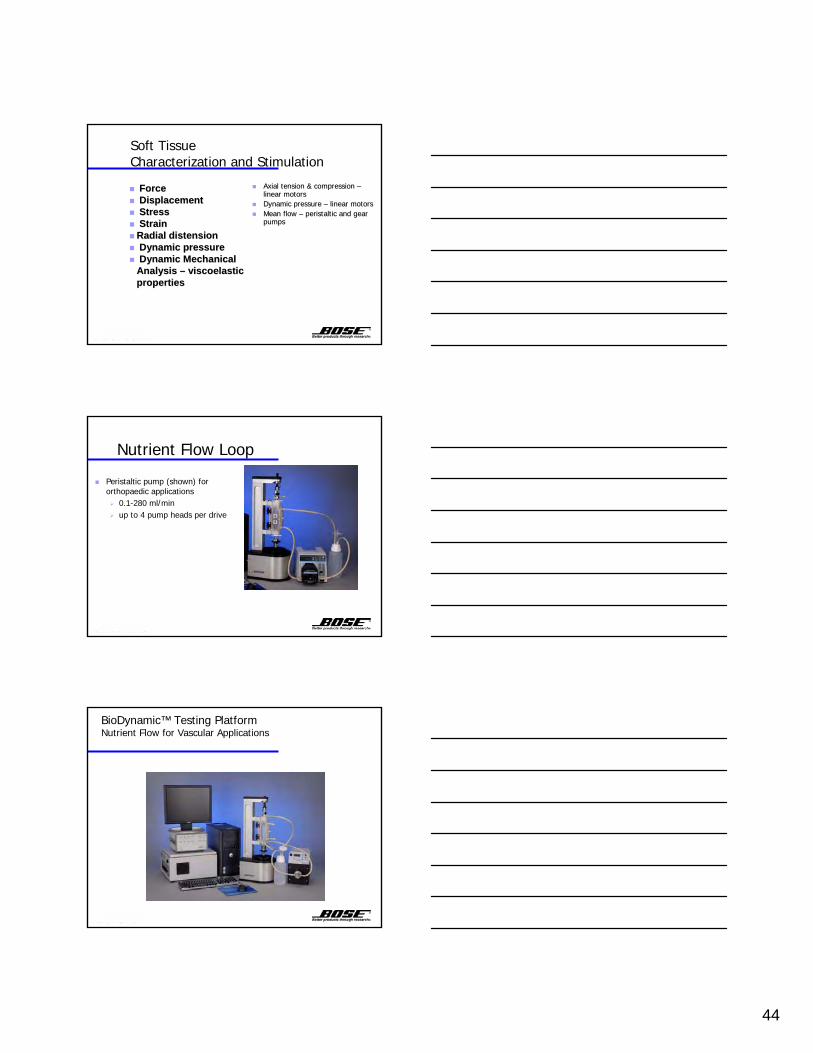
Chamber StandChamber Stand
Stand for support of chamber during assembly inside of sterile hood
Vertical for Disk Specimen Mounting
Horizontal and Partially Filled with Media
Additional Chamber Incubation with or without Perfusion Flow
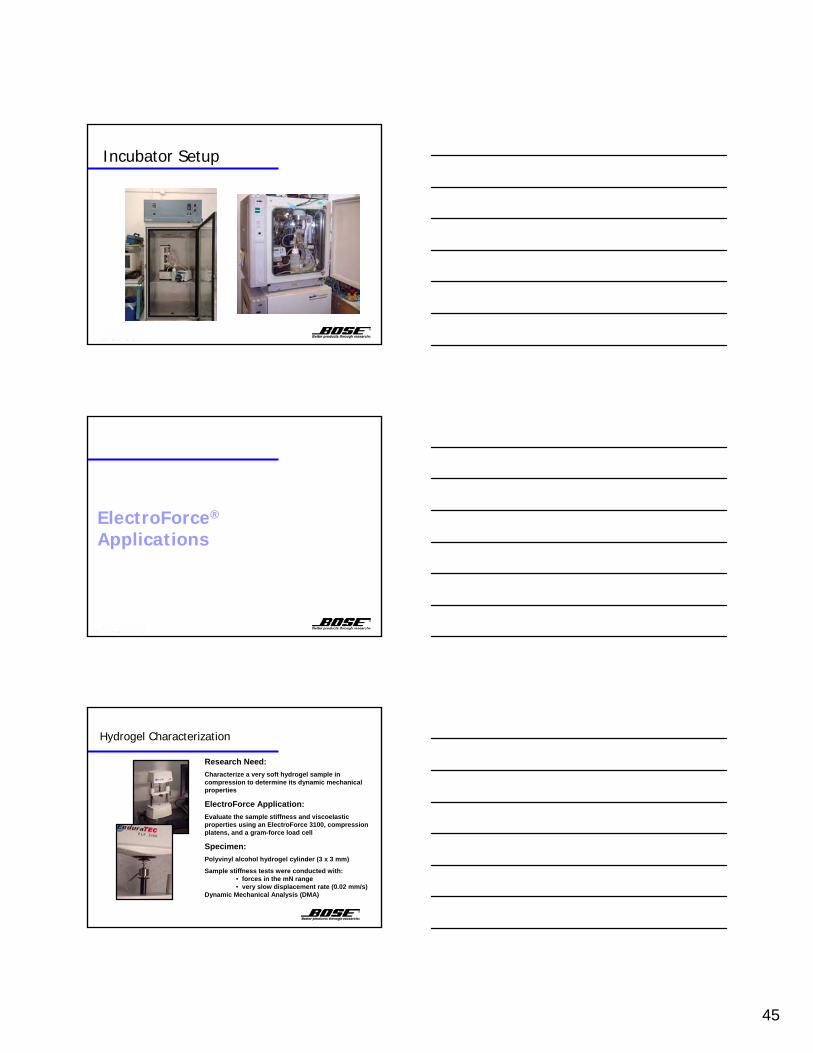
Chamber Ports and Sensors
Flow inlets/outletsChamber filling/drainingFluid sampling for off-line measurementsSensors
Load cells of different capacities and resolutions with axial motors
Displacement transducers in each motor
Catheter-type pressure transducers with vascular systems
Optical micrometer for vascular distension
Digital video extensometer for strain measurements
pH, dissolved oxygen, lactate/glucose, temperature
44
Soft Tissue Characterization and Stimulation
Axial tension & compression Axial tension & compression ––linear motorslinear motorsDynamic pressure Dynamic pressure –– linear motorslinear motorsMean flow Mean flow –– peristaltic and gear peristaltic and gear pumpspumps
ForceForceDisplacementDisplacementStressStressStrain Strain Radial distensionRadial distensionDynamic pressureDynamic pressureDynamic Mechanical Dynamic Mechanical Analysis Analysis –– viscoelastic viscoelastic propertiesproperties
Nutrient Flow Loop
Peristaltic pump (shown) for orthopaedic applications
0.1-280 ml/minup to 4 pump heads per drive
BioDynamic™ Testing PlatformNutrient Flow for Vascular Applications
45
Incubator Setup
ElectroForce®
Applications
Hydrogel Characterization
Research Need: Characterize a very soft hydrogel sample in compression to determine its dynamic mechanical properties
ElectroForce Application: Evaluate the sample stiffness and viscoelastic properties using an ElectroForce 3100, compression platens, and a gram-force load cell
Specimen: Polyvinyl alcohol hydrogel cylinder (3 x 3 mm)
Sample stiffness tests were conducted with:• forces in the mN range• very slow displacement rate (0.02 mm/s)
Dynamic Mechanical Analysis (DMA)
46
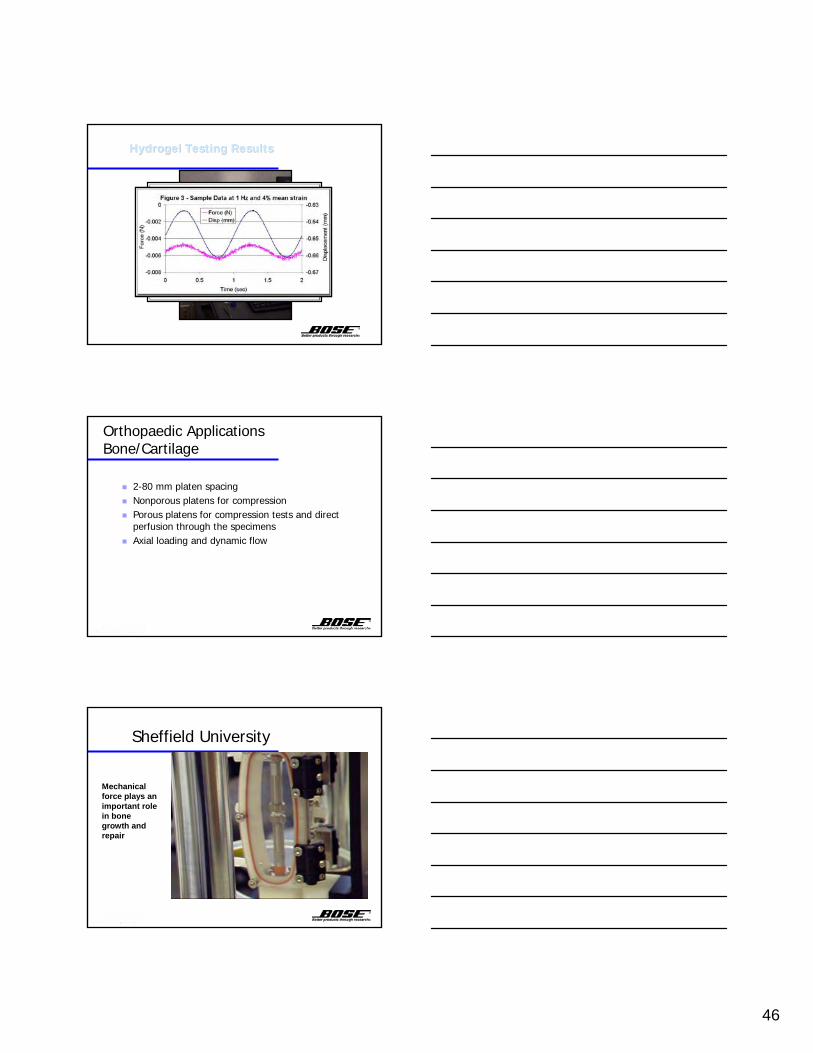
Hydrogel Testing ResultsHydrogel Testing Results
Orthopaedic ApplicationsBone/Cartilage
2-80 mm platen spacingNonporous platens for compressionPorous platens for compression tests and direct perfusion through the specimensAxial loading and dynamic flow
Sheffield University
Mechanical force plays an important role in bone growth and repair
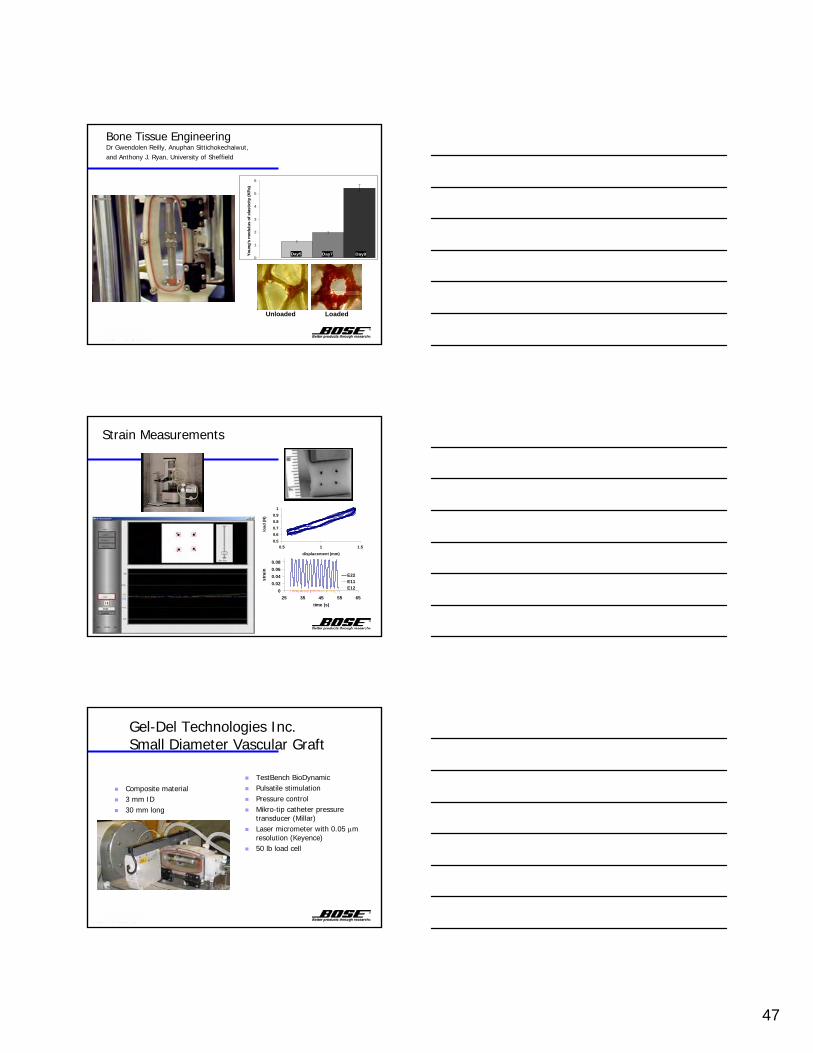
47
Bone Tissue EngineeringDr Gwendolen Reilly, Anuphan Sittichokechaiwut, and Anthony J. Ryan, University of Sheffield
Day5 Day7 Day90
1
2
3
4
5
6
Youn
g's
mod
ulus
of e
last
icity
(KPa
)
Unloaded Loaded
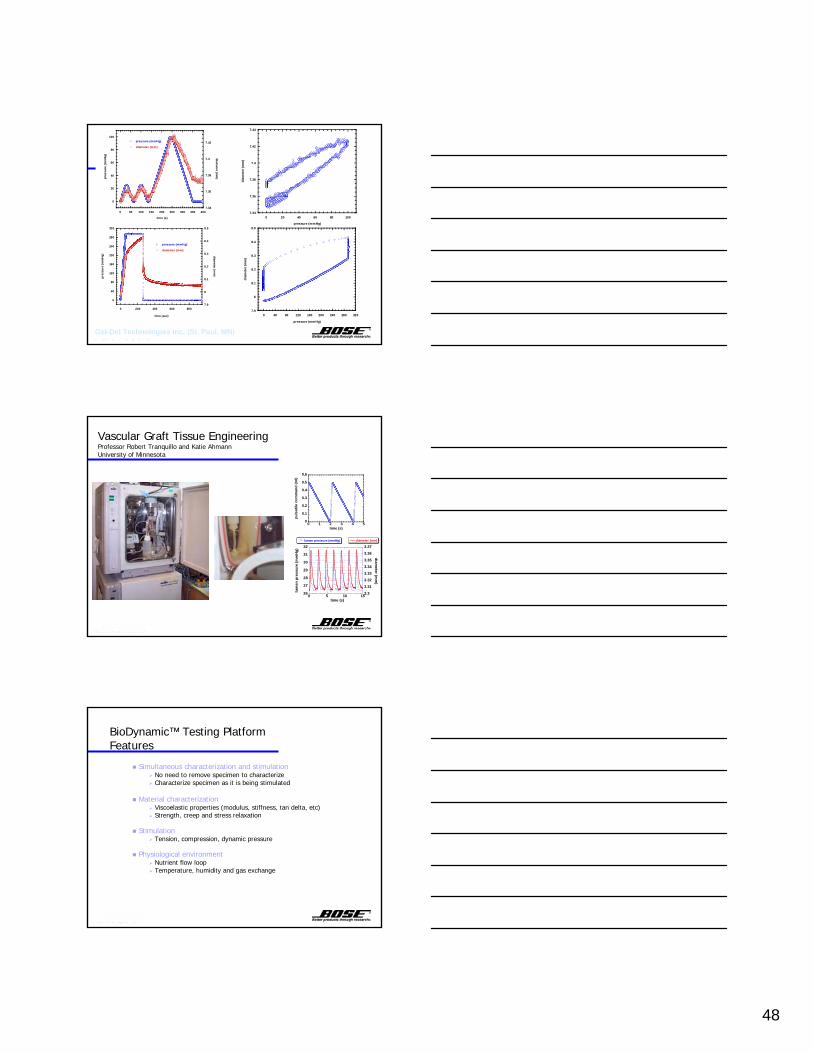
00.020.040.060.08
25 35 45 55 65time (s)
stra
in
E22E11E12
0.50.60.70.80.9
1
0.5 1 1.5displacement (mm)
load
(N)
Strain Measurements
Gel-Del Technologies Inc. Small Diameter Vascular Graft
TestBench BioDynamicPulsatile stimulationPressure controlMikro-tip catheter pressure transducer (Millar)Laser micrometer with 0.05 µm resolution (Keyence) 50 lb load cell
Composite material3 mm ID30 mm long
48
0
20
40
60
80
100
7.34
7.36
7.38
7.4
7.42
0 50 100 150 200 250 300 350 400
pressure (mmHg)
diameter (mm)
pres
sure
(mm
Hg) diam
eter (mm
)
time (s)
0
40
80
120
160
200
240
280
320
7.9
8
8.1
8.2
8.3
8.4
8.5
0 200 400 600 800
pressure (mmHg)
diameter (mm)
pres
sure
(mm
Hg) diam
eter (mm
)
time (sec)7.9
8
8.1
8.2
8.3
8.4
8.5
0 40 80 120 160 200 240 280 320
diam
eter
(mm
)
pressure (mmHg)
7.34
7.36
7.38
7.4
7.42
7.44
0 20 40 60 80 100
diam
eter
(mm
)
pressure (mmHg)
Gel-Del Technologies Inc. (St. Paul, MN)
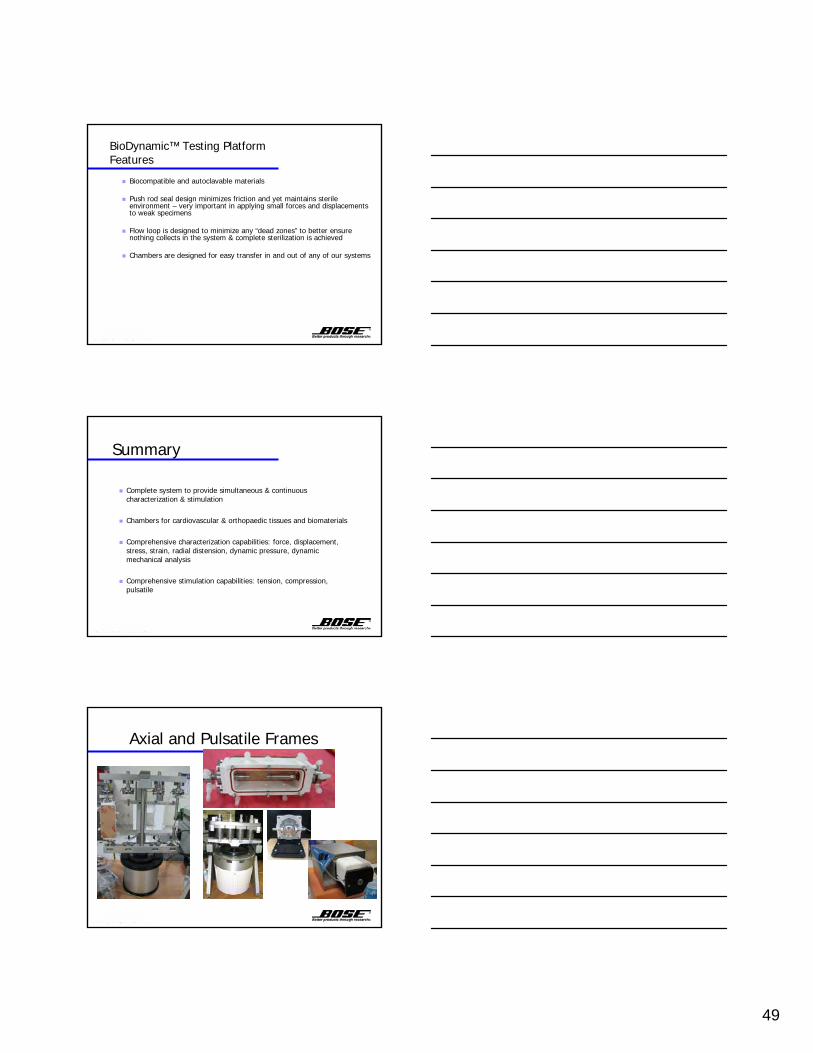
Vascular Graft Tissue Engineering Professor Robert Tranquillo and Katie Ahmann University of Minnesota
0
0.1
0.2
0.3
0.4
0.5
0.6
0 1 2 3 4 5
puls
atile
com
man
d (m
l)
time (s)
26
27
28
29
30
31
32
3.3
3.31
3.32
3.33
3.34
3.35
3.36
3.37
0 5 10 15
lumen pressure (mmHg) diameter (mm)
lum
en p
ress
ure
(mm
Hg)
diameter (m
m)
time (s)
Simultaneous characterization and stimulationNo need to remove specimen to characterizeCharacterize specimen as it is being stimulated
Material characterizationViscoelastic properties (modulus, stiffness, tan delta, etc)Strength, creep and stress relaxation
StimulationTension, compression, dynamic pressure
Physiological environmentNutrient flow loop Temperature, humidity and gas exchange
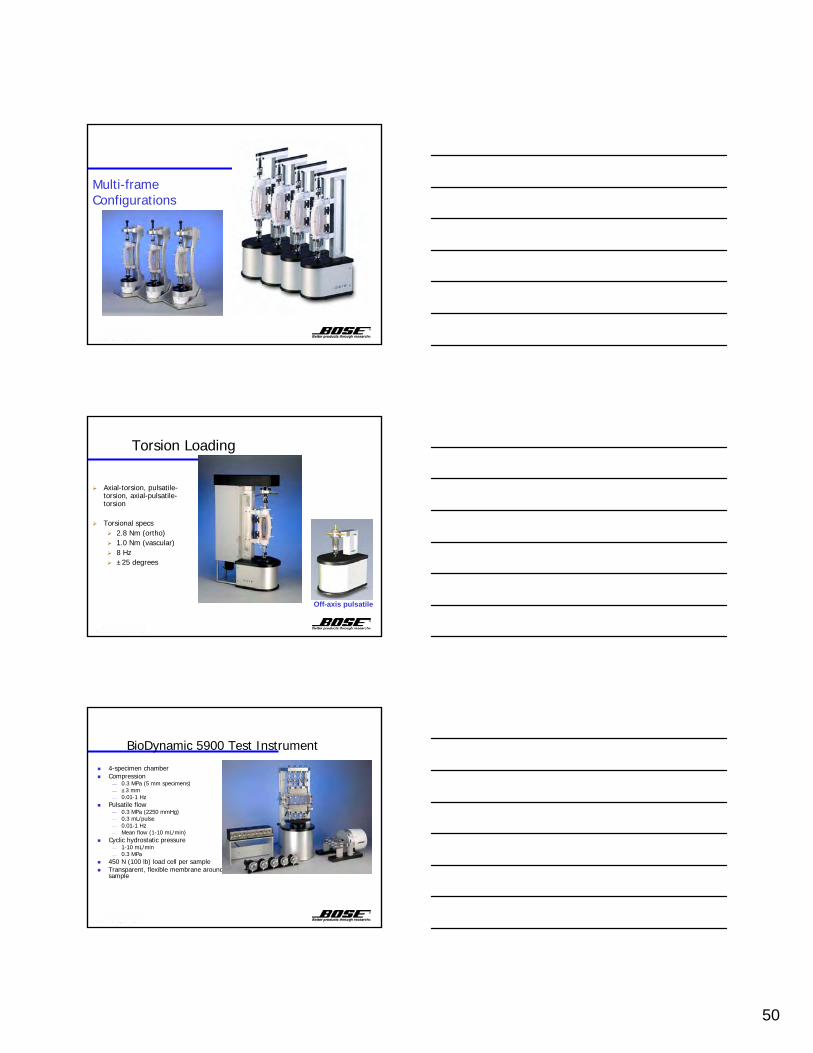
BioDynamic™ Testing PlatformFeatures
49
Biocompatible and autoclavable materials
Push rod seal design minimizes friction and yet maintains sterile environment – very important in applying small forces and displacements to weak specimens
Flow loop is designed to minimize any “dead zones” to better ensure nothing collects in the system & complete sterilization is achieved
Chambers are designed for easy transfer in and out of any of our systems
BioDynamic™ Testing PlatformFeatures
Summary
Complete system to provide simultaneous & continuous characterization & stimulation
Chambers for cardiovascular & orthopaedic tissues and biomaterials
Comprehensive characterization capabilities: force, displacement, stress, strain, radial distension, dynamic pressure, dynamic mechanical analysis
Comprehensive stimulation capabilities: tension, compression, pulsatile
Axial and Pulsatile Frames
50
Multi-frame Configurations
Torsion Loading
Axial-torsion, pulsatile-torsion, axial-pulsatile-torsion
Torsional specs2.8 Nm (ortho)1.0 Nm (vascular)8 Hz±25 degrees
Off-axis pulsatile
BioDynamic 5900 Test Instrument
4-specimen chamberCompression⎯ 0.3 MPa (5 mm specimens)⎯ ±3 mm⎯ 0.01-1 Hz
Pulsatile flow⎯ 0.3 MPa (2250 mmHg)⎯ 0.3 mL/pulse⎯ 0.01-1 Hz⎯ Mean flow (1-10 mL/min)
Cyclic hydrostatic pressure⎯ 1-10 mL/min⎯ 0.3 MPa
450 N (100 lb) load cell per sampleTransparent, flexible membrane around each sample

51
BD-5900
Bone Research
Bone Tissue ResearchMicrotesting
52
Bone Tissue ResearchMicrotesting
1 mm
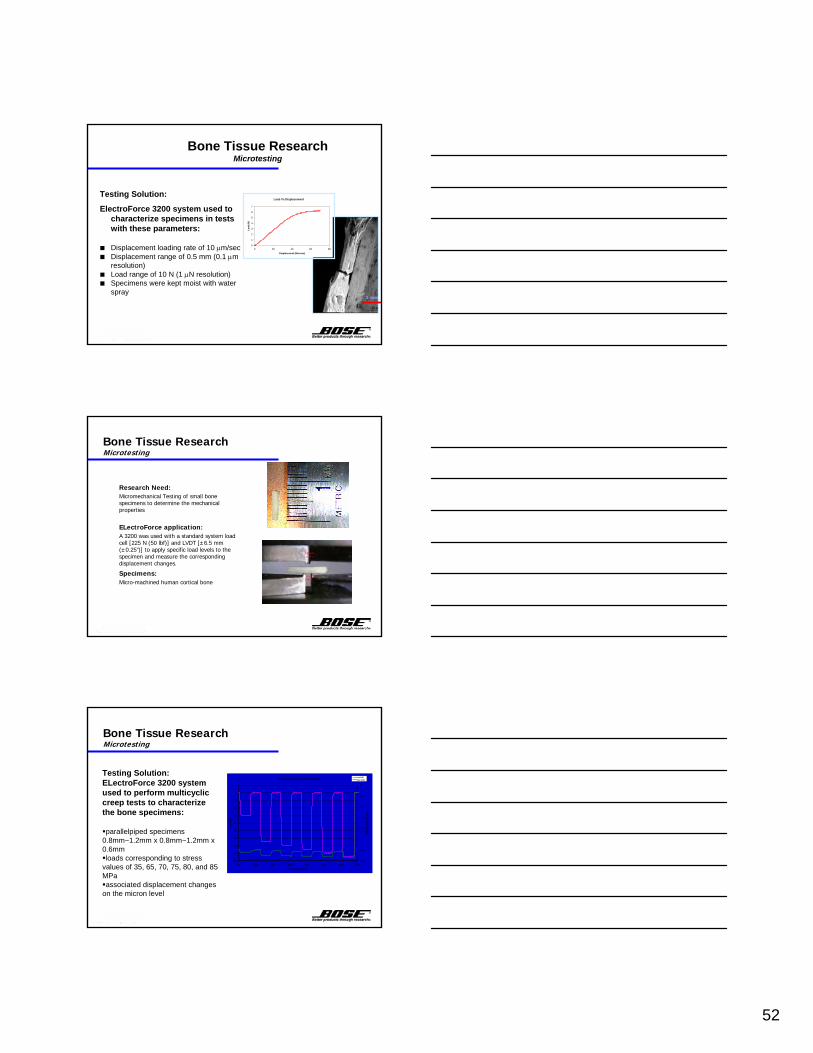
Testing Solution:
ElectroForce 3200 system used to characterize specimens in tests with these parameters:
Displacement loading rate of 10 µm/secDisplacement range of 0.5 mm (0.1 µm resolution) Load range of 10 N (1 µN resolution)Specimens were kept moist with water spray
Load Vs Displacement
0
1
2
3
4
5
6
7
0 20 40 60 80
Displacement (Microns)
Load
(N)
Bone Tissue ResearchMicrotesting
Research Need:Micromechanical Testing of small bone specimens to determine the mechanical properties
ELectroForce application:A 3200 was used with a standard system load cell [225 N (50 lbf)] and LVDT [±6.5 mm (±0.25”)] to apply specific load levels to the specimen and measure the corresponding displacement changes.
Specimens:Micro-machined human cortical bone
Bone Tissue ResearchMicrotesting
Cyclic Creep of Cortical Bone
-45
-40
-35
-30
-25
-20
-15
-10
-5
0
5
0 100 200 300 400 500 600 700Time (seconds)
Load
(N)
-1.4
-1.2
-1
-0.8
-0.6
-0.4
-0.2
0
Dis
plac
emen
t (m
m)
Load (N) Disp (mm)
Testing Solution: ELectroForce 3200 system used to perform multicycliccreep tests to characterize the bone specimens:
parallelpiped specimens 0.8mm~1.2mm x 0.8mm~1.2mm x 0.6mmloads corresponding to stress
values of 35, 65, 70, 75, 80, and 85 MPaassociated displacement changes
on the micron level
53
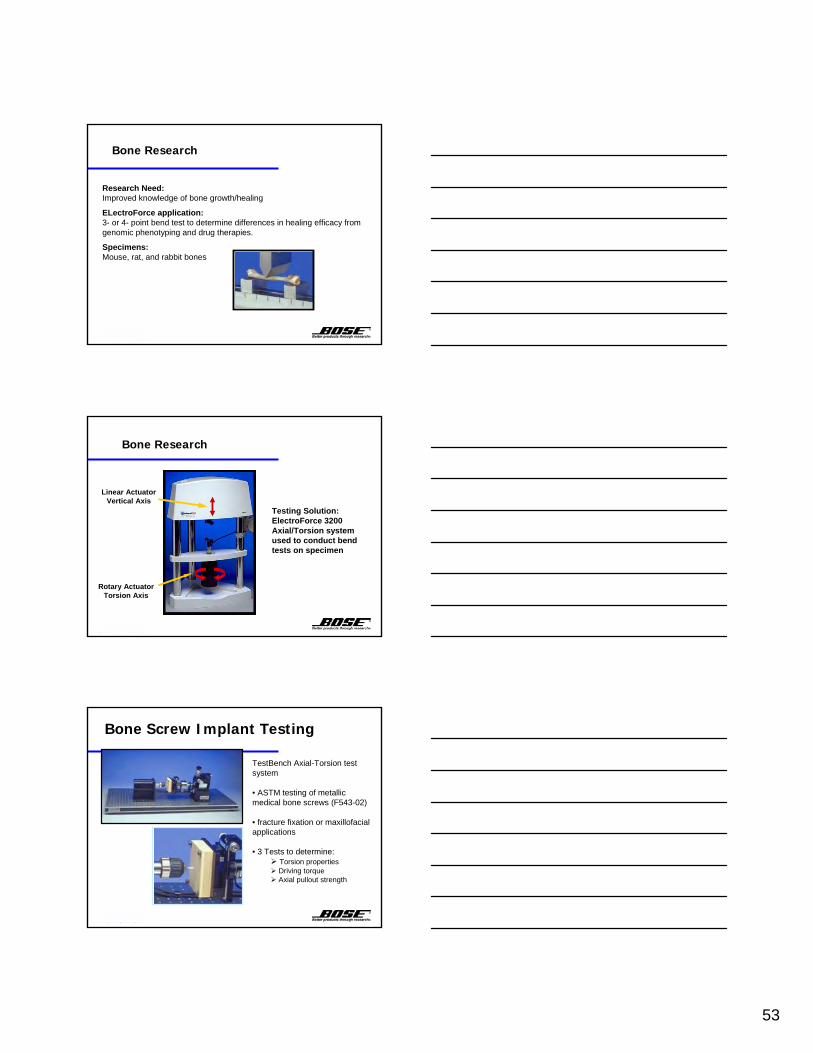
Research Need: Improved knowledge of bone growth/healing
ELectroForce application: 3- or 4- point bend test to determine differences in healing efficacy from genomic phenotyping and drug therapies.
Specimens: Mouse, rat, and rabbit bones
Bone Research
Rotary Actuator Torsion Axis
Bone Research
Linear ActuatorVertical Axis
Testing Solution: ElectroForce 3200 Axial/Torsion system used to conduct bend tests on specimen
TestBench Axial-Torsion test system
• ASTM testing of metallic medical bone screws (F543-02)
• fracture fixation or maxillofacial applications
• 3 Tests to determine:Torsion propertiesDriving torqueAxial pullout strength
Bone Screw Implant Testing
54
Spinal Devices
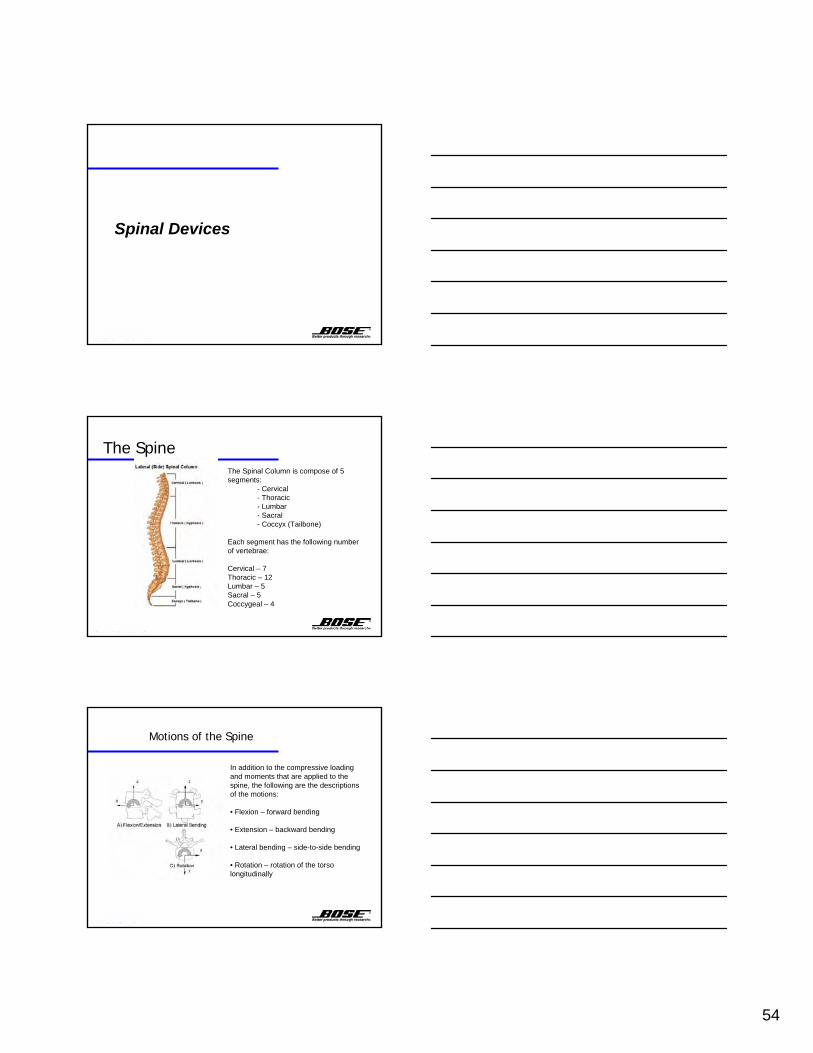
The SpineThe Spinal Column is compose of 5 segments:
- Cervical- Thoracic- Lumbar- Sacral- Coccyx (Tailbone)
Each segment has the following number of vertebrae:
Cervical – 7Thoracic – 12Lumbar – 5Sacral – 5Coccygeal – 4
Motions of the Spine
In addition to the compressive loading and moments that are applied to the spine, the following are the descriptions of the motions:
• Flexion – forward bending
• Extension – backward bending
• Lateral bending – side-to-side bending
• Rotation – rotation of the torso longitudinally
55
Spine
Standard and Customized equipment for standardized tests
Customer supplied gripping/fixtures/bathsAxial, bi-axial (axial-torsion), multi-axial system configurationsStatic and dynamic testing protocol
The purpose of many of these devices is to alleviate or manage pain and preserve motion.
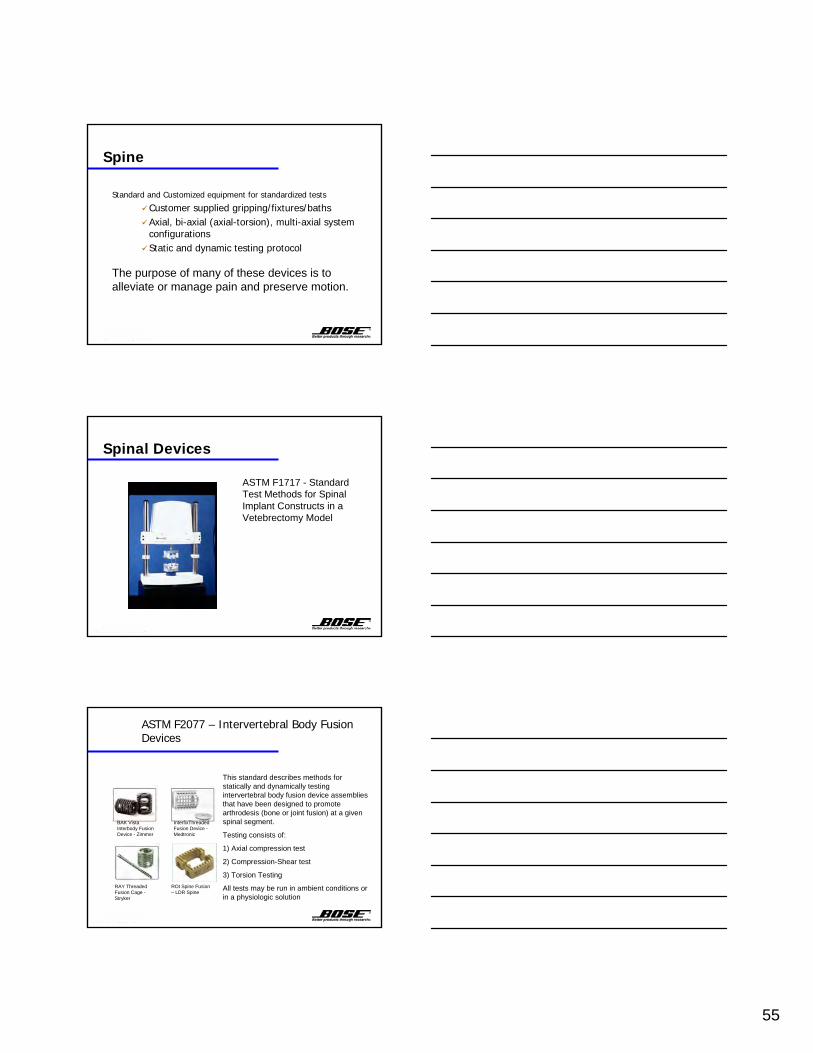
Spinal Devices
ASTM F1717 - Standard Test Methods for Spinal Implant Constructs in a Vetebrectomy Model
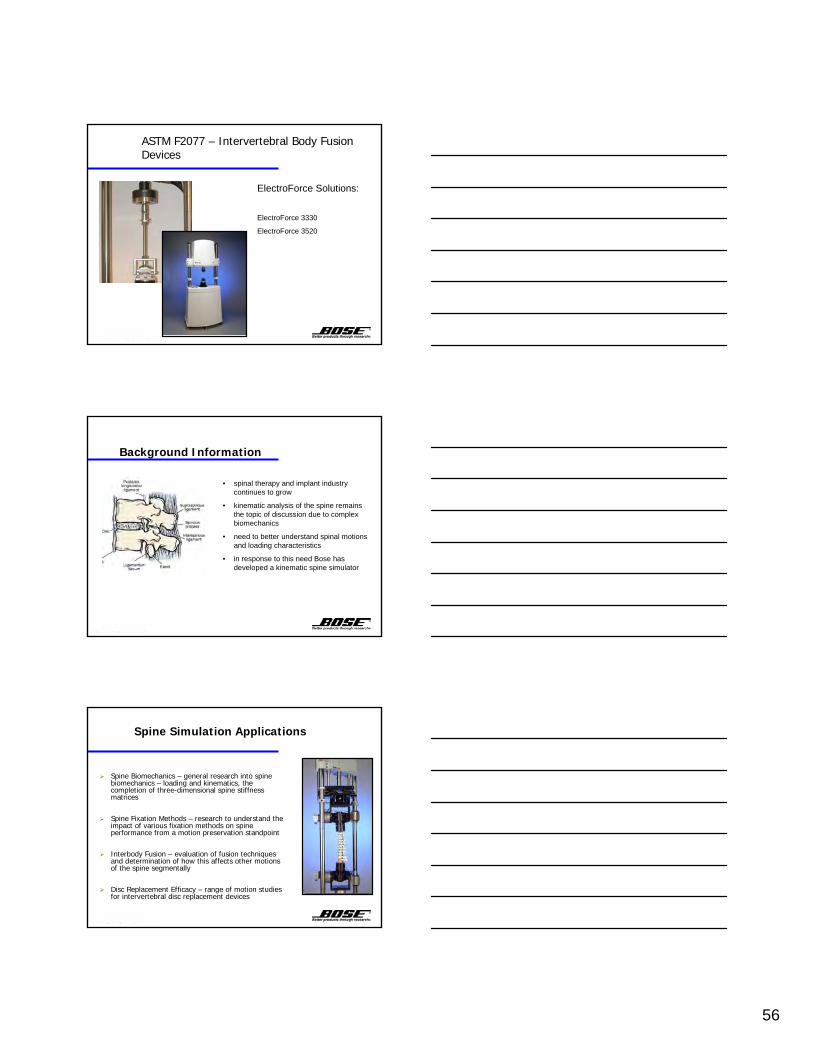
ASTM F2077 – Intervertebral Body Fusion Devices
BAK Vista Interbody Fusion Device - Zimmer
RAY Threaded Fusion Cage -Stryker
ROI Spine Fusion – LDR Spine
InterfixThreadedFusion Device -Medtronic
This standard describes methods for statically and dynamically testing intervertebral body fusion device assemblies that have been designed to promote arthrodesis (bone or joint fusion) at a given spinal segment.
Testing consists of:
1) Axial compression test
2) Compression-Shear test
3) Torsion Testing
All tests may be run in ambient conditions or in a physiologic solution
56
ElectroForce Solutions:
ElectroForce 3330
ElectroForce 3520
ASTM F2077 – Intervertebral Body Fusion Devices
Background Information
• spinal therapy and implant industry continues to grow
• kinematic analysis of the spine remains the topic of discussion due to complex biomechanics
• need to better understand spinal motions and loading characteristics
• in response to this need Bose has developed a kinematic spine simulator
Spine Simulation Applications
Spine Biomechanics – general research into spine biomechanics – loading and kinematics, the completion of three-dimensional spine stiffness matrices
Spine Fixation Methods – research to understand the impact of various fixation methods on spine performance from a motion preservation standpoint
Interbody Fusion – evaluation of fusion techniques and determination of how this affects other motions of the spine segmentally
Disc Replacement Efficacy – range of motion studies for intervertebral disc replacement devices
57
Spine Simulator Description
Base platform for the spine simulator is a servopneumatic axial-torsion materials test system
Combination of additional electric motors provide overturning moments and translations
Total of up to nine actuators provide axial compression and rotation, flexion-extension, lateral bending, and anterior-posterior and left-right translations
Each axis is independently controlled in either displacement/rotation or force/torque control
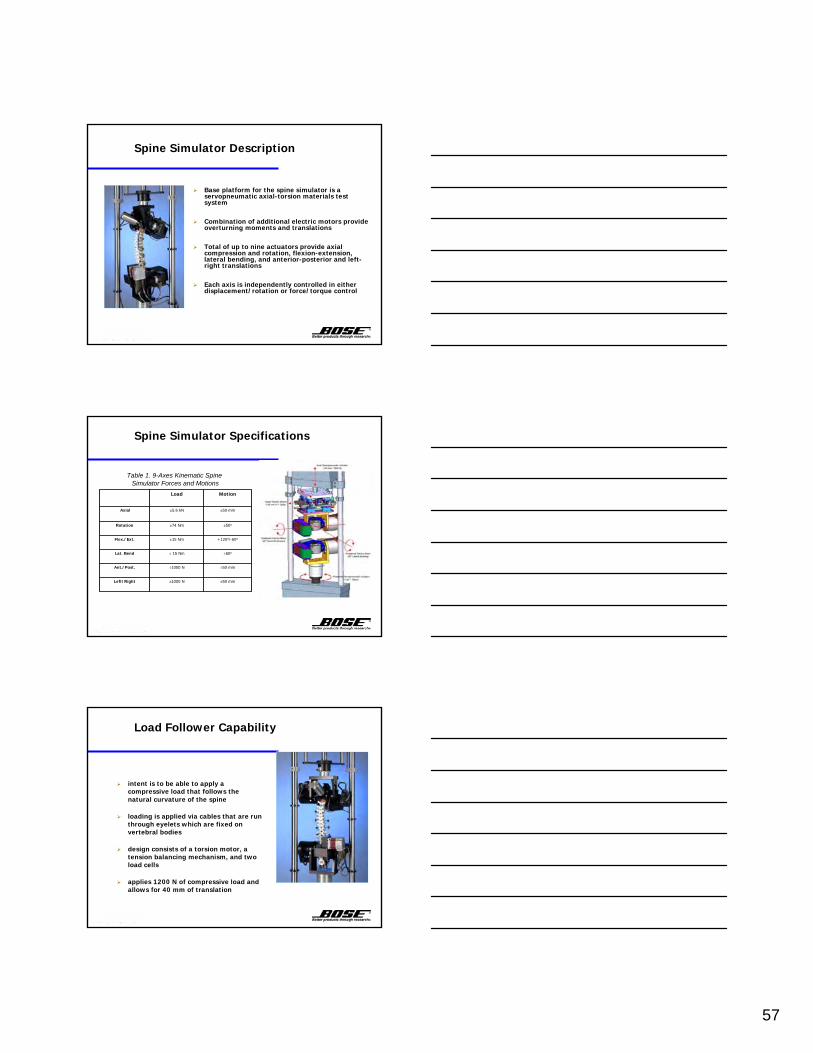
Spine Simulator Specifications
Table 1. 9-Axes Kinematic Spine Simulator Forces and Motions
±50 mm±1000 NLeft/Right
±50 mm±1000 NAnt./Post.
±60o± 15 NmLat. Bend
+120o/-60o±15 NmFlex./Ext.
±50o±74 NmRotation
±50 mm±5.6 kNAxial
MotionLoad
intent is to be able to apply a compressive load that follows the natural curvature of the spine
loading is applied via cables that are run through eyelets which are fixed on vertebral bodies
design consists of a torsion motor, a tension balancing mechanism, and two load cells
applies 1200 N of compressive load and allows for 40 mm of translation
Load Follower Capability
58
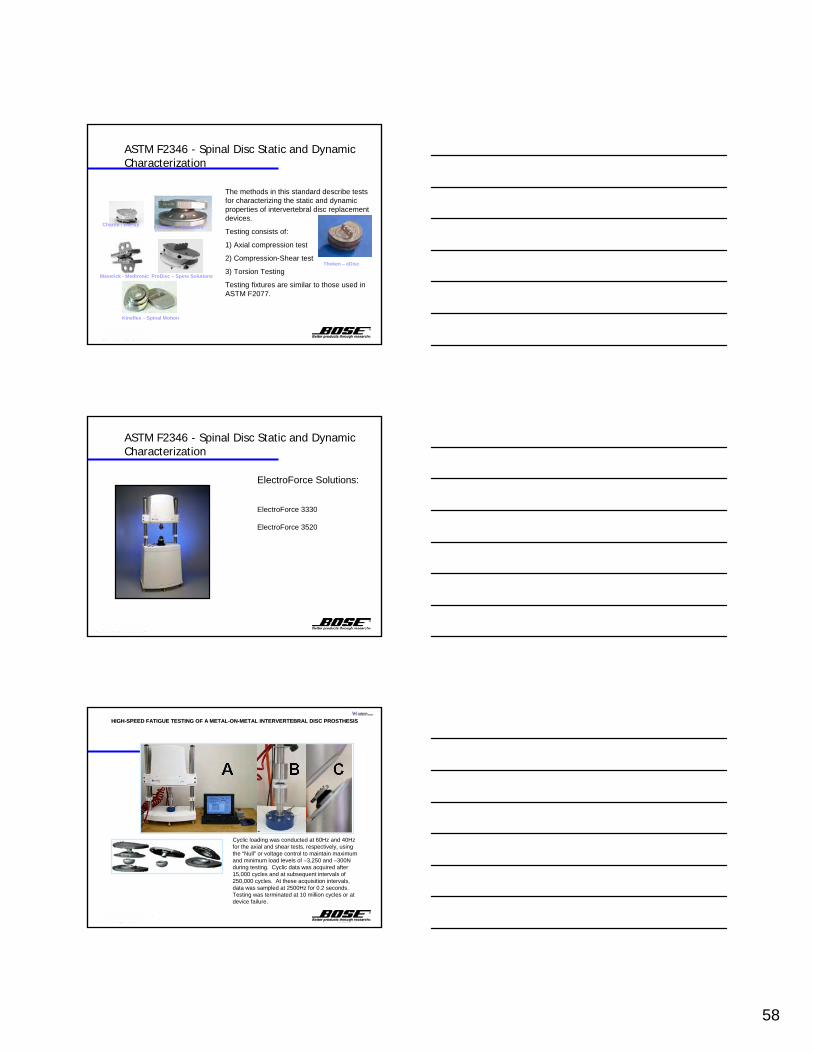
ASTM F2346 - Spinal Disc Static and Dynamic Characterization
The methods in this standard describe tests for characterizing the static and dynamic properties of intervertebral disc replacement devices.
Testing consists of:
1) Axial compression test
2) Compression-Shear test
3) Torsion Testing
Testing fixtures are similar to those used in ASTM F2077.
Charite - DePuy Flexicore - Spinecore
ProDisc – Spine SolutionsMaverick - Medtronic
Kineflex – Spinal Motion
Theken – eDisc
ElectroForce Solutions:
ElectroForce 3330
ElectroForce 3520
ASTM F2346 - Spinal Disc Static and Dynamic Characterization
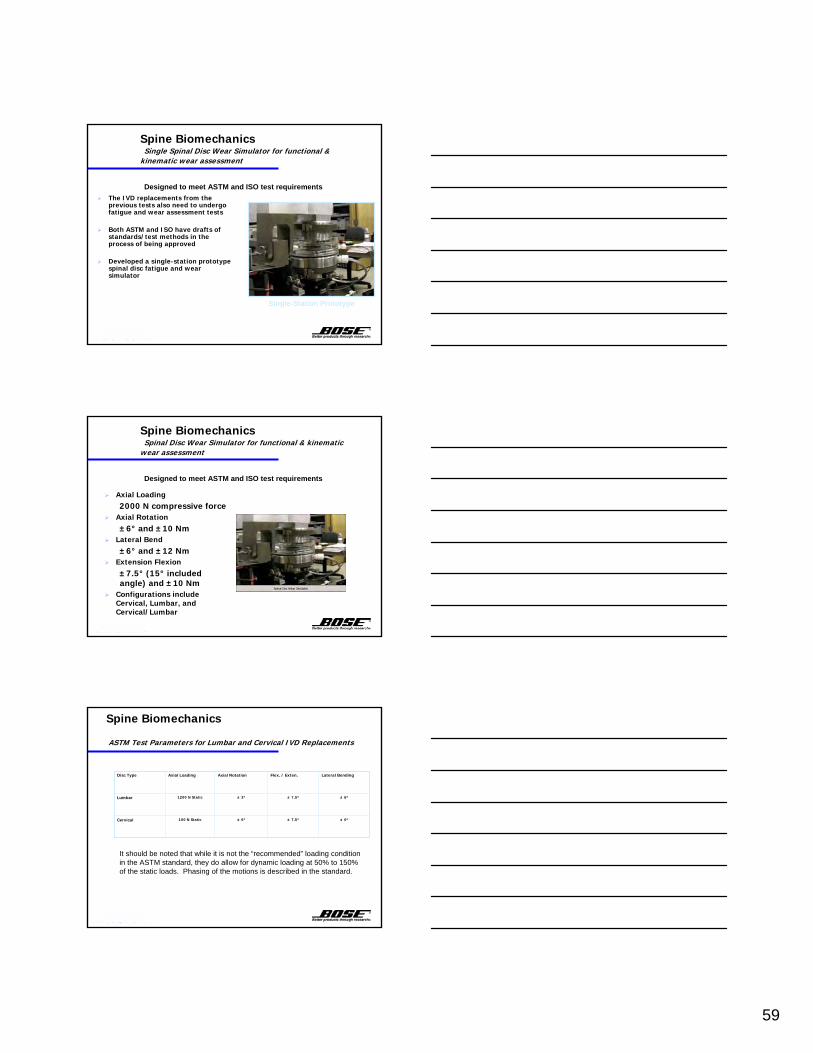
HIGHHIGH--SPEED FATIGUE TESTING OF A METALSPEED FATIGUE TESTING OF A METAL--ONON--METAL INTERVERTEBRAL DISC PROSTHESISMETAL INTERVERTEBRAL DISC PROSTHESIS
LL--5252--0160.10160.1--AA
Cyclic loading was conducted at 60Hz and 40Hz for the axial and shear tests, respectively, using the “Null” or voltage control to maintain maximum and minimum load levels of –3,250 and –300N during testing. Cyclic data was acquired after 15,000 cycles and at subsequent intervals of 250,000 cycles. At these acquisition intervals, data was sampled at 2500Hz for 0.2 seconds. Testing was terminated at 10 million cycles or at device failure.
59
Spine BiomechanicsSingle Spinal Disc Wear Simulator for functional &
kinematic wear assessment
The IVD replacements from the previous tests also need to undergo fatigue and wear assessment tests
Both ASTM and ISO have drafts of standards/test methods in the process of being approved
Developed a single-station prototype spinal disc fatigue and wear simulator
Designed to meet ASTM and ISO test requirements
Single-Station Prototype
Spine BiomechanicsSpinal Disc Wear Simulator for functional & kinematic
wear assessment
Axial Loading2000 N compressive force
Axial Rotation±6° and ±10 Nm
Lateral Bend±6° and ±12 Nm
Extension Flexion±7.5° (15° included angle) and ±10 Nm
Configurations include Cervical, Lumbar, and Cervical/Lumbar
Designed to meet ASTM and ISO test requirements
Spine Biomechanics
ASTM Test Parameters for Lumbar and Cervical IVD Replacements
± 6o± 7.5o± 6o100 N StaticCervical
± 6o± 7.5o± 3o1200 N StaticLumbar
Lateral BendingFlex. / Exten.Axial RotationAxial LoadingDisc Type
It should be noted that while it is not the “recommended” loading condition in the ASTM standard, they do allow for dynamic loading at 50% to 150% of the static loads. Phasing of the motions is described in the standard.
60
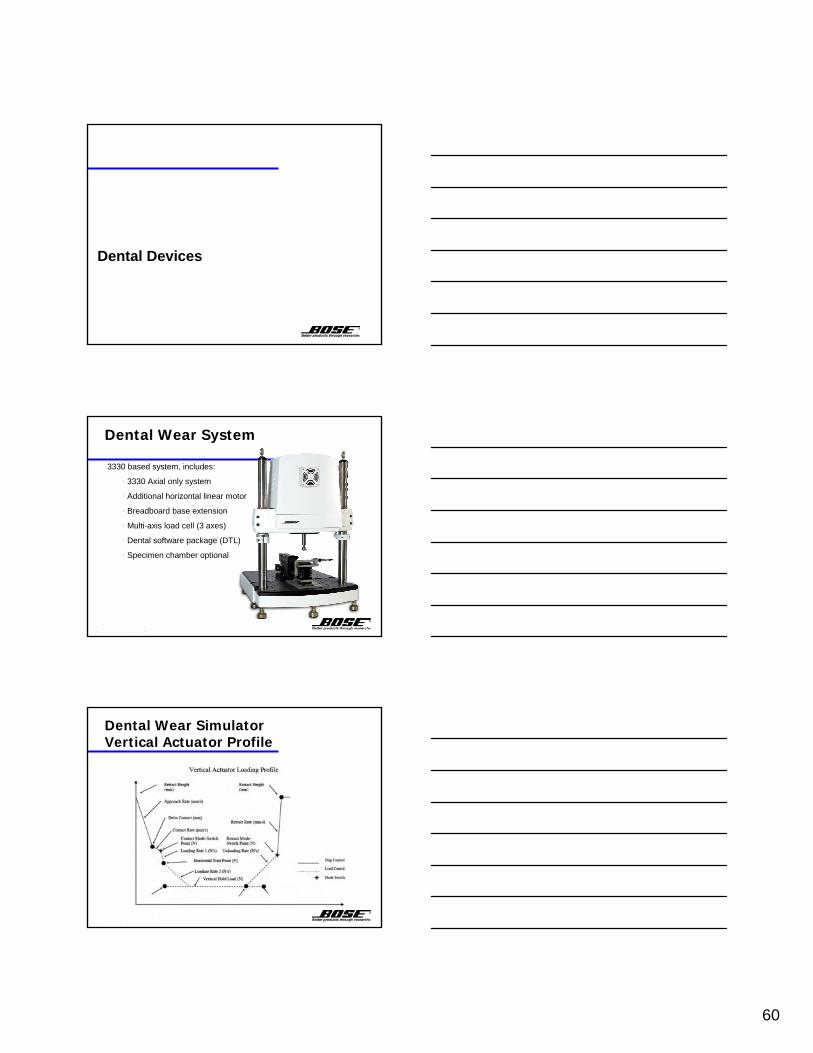
Dental Devices
Dental Wear System
3330 based system, includes:
• 3330 Axial only system
• Additional horizontal linear motor
• Breadboard base extension
• Multi-axis load cell (3 axes)
• Dental software package (DTL)
• Specimen chamber optional
Dental Wear Simulator Vertical Actuator Profile
61
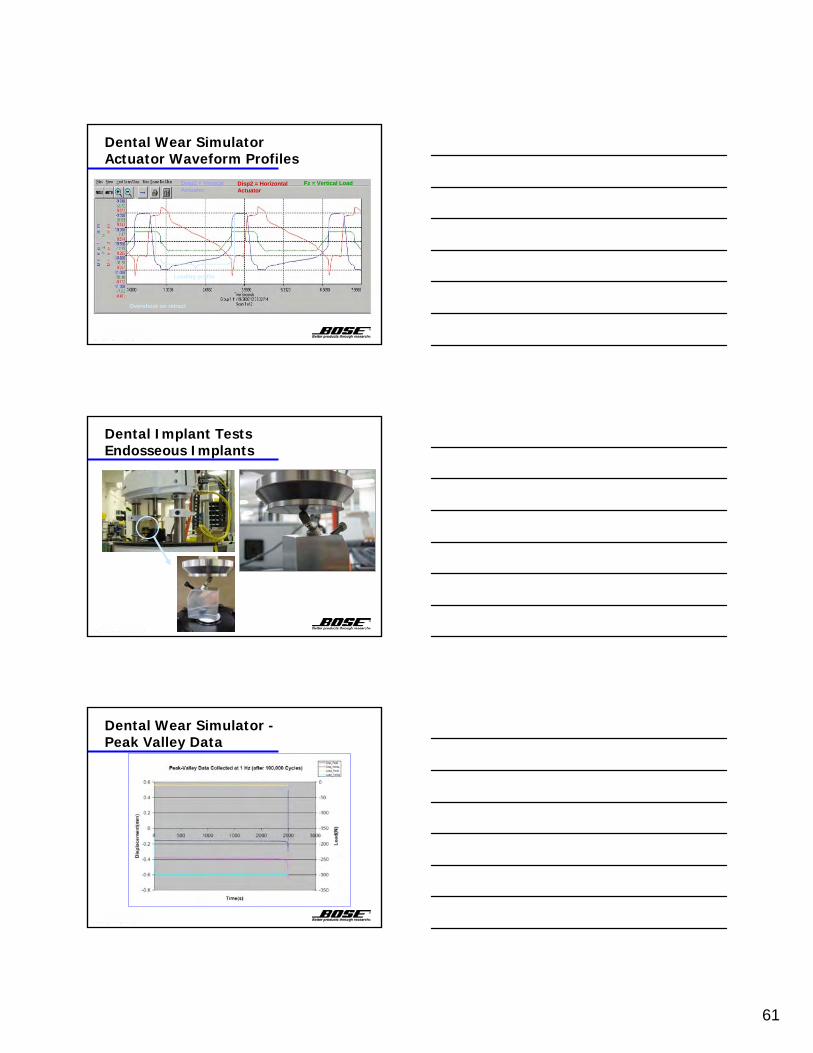
Dental Wear Simulator Actuator Waveform Profiles
Overshoot on retract
Loading profile
Disp1 = Vertical Actuator
Disp2 = Horizontal Actuator
Fz = Vertical Load
Dental Implant Tests Endosseous Implants
Dental Wear Simulator -Peak Valley Data

62
Dental Biomaterials TestsFatigue Crack Growth and Bending (Dentin, Composite, and the interface) –using the ElectroForce 3200. Both quasi-static and fatigue testing.
Stent – Graft Testing
What is a Stent ?
Stents are used in many other parts of the vascular system to hold veins
and arteries open.
A Stent is a scaffold. Often laser cut from a metal tube, it is used to open up partially blocked blood vessels such as the coronary arteries.
63
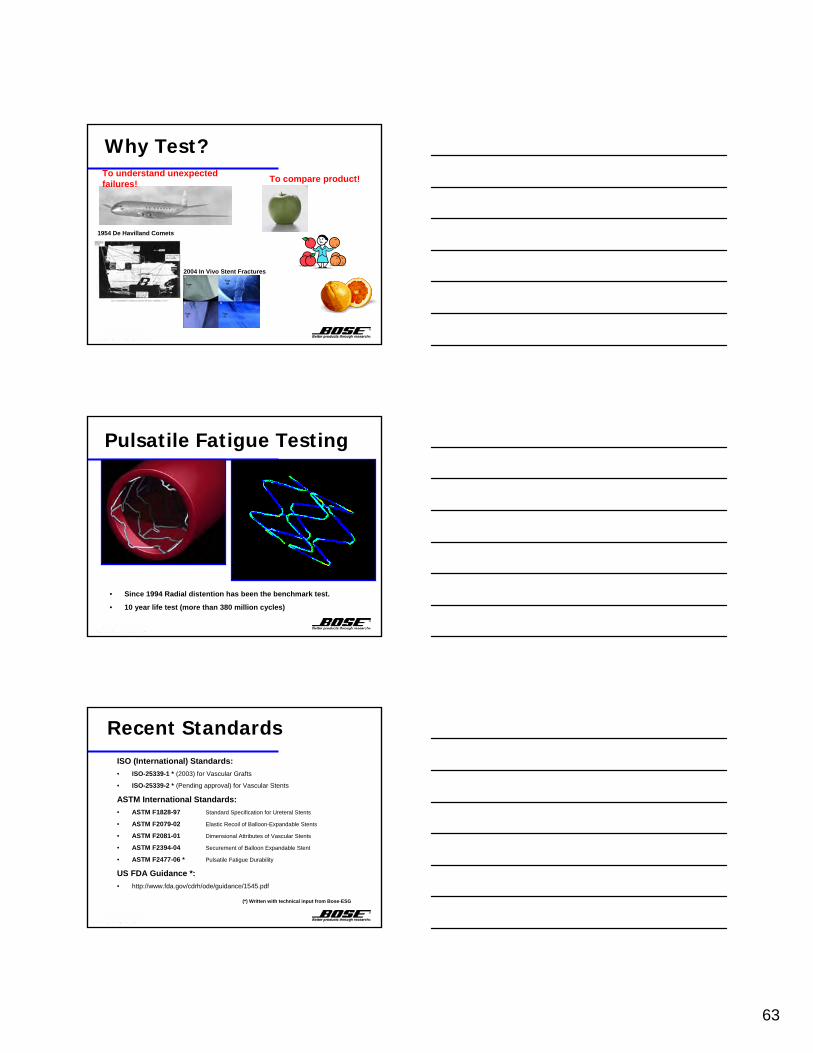
Why Test?
1954 De Havilland Comets
2004 In Vivo Stent Fractures
To understand unexpected failures! To compare product!
Pulsatile Fatigue Testing
• Since 1994 Radial distention has been the benchmark test.
• 10 year life test (more than 380 million cycles)
Recent StandardsISO (International) Standards:• ISO-25339-1 * (2003) for Vascular Grafts
• ISO-25339-2 * (Pending approval) for Vascular Stents
ASTM International Standards:• ASTM F1828-97 Standard Specification for Ureteral Stents
• ASTM F2079-02 Elastic Recoil of Balloon-Expandable Stents
• ASTM F2081-01 Dimensional Attributes of Vascular Stents
• ASTM F2394-04 Securement of Balloon Expandable Stent
• ASTM F2477-06 * Pulsatile Fatigue Durability
US FDA Guidance *:• http://www.fda.gov/cdrh/ode/guidance/1545.pdf
(*) Written with technical input from Bose-ESG
64
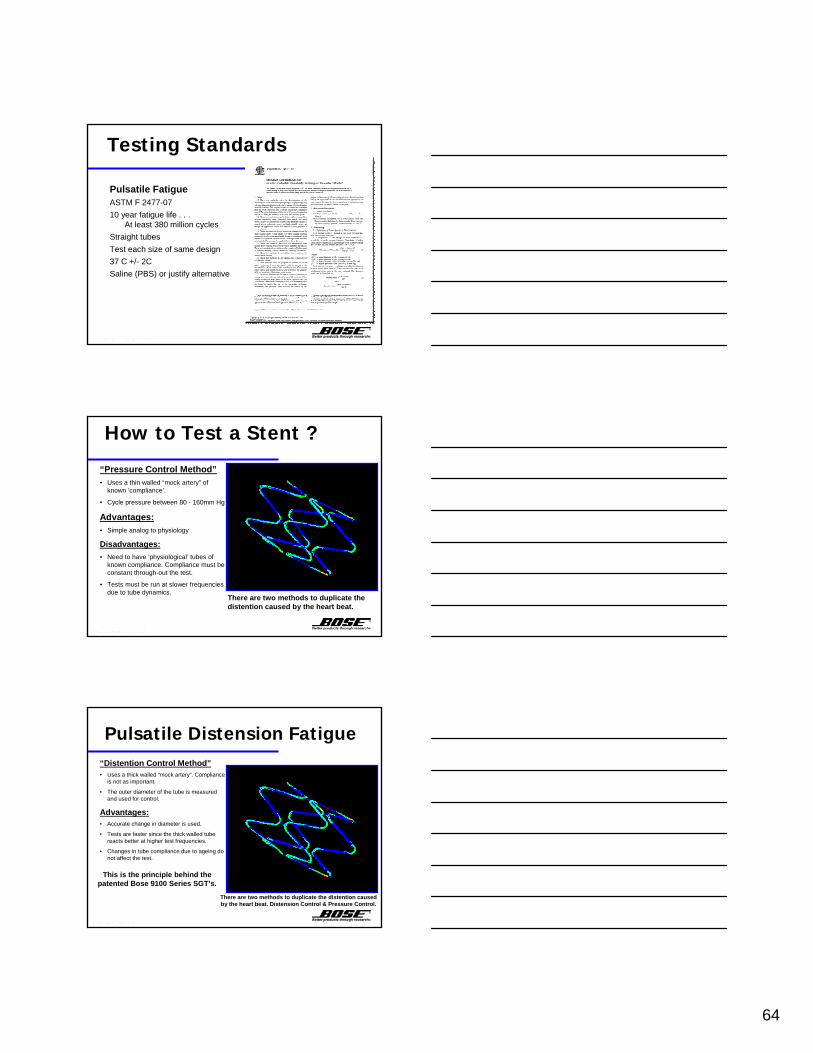
Testing Standards
Pulsatile FatigueASTM F 2477-0710 year fatigue life . . .
At least 380 million cyclesStraight tubesTest each size of same design37 C +/- 2CSaline (PBS) or justify alternative
How to Test a Stent ?
“Pressure Control Method”• Uses a thin walled “mock artery” of
known ‘compliance’.
• Cycle pressure between 80 - 160mm Hg
Advantages:• Simple analog to physiology
Disadvantages:• Need to have ‘physiological’ tubes of
known compliance. Compliance must be constant through-out the test.
• Tests must be run at slower frequencies due to tube dynamics.
There are two methods to duplicate the distention caused by the heart beat.
Pulsatile Distension Fatigue“Distention Control Method”• Uses a thick walled “mock artery”. Compliance
is not as important.
• The outer diameter of the tube is measured and used for control.
Advantages:• Accurate change in diameter is used.
• Tests are faster since the thick walled tube reacts better at higher test frequencies.
• Changes in tube compliance due to ageing do not affect the test.
There are two methods to duplicate the distention caused by the heart beat. Distension Control & Pressure Control.
This is the principle behind the patented Bose 9100 Series SGT’s.
65
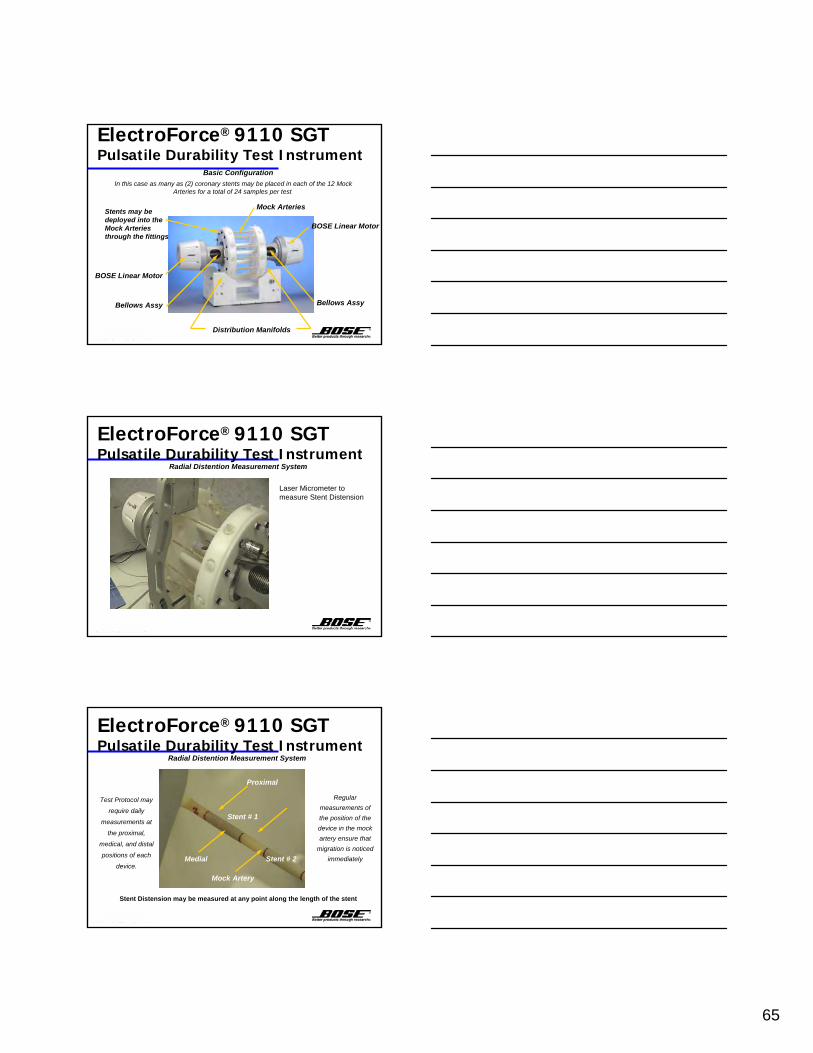
ElectroForce® 9110 SGTPulsatile Durability Test Instrument
Basic Configuration
BOSE Linear Motor
BOSE Linear Motor
Distribution Manifolds
Mock Arteries
Bellows Assy Bellows Assy
Stents may be deployed into the Mock Arteries through the fittings
In this case as many as (2) coronary stents may be placed in each of the 12 Mock Arteries for a total of 24 samples per test.
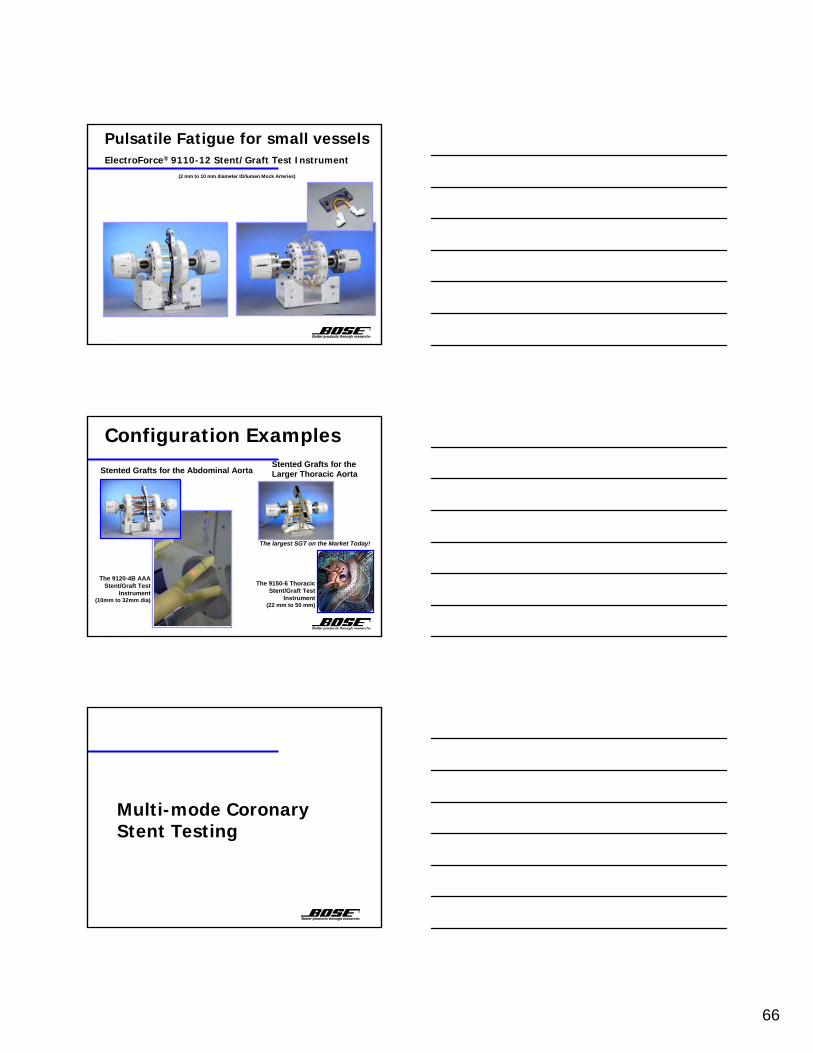
ElectroForce® 9110 SGTPulsatile Durability Test Instrument
Laser Micrometer to measure Stent Distension
Radial Distention Measurement System
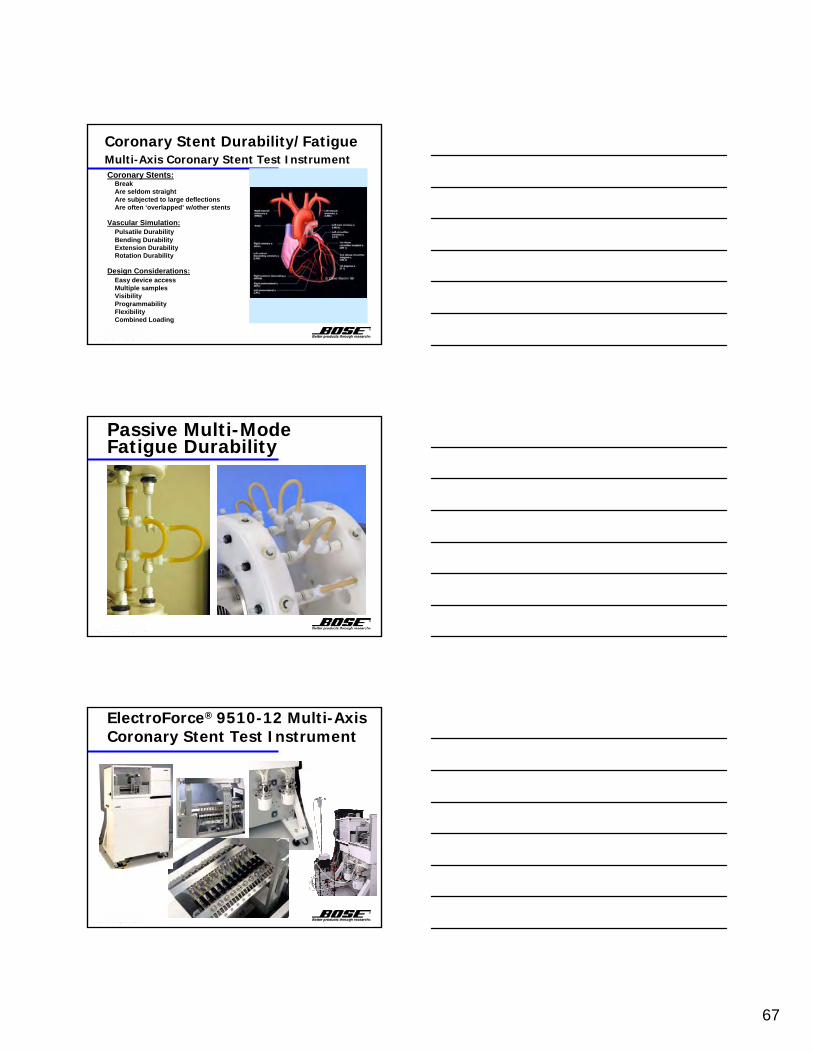
ElectroForce® 9110 SGTPulsatile Durability Test Instrument
Stent Distension may be measured at any point along the length of the stent
Test Protocol may
require daily
measurements at
the proximal,
medical, and distal
positions of each
device.
Regular measurements of the position of the device in the mock artery ensure that
migration is noticed immediately
Distal
Proximal
Medial
Mock Artery
Stent # 1
Stent # 2
Radial Distention Measurement System
66
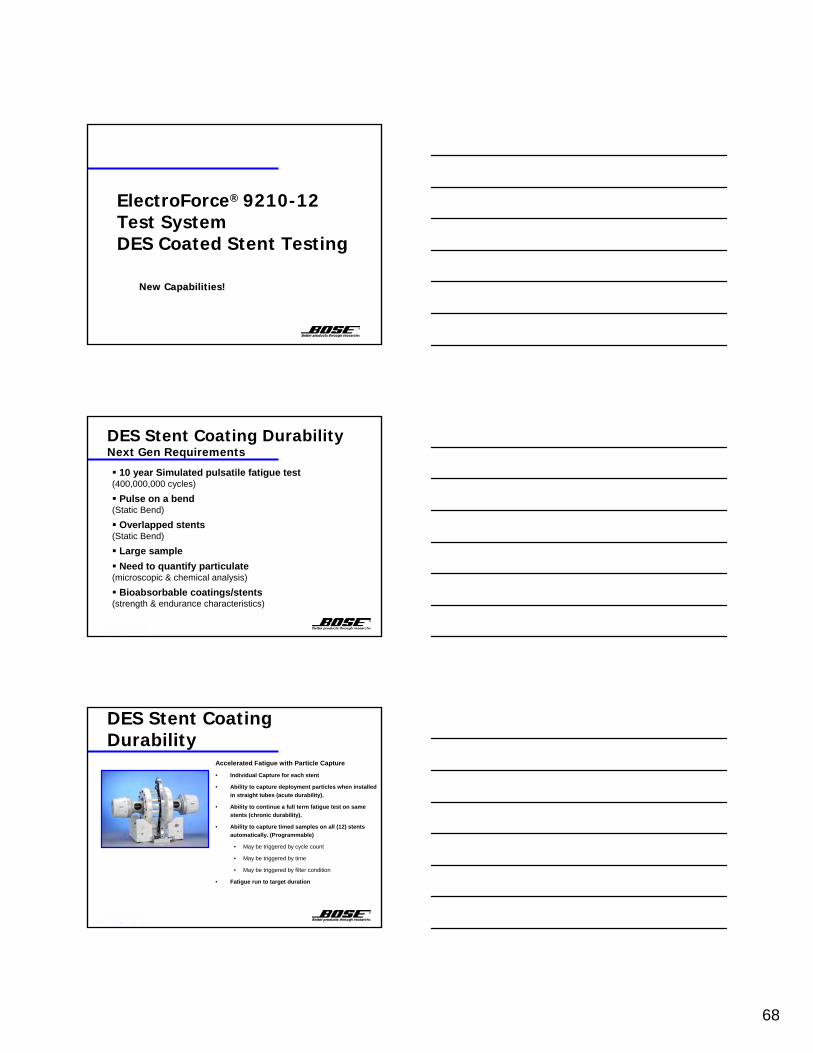
(2 mm to 10 mm diameter ID/lumen Mock Arteries)
Pulsatile Fatigue for small vesselsElectroForce® 9110-12 Stent/Graft Test Instrument
Configuration ExamplesStented Grafts for the Abdominal Aorta
The 9120-4B AAA Stent/Graft Test
Instrument(10mm to 32mm dia)
Stented Grafts for the Larger Thoracic Aorta
The largest SGT on the Market Today!
The 9150-6 Thoracic Stent/Graft Test
Instrument (22 mm to 50 mm)
Multi-mode CoronaryStent Testing
67
Coronary Stents:BreakAre seldom straightAre subjected to large deflectionsAre often ‘overlapped’ w/other stents
Vascular Simulation:Pulsatile DurabilityBending DurabilityExtension DurabilityRotation Durability
Design Considerations:Easy device accessMultiple samplesVisibilityProgrammabilityFlexibilityCombined Loading
Coronary Stent Durability/FatigueMulti-Axis Coronary Stent Test Instrument
Passive Multi-ModeFatigue Durability
ElectroForce® 9510-12 Multi-Axis Coronary Stent Test Instrument
68
ElectroForce® 9210-12Test SystemDES Coated Stent Testing
New Capabilities!New Capabilities!
DES Stent Coating Durability Next Gen Requirements
10 year Simulated pulsatile fatigue test (400,000,000 cycles)
Pulse on a bend (Static Bend)
Overlapped stents(Static Bend)
Large sampleNeed to quantify particulate
(microscopic & chemical analysis)
Bioabsorbable coatings/stents(strength & endurance characteristics)
DES Stent Coating Durability
Accelerated Fatigue with Particle Capture
• Individual Capture for each stent
• Ability to capture deployment particles when installed in straight tubes (acute durability).
• Ability to continue a full term fatigue test on same stents (chronic durability).
• Ability to capture timed samples on all (12) stents automatically. (Programmable)
• May be triggered by cycle count
• May be triggered by time
• May be triggered by filter condition
• Fatigue run to target duration
69
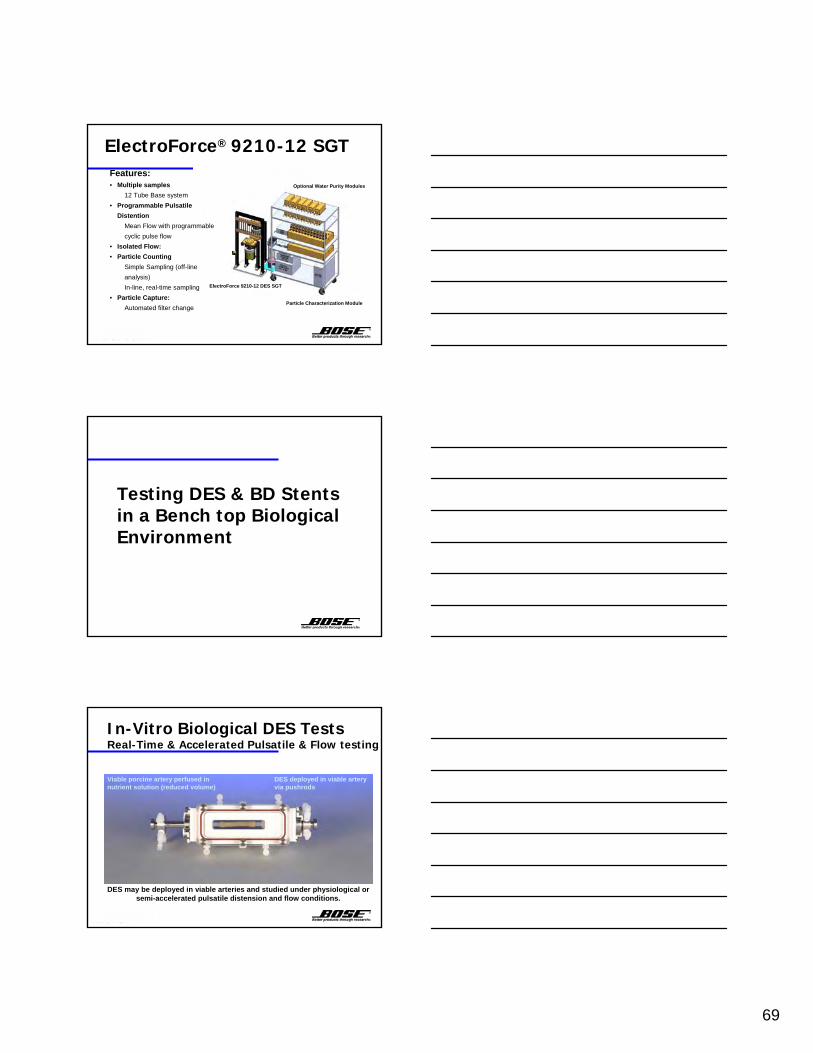
ElectroForce® 9210-12 SGT
ElectroForce 9210-12 DES SGT
Particle Characterization Module
Optional Water Purity Modules
Features:• Multiple samples
12 Tube Base system• Programmable Pulsatile
DistentionMean Flow with programmablecyclic pulse flow
• Isolated Flow:• Particle Counting
Simple Sampling (off-lineanalysis)In-line, real-time sampling
• Particle Capture:Automated filter change
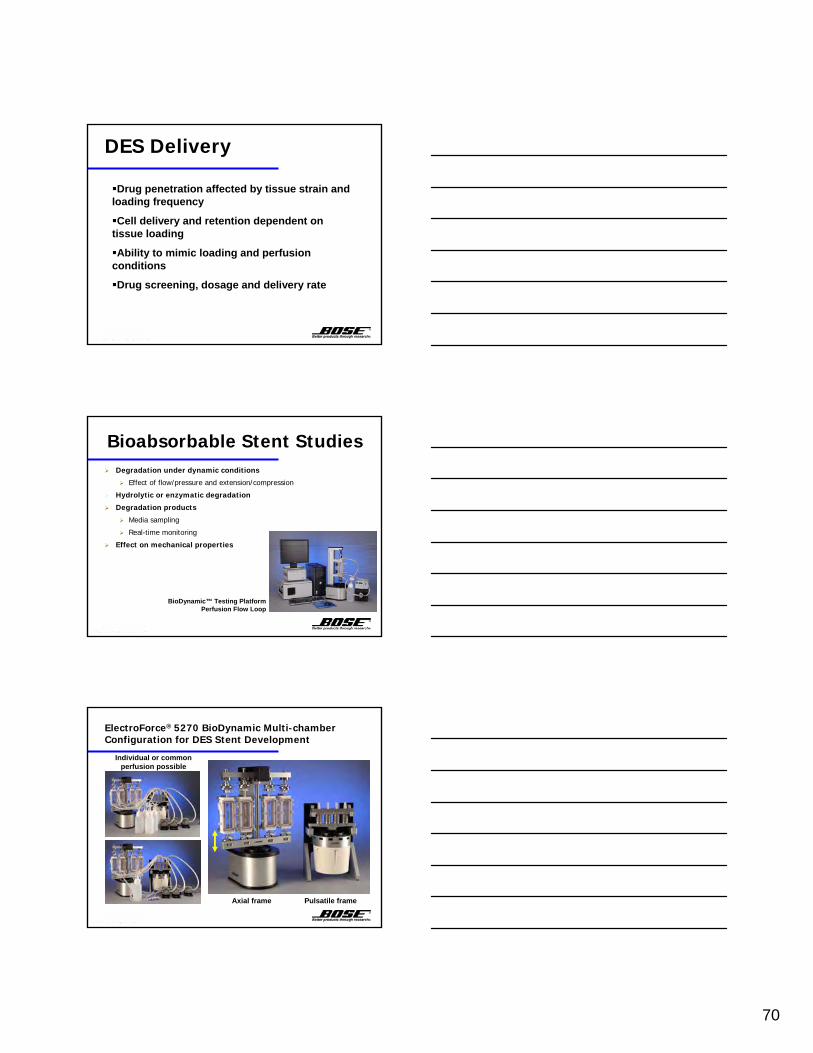
Testing DES & BD Stents in a Bench top Biological Environment
Viable porcine artery perfused in nutrient solution (reduced volume)
In-Vitro Biological DES TestsReal-Time & Accelerated Pulsatile & Flow testing
DES deployed in viable artery via pushrods
DES may be deployed in viable arteries and studied under physiological orsemi-accelerated pulsatile distension and flow conditions.
70
DES Delivery
Drug penetration affected by tissue strain and loading frequency
Cell delivery and retention dependent on tissue loading
Ability to mimic loading and perfusion conditions
Drug screening, dosage and delivery rate
Bioabsorbable Stent StudiesDegradation under dynamic conditions
Effect of flow/pressure and extension/compression
Hydrolytic or enzymatic degradation
Degradation products
Media sampling
Real-time monitoring
Effect on mechanical properties
BioDynamic™ Testing PlatformPerfusion Flow Loop
ElectroForce® 5270 BioDynamic Multi-chamber Configuration for DES Stent Development
Individual or common perfusion possible
Axial frame Pulsatile frame
71
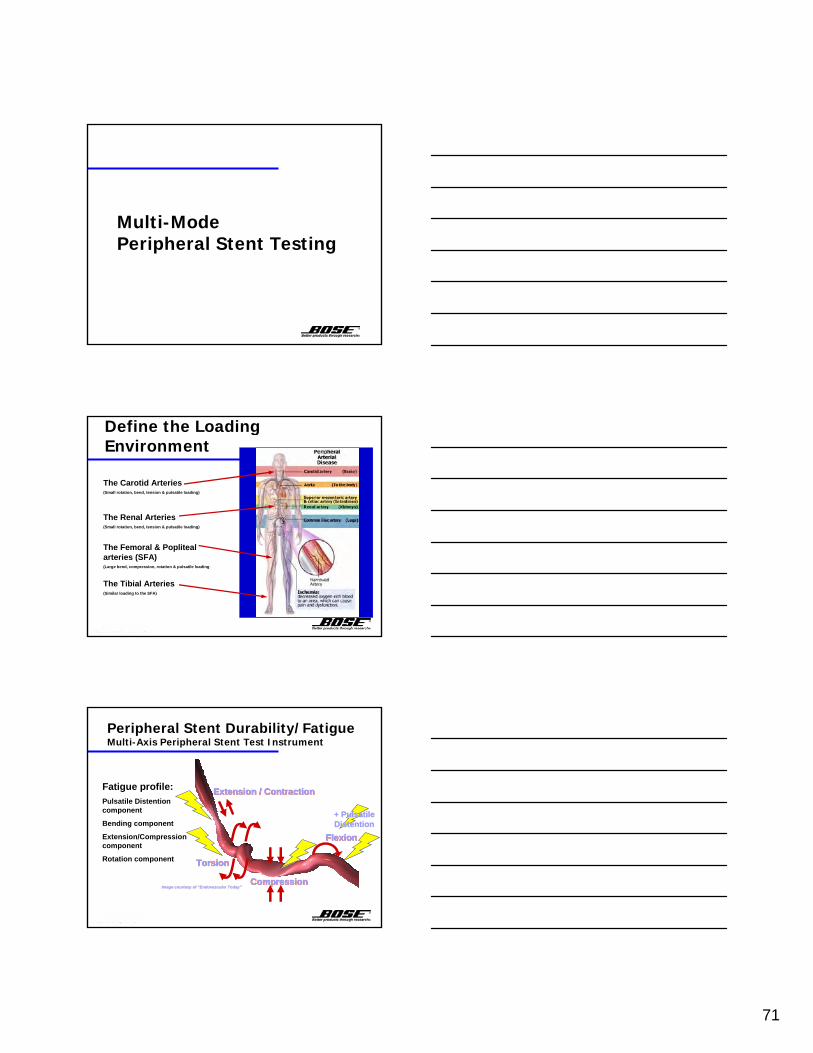
Multi-ModePeripheral Stent Testing
Define the Loading Environment
The Femoral & Popliteal arteries (SFA) (Large bend, compression, rotation & pulsatile loading)
The Tibial Arteries (Similar loading to the SFA)
The Renal Arteries (Small rotation, bend, tension & pulsatile loading)
The Carotid Arteries (Small rotation, bend, tension & pulsatile loading)
Fatigue profile:Pulsatile Distention component
Bending component
Extension/Compression component
Rotation component
Peripheral Stent Durability/FatigueMulti-Axis Peripheral Stent Test Instrument
CompressionCompressionCompressionImage courtesy of Image courtesy of ““Endovascular TodayEndovascular Today””
Extension / ContractionExtension / ContractionExtension / Contraction
Torsion Torsion Torsion
FlexionFlexionFlexion
+ Pulsatile + Pulsatile DistentionDistention
72
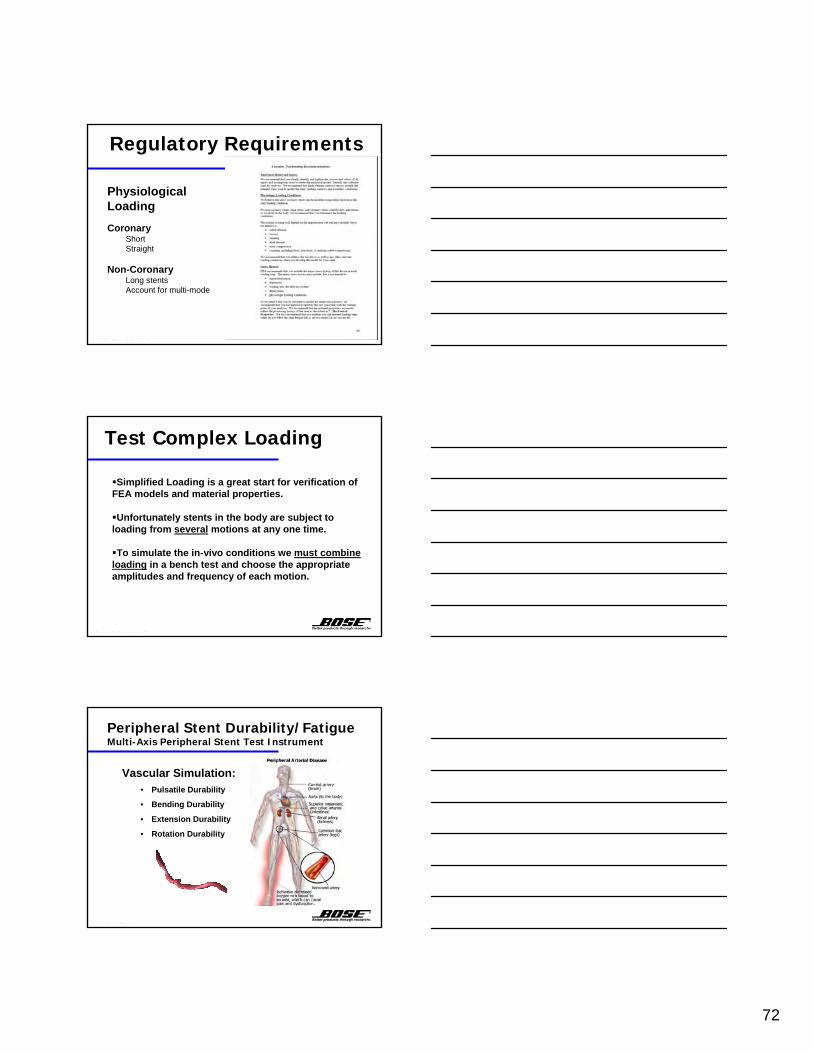
Physiological LoadingCoronary
Short Straight
Non-CoronaryLong stentsAccount for multi-mode
Regulatory Requirements
Test Complex Loading
Simplified Loading is a great start for verification of FEA models and material properties.
Unfortunately stents in the body are subject to loading from several motions at any one time.
To simulate the in-vivo conditions we must combine loading in a bench test and choose the appropriate amplitudes and frequency of each motion.
Vascular Simulation:• Pulsatile Durability
• Bending Durability
• Extension Durability
• Rotation Durability
Peripheral Stent Durability/FatigueMulti-Axis Peripheral Stent Test Instrument
73
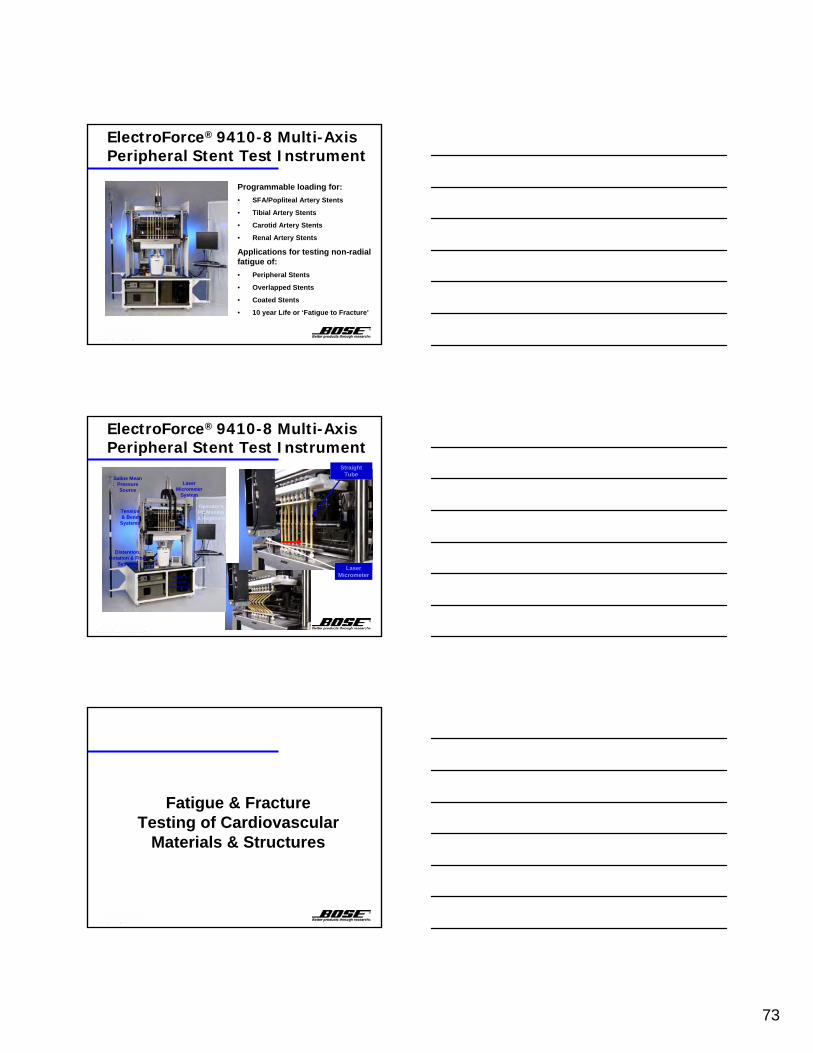
ElectroForce® 9410-8 Multi-Axis Peripheral Stent Test Instrument
Programmable loading for:• SFA/Popliteal Artery Stents
• Tibial Artery Stents
• Carotid Artery Stents
• Renal Artery Stents
Applications for testing non-radialfatigue of:• Peripheral Stents
• Overlapped Stents
• Coated Stents
• 10 year Life or ‘Fatigue to Fracture’
ElectroForce® 9410-8 Multi-Axis Peripheral Stent Test Instrument
Power & Control
Electronics
Distention, Rotation & Flow
Systems
Tension & Bend
Systems
Laser Micrometer
System
Saline Mean Pressure Source
Operator’s PC Monitor & Keyboard
Laser Micrometer
Straight Tube
Fatigue & FractureTesting of Cardiovascular
Materials & Structures
74
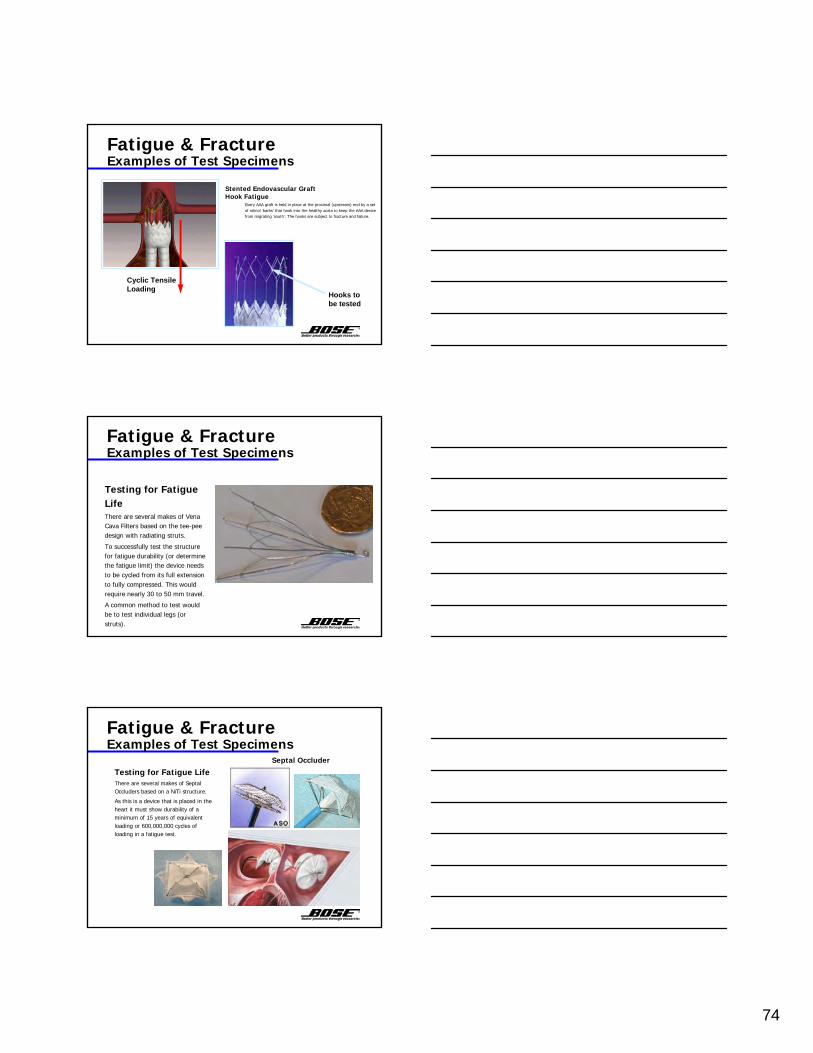
Stented Endovascular Graft Hook Fatigue
Every AAA graft is held in place at the proximal (upstream) end by a set of nitinol ‘barbs’ that hook into the healthy aorta to keep the AAA device from migrating ‘south’. The hooks are subject to fracture and failure.
Hooks to be tested
Cyclic Tensile Loading
Fatigue & FractureExamples of Test Specimens
Fatigue & FractureExamples of Test Specimens
Testing for Fatigue LifeThere are several makes of Vena Cava Filters based on the tee-pee design with radiating struts.
To successfully test the structure for fatigue durability (or determine the fatigue limit) the device needs to be cycled from its full extension to fully compressed. This would require nearly 30 to 50 mm travel.
A common method to test would be to test individual legs (or struts).
Septal Occluder
Fatigue & FractureExamples of Test Specimens
Testing for Fatigue LifeThere are several makes of Septal Occluders based on a NiTi structure.
As this is a device that is placed in the heart it must show durability of a minimum of 15 years of equivalent loading or 600,000,000 cycles of loading in a fatigue test.
75
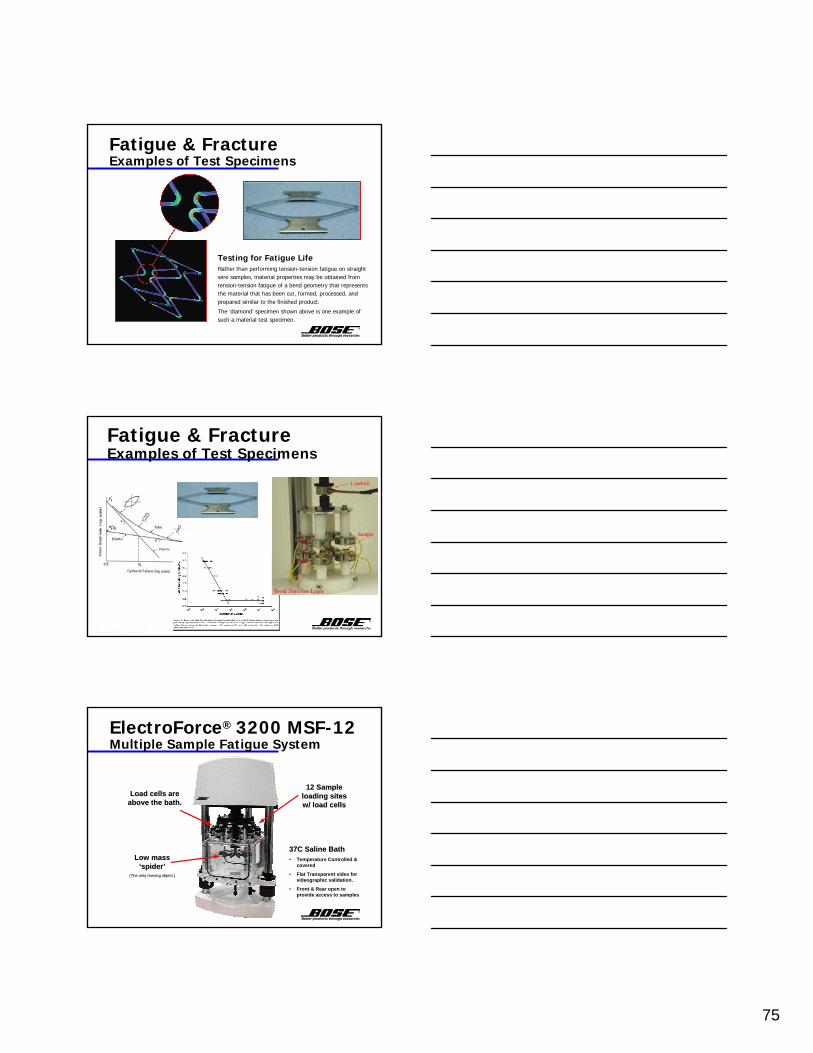
Fatigue & FractureExamples of Test Specimens
Testing for Fatigue LifeRather than performing tension-tension fatigue on straight wire samples, material properties may be obtained from tension-tension fatigue of a bend geometry that represents the material that has been cut, formed, processed, and prepared similar to the finished product.
The ‘diamond’ specimen shown above is one example of such a material test specimen.
Proceedings SMST-2003
Fatigue & FractureExamples of Test Specimens
ElectroForce® 3200 MSF-12Multiple Sample Fatigue System
12 Sample 12 Sample loading sites loading sites w/ load cellsw/ load cells
Low mass Low mass ‘‘spiderspider’’
(The only moving object.)(The only moving object.)
Load cells are Load cells are above the bath.above the bath.
37C Saline Bath37C Saline Bath• Temperature Controlled &
covered
• Flat Transparent sides for videographic validation.
• Front & Rear open to provide access to samples.

76
ElectroForce® 3200 MSF-12Multiple Sample Fatigue System
12 Sample 12 Sample loading sites loading sites w/ load cellsw/ load cells
Low mass Low mass ‘‘spiderspider’’
(The only moving object.)(The only moving object.)
Load cells are Load cells are above the bathabove the bath..
100 mm100 mm(between mounting surfaces)(between mounting surfaces) Removable Removable
‘‘DoorsDoors’’
ElectroForce® 3200 MSF-12Multiple Sample Fatigue System
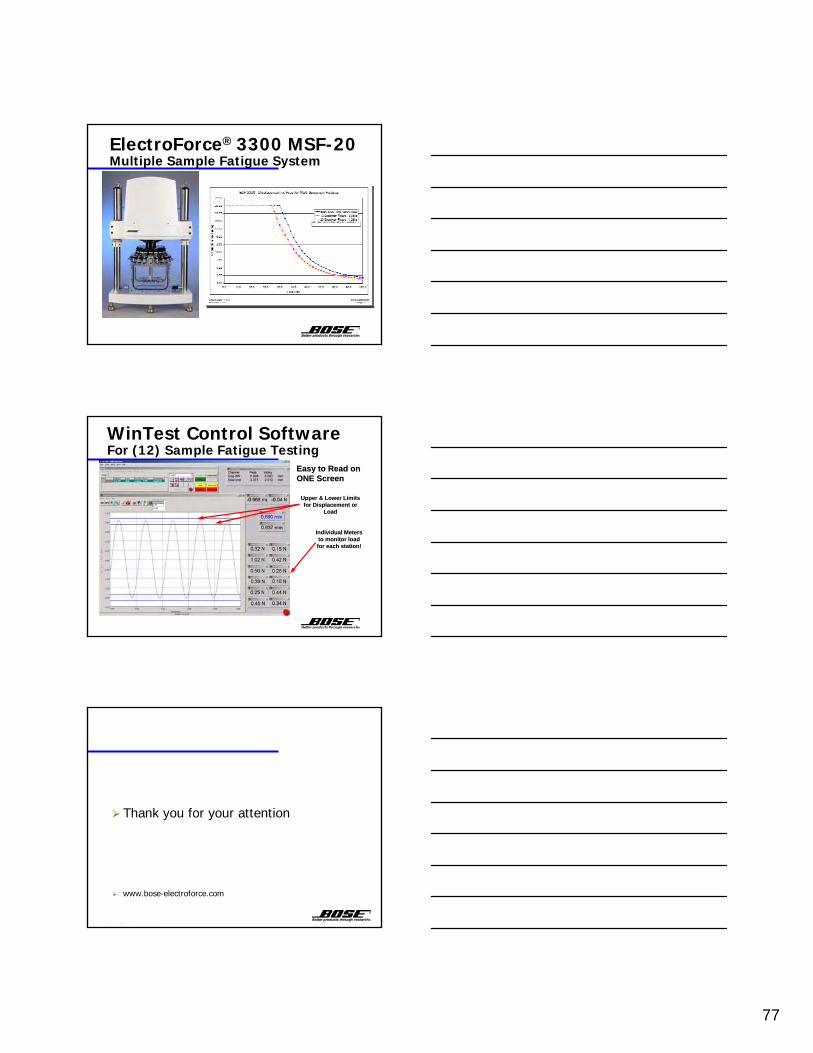
ElectroForce® 3300 MSF-20Multiple Sample Fatigue System
20 Sample 20 Sample loading sites loading sites w/ load cellsw/ load cells
Low mass Low mass ‘‘spiderspider’’
(The only moving object.)(The only moving object.)
Load cells are Load cells are above the bath.above the bath.
37C Saline Bath37C Saline Bath• Temperature Controlled &
covered
• Flat Transparent sides for videographic validation.
• Front & Rear open to provide access to samples.
77
ElectroForce® 3300 MSF-20Multiple Sample Fatigue System
WinTest Control SoftwareFor (12) Sample Fatigue Testing
Individual Meters Individual Meters to monitor load to monitor load for each station!for each station!
Upper & Lower Limits Upper & Lower Limits for Displacement or for Displacement or
LoadLoad
Easy to Read on Easy to Read on ONE ScreenONE Screen
Thank you for your attention
www.bose-electroforce.com