Why sleep matters -- the economic costs of insufficient … · 2016-12-08 · Magnitude of the...
101
Why sleep matters – the economic costs of insufficient sleep A cross-country comparative analysis Marco Hafner, Martin Stepanek, Jirka Taylor, Wendy M. Troxel, Christian van Stolk
Transcript of Why sleep matters -- the economic costs of insufficient … · 2016-12-08 · Magnitude of the...

Why sleep matters – the economic costs of insufficient sleepA cross-country comparative analysis
Marco Hafner, Martin Stepanek, Jirka Taylor,
Wendy M. Troxel, Christian van Stolk

RAND Europe is a not-for-profit organisation whose mission is to help improve policy and decisionmaking through research and analysis. RAND’s publications do not necessarily reflect the opinions of its research clients and sponsors.
Limited Print and Electronic Distribution Rights
This document and trademark(s) contained herein are protected by law. This representation of RAND intellectual property is provided for noncommercial use only. Unauthorized posting of this publication online is prohibited. Permission is given to duplicate this document for personal use only, as long as it is unaltered and complete. Permission is required from RAND to reproduce, or reuse in another form, any of its research documents for commercial use. For information on reprint and linking permissions, please visit www.rand.org/pubs/permissions.
Support RANDMake a tax-deductible charitable contribution at
www.rand.org/giving/contribute
www.rand.org
www.rand.org/randeurope
For more information on this publication, visit www.rand.org/t/RR1791
Published by the RAND Corporation, Santa Monica, Calif., and Cambridge, UK
© Copyright 2016 RAND Corporation
R® is a registered trademark.

i
Preface
This report presents the findings of a study on the causes, consequences and related economic costs of insufficient sleep.
The report will be of interest to employers, policy-makers, and the wider society and people interested in the field of sleep, health and wellbeing and health economics in general.
RAND Europe is an independent not-for-profit policy research organisation that aims to improve policy and decision-making in the public interest through research and analysis. This report has been peer reviewed in accordance with RAND’s quality assurance standards. For more information about RAND Europe or this document, please contact Marco Hafner ([email protected]):
RAND Europe Westbrook Centre, Milton Road Cambridge CB4 1YG United Kingdom Tel. +44 1223 353 329

ii
Abstract
This report examines the economic burden of insufficient sleep across five different OECD countries. Taking into account the association between sleep deprivation and mortality, as well as productivity, the findings of this study suggest that insufficient sleep can result in large economic costs in terms of lost GDP.

iii
Table of Contents
Preface ....................................................................................................................................................... i Abstract ..................................................................................................................................................... ii Figures ...................................................................................................................................................... v Tables ...................................................................................................................................................... vi Executive summary ................................................................................................................................. vii Acknowledgements ..................................................................................................................................xv Abbreviations ......................................................................................................................................... xvi 1. Introduction ....................................................................................................................................... 1
1.1. Insufficient sleep as a public health problem ................................................................................... 1 1.2. Causes of insufficient sleep .............................................................................................................. 4 1.3. Objectives of the study .................................................................................................................... 5 1.4. Research approach .......................................................................................................................... 7 1.5. Structure of this report .................................................................................................................... 8
2. Factors associated with insufficient sleep duration ............................................................................... 9 2.1. Factors associated with sleep duration - a glance at the literature ..................................................... 9 2.2. Using large-scale employer-employee data to analyse the factors associated with insufficient
sleep duration ............................................................................................................................... 10 2.3. Measuring and modelling the factors associated with sleep duration .............................................. 11 2.4. Descriptive characteristics of the study sample .............................................................................. 13 2.5. Empirical findings from the regression analysis ............................................................................. 17
2.5.1. Lifestyle and health factors ................................................................................................. 19 2.5.2. Personal and socio-demographic factors ............................................................................. 21 2.5.3. Psychosocial and job factors ............................................................................................... 22 2.5.4. Magnitude of the estimated sleep duration effects .............................................................. 24
3. Insufficient sleep and mortality ......................................................................................................... 26
iv
3.1. Insufficient sleep and mortality – existing empirical evidence ........................................................ 26 3.2. What is Meta-(regression) analysis? ............................................................................................... 28 3.3. MRA for the relationship between short sleep and all-cause mortality ........................................... 29
3.3.1. The meta-sample: systematic review and data collection .................................................... 29 3.3.2. Meta-regression analysis and publication selection bias ...................................................... 30 3.3.3. Taking into account study heterogeneity ........................................................................... 33 3.3.4. Short sleep duration and all-cause mortality risks for sub-categories ................................... 36
4. Quantifying the economic effects of insufficient sleep ....................................................................... 38 4.1. Insufficient sleep and workplace productivity ................................................................................ 38
4.1.1. Measuring workplace productivity loss .............................................................................. 39 4.1.2. Sleep and workplace productivity – empirical findings ....................................................... 40 4.1.3. Working time lost due to insufficient sleep – a cross-country perspective ........................... 42
4.2. The macroeconomic effects of insufficient sleep ............................................................................ 43 4.2.1. Conceptual approach and scope of the analysis .................................................................. 43 4.2.2. A dynamic general equilibrium model to assess the economic costs of insufficient
sleep .......................................................................................................................................... 44 4.2.3. Key parameters to calibrate the model ............................................................................... 47 4.2.4. Simulation results .............................................................................................................. 50
5. Discussion and recommendations ..................................................................................................... 53 5.1. Discussion .................................................................................................................................... 54 5.2. Recommendations ........................................................................................................................ 54
5.2.1. Recommendations targeting individuals ............................................................................ 55 5.2.2. Recommendations targeting employers .............................................................................. 56 5.2.3. Recommendations targeting public authorities .................................................................. 58
References ............................................................................................................................................... 61 Appendix A: List of studies used in the meta-analysis .............................................................................. 76 Appendix B: Macroeconomic model description ..................................................................................... 77

v
Figures
Figure 3.1: Funnel plot of relative mortality risks related to short sleep duration .................................... 31
vi
Tables
Table 1.1: Selected international sleep guidelines for adults ...................................................................... 2 Table 1.2: Proportions of the population sleeping less than seven hours ................................................... 3 Table 2.1: Potential factors associated with sleep quantity and quality .................................................... 11 Table 2.2: Personal and socio-demographic factor variables – BHW employees (n = 62,366) ................. 14 Table 2.3: Lifestyle and health factor variables – BHW employees (n = 62,366) ..................................... 15 Table 2.4: Psychosocial and job factor variables – BHW employees (n = 62,366) ................................... 16 Table 2.5: Sleep duration and quality variables – BHW employees (n = 62,366) .................................... 17 Table 2.6 Panel A: Factors associated with sleep duration (lifestyle and health) ...................................... 18 Table 3.1: Testing for publication bias - weighted least squares of meta-regression model (2) ................. 32 Table 3.2: Correcting for publication bias – weighted-least squares of meta-regression model (3) ........... 33 Table 3.3: Moderator variables for sleep-mortality research .................................................................... 34 Table 3.4: Multiple meta-regression analysis of short sleep duration and mortality risk .......................... 35 Table 3.5: Short sleep and all-cause mortality risk for different sleep patterns – night time and 24 hour
sleep .............................................................................................................................................. 37 Table 4.1: Sleep and work impairment due to absenteeism and presenteeism ......................................... 40 Table 4.2: Total working time lost across five different OECD countries ............................................... 42 Table 4.3: Scenarios included in the projections ..................................................................................... 46 Table 4.4: Proportions of the population sleeping less than seven hours ................................................. 48 Table 4.5: Estimated annual cost in GDP terms relative to baseline (U.S.$ billions; %) ......................... 51 Table 4.6: Average annual costs in GDP relative to baseline up to 2030 (U.S.$ billions) ........................ 52 Table 4.7: Estimated cumulative costs in GDP relative to baseline (U.S.$ billions, 2015 prices) ............. 52 Table 4.8: Estimated loss in labour productivity (%) relative to baseline ................................................. 53 Table B.0.1: Economic calibration parameters........................................................................................ 83

vii
Executive summary
A. Insufficient sleep as a public health problem
The Centers for Disease Control and Prevention (CDC) in the United States has declared insufficient sleep a ‘public health problem’. Indeed, according to a recent CDC study, more than a third of American adults are not getting enough sleep on a regular basis (Liu et al., 2014). However, insufficient sleep is not exclusively a U.S. problem, and also concerns other industrialised countries such as the United Kingdom, Japan, Germany, or Canada (National Sleep Foundation, 2013). According to recent evidence, the proportion of people getting less than the recommended hours of sleep is rising and is associated with lifestyle factors related to a modern 24/7 society, such as psychosocial stress, unbalanced diet, lack of physical activity and excessive electronic media use, among others (Roenneberg, 2013). This is alarming as insufficient sleep has been found to be associated with a range of negative health and social outcomes, including adverse performance effects at school and in the labour market.
Insufficient sleep duration has been linked with seven of the fifteen leading causes of death in the United States, including cardiovascular disease, malignant neoplasm, cerebrovascular disease, accidents, diabetes, septicaemia and hypertension (Kochanek et al., 2014). Besides impairing health and wellbeing, existing evidence suggests that sleep plays an important part in determining cognitive performance and workplace productivity, with a lack of sleep leading to more traffic accidents, industrial accidents, medical errors and loss of work productivity (Nuckols et al., 2009; Ulmer et al., 2009; Pack et al., 1995). Sleep loss and sleep-related disorders have been linked to a number of accidents and catastrophes including the Chernobyl nuclear explosion, the Three Mile Island nuclear incident, the Exxon Valdez spill and the Space Shuttle Challenger tragedy (United States Senate Committee on Energy and Natural Resources, 1986; Dinges et al., 1989; Moss, 1981; National Commission on Sleep Disorders, 1993; Walsh et al., 2011).
While insufficient sleep can have detrimental impacts on all age cohorts, sleep deprivation among children and adolescents may trigger irreversible long-term consequences. For instance, there is strong evidence for the association of quality and quantity of sleep with school performance and cognitive ability among school-aged children and adolescents (Blunden et al., 2000; Owens et al., 2000; Roberts et al., 2001). However, according to a National Sleep Foundation (2006) survey, more than 87 percent of high school students in the United States get far less than the recommended hours of sleep, and the amount of sleep they get is decreasing, posing a serious threat to their health and academic success.
Given the potential adverse effects of insufficient sleep on health, well-being and productivity, the consequences of sleep-deprivation have far-reaching societal and economic consequences. With the evidence on the economic consequences of sleep loss and disorders being limited so far, there is an acute

RAND Europe
viii
need for systematic analyses of the economic impacts of insufficient sleep, particularly given some evidence of rising rates of insufficient sleep worldwide,. This research study aims to raise awareness of the scale of insufficient sleep as a societal issue, quantifying the economic costs of insufficient sleep as well as making recommendations and providing potential solutions that can help tackle this growing problem.
B. Objectives of the study
Against this background, the study aims to stimulate discussion on the economic burden of insufficient sleep by contributing to the evidence base surrounding this public health problem. In essence, building on existing scientific evidence and applying relevant quantitative research methods this study seeks to:
1) Identify the factors associated with sleep duration: in order to make recommendations on how to tackle the problem of insufficient sleep it is important to understand the factors associated with sleep duration in more detail. To that end, we use a novel large employer-employee dataset which includes a substantial number of different variables that may be associated with sleep duration, enabling us to examine the relative contribution of each factor in more detail.
2) Investigate the link between insufficient sleep and mortality and workplace productivity: insufficient sleep is associated with many negative health outcomes and elevated mortality risks. It also impairs cognitive performance, leading to lower productivity levels. Using appropriate econometric modelling techniques, this study provides new estimates on the association between insufficient sleep and mortality, as well as working time lost due to absenteeism, employees not being at work, and presenteeism, employees being at work but working at a sub-optimal level.
3) Quantify the economic costs of insufficient sleep across different countries: we draw on parameters derived in the empirical analysis of this study and conduct a cross-country comparative analysis of the economic burden of insufficient sleep. For this purpose we develop a bespoke macroeconomic model to project GDP and labour productivity for five OECD countries under different future ‘what if’ scenarios.
C. Key research findings
The study findings contribute to the existing evidence base in four different areas: (1) factors associated with insufficient sleep; (2) link between insufficient sleep and (all cause)-mortality; (3) association between insufficient sleep and workplace productivity; (4) economics costs of insufficient sleep across five different OECD countries.
1. Individual and workplace-related factors impact sleep duration
Using recent survey data for over 62,000 individuals covering the combined years of 2015 and 2016, the findings of this study suggest that a number of different individual-level and workplace factors are associated with insufficient sleep. This includes body mass index (BMI), smoking, sugary drink consumption, a lack of physical activity, stress and anxiety, financial concerns, gender, marital status, unrealistic time pressures at work, working irregular hours and long commuting times. The factors leading to short sleep can be summarised in more detail as follows:

Why sleep matters – the economic costs of insufficient
ix
Lifestyle and health factors
1) BMI: people with a BMI considered as overweight or obese sleep on average between about 2.5 minutes to 7 minutes less per day than those with a normal BMI.
2) Smoking: current smokers sleep on average 5 minutes less per day than non-smokers.
3) Sugary drinks: people consuming more than two sugary drinks per day sleep on average 3.4 minutes less per day than those with less consumption of sugary drinks.
4) Physical activity: people performing less than 120 minutes of physical activity per week sleep on average about 2.6 minutes less per day than those reporting to do more than the recommended 150 mins of physical activity per week.
5) Mental health: people with medium to high risk of mental-health problems sleep on average 17.2 minutes less per day than those with low risk of mental-health issues.
Personal and socio-demographic factors
1) Financial concerns: people with financial concerns sleep on average about 10 minutes less per day than those without concerns.
2) Unpaid care: people who provide unpaid care to family members, close relatives or friends sleep on average about 5 minutes less per day than those who do not provide unpaid care.
3) Children: people with dependent children under age of 18 living in the same household sleep on average about 4.2 minutes less per day than those without dependent children under the age of 18.
4) Gender: Men sleep on average about 9 minutes less per day than women.
5) Marital status: people reporting being separated from their partner sleep on average 6.5 minutes less per day than those who report being married. Similarly, people who reported never being married sleep on average 4.8 minutes less than those being married.
Workplace psychosocial and job factors
1) Lack of choice: people reporting a lack of choice in their daily work routine sleep on average 2.3 minutes less per day than those reporting more choice at work.
2) Unrealistic time pressures: people reporting unrealistic time pressures and stress at the workplace sleep on average 8 minutes less per day than those reporting low levels of time pressure.
3) Irregular hours: people that work irregular hours (e.g. shift work) sleep on average 2.7 minutes less per day than those working regular hours.
4) Commuting: people commuting between 30 to 60 minutes to work (one way) sleep on average 9.2 minutes less per day compared to those with a zero to 15 minutes (one way) commute. Heavy commuters travelling more than 60 minutes to work (one way) sleep on average 16.5 minutes less per day than those with only short commutes.

RAND Europe
x
At first glance, the estimates of minutes of sleep lost due to the various factors outlined above may seem small. However, it is important to stress that the estimates represent the effect on sleep duration of each single factor, holding all other factors constant.
To put this into perspective, an employee who works irregular hours, commutes 30 to 60 minutes to work (one way) and is exposed to a set of different measures of workplace psychosocial risks, such as unrealistic time pressures, sleeps on average about 28.5 minutes per day less than an employee that has regular working hours, commutes only up to 15 minutes (one way) and is not exposed to psychosocial risk factors at the workplace. This equates to over 173 hours of lost sleep per year.
2. Insufficient sleep increases mortality risk by up to 13 per cent Investigating the link between sleep duration and mortality we find that at any given point in time, an individual that sleeps on average less than six hours per night has a 13 per cent higher mortality risk than an individual sleeping between seven and nine hours, which is considered as the healthy amount of sleep. Furthermore, an individual sleeping between six and seven hours per night has a 7 per cent higher mortality risk. This includes all causes of death, including fatal car accidents, strokes, cancer or due to cardiovascular disease.
3. Insufficient sleep is costly for employers by reducing workplace productivity
The empirical findings of this study suggest that workers who sleep less than six hours per day report on average about a 2.4 percentage point higher productivity loss due to absenteeism or presenteeism than workers sleeping between seven to nine hours per day. Those sleeping on average between six to seven hours still report about a 1.5 percentage point higher productivity loss compared to those sleeping seven to nine hours. To put these numbers into perspective, assuming there are 250 working days in a given year, this means that a worker sleeping less than six hours loses around 6 working days due to absenteeism or presenteeism per year more than a worker sleeping seven to nine hours. A person sleeping six to seven hours loses on average about 3.7 working days more per year.
Taking into account observed distributions of sleep duration and different working population sizes across
five different OECD countries,1 this amounts to a substantial loss of working time every year (see Table ES.1 below).
For instance, on an annual basis, the U.S. loses an equivalent of about 1.23 million working days due to insufficient sleep. This corresponds to about 9.9 million working hours. This is followed by Japan, which loses on average 0.6 million working days, or 4.8 million working hours, per year. With 0.2 million days the UK and Germany have a similar amount of working time lost, corresponding each to more than 1.65 million working hours. Among the five OECD countries examined, with about 0.08 million working days, Canada has the least working time lost due to insufficient sleep, corresponding to about 0.6 million working hours.
1 National Sleep Foundation (2013) reports the share of people sleeping less than 7 hours across five OECD countries as: Japan (56%), U.S. (45%), UK (35%), Germany (30%) and Canada (26%). See Table 1.1 in the report for more details.

Why sleep matters – the economic costs of insufficient
xi
Table ES.1: Total working time lost across five different OECD countries
Country U.S. UK Germany Japan Canada
Sleep: % < 6 hours 18% 16% 9% 16% 6%
Sleep: % 6 to 7 hours 27% 19% 21% 40% 20%
# Full-time workers (in thousands) 121,490 22,733 28,965 47,790 14,559
# Part time workers (in thousands) 27,340 8,296 11,245 14,000 3,387
Days lost (full-time): < 6 hours 528,377 87,372 60,545 185,289 22,089
Days lost (full-time): 6 to 7 hours 479,643 64,447 90,023 282,009 41,888
Days lost (part-time): < 6 hours 118,906 31,885 23,506 54,280 5,139
Days lost (part-time): 6 to 7 hours 107,938 23,519 34,951 82,614 9,745
Days lost: total 1,234,864 207,224 209,024 604,191 78,861
Hours lost: total 9,878,910 1,657,792 1,672,192 4,833,532 630,886
Notes: sleep-per-day data based on data from the National Sleep Foundation (2013) representative survey. The proportions of people sleeping less than six and between six and seven hours have been calculated by using the weighted average among the proportions for workday and weekend sleep patterns. The numbers of full and part-time employed workers in each country comes from the OECD labour statistics database. Note that we assume 250 working days per full-time employee per year and 125 working days for part-time employees. As an example, the total days lost due to insufficient sleep in an economy are calculated by multiplying the total number of workers (full- and part-time) by the proportions of short sleepers (< 6 hours and 6 to 7 hours), multiplied by the total number of working days (full-time: 250; part-time: 125) plus the percentages of work impairment due to absenteeism and presenteeism (< 6 hours: 2.36%; 6 to 7 hours: 1.47%). To calculate the total hours lost we multiply the working days by eight hours.
4. Up to $680 billion is lost each year across five OECD countries due to insufficient sleep
To provide estimates of the economic costs associated with insufficient sleep we develop a bespoke macro-economic model that simulates the various agents in an economy, including individuals, firms and the government, and their interactions over time. In our analytical approach, the effect of insufficient sleep is translated into the supply of effective labour units that individuals provide in the economy. In essence, labour supply is affected through three mortality and productivity related mechanisms.
Firstly, due to insufficient sleep, people are more likely to die than if they slept seven to nine hours a night, reducing the size of the working population. Secondly, sleep deprived workers are more likely to be absent from work due to sickness or with reduced performance while at work, which leads to an efficiency loss for each unit of labour supplied in the economy. Thirdly, sub-optimal school performance in younger years due to sleep deprivation hinders an individual’s skill development. We take this human capital effect into account by modelling shifts in the skill distribution at the point in time when adolescents enter the labour market.
As a first step, the model simulates the economic forecast of each of the five OECD countries under consideration in the status quo (or baseline) scenario – the current proportions of people with insufficient sleep. In a second step, under different ‘what if’ scenarios (compared to the status quo), the model predicts how economic output and labour productivity would be affected if the proportions of short

RAND Europe
xii
sleepers in the economy were reduced. In other words, how much larger would be the economic output if people got sufficient sleep.
Specifically, scenario 1 in our analysis represents an optimistic ‘best-case’ scenario where all short sleepers (less than seven hours per day) in the population would sleep the recommended hours of sleep (seven to nine hours). Scenario 2 represents a less ambitious scenario by examining the economic impact if those sleeping less than six hours started sleeping six to seven hours. Scenario 3 is similar to scenario 2 but predicts the potential gains to the economy if those sleeping six to seven hours started sleeping seven to nine hours, keeping those sleeping less than six hours unaffected. The findings for scenario 1 are depicted in the figure below.
Figure ES.1: Economic costs of insufficient sleep across five OECD countries
Notes: RAND Europe analysis
Our economic predictions indicate that in absolute terms, the U.S. sustains by far the highest annual economic loss (between $280 billion and $411 billion currently, depending on the scenario) due to the size of its economy, followed by Japan (between $88 billion and $138 billion). However, relative to the size of the overall economy, the estimated loss for Japan is actually larger than for the U.S. (between 1.56 to 2.28 per cent for the U.S. and 1.86 per cent to 2.92 per cent for Japan, respectively). This is followed by the UK (1.36 per cent to 1.86 per cent), Germany (1.02 per cent to 1.56 per cent) and Canada (0.85 per cent to 1.56 per cent).
The overall costs increase slightly in magnitude over time in all subsequent years of a given scenario, as the mortality effect of insufficient sleep leads to reductions in the labour supply. That is, the death of a worker does not only affect the year the death occurs, but continues to be a part of the costs in subsequent years because of the loss of all potential future offspring. To illustrate this point, the costs of insufficient sleep in 2020 for the U.S. range from $299 billion to $433 billion. However, this increases by 2030, where the range is from $318 to $456 billion. Overall, the lowest costs are observed in scenario 2, as this scenario assumes that short sleepers between six to seven hours have no elevated mortality risks and no

Why sleep matters – the economic costs of insufficient
xiii
higher amounts of working time lost due to absenteeism or presenteeism. The costs related to each scenario are summarised in more detail the Table ES.2 below.
Table ES.2: Estimated annual cost in GDP terms, relative to baseline scenario
Year Country GDP (U.S.$ billions, 2015 prices) GDP (%) Scenarios 1 2 3 1 2 3
Current
U.S. 411 280.6 357 2.28% 1.56% 1.98%
UK 50.2 36.7 43.2 1.86% 1.36% 1.60%
Japan 138.6 87.9 125.8 2.92% 1.86% 2.66%
Germany 60 39.3 54.8 1.56% 1.02% 1.42%
Canada 21.4 13.5 19.8 1.35% 0.85% 1.24%
2020
U.S. 433.8 299.4 377.5 2.40% 1.66% 2.09%
UK 53.8 40 46.4 1.99% 1.48% 1.72%
Japan 145.9 93.6 132.3 3.08% 1.98% 2.79%
Germany 62.3 40.9 56.5 1.61% 1.06% 1.47%
Canada 21.9 13.9 20.3 1.38% 0.88% 1.28%
2025
U.S. 456.1 318.6 396.9 2.53% 1.77% 2.20%
UK 57.6 43.3 49.7 2.13% 1.60% 1.84%
Japan 151.7 98.3 137.5 3.20% 2.07% 2.90%
Germany 64.7 42.6 58.6 1.68% 1.10% 1.52%
Canada 22.5 14.4 20.8 1.42% 0.91% 1.31%
2030
U.S. 467.7 330.0 406.9 2.59% 1.83% 2.26%
UK 58.7 44.1 50.6 2.17% 1.63% 1.87%
Japan 156.2 101.4 141.7 3.30% 2.14% 2.99%
Germany 69.1 46.6 62.9 1.79% 1.21% 1.63%
Canada 23.4 15.1 21.6 1.47% 0.95% 1.36%
The findings of the economic analysis in this report suggest, lower productivity levels and higher mortality risks related to insufficient sleep can result in substantial economic losses to modern economies. For instance, insufficient sleep among their populations cost the five OECD countries under consideration up to $680 billion of economic output every year. These costs rise over time, even if we assume constant proportions of short sleepers in the future. In summary, sleep deprivation adversely affects individuals through negative effects on their health and wellbeing and is also costly for employers due to lost working time from its employees, which is associated with large economic losses. Therefore, solving the problem of insufficient sleep represents a potential ‘win-win’ situation for individuals, employers and the wider society.
5. What can be done to solve the problem of insufficient sleep?
To improve sleep outcomes among the wider population, this report outlines a number of recommendations for individuals, employers and public authorities. Some of the key recommendations are summarised in the Table ES.3 below.

RAND Europe
xiv
Table ES.3: Recommendations for individuals, employers and public authorities to improve sleep outcomes
Recommendation Description
Recommendations targeted at individuals
1. Set a consistent wake-up time. Individuals may achieve better sleep outcomes by making sure they wake up at a consistent time.
2. Limit the use of electronic devices before bedtime.
Individuals may achieve better sleep outcomes minimising the time spent using electronic devices and the overall amount of screen time, particularly shortly before bedtime. The use of screens in the evening may suppress people’s melatonin levels, a hormone which is crucial for the control of sleeping and waking cycles.
3. Limit the consumption of substances which may impair sleep quality.
Sleep outcomes can be improved by avoiding or minimise the consumption of substances close to bedtime, including caffeine, alcohol, and nicotine.
4. Exercise. Physical activity has been demonstrated to be associated with improved sleep outcomes.
Recommendations targeting employers
5. Recognise the importance of sleep and the employer’s role in its promotion.
Employers should recognise the importance of sleep and the adverse outcomes both for individuals and businesses stemming from insufficient sleep. In some instances this may require a cultural change in organisational thinking.
6. Provide facilities and amenities that help employees with sleep hygiene.
Employers can put in place arrangements to support their staff’s daily routines with the aim of improving their sleep outcomes.
7. Discourage the extended use of electronic devices.
Employers may signal limits on staff’s expected availability after working hours or by introducing policies limiting after-hours and out-of-office communications.
Recommendations targeting public authorities
8. Support health professionals in providing sleep-related help.
Awareness campaigns and wider support activities should be aimed at professionals so that they are best equipped to assist individuals suffering from sleep disorders.
9. Introduce later school starting times. Public authorities can help promote more effective schedules by introducing delayed school starts.

Why sleep matters – the economic costs of insufficient
xv
Acknowledgements
The authors would like to thank the quality-assurance reviewers Charlene Rohr (RAND Europe) and Alex Armand (University of Navarra). In addition, we would also like to thank Ayesha Mansoor, David Filer and Miaoqing Yang for invaluable help and assistance during the research process.
The study relies in part on data collected for Vitality Health’s Britain’s Healthiest Workplace project, for which RAND Europe and the University of Cambridge provide research support to Vitality Health. However, it is important to note that this report involves independent research and analysis from RAND Europe.
The research ideas to this report have been developed by RAND researchers. The views presented in this report are the authors’ and remaining errors are also our own.

RAND Europe
xvi
Abbreviations
AMR Antimicrobial resistance BHW Britain's Healthiest Workplace competition CBT-I Cognitive-Behavioural Therapy for Insomnia CDC Centers for Disease Control and Prevention FAT Funnel Asymmetry Test GLM Generalised Linear Model HLQ Health and Labour Questionnaire HPQ Health and Work Performance Questionnaire HSE Health & Safety Executive LPM Linear Probability Model MRA Meta-regression analysis MS Management Standards OLG Overlapping Generations model OLS Ordinary Least Squares PEESE Precision-Effect Estimate with Standard Error PET Precision Effect Test RE Random Effects RR Relative risk SE Standard Error SPS Stanford Presenteeism Scale WHI Work and Health Interview WLG Work Limitations Questionnaire WLS Weighted Least Squares WPAI Work Productivity and Activity Impairment Questionnaire WPSI Work Productivity Short Inventory

1
1. Introduction
1.1. Insufficient sleep as a public health problem
We devote considerable portions of our lives to sleep. In fact, sleep may be considered ‘the most common
activity in terms of time spent that humans engage in’.2 However, even though we spend roughly one-third of our lives asleep, there are still significant gaps in our understanding of sleep. For instance, even the very fundamental question of why we sleep is subject to a series of hypotheses ranging from giving our bodies, and in particular our brains, time to recover, to clearing our bodies of toxins to strengthening our memory and selecting what our memories will retain (Ghosh, 2015; Locke, 2014). Nevertheless, there appears to be a consensus that sleep has beneficial effects at many different levels and is essential for health, productivity, and cognitive and psychological well-being. While the need to take into account individual factors makes it is impossible to set precise guidelines about how much sleep each individual
should be getting,3 there is a broad consensus about what constitutes insufficient – or short – sleep. Available guidelines frequently provide a range of hours individuals should sleep every night, and these estimates are relatively consistent for various groups (see Table 1.1). By extension, anything falling short of the recommended lower boundary can be understood as constituting insufficient, or short, sleep, giving rise – particularly if this is a regular occurrence – to sleep deprivation.
A lack of sleep has been found to be associated with a range of negative health and social outcomes, including adverse performance effects at school and in the labour market. Over the last decades, there has been growing evidence suggesting a strong association between sleep duration and mortality risk, with some evidence suggesting that individuals sleeping between seven and nine hours nightly experience the lowest risks for all-cause mortality, whereas those who sleep for shorter or longer periods have significantly higher mortality risks (see, for example, Vgontzas et al., 2010). Insufficient sleep duration has been linked with seven of the fifteen leading causes of death in the U.S. including cardiovascular disease, malignant neoplasm, cerebrovascular disease, accidents, diabetes, septicaemia and hypertension (Kochanek et al., 2014).
2 Freakonomics (2015) The Economics of Sleep, Part 2. 16 September 2015. As of 2 November 2016: http://freakonomics.com/2015/07/16/the-economics-of-sleep-part-2-full-transcript 3 As of 27 October 2016: https://sleepfoundation.org/how-sleep-works/how-much-sleep-do-we-really-need/page/0/1

RAND Europe
2
Table 1.1: Selected international sleep guidelines for adults
Source Guideline Notes
National Sleep Foundation4 7-9 hours Refers to adults aged 26–64
Mayo Clinic5 7-9 hours
National Heart Lung and Blood Institute6 7-8 hours Includes the elderly
Royal College of Psychiatrists7 Around 8 hours Includes the elderly
It is important to stress that existing evidence suggests that not only is insufficient sleep associated with negative outcomes, but also that individuals sleeping more than the recommended seven to nine hours may also have elevated mortality risk and productivity losses. It is therefore the extreme ends of sleep distribution patterns that really matter for predicting adverse outcomes (that is to say, short sleepers who sleep less than seven hours nightly versus long sleepers who sleep more than nine hours).
Sleep deprivation is often associated with shift work, the 24/7 society, stress and lifestyle factors, while long sleep is reported to be associated with underlying (unobserved or undiagnosed) chronic health conditions, such as heart disease, cancer or depression. The evidence suggests that the link between short sleep and negative outcomes is more direct, whereas the link between long sleep and negative outcomes seems to be more indirect (i.e. long sleep is driven by underlying chronic health conditions and not vice versa). Hence, the impact of insufficient sleep appears to be the more salient issue in our society and represents a major public-health concern which may be best addressed by changes in individual behaviour, supported by employers and public-policy measures (Grandner et al., 2010).
In addition, scientific evidence suggest that insufficient sleep may also impair cognitive abilities, leading to more traffic accidents, industrial accidents, medical errors and loss of work productivity (Nuckols et al., 2009; Pack et al., 1995). Typically, lack of sleep is thought of as an individual issue, but the consequences of insufficient sleep can be far-reaching and dramatic and can have wider societal and economic effects. Lack of adequate sleep can affect judgment and the ability to process and retain information adequately, and can increase the risk of serious or fatal accidents and injury. Sleep deficiency and sleep-related disorders have been linked to a number of accidents and catastrophes including the Chernobyl nuclear
4 NSF (2015) National Sleep Foundation Recommends New Sleep Times. As of 26 October 2016: https://sleepfoundation.org/media-center/press-release/national-sleep-foundation-recommends-new-sleep-times 5 Mayo Clinic (no date) How many hours of sleep are enough for good health? As of 26 October 2016: http://www.mayoclinic.org/healthy-lifestyle/adult-health/expert-answers/how-many-hours-of-sleep-are-enough/faq-20057898 6 NHLBI (2012) How Much Sleep Is Enough? As of 26 October 2016: http://www.nhlbi.nih.gov/health/health-topics/topics/sdd/howmuch 7 Royal College of Psychiatrists (2010) Sleeping well. As of 26 October 2016: http://www.nhs.uk/ipgmedia/national/royal%20college%20of%20psychiatrists/assets/sleepingwell.pdf

Why sleep matters – the economic costs of insufficient
3
explosion, the Three Mile Island nuclear incident, the Exxon Valdez spill and the Space Shuttle Challenger tragedy (United States Senate Committee on Energy and Natural Resources, 1986; Dinges et al., 1989; Moss, 1981; National Commission on Sleep Disorders, 1993; Walsh et al., 2011). Hence, existing data on how much sleep people are actually getting raises concerns about the consequences of insufficient sleep in the population at large. According to some evidence, people nowadays tend to get one to two hours less sleep each night compared to their ancestors fifty or a hundred years ago (Roenneberg, 2013). According to a report published by the Centers for Disease Control and Prevention (CDC), more than a third of American adults are not getting enough sleep on a regular basis (Liu et al., 2014).
Recognising the scale of the issue, the CDC has declared insufficient sleep a ‘public health problem’.8 Insufficient sleep is not exclusively a U.S. problem, as a recent study by the National Sleep Foundation (2013) highlighted. In a representative survey, researchers surveyed residents of five high-income OECD countries (the UK, the U.S., Canada, Germany, Japan) about their sleep habits. On average, around 21 per cent of people in the U.S. reported sleeping less than six hours per normal workday, with people in e Japan and UK slightly behind with 19 and 18 per cent respectively. This compares to 10 per cent of people sleeping less than six hours in Germany and 7 per cent in Canada.
Table 1.2: Proportions of the population sleeping less than seven hours
U.S. UK Germany Japan Canada
Less than 6 hours 18% 16% 9% 16% 6%
6 to 7 hours 27% 19% 21% 40% 20%
Notes: Sleep data based on data from the National Sleep Foundation (2013) representative survey. The proportions of people sleeping less than six and between six and seven hours have been calculated by using the weighted average among the proportions for workday and weekend sleep patterns.
While insufficient sleep can have detrimental impacts on all age cohorts, sleep deprivation among children and adolescents may trigger irreversible long-term consequences if those affected perform sub-optimally in school. A number of research articles have reported the association of quality and quantity of sleep with school performance and cognitive ability among school-aged children (Blunden et al., 2000; Owens et al., 2000; Roberts et al., 2001). Furthermore, a study by Carrell et al. (2011) specifically examined the effect of school start times on the academic achievement of adolescents at the U.S. Air Force Academy, finding that starting the school day 50 minutes later had a significant positive effect on academic achievement. According to a National Sleep Foundation (2006) survey, more than 87 percent of high school students in the United States get far less than the recommended hours of sleep and the amount sleep they get is decreasing, posing a serious threat to their health and academic success. The reasons why school-age children and adolescents may sleep fewer than the recommended hours include early school start times, electronic media use, competing demands including homework and extracurricular activities, and
8 CDC (2015) Insufficient Sleep Is a Public Health Problem. As of 10 September 2016: http://www.cdc.gov/features/dssleep/

RAND Europe
4
inconsistent bedtime patterns as well as neurobiological changes in sleep patterning and physiology across different stages of development (Thomas et al., 2015).
Given the potential adverse effects of insufficient sleep on health, well-being and productivity, the consequences of sleep-loss and disorders have far-reaching economic effects. A handful of existing studies have aimed to quantify the economic burden of sleep loss and disorders, all of which use a bottom-up cost estimation approach. For instance, Hillman et al. (2006) estimated that direct and indirect costs of sleep-related problems amount to nearly 1 per cent of GDP in Australia. Also in the Australian context, AlGhanim et al. (2008) estimated the total economic burden of sleep disorders to be $7.494 billion, representing 1.3 per cent of Australia’s GDP in 2004. For the U.S., Chilcott and Shapiro (1996) examined the costs directly related to insomnia in various sectors of healthcare, as well as the indirect costs associated with accidents, sick days and decreased work productivity. They estimated the total direct, indirect and related costs of insomnia to be $30 to $35 billion annually. Shahly et al. (2012) estimated that insomnia was associated with 7.2 per cent of all costly workplace accidents and errors and the costs thereof for the U.S. population had a combined value of $31.1 billion. For France, the study by Leger et al. (1999) found that the total direct cost of insomnia in France in 1995 was $2 billion. Furthermore, it has been estimated that sleep-related fatigue costs businesses $150 billion a year in absenteeism, workplace accidents, and other lost productivity (Health care strategic management, 2001). Although the evidence on the economic consequences of sleep loss and disorders is limited, there is an acute need for systematic analyses of the economic impacts of insufficient sleep, particularly given some evidence of rising rates of insufficient sleep worldwide.
1.2. Causes of insufficient sleep
The causes of sleep deprivation can be broadly categorised into two partially overlapping groups: (1) sleep disorders such as insomnia, sleep apnea or narcolepsy; and (2) lifestyle related (e.g. irregular sleep schedules, stress). Regrettably, as an Institute of Medicine report (Colten & Altevogt, 2006) highlighted, it is impossible to determine the relative contributions of pathological versus behavioural factors to sleep-
loss. In fact, as several authors9 have pointed out, sleep deprivation is frequently a product of multiple simultaneous factors.
Behavioural causes of sleep deprivation include various types of individual choices such as a person’s decision to restrict sleep time in pursuit of other activities, or consumption of stimulants close to bed time. Work commitments, such as those faced by shift workers or frequent business travellers, can also disrupt sleep cycles. Similar applies to stress and unrealistic time pressures at the workplace, which can adversely affect sleep. The same is the case with school schedules and demands, which can prevent children and adolescents from getting enough sleep, despite recommendations that these groups get even
9 See, e.g. Grover, V, Malhotra, R and Jaur H (2015) Exploring association between sleep deprivation and chronic periodontitis: A pilot study. J Indian Soc Periodontol. 19(3):304–307; Walia, HK and Mehra, R (2016) Overview of Common Sleep Disorders and Intersection with Dermatologic Conditions. International journal of molecular sciences, 17(5):654.

Why sleep matters – the economic costs of insufficient
5
more sleep than adults. People’s sleeping habits and hygiene, such as activities close to bed time and the environment in which they sleep, can also play a role in causing sleep deprivation.
The second broad group of causes of sleep deprivation are medical and psychological conditions. Insomnia, characterised by difficulties sleeping at night, affects up to 30 per cent of people as measured by those who report at least one symptom of insomnia, although the application of more stringent diagnostic criteria yield lower prevalence estimates (Roth, 2007). The prevalence of sleep apnea, which causes a reduction of air stream to the lungs while sleeping, is estimated to have grown substantially in recent decades, reaching, in the American context, up to approximately a quarter of adults aged 30–70
(American Academy of Sleep Medicine, 2014; Peppard et al., 2013).10 Other examples of relevant conditions include short-term illnesses such as tonsillitis, influenza or colds due to their ability to disrupt and fragment sleep. Furthermore, psychosocial stress, as well as other symptoms of psychological distress and disorders, including depression and anxiety, also contribute to insufficient sleep.
Regardless of the underlying cause of sleep deprivation, broad recent societal changes may have exacerbated the role of some of the factors discussed above and thus contributed to the observed decreases in the amount of sleep we are getting. One such change is the increasing prevalence of longer working hours and more shift work, which causes many people to become sleep deprived (Åkerstedt & Nilsson, 2003; Drake et al., 2004; Härmä et al., 1998). A somewhat related contributing trend is the proliferation of modern communication technology, which enables people to continue working, stay connected and be
available for longer and/or after departing their workspaces.11 New technology also provides outlets for distraction and entertainment, possibly chipping away at hours reserved for sleep (National Sleep Foundation, 2005). Wider societal pressures and perceptions that portray sleep as an unproductive activity, exemplified by frequent admiration for individuals and professionals who profess limited need for sleep, should also be considered an underlying contributing trend (Dement & Vaughan, 1999).
1.3. Objectives of the study
As outlined in the previous sections, it is well documented that insufficient sleep can have detrimental effects on health, well-being and productivity, and hence on the economy and wider society. In addition, it appears that recent societal changes have exacerbated at least some of the factors contributing to inadequate sleep, thereby accentuating these detrimental effects. Against this background, the aim of this study is to assess the wider economic and societal effects of insufficient sleep. In order to raise awareness of the scale of insufficient sleep as a public-health issue, we quantify the impacts across a number of OECD countries and make recommendations for potential solutions to tackle the problem. The contribution of this study towards the debate can be summarised as follows.
10 Note that this prevalence estimate is substantially higher that those reported in older prevalence studies, as described by Punjabi (2008). 11 Park, M (2009) Why we’re sleeping less. CNN, 6 March 2009. As of 11 September 2016: http://www.cnn.com/2009/HEALTH/03/04/sleep.stress.economy/

RAND Europe
6
Firstly, it is important to understand the factors associated with insufficient sleep in more detail, and hence the study begins with an analysis of factors associated with (short) sleep duration at different levels. These include the individual level (e.g. lifestyle factors such as smoking or alcohol consumption) as well as workplace-related factors (e.g. psychosocial environment). Previous studies have empirically assessed factors associated with sleep duration, but due to lack of data or sufficient sample size, were restricted to focusing on specific factors only. We use a novel large employer-employee dataset which includes a huge variety of variables that may jointly determine sleep duration, enabling us to examine the relative contribution of each single variable in more detail.
Secondly, insufficient sleep is associated with many negative health outcomes and thus elevated mortality risks. This study reviews the literature analysing the link between insufficient sleep and mortality risk and aims to synthesise and evaluate existing empirical evidence using a meta-analytical approach. The contribution of the meta-analysis is to derive relative mortality risks related to short sleep duration. While a handful of meta-analyses already exist on the topic, our analysis pays specific attention to potential publication bias in the literature and aims to identify specific study characteristics that may explain the observed research outcomes, including for instance whether the geography of the study sample matters or whether the inclusion of certain lifestyle factors may affect the predicted mortality risk. In addition, we extend the scope of previous reviews by including the most recent publications in our analysis.
Thirdly, in order to assess the economic effects of insufficient sleep it is important to quantify the productivity effects related to sleep deprivation. In a previous study we estimated the average working time lost related to insufficient sleep and other health and lifestyle risk factors (Hafner et al., 2015). For the purposes of this study, we revisit our previous analysis using more recent data and a much larger data sample based on a unique large linked employer-employee data set.
Finally, putting all these quantitative empirical estimates into context, we conduct a cross-country comparative analysis about the economic effects of insufficient sleep. In conceptualising these effects we follow a similar approach taken for the estimation of the costs of antimicrobial resistance (AMR) where we focussed mainly on the negative impacts on the labour supply in the economy (Taylor et al., 2014). In our analytical approach, insufficient sleep affects the supply of effective labour through three mortality and productivity related mechanisms:
1) Increased mortality: deaths attributable to insufficient sleep reduce the size of the working-age population. This affects negatively the total number of people working in the economy and hence may affect overall economic output.
2) Increased morbidity or impaired cognitive performance: prolonged periods of sickness and absence of work or reduced cognitive performance while at work (e.g. presenteeism) as a result of insufficient sleep lead to reductions in labour efficiency (or productivity). For instance, people sleeping less than the recommended hours of sleep are more likely to catch the flu or are more likely to have an accident at work leading to a higher level of sickness absence days compared to people sleeping enough.12
12 http://www.webmd.com/sleep-disorders/features/immune-system-lack-of-sleep#1

Why sleep matters – the economic costs of insufficient
7
3) Negative effect on adolescents’ skill accumulation: suboptimal school performance in younger years due to sleep deprivation hinders an individuals’ skill development, creating differences between individuals in terms of their skillset. There is some evidence that, for instance, a change in school starting times by one hour could improve strongly school performance and the educational achievements of adolescents, with associated gains in lifetime earnings.
In essence, in order to achieve these objectives, the study aims to answer the following research questions:
1) What factors are associated with sleep duration?
2) What is the association between insufficient sleep and all-cause mortality?
3) What are the economic effects of insufficient sleep? What is the association between insufficient sleep and working time lost? How much higher would GDP be if short sleepers increased their amount of sleep?
In answering these questions, the study contributes to the existing academic literature and provides new quantitative estimates of the potential economic effects of insufficient sleep. It is important to stress that the focus of this study is on sleep quantity. However, there is also evidence that suggests that sleep quality, rather than sleep quantity matters (see e.g. Lauderdale et al., 2008). Obviously, insufficient sleep and poor sleep quality are correlated, but it is important to stress that they are regarded as distinct constructs. For instance, individuals may report poor sleep quality but sleep the recommended hours and vice versa, others may report no sleep problems but sleep less than the recommended hours. We acknowledge the potential adverse effects of poor sleep quality alongside short sleep duration but due to the majority of currently available evidence on the negative effects of short sleep duration on various outcomes, the focus of this study is on sleep quantity.
1.4. Research approach
In order to address the research objectives and questions formulated above, our research incorporates three methodological strands:
1) Literature review: we review the available literature in order to collect available evidence about the relation between sleep and wider health outcomes, mortality, and productivity, as well as information on factors associated with sleep duration. For the analysis in Chapter 3, we systematically review the literature on the link between sleep duration and (all-cause) mortality.
2) Econometric modelling: we use multivariate regression techniques to investigate the factors associated with insufficient sleep, and the associations between short sleep duration and mortality and workplace productivity. The econometric work conducted in this study serves two purposes. Firstly, it contributes to the existing academic literature by using new data to test existing research hypotheses. Secondly, it provides important parameter estimates that feed into macro-economic model to assess the economic cost of insufficient sleep.
3) Macro-economic model development and calibration: we develop a bespoke macro-economic model that enables us to assess the economic effects of sleep deprivation drawing on parameter estimates generated in the empirical analysis of this study, as well as data for calibration purposes from different other relevant databases. In essence, the economic model used in our study is an

RAND Europe
8
overlapping generations (OLG) model. OLG models by definition assume that the modelled economy is represented by people of different age cohorts. This approach is necessary to capture effects of insufficient sleep through various means and different points in individuals’ lifecycles. In a nutshell, the economy in our model has three sectors – households, firms, and government – which continuously interact with the markets, just as in reality. Specifically, firms – representing the production sector – hire labour supplied by households to create output, paying wages in exchange for labour and interest rate as a cost of capital. In addition, the government collects income taxes from individuals and subsequently provides them with retirement benefits. We outline the specifics of the model in more detail in Chapter 4.
1.5. Structure of this report
Chapter 2 outlines the empirical approach taken to analyse the factors associated with sleep duration. Chapter 3 outlines the results from the meta-analysis to assess the associations between short sleep duration and mortality. Chapter 4 outlines the analytical approach taken to estimate the economic costs of insufficient sleep, including our macro-economic modelling framework. Chapter 5 concludes and provides recommendations for different target audiences on how to improve sleep outcomes.

9
2. Factors associated with insufficient sleep duration
This chapter examines the factors associated with sleep duration. Generally, there exists a large empirical literature that investigates the correlates of sleep duration and the evidence so far suggests that low socioeconomic status, psychosocial stress factors such as unrealistic job demands, electronic media use, physical and mental health comorbidities – as well as job and lifestyle factors such as shift work and excess consumption of alcohol or smoking – may cause insufficient sleep. However, one shortcoming of the existing empirical evidence is that the data used for the analyses are limited in scope. That is, some studies only look at the effects of psychosocial risks or other workplace factors, while other studies only look at health factors separately. The strength of the empirical analysis presented here is that it bridges this gap by exploiting information from a large employer-employee survey. This data enables us to comprehensively investigate various different factors simultaneously, filtering out the effect of each one separately, while holding other factors constant. In what follows we describe in more detail the related literature and the empirical approach adopted for the analysis, and report the corresponding findings.
2.1. Factors associated with sleep duration - a glance at the literature
The existing studies use different data sources covering varying geographic regions (e.g. the U.S., Asia, Australia or Europe). Magee et al. (2009), for instance, explored the determinants of sleep duration among a cohort of Australian adults aged 18 to 64 years. Using multivariate statistical analysis, the study found that short sleep was associated with longer working hours, lower education levels, being single rather than married, being a current cigarette smoker, alcohol consumption, obesity and depression/anxiety. The study also suggested that long sleep, by contrast, was associated with chronic health conditions such as cancer or cardiovascular problems, and was a consequence of these, rather than a cause.
Krueger and Friedman (2009) looked at the U.S. population from the 2004–2007 National Health Survey and found that demographic, socio-economic and health factors were all determinants of sleep duration. For instance, they found that factors such as low levels of education and cardiovascular disease were associated with both short and long sleep (e.g. more than nine hours). Short sleep was associated with higher age, smoking, alcohol consumption, being overweight or obese, as well as having young children. Stamatakis et al. (2007) came to a similar conclusion, also using U.S. data. Using Finnish data, Kronholm et al. (2006) reported that gender, as well as marital status, occupation and physical activity, were also major drivers of short sleep duration. According to the study, men are more likely to be short-sleepers than women.

Why sleep matters – the economic costs of insufficient
10
Looking at workplace-related factors, Nishitani et al. (2013) found that job-stress factors, such as quantitative workload and interpersonal conflict, lead to short sleep duration among male Japanese manufacturing workers. Psychosocial factors such as tension/anxiety and depressive symptoms have also been associated with reduced sleep. In addition, studies by Park et al. (2013) and Heo et al. (2013) revealed that organisational factors related to discrimination, work–life balance, high work demands and job insecurity were associated with an increased prevalence of sleep problems. Shift work was also found to increase the risk of sleep disturbances. In summary, demographic, socio-economic, health and workplace-related factors have all been found to be significant determinants of short sleep duration and sleep problems
2.2. Using large-scale employer-employee data to analyse the factors associated with insufficient sleep duration
One shortcoming of existing empirical studies is that because of data limitations (e.g. sample size and scope of measures included) they are unable to investigate and examine the relative contribution of each of these different factors (i.e. health vs. psychosocial) separately. Our empirical analysis uses a large employer-employee dataset which includes all of these factors in one single dataset, and hence allows us to control for many different potential factors simultaneously in our regression analysis.
Our empirical analysis is based on data acquired from the ‘Britain’s Healthiest Workplace’ (BHW) competition. Vitality Health, the health insurer, established the competition in order to find the UK’s outstanding organisations with regard to best practice and innovative approaches to workplace health and well-being. The BHW competition represents one of the largest UK national studies, giving employers valuable insights into the well-being of their employees. All companies in Britain are eligible and are invited to participate in the competition. After registering, all participating companies return a corporate health assessment including general company characteristics (such as the size of the organization and the industry it operates in) as well as information on the organisation’s approach to health promotion and well-being interventions. Subsequently, employees are invited to respond to an employee health-assessment survey which collects information on lifestyle, behavioural and clinical risk factors (including weight, diet, exercise, smoking, alcohol intake, stress, cholesterol, blood-glucose levels and blood pressure) as well as how often people attend health screenings to monitor and understand their health. It also includes self-reported measures on sleep. For the purpose of this analysis, we use the 2015 and 2016 waves
of the BHW survey, including a total of more than 62,000 UK employees.13
The data collected from the BHW represent a unique research resource. Collecting data from employers and employees allows both organisational and individual dimensions to be explored, while the scope of the survey, covering a wide range of health, well-being and management indicators, is also unique.
It is, however, important to address some limitations of the survey data regarding the representativeness of the data compared to the total population of employers and employees. Firstly, response rates to the 13 Note that a 2014 survey also exists but the questionnaires applied are more homogenous on some of the key questions used in this analysis for the recent waves, so we restrict our analysis to the 2015 and 2016 survey data.
RAND Europe
11
survey are variable, and for some participating companies are low – although, having said that, response rates on their own are a poor indicator of bias in surveys (Groves and Peytcheva, 2008) and BHW
response rates are typical for online surveys.14 In addition, we carried out survey-sensitivity analysis, which showed no evidence of a relationship between survey response rate and rankings of company well-being, which would be a marker of nonresponse bias if present. Secondly, comparing the profile of respondents with the profile of employees within participating companies we generally find a small over-representation of middle-income and middle-age employees (Hafner et al., 2015). However, all age, gender and income groups are represented across participating companies, and we adjust for age, gender, income and other potentially important factors in our regression analysis. Thirdly, there are also some differences between the sample of companies participating in the survey (participation is voluntary) and all companies in the UK. People working in financial and insurance activities are particularly over-represented and respondents working in companies with 500–2,499 employees are also notably over-represented. We account for the sampling approach in the analysis controlling for company fixed-effects which should account for company factors related to selection into the survey (e.g. company size).
In conclusion, our analysis accounts for the survey sampling approach and the possible over-representation of certain groups. We have explored the nature and extent of possible biases in this survey and acknowledge that these may limit attempts to fully generalize our findings to the full population of companies. Nevertheless, the representation of a broad range of workplaces in our sample suggests that findings are relevant for the population of employees.
2.3. Measuring and modelling the factors associated with sleep duration
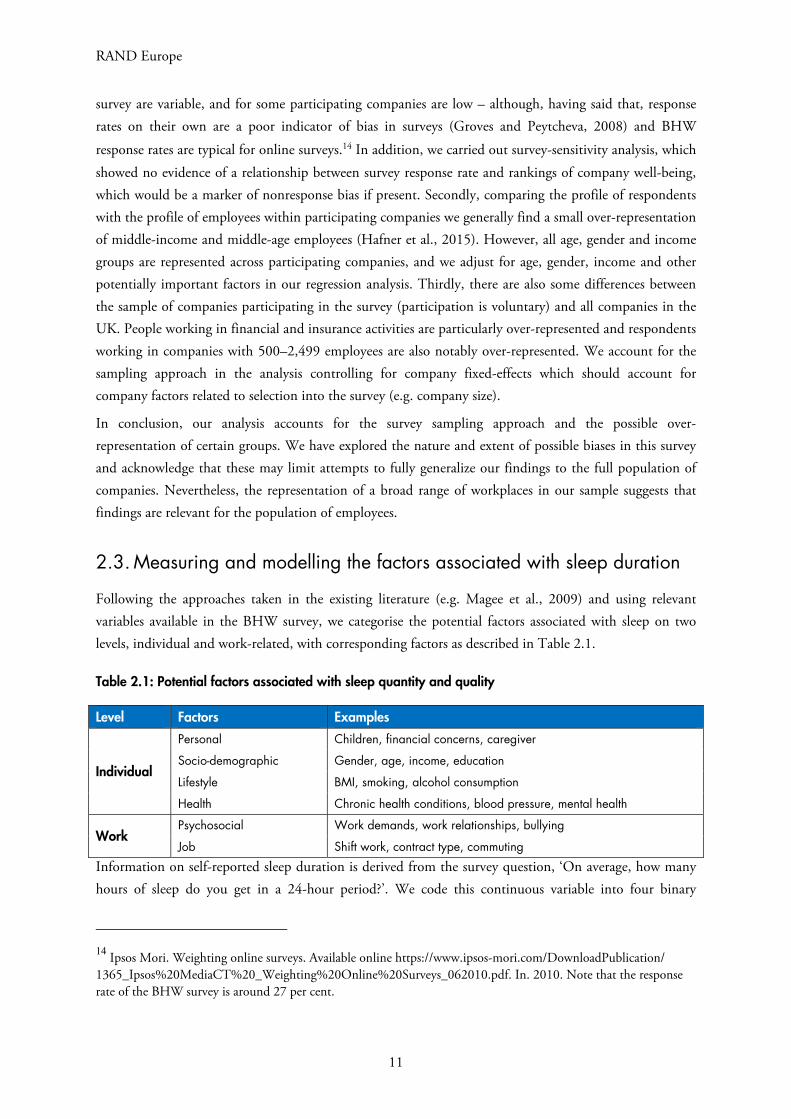
Following the approaches taken in the existing literature (e.g. Magee et al., 2009) and using relevant variables available in the BHW survey, we categorise the potential factors associated with sleep on two levels, individual and work-related, with corresponding factors as described in Table 2.1.
Table 2.1: Potential factors associated with sleep quantity and quality
Level Factors Examples
Individual
Personal Children, financial concerns, caregiver
Socio-demographic Gender, age, income, education
Lifestyle BMI, smoking, alcohol consumption
Health Chronic health conditions, blood pressure, mental health
Work Psychosocial Work demands, work relationships, bullying
Job Shift work, contract type, commuting
Information on self-reported sleep duration is derived from the survey question, ‘On average, how many hours of sleep do you get in a 24-hour period?’. We code this continuous variable into four binary
14 Ipsos Mori. Weighting online surveys. Available online https://www.ipsos-mori.com/DownloadPublication/ 1365_Ipsos%20MediaCT%20_Weighting%20Online%20Surveys_062010.pdf. In. 2010. Note that the response rate of the BHW survey is around 27 per cent.

Why sleep matters – the economic costs of insufficient
12
categories of sleep duration: (a) < 6 hours; (b) 6 to 7 hours; (c) 7 to 9 hours, defined as the recommended range of sleep; and (d) ≥ 9 hours.
We begin the empirical analysis by reporting the general descriptive statistics of the BHW sample of employees, including the total number of observations and corresponding proportions among the study sample for the different sleep-duration measures and potential factors associated with sleep. We primarily apply ordinary least squares (OLS) regression analysis to explore associations between sleep duration and its relation to factors such as work demands, health problems and lifestyle factors. In general terms, a linear regression model is used to describe the relation between two or more variables in a set of data points with a line. Hence, OLS is a statistical approach to fitting a model to the observed data by finding the function which most closely approximates (or best fits) the data (Wooldridge, 2015). In technical terms, the OLS method is used to fit a straight line through a set of data-points so that the sum of the squared vertical distances (called residuals) from the actual data-points is minimised. Therefore, the best fit can be represented by the line that minimises the total distance between the actual data points and the predicted values.
The predictor variables included in the regression analysis are defined in Tables 2.2 to 2.5 below. In general, most of the predictor variables are included in the model as binary indicators, some of which have been constructed from categorical variables. For interpretation purposes this means that they should be interpreted relative to an omitted base category (e.g. for the variable financial concerns the omitted category represents a worker who does not report currently any financial concerns).
All analyses in this study are conducted with Stata 14 and all statistics are evaluated at the 5 per cent significance levels. For statistical significance we expect the p-value to be less than the significance level (α = 0.05). The concept of statistical significance is generally used to determine whether a null hypothesis is to be rejected or retained. In this analysis, the null hypothesis is the default statement that the true effect is zero. P-values represent the probability of observing an effect given that the null hypothesis is true (there is no real effect), whereas the null hypothesis is rejected if the p-value is less than the significance level. The significance level therefore represents the probability of rejecting the null hypothesis given that
it is true (DeGroot & Schervish, 2002).15
For the sleep duration outcome variables which are binary indicators (e.g. less than six hours or between
six to seven hours), using OLS leads automatically to the linear probability model (LPM).16 One issue which may arise with LPM is that it might predict values for the probability of being a short sleeper which lie outside the interval between 0 and 1. A Probit or Logit response estimator takes this into account but assumes a (strong) assumption about the error terms using maximum-likelihood techniques. However, as long as the relative proportion of LPM predicted values that fall outside the unit interval is small, the LPM estimator is expected to be unbiased (Angrist and Pischke, 2010). The LPM is our preferred
15 Note that we perform also Bonferroni adjustments to α to prevent type 1 errors associated with multiple hypothesis testing. 16 See Angrist and Pischke (2010) on a discussion about the advantages of using LPM instead of Logit and Probit binary response models.

RAND Europe
13
estimator, as for interpretational practicality OLS directly delivers the marginal effects of our variables of
interest without the need for conversion of odds ratios into meaningful metrics.17
2.4. Descriptive characteristics of the study sample
The pooled BHW 2015–2016 survey includes 62,366 observations in total. Table 2.2 highlights the prevalence of personal and socio-demographic factors among the study sample. Almost one-quarter of respondents report having financial concerns at present, while about one-quarter also report having dependent children under the age of 18 living in the same household. In addition, 2.6 per cent report that they provide unpaid care to a family member or other close relative or friend. About half (51 per cent) of employees in the sample are male. Overall, the study population seems to be relatively well educated, with more than half the sample reporting having at least an undergraduate degree. Almost 44 per cent of the study population earns between £20,000 and £40,000 per year, with around 10 per cent earning £80,000 or more per year. In terms of age, the majority of the study sample is middle-aged, between 35 and 55, which is what can be expected from a working population sample. About 70 per cent of the study sample reports being either married or living in a civil partnership.
Considering lifestyle factors, Table 2.3 reveals that more than 50 per cent of the study sample has a BMI higher than 25 (indicating being overweight), of whom around 16 per cent are considered as obese (BMI larger than 30). Around 10 per cent of the sample report being current cigarette smokers and almost 30 per cent report consuming more than two sugared hot or cold beverages per day, which is above the recommended intake. With regard to physical activity and alcohol consumption, about one-third of the
study sample report performing less than 120 minutes18 of physical activity per week and about one-quarter report that they regularly consume alcohol above the recommended maximum number units per day.
With regard to the prevalence of certain physical- and mental-health factors, around 4.6 per cent of the study obtains a Kessler score above 13, which is considered as indicating a risk of having medium to high mental-health problems. Almost 26 per cent of the sample report having a high blood pressure, although only 2.6 per cent report high cholesterol levels. Survey respondents report on average almost two musculoskeletal (e.g. back or joint pain) conditions and around a half report chronic health condition (e.g. asthma, cancer, stroke, cardiovascular disease) that has been diagnosed within the last 12 months.
17 For sensitivity analysis we also applied logistic regression models where the outcome variable is binary. The findings are identical to the models estimated with LPM. 18 Note that guidelines from the World Health Organisation (WHO) suggest a minimum of 150 mins per week.

Why sleep matters – the economic costs of insufficient
14
Table 2.2: Personal and socio-demographic factor variables – BHW employees (n = 62,366)
Variables Mean SD Description Personal factors Financial concerns 0.241 (0.428) Having financial concerns at present (1 yes; 0 no).
Unpaid care 0.026 (0.16) Giving unpaid care to family members or friends at present (1 yes; 0 no).
Children 0.26 (0.439) Dependent child below age 18 living in household (1 yes; 0 no).
Socio-demographic factors
Gender: male 0.515 (0.5) Gender: male (1 yes; 0 no).
Education: low skilled 0.106 (0.22) Binary indicators of highest level of education achieved (1 yes; 0 no). Low skilled (base category): no formal education; primary education, 1st cycle secondary. Medium skilled: 2nd cycle secondary and post-secondary. High skilled: undergraduate, postgraduate.
Education: medium skilled 0.329 (0.47)
Education: high skilled 0.565 (0.496)
Income: ≤ £19,999 0.147 (0.14)
Binary indicators of annual salary (1 yes; 0 no).
Income: £20,000 to £39,999 0.439 (0.496)
Income: £40,000 to £59,999 0.227 (0.419)
Income: £60,000 to £79,999 0.089 (0.285)
Income: £80,000 to £119,999 0.062 (0.241)
Income: ≥ £120,000 0.036 (0.187)
Age: <20 0.006 (0.173)
Binary indicators of age cohort (1 yes; 0 no). Age: 20 to 35 0.388 (0.487)
Age: 36 to 55 0.508 (0.5)
Age: 56-70 0.098 (0.297)
Marital status: married 0.501 (0.566)
Binary indicators of marital status (1 yes; 0 no).
Marital status: cohabiting 0.195 (0.397)
Marital status: separated 0.032 (0.139)
Marital status: divorced 0.042 (0.201)
Marital status: widowed 0.005 (0.068)
Marital status: never married 0.225 (0.418)
Notes: based on 2015–2016 pooled BHW employee survey data. Standard deviation in parentheses.

RAND Europe
15
Table 2.3: Lifestyle and health factor variables – BHW employees (n = 62,366)
Variables Mean SD Description
Lifestyle factors
BMI: underweight 0.016 (0.126) BMI defined as: mass / height^2. Coded into binary indicators: BMI underweight (<18.5); BMI overweight (>25-30); BMI obese (>30). Base category: BMI in the healthy range considered as (18.5–25).
BMI: overweight 0.343 (0.475)
BMI: obese 0.166 (0.372)
Alcohol: not healthy range 0.247 (0.432) More than three to four daily units for men, more than two to three for women.
Smoking: in the past 0.266 (0.442) Smoking cigarettes; coded as previous smoker (1 yes; 0 no) or current smoker (1 yes; 0 no). Base category: never smoker.
Smoking: currently 0.104 (0.306)
Sugary drinks: not healthy range
0.305 (0.461) More than two sugared hot or cold beverages (including non-diet soda, sugared tea, coffee or hot chocolate) per day (1 yes; 0 no).
Physical activity: low 0.3 (0.458) Less than 120 mins per week (1 yes; 0 no). Base category: high activity (150 mins and more).
Physical activity: medium 0.05 (0.218) Between 120 mins and 150 mins per week (1 yes; 0 no). Base category: high activity (150 mins and more).
Health factors
Kessler score: mental health risk
0.046 (0.21) Kessler score above 13 on a total score of 24 (1 yes; 0 no).
MSK: total number of conditions
1.972 (1.759) Number of reported musculoskeletal health problems during the last 12 months.
Chronic: total number of conditions
0.592 (1.013) Number of GP diagnosed chronic health conditions during the last 12 months.
Blood pressure: high 0.259 (0.438) High risk: systolic or diastolic blood pressure above 120/80mmHg (1 yes; 0 no).
Cholesterol: high 0.026 (0.16) Cholesterol level 6.1mmol/l or higher (1 yes; 0 no).
Glucose: high 0.011 (0.105) Non-fasting glucose level 11.1mmol/l or higher (1 yes; 0 no).
Notes: based on 2015–2016 pooled BHW employee survey data
Table 2.4 reports the sample averages for psychosocial and job-related factors. The psychosocial risk factors are measured by the UK Health & Safety Executive (HSE) Management Standards (MS) Indicator
Tool.19 In the BHW sample, almost one-third of respondents report feeling that they have no choice in deciding what to do at work, while about one-third also report a lack of consultation at the workplace. About 1 per cent of respondents have been subject to bullying at the workplace and almost 15 per cent report being subjected to unrealistic time pressures at work. In addition, about 14 per cent report working irregular hours, including for instance shift work.
19 http://www.hse.gov.uk/stress/standards/notesindicatortool.htm.

Why sleep matters – the economic costs of insufficient
16
Almost half the employees in the study sample report having the opportunity to set the times they are at work in a flexible manner or the ability to work from home if needed. In addition, around 7 per cent report currently having a non-permanent employment relationship (e.g. fixed-term or zero-hour contract). Over one-third of the sample report commuting daily between 30 minutes to an hour each way, with about 15 per cent reporting a total commute of two hours or more daily.
Table 2.4: Psychosocial and job factor variables – BHW employees (n = 62,366)
Variables Mean SD Description
Psychosocial Environment HSE: choice 0.278 (0.448) Choice in deciding what I do at work (5 Always to 1
Never). Coded as continuous binary indicator (1 yes if 'disagree/almost always' or 'strongly agree/always; 0 no).
HSE: bullying 0.012 (0.109) Subject to bullying at work (5 Always to 1 Never). Coded as continuous binary indicator (1 yes if 'disagree/almost always' or 'strongly agree/always’; 0 no).
HSE: unrealistic demands 0.153 (0.36) Unrealistic time pressures (5 Always to 1 Never). Coded as continuous binary indicator (1 yes if 'disagree/almost always' or 'strongly agree/always; 0 no).
HSE: lack of peer support 0.069 (0.253) Receive the respect at work I deserve from my colleagues (5 Strongly disagree to 1 Strongly Agree). Coded as continuous binary indicator (1 yes if 'disagree/almost always' or 'strongly agree/always; 0 no).
HSE: lack of change consultation 0.303 (0.459) Staff are always consulted about change at work (5 Strongly disagree to 1 Strongly Agree). Coded as continuous binary indicator (1 yes if 'disagree/almost always' or 'strongly agree/always; 0 no).
HSE: strained relationships 0.153 (0.36) Relationships at work are strained (5 Strongly disagree to 1 Strongly Agree). Coded as continuous binary indicator (1 yes if 'disagree/almost always' or 'strongly agree/always; 0 no).
Job factors
Irregular hours 0.133 (0.339) Working irregular hours, e.g. shift work (1 yes; 0 no).
Home/flexitime 0.504 (0.5) Able to work from home or flexitime (1 yes; 0 no).
Working hours 36.187 (6.537) Contractual working hours (max 48 hours).
Non-permanent 0.073 (0.26) Non-permanent employment contract, e.g. zero-hour contract, fixed-term contract (1 yes; 0 no).
Commuting: 15 to 30 mins 0.312 (0.463) Travel time to work in minutes one-way: 15 to 30 mins (1 yes; 0 no).
Commuting: 30 to 60 mins 0.364 (0.481) Travel time to work in minutes one-way: 30 to 60 mins (1 yes; 0 no).
Commuting: ≥ 60 mins 0.142 (0.349) Travel time to work in minutes one-way: ≥ 60 mins (1 yes; 0 no).
Notes: based on 2015–2016 pooled BHW employee survey data. Standard deviation in parentheses.

RAND Europe
17
Table 2.5 shows that the average hours of sleep duration reported is around seven hours. Almost a third (29 per cent) of employees report less than seven hours of sleep. The vast majority (more than 70 per cent) sleeps between seven and nine hours, while only a small proportion (around 1 per cent) sleeps more than nine hours.
Table 2.5: Sleep duration and quality variables – BHW employees (n = 62,366)
Variables Mean SD Description
Sleep quantity
Average sleep length (hours) 7.034 (1.074) Based on question about the average hours of sleep in 24 hours (self-reported). We coded the sleep duration variable into 4 binary indicators: (1) ≤ 6 hours; (2) 6 to 7 hours; (3) 7 to 9 hours; (4) ≥ 9 hours. 7 to 9 hours considered as healthy number of hours of sleep.
< 6 hours 0.049 (0.215)
6 to 7 hours 0.24 (0.427)
7 to 9 hours 0.702 (0.457)
≥ 9 hours 0.009 (0.093)
Notes: based on 2015–2016 pooled BHW employee survey data. Standard deviation in parentheses.
In what follows we investigate the relation between sleep duration and the different factors outlined above in more detail by presenting the results from a multivariate regression analysis.
2.5. Empirical findings from the regression analysis
Columns 1 to 4 of Table 2.6 report the results from a multivariate OLS regression model using different measures of sleep duration as outcome variables. As reported in Table 2.5, these sleep duration outcome variables include the self-reported average hours of sleep per day and three binary indicator variables of
sleep duration (less than six hours; six to seven hours; more than nine hours).20 The regression models include a set of predictor variables related to individual factors such as lifestyle, health, personal and socio-demographic factors, as well as work-related factors such as the psychosocial environment at work and job-related factors. Note that for ease of presentation, Panels A to C of Table 2.6 below report the findings separately for the different associated factors of sleep duration, although these predictors were all included simultaneously in the regression model. Note that Bonferroni adjustments to α are performed to prevent type 1 errors associated with multiple tests, which means that the parameters are tested against an
α of 0.001 (2-tailed) in all of the models.21 Note that in Table 2.6, the entries highlighted in black pass significance test after Bonferroni adjustment. The results of the empirical analysis are explained in more detail in what follows.
20 Note that seven to nine hours has been omitted for ease of presentation, but the coefficients presented in Table 2.6 and the columns 2 to 4 level each other out across the four binary sleep duration indicators (e.g. the sum of the coefficients is zero). 21 Calculated as 0.5/50 as we include 50 predictor variables in the model.

Why sleep matters – the economic costs of insufficient
18
Table 2.6 Panel A: Factors associated with sleep duration (lifestyle and health)
(1) (2) (3) (4)
Panel A Sleep duration
Outcome variable: hours < 6 hours 6 to 7 hours > 9 hours
Lifestyle factors
BMI: underweight -0.04651 0.01515 0.00761 0.00050
(0.15712) (0.02772)* (0.55730) (0.88762)
BMI: overweight -0.04256 0.00432 0.02197 -0.00051
(0.00001)** (0.03287)* (0.00000)** (0.48369)
BMI: obese -0.11674 0.01941 0.04347 -0.00054
(0.00000)** (0.00000)** (0.00000)** (0.58708)
Alcohol: not healthy range -0.02467 -0.00009 0.00201 -0.00153
(0.00202)* (0.96528) (0.58333) (0.04091)*
Smoking: in the past -0.02549 0.00040 0.00934 -0.00122
(0.01198)* (0.80932) (0.03865)* (0.06582)
Smoking: currently -0.08084 0.01594 0.02620 0.00123
(0.00005)** (0.00003)** (0.00034)** (0.42304)
Sugary drinks: not healthy range -0.05792 0.01221 0.01661 0.00178
(0.00000)** (0.00000)** (0.00004)** (0.02327)*
Physical activity: low -0.04487 0.00748 0.01926 0.00142
(0.00036)** (0.00023)** (0.00002)** (0.17432)
Physical activity: medium -0.01482 0.00074 0.01406 -0.00267
(0.37827) (0.84020) (0.06179) (0.03168)*
Health factors
Kessler score: mental health risk -0.28678 0.08677 0.04734 0.00714
(0.00000)** (0.00000)** (0.00000)** (0.00190)*
MSK: total number of conditions -0.04614 0.00526 0.01241 -0.00100
(0.00000)** (0.00000)** (0.00000)** (0.00010)**
Chronic: total number of conditions -0.01754 0.00731 0.00389 0.00176
(0.00040)** (0.00000)** (0.05426) (0.00035)**
Blood pressure: High -0.00761 0.00400 0.00784 0.00146
(0.46582) (0.05403) (0.03972)* (0.12196)
Cholesterol: High -0.03581 0.02095 -0.00092 0.00286
(0.22472) (0.00120)* (0.93768) (0.29323)
Glucose: High -0.08216 0.01955 0.03956 0.00164
(0.09039) (0.08487) (0.04360)* (0.72654)
Notes: p-values in parentheses: ** p<0.001, * p<0.05. Entries highlighted in black pass significance test after Bonferroni adjustment. Regressions clustered for companies (company_id). N = 62,366. Columns 1 to 4 report the results from an OLS regression with average self-reported sleep hours (out of 24 hours) and binary coded indicators of sleep duration as outcome variable. More information about the omitted categories for the binary predictor variables can be foun in notes of panel C.

RAND Europe
19
2.5.1. Lifestyle and health factors
All else equal, the lifestyle and health factors found to be statistically significantly associated with sleep duration are BMI, smoking, consumption of sugary drinks, lack of physical activity, mental health, musculoskeletal and chronic health conditions. The key findings are summarised below.
Lifestyle factors
1) BMI overweight: respondents with a BMI considered as overweight sleep on average about 2.5minutes (0.0425 hours) less per day than respondents with a normal BMI and are more likely to be short sleepers (6 to 7 hours).
2) BMI obese: respondents with a BMI considered as obese sleep on average about 7 minutes (0.116 hours) less per day than respondents with a normal BMI and are more likely to be short sleepers (< 6 hours and 6 to 7 hours).
3) Smoking: current smokers sleep on average 5 minutes (0.08 hours) less per day than never smokers and are more likely to be short sleepers (< 6 hours and 6 to 7 hours).
4) Sugary drinks: respondents consuming more than 2 sugary drinks per day sleep on average 3.4 minutes (0.057 hours) less per day than respondents with less consumption of sugary drinks and are more likely to be short sleepers (< 6 hours and 6 to 7 hours).
5) Physical activity: respondents performing less than 120 minutes of physical activity per week sleep on average about 2.6 minutes (0.044 hours) less per day than respondents reporting to do more than 150 mins of physical activity per week and are more likely to be short sleepers (< 6 hours and 6 to 7 hours).
Health factors
1) Mental health: respondents with medium to high risk of mental-health problems sleep on average 17.2 minutes (0.286 hours) less per day than respondents with low risk of mental-health issues and are more likely to be short sleepers (< 6 hours and 6 to 7 hours).
2) Musculoskeletal: any additional musculoskeletal condition is associated with about 2.7 minutes (0.046 hours) less sleep per day and an increased probability of being a short sleeper (< 6 hours and 6 to 7 hours).
3) Chronic health conditions: any additional chronic health condition is associated with about 1 minute (0.0175 hours) less sleep per day and increases the probability of being either a short sleeper (< 6 hours) or long sleeper (> 9 hours).

Why sleep matters – the economic costs of insufficient
20
Table 2.6 (continued), Panel B: Factors associated with sleep duration (personal and socio-demographic)
(1) (2) (3) (4)
Panel B Sleep duration
Outcome variable: hours < 6 hours 6 to 7 hours > 9 hours
Personal factors
Financial concerns -0.16745 0.02417 0.05612 -0.00065 (0.00000)** (0.00000)** (0.00000)** (0.42423)
Unpaid care -0.08550 0.02655 0.02184 0.00292 (0.00068)** (0.00003)** (0.10106) (0.20210)
Children -0.07005 0.00638 0.02101 -0.00211 (0.00000)** (0.00324)* (0.00002)** (0.02149)*
Socio-demographic factors Gender: Male -0.15117 0.00451 0.03911 -0.00459
(0.00000)** (0.01804)* (0.00000)** (0.00000)** Education: medium skilled 0.00708 -0.00554 -0.00441 -0.00216 (0.62180) (0.13454) (0.43757) (0.10508) Education: high skilled 0.02798 -0.01011 -0.01955 -0.00398
(0.07628) (0.00277)* (0.00166)* (0.00427)* Income: £20,000 - £39,999 -0.06617 -0.00203 0.00988 -0.00372
(0.00018)** (0.52617) (0.08537) (0.03733)* Income: £40,000 - £59,999 -0.08526 -0.00379 0.02205 -0.00260
(0.00001)** (0.38792) (0.00046)** (0.15367) Income: £60,000 - £79,999 -0.10086 -0.00376 0.03309 -0.00262
(0.00000)** (0.43714) (0.00020)** (0.22102) Income: £80,000 - £119,999 -0.13175 -0.00751 0.04785 -0.00174
(0.00000)** (0.19470) (0.00000)** (0.48265) Income: ≥ £120,000 -0.15534 -0.00390 0.06670 -0.00150
(0.00000)** (0.48489) (0.00000)** (0.54123) Age: 20 to 35 -0.35187 0.01723 0.05246 -0.02197
(0.00006)** (0.02956)* (0.00223)* (0.05030) Age: 36 to 55 -0.49334 0.03395 0.09248 -0.02215
(0.00000)** (0.00005)** (0.00000)** (0.05072) Age: 56 to 70 -0.55145 0.04305 0.11382 -0.02202
(0.00000)** (0.00000)** (0.00000)** (0.05423) Marital status: Cohabiting 0.01574 0.00099 -0.01236 -0.00119
(0.11907) (0.63110) (0.01225)* (0.19913) Marital status: Separated -0.10515 0.01984 0.02977 0.00174
(0.00014)** (0.00633)* (0.03023)* (0.58771) Marital status: Divorced -0.05836 0.02093 0.00516 0.00203
(0.01628)* (0.00017)** (0.61953) (0.34429) Marital status: Widowed -0.18321 0.04614 0.07328 0.00241
(0.01848)* (0.00118)* (0.01191)* (0.69350) Marital status: Never married -0.08022 0.01402 0.02275 0.00090 (0.00000)** (0.00000)** (0.00001)** (0.41295)

RAND Europe
21
Notes: p-values in parentheses: ** p<0.001, * p<0.05. Entries highlighted in black pass significance test after Bonferroni adjustment. Regressions clustered for companies (company_id). N = 62,366. Find information about the omitted categories for the binary predictor variables in notes of panel C. Lifestyle and health factors
It is important to highlight that we cannot determine the direction of causality with our pooled cross-sectional data, which is particularly relevant for certain lifestyle and health factors which have previously
been identified as risk factors for insufficient sleep.22
For instance, the association between a higher BMI and short sleep duration could be determined by shorter sleep leading to a higher calorie intake and hence higher BMI, rather than the reverse direction. In fact, many studies using prospective cohort longitudinal data over long time-periods have found that a lack of sleep is generally associated with a higher BMI (e.g. Taheri, 2006). Secondly, mental-health problems such as depression and anxiety may also be a cause of a lack of sleep, although, conversely, evidence also suggests that sleep problems and shorter sleep duration may be a cause, rather than a symptom, of mental-health issues such as depression and anxiety (e.g. Vgontzas et al., 2012).
2.5.2. Personal and socio-demographic factors
All else equal, the particular personal and socio-demographic factors showing a significant statistical association with sleep duration are financial concerns, provision of unpaid care, presence of children, gender, income, age, and marital status. The key findings are summarised below.
Personal factors
1) Financial concerns: respondents with financial concerns sleep on average about 10 minutes (0.16754 hours) less per day than respondents without concerns and are more likely to be short sleepers (< 6 hours and 6 to 7 hours).
2) Unpaid care: respondents who provide unpaid care to family members, close relatives or friends sleep on average about 5 minutes (0.0855 hours) less per day than respondents who do not provide unpaid care and are more likely to be short sleepers (< 6 hours).
3) Children: respondents with dependent children under age 18 sleep on average about 4.2 minutes (0.07 hours) less per day than respondents without dependent children and are more likely to be short sleepers (6 to 7 hours).
Socio-demographic factors
1) Gender: male respondents sleep on average about 9 minutes (0.15 hours) less per day than female respondents and are more likely to be short sleepers (6 to 7 hours).
2) Income: respondents with annual salaries above £20,000 sleep on average less than respondents earning less than £20,000 per year (between 4 to 10 minutes). They also tend to be more likely short sleepers (6 to 7 hours).
22 Note that it is possible with the BHW survey data to track about 7000 individuals over time but, with only two years, the longitudinal analysis is limited in this case.

Why sleep matters – the economic costs of insufficient
22
3) Age: respondents above age 20 sleep on average fewer hours per day than respondents below 20 years of age (between 21 to 33 minutes), with the group of 56 to 70 year old sleeping the fewest hours on average.
4) Marital status: respondents reporting being separated from their partner sleep on average 6.5 minutes (0.10 hours) less per day than respondents who report being married. Similarly, respondents who reported never being married sleep on average 4.8 minutes (0.08 hours) less than married respondents and are more likely to be short sleepers (< 6 hours and 6 to 7 hours). Furthermore, compared to married respondents, divorced respondents are more likely to be short sleepers (< 6 hours).
A similar note of caution applies to the causal link between some of the personal and socio-demographic factors, given the cross-sectional nature of the data. Firstly, people who sleep less may earn less due to lower productivity (Gibson & Shrader, 2014) and thus may have financial concerns. On the other hand, people with financial concerns may worry a lot and hence cannot sleep. Secondly, the findings suggest that people who are separated from their partner sleep less on average than married people. That is, due to a lack of sleep of one partner, the marriage or partnership may have ended, or people in a separation of a partnership may be anxious and worried and hence, sleep less on average. In general, the direction of causality cannot be determined with cross-sectional data, and thus caution is warranted when interpreting the associations presented in Table 2.6.
2.5.3. Psychosocial and job factors
All else equal, the work-related psychosocial and job factors showing a significant statistical association with sleep duration are lack of choice at work, unrealistic demands, lack of peer support, lack of change consultation and strained relationships at work, as well as working irregular hours and commuting. The findings can be summarised as follows:
Psychosocial factors
1) Lack of choice: respondents reporting a lack of choice in their daily work routine sleep on average 2.3 minutes (0.038 hours) less per day than respondents with more choice at work and are more likely to be short sleepers (6 to 7 hours).
2) Unrealistic time pressure: respondents reporting unrealistic time pressures sleep on average 8 minutes (0.132 hours) less per day than respondents with less time pressure and are more likely to be short sleepers (< 6 hours and 6 to 7 hours).
3) Lack of peer support: respondents reporting not receiving enough respect from their colleagues sleep on average 3.7 minutes (0.061 hours) less per day than respondents reporting more respect from colleagues.
4) Lack of change consultation: respondents reporting a lack of change consultation at their workplace sleep on average 2.6 minutes (0.044) hours less per day than respondents reporting greater change consultation at the workplace and are more likely to be short sleepers (< 6 hours).
5) Strained relationships: respondents reporting having strained relationships at work are more likely to be short sleepers (< 6 hours) than respondents without strained relationships.

RAND Europe
23
Table 2.6 (continued), Panel C: Factors associated with sleep duration (psychosocial and job)
(1) (2) (3) (4)
Panel C Sleep duration
Outcome variable: hours < 6 hours 6 to 7 hours > 9 hours
Psychosocial Environment
HSE: choice -0.03804 0.00691 0.01612 0.00121 (0.00056)** (0.00130)* (0.00019)** (0.20458)
HSE: bullying 0.06645 0.01255 -0.03130 0.00502 (0.20739) (0.32392) (0.06402) (0.20208)
HSE: unrealistic demands -0.13229 0.01831 0.04914 -0.00085 (0.00000)** (0.00000)** (0.00000)** (0.34298)
HSE: lack of peer support -0.06164 0.00976 0.01787 -0.00255 (0.00018)** (0.02344)* (0.00806)* (0.10722)
HSE: lack of change consultation -0.04445 0.00794 0.00365 0.00002 (0.00000)** (0.00040)** (0.27424) (0.98417)
HSE: strained relationships -0.03199 0.01005 0.00905 0.00083
(0.00761)* (0.00025)** (0.08268) (0.45764)
Job factors Irregular hours -0.04539 0.01658 0.03002 0.00590
(0.00000)** (0.00001)** (0.00000)** (0.00069)** Home/Flexitime 0.01788 -0.00284 -0.00713 -0.00025
(0.09762) (0.16672) (0.13936) (0.75182) Working hours -0.00115 0.00005 0.00095 -0.00010
(0.16428) (0.75030) (0.00701)* (0.18283) Non-permanent -0.04979 -0.00154 -0.01976 0.00150
(0.01088)* (0.58559) (0.00106)* (0.32988) Commuting: 15-30 mins -0.06639 0.00207 0.01744 -0.00176
(0.00000)** (0.41999) (0.00102)** (0.13582) Commuting: 30 to 60 mins -0.15334 0.00737 0.04466 -0.00285
(0.00000)** (0.00362)* (0.00000)** (0.01784)* Commuting: ≥ 60 mins -0.27702 0.02541 0.09382 -0.00312
(0.00000)** (0.00000)** (0.00000)** (0.01370)*
Notes: p-values in parentheses: ** p<0.001, * p<0.05. Entries highlighted in black pass significance test after Bonferroni adjustment. Regressions clustered for companies (company_id). N = 62,366. Columns 1 to 4 report the results from an OLS regression with average self-reported sleep hours (out of 24 hours) and binary coded indicators of sleep duration as outcome variable. Omitted categories for the binary predictor variables are: normal BMI, never smoker, healthy range of sugary drink intake (less than two per day), more than 150 mins of physical activity per week, low risk for mental health problems, normal blood pressure, normal cholesterol and glucose levels, no financial concerns, no unpaid care, no dependent children under 18, female, low skilled, < £20,000 income, < 20 years of age, married, no lack of choice, not subject to bullying, no unrealistic demands, no lack of peer support, no lack of consultation, no strained relationships, no irregular hours, no home/flexitime, permanent job, commuting less than 15 mins. The regression model includes company fixed effects (binary indicator variable for each firm) to control for company-related factors influencing sleep but also potential selection effects of firms into the survey. These include company-size category (small, medium, high) or industry, as well as the company culture and management commitment towards health and well-being

Why sleep matters – the economic costs of insufficient
24
Job factors
1) Irregular hours: respondents reporting working irregular hours (e.g. shift work) sleep on average 2.7 minutes (0.045 hours) less per day and are more likely to be short sleepers (< 6 hours and 6 to 7 hours).
2) Commuting: respondents who commute 15 to 30 minutes (one way) to work sleep on average 4 minutes (0.066 hours) less per day than respondents who commute less than 15 minutes to work (one way) and are also more likely to be short sleepers (6 to 7 hours). In addition, respondents who commute 30 to 60 minutes to work (one way) sleep on average 9.2 minutes (0.153 hours) less per day and are more likely to be short sleepers (6 to 7 hours). Heavy commuters travelling more than 60 minutes to work (one way) sleep on average 16.5 minutes (0.27 hours) less per day and are more likely to be short sleepers (< 6 hours and 6 to 7 hours).
In summary, the psychosocial environment at works influences sleep duration, as do irregular working hours. Again, as with the areas discussed above, the suggestion of a causal link needs to be interpreted with caution. For instance, strained relationships in the workplace may trigger sleep loss, although equally it may be a lack of sleep which leads to strained relationships at work, as a sleep-deprived employee may be more likely to exhibit irritability and reduced frustration tolerance when interacting with co-workers.
2.5.4. Magnitude of the estimated sleep duration effects
At first glance, the estimates of minutes of sleep lost due to the various factors outlined above may seem small. For instance, heavy commuters sleep on average 16.5 minutes per day less than people with very short commutes, which doesn’t sound like a great amount. However, it is important to note that the
estimates represent the effect on sleep duration of each single factor, holding all other factors constant.23
To put this into perspective, assume a middle-aged (35 to 55 years) male or female respondent who is overweight, has dependent children under 18 living in the same household, consumes more than two sugary drinks per day, commutes more than one hour (one way), has financial concerns, suffers unrealistic time pressures at work and takes less than 120 minutes of exercise per week. If one compares this respondent to a second male or female respondent of similar age (35 to 55) with normal weight, commuting less than 15 minutes (one way), with no financial concerns, within the healthy range of sugary-drink consumption, taking more than 150 minutes of exercise per week and not suffering from unrealistic time pressures, the first respondent would sleep on average 56 minutes or 0.94 hours (male) or 47 minutes or 0.79 hours (female) less per day on average. This aggregates to over 340 hours (male) or
286 hours (female) per year, and hence represents a significant amount of lost sleep.24
Furthermore, when looking at workplace related factors only, assume an employee who works irregular hours, commutes 30 to 60 minutes to work (one way) and is exposed to a set of different measures of
23 The multivariate regression analysis estimates the parameters of each single factor highlighted in Table 2.2 to 2.4 holding all other factors constant. Or in other words, it estimates the relative contribution of each factor separately, all else equal. 24 Assuming 365 days per year.

RAND Europe
25
psychosocial risks at the workplace, including a lack of choice, unrealistic time pressure, a lack of support from colleagues or a lack of consultation about change. Such an employee sleeps on average about 28.5 minutes per day less than a an employee that does not work irregular hours, commutes only up to 15 minutes per day and is not exposed to psychosocial risk factors at the workplace. This aggregates to over 173 hours per year, only because of workplace related factors. Even if we assume that these factors are related to working days only, assuming 250 working days, that would still amount to 118 hours per year.

26
3. Insufficient sleep and mortality
Many studies have investigated the relationship between sleep duration and different health outcomes, as well as mortality. This chapter revisits existing empirical evidence examining the link between insufficient sleep duration and mortality. A handful of systematic reviews and meta-analyses exist in this research topic, concluding that insufficient sleep elevates mortality risks. One drawback of many existing meta-analyses is that they do not take into account the potential selection bias that is potentially prevalent in the empirical literature. The aim of the analysis presented in this chapter is to determine the relative mortality risk of insufficient (termed ‘short’ here) sleep duration in the wider population, from existing research taking into account potential publication selection and study design heterogeneity. To that end, we apply the meta-regression approach established by Doucouliagos and Stanley (2009) and recently introduced into health research by scholars such as Costa-Font et al. (2013). In what follows we describe in more detail the related literature and the empirical approach adopted for this analysis, and report the corresponding findings.
3.1. Insufficient sleep and mortality – existing empirical evidence
Interest in the association between sleep duration and different health outcomes has increased rapidly over the last decade (Ferrie et al., 2011). Existing evidence suggests that the relationship between duration of sleep and health outcomes is U-shaped, highlighting that too little sleep (‘short sleep duration’) and too much sleep (‘long sleep duration’) are both associated with elevated risks of stroke, coronary heart disease, hypertension, obesity, type-2 diabetes and mortality (Cappuccio et al., 2011; Leng et al., 2015; Lu et al., 2013; Shan et al., 2015; Sperry et al., 2015; Wang et al., 2012).
The association between sleep duration and mortality has been explored in different countries and healthcare settings. Many studies have been conducted in Japan (e.g. Kojima et al., 2000; Tamakoshi & Ohno, 2004; Yoshitaka Tsubono et al., 1993), some in Taiwan and Singapore (Lan et al., 2007; Shankar et al., 2008), Israel (Burazeri et al., 2003), Sweden, Finland, the UK (Ferrie et al., 2007; Hublin et al., 2007; Mallon et al., 2002) and the U.S. (Gangwisch et al., 2007; Kripke et al., 2002; Patel et al., 2004). In addition, a handful of meta-analyses and systematic reviews found similar associations between sleep duration and mortality. For instance, Gallicchio and Kalesan (2009) report that the pooled relative risk (RR) for all-cause mortality for short sleep is 1.10 (95%CI = [1.06, 1.15]) and for long-sleep the RR for all-cause mortality is 1.23 (95%CI = [1.16, 1.30]). In other words, sleeping less than seven hours is associated with a 10 per cent higher mortality risk and sleeping more than the healthy range is associated with a 23 per cent higher mortality risk. Similar findings are reported in Cappuccio et al. (2010), who
RAND Europe
27
reviewed 16 studies and found that the RR for short sleep duration is 1.12 (95%CI = [1.06,1.18]), and that long sleep duration is also associated with greater risk of death (RR 1.30). Neither of the aforementioned meta-studies found publication bias.
While these studies generally found that the risk associations with health and mortality outcomes are similar at both ends of the sleep duration distribution, they find that the underlying mechanisms are different for short and long sleep. While sleep deprivation is generally associated with shift work, the 24/7 society, stress and lifestyle factors, long sleep is reported to be associated with underlying (unobserved or undiagnosed) chronic conditions such as heart disease or cancer or depression (Foley, 2004; Knutson & Turek, 2006). It is important to stress that our meta-analysis focuses only on short sleep, as a majority of studies finds a direct link between short sleep and mortality (e.g. as a result of obesity, or occupational or traffic accidents), whereas the link between long-sleep and mortality is more indirect (e.g. driven by underlying chronic health conditions) (Grandner et al., 2010).
The study by Grandner et al. (2010) outlined different pathways by which insufficient sleep may affect mortality, including:
1) Short sleep as direct effect: short sleep can cause mortality directly, for instance when a lack of sleep leads to fatal car accidents. As described in the studies above, epidemiological studies further support this pathway, while large-scale empirical studies adjusting for a variety of confounding factors (e.g. age) still find a statistically significant association between short sleep and mortality risk. However, other pathways are possible.
2) Short sleep is mediated or moderated by social and physiological factors: short sleep may cause social or physiological changes which may lead to elevated mortality risk. For instance, short sleep may lead to hormonal and behavioural changes (e.g. cardiovascular disease, changes in the immune system) which are linked to weight gain or reduced productivity and which then lead towards an increased mortality risk (e.g. Berkman et al., 2014).
3) Short sleep is associated with other factors linked to mortality: short sleep might be linked to factors causally linked to mortality. For instance, short sleep may be linked to age, which is independently associated with mortality. In addition, short sleep is associated with certain socio-demographic characteristics which are directly linked to mortality (e.g. poorer households are more likely to sleep less and are more likely to be living in neighbourhoods with elevated levels of violence). These effects should be taken into account using multivariate regression analysis which adjusts for such factors.
Which pathways dominate is still an open question and subject to future research (Grandner et al., 2010). In addition, previous studies have limitations that need to be taken into account when interpreting their findings. Firstly, existing studies often use different definitions for ‘short’ and ‘long’ sleep, making direct comparisons more difficult. Secondly, another source of study heterogeneity is the inclusion of different covariates which may take into account different pathways by which short sleep is associated with mortality risk. Some studies, for instance, do not adjust for age or gender, which can confound parameter estimates, while the inclusion of sociodemographic and socio-economic factors also varies between studies. Not adjusting for as many variables as possible may lead to the problem that the relationship between

Why sleep matters – the economic costs of insufficient
28
short sleep and mortality is driven by third (unobserved) factors and not by sleep duration itself. We take into account such study heterogeneity in our meta-regression analysis.
3.2. What is Meta-(regression) analysis?
Meta-analysis is a form of systematic review employing a range of statistical methods to synthesise and evaluate specific empirical literature (Glass, 1976). It helps to better understand the existing research findings on a given empirical effect of interest (Stanley and Doucouliagos, 2012). In contrast to narrative literature reviews, systematic reviews aim to include all research results by following an explicit and comprehensive search strategy which should be replicable by independent researchers. Meta-regression analysis (MRA) is a form of meta-analysis designed to investigate empirical research (Stanley, 2001).
In essence, MRA is designed to model the effects of observed econometric specifications and heterogeneity in study designs analysing a specific phenomenon (e.g. mortality effects of short sleep duration). The reported estimates of applied econometric studies are often just a small sub-set of a large number of different specification choices the researchers made during the research process. Often, there is no reliable way to know which model specification is the correct one. To that end, MRA can accommodate potential misspecification bias and correct for publication selection biases within applied statistical studies. For instance, the aforementioned studies look at mortality outcomes for individual sub-samples (e.g. all, elderly), apply a range of different datasets and most importantly, report a variety of relative mortality risk effect sizes. It is crucial to understand the extent to which these findings are driven by differences in study design and whether there is a ‘true’ underlying effect, once we control for the variance in study design factors and potential publication selection bias. Publication selection has been documented, and is a widely accepted fact in medical and social sciences, with a detrimental effect to published empirical findings (e.g. Feige, 1975; Begg and Berlin, 1988; Copas, 1999; Card and Krueger, 1995). In essence, publication bias arises when researchers, editors or reviewers use statistical significance in empirical estimates as a model selection criterion. That is, publication bias can arise when research findings are selected as a result of their statistical significance, leading to exaggerations of their size. Card and Krueger (1995) list reasons why publication bias may emerge:
1) Reviewers and editors of academic journals may be predisposed to accept only articles consistent with the predominant conventional view in the area of research;
2) Researchers may use the presence of conventionally expected results as a model-selection test;
3) Researchers, reviewers and editors may just have a natural predisposition to treat statistically significant results more favourably.
In summary, the real problem of publication selection is not its existence per se, but rather the potentially large biases it imposes on summaries of existing empirical research. The research landscape analysing the links between sleep duration and mortality is complex and characterised by large study heterogeneity. The multidimensional nature of this research makes clear inference more difficult. MRA is a tool to address these challenges and synthesise and evaluate research findings.

RAND Europe
29
As described, MRA is a powerful tool to evaluate existing empirical research, however, like every method, MRA has his limitations and caveats that should be considered when interpreting the findings of this study:
1) A meta-study depends on the data that feed into the analysis: as the data inputs into a MRA are estimates from existing empirical studies, such a meta-analysis cannot fully overcome the weakness of the literature it synthesises.
2) Every meta-analysis is subject to a degree of subjectivity: while systematic reviews in medical research often make subjective pre-judgments of what is ‘good’ and ‘bad’ research at the outset, empirical meta-analysis is more conclusive and aims to include all studies as long as they met some minimal inclusion/exclusion criteria. However, as empirical studies include a large number of estimates (e.g. including ‘straw’ or placebo regressions) there might be a discourse between (meta-)researchers on what estimates from each study should be included. One way to circumvent this caveat is to be as transparent as possible in the description of studies and estimates included.
3.3. MRA for the relationship between short sleep and all-cause mortality
We apply meta-regression analysis (MRA) to assess the relationship between short sleep and all-cause mortality (taking into account publication selection bias and study heterogeneity) and to identify the ‘genuine’ relative mortality risk of short sleep duration, net of potential publication selection. Two recent meta-analyses of the association between sleep duration and mortality have been published (Liu et al., 2016; Shen et al., 2016), although neither particularly emphasizes the potential bias caused by publication selection. By adding more recent prospective cohort studies our analysis complements the meta-analyses by Gallicchio and Kalesan (2009) and Cappuccio et al. (2011), neither of which detected selection bias in the combined literature investigating associations between short and long sleep duration and all-cause mortality.
3.3.1. The meta-sample: systematic review and data collection
We performed a systematic literature search up to October 2016 by searching on Pubmed, Embase, Scopus and Google Scholar. In addition to these search engines we also searched cross-references from identified studies. Keywords for the search included various combinations of ‘prospective’, ‘cohort’, ‘longitudinal’, ‘follow up’, ‘death’, ‘mortality’ and ‘sleep’. To be included in the review, a study needs to contain a new empirical estimate of the relationship between sleep duration and all-cause mortality. In
addition, the study needs to include a prospective design,25 the exposure of interest is short sleep duration and the categories of short sleep duration are provided and confidence intervals or standard errors or t-stats of estimates were provided. This process identified 36 relevant and comparable studies and in order to accommodate potential publication bias, standard errors of the estimates are required (see Egger et al., 1997; Stanley & Doucouliagos, 2012). The studies included in the sample mainly provided confidence
25 A prospective study design examines specific outcomes over a longer time period (e.g. mortality) and aims to relate the outcome to other factors such as lifestyle risks (e.g. smoking. BMI).

Why sleep matters – the economic costs of insufficient
30
intervals for the relevant estimates. We use the formula proposed by Cochrane Handbook to calculate the
standard errors for RR based on confidence intervals.26 The next step in the data collection process was to extract relevant estimates and information on different dimensions of the study, including for instance the year of the publication of the study, how it defines short sleep, the relative mortality risk for each short sleep category, whether the estimates in the study are adjusted for control variables, the total number of observations etc. (see Table 3.3 for more details). In line with the MAER-NET guidelines we extracted
multiple estimates per study.27 Overall, our meta-sample contains 205 estimates of the relative all-cause mortality risk of short sleep. A full list of publications and corresponding numbers of estimates included in the analysis can be found in Appendix A.
3.3.2. Meta-regression analysis and publication selection bias
The common practice in medical research for detecting publication bias is an informal examination of a so called ‘funnel plot’ (Sutton et al., 2000). A funnel plot is a simple scatter diagram of an empirical estimate and its corresponding precision (e.g. the inverse of the estimates’ standard error: 1/SE). Since a measure of variability of each estimate is placed on the y-axis, the estimates at the bottom have larger corresponding standard errors and hence, are more widely dispersed. In contrast, the more precisely estimated estimates are more compactly distributed towards the top. The most accurate estimates can therefore be found at the top of a funnel graph and these estimates should be less affected by publication selection as their high precision makes them less likely to be statistically insignificant. In essence, if no publication selection is prevalent, then the scatter diagram should resemble an inverted funnel. Figure 3.1 presents the funnel plot for the estimated relative mortality risks related to short sleep duration.
There are some estimates with relatively high precision, which mainly stem from studies that had a large cohort sample available for their analysis. The graph is not fully symmetrical, with more estimates of lower precision gathered in the right lower portion of the graph, which reveals potential selection for positive mortality risks. However, it should be noted that simply looking at the graph can be misleading as such graphs are vulnerable to misjudgement and subjective interpretation. To that end we follow Stanley and Doucouliagos (2012) and apply the Funnel Asymmetry Test (FAT) and the Precision Effect Test (PET) – or, in short, the FAT-PET. The mechanism of FAT-PET is simple but extremely powerful. With publication selection, researchers with small samples and low precision will be forced to search more intensively for their ‘best’ model specification, based on their data and econometric technique until they find larger estimates. Otherwise their results will not be statistically significant. Researchers with larger studies, however, do not need to search so hard to find statistical significance in their estimates and will be more likely satisfied with lower estimates. In essence, should publication selection be present, the reported effect is, all else being equal, positively correlated with its standard error.
26 SE = (upper limit – lower limit) / 3.92. See Higgins & Green, 2011. 27 https://www.hendrix.edu/maer-network/.

RAND Europe
31
Figure 3.1: Funnel plot of relative mortality risks related to short sleep duration
Note: own calculations.
Such considerations suggest that the magnitude of the reported estimate depends on its standard error, or to depict this more formally in equation (1): = + + (1)
where represents an individual estimate and is its corresponding standard error. The term models publication selection bias, while estimates serve as estimates corrected for publication
bias. However, the error term is not expected to be independently and identically distributed because the estimated effect is a regression coefficient from a larger sample and hence the variance of will vary from one estimate to another. This leads to the fact that estimating equation (1) with OLS will suffer from heteroscedasticity and Stanley and Doucouliagos (2012) suggest estimating and employing a weighted least squares (WLS) approach by weighting the standard errors with the inverse of each estimate’s variance (e.g. 1/SE*SE). Equivalently, equation (1) can be divided by and estimated as: = + (1/ ) + (2)
where is the t-statistic of each individual estimated empirical effect ( / ) and (1/) represents its precision and = / makes its variance approximately constant.
A simple test for the presence of publication selection is : = 0. This is called the funnel-asymmetry test (FAT) and shows whether or not publication selection is present. is the coefficient on precision in equation (2) and testing : = 0 is the so called precision-effect test (PET) to identify whether there is a ‘genuine’ underlying empirical effect net of a potential publication selection bias. Table 3.1 reports the

Why sleep matters – the economic costs of insufficient
32
estimates for the MRA model depicted in equation (2). As authors in this literature usually report multiple estimates and hence estimates within a study are likely not independent from each other, we have to adjust the WLS estimates for within-study dependence. Following Stanley and Doucouliagos (2012)
we apply cluster-robust standard errors and random-effects (RE) unbalanced panel estimators.28
Table 3.1: Testing for publication bias - weighted least squares of meta-regression model (2)
(1) (2) (3) Variables WLS WLS Cluster RE Panel
1/SE [PET] 0.0433 0.0433 0.0342
(0.006)*** (0.007)*** (0.006)***
Intercept [FAT] 0.6658 0.6658 0.8072
(0.111)*** (0.199)*** (0.175)***
Observations 205 205 205
Notes: cells report coefficient estimates for equation (2). The dependent variable is the log relative mortality risk of short sleep duration. The standard errors are reported in parentheses: *** p<0.01, ** p<0.05, * p<0.10; Standard errors are adjusted for data clustering in column 2 and 3. FAT is a test for publication bias. PET is a test for the existence of a mortality effect of short sleep corrected of publication bias. RE-panel is the random effects panel meta-regression model.
Normally, fixed-effects panel MRA models are the preferred option as random-effects are likely to be correlated with the MRA independent variables (e.g. (1/ )). Applying the Hausman test for choosing between fixed- and random-effects panel models allows us to accept random effects as the preferred model
specification.29 The parameter estimates in Table 3.1 reveal that there is statistical evidence of publication selection bias, as the intercept (FAT) is positive and statistically significant across all the three columns. Hence, the hypothesis : = 0 is to be rejected. In addition, we observe a genuine mortality effect of short sleep duration, with the parameter estimate between 0.0433 and 0.0342. In other words, short sleep duration (e.g. less than seven hours on average) leads to an elevated relative risk for all-cause mortality of
between 3.47 and 4.41 per cent.30
Furthermore, as discussed in Stanley and Doucouliagos (2012), the coefficient on precision in equation (2) gives a biased estimate of the empirical effect if there is publication bias. Stanley and Doucouliagos (2014) therefore offer an improved correction for publication selection using the standard error in MRA model outlined in equation (2). This estimator is called the ‘precision-effect estimate with standard error’ or simply PEESE. Stanley and Douciolagos (2012) report that in simulations PEESE provides better estimates of the underlying ‘genuine’ effect if there is publication bias and there is an effect. The PEESE WLS-MRA model can be written as:
28 Note that while most common panel data are pooled time-series and cross-sectional data, any multidimensional data may de facto be regarded as a panel. In this case we have various effect sizes by study. 29 Chi-Square(1) = 0.88; p-value >>0.05. 30 Calculated as transforming log risk back into exp(0.0342) and exp(0.0433), which translates into 3.47 and 4.41 per cent.

RAND Europe
33
= + (1/ ) + (3)
where the standard error is added to equation (2). Table 3.2 reports the parameter estimates for PEESE outlined in equation (3).
Table 3.2: Correcting for publication bias – weighted-least squares of meta-regression model (3)
(1) (2) (3) Variables WLS WLS Cluster RE Panel
1/SE [PET] 0.0410 0.0410 0.0306
(0.007)*** (0.006)*** (0.007)***
SE [FAT] -0.5896 -0.5896 -0.8506
(0.944) (1.049) (1.104)
Observations 205 205 205
Notes: cells report coefficient estimates for equation (3). The dependent variable is the log relative mortality risk of short sleep duration. The standard errors are reported in parentheses: *** p<0.01, ** p<0.05, * p<0.10; standard errors are adjusted for data clustering in columns 2 and 3. RE-panel is the random effects panel meta-regression model.
The parameter estimates for reported in columns 1 to 3 in Table 3.2 reveal that the PEESE correction for publication bias lowers the simple average relative mortality risk between five (columns 1 and 2) and ten (column 3) per cent.
The parameter estimates for the relative mortality risk of short sleep duration presented in Tables 3.1 and 3.2 do not reveal whether there are different risks related to different levels of short sleep (e.g. less than six). They also do not take into account any differences in the study design or whether the measure of sleep was self-reported or accounts for night-time sleep only, rather than sleep over a 24 hour period. All these factors may affect the parameter estimates and need to be taken into account. To accommodate for study heterogeneity, and hence potential misspecification bias, we turn to multiple MRA.
3.3.3. Taking into account study heterogeneity
In order to accommodate study heterogeneity, the simple MRA model in equation (3) can be expanded as follows: = + (1/ ) + ∑ / + (4)
where is replaced by + ∑ and the Z-variables allowing for heterogeneity and misspecification bias. The question is then which Z variables should be included as moderator variables in MRA model outlined in equation (4)? We follow previous meta-analyses on sleep duration and related mortality risks and include the following dimensions:
1) whether estimate is adjusted for demographic confounders (e.g. age, socio-demographic background);
2) whether estimate is adjusted for lifestyle risk factors (e.g. BMI, drinking, smoking, exercise);
3) whether estimate is adjusted for chronic conditions (e.g. diabetes, cholesterol, cancer, hypertension);

Why sleep matters – the economic costs of insufficient
34
4) categories of short sleep (6 to 7 hours and less than 6 hours);
5) pattern of sleep measured (24-hour or night-time sleep);
6) gender differences (female vs. male);
7) country/region (e.g. Europe, Japan, United States);
8) whether estimate based on sample that includes all age or only elderly;
9) follow up year of effect measured (e.g. below or above 10 years follow up);
10) year of publication of study;
11) whether sleep duration is self-reported or based on expert interview.
Table 3.3 lists the moderator variables and how they are coded together with their means and standard deviation.
Table 3.3: Moderator variables for sleep-mortality research
Moderator variable Definition Mean SD
SE is the standard error of estimate. 0.141 0.106
Less than 6 =1, if estimate relates to short sleep less than 6 hours. 0.454 0.499
Male =1, if estimate relates to males. 0.327 0.470
Female =1, if estimate relates to females. 0.322 0.468
Mean age =1, if estimate relates to sample with average age <60. 0.273 0.447
Type =1, if estimate relates to night-sleep duration. 0.376 0.485
Self =1, if estimate is self-reported 0.068 0.253
Euro =1, if estimate relates to European country. 0.288 0.454
U.S. =1, if estimate relates to United States. 0.200 0.401
Japan =1, if estimate relates to Japan. 0.259 0.439
Life =1, if estimate adjusted for lifestyle risk factors. 0.634 0.483
Chronic =1, if estimate adjusted for chronic conditions. 0.483 0.501
Demo =1, if estimate adjusted for demographics. 0.576 0.495
Follow =1, if follow up year >=10. 0.444 0.498
Year1 =1, if year article published between 1995-2005. 0.200 0.401
Year2 =1, if year article published after 2005. 0.776 0.418
Note: variable means and standard deviations reported based on a sample of 205 estimates.
Table 3.4 reports the parameter estimates for the MRA model outlined in equation (4). The full set of moderator variables from the cluster-robust WLS-MRA model is reported in column 1. Next, because there is substantial multicollinearity and to identify the most important research dimensions in this literature, we employed a general-to-specific modelling approach removing the variables from the specification that had the largest p-value (insignificant variables) until only significant variables remain (all p-values are equal or below 0.05).

RAND Europe
35
Table 3.4: Multiple meta-regression analysis of short sleep duration and mortality risk
(1) (2) (3)
Moderator variables WLS cluster G-to-S: WLS cluster G-to-S: RE panel
Less than 6 0.0609 0.0579 0.0554 (0.018)*** (0.017)*** (0.019)***
Male 0.0056 (0.013)
Female 0.0006 (0.014)
Mean age 0.0154 (0.031)
Type 0.0279 0.0408 0.0294 (0.030) (0.016)** (0.016)*
Self 0.0075 (0.048)
Euro 0.0048 (0.033)
U.S. -0.0263 (0.026)
Japan -0.0249 (0.026)
Life -0.0694 -0.0651 -0.0542 (0.017)*** (0.011)*** (0.008)***
Chronic -0.0070 (0.013)
Demo 0.0484 0.0362 0.0290 (0.013)*** (0.010)*** (0.010)***
Follow 0.0523 0.0399 0.0243 (0.024)** (0.016)** (0.016)
Year 1 0.0220 (0.201)
Year 2 -0.0029 (0.200)
1/SE 0.0412 0.0322 0.0379 (0.202) (0.025) (0.024)
SE 0.8880 -0.1253 (1.370) (1.378)
Observations 205 205 205
Note: standard errors reported in parentheses adjusted for data clustering. See table 3.3 for variable definitions.
The resulting cluster-robust general-to-specific WLS-MRA model is shown in column 2 of Table 3.4, whereas we also estimate the same specification using the random-effects panel estimator (column 3). Several patterns emerge from this comprehensive MRA of the sleep and all-cause mortality risk literature. Columns 2 and 3 reveal that the following research dimensions affect the magnitude of the reported mortality risk effect: (1) less than six hours of sleep; (2) night-time sleep duration; (3) adjustment for lifestyle risk factors; (4) adjustment for demographics; and (5) follow up year.

Why sleep matters – the economic costs of insufficient
36
Our findings suggest that after taking into account various research dimensions, the magnitude of the estimates is not affected by the fact that studies were conducted in different countries or geographical regions. Our analysis indicates that sleeping less than six hours on average increases the relative risk of all-cause mortality as confirmed by the relatively large positive MRA coefficient (about 0.05). Secondly, if sleep is related to night-time sleep only (instead over a 24 hour period), we observe a higher relative mortality risk of short sleep duration (between 0.02 and 0.04). Thirdly, adjusting for lifestyle risk factors has the effect of reducing the mortality effect of short sleep, which is in line with the expectations of omitted variable bias. If for instance, smoking is positively related to short sleep duration and mortality, then the parameter estimate of the effect of short sleep on mortality non-adjusted for smoking is biased and too large. Fourthly, adjusting for demographics increases the magnitude of the MRA coefficient (around 0.03). Finally, the longer the follow-up period is with participants in the study, the larger is the MRA coefficient of the relationship between short sleep and all-cause mortality. This can probably be explained by the fact that the longer one waits to follow-up with the participants in the study, the more likely it is that death will be observed (the outcome variable of interest in the studies under consideration). We take the position that longer follow-up periods are preferable in order to observe a more long-term effect.
3.3.4. Short sleep duration and all-cause mortality risks for sub-categories
As the previous section highlighted, there are a handful of factors which contribute to the heterogeneity across different studies. We combine the significant dimensions to report the relative mortality risk of short sleep duration for different sub-categories, including for two different short-sleep categories (six to seven hours, less than six hours), sleep type (whether related to night-time or 24-hour period sleep pattern), and different follow-up periods in the prospective cohort studies (less than ten years and more than ten years). Table 3.5 reports the relative all-cause mortality risks for different short-sleep categories, under different types of sleep measured and follow-up periods. In essence, six to seven hours of night-time sleep increases mortality risk by 7 per cent (relative to seven to eight hours sleep and follow-up period longer than ten years), whereas the same relative risk for less than six hours is 13 per cent. In other words, an individual sleeping less than six hours per night is 13 per cent more likely to die at any time than the same individual sleeping seven to eight hours per night. The risk is slightly reduced when looking at sleep over a 24-hour period, which takes into account day-time naps as well. In this case, sleeping between six to seven hours is associated with a relative all-cause mortality risk of 4 per cent, whereas sleeping less than six hours is associated with a relative risk of 10 per cent. This finding highlights the potential relevance of day time naps.

RAND Europe
37
Table 3.5: Short sleep and all-cause mortality risk for different sleep patterns – night time and 24 hour sleep
Night-time sleep 24 hour sleep
6 to 7 hours less than 6 hours 6 to 7 hours less than 6 hours
follow up < 10 years 1.04 (1.00-1.08) 1.10 (1.06-1.10) 1.01 (0.98-1.05) 1.07 (1.03 -1.11)
follow up > 10 years 1.07 (1.03-1.11) 1.13 (1.07-1.19) 1.04 (1.02-1.05) 1.10 (1.05-1.15)
Notes: table entries based on linear combination for different research dimensions using parameter estimates of column 3 in Table 3.4 (Stata command:lincom). All entries automatically take the values for estimates adjusting for lifestyle factors and demographics but vary follow up period, sleep type (night versus 24 hour) and short sleep duration categories (6 to 7 hours versus less than 6 hours).
Our findings are broadly in line with the meta-studies by Gallicchio and Kalesan (2009) and Cappuccio et al. (2011) which find a relative all-cause mortality risk for short sleepers (measured as less than seven hours) of 10 per cent and 12 per cent, respectively.

38
4. Quantifying the economic effects of insufficient sleep
This chapter examines the costs of insufficient sleep at two different levels – at the level of the employer (e.g. working time lost) and at the level of the country (e.g. GDP, labour productivity) - by using data for five different OECD countries. The economic analysis in this chapter consists of two parts.
Firstly, we revisit the association between sleep duration and workplace productivity. In a previous study (Hafner et al., 2015), using BHW survey data for 2014, we investigated the link between a set of different factors that may affect productivity. We found that sleep, among other factors such as mental health, was a significant factor associated with productivity loss among workers. For the purpose of the empirical analysis presented in this chapter, we use BHW survey data for the years 2015 and 2016 and investigate in more detail the link between sleep duration and workplace productivity loss, measured as working time lost due to absenteeism and presenteeism.
Secondly, after identifying the adverse effects of insufficient sleep on individuals (e.g. negative effects on health and wellbeing) and the burden it can represent to employers (e.g. lost working time and productivity) we feed these effects into a common analytical framework. With this framework we can quantify the overall economic costs of insufficient sleep, measured in terms of a country’s lost economic output and labour productivity. To that end we develop a bespoke macro-economic simulation model that draws on parameter estimates developed in this study to calibrate some of the key model parameters. While there is a large literature on the negative effects of insufficient sleep on individuals’ health and productivity (see for example Giuntella et al., 2015; Hillman et al., 2006; Rosekind et al., 2010; Taheri, 2006), evidence about its potential wider economic costs is more scarce and comprehensive cross-country comparisons are lacking. The analysis presented in this chapter aims to bridge the gap by providing quantitative estimates of the costs relevant to five different OECD countries for which we have data available on the sleep duration in the population. The following sections explain in more detail the analytical approach taken and the corresponding research findings.
4.1. Insufficient sleep and workplace productivity
There is a growing body of research investigating the association between sleep deprivation and productivity, documenting the negative effects of sleep loss. For instance, Bolge et al. (2009), based on data from the 2005 U.S. National Health and Wellness Survey, found that insomnia was associated with losses in work productivity and with impaired activity. Similarly, Kessler et al. (2012), working with data collected through the America Insomnia Survey, found that there was a significant association between insomnia and presenteeism. According to the authors, this was equivalent to 11.3 days of lost work

RAND Europe
39
performance (7.8 days when controlled for comorbid conditions). The association between insomnia and productivity losses was also observed by Sarsour et al. (2011), who noted that employees with insomnia had 72 per cent higher lost productivity costs than their counterparts without the condition. Dean et al. (2010) analysed the effects of excessive sleepiness on a range of outcomes, including work productivity, and concluded that it was associated with significant deterioration in all productivity measures included in the study with the exception of absenteeism. In a more recent paper, Katz et al. (2014) investigated the relationship between various lifestyle behaviours (including sleep) and employee productivity. The authors found that productivity loss was significantly higher among employees who got less than seven to eight hours of sleep. These findings were also corroborated by Hafner et al. (2015) who, based on findings from a survey of employees of UK-based companies, found that lack of sleep was negatively associated with workers’ productivity. Sleep has also been found to be associated with other notable work outcomes. For example Gibson and Shrader (2014) found a positive relationship between sleep duration and wages, showing that a one-hour increase in weekly mean sleep raises wages by 1 per cent in the short term and 4.5 per cent in the long term.
4.1.1. Measuring workplace productivity loss
Our empirical analysis is based on the BHW survey data, which we describe in more detail in section 2.2. We use the same data sample as for the analysis in Chapter 2, including the 2015 and 2016 instalments of the BHW, which together surveyed more than 62,000 UK employees. For the purpose of this analysis we use a measure for work impairment due to absenteeism and presenteeism as proxy for productivity. That is, the BHW survey data includes a validated scale to measure workplace productivity, namely the Work Productivity and Activity Impairment Questionnaire (General Health) (WPAI-GH). The WPAI-GH was developed to assess productivity loss by measuring the effect on work productivity of general health and symptom severity (Tang et al., 2011). It was originally established as a self-reported quantitative assessment of the amount of absenteeism, presenteeism and daily-activity impairment attributable to general health (WPAI-GH) or a specific health problem (WPAI-SHP). It has since been used in a wide range of applications and several versions for specific health problems are now available (Lofland et al., 2004).
The instrument consists of several questions with a recall time frame of seven days. The questions ask (1) whether the respondent is employed; (2) the number of hours missed from work; (3) the number of hours actually worked; (4) the degree to which the respondent feels that a health problem has affected productivity while at work and (5) has affected their ability to do daily activities other than work. It is important to stress that WPAI-GH outcomes are expressed as impairment percentages, where higher percentages indicate greater impairment and hence, lower productivity.
Beside the different WPAI scales, a number of other scales of self-reported workplace-productivity measurement have been created, including the Work Limitations Questionnaire (WLQ), the Health and Work Performance Questionnaire (HPQ), the Work Productivity Short Inventory (WPSI), the Stanford Presenteeism Scale (SPS-34 and SPS-13), the Work and Health Interview (WHI) and the Health and Labour Questionnaire (HLQ). A number of reviews have examined the advantages and disadvantages of each of these scales in more detail (Allen Jr & Bunn III, 2003; Lofland et al. 2004; Stewart et al., 2003).

Why sleep matters – the economic costs of insufficient
40
Please refer to Hafner et al. (2015) for a more in-depth description of the advantages and drawbacks of the WPAI-GH scale vis-à-vis other workplace productivity scales.
4.1.2. Sleep and workplace productivity – empirical findings
In order to explore the associations between workplace productivity and insufficient sleep we apply two estimation methods: (1) OLS; and (2) a fractional response estimator proposed by Papke and Wooldridge (1993). We chose the fractional estimation method because our outcome variables of interest is the share (of work impairment) lying on the interval between 0 and 1. An issue that may arise with OLS related to such a bounded outcome variable is that it could predict values for the proportion of working time lost due to absenteeism and/or presenteeism which lie outside the unit interval between 0 and 1. The proposed fractional response estimator takes this into account and suggests that a generalised linear model (GLM) with a binomial distribution and a Logit link function is appropriate in the case where the observed variable is continuous and bounded between 0 and 1. Hence, in what follows we prefer the parameter estimates from the fractional response estimator. As predictor variables related to sleep we use the four binary indicator variables of sleep duration (< 6 hours; 6 to 7 hours; 7 to 9 hours; > 9 hours) described in Table 2.5. The other predictor variables included in the regression are the same ones as in the analysis presented in Chapter 2 (see Tables 2.2 to 2.4).
Table 4.1: Sleep and work impairment due to absenteeism and presenteeism
(1) (2)
Outcome variable: % work impairment (WPAI-GH scale) absenteeism/presenteeism
Estimation method OLS GLM
Sleep duration < 6 hours 0.03099 0.02358
(0.00000)** (0.00000)** 6 to 7 hours 0.01587 0.01470
(0.00000)** (0.00000)** ≥ 9 hours 0.01610 0.01480
(0.00075)** (0.00038)**
Notes: p-values in parentheses: ** p<0.001, * p<0.05. Entries highlighted in black pass significance test after Bonferroni adjustment (a=0.001). Regressions clustered for companies (company_id). N = 62,366. Regressions clustered for companies (company_id). N = 60,214. Note that the models in columns 1 and 2 use the same predictor variables as used for the regression analysis outlined in Table 2.6 Column 1 reports the results from an OLS regression with work productivity loss due to absenteeism and presenteeism as the outcome variable and four binary indicators of sleep duration as predictor variables (≤ 6 hours, 6 to 7 hours, 7 to 9 hours and ≥ 9 hours, with 7 to 9 hours being the omitted category). Column 2 includes the results from a GLM regression reporting the marginal effects.
Column 1 of Table 4.1 reports the results from an multivariate OLS regression model using productivity loss due to absenteeism and presenteeism as the outcome variable and different binary measures of sleep duration as predictor variables: (1) sleeping less than six hours, (2) between six and seven hours, (3) seven to nine hours and (4) nine or more hours. In addition to the sleep-duration variables, and in order to reduce omitted variable bias, the regression model includes a set of other predictor variables related to individual factors such as lifestyle, health, personal and socio-demographic factors, as well as work-related

RAND Europe
41
factors such as the psychosocial environment at work and job-related factors (see Tables 2.2 to 2.4 for a description). Note that for ease of presentation, Table 4.1 does not present the parameters for these other predictor variables, as the main interest lies in the association between sleep and productivity. Note that entries highlighted in black pass the significance test after the Bonferroni adjustment (α=0.001).
In essence, the parameters in column 1 of Table 4.1 suggest that a respondent who reports sleeping less than six hours per day has on average about a 3 percentage point higher work impairment or per cent of working time lost than a respondent sleeping between seven and nine hours a day (holding all other factors constant). In addition, a respondent reporting sleeping six to seven hours has about a 1.6 percentage point higher impairment. Column 2 of Table 4.1 reports the same parameters but based on the GLM fractional response estimation method. The coefficients are lower in magnitude than the OLS coefficients and suggest that a respondent sleeping less than six hours a day experiences on average about a 2.4 percentage point higher work impairment than a respondent sleeping between seven and nine hours a day, whereas a respondent sleeping between six and seven reports on average about a 1.5 percentage point higher productivity loss.
Using the parameter estimates in column 2 of Table 4.1 and assuming 250 working days in a given year, this translates to around six working days per year more lost due to absenteeism or presenteeism for a person sleeping less than six hours compared to someone sleeping seven to nine hours. A person sleeping six to seven hours loses on average about 3.7 days more per year. Interestingly, long sleepers (measured as sleeping more than nine hours per day) on average also report higher work impairment due to absenteeism and presenteeism (around 1.5 percentage points) than someone sleeping seven to nine hours. This echoes previous research, which has also found a U-shaped relationship between hours of sleep and mortality, probably driven by the fact that sleeping long hours is a predictor for underlying chronic health conditions.
In summary, our findings suggest that sleeping either less or more than the recommended hours of sleep has a detrimental effect on workplace productivity when measured as working time lost due to absenteeism or presenteeism. The empirical analysis suggests that the impact of insufficient sleep is not only felt at the individual level, where short sleepers are likely associated with higher risks of certain health conditions such as obesity, diabetes or cardiovascular disease, but also at the organisational or employer level, as workers with sub-optimal hours of sleep are more likely to be off work (absenteeism) or at work but performing at lower efficiency (presenteeism), with costly consequences for employers. In what follows we aim to quantify the total working time lost across five OECD countries where we have data available on sleep duration in the population. To that end we use the parameters from the empirical
analysis (column 2 in Table 4.1) and additional data from the OECD on employment31 to calculate the overall working days and hours lost due to insufficient sleep.
31 http://www.oecd.org/employment/emp/onlineoecdemploymentdatabase.htm

Why sleep matters – the economic costs of insufficient
42
4.1.3. Working time lost due to insufficient sleep – a cross-country perspective
Based on observed sleep duration profiles, the predicted days and hours of working days lost due to insufficient sleep across the five OECD countries, presented in Table 4.2, suggest that insufficient sleep is associated with large costs to employers. On an annual basis, the U.S. loses an equivalent of about 1.23 million working days, which corresponds to about 9.8 million working hours. This is followed by Japan, which loses on average around 0.6 million working days, or 4.8 million working hours, per year. The UK and Germany are each faced with a similar loss of working time, corresponding to about 0.2 million days, or more than 1.65 million working hours. Among the five OECD countries examined, with about 0.08 million working days, Canada has the least working time lost due to insufficient sleep, corresponding to about 0.6 million working hours. The numbers for Canada are much lower because of the smaller overall workforce and a relative small proportion of the population sleeping for less than 6 hours.
Table 4.2: Total working time lost across five different OECD countries
Country U.S. UK Germany Japan Canada
Sleep: % < 6 hours 18% 16% 9% 16% 6%
Sleep: % 6 to 7 hours 27% 19% 21% 40% 20%
# Full-time workers (in thousands) 121,490 22,733 28,965 47,790 14,559
# Part time workers (in thousands) 27,340 8,296 11,245 14,000 3,387
Days lost (full-time): < 6 hours 528,377 87,372 60,545 185,289 22,089
Days lost (full-time): 6 to 7 hours 479,643 64,447 90,023 282,009 41,888
Days lost (part-time): < 6 hours 118,906 31,885 23,506 54,280 5,139
Days lost (part-time): 6 to 7 hours 107,938 23,519 34,951 82,614 9,745
Days lost: total 1,234,864 207,224 209,024 604,191 78,861
Hours lost: total 9,878,910 1,657,792 1,672,192 4,833,532 630,886
Notes: sleep-per-day data based on data from the National Sleep Foundation (2013) representative survey. The proportions of people sleeping less than six and between six and seven hours have been calculated by using the weighted average among the proportions for workday and weekend sleep patterns. The numbers of full and part-time employed workers in each country comes from the OECD labour statistics database. Note that we assume 250 working days per full-time employee per year and 125 working days for part-time employees. As an example, the total days lost due to insufficient sleep in an economy are calculated by multiplying the total number of workers (full- and part-time) by the proportions of short sleepers (< 6 hours and 6 to 7 hours), multiplied by the total number of working days (full-time: 250; part-time: 125) plus the percentages of work impairment due to absenteeism and presenteeism (< 6 hours: 2.36%; 6 to 7 hours: 1.47%). To calculate the total hours lost we multiply the working days by eight hours.
The working time lost in each of the countries reflects a significant loss to employers. However, the numbers do not give us an indication how this translates into economic output in the economy. In what follows we aim to quantify the economic costs to the five countries, by aggregating and linking the different costs related to individuals (e.g. health and mortality) as well as lost working time to employers.

RAND Europe
43
4.2. The macroeconomic effects of insufficient sleep
While the previous section reports large costs for employers in terms of lost working time due to insufficient sleep across five different OECD countries, in this section we analyse how this lost working time, together with elevated mortality risk affects the economy. That is, in order to estimate the economic effects of sleep deprivation we develop a bespoke economic model which predicts under different scenarios how much larger the economic output (measured as GDP), and the labour productivity (GDP per worker) would be, if the proportion of the working-age population sleeping less than the recommended amount (seven to nine hours) decreases.
4.2.1. Conceptual approach and scope of the analysis
In our conceptualisation of the economic costs related to insufficient sleep we focus primarily on its impact on labour supply, as sleep deprivation increases the risk of people developing severe health problems, reducing their wellbeing, with an adverse effect on their productivity and increased mortality risks. In addition, insufficient sleep as an adolescent has detrimental effects on schooling performance and hence skill accumulation, with potentially negative effects over the lifecycle in terms of labour-market outcomes, such as earnings. In essence, in our model insufficient sleep affects the supply of effective labour through three mortality and productivity related mechanisms:
Mortality
1) Elevated mortality risks: insufficient sleep increases sleep related deaths, which reduces the size of the working-age population. The analysis in Chapter 3 highlighted that at any given point of their life, very short sleepers (< 6 hours per day) are about 10 per cent more likely to die of any cause than individuals sleeping around 7 to 9 hours.32 In comparison, short sleepers (6 to 7 hours per day) are 4 per cent more likely to die of any cause.
Productivity
1) Increased morbidity or impaired cognitive performance: prolonged periods of sickness and absence of work or reduced (cognitive) performance while at work (e.g. presenteeism) lead to reductions in the efficiency of labour. This represents a direct effect on the effectiveness of the working-age population. For instance, the empirical analysis in the previous section revealed that, on average, and all else being equal, very short sleepers (< 6 hours) report a larger working time lost due to absenteeism and presenteeism than people sleeping around seven to nine hours.
2) Negative effect on adolescents’ skill accumulation: suboptimal school performance in younger years due to sleep deprivation hinders an individual’s skill development, creating differences between individuals in terms of their skillset. There is some evidence that, for instance, a change in
32 Note that the relative mortality risk depends on the sleep pattern observed, either during night-time only or taking into account day-time naps (e.g. 24-hour sleep). For the purpose of this analysis, we apply the mortality risk relevant to a 24-hour sleep pattern, which is between 4 per cent (six to seven hours) and 10 per cent (less than six hours).

Why sleep matters – the economic costs of insufficient
44
school starting times by one hour could improve strongly school performance and the educational achievements of adolescents. We take this human capital effect into account by modelling shifts in the skill distribution at the point in time when adolescents enter the labour market.
We recognize that there are other effects that may affect the labour supply through insufficient sleep. For instance, some evidence exists that sleep deprivation may have a negative effect on fertility (White, 2016). For instance, some studies suggest that shift work may have an adverse effect on fertility. However, there is a lack of applicable empirical estimates that would help us to calibrate the parameters of our model. Furthermore, anecdotal evidence suggests that major accidents like Exxon Valdez were connected to sleep deprivation, which obviously not only affects labour supply but also directly destroys capital.
In our analytical approach we also look at the effect of insufficient sleep on skill accumulation in adolescents. However, reduced cognitive performance may also have negative effects on learning while being in the labour market, for instance through on-the-job training. Again, due to a lack of empirical estimates to calibrate the model we do not include such effects. Not taking into account these potential factors thus results in an underestimation of the potential economic costs of insufficient sleep.
4.2.2. A dynamic general equilibrium model to assess the economic costs of insufficient sleep
For the purpose of this analysis we develop a theoretical dynamic general equilibrium model based on a system of mathematical equations to characterise the different economic interaction of agents in an economy. To that end, we build on the long tradition of computable general equilibrium (CGE) models, which have been extensively applied for economic policy analysis (see for example Allan et al., 2014; Lofgren et al., 2013; Zodrow & Diamond, 2013). CGE models are essentially based on a detailed theoretical framework depicting relationships between subjects in an economy described by a set of parameters, equations and conditions that are to be satisfied simultaneously. The equations are then
evaluated using mathematical software,33 giving a set of numerical results representing for example the GDP or capital stock in a simulated economy. CGE models explicitly allow for the analysis of multiple comparable scenarios which differ only in the selected set of parameters – i.e. by creating both a baseline (or status quo) and a ‘what if’ situation showing how the economy would evolve under different policy scenarios.
The model developed for this study is based on a specific family of general equilibrium models, a so-called ‘Overlapping Generations (OLG) model’. OLG models have been developed to account for complex economic interactions involving more than one generation of people. The basic mechanism behind the OLG modelling approach is driven by the life choices of representative economic agents (e.g. individuals in households) regarding education, labour supply, savings, investments and retirement based on a utility function that determines their preferences at any given point in time throughout their lifetimes. Overall, the (simplified) economy in each country of our analysis consists of three agents – households, firms, and
33 For the purpose of this analysis we use MatLab. See https://uk.mathworks.com/products/matlab/?requestedDomain=www.mathworks.com

RAND Europe
45
government – which continuously interact on different markets just as in reality. For instance, firms, representing the production sector, hire labour supplied by households to create output, paying wages in exchange for labour and interest as a cost of capital. Households buy goods and services with the income they receive from their labour supply. In the absence of international trade and public enterprises, all assets within the economy are ultimately in possession of people, who also constitute the final consumer of all production. In addition, the government collects income taxes from individuals and subsequently provides them with retirement benefits. In other words, in each country, profit-maximising firms demand inputs from the factor markets (e.g. labour and capital) and compare these costs with the revenue they expect from selling the final goods in the product market. This forms the production side of the economy. Simultaneously, consumers/households are endowed with capital and labour which they offer on the factor markets. Consumers then demand a bundle of goods produced by firms to maximise their utility, subject to their budget constraints, which forms the demand-side of the model.
In an equilibrium, prices adjust so that demand and supply is equal. In principle, the model assumes the economy to be populated by individuals of different age cohorts who make decisions about schooling in earlier years, then enter the labour market and produce goods, receive wages for their labour, pay taxes and receive unconditional pensions from the government in retirement. So in essence, at any given point in time the economy consists of different cohorts of individuals. Appendix B provides a full model description.
As a first step, the model simulates the economic forecast of each of the five OECD countries under consideration in the baseline scenario – that is to say given the current proportions of people with insufficient sleep in the economy. In a second step, under different ‘what if’ scenarios (compared to the baseline), the model predicts how the economic output and labour productivity would be affected if the proportions of short sleepers in the economy were reduced by a certain amount. Or, in other words, how much bigger would be the economic output if people got more or sufficient sleep.
Model dynamics and scenarios
As described above, in our model insufficient sleep affects the supply of effective labour and therefore production in a given country through three mechanisms: (1) increased mortality, (2) increased morbidity or reduced cognitive performance (productivity); and (3) skill accumulation as an adolescent.
In every country c, the economic output consists of goods and services that are produced using input factors capital and effective labour (e.g. labour input adjusted for efficiency units), and hence production is modelled as a function of = ( , ). Similar to the method used by Taylor et al. (2014) in a different context for a study of antimicrobial resistance (AMR), in each time period the model assumes that effective labour is adjusted for efficiency units by = ∗ with the physical supply of labour input and efficiency labour .
To address the first component (physical labour) we develop a cohort-component model which estimates the size of the working-age and overall populations, with different proportions of short sleepers having an effect on the size of the workforce and the population, which then directly affects the supply of labour in the economy. To address the second component (efficiency) we develop a labour-efficiency model which links the health or productivity of the working population with the number of working days lost by

Why sleep matters – the economic costs of insufficient
46
workers such that a decrease in the proportion of individuals with insufficient sleep raises the number of days worked. It is important to stress that the two components are interlinked, as changes in the proportion of the working population affect the number of working days lost. Besides allowing us to explicitly model the detrimental effect of insufficient sleep on different population cohorts in the economy, the OLG model also establishes a relationship between the working population and people in retirement. In essence, we can observe the effect of increased mortality rates due to sleep deficiency across different age groups as well as population ageing. These factors create a whole set of interactions in the economy, ranging from increased pressure on workers to provide funding for pension transfers to changes in the overall consumption patterns and capital accumulation due to differences in the propensity to consumption and saving across the lifecycle.
The model then generates long-run GDP and labour productivity projections for five different OECD countries under different ‘what if’ scenarios which are compared against a baseline projection based on the current proportions of people with insufficient sleep. Note that in the application of this study,
simulations are based on a forecast of 15 years.34 Table 4.3 describes the four different sleep scenarios (baseline and three ‘what if’) included in our projections.
Table 4.3: Scenarios included in the projections
Scenarios Description
Baseline Current proportions of short sleepers
Scenario 1 Proportions of very short (< 6 hours) and short sleepers (6 to 7 hours) improve sleep duration to the recommended hours of sleep (7 to 9 hours)
Scenario 2 Current proportion of very short sleepers (< 6 hours) improve sleep duration to sleep between 6 to 7 hours
Scenario 3 Current proportion of short sleepers (6 to 7 hours) improve sleep duration to sleep the recommended hours of sleep (7 to 9 hours)
Specifically, scenario 1 represents an optimistic ‘best-case’ scenario where all short sleepers in the population started to get the recommended hours of sleep (seven to nine hours). Scenario 2 represents a less ambitious scenario by examining the economic impact if those sleeping less than six hours started sleeping six to seven hours. Scenario 3 is similar to scenario 2 but predicts the potential gains to the economy if those sleeping six to seven hours start sleeping seven to nine hours, keeping those sleeping less than six hours unaffected. In order to interpret the findings of our projections under different scenarios four factors need to be taken into account.
Firstly, it is important to stress that the model compares changes in the ratio of short sleepers and its potential impact on the economic output under different ‘what if’ scenarios compared to the baseline scenario. That is, any predictions of the model are essentially independent of any future observed policy 34 Assuming from 2015 until 2030.

RAND Europe
47
shocks35 as we assume that these would affect the baseline and the ‘what if’ scenario in the same way, and
therefore cancel one another out. Indeed, all potential influences36 would arguably affect the economy in the same way no matter how much people sleep.
Secondly, our model only takes into account the direct effects of reducing the proportion of people with insufficient sleep in the economy – that is, effects relating to mortality and productivity, all else being equal. This approach, however, does not account for indirect effects. For instance, if the proportion of short sleepers were to decrease, this would likely trigger mental-health improvements in the affected population, which might in turn have further large independent effects on productivity (on top of the sleep effect) and hence might positively affect economic output in an indirect manner. In addition, a worker who sleeps longer is more productive, which might in turn increase the productivity of its co-workers through so-called ‘peer effects’. Due to a lack of empirical estimates to help calibrate such parameters we do not take these indirect effects into account, which most likely underestimates the estimated economic effects.
Thirdly, our model assumes that the proportion of people with insufficient sleep is independent of future business cycles. Theoretically, during an economic recession, the proportion of short sleepers could increase as people may worry about losing their jobs, may have financial concerns or generally elevated levels of anxiety, leading to lower levels of sleep. On the other hand, during an economic boom people may have lower levels of job worries leading to a positive effect on levels of sleep. Conversely, at the same time people might just go out more often and hence sleep less. Generally, the empirical evidence on the effect of business cycles on sleep duration is ambiguous. For instance, a study from the U.S. showed that business cycles are not linked to sleep duration, whereas a study from Iceland showed a positive relationship between recession and sleep duration (Olafsson, 2015; Ásgeirsdóttir et al., 2014). In our predictions we assume that the proportion of short sleepers is constant, rather than an endogenous function of economic output.
4.2.3. Key parameters to calibrate the model
Economic and sleep duration data
To estimate the cost of insufficient sleep, the theoretical OLG model described above is calibrated to economic data for each of the five OECD countries we examine. National-level economic data is required to apply the model to the existing economic situation of a country. For this purpose we draw on macro-economic data, such as the capital stock (human and physical), capital/labour ratios, multifactor
productivity and total hours worked, among others, from the Penn World Tables,37 the OECD and the World Bank. The parameters applied are described in Table B.1 in Appendix B.
35 E.g. The UK’s decision to leave the European Union 36 Except for some form of endogenous behavioural change affecting the relationship between the amount of sleep and our input parameters – fertility, mortality, school achievement and workplace productivity. 37 http://cid.econ.ucdavis.edu/pwt.html

Why sleep matters – the economic costs of insufficient
48
For the proportions of the working population sleeping below the recommended sleep duration we draw on data from a representative survey by the National Sleep Foundation (2013). The proportions of short sleepers are reported in Table 4.4.
Table 4.4: Proportions of the population sleeping less than seven hours
U.S. UK Germany Japan Canada
Less than 6 hours 18% 16% 9% 16% 6%
6 to 7 hours 27% 19% 21% 40% 20%
Notes: Sleep data based on data from the National Sleep Foundation (2013) representative survey. The proportions of people sleeping less than six and between six and seven hours have been calculated by using the weighted average among the proportions for workday and weekend sleep patterns.
Population projections
We base the growth of the workforce and its efficiency on current proportions of short sleepers in the economy, as well as demographic projections for the potential future scenarios with varying rates of short sleepers. We base the demographic projections on data from the United Nations (2014) and an adapted version of Chapin's cohort-component model (Hunsinger, n.d.). The cohort-component model starts with the base population in 2015 and is categorised by country, age and gender. The base population subsequently evolves by applying assumptions on mortality and fertility so that the population changes according to a ‘natural’ increase (births minus deaths), which depends on the particular sleep scenario. The outcome of the model is a projection of the population by 5-year age groups and gender groups up to 2030, applied to each of the five countries.
The total births in a given period depend on the size of the population, its age structure and age- and country-specific fertility rates. Similarly, the number of deaths in any given period depends on the population size, the age distribution and age- and gender-specific mortality rates. In addition, net migration can lead to an increase in the population. We apply the abridged life tables provided by the UN to calculate age- and gender-specific probabilities of surviving from one age group to the next (within five years). More formally, the population of age , gender at time is calculated as
, , = , , + , − , + , − ,
where , represents the total births, , total deaths. , and , represent inward and outward migration respectively. It is important to stress that we assume that, in each of the five countries, fertility rates will follow a similar trend as during the last decade (e.g. declining birth rates among women aged 20 to 25 and increasing birth rates among women aged 35 and above). Furthermore, although it is important to highlight that an improvement in sleep duration could affect fertility rates we do not model fertility rates as endogenous.
As previously discussed, we essentially predict the economic effects of three scenarios compared to the current baseline. In the status-quo scenario, fertility and mortality rates are based on the actual UN projections, whereas in the different ‘what if’ scenarios we adjust the relative mortality risks with the parameters developed in chapter 3, where the findings suggest that the relative mortality risk for people sleeping less than six hours per day is 1.1 and for people sleeping between six and seven hours per day is

RAND Europe
49
1.04.38 Note that the net-migration figures are drawn from the UN population database as well, and based on UN predictions.
Labour-efficiency model
To calculate the sleep duration-related efficiency units of labour, we draw mainly on the parameter estimates derived in section 4.1.2 above. That is, we know that on average a worker sleeping less than six hours per day has on average a 2.36 percentage point higher working time lost due to either absenteeism or presenteeism than a worker sleeping on average seven to nine hours, all else being equal. A worker sleeping six to seven hours on average has still a 1.47 percentage point higher working time lost than a worker sleeping seven to nine hours. Thus, in our model, labour efficiency is based on subtracting a number of days (normalised to a year) from the baseline yearly efficiency level. Put simply, the yearly efficiency of a worker is: = 1 −
with a decrease in the proportion of short sleepers increasing the number of working days. Note that we base the parameter estimates for working days lost due absenteeism and presenteeism on a large working population dataset for the UK. Hence, we implicitly assume that the parameters can be applied across the four other industrialised OECD countries and we believe that the assumption is valid overall. That is, although the different countries may have different labour-market regulations and different sick-leave regimes, our measure of working time lost captures the combined effect as to whether someone is more likely to be off work or at work but performing below optimal productivity. Hence, if for instance in one country it may be more difficult or less socially acceptable to take sick leave, the worker may still not being working at normal efficiency if coming to work while sick.
Suboptimal performance in school
The effect of sleep on school achievement is discussed by multiple authors (see for example Li et al., 2013; Pagel et al., 2007; Wolfson & Carskadon, 1998). However, not many studies look at high-school students in at least one of the selected countries and only a few of the studies provide results that can be expressed in terms of usable elasticities as calibration parameters in the model. We identified Fredriksen et al. (2004) as a suitable study at the intersection of the two sets. The authors show how for American high-school students an additional one hour of sleep increases academic achievement, expressed as average grade, by 7.75 per cent on average. We combine this estimate with the findings of Eaton et al.(2010) who show, again amongst American high-school students, that 68.9 per cent of pupils get insufficient sleep, thereby suggesting that over two-thirds of all students could increase their academic achievement if they slept more. Lastly, to extrapolate these figures to other countries we use data collected by the National Sleep Foundation (2013), which shows the distribution of people in respect to their average length of sleep (see Table 4.4).
38 Meaning a 10 per cent and 4 per cent higher risk to die of any cause than a person sleeping between seven to nine hours per day..

Why sleep matters – the economic costs of insufficient
50
Specifically, we take the U.S. data as the baseline for our calculations, as both Fredriksen et al. (2004) and Eaton et al. (2010) observed U.S. students, and multiply the share of students who get insufficient sleep by the ratio of people who sleep less than seven hours on a typical workday in a given country, compared to the U.S.: = ,
where denotes the share of students who get insufficient amount of sleep and is the share people in the country who sleep less than seven hours on a typical workday.
4.2.4. Simulation results
To estimate the cost of insufficient sleep we examine three scenarios which are compared against a baseline scenario of current proportions of short sleepers in the population. The three scenarios are described in Table 4.3 and include: (1) scenario 1, where all current short sleepers get sufficient sleep; (2) scenario 2, where very short sleepers (less than six hours) improve their average sleep duration to between six to seven hours; and (3) scenario 3, where short sleepers (six to seven hours) improve their sleep duration to seven to nine hours, whereas the proportion of very short sleepers (less than six hours) remains constant. All scenarios are estimated for each of the five OECD countries under consideration.
In interpreting the results of our model predictions, it is important to keep in mind that the values calculated in each ‘what-if’ scenario represent how much higher a country’s GDP or labour productivity would be at a particular point of time in comparison to the state with current proportions of short sleepers. In other words, the costs in our model represent the opportunity cost to the economy due to a proportion of the population not sleeping the sufficient amount of hours. Note that excess deaths due to insufficient sleep reduce permanently the size of the population, which influences directly future population sizes and hence the effects of insufficient sleep accumulate over time. That is, the death of a worker does not only affect the year the death occurs but continues to be a part of the costs in subsequent
years because it also includes the potential ‘death’39 of all future offspring. This explains why the costs of insufficient sleep increase over time, even if the proportions of short sleepers remain constant relative to the baseline.
The results of our simulation analysis are presented in a series of tables, including Tables 4.5, 4.6 and 4.7. Table 4.5 reports for each country the economic costs in terms of lost economic output (absolutely and as a percentage of the total GDP) within five year periods until 2030. For example, in absolute terms, the U.S. is assumed to sustain by far the highest loss (between $280 billion and $411 billion currently, depending on the scenario) due to the size of its economy, followed by Japan (between $88 billion and $138 billion). However, the relative numbers show that the estimated loss for Japan is actually higher than for the U.S. (between 1.56 to 2.28 per cent for the U.S. and 1.86 per cent to 2.92 per cent for Japan, respectively), with the UK (1.36 per cent to 1.86 per cent), Germany (1.02 per cent to 1.56 per cent) and Canada (0.85 per cent to 1.56 per cent) following behind. The lowest costs are observed in scenario 2.
39 Or in this case, never been born.

RAND Europe
51
This is in line with our expectations as this scenario assumes that people sleeping between six to seven hours have neither elevated mortality risks nor higher working time lost due to absenteeism or
presenteeism.40
Table 4.5: Estimated annual cost in GDP terms relative to baseline (U.S.$ billions; %)
Year Country GDP (U.S.$ billions, 2015 prices) GDP (%)
Scenarios 1 2 3 1 2 3
Current
U.S. 411.0 226.4 265.6 2.28% 1.26% 1.47%
UK 50.2 29.9 32.0 1.86% 1.11% 1.18%
Japan 138.6 75.7 105.1 2.92% 1.60% 2.22%
Germany 60.0 34.1 46.1 1.56% 0.88% 1.20%
Canada 21.4 12.0 17.2 1.35% 0.76% 1.08%
2020
U.S. 433.8 244.1 283.9 2.40% 1.35% 1.57%
UK 53.8 32.6 34.8 1.99% 1.21% 1.29%
Japan 145.9 80.4 110.9 3.08% 1.70% 2.34%
Germany 62.3 35.2 47.6 1.61% 0.91% 1.23%
Canada 21.9 12.2 17.6 1.38% 0.77% 1.11%
2025
U.S. 456.1 260.3 301.1 2.53% 1.44% 1.67%
UK 57.6 35.2 37.5 2.13% 1.31% 1.39%
Japan 151.7 84.4 115.6 3.20% 1.78% 2.44%
Germany 64.7 36.5 49.3 1.68% 0.95% 1.28%
Canada 22.5 12.7 18.1 1.42% 0.80% 1.14%
2030
U.S. 467.7 270.4 312.0 2.59% 1.50% 1.73%
UK 58.7 36.3 38.5 2.17% 1.34% 1.43%
Japan 156.2 87.2 119.2 3.30% 1.84% 2.52%
Germany 69.1 40.2 53.4 1.79% 1.04% 1.39%
Canada 23.4 13.4 18.9 1.47% 0.84% 1.19%
Scenario 2 predicts that even relative small changes in sleep duration for the very short sleepers could raise the economic output. For instance, currently the U.S. could improve their output by around 1.26 per cent ($226.6 billion) and Japan by 1.6 per cent ($75.7 billion). The UK would gain around 1.1 per cent ($29.9 billion), Germany around 0.88 per cent ($ 34.1 billion) and Canada around 0.76 per cent ($12 billion). Scenario 3 predicts a similar distribution of losses across the five countries compared to scenario 2 but overall the costs are higher, especially for Japan which has relative large proportion of people sleeping between six to seven hours.
40 Even though that the empirical evidence in this study shows the opposite. The adverse mortality and productivity effects are lower for those people sleeping between six to seven hours, compared to those sleeping less than six hours, but they are statistically and (as shown above) economically significant.

Why sleep matters – the economic costs of insufficient
52
To get a sense about the overall average costs, including those arising in the future, Table 4.6 reports the average annual costs by country in terms of lost GDP from the current year up to 2030.
Table 4.6: Average annual costs in GDP relative to baseline up to 2030 (U.S.$ billions)
Country Average loss in GDP (2015 prices)
Scenarios 1 2 3
U.S. 442.1 250.3 290.6
UK 55.1 33.5 35.7
Japan 148.1 81.9 112.7
Germany 64.0 36.5 49.1
Canada 22.3 12.6 17.9
To better understand the implications of the results, Table 4.7 shows the cumulative costs in terms of GDP over the reported period. The cumulative costs in trillion USD associated with scenario 1 by 2030 are almost $7 trillion for the U.S..
Table 4.7: Estimated cumulative costs in GDP relative to baseline (U.S.$ billions, 2015 prices)
Year Country GDP (U.S.$ billions, 2015 prices)
Scenarios 1 2 3
2020
U.S. 2,500.9 1,404.5 1,639.4
UK 310.6 187.7 200.1
Japan 847.4 466.5 644.6
Germany 365.3 208.4 280.6
Canada 129.3 72.7 104.2
2025
U.S. 4,725.9 2,678.6 3,113.4
UK 587.4 356.7 379.9
Japan 1,588.1 877.8 1,209.2
Germany 683.8 389.7 524.3
Canada 240.1 134.6 193.2
2030
U.S. 7,030.7 4,003.6 4,643.6
UK 877.4 536.0 570.3
Japan 2,357.2 1,306.8 1,795.8
Germany 1,021.4 585.2 784.5
Canada 355.1 200.1 286.0
To put this value into perspective, this is roughly a bit less than half of the annual U.S. current GDP. This is followed by cumulative costs of $2.3 trillion for Japan, $1 trillion for Germany, $0.8 trillion for the UK and $0.3 trillion for Canada.
Finally, Table 4.8 shows the relative loss in labour productivity (GDP per worker) relative to the baseline scenario (current proportions of short sleepers). Under scenario 1, the simulations suggest that if Japan

RAND Europe
53
would reduce the proportion of short sleepers to zero, labour productivity could currently be 2.11 per cent higher, rising to 2.38 per cent in 2030. For the U.S., the predicted increase is 1.63 per cent (1.86 per cent by 2030), followed by the UK (1.39 per cent currently and 1.62 per cent in 2030), Germany (1.1 per cent currently and 1.27 per cent in 2030) and Canada (0.97 per cent currently and 1.06 per cent in 2030).
In summary, insufficient sleep among the population is associated with large economic losses, with adverse effects on economic output and labour productivity. It is important to highlight that the cost vary across the three different scenarios, with scenario 2 predicted to translate into the smallest losses among the three scenarios but with still large costs for the economies of the five OECD countries examined. What is more, as our economic forecast up to 2030 predicts, it is important to highlight that the economic costs of insufficient sleep are rising over time, even if we assume the proportion of short sleepers to stay constant. Hence, the earlier the insufficient sleep problem can be addressed, the lower will be the burden in the future.
Table 4.8: Estimated loss in labour productivity (%) relative to baseline
Year Country GDP per worker (%)
Scenarios 1 2 3
Current
U.S. 1.63% 1.00% 1.18%
UK 1.39% 0.94% 1.00%
Japan 2.11% 1.45% 2.02%
Germany 1.10% 0.83% 1.13%
Canada 0.97% 0.61% 0.88%
2020
U.S. 1.73% 1.08% 1.26%
UK 1.49% 1.03% 1.09%
Japan 2.22% 1.54% 2.13%
Germany 1.14% 0.86% 1.16%
Canada 1.00% 0.62% 0.90%
2025
U.S. 1.81% 1.16% 1.34%
UK 1.59% 1.11% 1.18%
Japan 2.31% 1.62% 2.22%
Germany 1.19% 0.89% 1.20%
Canada 1.02% 0.65% 0.93%
2030
U.S. 1.86% 1.20% 1.38%
UK 1.62% 1.14% 1.21%
Japan 2.38% 1.67% 2.29%
Germany 1.27% 0.98% 1.31%
Canada 1.06% 0.68% 0.97%

54
5. Discussion and recommendations
5.1. Discussion
Sleep is a basic human need in much the same way as nutrition. We need a degree of sleep to survive as human beings as extensive long-term sleep deprivation can lead to death. However, contrary to what we know about how human being’s use and need of nutrition, the purpose of sleep is still the subject of much scientific research. There have been countless stories about businessmen, chief executives and heads of state who claim they get by on little to no sleep. Whereas the late UK Prime Minister Margaret Thatcher famously claimed that ‘sleep is for wimps’ - she required only a few hours and arguably saw sleeping as unproductive time - we know that lack of sleep and irregular sleep is associated with specific outcomes that are undesirable in societies. Lack of sleep is associated with poorer health outcomes (see Liu et al., 2014; Sigurdson and Ayas, 2007; and Hublin et al, 2007). These health outcomes range from an increasing risk of suffering from chronic conditions, including medical conditions like diabetes, high blood pressure, and heart disease and mood disorders such depression and anxiety. Studies are also increasingly linking regular sleep deprivation with poor decision-making (Harrison and Horne, 2000). Sleep appears to affect our mental performance and cognitive function negatively and can be linked with an increase of errors in performing tasks. This has for instance been noticed in medical personnel working shifts making medical errors and drivers making driving errors after prolonged periods behind the wheel of a car. Insufficient sleep may also be an expression of deep-rooted societal problems. As mentioned in this report, lack of sleep can also be associated with earning a lower income in addition to being at higher risk of health problems. This may speak to broader inequality issues or social disenfranchisement in our societies. As the findings of the economic analysis in this report suggest, lower productivity levels and higher mortality risks related to insufficient sleep can result in huge economic losses to modern economies. For instance, insufficient sleep among its populations cost the five OECD countries under consideration up to $680 billion of economic output lost every year, with costs rising over time, even if we assume constant proportions of short sleepers. Hence, sleep deficiency adversely affects individuals through negative effects on their health and wellbeing, is costly for employers due to lost working time of its employees, which is associated with large economic losses, and solving the problem of insufficient sleep therefore represents a potential ‘win-win’ situation.
5.2. Recommendations
In light of the large potential economic costs related to insufficient sleep and sleep disorders, it appears desirable to put in place measures designed to encourage better sleep outcomes among working and wider

RAND Europe
55
populations. Several recommendations have been put forward based on findings from available research studies. The following section presents an overview of the most relevant recommendations for ways to mitigate the adverse health, social and economic outcomes associated with insufficient sleep. The recommendations are grouped in three categories, according to who may be in a position to action them. In line with the discussion in Section 1.1, this categorisation acknowledges that efforts to improve sleep quality and tackle lack of sleep can be taken by individuals, employers and public authorities alike.
5.2.1. Recommendations targeting individuals
The first group of recommendations addresses individuals, focusing on adjustments to people’s sleeping habits and daily routines. Although external factors can play an important role in sleep duration and quality, proper sleep habits and sleep-hygiene standards are the primary responsibility of individuals. 1. Set a consistent wake-up time. Individuals may achieve better sleep outcomes by making sure they wake up at a consistent time. Troxel et al. (2012), for instance, included a rule to wake up at the same time every day irrespective of sleep quality as part of a brief behavioural treatment intervention developed to address dissemination barriers associated with cognitive-behavioural therapy for insomnia (CBT-I). The short-term efficacy of this intervention has been demonstrated in a population of older adults (Buysse et al., 2011). Potentially harmful disruptions to consistent sleep patterns even include oversleeping at the weekend, perhaps in an effort to compensate for shorter sleep during the working week (Wong et al., 2015).
2. Limit time spent in bed on activities other than sleeping. Based on the notion of “stimulus-control” (Bootzin et al., 1991), which highlights the importance of creating a strong, learned association between the bed and sleep, the avoidance of non-sleep activities in bed (other than sex), such as watching TV or working, has also been recommended in other research literature (e.g. Harvard Medical School, 2007; Simon et al., 2014).
3. Do not stay in bed unless asleep. Related to the previous point, it appears beneficial to get out of bed when encountering difficulties either when falling asleep or when getting back to sleep in the event of a sleep interruption. In this context, however, it is important not to engage in activities that may be overly stimulating, such as using a computer (see below). To that end, various stimulus-control activities have been put forward suggesting what activities to avoid and what to do when having trouble falling asleep (Bootzin et al., 1991). These include sticking to distracting but not excessively stimulating activities, preferably in low-light settings.
4. Limit the use of electronic devices before bedtime. Another way to improve sleep outcomes is to minimise the time spent using electronic devices and the overall amount of screentime, particularly shortly before bedtime, as use of screens in the evening may suppress people’s melatonin levels, a hormone which is crucial for the control of sleeping and waking cycles. Evidence suggests that this recommendation applies across all age groups, as the use of electronic media and screentime have been found to be associated with negative sleep outcomes in school-aged children (Hale & Guan, 2015), adolescents (Lemola et al., 2015) and adults alike (Exelmans & Van den Bulck, 2016).
5. Limit the consumption of substances which may impair sleep quality. Another way to improve sleep outcomes is to avoid or minimise the consumption of substances close to bedtime. As demonstrated

Why sleep matters – the economic costs of insufficient
56
by empirical studies, this recommendation includes caffeine (Clark & Landolt, 2016), alcohol (Ebrahim et al., 2013) and nicotine (Jaehne et al., 2009).
6. Address stressful issues long before bedtime. It appears beneficial to avoid engaging in activities that may give rise to stress and thinking about subjects one may find stressful shortly before bedtime. For instance, Baikie and Wilhelm (2005) recommended setting regular time aside for addressing potentially traumatic, stressful or emotional issues to improve the onset of sleep.
7. Exercise. Physical activity has been demonstrated to be associated with improved sleep outcomes. This has been the case both among healthy people (Lira et al., 2011) and insomniacs (Reid et al., 2010).
5.2.2. Recommendations targeting employers
The second group of recommendations is addressed to employers, who may be in a position to implement measures and policies which better suit our biological needs. At least three broad types of interventions can be identified. The first group addresses the conceptual level of incorporating sleep considerations into the overall management approach, the second group revolves around making improvements in the workplace environment, and the third group touches on organizing work and employees’ schedules. These three intervention categories are addressed below.
Incorporating sleep considerations into management approach
8. Recognise the importance of sleep and the employer’s role in its promotion. The first step in contributing to better sleep outcomes for employees is for employers to recognise the importance of sleep and the adverse outcomes both for individuals and businesses stemming from insufficient sleep (Huppke, 2016). In some instances this may require a cultural change in organizational thinking (van Dam & van der Helm, 2016). This is particularly the case if, as discussed in Chapter 1, this involves no longer
crediting people who report less sleep with greater effectiveness and work results.41
9. Commit organisationally to helping employees achieve better sleep outcomes. In practical terms, an organizational recognition of the importance of sleep would translate into an organizational commitment to support the workforce and their sleep outcomes. This could manifest itself in numerous forms. For instance, a growing number of companies have installed sleep facilities for employees to use and introduced snooze-friendly policies, signalling that it is acceptable (and desirable) to rest as needed (National Sleep Foundation, n.d.). Corporate focus on employees’ improved sleep may also have an external dimension. For instance, the U.S.-based insurance company Aetna has introduced an incentive system whereby employees reporting sleep in excess of seven hours are eligible for bonus payments (DiGiulio, 2016). In addition, organisational commitment helps communicate the importance of sleep to the workforce, and this effect could be boosted by incorporating sleep training within the broader
framework of other well-being initiatives which may already be in place.42 This may include incorporating
41 See, for instance, the pronouncements of the CEO of Marriott on the topic (Kaufman, 2016). 42 For instance, van Dam and van der Helm (2016) list exercise, nutrition, mindfulness as examples of broader well-being framework where sleep training could be added.

RAND Europe
57
the use of commercially available and widely used “wearable” devices that monitor sleep-wake activity. These devices may provide a useful way for employees to track their sleep and be incentivised for maintaining consistent sleep routines with adequate sleep duration. This, as also discussed below, may in turn be expected to enhance individual efforts made by employees along the lines of the recommendations listed in the previous section.
Improving the workplace environment
10. Design and build brighter workspaces. This recommendation builds on available evidence suggesting that brighter lighting may be beneficial for employees, helping to maintain their brains’ alerting signal (Harvard Medical School, 2007). For instance, in a case-control study by Boubekri et al. (2014) of 49 office workers, those working in windowless environments reported, among other outcomes, poorer sleep quality and increased sleep disturbances.
11. Provide facilities and amenities that help employees with their sleep hygiene. Employers can put in place arrangements to support their staff’s daily routines with the aim of improving their sleep outcomes. These initiatives may target some of the individual behaviours described in section 5.2.1 above, with relevant examples (e.g. Harvard Medical School 2008; Prueher, 2016; van Dam and van der Helm 2016) including providing access to a gym and/or fitness tracking devices to support exercise routines, providing vending machines with (or free distribution of) healthy snacks to support good dietary habits, and using smart technology with limited blue-light emission to mitigate the adverse effects of screen time.
12. Combat workplace psychosocial risks. Another way employers can contribute to employees’ improved sleep outcomes through workplace arrangements is by working to tackle workplace-related stressors. A systematic review and meta-analysis by Linton et al. (2015) of work-environment effects on future sleep disturbances included four studies investigating the relationship between job strain and future sleep issues. The authors concluded that there was a positive association between reporting job strain and future sleep disturbances. The review also found an association between higher levels of social support at work and lower levels of future sleep disturbances, and between perceived levels of organizational injustice at the workplace and future sleep disturbances. Three additional psychosocial factors which were also found to be associated with future sleep disturbances were (lack of) control over work, effort–rewards imbalance and bullying,
13. Address physical workplace risk factors. Employers should also work to limit the potential negative effects physical workplace risks may have on staff sleep. While not every recommendation in this group may be relevant to every workplace, examples of physical risks with demonstrated evidence in at least some studies include work with pesticides (Postuma et al., 2012), strenuous physical work demands (Åkerstedt et al., 2002; Gerster et al., 1995), exposure to vibrations (Ribet & Derriennic, 1999) and
organic solvents (Lindelof et al., 1992)43 and excessive work with visual display terminals (Tachibana et al., 1996).
43 However, please note that Heiskel et al. (2002) did not find any association between exposure to solvents and sleep apnea in workers.

Why sleep matters – the economic costs of insufficient
58
Improving the organisation of work
14. Discourage the extended use of electronic devices. As discussed in section 5.2.1 on individual behaviors and evidenced in the research literature (e.g. Chang et al., 2015), excessive use of electronic devices can have negative effects on workers’ sleep. Since one of the reasons for the increased and longer use of electronic devices is the actual or perceived need to be available for work purposes (Deal, 2013; Weber, 2015), employers are in a position to make a difference. One possible course of action by employers is to signal limits on staff’s expected availability after working hours or by introducing policies limiting after-hours and out-of-office communications. Examples of such steps already exist – for instance, the car and lorry manufacturer Daimler introduced a ‘holiday mode’ to its corporate email system, allowing employees to opt out of receiving messages when not in office (Bryant, 2014). The German ministry of labour also eliminated after-hours delivery of emails, following an example set previously by Volkswagen (de Castella, 2014).
15. Minimise variability in working hours and maximize employees’ control. Another employer-led intervention which can be expected to lead to positive sleep outcomes is to minimise variability in working hours and to give employees more control over their schedules. This recommendation mirrors the findings from the systematic review and meta-analyses by Linton et al. (2015) which concluded that shift work was likely associated with future sleep disturbances. The same study also found that perceived higher levels of control at work, including pace of work, was associated with fewer sleep problems. Similarly, a survey of manufacturing-sector employees by Kubo et al. (2013) found that workers who reported a high degree of control over their working time and/or low variability in working hours also reported significantly higher quality of sleep. In this context, availability of flexible scheduling of work may be of particular benefit to employees with high conflicts between work and family responsibilities, such as new parents (Berkman et al., 2015).
5.2.3. Recommendations targeting public authorities
The third group of recommendations targets public authorities and policymakers. Frequently, public authorities and their activities may enhance the implementation and effectiveness of measures put in place by individuals and employers, as illustrated in the following categories. 16. Raise general awareness of the benefits of sleep. While many people typically agree on the importance of sleep, they may not be aware of the full extent of the relationship between sleep and health and well-being (Royal Society for Public Health and University of Oxford, 2016). There may also be a disconnect between individuals’ perceived and actual sleep-related behaviours and hygiene (Bonuck et al., 2016). As a result, public authorities and other stakeholders have a role in raising general awareness of the consequences of sleep loss and of strategies to combat it (Colten & Altevogt, 2006; Perry et al., 2013). In doing so, synergies can be explored, with initiatives undertaken by third-sector organisations such as the
RAND Europe
59
Sleep Awareness Week run by the National Sleep Foundation (National Sleep Foundation, 2016) and the
Australia-based Sleep Awareness Week run by the Sleep Health Foundation.44
17. Support health professionals in providing sleep-related help. In addition to the general public, awareness campaigns and wider support activities should also be aimed at professionals so that they are best equipped to assist individuals suffering from sleep disorders (Perry et al. 2013). Efforts in this area may contribute to a more systematic inclusion of sleep as a medical issue and health behaviour in the work of health-care providers, which is often lacking (Papp et al., 2002; Sorscher, 2008). In addition to awareness campaigns, professional clinical guidelines and training represent important platforms to support health practitioners (Royal Society for Public Health and University of Oxford 2016). One recent example are the guidelines which recommend cognitive behavioural therapy for insomnia (CBT-I) as the most effective and safest option, rather than pharmacological solutions (Qaseem et al., 2016).
18. Encourage employers to pay attention to sleep issues. As with interventions targeting individuals, public-health and other relevant authorities have a role to play in supporting the implementation of measures by employers, for instance by publishing and communicating good-practice guidelines in areas such as shift work and night work (see, for example, Irish Health and Safety Authority, 2012; UK Health and Safety Executive, 2006). Social partners, such as trade unions and professional organisations, also represent an important partners for public authorities in this area given their contribution to occupational health and safety (Quinlan, 2015).
19. Make use of existing workspace mandates and their enforcement. Following on from the previous point, public authorities should not only advise and provide guidelines, but also ensure that employers remain compliant with all their legal responsibilities in the area of occupational health and safety (Royal Society for Public Health and University of Oxford 2016). In the European context, sleep-related examples mandated by the European Working Time Directive (2003/88/EC) include provisions relating to maximum working hours, minimum periods of rest and free health assessments for night workers (European Commission, 2003).
20. Introduce later school starting times. The ability of public authorities to help promote more effective schedules extends beyond regulating and working with employers but can also be applied to other areas, such as school starting times. Reflecting a growing body of research demonstrating the negative outcomes associated with insufficient pupil sleep time (Minges & Redeker, 2016; Wheaton et al., 2016), later school starting times have been called for by numerous relevant bodies (e.g. American
Adademy of Pediatrics, 2014) and have already been implemented in a number of places.45 In addition to
44 Sleep Health Foundation (2016) Sleep Awareness Week 2016. As of 25 October 2016: http://www.sleephealthfoundation.org.au/public-information/key-events/about-sleep-awareness-week.html 45 For an example of a list compiled by a U.S.-based advocacy group, see http://www.startschoollater.net/success-stories.html [as of 26 October 2016].

Why sleep matters – the economic costs of insufficient
60
health benefits, delayed school starts have also been found to be beneficial in economic terms (Jacob &
Rockoff, 2011).46
21. Support further research and monitoring in the area of sleep. Finally, public authorities should continue to advance our understanding of sleep and related issues and disorders. To that end, surveillance and monitoring of sleep prevalence and sleep-related health problems should be enhanced (Colten and Altevogt, 2006), accompanied by a continuation and intensification of research efforts. While the identification of research needs should be updated on a continual basis, research areas identified as being in particular need of attention (see e.g. Colten and Altevogt, 2006; Linton et al., 2015) include, but are not limited to: (1) development and validation of the efficacy of novel diagnostic technologies; (2) development of novel therapeutic options; (3) integration of research areas and disciplines relevant to sleep disorders and somnology; and (4) greater understanding of the mechanisms between various risk factors and sleep outcomes. As a consequence, furthering the scientific understanding of sleep and sleep-related disorders will also help inform future directions in the provision of medical and psychosocial assistance to those in need.
46 Jacob and Rockoff (2011) estimated the benefits-to-costs ratio of later start times in the U.S. context to be 9 to 1. This analysis used lifetime earnings gains per student as a measure of benefits and did not include other potential benefits discussed in this report.

61
References
Åkerstedt, Torbjörn, & Nilsson, Peter M. (2003). Sleep as restitution: an introduction. Journal of internal medicine, 254(1), 6-12.
Åkerstedt, Torbjörn, Fredlund, Peeter, Gillberg, Mats, & Jansson, Bjarne. (2002). Work load and work hours in relation to disturbed sleep and fatigue in a large representative sample. Journal of psychosomatic research, 53(1), 585-588.
AlGhanim, Nayef, Comondore, Vikram R, Fleetham, John, Marra, Carlo A, & Ayas, Najib T. (2008). The economic impact of obstructive sleep apnea. Lung, 186(1), 7-12.
Allan, Grant, Lecca, Patrizio, McGregor, Peter, & Swales, Kim. (2014). The economic and environmental impact of a carbon tax for Scotland: a computable general equilibrium analysis. Ecological Economics, 100, 40-50.
Allen Jr, Harris M, & Bunn III, William B. (2003). Validating self-reported measures of productivity at work: a case for their credibility in a heavy manufacturing setting. Journal of occupational and environmental medicine, 45(9), 926-940.
Amagai, Yoko, Ishikawa, Shizukiyo, Gotoh, Tadao, Doi, Yuriko, Kayaba, Kazunori, Nakamura, Yosikazu, & Kajii, Eiji. (2004). Sleep duration and mortality in Japan: the Jichi medical school cohort study. Journal of epidemiology, 14(4), 124-128.
American Academy of Sleep Medicine. (2014). Rising prevalence of sleep apnea in U.S. threatens public health. National Healthy Sleep Awareness Project.
American Adademy of Pediatrics. (2014). School Start Times for Adolescents. Policy Statement. Policy Statement, August 2014.
Angrist, Joshua D, & Pischke, Jörn-Steffen. (2010). The credibility revolution in empirical economics: How better research design is taking the con out of econometrics. The Journal of Economic Perspectives, 24(2), 3-30.
Ásgeirsdóttir, Tinna Laufey, Corman, Hope, Noonan, Kelly, Ólafsdóttir, Þórhildur, & Reichman, Nancy E. (2014). Was the economic crisis of 2008 good for Icelanders? Impact on health behaviors. Economics & Human Biology, 13, 1-19.
Auerbach, Alan J, & Kotlikoff, Laurence J. (1987). Dynamic fiscal policy (Vol. 11): Cambridge University Press Cambridge.

62
Baikie, Karen A, & Wilhelm, Kay. (2005). Emotional and physical health benefits of expressive writing. Advances in psychiatric treatment, 11(5), 338-346.
Bellavia, Andrea, Åkerstedt, Torbjörn, Bottai, Matteo, Wolk, Alicja, & Orsini, Nicola. (2013). Sleep duration and survival percentiles across categories of physical activity. American journal of epidemiology, 179(4), 484-491.
Berkman, Lisa F, Kawachi, Ichiro, & Glymour, M Maria. (2014). Social epidemiology. Oxford University Press.
Berkman, Lisa F, Liu, Sze Yan, Hammer, Leslie, Moen, Phyllis, Klein, Laura Cousino, Kelly, Erin, . . . Karuntzos, Georgia. (2015). Work–family conflict, cardiometabolic risk, and sleep duration in nursing employees. Journal of occupational health psychology, 20(4), 420.
Bloom, David E, Canning, David, & Graham, Bryan. (2003). Longevity and Life‐cycle Savings*. The Scandinavian Journal of Economics, 105(3), 319-338.
Blunden, Sarah, Lushington, Kurt, Kennedy, Declan, Martin, James, & Dawson, Drew. (2000). Behavior and neurocognitive performance in children aged 5-10 years who snore compared to controls. Journal of Clinical and Experimental neuropsychology, 22(5), 554-568.
Bolge, Susan C, Doan, Justin F, Kannan, Hema, & Baran, Robert W. (2009). Association of insomnia with quality of life, work productivity, and activity impairment. Quality of Life Research, 18(4), 415.
Bonuck, Karen A, Schwartz, Barbara, & Schechter, Clyde. (2016). Sleep health literacy in head start families and staff: exploratory study of knowledge, motivation, and competencies to promote healthy sleep. Sleep health, 2(1), 19.
Bootzin, Richard R, Epstein, Dana, & Wood, James M. (1991). Stimulus control instructions Case studies in insomnia (pp. 19-28): Springer.
Boubekri, Mohamed, Cheung, Ivy N, Reid, Kathryn J, Kuo, Nai-Wen, Wang, Chia-Hui, & Zee, Phyllis C. (2014). Impact of Windows and Daylight Exposure on Overall Health and Sleep Quality of Office Workers-A Case-Control Pilot Study 2. Disclosure, 19, 20.
Bryant, Chris. (2014). Auf wiedersehen, post–Daimler staff get break from holiday email. Financial Times, August 13, 2014.
Burazeri, Genc, Gofin, Jaime, & Kark, Jeremy D. (2003). Over 8 hours of sleep--marker of increased mortality in Mediterranean population: follow-up population study. Croatian medical journal, 44(2), 193-198.
Buysse, Daniel J, Germain, Anne, Moul, Douglas E, Franzen, Peter L, Brar, Laurie K, Fletcher, Mary E, . . . Reynolds, Charles F. (2011). Efficacy of brief behavioral treatment for chronic insomnia in older adults. Archives of internal medicine, 171(10), 887-895.
Cai, Hui, Shu, Xiao-Ou, Xiang, Yong-Bing, Yang, Gong, Li, Honglan, Ji, Bu-Tian, . . . Zheng, Wei. (2015). Sleep duration and mortality: a prospective study of 113,138 middle-aged and elderly Chinese men and women. Sleep, 38(4), 529-536.

63
Cappuccio, Francesco P, Cooper, Daniel, D'Elia, Lanfranco, Strazzullo, Pasquale, & Miller, Michelle A. (2011). Sleep duration predicts cardiovascular outcomes: a systematic review and meta-analysis of prospective studies. European heart journal, 32(12), 1484-1492.
Cappuccio, Francesco P, D'Elia, Lanfranco, Strazzullo, Pasquale, & Miller, Michelle A. (2010). Sleep duration and all-cause mortality: a systematic review and meta-analysis of prospective studies. Sleep, 33(5), 585.
Card, David, & Krueger, Alan B. (1995). Time-series minimum-wage studies: a meta-analysis. The American Economic Review, 85(2), 238-243.
Carrell, Scott E., Maghakian, Teny, & West, James E. (2011). A's from Zzzz's? The Causal Effect of School Start Time on the Academic Achievement of Adolescents. American Economic Journal: Economic Policy, 3(3), 62-81.
Castro‐Costa, Érico, Dewey, Michael E, Ferri, Cleusa P, Uchoa, Elizabeth, Firmo, Joselia OA, Rocha, Fabio L, . . . Stewart, Robert. (2011). Association between sleep duration and all‐cause mortality in old age: 9‐year follow‐up of the Bambuí Cohort Study, Brazil. Journal of sleep research, 20(2), 303-310.
Chang, Anne-Marie, Aeschbach, Daniel, Duffy, Jeanne F, & Czeisler, Charles A. (2015). Evening use of light-emitting eReaders negatively affects sleep, circadian timing, and next-morning alertness. Proceedings of the National Academy of Sciences, 112(4), 1232-1237.
Chen, Hsi-Chung, Su, Tung-Ping, & Chou, Pesus. (2013). A nine-year follow-up study of sleep patterns and mortality in community-dwelling older adults in Taiwan. Sleep, 36(8), 1187.
Chien, Kuo-Liong, Chen, Pei-Chung, Hsu, Hsiu-Ching, Su, Ta-Chen, Sung, Fung-Chang, Chen, Ming-Fong, & Lee, Yuan-Teh. (2010). Habitual sleep duration and insomnia and the risk of cardiovascular events and all-cause death: report from a community-based cohort. Sleep, 33(2), 177.
Chilcott, Lisa A, & Shapiro, Colin M. (1996). The socioeconomic impact of insomnia. Pharmacoeconomics, 10(1), 1-14.
Clark, Ian, & Landolt, Hans Peter. (2016). Coffee, caffeine, and sleep: A systematic review of epidemiological studies and randomized controlled trials. Sleep medicine reviews.
Colten, Harvey R. , & Altevogt, Bruce M. (2006). Sleep Disorders and Sleep Deprivation: An Unmet Public Health Problem. Committee on Sleep Medicine and Research; Board on Health Sciences Policy; Institute of Medicine.
Costa-Font, Joan, McGuire, Alistair, & Stanley, Tom. (2013). Publication selection in health policy research: The winner's curse hypothesis. Health policy, 109(1), 78-87.
de Castella, Tom. (2014). Could work emails be banned after 6pm? BBC News Magazine, April 10, 2014.
Deal, Jennifer J. (2013). Always on, never done? Don’t blame the smartphone. Center for Creative Leadership.

64
Dean, Bonnie, Aguilar, Daniel, Shapiro, Colin, Orr, William C, Isserman, Joshua A, Calimlim, Brian, & Rippon, Gregory A. (2010). Impaired health status, daily functioning, and work productivity in adults with excessive sleepiness. Journal of Occupational and Environmental Medicine, 52(2), 144-149.
DeGroot, Morris. H., & Schervish, Mark J. (2002). Probability and Statistics: Addison-Wesley.
Dement, William C., & Vaughan, Christopher C. (1999). The Promise of Sleep: A Pioneer in Sleep Medicine Explores the Vital Connection Between Health, Happiness, and a Good Night's Sleep: Delacorte Press.
Diamond, Peter A. (1965). National debt in a neoclassical growth model. The American Economic Review, 55(5), 1126-1150.
DiGiulio, Sarah (2016). Why This Company Is Paying Its Employees To Sleep More. Huffington Post, April 14, 2016.
Dinges, David F., Graeber, R. Curtis, Carskadon, Mary A, Czeisler, Charles A, & Dement, William C. (1989). Attending to Inattention. Science, 245(4916), 342-343.
Doucouliagos, Hristos, & Stanley, Tom D. (2009). Publication selection bias in minimum‐wage research? A meta‐regression analysis. British Journal of Industrial Relations, 47(2), 406-428.
Drake, Christopher L, Roehrs, Timothy, Richardson, Gary, Walsh, James K, & Roth, Thomas. (2004). Shift work sleep disorder: prevalence and consequences beyond that of symptomatic day workers. Sleep, 27(8), 1453-1462.
Eaton, Danice K, McKnight-Eily, Lela R, Lowry, Richard, Perry, Geraldine S, Presley-Cantrell, Letitia, & Croft, Janet B. (2010). Prevalence of insufficient, borderline, and optimal hours of sleep among high school students–United States, 2007. Journal of Adolescent Health, 46(4), 399-401.
Ebrahim, Irshaad O, Shapiro, Colin M, Williams, Adrian J, & Fenwick, Peter B. (2013). Alcohol and sleep I: effects on normal sleep. Alcoholism: Clinical and Experimental Research, 37(4), 539-549.
Egger, Matthias, Smith, George Davey, Schneider, Martin, & Minder, Christoph. (1997). Bias in meta-analysis detected by a simple, graphical test. Bmj, 315(7109), 629-634.
Enstrom, James E, & Breslow, Lester. (2008). Lifestyle and reduced mortality among active California Mormons, 1980–2004. Preventive medicine, 46(2), 133-136.
European Commission. (2003). Working Conditions - Working Time Directive. As of November 28, 2016: http://ec.europa.eu/social/main.jsp?catId=706&langId=en&intPageId=205
Exelmans, Liese, & Van den Bulck, Jan. (2016). Bedtime mobile phone use and sleep in adults. Social Science & Medicine, 148, 93-101.
Ferrie, Jane E, Kumari, Meena, Salo, Paula, Singh-Manoux, Archana, & Kivimäki, Mika. (2011). Sleep epidemiology—a rapidly growing field. International journal of epidemiology, 40(6), 1431-1437.
Ferrie, Jane E, Shipley, Martin J, Cappuccio, Francesco P, Brunner, Eric, Miller, Michelle A, Kumari, Meena, & Marmot, Michael G. (2007). A prospective study of change in sleep du-ration; associations with mortality in the whitehall II cohort. Sleep, 30(12), 1659-1666.

65
Foley, Daniel J. (2004). An epidemiological perspective on one tale of a two-tailed hypothesis. Sleep medicine reviews, 8(3), 155-157.
Fredriksen, Katia, Rhodes, Jean, Reddy, Ranjini, & Way, Niobe. (2004). Sleepless in Chicago: tracking the effects of adolescent sleep loss during the middle school years. Child development, 75(1), 84-95.
Gallicchio, Lisa, & Kalesan, Bindu. (2009). Sleep duration and mortality: a systematic review and meta‐analysis. Journal of sleep research, 18(2), 148-158.
Gangwisch, James E, Heymsfield, Steven B, Boden-Albala, Bernadette, Buijs, Ruud M, Kreier, Felix, Opler, Mark G, . . . Malaspina, Dolores. (2008). Sleep duration associated with mortality in elderly, but not middle-aged, adults in a large US sample. Sleep, 31(8), 1087-1096.
Gangwisch, James E, Heymsfield, Steven B, Boden-Albala, Bernadette, Buijs, Ruud M, Kreier, Felix, Pickering, Thomas G, . . . Malaspina, Dolores. (2007). Sleep duration as a risk factor for diabetes incidence in a large US sample. Sleep, 30(12), 1667-1673.
Garde, Anne Helene, Hansen, Åse Marie, Holtermann, Andreas, Gyntelberg, Finn, & Suadicani, Poul. (2013). Sleep duration and ischemic heart disease and all-cause mortality: prospective cohort study on effects of tranquilizers/hypnotics and perceived stress. Scandinavian journal of work, environment & health, 550-558.
Gerster, Bettina Isenschmid, Calmonte, Roland, & Noack, Horst. (1995). Schlafstörungen bei berufstätigen Männern und Frauen und ihre Beziehung zur Arbeitswelt. Sozial-und Präventivmedizin, 40(5), 275-284.
Ghosh, Pallab. (2015). Why do we sleep? BBC, May 15, 2015.
Gibson, Matthew, & Shrader, Jeffrey. (2014). Time use and productivity: The wage returns to sleep. UC San Diego Department of Economics Working Paper.
Giuntella, Osea, Han, Wei, & Mazzonna, Fabrizio. (2015). Circadian rhythms, sleep and cognitive skills. Evidence From an Unsleeping Giant.
Goto, Aya, Yasumura, Seiji, Nishise, Yuko, & Sakihara, Seizo. (2003). Association of health behavior and social role with total mortality among Japanese elders in Okinawa, Japan. Aging clinical and experimental research, 15(6), 443-450.
Grandner, Michael A, Hale, Lauren, Moore, Melisa, & Patel, Nirav P. (2010). Mortality associated with short sleep duration: the evidence, the possible mechanisms, and the future. Sleep medicine reviews, 14(3), 191-203.
Groves, Robert M, & Peytcheva, Emilia. (2008). The impact of nonresponse rates on nonresponse bias a meta-analysis. Public opinion quarterly, 72(2), 167-189.
Hafner, Marco, van Stolk, Christian, Saunders, Catherine L., Krapels, Joachim, & Baruch, Ben. (2015). Health, wellbeing and productivity in the workplace: A Britain's Healthiest Company summary report. RAND Europe report.

66
Hale, Lauren, & Guan, Stanford. (2015). Screen time and sleep among school-aged children and adolescents: a systematic literature review. Sleep medicine reviews, 21, 50-58.
Hall, Martica H, Smagula, Stephen F, Boudreau, Robert M, Ayonayon, Hilsa N, Goldman, Suzanne E, Harris, Tamara B, . . . Satterfield, Suzanne. (2015). Association between sleep duration and mortality is mediated by markers of inflammation and health in older adults: the health, aging and body composition study. Sleep, 38(2), 189.
Hanse, Gary D. (1993). The cyclical and secular behaviour of the labour input: Comparing efficiency units and hours worked. Journal of Applied Econometrics, 8(1), 71-80.
Härmä, Mikko, Tenkanen, Leena, Sjöblom, Tom, Alikoski, Tiina, & Heinsalmi, Pertti. (1998). Combined effects of shift work and life-style on the prevalence of insomnia, sleep deprivation and daytime sleepiness. Scandinavian journal of work, environment & health, 300-307.
Harvard Medical School. (2007). Twelve Simple Tips to Improve Your Sleep. As of 28 November 2016: http://healthysleep.med.harvard.edu/healthy/getting/overcoming/tips
Health care strategic management. (2001). Sleep disorders create growing opportunities for hospitals. Health care strategic management, 19(2), 16-17.
Heer, Burkhard, & Maussner, Alfred. (2009). Dynamic general equilibrium modeling: computational methods and applications: Springer Science & Business Media.
Heiskel, Harald, Gunzenhäuser, Ditz, Seidler, Andreas, Volk, Stephan, Pflug, Burkhard, Kauppinen, Timo, & Elsner, Gine. (2002). Sleep apnea and occupational exposure to solvents. Scandinavian journal of work, environment & health, 249-255.
Heo, Yong-Seok, Chang, Sei-Jin, Park, Shin-Goo, Leem, Jong-Han, Jeon, Sung-Hwan, Lee, Bum-Joon, . . . Kim, Hwan-Cheol. (2013). Association between workplace risk factor exposure and sleep disturbance: analysis of the 2nd Korean Working Conditions Survey. Annals of occupational and environmental medicine, 25(1), 1.
Heslop, Pauline, Smith, George Davey, Metcalfe, Chris, Macleod, John, & Hart, Carole. (2002). Sleep duration and mortality: the effect of short or long sleep duration on cardiovascular and all-cause mortality in working men and women. Sleep medicine, 3(4), 305-314.
Higgins, Julian PT, & Green, Sally. (2011). Cochrane Handbook for Systematic Reviews of Interventions. The Cochrane Collaboration, 2011.
Hillman, David R, Murphy, Anita S, & Pezzullo, Lynne. (2006). The economic cost of sleep disorders. Sleep, 29(3), 299-305.
Hublin, Christer, Partinen, Markku, Koskenvuo, Markku, & Kaprio, Jaakko. (2007). Sleep and mortality: a population-based 22-year follow-up study. Sleep 30(10), 1245.
Huggett, Mark. (1996). Wealth distribution in life-cycle economies. Journal of Monetary Economics, 38(3), 469-494.

67
Hunsinger, Eddie. (n.d.). Applied demography toolbox: Tim Chapin’s cohort component model spreadsheet. University of California, Berkley, Department of Demography
Huppke, Rex. (2016). Companies need to recognize the importance of sleep. Chicago Tribune, March 11, 2016.
Ikehara, Satoyo, Iso, Hiroyasu, Date, Chigusa, Kikuchi, Shogo, Watanabe, Yoshiyuki, Wada, Yasuhiko, . . . Tamakoshi, Akiko. (2009). Association of sleep duration with mortality from cardiovascular disease and other causes for Japanese men and women: the JACC study. Sleep, 32(3), 259-301.
Irish Health and Safety Authority. (2012). Guidelines for Employers and Employees on Night and Shift Work. As of 28 November 2016: www.hsa.ie/eng/Publications_and_Forms/Publications/ Healthcare_Sector/Night_and_Shift_Work_2012.pdf
Jacob, Brian A, & Rockoff, Jonah E. (2011). Organizing schools to improve student achievement: Start times, grade configurations, and teacher assignments: Brookings Institution, Hamilton Project.
Jaehne, Andreas, Loessl, Barbara, Bárkai, Zsuzsanna, Riemann, Dieter, & Hornyak, Magdolna. (2009). Effects of nicotine on sleep during consumption, withdrawal and replacement therapy. Sleep medicine reviews, 13(5), 363-377.
Jung, Kyu-In, Song, Chan-Hee, Ancoli-Israel, Sonia, & Barrett-Connor, Elizabeth. (2013). Gender differences in nighttime sleep and daytime napping as predictors of mortality in older adults: the Rancho Bernardo Study. Sleep medicine, 14(1), 12-19.
Kakizaki, Masako, Kuriyama, Shinichi, Nakaya, Naoki, Sone, Toshimasa, Nagai, Masato, Sugawara, Yumi, Tsuji, Ichiro. (2013). Long sleep duration and cause‐specific mortality according to physical function and self‐rated health: the Ohsaki Cohort Study. Journal of sleep research, 22(2), 209-216.
Katz, Abigail S, Pronk, Nicolaas P, & Lowry, Marcia. (2014). The Association Between Optimal Lifestyle-Related Health Behaviors and Employee Productivity. Journal of Occupational and Environmental Medicine, 56(7), 708-713.
Kaufman, Alexander C. (2016). Marriott CEO: Stop Applauding People Who Boast About Not Sleeping. The Huffington Post, January 23, 2016.
Kessler, Ronald C, Berglund, Patricia A, & Coulouvrat, Catherine. (2012). Insomnia and the performance of US workers: results from the America Insomnia Survey (vol 34, pg 1161, 2011). Sleep, 35(6), 725-725.
Kim, Yeonju, Wilkens, Lynne R, Schembre, Susan M, Henderson, Brian E, Kolonel, Laurence N, & Goodman, Marc T. (2013). Insufficient and excessive amounts of sleep increase the risk of premature death from cardiovascular and other diseases: the Multiethnic Cohort Study. Preventive medicine, 57(4), 377-385.
Knutson, Kristen L, & Turek, Fred W. (2006). The U-shaped association between sleep and health: the 2 peaks do not mean the same thing. Sleep, 29(7), 878-879.
Kochanek, Kenneth D, Murphy, Sherry L, Xu, Jiaquan, & Arias, Elizabeth. (2014). Mortality in the United States, 2013. NCHS data brief, 178(178), 1-8.

68
Kojima, Masayo, Wakai, Kenji, Kawamura, Takashi, Tamakoshi, Akiko, Aoki, Rie, Lin, Yingsong, . . . Ohno, Yoshiyuki. (2000). Sleep patterns and total mortality: a 12-year follow-up study in Japan. Journal of epidemiology, 10(2), 87-93.
Kripke, Daniel F, Garfinkel, Lawrence, Wingard, Deborah L, Klauber, Melville R, & Marler, Matthew R. (2002). Mortality associated with sleep duration and insomnia. Archives of general psychiatry, 59(2), 131-136.
Kronholm, Erkki, Härmä, Mikko, Hublin, Christer, Aro, Arja R, & Partonen, Timo. (2006). Self‐reported sleep duration in Finnish general population. Journal of sleep research, 15(3), 276-290.
Kronholm, Erkki, Laatikainen, Tiina, Peltonen, Markku, Sippola, Risto, & Partonen, Timo. (2011). Self-reported sleep duration, all-cause mortality, cardiovascular mortality and morbidity in Finland. Sleep medicine, 12(3), 215-221.
Krueger, Dirk, & Ludwig, Alexander. (2013). Optimal Progressive Taxation and Education: Subsidies in a Model of Endogenous Human Capital Formation: MEA.
Krueger, Patrick M, & Friedman, Elliot M. (2009). Sleep duration in the United States: a cross-sectional population-based study. American journal of epidemiology, 169(9), 1052-1063.
Kubo, Tokuro, Takahashi, Masaya, Togo, Fumiharu, Liu, Xinxin, Shimazu, A, Tanaka, Katsutashi, & Takaya, M. (2013). Effects on employees of controlling working hours and working schedules. Occupational medicine, 63(2), 148.
Lan, Tzuo-Yun, Lan, Tsuo-Hung, Wen, Chi-Pang, Lin, Yu-Hsuan, & Chuang, Yi-Li. (2007). Nighttime sleep, Chinese afternoon nap, and mortality in the elderly. Sleep 30(9), 1105.
Lauderdale, Diane S, Knutson, Kristen L, Yan, Lijing L, Liu, Kiang, & Rathouz, Paul J. (2008). Self-reported and measured sleep duration: how similar are they? Epidemiology (Cambridge, Mass.), 19(6), 838-845.
Leger, Damien, Levy, Emile, & Paillard, Michel. (1999). The direct costs of insomnia in France. Sleep, 22, S394-401.
Lemola, Sakari, Perkinson-Gloor, Nadine, Brand, Serge, Dewald-Kaufmann, Julia F., & Grob, Alexander. (2015). Adolescents’ Electronic Media Use at Night, Sleep Disturbance, and Depressive Symptoms in the Smartphone Age. Journal of Youth and Adolescence, 44(2), 405-418.
Leng, Yue, Cappuccio, Francesco P, Wainwright, Nick WJ, Surtees, Paul G, Luben, Robert, Brayne, Carol, & Khaw, Kay-Tee. (2015). Sleep duration and risk of fatal and nonfatal stroke A prospective study and meta-analysis. Neurology, 84(11), 1072-1079.
Li, Shenghui, Arguelles, Lester, Jiang, Fan, Chen, Wenjuan, Jin, Xingming, Yan, Chonghuai, . . . Zhang, Jun. (2013). Sleep, school performance, and a school-based intervention among school-aged children: a sleep series study in China. PLoS One, 8(7), e67928.
Li, Ying, Sato, Yasuto, & Yamaguchi, Naohito. (2013). Potential biochemical pathways for the relationship between sleep duration and mortality. Sleep Medicine, 14(1), 98-104.

69
Lindelof, Birgitta, Almkvist, Ove, & Göthe, Carl-Johan. (1992). Sleep disturbances and exposure to organic solvents. Archives of Environmental Health: An International Journal, 47(2), 104-106.
Linton, Steven J, Kecklund, Göran, Franklin, Karl A, Leissner, Lena C, Sivertsen, Børge, Lindberg, Eva, . . . Hetta, Jerker. (2015). The effect of the work environment on future sleep disturbances: a systematic review. Sleep medicine reviews, 23, 10-19.
Lira, Fábio S, Pimentel, Gustavo D, Santos, Ronaldo VT, Oyama, Lila M, Damaso, Ana R, do Nascimento, Cláudia M Oller, Santana, Marcos G. (2011). Exercise training improves sleep pattern and metabolic profile in elderly people in a time-dependent manner. Lipids in health and disease, 10(1), 1.
Liu, Tong-Zu, Xu, Chang, Rota, Matteo, Cai, Hui, Zhang, Chao, Shi, Ming-Jun, . . . Kwong, Joey SW. (2016). Sleep duration and risk of all-cause mortality: A flexible, non-linear, meta-regression of 40 prospective cohort studies. Sleep medicine reviews.
Liu, Yong, Wheaton, Anne G, Chapman, Daniel P, Cunningham, Timothy J, Lu, Hua, & Croft, Janet B. (2014). Prevalence of Healthy Sleep Duration among Adults — United States. MMWR Morb Mortal Wkly Rep 2016, 65, 137-141.
Locke, Sussannah. (2014). Why do people need to sleep? Here are 5 possible theories. Vox, September 5, 2014.
Lofgren, Hans, Cicowiez, Martin, & Diaz-Bonilla, Carolina. (2013). MAMS—a computable general equilibrium model for developing country strategy analysis. Handbook of Computable General Equilibrium Modeling SET.
Lofland, Jennifer H, Pizzi, Laura, & Frick, Kevin D. (2004). A review of health-related workplace productivity loss instruments. Pharmacoeconomics, 22(3), 165-184.
Lu, Yan, Tian, Nong, Yin, Jie, Shi, Yuhua, & Huang, Zhenping. (2013). Association between sleep duration and cancer risk: a meta-analysis of prospective cohort studies. PloS one, 8(9), e74723.
Magee, Christopher A, Iverson, Donald C, & Caputi, Peter. (2009). Factors associated with short and long sleep. Preventive medicine, 49(6), 461-467.
Mallon, Lena, Broman, J‐E, & Hetta, Jerker. (2002). Sleep complaints predict coronary artery disease mortality in males: a 12‐year follow‐up study of a middle‐aged Swedish population. Journal of internal medicine, 251(3), 207-216.
Mesas, Arthur E, López-García, Esther, León-Muñoz, Lux M., Guallar-Castillón, Pilar, & Rodríguez-Artalejo, Fernando. (2010). Sleep duration and mortality according to health status in older adults. The American Geriatrics Society, 58(10), 1870-1877.
Minges, Karl E, & Redeker, Nancy S. (2016). Delayed school start times and adolescent sleep: a systematic review of the experimental evidence. Sleep medicine reviews, 28, 82-91.
Modigliani, Franco, & Cao, Shi Larry. (2004). The Chinese saving puzzle and the life-cycle hypothesis. Journal of economic literature, 42(1), 145-170.

70
Moss, Thomas H, & Sills David L. (1981). The Three Mile Island Nuclear Accident: Lessons and Implications. Science, Technology & Human Values, 6(4), 55. doi: 10.1177/016224398100600450
National Commission on Sleep Disorders. (1993). Wake up America a national sleep alert : report of the National Commission on Sleep Disorders Research. [Washington, D.C.]: The Commission.
National Sleep Foundation. (2005). 2005 Sleep in America Poll. As of 28 November 2016: https://sleepfoundation.org/sleep-polls-data/sleep-in-america-poll/2005-adult-sleep-habits-and-styles
National Sleep Foundation. (2006). Teens and Sleep. As of 28 November 2016: https://sleepfoundation.org/sleep-topics/teens-and-sleep
National Sleep Foundation. (2013). International Bedroom Poll. As of 28 November 2016: https://sleepfoundation.org/sleep-polls-data/other-polls/2013-international-bedroom-poll
National Sleep Foundation. (2016). National Sleep Foundation Kicks Off Sleep Awareness Week 2016 with #7Days4BetterSleep. As of 28 November 2016: https://sleepfoundation.org/sleep-news/sleep-awareness-week-2016
National Sleep Foundation. (n.d.). Sleeping at Work: Companies with Nap Rooms and Snooze-Friendly Policies. As of 28 November 2016: https://sleep.org/articles/sleeping-work-companies-nap-rooms-snooze-friendly-policies/
Nishitani, Naoko, Sakakibara, Hisataka, & Akiyama, Izumi. (2013). Short Sleeping Time and Job Stress in Japanese White-Collar Workers. The Open Sleep Journal, 6(1).
Nishiyama, Shinichi, & Smetters, Kent. (2007). Does social security privatization produce efficiency gains? The Quarterly Journal of Economics, 1677-1719.
Nuckols, Teryl K, Bhattacharya, Jay, Wolman, Dianne Miller, Ulmer, Cheryl, & Escarce, José J. (2009). Cost implications of reduced work hours and workloads for resident physicians. New England Journal of Medicine, 360(21), 2202-2215.
Olafsson, Sigurður P. (2015). The Demand for Sleep in the United States: An Empirical analysis. University of Iceland, Bachelor thesis.
Owens, Judith A, Spirito, Anthony, McGuinn, Melissa, & Nobile, Chantelle. (2000). Sleep habits and sleep disturbance in elementary school-aged children. Journal of Developmental & Behavioral Pediatrics, 21(1), 27-36.
Pack, Allan I, Pack, Andrew M, Rodgman, Eric, Cucchiara, Andrew, Dinges, David F, & Schwab, C William. (1995). Characteristics of crashes attributed to the driver having fallen asleep. Accident Analysis & Prevention, 27(6), 769-775.
Pagel, James F, Forister, Natalie, & Kwiatkowki, Carol. (2007). Adolescent sleep disturbance and school performance: the confounding variable of socioeconomics. Journal of clinical sleep medicine: JCSM: official publication of the American Academy of Sleep Medicine, 3(1), 19-23.

71
Papke, Leslie E, & Wooldridge, Jeffrey. (1993). Econometric methods for fractional response variables with an application to 401 (k) plan participation rates: National Bureau of Economic Research Cambridge, Mass., USA.
Papp, Klara K, Penrod, Carolyn E, & Strohl, Kingman P. (2002). Knowledge and attitudes of primary care physicians toward sleep and sleep disorders. Sleep and Breathing, 6(03), 103-110.
Park, Jae Bum, Nakata, Akinori, Swanson, Naomi G, & Chun, Heekyoung. (2013). Organizational factors associated with work-related sleep problems in a nationally representative sample of Korean workers. International archives of occupational and environmental health, 86(2), 211-222.
Patel, Sanjay R, Ayas, Najib T, Malhotra, Mark R, White, David P, Schernhammer, Eva S, Speizer, Frank E, . . . Hu, Frank B. (2004). A prospective study of sleep duration and mortality risk in women. Sleep 27(3), 440-444.
Peppard, Paul E, Young, Terry, Barnet, Jodi H, Palta, Mari, Hagen, Erika W, & Hla, Khin Mae. (2013). Increased prevalence of sleep-disordered breathing in adults. American journal of epidemiology, 177(9), 1006-1014.
Perry, Geraldine S, Patil, Susheel P, & Presley-Cantrell, Letitia R. (2013). Raising awareness of sleep as a healthy behavior. Preventing chronic disease, 10.
Postuma, Ronald B, Montplaisir, Jacques Y, Pelletier, Amélie, Dauvilliers, Yves, Oertel, Wolfgang, . . . Manni, Raffaele. (2012). Environmental risk factors for REM sleep behavior disorder A multicenter case-control study. Neurology, 79(5), 428-434.
Prueher, Ingrid. (2016). Employers and Employees Benefit When Organizations Take an Interest in How Well Employees Are Sleeping. Huffington Post, August 13, 2015.
Punjabi, Naresh M. (2008). The epidemiology of adult obstructive sleep apnea. Proceedings of the American Thoracic Society, 5(2), 136-143.
Qaseem, Amir, Kansagara, Devan, Forciea, Mary Ann, Cooke, Molly, & Denberg, Thomas D. (2016). Management of chronic insomnia disorder in adults: a clinical practice guideline from the American College of Physicians. Annals of internal medicine.
Qiu, Li, Sautter, Jessica, Liu, Yuzhi, & Gu, Danan. (2011). Age and gender differences in linkages of sleep with subsequent mortality and health among very old Chinese. Sleep medicine, 12(10), 1008-1017.
Quinlan, Michael. (2015). The effects of non-standard forms of employment on worker health and safety: International Labour Organization. As of 28 November 2016: http://www.ilo.org/wcmsp5/groups/ public/---ed_protect/---protrav/---travail/documents/publication/wcms_443266.pdf
Reid, Kathryn J, Baron, Kelly Glazer, Lu, Brandon, Naylor, Erik, Wolfe, Lisa, & Zee, Phyllis C. (2010). Aerobic exercise improves self-reported sleep and quality of life in older adults with insomnia. Sleep medicine, 11(9), 934-940.
Rhee, Chul Woo, Kim, Ji Young, Park, Byung Joo, Li, Zhong Min, & Ahn, Yoon-Ok. (2012). Impact of individual and combined health behaviors on all causes of premature mortality among middle aged men in Korea: the Seoul Male Cohort Study. Journal of preventive medicine and public health, 45(1), 14-20.

72
Ribet, Céline, & Derriennic, Francis. (1999). Age, working conditions, and sleep disorders: a longitudinal analysis in the French cohort ESTEV. Sleep: Journal of Sleep Research & Sleep Medicine.
Roberts, Robert E, Roberts, Catherine R, & Chen, Irene G. (2001). Functioning of adolescents with symptoms of disturbed sleep. Journal of Youth and Adolescence, 30(1), 1-18.
Roenneberg, Till. (2013). Chronobiology: The human sleep project. Nature, 498(7455), 427-428.
Rosekind, Mark R, Gregory, Kevin B, Mallis, Melissa M, Brandt, Summer L, Seal, Brian, & Lerner, Debra. (2010). The cost of poor sleep: workplace productivity loss and associated costs. Journal of Occupational and Environmental Medicine, 52(1), 91-98.
Roth, Thomas. (2007). Insomnia: definition, prevalence, etiology, and consequences. Journal of clinical sleep medicine: JCSM: official publication of the American Academy of Sleep Medicine, 3(5 Suppl), S7.
Royal Society for Public Health and University of Oxford. (2016). Waking up to the health benefits of sleep. As of 28 November 2016: https://www.ndcn.ox.ac.uk/news/public-missing-out-on-a-night2019s-worth-of-sleep-every-week/sleep-report-rsph.pdf
Samuelson, Paul A. (1958). An exact consumption-loan model of interest with or without the social contrivance of money. The journal of political economy, 467-482.
Sarsour, Khaled, Kalsekar, Anupama, Swindle, Ralph, Foley, Kathleen, & Walsh, James K. (2011). The association between insomnia severity and healthcare and productivity costs in a health plan sample. Sleep, 34(4), 443-450.
Shahly, Victoria, Berglund, Patricia A, Coulouvrat, Catherine, Fitzgerald, Timothy, Hajak, Goeran, Roth, Thomas, . . . Kessler, Ronald C. (2012). The associations of insomnia with costly workplace accidents and errors: results from the America Insomnia Survey. Archives of general psychiatry, 69(10), 1054-1063.
Shan, Zhilei, Ma, Hongfei, Xie, Manling, Yan, Peipei, Guo, Yanjun, Bao, Wei, Liu, Liegang. (2015). Sleep duration and risk of type 2 diabetes: a meta-analysis of prospective studies. Diabetes Care, 38(3), 529-537.
Shankar, Anoop, Koh, Woon-Puay, Yuan, Jian-Min, Lee, Hin-Peng, & Mimi, C Yu. (2008). Sleep duration and coronary heart disease mortality among Chinese adults in Singapore: a population-based cohort study. American Journal of Epidemiology, 168(12), 1367-1373.
Shen, Xiaoli, Wu, Yili, & Zhang, Dongfeng. (2016). Nighttime sleep duration, 24-hour sleep duration and risk of all-cause mortality among adults: a meta-analysis of prospective cohort studies. Scientific reports, 6.
Simon, Stacey L, Duncan, Christina L, & Mentrikoski, Janelle M. (2014). Primary Insomnia and Sleep Apnea in Pediatric and Adult Populations Handbook of Clinical Psychology in Medical Settings (pp. 565-587): Springer.
Sorscher, Adam J. (2008). How is your sleep: a neglected topic for health care screening. The Journal of the American Board of Family Medicine, 21(2), 141-148.

73
Sperry, Susan D, Scully, Iiona D, Gramzow, Richard H, & Jorgensen, Randall S. (2015). Sleep duration and waist circumference in adults: a meta-analysis. Sleep, 38(8), 1269.
Stamatakis, Katherine A, Kaplan, George A, & Roberts, Robert E. (2007). Short sleep duration across income, education, and race/ethnic groups: population prevalence and growing disparities during 34 years of follow-up. Annals of epidemiology, 17(12), 948-955.
Stanley, Tom, & Doucouliagos, Hristos. (2012). Meta-regression analysis in economics and business (Vol. 5): Routledge.
Stanley, Tom, & Doucouliagos, Hristos. (2014). Meta-regression approximations to reduce publication selection bias. Research Synthesis Methods, 5(1), 60-78.
Stewart, Walter F, Ricci, Judith A, Chee, Elsbeth, & Morganstein, David. (2003). Lost productive work time costs from health conditions in the United States: results from the American Productivity Audit. Journal of Occupational and Environmental Medicine, 45(12), 1234-1246.
Stone, Katie L, Ewing, Susan K, Ancoli‐Israel, Sonia, Ensrud, Kristine E, Redline, Susan, Bauer, Douglas C, Cummings, Steven R. (2009). Self‐Reported Sleep and Nap Habits and Risk of Mortality in a Large Cohort of Older Women. Journal of the American Geriatrics Society, 57(4), 604-611.
Suzuki, Etsuji, Yorifuji, Takashi, Ueshima, Kazumune, Takao, Soshi, Sugiyama, Masumi, Ohta, Toshiki, . . . Doi, Hiroyuki. (2009). Sleep duration, sleep quality and cardiovascular disease mortality among the elderly: a population-based cohort study. Preventive medicine, 49(2), 135-141.
Tachibana, Hiroshi, Izumi, Honda, Horiguchi, Manabe, & Takemoto, (1996). A study of the impact of occupational and domestic factors on insomnia among industrial workers of a manufacturing company in Japan. Occupational medicine, 46(3), 221-227.
Taheri, Shahrad. (2006). The link between short sleep duration and obesity: we should recommend more sleep to prevent obesity. Archives of disease in childhood, 91(11), 881-884.
Tamakoshi, Akiko, & Ohno, Yoshiyuki. (2004). Self-reported sleep duration as a predictor of all-cause mortality: results from the JACC study, Japan. Sleep 27(1), 51-54.
Tang, Kenneth, Beaton, Dorcas E, Boonen, Annelies, Gignac, Monique AM, & Bombardier, Claire. (2011). Measures of work disability and productivity: Rheumatoid Arthritis Specific Work Productivity Survey (WPS‐RA), Workplace Activity Limitations Scale (WALS), Work Instability Scale for Rheumatoid Arthritis (RA‐WIS), Work Limitations Questionnaire (WLQ), and Work Productivity and Activity Impairment Questionnaire (WPAI). Arthritis care & research, 63(S11), S337-S349.
Taylor, Jirka, Hafner, Marco, Yerushalmi, Erez, Smith, Richard, Bellasio, Jacopo., Vardavas, Raffaele, . . . Rubin, Jennifer. (2014). Estimating the economic costs of antimicrobial resistance. RAND Research Report.
Thomas, April Gile, Monahan, Kathryn C, Lukowski, Angela F, & Cauffman, Elizabeth. (2015). Sleep problems across development: A pathway to adolescent risk taking through working memory. Journal of youth and adolescence, 44(2), 447-464.

74
Troxel, Wendy M, Germain, Anne, & Buysse, Daniel J. (2012). Clinical management of insomnia with brief behavioral treatment (BBTI). Behavioral sleep medicine, 10(4), 266-279.
Tsubono, Yoshitaka, Fukao, Akira, & Hisamichi, Shigeru. (1993). Health practices and mortality in a rural Japanese population. The Tohoku journal of experimental medicine, 171(4), 339-348.
UK Health and Safety Executive. (2006). Managing shiftwork: Health and safety guidance. As of 28 November 2016: http://www.hse.gov.uk/pUbns/priced/hsg256.pdf
United Nations, Department of Economic and Social Affairs. (2014). Revision of World Population Prospects. As of 28 November 2016: https://esa.un.org/unpd/wpp/
United States Senate Committee on Energy and Natural Resources. (1986). The Chernobyl accident. Washington: U.S. G.P.O. : For sale by the Supt. of Docs., Congressional Sales Office.
van Dam, Nick, & van der Helm, Els (2016). The organizational cost of insufficient sleep. McKinsey Quarterly, February 2016.
Vgontzas, Alexandros N, Fernandez-Mendoza, Julio, Bixler, Edward O, Singareddy, Ravi, Shaffer, Michele L, Calhoun, Susan L, . . . Chrousos, George P. (2012). Persistent insomnia: the role of objective short sleep duration and mental health. Sleep, 35(1), 61-68.
Vgontzas, Alexandros N, Liao, Duanping, Pejovic, Slobodanka, Calhoun, Susan, Karataraki, Maria, Basta, Maria, . . . Bixler, Edward O. (2010). Insomnia with short sleep duration and mortality: the Penn State cohort. Sleep, 33(9), 1159-1164.
Von Ruesten, Anne, Weikert, Cornelia, Fietze, Ingo, & Boeing, Heiner. (2012). Association of sleep duration with chronic diseases in the European Prospective Investigation into Cancer and Nutrition (EPIC)-Potsdam study. PloS one, 7(1).
Wallander, Mari-Ann, Johansson, Saga, Ruigómez, Ana, Rodriguez, LA Garcia, & Jones, Roger. (2007). Morbidity associated with sleep disorders in primary care: a longitudinal cohort study. Primary care companion to the Journal of clinical psychiatry, 9(5), 338.
Walsh, James K., Dement, William C., & Dinges, David F. (2011). Chapter 62 - Sleep Medicine, Public Policy, and Public Health Principles and Practice of Sleep Medicine (Fifth Edition) (pp. 716-724). Philadelphia: W.B. Saunders.
Wang, Qijuan, Xi, Bo, Liu, Man, Zhang, Yanqing, & Fu, Maosun. (2012). Short sleep duration is associated with hypertension risk among adults: a systematic review and meta-analysis. Hypertension Research, 35(10), 1012-1018.
Weber, Lauren. (2015). Can You Sue the Boss for Making You Answer Late-Night Email? The Wall Street Journal, May 20, 2015.
Wheaton, Anne G, Chapman, Daniel P, & Croft, Janet B. (2016). School Start Times, Sleep, Behavioral, Health, and Academic Outcomes: A Review of the Literature. Journal of School Health, 86(5), 363-381.
Wolfson, Amy R, & Carskadon, Mary A. (1998). Sleep schedules and daytime functioning in adolescents. Child development, 69(4), 875-887.

75
Wong, Patricia M, Hasler, Brant P, Kamarck, Thomas W, Muldoon, Matthew F, & Manuck, Stephen B. (2015). Social jetlag, chronotype, and cardiometabolic risk. The Journal of Clinical Endocrinology & Metabolism, 100(12), 4612-4620.
Wooldridge, Jeffrey M. (2015). Introductory Econometrics: A Modern Approach: Cengage Learning.
Xiao, Qian, Keadle, Sarah K, Hollenbeck, Albert R, & Matthews, Charles E. (2014). Sleep duration and total and cause-specific mortality in a large US cohort: interrelationships with physical activity, sedentary behavior, and body mass index. American journal of epidemiology, 180(10), 997-1006.
Yeo, Yohwan, Ma, Seung Hyun, Park, Sue Kyung, Chang, Soung-Hoon, Shin, Hai-Rim, Kang, Daehee, & Yoo, Keun-Young. (2013). A prospective cohort study on the relationship of sleep duration with all-cause and disease-specific mortality in the Korean Multi-center Cancer Cohort study. Journal of Preventive Medicine and Public Health, 46(5), 271-281.
Zodrow, George R, & Diamond, John W. (2013). Dynamic overlapping generations computable general equilibrium models and the analysis of tax policy: The Diamond–Zodrow Model. Handbook of Computable General Equilibrium Modeling, 1, 743-813.

76
Appendix A: List of studies used in the meta-analysis
Study # estimates
Amagai et al. (2004) 8 Bellavia et al. (2013) 3 Enstrom and Breslow (2008) 1 Burazeri et al. (2003) 8 Cai et al. (2015) 6 Castro‐Costa et al. (2011) 8 Chen et al. (2013) 2 Chien et al. (2010) 6 J. Ferrie et al. (2007) 8 J. E. Gangwisch et al. (2008) 7 Garde et al. (2013) 8 Goto et al. (2003) 4 Hall et al. (2015) 4 Heslop et al. (2002) 6 Hublin et al. (2007) 3 Ikehara et al. (2009) 12 Jung et al. (2013) 8 Kakizaki et al. (2013) 2 Kim et al. (2013) 4 Kojima et al. (2000) 4 Kripke et al. (2002) 6 Kronholm et al. (2011) 12 Lan et al. (2007) 6 Y. Li et al. (2013) 4 Magee et al. (2009) 3 Mesas et al. (2010) 4 Patel et al. (2004) 5 Qiu et al. (2011) 15 Rhee et al. (2012) 2 Stone et al. (2009) 2 Suzuki et al. (2009) 18 Y. Tsubono et al. (1993) 1 Von Ruesten et al. (2012) 4 Wallander et al. (2007) 3 Yeo et al. (2013) 4 Xiao et al. (2014) 4
RAND Europe
77
Appendix B: Macroeconomic model description
The simulation model used in our study is an overlapping generations (OLG) model first introduced by Samuelson (1958) and Diamond (1965) and later developed by Auerbach and Kotlikoff (1987) who used simulated a pioneering large-scale numerical OLG model to evaluate fiscal policies. Unlike other models assuming all workers to be essentially equal, OLG model by definition assumes that the modelled economy is represented by people of different ages, which is necessary to capture effects of sleep deficiency through various means. Moreover, to allow for effects to differ across income groups, we further differentiate among workers in terms of their skill in a similar fashion to Heer and Maussner (2009) and Krueger and Ludwig (2013).
The economy has three sectors – households, firms, and government – which continuously interact on the markets just as in reality. Specifically, firms, representing the production sector, hire labour supplied by households to create output, paying wages in exchange for labour and interest rate as a cost of capital. In absence of international trade and public enterprises, all assets within the economy are ultimately in possession of people and they also constitute the final consumer of all production. Government collects income taxes from individuals and subsequently provides them with retirement benefits. We assume that the foreign trade effect is negligible as sleep deficiency has no direct influence on it and do not explicitly model foreign economies.
Households
Households and individuals are used interchangeably in the model and we only assume individuals aged 18+ in the economy (i.e. those economically active) in line with the related literature in order to decrease computation requirements. All people are assumed to live 60 years from the inception of their professional careers, out of which they spend = 43 years working and = 17 in retirement, reflecting that the retirement age is set at around 65 years in the developed countries and the average life expectancy is slightly over 80 years according to the World Bank data. Since life expectancy in the model remains constant over the assumed period, retirement age also remains unchanged.
All individuals in the model are assumed to start working at the age of 18. The labour supply is exogenously set at 8 hours per workday for everyone. We model the differences in their skillsets, schooling and other personal characteristics through explicit determination of a labour-endowment distribution and its changes over time. This implicitly introduces variation in shift length as well in a way that the ultimate distribution of labour output resembles what we can observe in reality. This can be understood also as a tool to model intra-generation wage distribution including probability of being unemployed, ill, unable to work or, on the other hand, promoted or finding a better job. Specifically, we assume each individual is

Why sleep matters – the economic costs of insufficient
78
subject to an idiosyncratic productivity shock log-normally distributed with mean and variance . Over individuals life, the idiosyncratic productivity shock follows a Markov (AR(1)) process given by = + , where ~ (0, ), and thus depends on its past realisations.47
In order to approximate the autoregressive process, the continuum of all possible shocks must be limited; to do so, we follow Huggett (1996) and discretize the state space Z containing all shocks into nine realizations ranging from −2 to 2 . These realizations in fact constitute nine different income classes. The probability of having a given productivity shock can then be computed using integration over
corresponding area under the normal distribution, and the efficiency index ( , ) = , where represents agent’s age and is the mean log-normal income of -aged workers, follows a finite Markov chain. Given wage defined below, tax rate and labour supply , the total annual salary can then be calculated as = (1 − ) ( , ) . Individuals within one cohort differ in their earnings in a way such that the resulting after tax Gini coefficient (a measure of statistical distribution of income) closely follows empirical data. In particular, the data provided by HM Revenue & Customs48 show that the top one percent of individuals with liability to income tax in the UK earn over 16-times more than the bottom one percent and 13.5-times more than the bottom 10%. Indeed, similar patterns are evident from all the countries included in our analysis as well. To further reflect the reality, we assume that the individual’s productivity (and earnings) change over time, following the age-productivity profile reported by Hansen (1993).
During retirement, agents receive pension transfers from the government determined according to the existing plans in the given country. For instance, in the UK pension transfers consist of state pension of maximum £155.65 per week and annuity determined by partially tax-deductible lifetime savings into a pension fund, complemented by employer and government contributions. In the US, social security benefit repayment rates are based on a 35-year salary average (30-year in the model) and complemented by individual savings into pension funds. The marginal income and social security tax rates, as well as basic personal allowances are presented in Table B-1.
Given a maximum life expectancy and certain death at that time, each year the remainder of the oldest cohort dies and a new generation is born. Population size in each age category is based on predictions described further. Importantly, the model assumes no bequests implying that each worker starts with no wealth and, due to rational expectations, consumes all their remaining savings at the age of 60. However, all individuals also face a positive probability of death throughout their live, implicitly increasing their interest in immediate consumption rather than saving.
47 In reality, the autoregressive process of order one may be understood as a low probability that a worker would be promoted or demoted, and a high probability of remaining at the original level. Similarly, unemployed agents are more likely to be unemployed in the subsequent period than employed agents, and so on. 48 https://www.gov.uk/government/statistics/percentile-points-from-1-to-99-for-total-income-before-and-after-tax
RAND Europe
79
Economic agents in the model are assumed to have rational expectations about the future.49 Specifically, consumption and savings decisions are determined by expectations about future earnings, life expectancy, or time spent in retirement rather than by contemporary variables such as current interest rate. Even in case of a sudden change in the economy, individuals are expected to identify changes fast enough to adjust their decisions within the same year. The assumption of rational expectations embodies the life-cycle hypothesis suggesting that economic agents aim to smooth their consumption throughout the life, a behavioural pattern supported by empirical evidence (see e.g. Modigliani & Cao, 2004; Bloom et al., 2003). Technically, this fact is represented by maximisation of lifetime utility from consumption where future consumption matters slightly less than the current one. The lifetime utility function maximised by households operates with the standard CRRA (constant relative-risk aversion) function:
E ( ) , ( ) = − 11 − η ,
where η the coefficient of relative risk aversion, ( ) is the instantaneous utility function with consumption as its only parameter, are the survival probabilities implicitly determined by population projections, and is the discount factor determining time preference.
Finally, we assume that agents cannot borrow money and their consumption thus cannot exceed revenue, i.e. the sum of annual salary, pension payments (if retired), and one-year bond holdings earning risk-free interest rate . The budget constraint is thus in general given by = (1 + ) + (1 − ) ( , ) + − . Firms and government
Firms produce output using effective labour and capital , which are hired at wage and interest rate r, equal to the marginal product of labour and capital, respectively, as determined within the competitive equilibrium framework (see below). Capital also depreciates at rate . Production is characterised by constant returns to scale and we assume the standard neoclassical Cobb-Douglas production function in form of = , = − , = (1 − ) , where is the total factor productivity growth parameter denoting efficiency with which can the factors of production be used and is capital output elasticity (capital share on production). Note that the production function works with units of effective labour; wage and interest rate are then equal for all agents despite differences in their age and productivity group.
49 Rational expectations refer to the best possible prediction of the future based on all available information and past experiences. In the model, all agents are assumed to be rational and thus to behave in a similar manner.
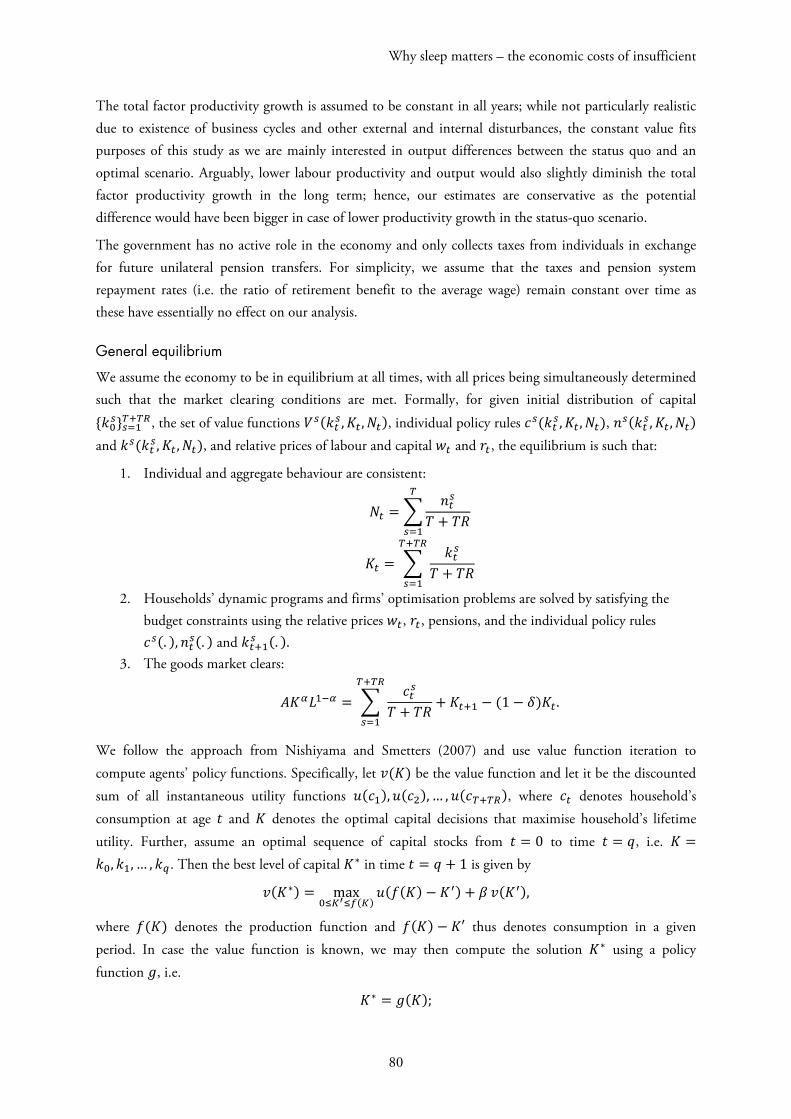
Why sleep matters – the economic costs of insufficient
80
The total factor productivity growth is assumed to be constant in all years; while not particularly realistic due to existence of business cycles and other external and internal disturbances, the constant value fits purposes of this study as we are mainly interested in output differences between the status quo and an optimal scenario. Arguably, lower labour productivity and output would also slightly diminish the total factor productivity growth in the long term; hence, our estimates are conservative as the potential difference would have been bigger in case of lower productivity growth in the status-quo scenario.
The government has no active role in the economy and only collects taxes from individuals in exchange for future unilateral pension transfers. For simplicity, we assume that the taxes and pension system repayment rates (i.e. the ratio of retirement benefit to the average wage) remain constant over time as these have essentially no effect on our analysis.
General equilibrium
We assume the economy to be in equilibrium at all times, with all prices being simultaneously determined such that the market clearing conditions are met. Formally, for given initial distribution of capital { } , the set of value functions ( , , ), individual policy rules ( , , ), ( , , ) and ( , , ), and relative prices of labour and capital and , the equilibrium is such that:
1. Individual and aggregate behaviour are consistent: = +
= +
2. Households’ dynamic programs and firms’ optimisation problems are solved by satisfying the budget constraints using the relative prices , , pensions, and the individual policy rules (. ), (. ) and (. ).
3. The goods market clears: = + + − (1 − ) . We follow the approach from Nishiyama and Smetters (2007) and use value function iteration to compute agents’ policy functions. Specifically, let ( ) be the value function and let it be the discounted sum of all instantaneous utility functions ( ), ( ), … , ( ), where denotes household’s consumption at age and denotes the optimal capital decisions that maximise household’s lifetime utility. Further, assume an optimal sequence of capital stocks from = 0 to time = , i.e. =, , … , . Then the best level of capital ∗ in time = + 1 is given by ( ∗) = max( ) ( ( ) − ) + ( ), where ( ) denotes the production function and ( ) − ′ thus denotes consumption in a given period. In case the value function is known, we may then compute the solution ∗ using a policy function , i.e. ∗ = ( );

RAND Europe
81
policy function thus represents the optimal decision regarding the next-period level of capital as a function of the current capital stock.
Due to the presence of idiosyncratic shocks, policy functions cannot be computed from time = 0 onwards because individuals do not know their future income and cannot plan consumption and savings accordingly. The algorithm therefore computes the policy functions retrospectively instead using backward induction, working iteratively from the set of initial assumptions.

Table B.0.1: Economic calibration parameters
Parameter Source
Country
Canada Germany Japan Mexico UK U.S. Average annual hours worked Penn World Tables (v9)50
1,688 1,371 1,729 2,137 1,675 1,765 Human capital index 3.68 3.66 3.54 2.68 3.73 3.72 Real GDP (constant 2011 prices, in U.S.$ mil.) 1,550,457 3,553,909 4,596,362 1,974,418 2,350,437 16,490,192 Capital stock (constant 2011 prices, U.S.$ mil.) 5,949,967 13,875,688 17,726,870 6,498,114 10,107,181 51,190,644 Capital-output ratio 3.838 3.904 3.857 3.291 4.300 3.104 Capital-labour ratio 61.91% 62.27% 60.28% 38.60% 61.26 60.36 Capital stock depreciation rate 3.63% 3.80% 4.62% 3.73% 3.68% 4.71% Multifactor productivity growth OECD51
9.54% 1.03% 7.12% 2.08%52 8.32% 9.48% Coefficient of relative risk aversion Federal Reserve Bank of St.
Louis (2014) 0.83 0.77 0.44 0.78 1.03 1.39
Wealth gini coefficientc World Bank5330.1 32.6 32.1 41.1 48.2 32.6
50 www.rug.nl/research/ggdc/data/pwt 51 stats.oecd.org 52 Approximated using labour productivity index, assuming the ratio of labour productivity and multifactor productivity to be the same as the average of other countries‘ data 53 data.worldbank.org/indicator/SI.POV.GINI

Why sleep matters – the economic costs of insufficient
Income tax ratea Various 15%-33%54 0%-45%55 5%-45%56 1.9%-35%57 0%-45%58 10%-39.6%59 Social security tax rateb Various 4.95%60 9.35%61 8.737%62 1.125%63 12%64 6.2%65 a Marginal tax rate. Other specifications of the tax system such as maximum contribution for social security contributions or baseline personal allowance not reported but included in the model. b Pension system contributions paid by employee only. In Mexico, UK and U.S. the model assumes additional individual savings in a funded pension scheme. c Latest available data for each country.
54 Canada Revenue Agency, www.cra-arc.gc.ca 55 German Federal Central Tax Office, www.bzst.de/DE/Home/home_node.html 56 Japan external Trade Organisation, www.jetro.go.jp 57 PricewaterhouseCoopers, taxsummaries.pwc.com 58 UK Government, www.gov.uk 59 U.S. Treasury, www.treasury.gov 60 Employment and Social development Canada, www.esdc.gc.ca 61 www.lohnsteuer.de 62 Japan Pension Service, www.nenkin.go.jp 63 U.S. Office of retirement and Disability Policy, www.ssa.gov 64 UK Government, www.gov.uk, includes all social security contributions, excludes workplace pension contributions. 65 Social Security Administration, www.ssa.gov, includes contributions to survivors and disabled individuals
![Home [pscourts.nmcourts.gov]€¦ · Web viewThis combination of excessive fast brain waves and insufficient slower brain wave activity is associated with anxiety and sleep problems,](https://static.fdocuments.in/doc/165x107/5f337f4fc5061d70f12c3b93/home-web-view-this-combination-of-excessive-fast-brain-waves-and-insufficient.jpg)