Why is BC Best? The Role of Provincial and Reserve School ...
24
Institut C.D. HOWE Institute commentary NO. 390 Why is BC Best? The Role of Provincial and Reserve School Systems in Explaining Aboriginal Student Performance Education outcomes for young Aboriginal adults living in British Columbia are markedly better than those in other provinces. What is BC doing right? And what can other provinces learn? John Richards
Transcript of Why is BC Best? The Role of Provincial and Reserve School ...

Institut C.D. HOWE Institute
commentaryNO. 390
Why is BC Best? The Role of Provincial and Reserve School Systems in Explaining Aboriginal Student
Performance
Education outcomes for young Aboriginal adults living in British Columbia are markedly better than those in other provinces. What is BC doing right? And what can other provinces learn?
John Richards

$12.00isbn 978-0-88806-911-5issn 0824-8001 (print);issn 1703-0765 (online)
Essential Policy Intelligence | Conseils indispensablessur les
polit
ique
s
INST
ITU
TC.D. HOWE
INST
ITU
TE
Finn PoschmannVice-President, Research
Commentary No. 390October 2013Social Policy
C.D. Howe Institute publications undergo rigorous external review by academics and independent experts drawn from the public and private sectors.
The Institute’s peer review process ensures the quality, integrity and objectivity of its policy research. The Institute will not publish any study that, in its view, fails to meet the standards of the review process. The Institute requires that its authors publicly disclose any actual or potential conflicts of interest of which they are aware.
In its mission to educate and foster debate on essential public policy issues, the C.D. Howe Institute provides nonpartisan policy advice to interested parties on a non-exclusive basis. The Institute will not endorse any political party, elected official, candidate for elected office, or interest group.
As a registered Canadian charity, the C.D. Howe Institute as a matter of course accepts donations from individuals, private and public organizations, charitable foundations and others, by way of general and project support. The Institute will not accept any donation that stipulates a predetermined result or policy stance or otherwise inhibits its independence, or that of its staff and authors, in pursuing scholarly activities or disseminating research results.
The Institute’s Commitment to Quality
About The Author
John Richards School of Public Policy, Simon Fraser University and Fellow-in-Residence, C.D. Howe Institute.

The Study In Brief
Poor education outcomes for Aboriginals in Canada have long been a source of concern for Aboriginal leaders and the provincial and federal governments. Notably, sixty percent of young Aboriginal adults living on reserves in Canada lack high-school certification. As a result, they face severely limited employment opportunities off-reserve, and limited opportunities on-reserve. Among young Canadians not living on a reserve, those who identify as Indian-First Nation have better education outcomes than those on-reserve, but they are weaker than outcomes for Métis. In general, non-Aboriginals achieve the best outcomes.
This Commentary undertakes a suggestive, but far-from-definitive, exercise in assessing the role of education policies and institutions in Aboriginal K-12 outcomes. It disaggregates the young adult Aboriginal population (ages 20-24 at the time of the 2006 census) into subgroups defined by province, location within a province (urban vs. rural and on- vs. off-reserve) and by Aboriginal identity group (non-Aboriginal, Métis, Indian-First Nation). After allowance for the impact of school location and employment rate as a proxy for family characteristics, this examination finds that British Columbia has achieved considerably better K-12 outcomes than the five other provinces, Quebec, Ontario, Manitoba, Saskatchewan and Alberta, with large Aboriginal cohorts.
The Commentary discusses three institutional and policy differences between British Columbia and other provinces that may explain its superior outcomes: i) more comprehensive and regular monitoring of Aboriginal student performance in the core competencies of reading, writing and mathematics; ii) incentives for provincial school districts to innovate and consult with local Aboriginal leaders; and iii) the encompassing nature of First Nation institutions providing secondary services to reserve schools.
C.D. Howe Institute Commentary© is a periodic analysis of, and commentary on, current public policy issues. Michael Benedict and James Fleming edited the manuscript; Yang Zhao prepared it for publication. As with all Institute publications, the views expressed here are those of the author and do not necessarily reflect the opinions of the Institute’s members or Board of Directors. Quotation with appropriate credit is permissible.
To order this publication please contact: the C.D. Howe Institute, 67 Yonge St., Suite 300, Toronto, Ontario M5E 1J8. The full text of this publication is also available on the Institute’s website at www.cdhowe.org.
2
The panel concluded that among the barriers to better outcomes is that, “The education ‘system’ for First Nation students on reserve is a far cry from any system that other Canadians would recognize in terms of … degree of input, accountability, and democratic governance most Canadians take for granted (AFN/AANDC 2012,9).” Reserve schools operate, the panel added, in a “non-system.” Each reserve runs its own school much as, a century ago, each rural municipality in the Prairies ran its own one- or two-room school.
Dedicated teachers may achieve remarkable success in a “non-system,” but the overall outcomes will not be satisfactory. In diplomatic language, the panel urged chiefs and councils to professionalize school management by introducing school “authorities” that assume responsibility for running a number of reserve schools. Such “authorities” would be democratically accountable to First Nations living within the region, but schools would no longer be primarily accountable to individual band councils.
One month after the panel report, the federal budget promised new legislation and “sustainable funding” for reserve schools:
In response to the Panel ’s report, the Government will work with willing partners to introduce a First Nation
Education Act and have it in place for September 2014. The purpose of this legislation is to establish the structures and standards to support strong and accountable education systems on reserve. This will set the stage for more positive education outcomes for First Nations children and youth. The Government will also work to explore mechanisms to ensure stable, predictable and sustainable funding for First Nations elementary and secondary education. (Canada 2012.)
Most educators and administrators involved with Aboriginal education agree that improvement in reserve school outcomes requires both more money and a more professional organization of schools, one aspect of which is creation of multi-school equivalents of provincial school districts.1
It is an understatement to observe that events subsequent to the 2012 budget have not demonstrated an analogous consensus among First Nation leaders. In October 2012, a special AFN assembly on education rejected the federal proposals outright. “We’re not going to let Canada make everybody think that the solution to low graduation levels is resolved by a legislated solution,” said Grand Chief Derek Nepinak of the Assembly of Manitoba Chiefs (CBC 2012). In July 2013, the AFN General Assembly repeated its rejection of the AANDC initiative
The first draft of this Commentary was presented at a Canadian Economics Association session, jointly sponsored by the C.D. Howe Institute and the Centre for the Study of Living Standards (CSLS). For their extensive discussion, I thank participants at the session, especially Tim Thompson from the Assembly of First Nations, Barry Anderson and Andrew Sharpe, director of the CSLS. I also thank Gordon Martell, Larry Steeves, Don Drummond and an anonymous reviewer who commented on an earlier draft. Colin Busby shepherded this project at the C.D. Howe Institute.
1 An example is Mendelson’s (2009) call for creation of reserve school “authorities.”
In February 2012, a panel jointly sponsored by the Assembly of First Nations and the federal Department of Aboriginal Affairs and Northern Development Canada (AANDC), released its review of on-reserve education.

3 Commentary 390
(AFN 2013). At time of writing (August 2013), AANDC is attempting to secure among First Nation leaders some measure of agreement on legislative reform, based on two Discussion Guides (Canada 2013b, 2013c).
Largely absent from the debate over legislation defining reserve school organization has been any reference to whether proposed institutional changes matter in terms of high-school completion. This Commentary undertakes two tasks. It decomposes Aboriginal high-school graduation rates among young adults by province in a manner that provides some evidence that policies and institutional arrangements pursued by both provincial education ministries and on-reserve schools do matter. In general, among the provinces under review, BC has the best Aboriginal high-school completion rates, both on- and off-reserve.
Second, the Commentary discusses institutional features of provincial and reserve school organization that almost certainly figure in the explanation for BC’s relative success. Compared to other provinces, the BC education ministry generates more detailed information about the K-12 performance of Aboriginal students and has a longer tradition of encouraging provincial school districts to engage local Aboriginal leaders in designing suitable local programs. Furthermore, BC reserve schools benefit from encompassing First Nation organizations that act as proto-school districts, providing some of the secondary services of a school district.
Rules of Thumb
Education officials – school principals, school district superintendents and deputy ministers in provincial education ministries – may not cite precise statistics, but they are aware of “rules of thumb” that characterize student outcomes. One
is that K-12 academic performance is superior in big city school districts than elsewhere. A second is that, controlling for the location of the school district, students identifying as Indian-FN have the weakest outcomes and non-Aboriginal the best; results for Métis students will fall roughly in the middle.
The rules of thumb are illustrated, for all Canada, in Figure 1. The statistics presented are for the cohort of young adults, aged 20-24 at the time of the 2006 census. (See the Appendix for an explanation of the identity definitions employed by Statistics Canada.) The census data indicate residence, a good but imperfect proxy for the actual location of K-12 instruction. The tabulated census results disaggregate location into four categories: census metropolitan areas (CMAs) with a population of more than 100,000, urban non-CMA, rural and on-reserve. For all three identity groups, the best outcomes are for those living in CMAs.
What is of particular concern is the very high share, more than 60 percent, of young adults on-reserve without high-school certification. They face severely limited employment opportunities off-reserve, and their employment opportunities on most reserves are also limited.2
Rule 1: Student performance is better in urban than in rural schools
The explanation for the first rule of thumb is straightforward. Rural school districts have more difficulty in retaining teachers, especially specialist teachers. The result is lower average teaching experience in rural than urban schools (CCL 2006). High teacher turnover is one factor, among others, that tends to lower student performance in a school. Indeed, Hanushek and Rivkin’s detailed
2 Admittedly, some are completing high school or gaining high-school equivalence after age 24. The Aboriginal incomplete K-12 rates among the 25-34 cohort are about one-third lower than those illustrated in Figure 1.

4
econometric study of factors explaining the gap in relative performance of black and white Texas school children attributed much of the difference to the fact that black students attend schools with high teacher turnover. Meanwhile, a recent Alberta longitudinal study (2009) found that high-school completion rates rise with an increase in the average length of teaching experience at the students’ school.
Also, large urban schools enjoy scale economies in their ability to offer specialized services and instruction that rural- and small-town schools, even with compensating higher per-student budgets, often cannot replicate (CCL 2006). But education outcomes depend not only on school
quality. Higher family income and parental education levels are also associated with better student outcomes in virtually all studies – and average family incomes and parental education levels are higher in large cities.
Demand-side effects supplement supply-side effects. For rural families whose children expect to remain in the local community, the financial rewards of high-school completion – and subsequent post-secondary training – are less evident than in an urban context, the location of most knowledge-based, high-income jobs. In turn, this has led to lower parental expectations about the importance of formal education.3
Source: Author’s calculations from tabulations of the 2006 census (Canada 2008b).
Figure 1: Incomplete K-12 Rate, Ages 20-24, by Identity Group and Location of Residence, 2006
35.7
23.1
10.9
39.9
28.6
16.7
40.3
24.3
16.0
61.1
0
10
20
30
40
50
60
70
North American Indian / FirstNation
Métis Non-Aboriginal
Perc
ent
urban, census metropolitan area urban, non-census metropolitan area rural on-reserve
3 This is one conclusion from an analysis by Carr (2010) based on a Statistics Canada household survey of participation in post-secondary education by young adults.

5 Commentary 390
This demand-side incentive operates among Aboriginals as well as non-Aboriginals. The incentive is weakest on-reserve where, in general, jobs requiring formal education are few.
Rule 2: Controlling for location of school, students identifying as Indian-FN have the weakest outcomes, and non-Aboriginal the strongest; results for Métis students fall roughly in the middle.
The explanation for Aboriginal/non-Aboriginal disparities is complex. To begin, relative to non-Aboriginals, those who identify as Aboriginal are more likely to live in small towns or rural communities – or, in the case of registered Indians, to live on-reserve. Hence, they suffer the impact of the first rule of thumb: rural and small-town students typically fare less well in terms of high-school completion.
Discrimination against Aboriginals has almost certainly declined in Canada over the last three decades. An indicator is that more people now acknowledge an Aboriginal identity in the census (Siggner and Costa 2005). Since 1981, the inter-census increases in the size of Aboriginal identity cohorts are well in excess of projections based on fertility and mortality rates.
Although schools no longer disparage Aboriginal culture, discrimination may persist in more subtle ways. Some teachers and administrators still assume that native students are inherently less able than others to master the core competencies and, accordingly, devote less effort to teaching them. Furthermore, a history of past discrimination permeates many Aboriginal families’ view of formal education. And whether or not their parents are skeptical of schools, Aboriginal children may grow up in an environment where few of the adults they know have benefited – in terms of income and employment – from a good education. Hence, why should they, the children, struggle to complete high school?
Conclusions of the preceding paragraph arise from personal experience and are hard to
document. More authoritative is the following summary from a Senate report on urban Aboriginal youth (Canada 2003, s.1.4):
There are many complex reasons why [Aboriginal] youth stop attending school. Some of these reasons include racism; lack of parental involvement and guidance; resentment and embarrassment caused by feeling less successful scholastically than other students; instability caused by high rates of residential mobility; feelings of isolation caused by being in environments that are not culturally sensitive; an inability to afford text books, sporting equipment, and excursion fees; an unstable home life; and poverty.
Consistently, witnesses emphasized that the lack of parental involvement, guidance and support was partly responsible for the fact that Aboriginal youth continue to fare so poorly academically …
The damaging effects of residential schools on Aboriginal peoples, cultures and languages are now widely recognized … [T]here is a deep mistrust among some Aboriginal people of mainstream educational institutions. The importance of obtaining a good education becomes secondary to what may be perceived as a further assimilative assault on Aboriginal culture, language and traditions.
Interprovincial Variation
It is important to distinguish between the performance of school systems in teaching students who are expected to complete the K-12 cycle and students from marginal communities – such as many Aboriginal students – who may well drop out before completing the secondary school cycle. A clear example of this distinction is found in Alberta. In the 2009 round of student performance tests conducted by the Organisation for Economic Co-operation and Development (OECD), Alberta high-school students ranked first among provinces in their combined reading scores but last among the six provinces (see Figure 2) in terms of non-Aboriginal high-school completion and second

6
from last among Métis and Indian-FN students (Knighton et al. 2010).
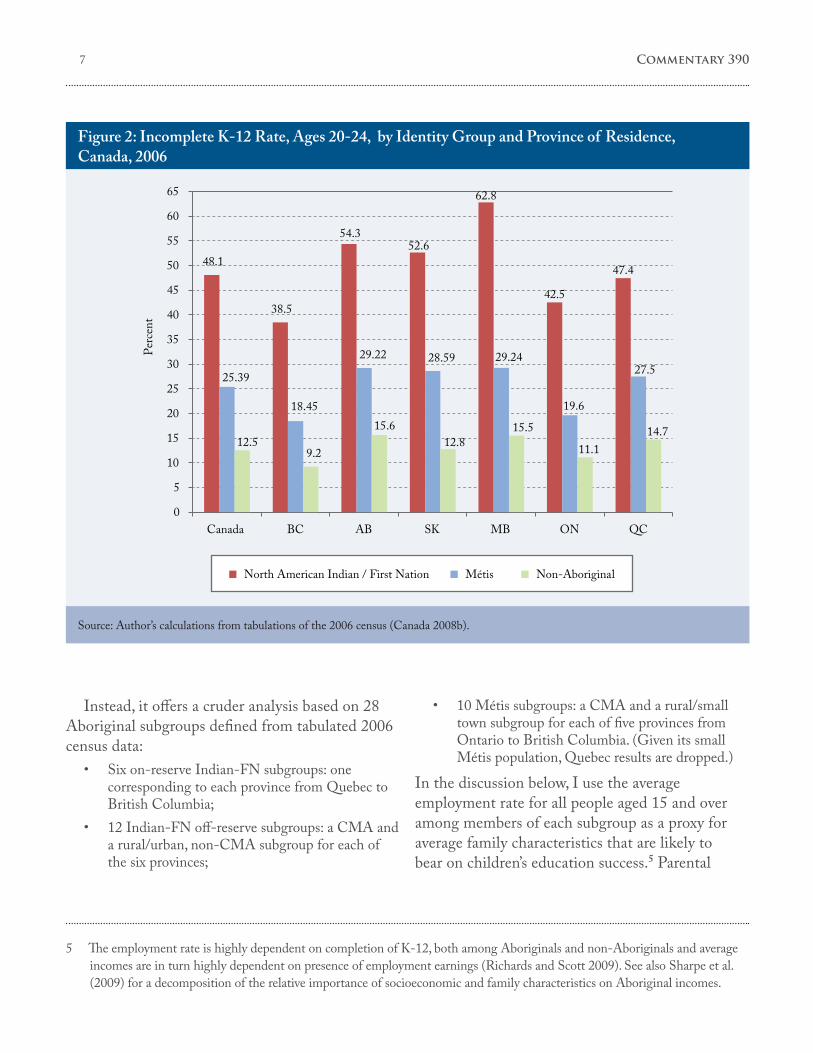
High-school incomplete results disaggregated by province are less well known than the above rules of thumb. Figure 2 illustrates incomplete K-12 rates among young adults for Canada and for the six provinces with Aboriginal populations in excess of 100,000. Nine of 10 Aboriginals reside in one of these six provinces. While the rules of thumb apply to all provinces, there exists significant interprovincial variation. For non-Aboriginals, the best provincial outcome is in British Columbia (9.2 percent incomplete K-12); the worst is in Alberta (15.6 percent). For Métis, the best is also in British Columbia (18.4 percent); the worst in Manitoba (29.2 percent).4 For young Indian-FN adults, the best is once again British Columbia (38.5 percent) and, as before, the worst is Manitoba (62.8 percent).
Nearly two-thirds of the Aboriginal population identify as Indian-FN, some one-third as Métis; the remainder, under 5 percent, as Inuit. Slightly over half the Canadian population identifying as Indian-FN live on-reserve (Canada 2008a). Based on these ratios, about seven in 10 Aboriginals live off-reserve. The children of “registered Indian” families living on-reserve have the option to attend an on-reserve school. Nationwide, about 60 percent do. However, about 40 percent – mostly high-school students – attend a nearby provincial school, often in a small town (Rajekar and Mathilakath 2009). For their part, Métis and Inuit children attend provincial schools. In summary, about one Aboriginal child in five is at any time attending an on-reserve school; the overwhelming majority, four in five, are attending a provincial school.
A final introductory observation is that it makes little sense to consider provincial and
reserve schools run by band councils as belonging to watertight compartments. Net Aboriginal migration since the Second World War has been toward the city, but a great deal of “back and forth” has been taking place. Aboriginal families are more mobile than non-Aboriginals, which means frequent transfers for many Indian-FN children between a reserve and a provincial school, and among provincial schools.
Decomposing Aboriginal K-12 incomplete r ates
Figures 3-5 illustrate the variation among provinces in K-12 incomplete rates among Métis and Indian-FN off- and on-reserve. To what extent is variation across provinces due to provincial education systems and, in the case of on-reserve results, the quality of reserve schools? The ideal decomposition procedure would be to generate a national sample of young adults, determine the location of K-12 schooling for each sample member along with a range of socioeconomic and identity characteristics (parental education and income, Aboriginal or non-Aboriginal, and sub-groups among Aboriginals). In conducting the analysis, we could introduce index variables for each province and school location (urban CMA, rural plus urban non-CMA, or on-reserve).
Finally, we could regress high-school completion on these variables and estimate the incremental impact of each. The magnitude and statistical significance of the index variable coefficients would provide a good measure of relative success of the various provincial school systems in different locations within the province and of the reserve “non-systems.” But that is not what this Commentary attempts.
4 The differences in Métis K-12 incomplete rates across the Prairies are trivially small. The results are as follows: Alberta (29.22 percent), Saskatchewan (28.59 percent) and Manitoba (29.24 percent).
7 Commentary 390
Instead, it offers a cruder analysis based on 28 Aboriginal subgroups defined from tabulated 2006 census data:
• Six on-reserve Indian-FN subgroups: one corresponding to each province from Quebec to British Columbia;
• 12 Indian-FN off-reserve subgroups: a CMA and a rural/urban, non-CMA subgroup for each of the six provinces;
• 10 Métis subgroups: a CMA and a rural/small town subgroup for each of five provinces from Ontario to British Columbia. (Given its small Métis population, Quebec results are dropped.)
In the discussion below, I use the average employment rate for all people aged 15 and over among members of each subgroup as a proxy for average family characteristics that are likely to bear on children’s education success.5 Parental
Source: Author’s calculations from tabulations of the 2006 census (Canada 2008b).
Figure 2: Incomplete K-12 Rate, Ages 20-24, by Identity Group and Province of Residence, Canada, 2006
15.6
0
5
10
15
20
25
30
35
40
45
50
55
60
65
Canada BC AB SK MB ON QC
Perc
ent
North American Indian / First Nation Métis Non-Aboriginal
48.1
38.5
54.352.6
62.8
42.5
47.4
25.39
18.45
29.22 28.59 29.24
19.6
27.5
12.59.2
12.815.5
11.114.7
5 The employment rate is highly dependent on completion of K-12, both among Aboriginals and non-Aboriginals and average incomes are in turn highly dependent on presence of employment earnings (Richards and Scott 2009). See also Sharpe et al. (2009) for a decomposition of the relative importance of socioeconomic and family characteristics on Aboriginal incomes.

8
Source: Author’s calculations from tabulations of the 2006 census (Canada 2008b).
Figure 3a: Decomposition of K-12 Incomplete Rate, Métis, Census Metropolitan Areas, Ages 20-24, Canada and Selected Provinces, 2006
employment is highly correlated with individual family income and parental education levels, which in turn are two key determinants of children’s education success.
The projections for the Indian-FN subgroups in Table 1 arise from a simple regression that incorporates employment rate and an index variable to identify on-reserve observations. The rationale for inclusion of the index is to accommodate the difficulties of schools graduating their students in the context of largely isolated and very small schools. We would expect a statistically significant negative relationship
between a subgroup’s overall employment rate and its incomplete K-12 rate among young adults. Such is the implication of the regression. For the Métis subgroups the range in employment rates is much smaller than for Indian-FN groups, and the employment rate variations have negligible effect on incomplete K-12 rates. For Métis subgroups, the projections in Table 1 are simply the respective average incomplete K-12 rates, calculated separately for Métis in CMA and in rural/urban, non-CMA locations. (See note to Table 1 for more details.)
Several observations are worth noting. The employment rate range is large, particularly among
0
2
4
6
8
10
12
14
16
18
20
22
24
26
28
30
Canada BC AB SK MB ON
Perc
ent
Métis / non-Aboriginal, provincial (national) gap
Non-Aboriginal, provincial (national) K-12 incomplete rate
10.97.5
13.29.9
12.110.3
12.2
8.6
12.6
15.3
16.4
8.2

9 Commentary 390
Source: Author’s calculations from tabulations of the 2006 census (Canada 2008b).
Figure 3b: Decomposition of K-12 Incomplete Rate, Métis, Rural plus non-CMA Urban, Ages 20-24, Canada and Selected Provinces, 2006
Indian-FN subgroups, indicating considerable interprovincial variation in average prosperity and projected education levels of the disaggregated subgroups. There is little overlap across the three aggregated subgroups in incomplete K-12 or employment rates. The on-reserve incomplete rates are generally the highest and employment rates the lowest; the Métis incomplete rates are lowest and employment rates highest; the off-reserve Indian-FN incomplete and employment rates are intermediary.
If we project expected K-12 incomplete rates in terms of the simple regression, or means in the case of Métis subgroups, we can interpret deviations from projection as an approximate indicator of the performance of provincial school systems and reserve schools in the respective provinces. A
positive deviation implies the K-12 incomplete rate is higher than projected and the relevant school system is underperforming relative to expectation; a negative deviation implies superior performance. (See Table 1.)
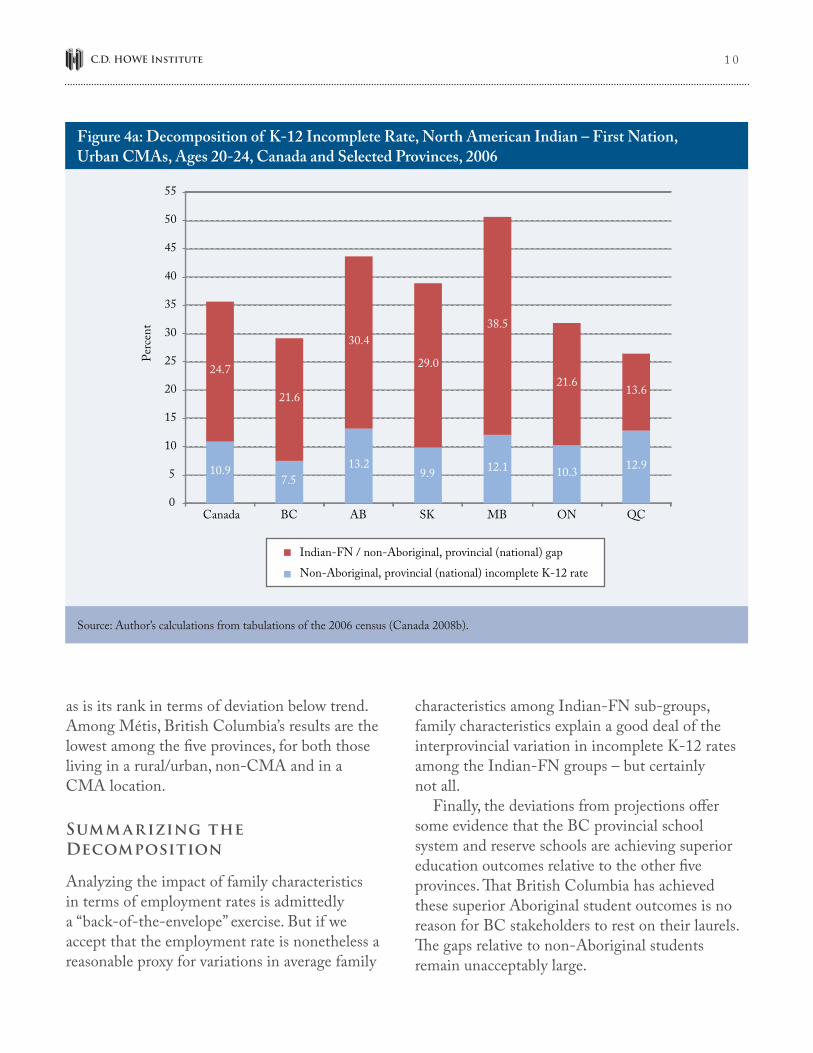
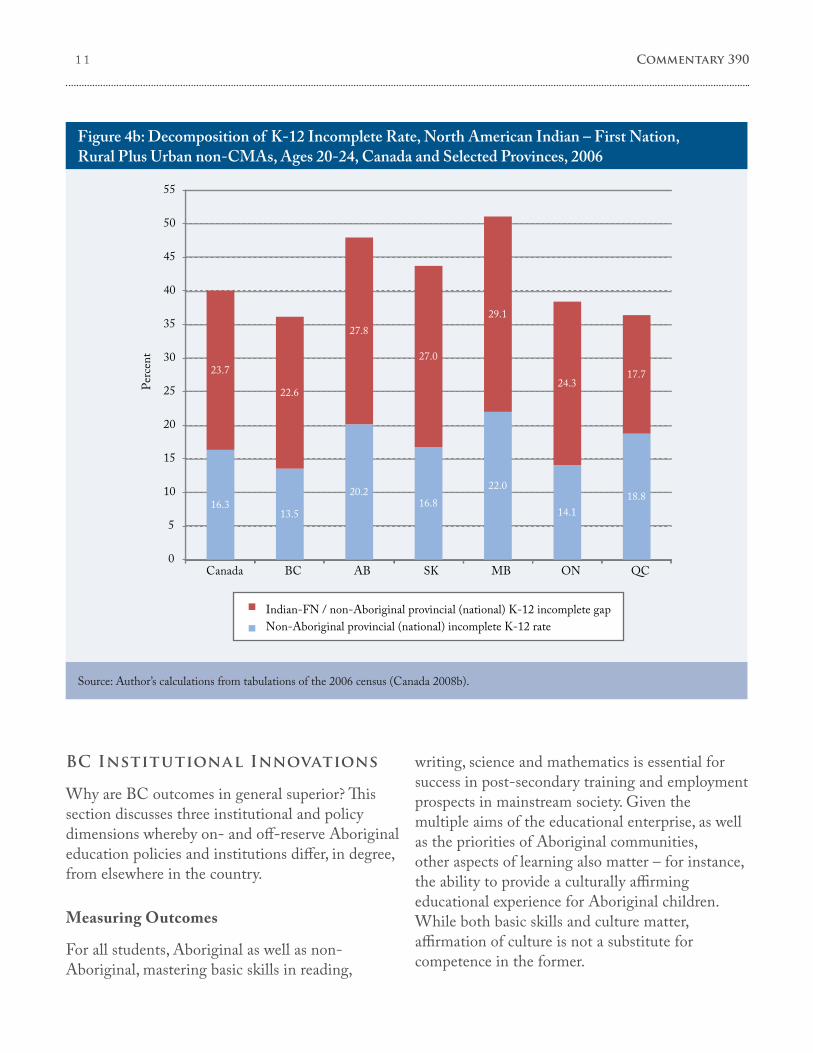
British Columbia’s most impressive educational achievement is that of its on-reserve subgroup. Its incomplete rate on-reserve is the lowest among the six provinces and 13 percentage points below projection. Among the young Indian-FN adults living off-reserve in a rural/urban, non-CMA location, British Columbia’s incomplete result is the overall lowest. Its deviation below trend is second largest (in absolute value). Among young Indian-FN adults living off-reserve in a CMA, British Columbia again produces impressive results. Its incomplete rate for this group is second lowest,
0
5
10
15
20
25
30
35
Canada BC AB SK MB ON
Perc
ent
Métis / non-Aboriginal provincial (national) gap
Non-Aboriginal provincial (national) incomplete K-12 rate
16.313.5
20.216.8
22.0
14.1
10.4
6.2
11.713.1
8.1
6.5
1 0
as is its rank in terms of deviation below trend. Among Métis, British Columbia’s results are the lowest among the five provinces, for both those living in a rural/urban, non-CMA and in a CMA location.
Summ arizing the Decomposition
Analyzing the impact of family characteristics in terms of employment rates is admittedly a “back-of-the-envelope” exercise. But if we accept that the employment rate is nonetheless a reasonable proxy for variations in average family
characteristics among Indian-FN sub-groups, family characteristics explain a good deal of the interprovincial variation in incomplete K-12 rates among the Indian-FN groups – but certainly not all.
Finally, the deviations from projections offer some evidence that the BC provincial school system and reserve schools are achieving superior education outcomes relative to the other five provinces. That British Columbia has achieved these superior Aboriginal student outcomes is no reason for BC stakeholders to rest on their laurels. The gaps relative to non-Aboriginal students remain unacceptably large.
Source: Author’s calculations from tabulations of the 2006 census (Canada 2008b).
Figure 4a: Decomposition of K-12 Incomplete Rate, North American Indian – First Nation, Urban CMAs, Ages 20-24, Canada and Selected Provinces, 2006
0
5
10
15
20
25
30
35
40
45
50
55
Canada BC AB SK MB ON QC
Perc
ent
Non-Aboriginal, provincial (national) incomplete K-12 rateIndian-FN / non-Aboriginal, provincial (national) gap
10.97.5
13.29.9 12.1 10.3 12.9
24.7
21.6
30.4
29.0
38.5
21.6 13.6
1 1 Commentary 390
BC Institutional Innovations
Why are BC outcomes in general superior? This section discusses three institutional and policy dimensions whereby on- and off-reserve Aboriginal education policies and institutions differ, in degree, from elsewhere in the country.
Measuring Outcomes
For all students, Aboriginal as well as non-Aboriginal, mastering basic skills in reading,
writing, science and mathematics is essential for success in post-secondary training and employment prospects in mainstream society. Given the multiple aims of the educational enterprise, as well as the priorities of Aboriginal communities, other aspects of learning also matter – for instance, the ability to provide a culturally affirming educational experience for Aboriginal children. While both basic skills and culture matter, affirmation of culture is not a substitute for competence in the former.
Source: Author’s calculations from tabulations of the 2006 census (Canada 2008b).
Figure 4b: Decomposition of K-12 Incomplete Rate, North American Indian – First Nation, Rural Plus Urban non-CMAs, Ages 20-24, Canada and Selected Provinces, 2006
0
5
10
15
20
25
30
35
40
45
50
55
Canada BC AB SK MB ON QC
Perc
ent
Indian-FN / non-Aboriginal provincial (national) K-12 incomplete gapNon-Aboriginal provincial (national) incomplete K-12 rate
16.313.5
20.216.8
22.0
14.118.8
23.7
22.6
27.8
27.0
29.1
24.317.7

1 2
There are two main reasons to undertake detailed student-outcome monitoring. First, measuring and reporting school and student performance on a regular basis provides an accountability function. Whether Aboriginal or not, parents are concerned about the quality of the schools that their children attend. Given the historic absence of educational accountability to Aboriginal communities, information about school performance – both on- and off-reserve – is one means to convince Aboriginal communities that education programs are working for their children.
Second, performance measurement is a necessary tool for improving school quality. As the old conundrum has it, if you don’t know where you are and you don’t know where you want to go, you’re unlikely to get there.
While far from perfect, both BC provincial and reserve schools have a better tradition of measuring and reporting Aboriginal student outcomes than other provinces. For example, the BC First Nations School Association manages an on-reserve school-reporting project (FNSA 2012). As well, the provincial education ministry (BC 2012) has
Source: Author’s calculations from tabulations of the 2006 census (Canada 2008b).
Figure 5: Decomposition of Incomplete K-12 Rate, North American Indian – First Nation, On-Reserve, Ages 20-24, Canada and Selected Provinces, 2006
0
5
10
15
20
25
30
35
40
45
50
55
60
65
70
75
Canada BC AB SA MB ON QC
Perc
ent
Indian-FN o�-reserve (rural + urban, non-CMA) provincial (national) incomplete K-12 rate
40.136.2
48.043.8
51.1
38.4 36.4
21.0
10.7
19.5
17.8
20.9
22.7 25.0
Indian-FN on / o�-reserve (rural + urban, non-CMA) provincial (national) gap

1 3 Commentary 390
Source: Author’s calculations from Canada (2008b, 2008c).Note: For the 18 Indian-FN subgroups the projection is based on a regression of the incomplete K-12 rate on the employment rate and an index indicating a reserve location. The result is y = 66.9 – 0.51x1 + 14.7x2, where y is the projected incomplete K-12 rate, x1 is the employment rate and x2 is the index for a reserve location. The adjusted R2 is 0.67. The employment rate is significant at 5% one-tail, the on-reserve index at 1% one-tail. The regression could be re-specified to add an index distinguishing CMA from rural/urban, non-CMA Indian-FN subgroups. Such an index has the appropriate sign (implying higher rural than CMA incomplete rates) but is insignificant. The number of observations for any regression is, however, too small for the results to be more than suggestive. For Métis, the projections are the respective incomplete K-12 averages, calculated separately for Métis in CMA and in rural/urban, non-CMA locations.
Location Employment Rate K-12 Incomplete Rate Projected K-12
Incomplete Rate
Deviation of Actual from Projected K-12
Incomplete Rate
percent percentage pointsIndian-FN, on-reserve
BC 42.5 46.9 59.9 -13.0AB 38.4 67.5 62.0 5.5SK 30.8 61.5 65.9 -4.3MB 31.4 72.0 65.6 6.4ON 45.5 61.1 58.4 2.8QC 44.9 61.4 58.7 2.7
Indian-FN, off-reserve, rural and urban, non-CMABC 54.6 36.2 39.0 -2.8AB 62.0 48.0 35.2 12.7SK 45.7 43.8 43.6 0.2MB 49.0 51.1 41.8 9.2ON 56.7 38.4 37.9 0.5QC 50.3 36.4 41.2 -4.8
Indian-FN, off-reserve, CMABC 59.1 29.2 36.7 -7.5AB 61.0 43.6 35.7 7.9SK 41.7 38.9 45.6 -6.7MB 44.4 50.6 44.2 6.4ON 58.0 31.9 37.3 -5.4QC 60.1 26.5 36.2 -9.7
Métis, rural and urban, non-CMABC 63.3 19.7 26.4 -6.7AB 69.0 31.9 26.4 5.4SK 58.0 29.9 26.4 3.5MB 64.8 30.1 26.4 3.7ON 59.6 20.6 26.4 -5.9
Métis, CMABC 66.3 16.2 22.8 -6.7AB 70.1 25.9 22.8 3.0SK 67.8 25.2 22.8 2.4MB 64.6 28.5 22.8 5.7ON 64.3 18.5 22.8 -4.4
Table 1: Projected K-12 Incomplete Rates and Deviations from Projections, Young Aboriginals, Ages 20-24, Selected Provinces and Location, 2006

1 4
for more than a decade published How are We Doing?, an annual summary of Aboriginal student performance in provincial schools.
Canada participates in international random sample testing of students, such as the OECD’s tri-annual PISA tests. These are useful in comparing education results across provinces and between Canada and other countries. However, to assess and manage well a complex school system, such as that of a province, requires data at a far more disaggregated level than PISA or census snapshots every five years.6
Most provinces undertake core competency tests in reading, writing and arithmetic at several grades in the K-12 cycle. In British Columbia, these tests (so-called Foundations Skills Assessment – FSA) have been conducted in Grades 4 and 7 since the 1990s and are disaggregated by identity, allowing analysis of trends among Aboriginal relative to non-Aboriginal students. British Columbia also publishes analyses of student cohorts followed from Grade 8, allowing a longitudinal comparison of Aboriginal and non-Aboriginal students in higher grades.7
Admittedly, student performance data can be abused. Average neighbourhood income and parental education are factors relevant to school performance, but largely beyond school control. Aboriginal students face additional handicaps that should be analyzed when reporting results. To rank schools without serious discussion of such factors is not helpful.8 But the potential to abuse data is not a reason to ignore data.
Aboriginal Education Enhancement Agreements and Discretionary Funding to Provincial School Districts
School districts are an oft-forgotten but potentially important level of school governance (Anderson 2006). In the 1990s, British Columbia established a precedent, copied in some other provinces, of awarding supplementary funds annually to school districts based on the number of identified Aboriginal students. Provided they are devoted to educational initiatives for Aboriginals, districts exercise wide discretion over how these funds are allocated. There exists reasonably good evidence that Aboriginal student scores on provincial core competency tests are superior in school districts that, by various criteria, take seriously their obligations to monitor and advance their native students – relative to native student scores in those districts that do not take these obligations as seriously (Richards et al. 2008).
The benefits from encouraging district-level innovation seem to derive from a variety of avenues:
• The provincial education ministry requires districts to draw up Aboriginal education enhancement agreements with medium-term targets.9 This obliges district school boards, superintendents and school principals to address Aboriginal student outcomes in their district over time, and relative to other districts.
• The enhancement agreements oblige school districts to consult local Aboriginal community leaders in school policymaking and setting of targets. School districts enjoy discretion as to how they interpret this obligation to consult.
6 The 2011 census snapshot is likely blurred at best. Elimination of the mandatory long form has probably introduced biases concerning Aboriginal results. See Appendix for more detail.
7 See, for example, the annual detailed report (BC 2012) on Aboriginal student performance in provincial BC schools.8 An example of analysis that accounts for socioeconomic factors is David Johnson’s (2010) assessment of BC school
performance.9 For a description of these agreements, see British Columbia (2013). To read a sample agreement, see Richards and Scott
(2009, Appendix 1).

1 5 Commentary 390
• School and district-level educators may interact more closely with local on-reserve schools, with the intent of addressing education issues arising from student mobility.
A controversial aspect of school-district innovation is the designation of magnet schools whose student body is expected to comprise primarily members of a marginalized minority. Such schools raise the issue of peer effects. Socioeconomic characteristics of individual families may affect not only their own children, they may also impinge – positively or negatively – on other students in the school and, hence, become determinants of school quality. After adjusting for other factors, a study I undertook with colleagues (Richards et al. 2008, Richards et al. 2010) found that Aboriginal student performance on core competency tests was on average significantly lower in schools with large Aboriginal cohorts.
Conversely, the peer effect may be positive. In the same study, the non-Aboriginal students (who were a large majority in nearly all shools) had a marked positive impact on Aboriginal student FSA scores.
The potential impact of student peers is inseparable from designing school curriculum and hiring faculty in a manner to promote Aboriginal culture. To improve school performance among marginalized ethnic/racial groups, many studies stress the value of hiring teachers who belong to the ethnic/racial group in question, and of introducing a school curriculum oriented to that group’s cultural experience. These features are usually more in evidence in schools with large
numbers from the relevant group. Such schools have efficient scale to achieve such goals.
However, a tradeoff usually exists.10 The presence of a large culturally homogeneous low-performing student cohort may well encourage a school culture of low academic expectations: some combination of low teacher expectations of their students’ academic potential and low student expectations of their own and their peers’ potential (Rivkin, Hanushek and Kain 2005).
British Columbia’s First Nation Schools Association (FNSA) and First Nations Education Steering Committee (FNESC)
Canadian professional educators agree generally that BC reserve schools have achieved more coordination among themselves and with the provincial school system than is the case in any other province. FNESC, in existence since 1992, and FNSA, which dates from the late 1990s, encompass virtually all reserve schools in the province. Which is not to deny the value of proto-school districts serving some (but not all) reserve schools in other provinces.11 The coordination in British Columbia may be better, but it is far from perfect. FNESC and FNSA have limited discretion relative to chiefs and councils on individual reserves and limited managerial capacity relative to that available to school boards and a provincial education ministry.
Meanwhile, across Canada provincially based First Nation organizations, education ministries and AANDC have negotiated a series of tripartite
10 While the study by Richards et al. (2008) and Richards et al. (2010) found a large negative Aboriginal peer effect, there exists some counter-evidence. Friesen and Krauth (2010) found no evidence from their study of Aboriginal performance in BC schools that negative peer effects exist. However, their measure of Aboriginal peer effects was based on small changes in Aboriginal student numbers within classes within particular schools, not on larger inter-school differences in Aboriginal student cohort sizes.
11 A Saskatchewan example is an exercise undertaken by the Yorkton Tribal Council (Steeves et al. 2011). Others include the James Bay Cree school board in Quebec and Mi’kmaw Kina’matnewey in Nova Scotia.
1 6
education agreements intended to realize various scholastic and cultural education goals. Reflecting the relatively well-established role of FNESC and FNSA, the BC education agreement is the most ambitious.12
FNESC, a political organization somewhat akin to a school board, is controlled by BC chiefs and band councils operating under provisions of the Indian Act or a modern treaty. Its activities mostly concern liaison with the BC government on school policy and programs for Indian-FN students (FNESC 2011).
FNSA, somewhat akin to the professional staff of a school district, provides most on-reserve schools secondary services, such as instruction in local Aboriginal language. Between them, FNESC and FNSA undertake many functions associated with school districts in provincial systems and are, in effect, a “proto school district” for on-reserve BC schools.
Conclusion
The above discussion of dimensions whereby British Columbia differs, at least in degree, from other provinces and the decomposition exercise are
far from definitive proof that the proposals of the joint AFN/AANDC panel and the 2012 federal budget proposal for reserve school authorities will improve outcomes. An obvious conclusion is a call for better evidence.
The more relevant finding, I suggest, is that the available evidence suggests strongly that education policies and institutional arrangements for schools matter. Hence, the 2012 federal budget was right in making a commitment “to establish the structures and standards to support strong and accountable education systems on reserve.” This is bureaucratic language of budget drafters. It is easy to mock. It is easy also for First Nation leaders to indulge in critiques of past federal policy and inadequacies in AANDC school funding. Such critiques are largely accurate.
It is also easy for the federal government to conclude that the chiefs have turned down the offer of reserve school reform and turn to other files. But the goal of decent Aboriginal education outcomes is too important to base decisions on sins of the past.
12 The texts of current tripartite education agreements, including that in British Columbia, are available at http://www.aadnc-aandc.gc.ca/eng/1308840098023/1308840148639.

1 7 Commentary 390
Defining Aboriginal Identity Groups
As with all issues of identity in the modern world, the defining criteria are debatable. The Canadian census defines the Aboriginal population in several ways. The most widely used is based on self-identification. Individuals can self-identify as belonging to one of three Aboriginal groups: (i) North American Indian or First Nation (Mohawk, Ojibwa, Cree, and so on); (ii) Métis (descendents of communities formed from the intermarriage of Indians and coureurs de bois engaged in the fur trade); or (iii) Arctic Inuit. Self-identification as an Aboriginal does not necessarily mean an individual has Aboriginal ancestry.
Another census definition is based on an individual indicating that he or she is a “registered Indian” under provisions of the Indian Act, a Canadian statute dating from the late 19th century. The great majority of those who self-identify as Indian/First Nation are also registered Indians. Only registered Indians have the right to live on designated reserve lands and receive the associated benefits. The census defines the Aboriginal identity population as those who self-identify as Aboriginal or indicate that they are “registered Indians.”
Most of the statistics discussed in this paper derive from the 2006 census. The census is by far the most important source of consistent information about Aboriginal social conditions across Canada. Detailed Aboriginal data from the 2011 census will become available in stages during 2013.
The 2006 census included a 20 percent random sample required to complete the “long-form” questionnaire. Since participation was mandatory among those randomly selected, the reported results on many social conditions among Canadians were as accurate as a census could provide.
For the 2011 census, the government made the controversial decision to abolish mandatory participation in a “long-form” 20 percent sample and substituted voluntary participation in a larger 35 percent sample, the basis for the National Household Survey. While the sample was larger, those who rely on census Aboriginal data have expressed serious concerns about bias. The Aboriginal response rate may well have been considerably lower than in 2006, and those Aboriginals who chose not to respond may well have been poorer and/or more alienated from mainstream Canada than one would conclude from a representative sample.
Appendix

1 8
References
Alberta. 2009. High School Completion Longitudinal Study. Edmonton: Alberta Ministry of Education.
Anderson, Steven. 2006. “The School District’s Role in Educational Change.” International Journal of Education Reform, 15: 13-37.
Assembly of First Nations. 2013. “National Advocacy to Assert First Nations Control of First Nations Education.” Resolution approved at AFN General Assembly. July. Whitehorse.
Assembly of First Nations and Aboriginal Affairs and Northern Development Canada (AFN/AANDC). 2012. Nurturing the Learning Spirit of First Nation Students. Report of the National Panel on First Nation Elementary and Secondary Education for Students on Reserve. Ottawa.
British Columbia. 2012. Aboriginal Report 2006/07 – 2010/11 How Are We Doing? Victoria: Ministry of Education.
––––––––––––––. 2013. Aboriginal Education Enhancement Agreements. Available at: http://www.bced.gov.bc.ca/abed/agreements.
Canada. 2003. Urban Aboriginal Youth: An Action Plan for Change. Final Report of the Senate Standing Committee on Aboriginal Peoples; Senator Thelma Chalifoux, chair. Ottawa.
––––––––––––––. 2008a. Aboriginal Identity (8), Area of Residence (6), Age Groups (12) and Sex (3) for the Population of Canada, Provinces and Territories, 2006 Census – 20% Sample Data. 97-558-XWE2006006. Ottawa: Statistics Canada.
––––––––––––––. 2008b. Aboriginal Identity (8), Highest Certificate, Diploma or Degree (14), Major Field of Study – Classification of Instructional Programs, 2000 (14), Area of Residence (6), Age Groups (10A) and Sex (3) for the Population 15 Years and Over of Canada, Provinces and Territories, 2006 Census – 20% Sample Data. 97-560-XWE2006028. Ottawa: Statistics Canada.
––––––––––––––. 2008c. Labour Force Activity (8), Aboriginal Identity (8), Highest Certificate, Diploma or Degree (14), Area of Residence (6), Age Groups (12A) and Sex (3) for the Population 15 Years and Over of Canada, Provinces and Territories, 2006 Census – 20% Sample Data. 97-560-XWE2006031. Ottawa: Statistics Canada.
––––––––––––––. 2012. Budget Plan. Ottawa: Department of Finance.
––––––––––––––. 2013a. Tripartite Education Agreements. Ottawa: Aboriginal Affairs and Northern Development Canada (AANDC).
––––––––––––––. 2013b. Developing a First Nation Education Act: Discussion Guide. Ottawa: AANDC.
––––––––––––––. 2013c. Developing a First Nation Education Act: A Blueprint for Legislation. Ottawa: AANDC.
Canadian Council on Learning. 2006. Lessons in Learning: The Rural-urban Gap in Education. Ottawa.
Carr, Jeffrey. 2010. Increasing the Participation of Rural Canadians in Post-Secondary Education. Masters project Simon Fraser University.
CBC. 2012. “Harper government’s First Nations education plans collapse: Assembly of First Nations National Chief Shawn Atleo rejects proposed bill to overhaul native schools.” Available at: http://www.cbc.ca/news/politics/story/2012/10/04/pol-cp-first-nations-education-plan-collapse.html.
First Nations Education Steering Committee. 2011. Annual Report 2010/2011. West Vancouver, BC.
First Nations School Association. 2012. School Measures and Data Collection Project 2011/12. West Vancouver, BC.
Friesen, Jane, and Brian Krauth. 2010. “Sorting, peers, and achievement of Aboriginal students in British Columbia.” Canadian Journal of Economics 43: (4), 1273-1301.

1 9 Commentary 390
Hanushek, Eric, and Steven Rivkin. 2006. “School Quality and the Black-White Achievement Gap.” Working Paper 12651. National Bureau of Economic Research. Cambridge, Mass.
Johnson, David. 2010. “British Columbia’s Best Schools: Where Teachers Make the Difference.” E-Brief. Toronto: C.D. Howe Institute. June.
Knighton, Tamara, Pierre Brochu, and Tomasz Gluszynski. 2010. Measuring Up: Canadian Results of the OECD PISA Study. Ottawa: Statistics Canada.
Mendelson, Michael. 2009. Why We Need a First Nations Education Authority Act. Ottawa: Caledon Institute of Social Policy.
Rajekar, Ashutosh, and Ramnarayanan Mathilakath. 2009. The Funding Requirement for First Nations Schools in Canada. Ottawa: Office of the Parliamentary Budget Officer. Available at: http://www2.parl.gc.ca/sites/pbo-dpb/documents/INAC_Final_EN.pdf.
Richards, John, Jennifer Hove, and Kemi Afolabi. 2008. Understanding the Aboriginal / non-Aboriginal Gap in Student Performance: Lessons from British Columbia. Commentary 276. Toronto: C.D. Howe Institute. December.
Richards, John, and Megan Scott. 2009. Aboriginal Education: Strengthening the Foundations. Ottawa: Canadian Policy Research Network.
Richards, John, Aidan Vining, and David Weimer. 2010. “Aboriginal Performance on Standardized Tests: Evidence and Analysis from Provincial Schools in British Columbia.” Policy Studies Journal 38 (1), 47-67.
Rivkin, Steven, Eric Hanushek, and John Kain. 2005. “Teachers, Schools, and Academic Achievement.” Econometrica, 73, 417-458.
Sharpe, Andrew et al. The Effect of Increasing Aboriginal Educational Attainment on the Labour Force, Output and the Fiscal Balance. Ottawa: Centre for the Study of Living Standards.
Siggner, Andrew, and Rosalinda Costa. 2005. Aboriginal Conditions in Census Metropolitan Areas, 1981-2001. Ottawa: Statistics Canada.
Steeves, Larry, Sheila Carr-Stewart and James Marshall. 2011. “Enhancing Student Achievement: The Importance of Second Level Educational Services in First Nation Schools in One Tribal Council in Saskatchewan.” In-education 17(2). University of Regina.

Notes:

Support the InstituteFor more information on supporting the C.D. Howe Institute’s vital policy work, through charitable giving or membership, please go to www.cdhowe.org or call 416-865-1904. Learn more about the Institute’s activities and how to make a donation at the same time. You will receive a tax receipt for your gift.
A Reputation for Independent, Nonpartisan ResearchThe C.D. Howe Institute’s reputation for independent, reasoned and relevant public policy research of the highest quality is its chief asset, and underpins the credibility and effectiveness of its work. Independence and nonpartisanship are core Institute values that inform its approach to research, guide the actions of its professional staff and limit the types of financial contributions that the Institute will accept.
For our full Independence and Nonpartisanship Policy go to www.cdhowe.org.
Recent C.D. Howe Institute Publications
September 2013 Goulding, A.J. A New Blueprint for Ontario’s Electricity Market. C.D. Howe Institute Commentary 389.September 2013 Boyer, Marcel, Éric Gravel, and Sandy Mokbel. Évaluation de projets publics: risques, coût de financement et coût du capital. C.D. Howe Institute Commentary 388 (French).September 2013 Boyer, Marcel, Éric Gravel, and Sandy Mokbel. The Valuation of Public Projects: Risks, Cost of Financing and Cost of Capital. C.D. Howe Institute Commentary 388.September 2013 Tkacz, Greg. Predicting Recessions in Real-Time: Mining Google Trends and Electronic Payments Data for Clues. C.D. Howe Institute Commentary 387.August 2013 Gros, Barry. Ontario Pension Policy 2013: Key Challenges Ahead. C.D. Howe Institute Commentary 386.August 2013 Johnson, David. “Identifying Alberta’s Best Schools.” C.D. Howe Institute E-Brief.August 2013 Daniel Schwanen. “Uneasy Birth: What Canadians Should Expect from a Canada-EU Trade Deal.” C.D. Howe Institute E-Brief.August 2013 Dachis, Benjamin. “How Ottawa Can Deliver A Reformed Canada Post.” C.D. Howe Institute E-Brief.July 2013 Boyer, Marcel, and Sébastien Boyer. “The Main Challenge of Our Times: A Population Growing Younger.” C.D. Howe Institute E-Brief.July 2013 Laurin, Alexandre, and Finn Poschmann. “Treading Water: The Impact of High METRs on Working Families in Canada.” C.D. Howe Institute E-Brief.July 2013 Dachis, Benjamin. Cars, Congestion and Costs: A New Approach to Evaluating Government Infrastructure Investment. C.D. Howe Institute Commentary 385.July 2013 Busby, Colin, and Alexandre Laurin. “The 8 Percent Solution: A Sensible Tax Compromise for Albertans.” C.D. Howe Institute E-Brief.June 2013 Ragan, Christopher. “The Seductive Myth of Canada’s “Overvalued” Dollar.” C.D. Howe Institute E-Brief.

C.D
. HO
WE
Ins
tit
ut
e
67 Yonge Street, Suite 300,Toronto, O
ntarioM
5E 1J8