General Presentation of Hungary Gergely Schuchtár Consul Embassy of Hungary.
Upload
tamsin-mckinneyCategory
view
219download
1
WHY Hungary?WHAT in Hungary?
Gergely Mikola
Chairman, British Chamber of Commerce in HungaryDirector of Corporate and Regulatory Affairs in CEE, BAT

A call for action
Two major mistakes in business:
– Focusing too much on what we sell
instead of focusing on the customer
– Keep doing the same thing and expect a
different result
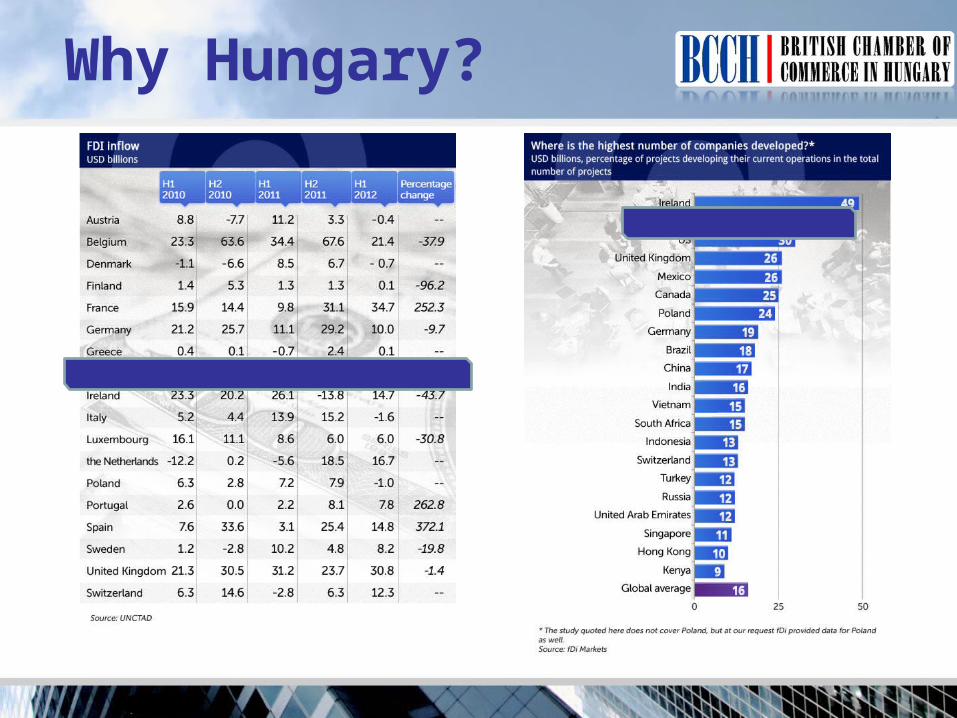
Why Hungary?

Main macroeconomic indicators in Central Europe
2011 BulgariaCzech
RepublicHungary Poland Romania Slovakia
Inflation 3,4% 2,1% 3,9% 3,9% 5,8% 4,1%
GDP per capita * $ 7.202 $ 20.444 $ 14.050 $ 13.540 $ 8.863 $ 17.644
GDP growth ** 1,6% 0,6% 1,4% 4,3% 1,9% 3,3%
Export statistics (bn)
$ 28,1 $ 138,5 $ 110,1 $ 193,9 $ 62,7 $ 77,4
Import statistics (bn)
$ 30,9 $ 133,2 $ 105,9 $ 208,0 $ 73,1 $ 74,3
Unemployment rate 11,2% 6,7% 10,9% 9,7% 7,4% 13,5%
Minimum wages (EUR)
122.7 319,2 280.6 348.7 157.2 317
Source: Eurostat, 2011; Economist Intelligence Unit, 2012; IMF, 2011, Trading Economics, 2011Statistical Office of the Republic of Serbia, 2011*IMF staff estimates**Trading Economics estimates

Budget deficit as percentage of GDP in 2012

State debts
Europa.eu

Lower Labour Costs – Western Europe vs. Hungary
Minimum wages (EUR)
2010 2011
Bulgaria 122.7 122,7
Romania 141.6 157,2
Slovakia 307,7 317,0
Hungary 271.8 280,6
Czech Republic
302,2 319,2
Poland 320,9 348,7
Hourly labour costs
(EUR)2011
Bulgaria 3,5
Romania 4,2
Slovakia 8,4
Hungary 7,6
Czech Republic 10,5
Poland 7,1
Lembo Tanning, PhD: Labour Costs and Productivity Analysis of East-European Countries
Average gross annual earnings in EU states, 2012

High quality labour pool available throughout the country
400,000 students in 70 higher education institutions
100,000 majoring in business administration faculties
90% of students speak English
20% of fresh graduates have international experience
61% of students have professional experience
Seniors and executives with several years of
experience readily available

External reality• Increasing global competition• Troubled Europe• Strong regional race for investment• Local challenges
Internal reality• Boardroom and webex fights• Internal competition for funds• Increasing shareholder demand and costbase vs.
stagnating/shrinking disposable funds
Reality

Investors’ view
• Geographical location• Labour market, employment quality and cost• Political environment• Regulatory environment
– Complexity– Change frequency
• Infrastructure• Consumer/partner/competition • Financial and ITC systems• Tax environment• Incentives• …

Hungary - most active industries/sectors
Automotive industry
Manufacturing
Information and communication technology
Chemicals and pharmaceuticals
Transportation and logistics
Agriculture

Overview of existing service sectors

BAT Central Europe Business Unit
• Established in April 2012
• 12 end-markets – (Bulgaria, Serbia, Montenegro, Czech Republic,
Slovakia, Albania, Kosovo, Slovenia, Bosnia, Macedonia, Croatia, Hungary)
• BAT Hungary as cluster leader
• Number of employees: appr. 1400
• 3rd biggest volume contributor in Europe

Why BAT HU?
1. 100 years heritage in tobacco production with 20 years
presence of BAT
2. Mature organisation with highly skilled employees
3. Central geographical location, good infrastructure

Strategy recommendationThe 3 C’s
• Competitiveness– Know what you are– Know what you are not– Know what you do best
• Consistency– Keep the storyline
• Communication– Say it– Do not assume I know what you want to say– Do assume I read newspapers– Tell others so that they tell others