
Thesis Gergely Fazakas Examining the Dividend Policy in...
30
Corvinus University of Budapest PhD in Business Administration Thesis Gergely Fazakas Examining the Dividend Policy in Hungary PhD dissertation Tutor: Dr. Gáspár Bencéné Vér Katalin Associate Professor Budapest, 2009 1
Transcript of Thesis Gergely Fazakas Examining the Dividend Policy in...

Corvinus University of Budapest PhD in Business Administration
Thesis
Gergely Fazakas Examining the Dividend Policy in Hungary
PhD dissertation
Tutor:
Dr. Gáspár Bencéné Vér Katalin Associate Professor
Budapest, 2009
1

2

Corvinus University of Budapest PhD in Business Administration
Institute of Accounting and Finance Department of Investments and Corporate Finance
Thesis
Gergely Fazakas Examining the Dividend Policy in Hungary
PhD dissertation
Tutor:
Dr. Gáspár Bencéné Vér Katalin Associate Professor
Budapest, 2009
3

4

Contents a) The aim of the dissertation and the precedents 1
Motivation 1
Theoretical background 2
b) Research methodology 7
A. The connection between betas and dividend payout ratio 8
B. The sectoral effect on dividend policy 8
C. Modeling the theoretical possibility of tax-arbitrage in the
Hungarian stockmarket
10
D. Testing if there is trading for tax-arbitrage on the
Hungarian Stock-market
12
c) Empirical results 14
A. The connection between betas and dividend payout ratio 14
B. The sectoral effect on dividend policy 15
C. Modeling the theoretical possibility of tax-arbitrage in the
Hungarian stockmarket
20
D. Testing if there is trading for tax-arbitrage on the
Hungarian Stock-market
22
d) Applicability in practice 24
e) The author’s publications in the same field 25
5

a) The aim of the dissertation and the precedents
This dissertation has been dedicated to dividend policy, or – to be more precise – the
characteristics of the dividend policy of Hungarian companies.
Motivation
I was engaged by the Department of Finances in 1992 (and then after the reorganization in
1993 by the Department of Corporate Finances). One of the key problems was dividend
policy that was treated in the 1989 first edition – serving as the basis of the first Hungarian
edition in 1992 – with relative simplicity. The message conveyed by the chapter on dividend
policy was that on a perfect market dividend policy did not matter at all, as it had been stated
by the well-known 1961 publication of Modigliani & Miller in connection with the
irrelevance of dividend policy.
The given educational material did not detail the opinions in this issue – the main
argument for the payment of the largest possible proportion of the profit in the form of
dividends was proper transparency and information flow, while the tax disadvantages of
dividends, i.e. the larger tax rate in comparison with the exchange gain tax rate, called for the
reduction of dividend payment rates. This topic did not promise particular excitements,
especially in the light of the (frequently cited) fact that in corporate financial decisions –
investment, financing, dividend policy – dividend policy should have a residual role: its
effects have been examined in relation to fixed investment and financing policy. The
arguments claiming that the market of instruments and financing items is the least perfect, and
consequently for the maximization of the shareholding value the primary task is to optimize
them, and then any decision on dividend policy can move within the remaining, limited scope
of variability in a passive way suggested that the entire dividend issue was a “aesthetic”,
rather than a value-adding decision.
At the same time, Hungarian market did not seem to take a middle course. In education,
for me it was inevitable to have some kind of insight in the Hungarian capital market as a
small investor and rather reluctant analyst, and the associated experience has clearly pointed
out that shareholders invariably and without reservations like the news of rising dividends,
and therefore the market also acknowledges the increase with the improvement of prices. If in
any of the past 16 years, in any of my education groups I have raised the question whether
they would like to see larger or smaller dividends from a specific share, those giving their
opinions have always voted for larger dividends. Therefore, it seems that the mainstream
6

thought, the assumption of the irrelevance theory, the perfection of capital markets is in full
contrast with the actual market practices.
The first impetus to dig deeper in this topic was given to me when seeing that it seemed to
be simple to test imperfections on the not too efficiently functioning Hungarian capital
markets, and thus it could be easily accepted that in certain situations, at specific companies,
groups of investors larger dividends tended to increase the assets value of shareholders, while
other situations the same was triggered by the policy of smaller dividend payouts. Obviously,
it is not only Hungary where the assumption of the perfection of the capital market proves to
be false, but also on more developed capital markets – after having a deeper insight into the
associated literature, I have found myself realize what a broad range of factors, investor
motivations, internal and external parameters in view of the company and its shareholders can
influence the optimal volume.
While elaborating the dissertation, I have felt my concept strengthening that the
examination of dividend policy would offer an excellent opportunity for students of master’s
degree to have a kind of summary subjects of corporate finances – because dividend policy
can be deemed to be a sort of all-inclusive discipline. When being studied, it can be seen how
many external factors affect the shareholders’ assets embodying in the dividend and shares,
what aspects influence their attitudes to dividends and related decisions.
It is the complexity of the topic why I think it should be introduced as an education
subject for the master’s degree. In this later stage of studies, students do have fundamental
knowledge of corporate finances, asset evaluation, investment, accounting, taxation, law and
options. On the other hand, the proper knowledge of dividend policies, insight into the
motivations of investors, the theoretical survey of the economic and psychological
correlations call for the extensive use of mathematical and statistical means.
The Hungarian stock market of the past 18 years has served with the number of exciting,
interesting, actual decisions in relation to dividend policy – these concrete examples should be
processed in order to offer an opportunity to understand the associated theories in a more
entertaining manner, to create a kind of symbioses of the sometimes shocking solutions of
practical activities and models described in the related professional literature.
Theoretical background
Up to this date, the starting point of studies on dividend policy is the model of Modigliani
& Miller assuming the existence of perfect capital markets, and thus claiming dividend policy
7

to be irrelevant. The key issue of any survey of the related professional literature is how an
approach without assuming the existence of perfect capital markets would influence the
dividend payment practices of companies. The related literature has provided a long list of
factors influencing dividend policy: the willingness of investors to take risks and diversify
their portfolios, various tax rates (for instance, Brennan [1970], Litzenberger & Ramaswamy
[1980], [1982]), the time horizon of investment, future prospects of plow-back and
profitability, similar policies of competitors within the given industry, as well as the
differences of sectors (for example, Rozeff [1982]), alternative financing opportunities,
various transaction costs, situations of access to information and information games,
behavioural finances describing decision-making in uncertain situations – in practice, they all
affect the dividend policy followed by companies. A number of models have been developed,
and supported by practical test results they have partly proved that in the face of varied
external circumstances companies may follow significantly different dividend policies. On the
other hand other models showed that investors with different tax positions, incomes and
shareholding positions would opt for companies following dissimilar dividend policies.
The fact that dividend policy is suitable for influencing the assets of shareholders induces the
reconsideration of the former passive dividend policy. Several publications have enriched the
related professional literature to call the attention to the fact that dividend policy decisions do
affect financing and moreover investment decisions, meaning that their influence cannot be
examined solely passively, within a domain determined by the other decisions. In other
words, active dividend policy means that in any given case a company would not accept any
investment even with positive net present value if it triggered changes in the long-term
concept of dividend policy, and thus indirectly would deduct the shareholding value, and that
in certain situations dividend policy decisions and indebtedness decisions may be
supplementary to each other or alternatives.
Even in view of the major ones, the number of publications adding to the debate about
dividend policy counts hundreds, and on the basis of the examined parameters, assumptions
the scope of problems is very extensive. It is obvious that it is almost impossible to handle the
effects of single parameters independently. There are many talking about the mystery of
dividend policy, because for instance there have been cases when companies have paid
considerable amount of dividends in spite of the apparent tax disadvantages, while others
have rather refrained from dividend payouts in spite of the information benefits. It seems to be
clear that a company owned by the given shareholders and operated in a specific industry at
the given time, under the effective regulatory and tax regime, with the given management and
8

investment opportunities will shape its own dividend policy under the combined effects of the
given circumstances.
The variability of grouping options is shown in next Figure where the opportunities for the
proper arrangement of opinions provided in the debate are listed.
Figure 1 Arrangement options for the grouping of opinions on dividend policy
Right wing
Left wing
Classic / Effect on value
Market imperfections Information content
Assymetric position
Information imperfection Middle of the road
Tax implication
Dividend policy
Assymetric information / Signaling theory
Full access to information
Behavioural studies
Agency theory
Transaction costs of alternatives
My empirical studies can be divided into to main parts.
The first part mainly focus on testing the effect of the market imperfections on the
dividend policy. My empirical studies focus the effect on dividend payout ratio and dividend
yield caused by different sectors the companies belonging.
Since the 1960s, statistical tests have been used to prove (for example, Dhrymes & Kurz
[1967], Fama [1974], McCabe [1979], Michel [1979]) and Rozeff [1982]) or refute (Higgins
[1972]) that in different industries companies tend to follow differing dividend policies. The
tests regarded to confirm such sectoral effects have led to double results:
- on the one hand, dividend policies have shown significantly differences in the various
sectors,
- on the other hand, the homogeneity of intra-sectoral dividend policies cannot be
discarded on the established significance levels. (For instance, Rozeff, [1982]).
A parallel explanation is the similar betas of the companies belonging to the same
industry. The betas of mature companies reflected values nearing the average, while growing
companies rather carried risks – any market upswing may multiply their turnovers. On the
basis of the test of Rozeff [1982], larger betas tend to be accompanied by smaller dividend
payments. If in the light of the conclusions of the CAPM model the larger beta value is
9

associated with higher expected profitability, then according to Rozeff’s results it was the
companies with higher expected profitability that actually paid smaller dividends.
In the above-referenced model of Rozeff [1982] concerning dividend payout ratio as a
profit variable, the regression coefficient of beta was –27.62, meaning that any unit increase
of the beta value led to a 27.62% drop in the payout ratio on the average.
With respect to the foregoing, it seems that dividend policy cannot be separated from the
profitability of corporate investments. The assumption for the perfect market, i.e. that the role
of dividend policy should be examined in view of the given investment and financing policy,
seems to be discarded if the transaction cost implications of various strategies are also taken
into consideration. It is not true that dividend payment and the concurrent issuing of new
shares are perfect substitutes for the withholding of the profit due to the transaction costs of
share issuing. In other words, it means that it is not only the projected investment policy that
influences dividend policy, but there must be an effect mechanism of opposing direction in
work. Dividend policy recoils on investment policy, as well: in the light of the foregoing,
growing companies pay smaller dividends owing to their larger reserves of resources, but it is
also likely that they refrain from profitable investments, because they would induce drastic
changes in funds – and either the alteration of dividend policy, or further share issuing would
generate excessive transaction costs.
It seems that the process of becoming a mature company leads to shrinking profitability
and the moderation of the company’s systematic risks. From the perspective of the new
effects of dividend policy, the increase of dividends conveys double information: the drop of
profitability (which is bad news) and the moderation of risks (which is good news). According
to the calculations of Allen & Michaely, the yield expected from companies that increased
their dividends in the period from 1972 to 1998 diminished by 1% on the average. (Although
their expected growth rates decreased to a larger extent, 2% on the average, but dividend in
the numerator increased, and therefore on the basis of Gordon’s model their theoretical share
price rose.)
The second main focus of dissertation is the tax effect of the dividend policy.
Models relying on the tax implications can be divided into two main groups:
- models relying solely on tax implications;
- examination of the combined effects of taxes and other factors (signaling principle).
10

This part focuses exclusively on the first group. Models relying on tax implications are
excellently grouped in the study of Judit Kosárka [2007], and thus most of this chapter makes
use of her work offering extensive resources.
The related literature calls such a situation clientele model where on the basis of various
preferences investors opt for different companies, and thus companies sees the emergence of
their own steady clienteles, circles of investors.
The grouping options of clientele models established on the basis of tax implications are
shown in next Figure.
Figure 2 Examination models of tax implications on dividend policy
Static models
Institutional investors
Minimization of tax on dividends
Marginal taqx rate
Conventional Simple
Dynamic models Taxes and risks
Changes in dividend policy
Tax reform
Corporate risks
Examination models of tax implications
Expected earnings on
shares
The second part of my empirical study is focused on the conventional static models, at
closer look the minimization of tax on dividends.
11

b) Research methodology
A broad range of methods have been applied to the studying of dividend policy. Purely
theoretical models without empiric results (for instance, Brennan [1970], Modigliani & Miller
[1961]) have been established, while on the other hand interviews have been made with
company managers (Lintner [1956]), but the most frequently the testing of statistical–
econometric models have been chosen for the verification of the given models.
In my studies, I have also tried to obtain answers to my questions with the use of tests
conducted on statistical samples, i.e. performed quantitative surveys. The prices and turnover
data of shares traded at the Budapest Stock Exchange offer daily data sequences, whereas
from the financial statements of companies listed at the stock exchange annual balance sheet
and profit figures can be established. In other words, it means that a sample of sufficient
volume is available for the performance of the quantitative analysis.
Each of the examined variables can be measured against a scale of ratios, which allows
the performance of a wide range of statistical analyses. Within the context of my statistical
studies, hypotheses will be established on the basis of the generally accepted methodology of
hypothesis examination.
For the hypothesis examination, a nullhypothesis and alternative hypothesis have been
established. The material statement of the nullhypothesis is that the examined independent
variable does not cause any essential change in the value of the dependent variable (regression
analysis) or the empirical values from a sample have the same functions (average, standard
deviation, distribution) as we would expect from a theoretical distribution. In contracts, the
alternative statement is that on the given level of confidence (typically 95%) the
nullhypothesis cannot be accepted, and the examined explanatory variable brings about a
significant difference in the value of the dependent variable. Consequently, the rejection of
the nullhypothesis and acceptance of the alternative hypothesis mean the statistical
confirmation of the assumption that the explanatory variable exercises a significant influence
on the dependent variable, or the values from the sample significantly differ from the ones we
would expect from the theoretical distribution.
The main research methodologies are the following:
12

A. The connection between betas and dividend payout ratio
To examine this connection firstly I used regression analysis between the betas of the
companies and their dividend payout ratios. As far as it is not evident, how to build up and
what is the relevant CAPM-model to get betas, I used several market portfolio and time
horizon to test this connection. I also tried to test the non-linear function between these
variables. So as I build a factor-analysis model with several betas as independent parameters
in it, and also build a cluster-analysis to test the connection between risk and dividend payout
ratio.
B. The sectoral effect on dividend policy
To test, if the dividend payout ratio and dividend yield differs in different sectors, I used
the model of variance-analysis.
The key question is whether in the examined period, between 1996 and 2006 Hungarian
companies belonging to the same industry followed identical dividend policies, or whether
their respective sectors influenced dividend policy, the dividend yields of the individual
companies or the dividend payout ratios. To test this aspect, we have used variance analysis.
The nullhypothesis of the test for the single-parameter variance analysis is that when the
population is split up into M units the expected values for the individual groups should be
identical:
μμμμ ==== M210 :H K .
The alternative hypothesis is that there exists at least one such jth group whose average differs
from the expected value of the population:
μμ ≠≤≤∃ j:Mj :H 11 .
The test is performed with the breakdown of the sum-of-squares of the deviation. The total n
units of observed values are categorized into M groups, and in the jth group there will be nj
observations. With the observations marked with y, means the iijy th individual observation in
the jth category, jy is the average of the jth category and y is the average of the entire sample.
Thereafter, the breakdown of the total sum-of-squares (SST) into internal sum-of-squares
(SSB) and external sum-of-squares (SSK) is:
SSKSSBSST += (1)
13

∑∑ ∑∑∑= = == =
−+−=−M
j
n
i
M
jjjjij
M
j
n
iij
jj
yynyyyy1 1 1
22
1 1
2 )()()( (2)
The internal sum-of-squares shows intra-group deviations, i.e. how much they differ from
the other members of the group. The external sum-of-squares of deviations reflects the
deviation of group averages and the main average of the sample. To test statistical
independence, the F test function is applied. Towards this end, the external and internal sum-
of-squares of deviations is adjusted with the appropriate degrees of freedom (external: M-1;
internal: n-M).
)Mn,M(F~)Mn/(SSB)M/(SSKF −−
−−
= 11 (3)
If there is any independent variable, i.e. grouping criterion that influences the observed
values, the value of ratio F will be larger than the limit value belonging to the given
significance level.
To establish the differences of the various industries, all the dividend figures of the
studied companies within the examined period are taken into consideration, and thus the total
number of observations represents the n value, whereas the number of industries is M.
Identical dividend policies within a specific industry can also be tested with the use of F
statistics. Here, the analysis is to be performed separately for the individual sectors. The
individual companies mean the grouping criteria, M is the number of companies belonging to
the given industry, means the specific observation of the iijy th year for jth company, jy is the
average data of the jth company, y is the main average, that is the average dividend data of
the given sector. Our nullhypothesis is that the average dividend data of the individual
companies are identical, while if the F value described in paragraph (3) exceeds the limit
value belonging to the significance level, the homogeneity of the given industry is not proven.
There is a clear agreement in the related literature that the sectoral differences of the
dividend policies of companies are determined by the growth prospects of the given industry.
One would think of industries with low dividend payout ratios (pharmaceutical industry,
financial services, chemical industry, IT in the examined Hungarian sample) that they plow
back most of their profit into their operations, because with the employment of the monies of
investors the reinvestment brings about larger yields in comparison with the investment of the
dividends on capital markets. In contrast, industries with high dividend payout ratios
(chemical industry and food processing in the above sample) pay a lot of dividends, because
for the future they foresee worsening or stagnating reinvestment opportunities, growth. For
14

this reason, to test the statements of the literature three additional profitability variables
(return on equity; average yearly growth rate in price; total ex-post return of the stock) have
been involved in my studies, so as to examine by regression models, if there is a negative
connection between growth rate and dividend yield, and if the total return of stocks are
indifferent on dividend yields.
C. Modeling the theoretical possibility of tax-arbitrage in the Hungarian
stockmarket
The model that is explained by Kalay in the chapter grouping dividend policies with
respect to taxation (Kalay [1982]) has substantial practical consequences. The model concerns
dynamic tax minimization, meaning that at times of dividend payment investors of varied tax
rates are able to effectuate tax arbitrage by means of trading activities. The associated effects
can be perceived e.g. in Hungary at the times of dividend payment on shares considerable
dividend yields. For this reason, this theory is explained in details.
Hereunder, tax arbitrage is defined as such a share trading activity whose purpose is to
reduce the aggregate tax payment obligation (sum of the tax on dividend and profit gain tax)
of the participants. As a result of the arbitrage, typically all the participating actors see their
tax payment obligations reducing, yet within the context of the model it is sufficient to
assume that the obligations of at least one stakeholder decreases, while none of the actors has
rising payable taxes.
To measure the potential extent of tax minimization, I build up a model on it.
The first step should be the application of formula (4). I defined it as the equivalent of
dividend profit gain:
(PB-PB A) = pg
D
TTDIV
−−
11* (4)
Upon the rearrangement of the equation, the ratio of tax implications can express what a
price can be regarded as the equivalent of a HUF 100 dividend for the given investor, i.e.
what the equivalent of the dividend profit gain is.
(PB-PB A) / DIV = pg
D
TT
−−
11 (5)
T* = 100 * pg
D
TT
−−
11 (6)
15

wherein
TD – tax rate on dividend,
Tpg - rate of profit gain tax,
T* - volume of the profit gain ensuring the same after-tax profit as 100 units of dividend
(equivalent of 100 units of dividend profit gain).
On the basis of the formula, it can be established what an amount of price gain should be
granted to the market actor to supply the same amount of after-tax income as if a dividend of
HUF 100 were furnished – or in other words, what the equivalent of dividend profit gain of
HUF 100 is. Obviously, any value over 100 indicates more favorable tax rate for the dividend,
and vice versa.
The Hungarian situation is different from the US one, as only two types of clienteles can
be distinguished: corporate and private person investors. Private persons pay taxes from
dividends and incomes from profit gains as separate incomes. The only potential difference
that can be detected when the incomes of private persons are observed is that under certain
conditions (capital account; company listed at the stock exchange) they are to pay taxes with a
more favorable profit gain tax rate, or in the case of dividends exceeding 30 percent of the
adjusted equity the payable taxes are (were) calculated with a more unfavorable tax rate on
dividend. As in the case of companies listed at the stock exchange the examined period never
saw the payment of dividends over the above limit to effectuate the 35% rate, while tax
benefits could typically be realized by holding stock exchange shares, two groups of private
persons have been specified: investors with “normal rates” and preferential tax rates.
The second step discusses the expanse of the underlying price range the third the volume
of the achievable arbitrage.
The calculation of the potential arbitrage is hindered by the fact that any two of the actors
would pay different taxes on profit gains (or save taxes on losses). Therefore, tax savings on
the profit gain tax can exclusively be realized by corporate actors, and only if it has made
losses (prior to the dividend payment, it purchases at larger cum-dividend prices, and after
dividend payment sells at smaller ex-dividend prices).
The arbitrage that can be achieved in connection with the tax on dividend and the profit
gain tax are hereby handled separately, and it is also distinctly examined how prices change
within the price range being appropriate for arbitrage. In between the two extreme values, the
16

value of tax savings is linear, and therefore the calculated values are presented only for these
two extreme values.
Savings of the private person in the tax on dividend:
DIV * TD (7)
wherein TD: the tax rate on dividend for the private person.
After dividend payment, the price drop should minimally have an extent that makes for
the private person worth selling the share prior to dividend payment, and repurchase the same
after dividend payment:
DIV * (1-TD) (8)
After dividend payment, the price drop should maximally have an extent that makes for
the corporate actor worth purchasing the share prior to dividend payment, and sell the same
after dividend payment (assuming that the company is profit-making, and therefore pays
corporate income tax):
DIV / (1-TC) (9)
On the basis of (8) and (9), the potential range of price drop is:
DIV * (1-TD) < PA – PB < DIV / (1-TC) (10)
As the third step, we can calculate the total potential tax savings. With the use of equation
(10), such a value has been calculated that the tax savings on the price loss may take during
arbitrage for a profitable corporate actor (as depending on the fact whether the price drop
arrives at the minimum value representing the limit value for the private actor or the
maximum meaning the limit value for the corporate actor):
DIV * (1-TD) * TC < PA – PB < DIV / (1-TB C) * TC (11)
Adding up the tax savings of the private actor and corporate actor (that is the sum of (7)
and (11)), the effective range of the total tax saving is:
Minimum: DIV * TDP + DIV * (1-TD)* TC < PA – PB B (12)
Maximum: PA – PB < DIV * TB D + DIV / (1-TC) * TC (13)
D. Testing if there is trading for tax-arbitrage on the Hungarian Stock-market
Above I have proved on theoretical grounds that at the Hungarian stock markets investors
with various tax rates have the theoretical option to implement active tax minimization
strategies at time of dividend payments. In other words, it means that by trading shares around
the days of dividend payment investors can minimize their tax burdens. In the light of our
practical market experience, investors in fact act so in relation to some of the shares. In order
17

to test this process, it has been examined whether at times of dividend payments there occurs
any substantial rise in the turnover – and if yes, in our opinion it is a guarantee for arbitrage
activities.
To test significant rise in turnover, simple t statistics have been selected. It has been
examined whether the average turnover measurable in the given window (expressed in value)
significantly exceeds the annual turnover of the share in question. For the purpose of the
model employed, we have had the assumption that the examined windows of 5–20 days, as
well as the distribution and standard deviation of the samples for the entire year do not differ
from each other significantly. The formula of the applied t statistics is:
nsXt
/μ−
= (14)
wherein:
wherein:
– X is the average daily turnover figure of the sample window;
– μ is the average daily turnover figure of the given share for the whole year;
– s is the standard deviation of the daily turnover data of the given share for the whole
year
– n is the number of the trading days within the sample window (i.e., in fact 5 or 20.)
On the basis of the t test, presuming normal distribution, if the test result is 2 or more, then
on the 95% reliability level it can be stated that the examined window has reflected significant
rise in turnover.
18

c) Empirical results
A. The connection between betas and dividend payout ratio
Hypothesis 1: There is a negative connection between the beta and the dividend payout
ratio by the Hungarian companies listed at the stock exchange.
Studies in the literature found negative correlation between the dividend payout ratios and
beta values of shares. Therefore as the first step of our investigation we calculated the
correlations between the betas calculated with various methods and the dividend payout ratio
of the given year for each year between 1997 and 2006. (Since the dividend payout ratio of
the year is required for calculating the correlation and the dividend payment decision for 2007
is only determined in the spring of 2008, we could not examine the last year of the database,
but naturally the betas calculated with these data remained in the database.)
Reviewing the correlations (Schedule 1 contains the correlation tables) and comparing
those to the results of earlier studies of others brought a rather surprising result: on the one
hand the number of significant connections is very low in most years – for example we found
no significant connection in 2000. On the other hand the direction of the connection is also
not unambiguous, although negative correlations are more frequent i.e. the higher risk rather
seems to decrease the payout ratio. Another problem is that none of the methods for
calculating betas showed constant significant connection with the payout ratio. (It is a
problem with the reliability of our results that each correlation has been calculated from 25-28
observation pairs.) Majority of the observed significant connections is negative, i.e. our
results are parallel with the conclusions of previous studies: the higher risks tend to come with
lower payout ratios in the examined period.
Thus hypothesis 1 has been partly confirmed.
Based on our investigation it seems that the dividend payment policy of the companies is
not stabile, they follow different policies in different economic periods.
Hypothesis 2: The dividend policy of the various periods of the companies is influenced
in different ways by their risk exposure. According to my hypotheses companies with high
risk tend to lower their dividend significantly in the expansive periods, while there is no such
unambiguous connection between the corporate risk and the dividend policies in recessive or
stagnating periods.
19
According to our observations the connection strengthened spectacularly in the period
between 2002 and 2004, while in the other years very few of the betas showed significant
correlation. (See regression values of Schedule 1.) This suggests that if a connection does
exist between the payout ratio and the risk it has changed with time. The conclusion can be
made for the period between 2002 and 2004, when expansive economic policy was
characteristic that companies with higher risk, i.e. those reacting more to the growth
opportunities tended to reinvest their profit and paid less dividend, than companies that are
more stabile and therefore have less growth opportunity. Thus hypothesis 2 most probably
must be accepted.
Based on the results on the factor-analysis and cluster-analysis, we cannot state that
companies with similar risk profile follow identical dividend policy at the Hungarian capital
market. Thus we can hardly conclude from one characteristic observation to another with
good results.
Based on all these we concluded that the connection between the lower market risk –
higher dividend payout ratio connection determined by Rozeff in essence is true for the
Hungarian market as well for the examined period. According to our results, companies
characterized with high dividend payout ratio are found rather among those with lower beta,
while companies with higher market risk could be characterized with moderate but not zero
dividend payout. Thus it cannot be stated that companies not paying dividend at all would be
the riskiest.) At the same time the dividend policies of these companies were rather variegated
and could not be characterized with a decisive trend, i.e. successful conclusions for the change
of ratios or for a reverse effect could not be derived from the change of the market risk.
B. The sectoral effect on dividend policy
Hypothesis 3: The dividend payout ratios of the individual industries differ from each
other.
During the studies, the opposite statement is tested as the nullhypothesis: the dividend
payout ratios of the individual industries are identical. The acceptance of the hypothesis is
when nullhypothesis has to be refuted in the light of significant sectoral differences.
On the basis of the results of the variance analysis (p: 0.000), it is suggested that
companies belonging to different industries would follow differing dividend policies.
Consequently, hypothesis 3 can be accepted with quite a certainty.
20

Table 1 Results of the variance analysis on unweighted sectoral dividend payout
ratios
dp
Differential
sum-of-
squares
Degree of
freedom
Average sum-
of-squares F value p value
Critical
F value
SSK 51116.591 5 10223.318 13.095 0.000 2.268
SSB 131156.978 168 780.696
SST 182273.569 173
Hypothesis 4: The companies belonging to the individual industries can be characterized
by identical dividend payout ratios. This statement can be confirmed with the nullhypothesis
of the variance analysis.
In the second phase, the variance analysis has been performed for each of the industries
separately. Companies have been used as the grouping criterion, meaning that the question
has been raised to ask: whether the dividend policies of companies belonging to the same
industry can be considered to be similar on the long run. From among the six industries, it was
solely chemical industry where similarity as the nullhypothesis could not be refuted on the
established significance levels. In the other five sectors, the dividend payout ratios of the
companies have showed significant differences.
Consequently, hypothesis 4 has been confirmed just partly (in chemical industry), whereas
the other sectors have demonstrated significant deviations. It seems that companies have not
been influenced in the framing of their dividend policies by the actual policies of the
competitors.
Sectoral studies in the related literature solely focus on the analysis of dividend payout
ratios. No examples have been found for the testing of dividend yields within the framework
of sectoral particularities. The main function of this indicator is to break down the total after-
tax yield of the investor into certain portions (dividend yield + yield originating from the
profit gain). In the associated professional literature, the division of yields aims at the
demonstration of the fact that if differing tax rates are imposed on various capital incomes, the
shares paying different yields will be purchased by investor groups with different tax rates.
In my opinion, the significance of sectoral studies on dividend yields is inherent in the fact
that the behaviour of investors operating in certain industries and their preferences for
dividends may be different, as well. While the dividend payout ratio describes dividend policy
21

via the method of the division of the profit, from the perspective of companies, dividend
yields are indicative of investor attitudes: whether companies belonging to certain industries
are homogeneous or not on the basis of the realizable dividend yields. The two indicators do
not necessarily run parallel with each other – in between them, the link is the return on equity
calculated at market rates. A priori, it seems to be likely that average profitability rates of the
individual sectors are different, and therefore these industries may show differences of various
roots in the examination of dividend yields, as it has been seen in relation to dividend payout
ratios, as well. If, for instance, electric power suppliers and food processors producing basic
goods, and therefore seeing more steady markets feature lower profitability – adequately
with the lower risk levels –, it is still possible that dividend yields related to the invested
capital become better balanced than the values of dividend payout ratios.
Hypothesis 5: In the individual industries, the dividend yields that are realizable by the
shareholders differ from each other. The test is suitable for examining the nullhypothesis
setting forth an opposite statement, i.e. that dividend yields tend to be identical within the
respective industries. The justification of the hypothesis is in fact the disallowance of the
nullhypothesis.
In the light of the variance analysis, I think that the nullhypothesis can be refuted on very
high levels of significance, so it is not true that in different industries companies would follow
identical dividend policies. Consequently, hypothesis 5 is seen to have been justified.
22

Table 2 Table of the variance analysis on the dividend yields of industries
dy
Differential
sum-of-
squares
Degree of
freedom
Average sum-
of-squares F value p value Critical
F value
SSK 1211.645 5 242.329 21.724 0.000 2.273
SSB 1706.730 153 11.155
SST 2918.376 158
The second step of variance analysis has returned to the examination of homogeneity
within the respective industries.
Hypothesis 6: Within the individual industries, investors can achieve similar dividend
yields by holding various shares.
Again, it seems that chemical industry is the sector where companies operate the most
homogeneously to fulfill the expectations of investors for dividend yields. In the other
industries, there have occurred differences among the dividend yields granted by the
individual companies – the dividend yields that can be realized with certain companies of the
pharmaceutical industry and food processing are different even on the stricter significance
levels. Therefore, it seems that on the basis of corporate dividend policies (ratios of the
division of profit, i.e. the value of the dividend payout ratio) and dividend yields that are
realizable by the investors corporate policies significantly differ from each other in most of
the industries, as well.
Consequently, hypothesis 6 has been justified partly, again only for chemical industry.
Hypothesis 7: Companies with higher profitability and higher expected growth rates tend
to pay smaller dividends.
The average ROE figures of companies do not support the theoretical principle of low
profitability – large dividend payment: the largest profitability can be found for food
processing featuring high payout ratios, whereas the profitability of the four industries with
low dividend yields are under the average.
First, the dividend payment data of the company for the year under review have been
compared with the profitability figures in the year under review. The analyses conducted with
the average figures of the companies have generated fully parallel results. The dividend
payout ratio is independent from both the profitability of the company in the year under
review and its growth rate, as well as from the total realizable yield. The total realizable yields
of companies are determined by price changes (r = 0.997) to an even larger extent than what
23
has been seen in relation to the studies of the average values of the companies, and therefore
the dividend yield has had only a very weak correlation with the total yield or the price
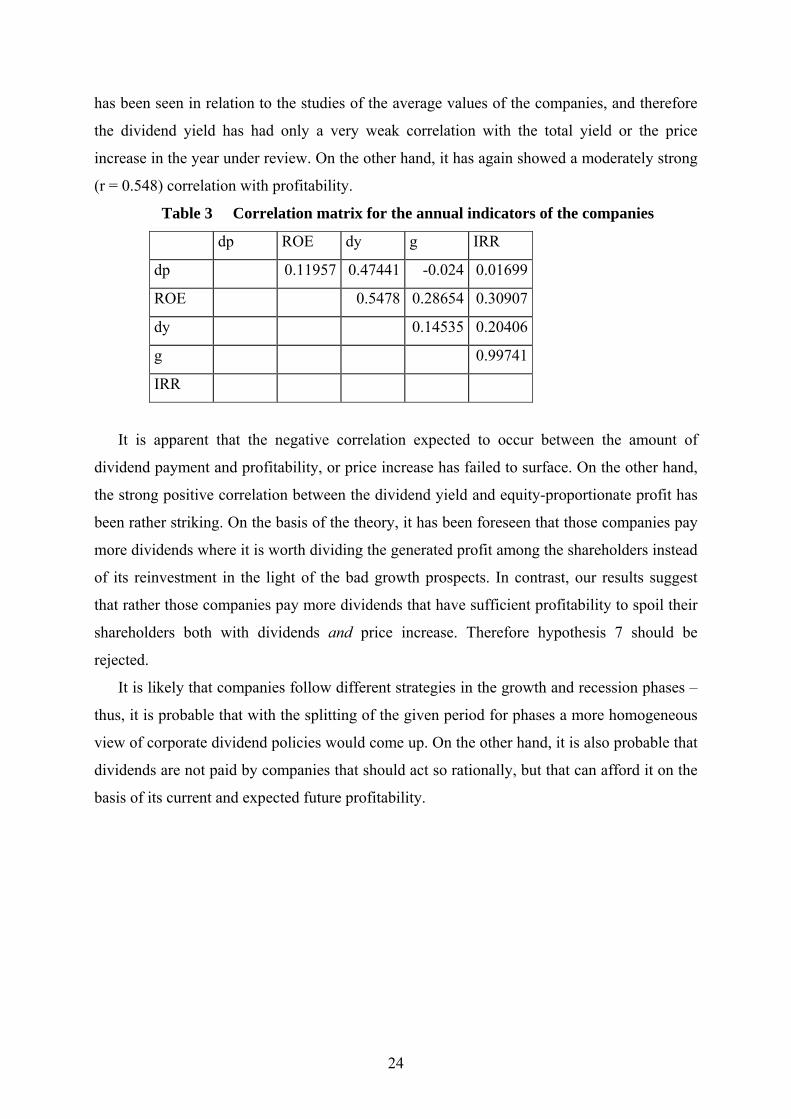
increase in the year under review. On the other hand, it has again showed a moderately strong
(r = 0.548) correlation with profitability.
Table 3 Correlation matrix for the annual indicators of the companies
dp ROE dy g IRR
dp 0.11957 0.47441 -0.024 0.01699
ROE 0.5478 0.28654 0.30907
dy 0.14535 0.20406
g 0.99741
IRR
It is apparent that the negative correlation expected to occur between the amount of
dividend payment and profitability, or price increase has failed to surface. On the other hand,
the strong positive correlation between the dividend yield and equity-proportionate profit has
been rather striking. On the basis of the theory, it has been foreseen that those companies pay
more dividends where it is worth dividing the generated profit among the shareholders instead
of its reinvestment in the light of the bad growth prospects. In contrast, our results suggest
that rather those companies pay more dividends that have sufficient profitability to spoil their
shareholders both with dividends and price increase. Therefore hypothesis 7 should be
rejected.
It is likely that companies follow different strategies in the growth and recession phases –
thus, it is probable that with the splitting of the given period for phases a more homogeneous
view of corporate dividend policies would come up. On the other hand, it is also probable that
dividends are not paid by companies that should act so rationally, but that can afford it on the
basis of its current and expected future profitability.
24
C. Modeling the theoretical possibility of tax-arbitrage in the Hungarian
stockmarket
Since 1996, corporate investors has clear tax benefits in dividend payment, as their
dividends received from other companies are exempt from taxes, while the profit gain is
deemed to be a part of the corporate income tax base, and thus subject to the payment of
corporate income tax. Since 1998, the taxation conditions have been changed on several
occasions. From 1996 to 2001, in the case of stock exchange shares – provided that their
investments were held in capital accounts – private investors were exempt from the effects of
the profit gain tax. Therefore, in this period private investors had clear benefits in the profit
gain. It means that in the period of 1996–2001 the two groups of investors did not enjoy
comparative, but absolute tax advantages in the two tax types. At times of dividend payment,
institutional investors were to buy, while private investors should have sold.
From 1990 to 2007, it has been calculated for each year what percentage of the dividend –
as the aggregate earning – could be realized by both actors owing to the tax arbitrage between
the corporate and private investors. For the individual actors, the above-described profit gain
equivalent of the dividend has been established, as well. Thereafter, the difference of the
profit gain equivalent for the two potential partners has been adjusted with the profit gain tax
–using the tax rates for private persons in the first column, and for companies in the second
column. The results are presented in the next Figure.
25

Figure 3 Arbitrage opportunity for a dividend of HUF 100 between a private
person paying normal taxes and a company (HUF)
0,00
5,00
10,00
15,00
20,00
25,00
30,00
35,00
1990
1992
1994
1996
1998
2000
2002
2004
2006
2007
Ft
Normal Company
Figure 2
Figure 4 Arbitrage opportunity for a dividend of HUF 100 between a private person paying preferential taxes and a company (HUF)
0,00
5,00
10,00
15,00
20,00
25,00
30,00
35,00
40,00
45,00
50,00
1990
1992
1994
1996
1998
2000
2002
2004
2006
2007
Ft
Preferential Company
26

As the figure reflects, the years of 1990–91 and 1995 can be regarded to be arbitrage-fee.
It is also shown that the objectives of the tax reforms did not focus primarily on the
elimination of arbitrage options. The tax reform of 1995 ruled out the rather moderate
arbitrage opportunities having been in place so far. The potentials of arbitrage were enhanced
by the tax benefits provided to private stakeholders in 1996 (profit gain tax exemption of
shares held in security accounts), as well as the exemption of companies from the tax on
dividend in effect from 1996, while the changes in September narrowed for a period the
scope. From year 2003 the arbitrage opportunities reach 30% again.
D. Testing if there is trading for tax-arbitrage on the Hungarian Stock-market
The theoretical chapter has proved on theoretical grounds that at the Hungarian stock
markets investors with various tax rates have the theoretical option to implement active tax
minimization strategies at time of dividend payments. In other words, it means that by trading
shares around the days of dividend payment investors can minimize their tax burdens. In the
light of our practical market experience, investors in fact act so in relation to some of the
shares. In order to test this process, it has been examined whether at times of dividend
payments there occurs any substantial rise in the turnover – and if yes, in our opinion it is a
guarantee for arbitrage activities.
Hypothesis 8: At times of dividend payments, a considerable proportion of shares witness
significantly larger turnovers than in the other parts of the year.
Hypothesis 9: The avoidance of the tax on dividend by means of arbitrage is encouraged
by the fact if the given tax regime determines larger differences for the tax rates of the various
actors, thereby opening a broad scope to realize tax savings.
In the light of the results, in the case of 14 from among the 17 companies there were
years when at the times of dividend payments considerable rise in turnover could be observed.
It may be more convincing to mention that exactly in one-fourth of all the 150 turnover years,
that is in 41 cases significant increase in turnover could be recorded. For 18 of these 41 cases,
both before and after dividend payment turnover rose substantially – meaning that apart from
the incremental trading, the fact of two-way trading could also be ascertained.
Consequently, hypothesis 8, i.e. intensified trading activities at times of dividend
payments have the most probably been justified.
120 of the 150 examined share years, i.e. 80% of the samples fell within the period of
1997–2001 or 2003-2007, that can be regarded to be the most exciting time interval in view of
27

arbitrage. As it is reflected in Table 42 and 25–26, these five years opened the gates for
arbitrage especially wide. Of the 41 observed cases of significant rise in turnover, 31 cases,
that is cc. 75%, took place in the said period. From among the 18 cases when the increase in
turnover was equally significant before and after dividend payment, 11 cases, so as only 61%
fell within these favourable days for arbitrage.
It seems that hypothesis 9 cannot be confirmed with the use of simple methods: however,
arbitrage activities designed to evade tax on dividend were in place as irrespective of their
“efficiencies”.
28

d) Applicability in practice
In relation to dividend policy, the interests of three types of actors should be considered.
On the one hand, the aspects of companies driving growth, so as plow-back or cash outflow,
so as dividend to the owners, on the other hand the demands of investors, shareholders in
quest for the most efficient investments in the domain of risks and net yields, and thus relying
on tax minimization, even tax arbitrage, while the third set of aspects belongs to the
government, regulatory authority that sets the frameworks of the above decisions of
companies and investors, thereby trying to prevent tax evasion and tax games.
The most concrete practical results are exposed in Chapter 10 describing the theoretical
options of tax minimization and Chapter 11 proving the existence of actual tax minimization
processes statistically. In this context, it seems that from time to time the regulatory authority
tries to narrow the space for the tax minimization games of investors, but thereafter changes
in the same regulations for other purposes always open up the way for the arbitrage activities
of investors with various tax rates.
The empiric results have suggested that these imperfections are not purely theoretical
options, but are actually employed by stakeholders. The test results, the significant increase of
turnover at times of dividend payout on the Hungarian market show, that investors follow
dynamic tax minimization strategies by extensively. In Forints, tens of billions can be saved
by investors with active tax minimization strategies, and it is the very amount that the
regulatory authority should rescue for the treasury by means of the standardization of tax
rates.
Annually, investors and companies acting in favour of the interests of their investors
decide on tens of billions of Hungarian Forints when defining their annual dividend policies.
The taxes to be paid by the shareholders, the investment opportunities of the companies, the
psychological routines of shareholders, the responses to any unexpected volume of dividend
all influence of the wealth of the shareholders via prices.
29

e) The author’s publications in the same field
Book:
Fazakas G [1998]: Vállalati pénzügyek. (Corporate Finance) Kereskedelmi, Vendéglátóipari
és Idegenforgalmi Főiskola, Budapest.
Part of books:
Fazakas G. – Gáspár B. – Soós R. [2003]: Bevezetés a pénzügyi és vállalati pénzügyi
számításokba. (Introduction to the calculations in Finance and Corporate Finance)
Tanszék Kft., Budapest.
Fazakas G. – Sulyok-Pap M. [2000]: A vállalkozások pénzügyi döntései. (The financial
decisions of the companies) in.:Pénzügy. Magyar Könyvvizsgálói Kamara, 315-343,
Budapest.
Articles in Journals:
Fazakas G. [2003]: Hozamfajták. ((Types of rate of returns) Vezetéstudomány, április, 47-56.
Fazakas G. – Juhász P. [2009]: Alacsonyabb kockázat – nagyobb osztalék? A béta és az
osztalékfizetési hányad kapcsolatának vizsgálata a Budapesti Értéktőzsdén (1997-2007).
(Lower risk – higher dividend? Examining the connection between the beta and the
dividend payout ration int he Budapest Stock Exchange (1997-2007)) Közgazdasági
Szemle, április, 322-343
Fazakas G. – Kosárka J. [2008]: Az adók hatása az osztalékpolitikára. (The tax effects on
dividend policy) Közgazdasági Szemle, szeptember, 782-806.
30