Whole-Core Depletion Studies in Support of Fuel ... · Whole-Core Depletion Studies in Support of...
75
Whole-Core Depletion Studies in Support of Fuel Specification for the Next Generation Nuclear Plant (NGNP) Core by T. K. Kim, W. S. Yang, T. A. Taiwo, and H. S. Khalil Nuclear Engineering Division 9700 South Cass Avenue Argonne National Laboratory Argonne, IL 60439 July 30, 2004
Transcript of Whole-Core Depletion Studies in Support of Fuel ... · Whole-Core Depletion Studies in Support of...

Whole-Core Depletion Studies in Support of Fuel Specification for the Next Generation Nuclear Plant (NGNP) Core
by
T. K. Kim, W. S. Yang, T. A. Taiwo, and H. S. Khalil
Nuclear Engineering Division 9700 South Cass Avenue
Argonne National Laboratory Argonne, IL 60439
July 30, 2004
Argonne National Laboratory, a U.S. Department of Energy Office of Science laboratory,is operated by The University of Chicago under contract W-31-109-Eng-38.
DISCLAIMER
This report was prepared as an account of work sponsored by an agency ofthe United States Government. Neither the United States Government norany agency thereof, nor The University of Chicago, nor any of theiremployees or officers, makes any warranty, express or implied, or assumesany legal liability or responsibility for the accuracy, completeness, orusefulness of any information, apparatus, product, or process disclosed, orrepresents that its use would not infringe privately owned rights. Referenceherein to any specific commercial product, process, or service by trade name,trademark, manufacturer, or otherwise, does not necessarily constitute orimply its endorsement, recommendation, or favoring by the United StatesGovernment or any agency thereof. The views and opinions of documentauthors expressed herein do not necessarily state or reflect those of theUnited States Government or any agency thereof, Argonne NationalLaboratory, or The University of Chicago.
Available electronically at http://www.osti.gov/bridge/
Available for a processing fee to U.S. Department ofEnergy and its contractors, in paper, from:
U.S. Department of EnergyOffice of Scientific and Technical InformationP.O. Box 62Oak Ridge, TN 37831-0062phone: (865) 576-8401fax: (865) 576-5728email: [email protected]

3
Table of Contents
Page Abstract .................................................................................................................. 9
1.0 Introduction...................................................................................................11
2.0 Description of NGNP Core and Fuel Elements ............................................14
3.0 Description of Analysis Codes......................................................................18
3.1 WIMS8 and DRAGON Lattice Codes .......................................................... 18
3.2 REBUS-3/DIF3D Fuel Cycle Analysis Code System.................................... 21
3.3 WIMS/DIF3D/REBUS-3 Calculation Procedure ........................................... 23
4.0 NGNP Depletion Sensitivity Studies with WIMS8 Lattice Code....................25
4.1 Trend of Multiplication Factor with Fuel Parameters .................................... 25
4.2 Estimation of Core Cycle Length and Discharge Burnup ............................. 29
5.0 Whole-Core Model Evaluation and Studies..................................................33
5.1 REBUS-3/DIF3D Whole-Core Model for NGNP Core .................................. 33
5.2 Verification and Sensitivity Studies of REBUS-3/DIF3D Model .................... 36
5.3 Radial Peaking Factor Calculation with MCNP4C........................................ 44
5.4 Fuel Management Option – Single-Batch Core............................................ 47
5.5 Fuel Management Option – Two-Batch Equilibrium Core ............................ 51
5.6 Fuel Management Option – Three-Batch Equilibrium Core.......................... 61
5.7 Evaluation of Two- and Three-Batch Transitional Cores.............................. 66
5.8 Summary of Fuel Management Studies....................................................... 70
6.0 Conclusions..................................................................................................72
References ...................................................................................................75

4
List of Tables
Page Table 1. NGNP Fuel Element Data ...................................................................16
Table 2. NGNP Reference Values and Investigated Ranges of Fuel Particle Parameters .........................................................................................25
Table 3. Cycle Length and Discharge Burnup for Optimum Packing Ratio.......32
Table 4. Single-Batch Fuel Management Option with 350 µm and 425 µm Kernel-Diameter Fuel ..........................................................................47
Table 5. Two-Batch Fuel Management Option with 350 µm and 425 µm Diameter Fuel......................................................................................53
Table 6. Three-Batch Fuel Management Option with 350 µm and 425 µm Kernel-Diameter Fuel ..........................................................................63
Table 7. Summary of NGNP Excess Reactivity, Peak Power and Fluence ......71
Table 8. Summary of NGNP Heavy-Metal Loading, Cycle Length and Discharge Burnup ........................................................................71

5
List of Figures
Page Figure 1. NGNP Core Radial Arrangement .....................................................17
Figure 2. Standard Fuel Assembly of NGNP...................................................17
Figure 3. Eigenvalue Letdown Curve with Constant Flux Level.......................21
Figure 4. ISOTXS File Generation Procedure .................................................24
Figure 5. k∞ Letdown Curve for 200 �m Kernel ...............................................26
Figure 6. k∞ Letdown Curve for 300 �m Kernel ...............................................26
Figure 7. k∞ as Function of Moderator to Fuel Ratio........................................26
Figure 8. Fission Yield per Absorption (Eta) and Fast Fission Factor for Initial State........................................................................................27
Figure 9. Thermal Utilization Factors for Initial State.......................................27
Figure 10. Resonance Escape Probability (p) and Double Heterogeneity Effects .......................................................................27
Figure 11. Thermal-to-Fast Flux Ratio (Thermal Cutoff Energy = 4 eV)............28
Figure 12. Critical Burnup vs. Moderator-to-Fuel Ratio .....................................30
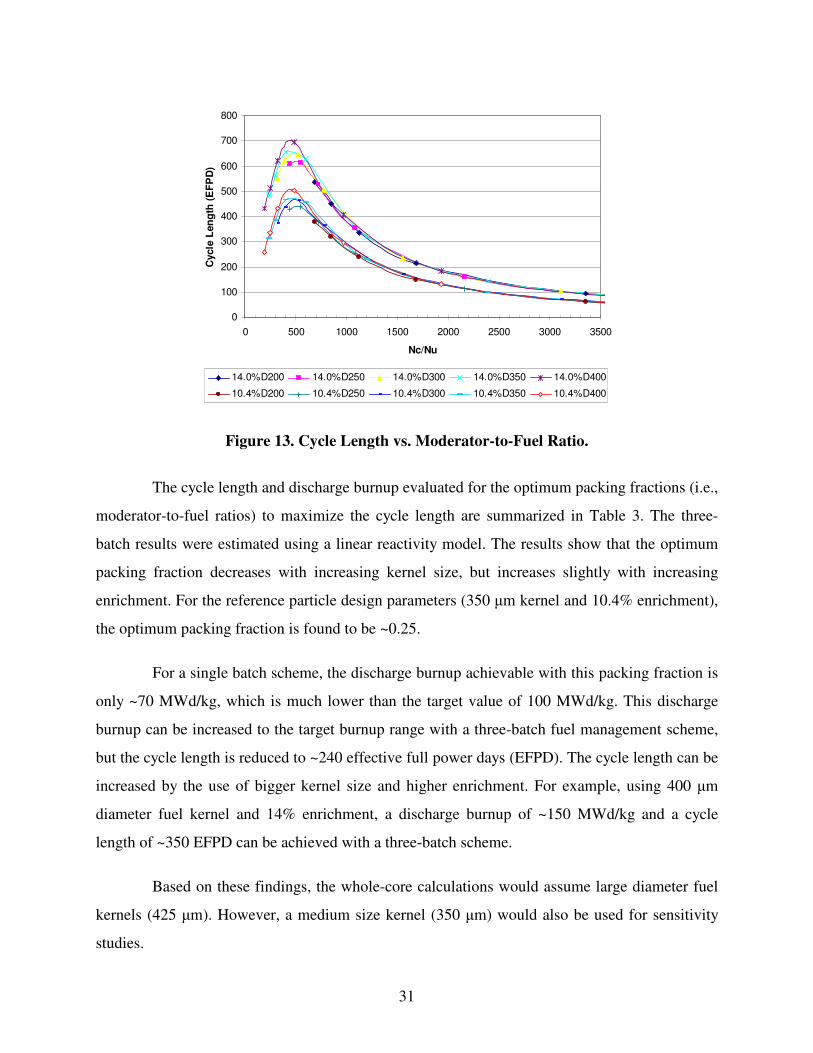
Figure 13. Cycle Length vs. Moderator-to-Fuel Ratio ........................................31
Figure 14. DIF3D Core Model for NGNP Whole-Core Calculations ..................34
Figure 15. Fuel Element k∞ from WIMS8 and REBUS3 Depletion Calculations......................................................................................37
Figure 16. Fuel Element Burnup-Dependent Multiplication Factors with Lumped and Explicit Fission Products Models .................................38
Figure 17. Whole Core Burnup-Dependent Multiplication Factors with Lumped and Explicit Fission Product Models...................................39
Figure 18. Sensitivity Study on Number of Axial Burn Zones ............................40
Figure 19. Comparison of Equilibrium and Non-Equilibrium Results .................42
Figure 20. k-effective with 6- and 32-Group REBUS-3/DIF3D Calculations ......43
Figure 21. Simplified Core Model for Peaking Factor Estimation with MCNP4C...................................................................................45
Figure 22. Pin Power Distribution in Fuel Element Adjacent to Inner Reflector ...........................................................................................46
Figure 23. Core Total Power Peaking Factor as Function of Burnup (Single-Batch Core: 350 µm Kernel-Diameter Case) ......................48

6
List of Figures
Page Figure 24. Core Axial Power Distributions at Beginning and End of Cycle
(Single-Batch Core: 350 µm Kernel-Diameter Case) .......................49
Figure 25. Core Radial Power Distributions for Single-Batch Core with 350 µm Kernel-Diameter Fuel ..........................................................49
Figure 26. Core Axial Power Distributions at Beginning and End of Cycle (Single-Batch Core: 425 µm Kernel-Diameter Case) .......................50
Figure 27. Core Radial Power Distributions for Single-Batch Core with 425 µm Kernel-Diameter Fuel ..........................................................50
Figure 28. Two-Batch Fuel Management Scheme for NGNP Core...................52
Figure 29. BOC Axial Power Distributions at Leading Peak Power Locations for the Two-Batch Core with 425 µm Kernel-Diameter Fuel ............54
Figure 30. EOC Axial Power Distributions at Leading Peak Power Locations for the Two-Batch Core with 425 µm Kernel-Diameter Fuel ............54
Figure 31. Radial Power Distribution for Two-Batch Core with 425 µm Kernel-Diameter Fuel ..........................................................55
Figure 32. Radial Power Distribution for Modified Two-Batch Core with 425 µm Kernel-Diameter Fuel .........................................................55
Figure 33. Alternating Fuel Pattern Scheme for Two-Batch Core .....................57
Figure 34. BOC Axial Power Distributions for Two-Batch Alternating Fuel Pattern and Regular Shuffling Scheme with 425 µm Kernel-Diameter Fuel ..........................................................58
Figure 35. EOC Axial Power Distributions for Two-Batch Alternating Fuel Pattern and Regular Shuffling Scheme with 425 µm Kernel-Diameter Fuel ..........................................................58
Figure 36. BOC Axial Power Distributions at Leading Column Power Locations for Alternating Fuel Pattern Two-Batch Core with 425 µm Diameter Fuel......................................................................59
Figure 37. EOC Axial Power Distributions at Leading Column Power Locations for Alternating Fuel Pattern Two-Batch Core with 425 µm Diameter Fuel......................................................................59
Figure 38. Radial Power Distributions for Alternating Fuel Pattern Two-Batch Core with 425 µm Kernel-Diameter Fuel. .......................60

7
List of Figures
Page Figure 39. Three-Batch Fuel Management Scheme for NGNP Core ................62
Figure 40. Radial Power Distribution for Three-Batch Core with 425 µm Diameter Fuel......................................................................64
Figure 41. BOC Axial Power Distribution at Leading Peak Power Locations for Three-Batch Core with 425 µm Diameter Fuel ...........65
Figure 42. EOC Axial Power Distribution at Leading Peak Power Locations for Three-Batch Core with 425 µm Diameter Fuel ...........65
Figure 43. Core k-effective and Total Peaking Factor during Transitional Cycles for Two-Batch Fuel Management Scheme with 425 µm Kernel-Diameter Fuel ..........................................................67
Figure 44. Core k-effective and Total Peaking Factor during Transitional Cycles for Three-Batch Fuel Management Scheme with 425 µm Kernel-Diameter Fuel ..........................................................67
Figure 45. Average Discharge Burnup during Transitional Cycles for Two-Batch Fuel Management Scheme with 425 µm Kernel-Diameter Fuel ..........................................................68
Figure 46. Average Discharge Burnup during Transitional Cycles for Three-Batch Fuel Management Scheme with 425 µm Kernel-Diameter Fuel ..........................................................68
Figure 47. BOC Axial Power Distributions during Transitional Cycles for Two-Batch Fuel Management Scheme with 425 µm Kernel-Diameter Fuel ..........................................................69
Figure 48. BOC Axial Power Distributions during Transitional Cycles for Three-Batch Fuel Management Scheme with 425 µm Kernel-Diameter Fuel ..........................................................69

8

9
ABSTRACT
Whole-core deterministic depletion models have been developed and utilized for analyzing the NGNP core. This activity was conducted to support the Advanced Gas-Cooled Reactor (AGR) fuel qualification program. This report complements an earlier one in which lattice and stochastic code models for the NGNP were developed and assessed.
The fuel cycle optimization study performed in this work is for an NGNP with a VHTR prismatic core design that employs a once-through fuel cycle. A single fuel particle (fissile) is assumed, though enrichment zoning can be employed for optimizing the core power distribution. The current work assumes the targeted core operational cycle length is 18 to 24 months to be consistent with current practices in U.S. utilities and an average fuel discharge burnup of 100 to 150 GWd/t.
The WIMS8 lattice code is used for preliminary analysis of the NGNP core with respect to meeting performance goals for the cycle length and discharge burnup under the constraints on fuel specification parameters such as the fuel diameter, fuel enrichment, and fuel packing fraction in the graphite compact. The preliminary evaluation facilitated limiting the search space for the more computationally expensive whole-core depletion calculations, by providing a narrow range for the pertinent design parameters to be evaluated.
The whole-core depletion studies evaluated various fuel management schemes (single-, two-, and three-batch schemes) for the equilibrium and transitional cycles. The study evaluated the impact of radial and axial fuel shuffling on the core power peaking and reactivity swing, which directly affect reactor safety requirements. The neutron fluence loads on the fuel particle designs that meet reactor core performance requirements (e.g., the cycle length and discharge burnup) were also evaluated.
The current study indicated that within the limits on the fuel packing fraction (less than 30%) and the fuel enrichment (less than 15%), only the two-batch fuel management scheme can meet simultaneously the targeted cycle length and discharged burnup goals. The single-batch scheme could only satisfy the cycle length goal (about 18 month) when a fuel kernel diameter of 425 �m is employed. By increasing the number of fuel batches, it is possible to increase the average discharge burnup to 100 GWd/t with a two-batch scheme and 115 GWd/t with a three-batch scheme. The reactivity swing can be reduced by a factor of 2.4 if the three-batch fuel management scheme is used relative to the single-batch scheme. The application of more fuel batches and fuel shuffling would also help to reduce the power peaking factor. However, the cycle length is reduced to less than 15 months for the three-batch scheme. The fast fluence limit of 4 x 10²¹ n/cm2 (E > 0.18 MeV) is also exceeded slightly by the three-batch scheme, while it is satisfied by the single- and two-batch schemes. The study also found that utilizing axial element shuffling is possible but would provide only limited benefit to the reduction of the power peaking factor. (The axial power peaking for the fuel columns actually increased in this case.)

10

11
1.0 Introduction
An Advanced Gas-Cooled Reactor (AGR) program focused on fuel development and
qualification is currently ongoing to support the USDOE goal of developing and demonstrating a
Next Generation Nuclear Plant (NGNP) that is based on the Generation IV Very High
Temperature Reactor (VHTR) concept. The objectives of the AGR fuel program are to (1)
provide baseline fuel qualification dataset in support of the licensing and operation of the VHTR,
(2) support near-term deployment of an AGR for commercial energy production in the United
States by reducing market entry risks posed by technical uncertainties associated with fuel
production, and (3) utilize international collaborations to leverage the USDOE resources. [1] The
coated-particle fuels that can be used in the prismatic- and pebble-bed-type modular reactors are
being investigated under this program. While there is a broad body of U.S. and international fuels
data applicable to the VHTR designs, they are not sufficient to address specific prismatic-core
manufacturing parameters and the higher fuel performance requirements (i.e., higher burnup,
operating temperature and temperature gradients, and fast neutron exposure). Consequently, there
has been a focus on manufacturing and testing the fuel design used in the prismatic core concepts,
using more recent fuel specifications.
Reactor physics tasks have been defined to support the AGR fuel qualification program.
These tasks include independent confirmation and support for efforts to specify such key fuel
design parameters as fissile enrichment, fuel particle size, and fuel packing fraction in the fuel
compacts. An important objective is to provide timely assurance that these parameters are
appropriately specified in the AGR program fuel performance tests to be conducted in the
Advanced Test Reactor (ATR) at INEEL and that they satisfy key NGNP performance and safety
objectives. The physics effort would also provide estimates of the maximum power and fluence
loads expected on the fuel particle designs that meet reactor core performance requirements (e.g.,
the cycle length.)
In response to the physics requirements, NGNP core models have been developed using
deterministic tools for lattice and whole-core calculations. This effort complements similar
activities ongoing at INEEL in which stochastic Monte Carlo codes are being employed. The
ANL effort was divided into two parts. In the first, an investigation of the deterministic code

12
capabilities was performed primarily by comparing the code predictions to those obtained with
the Monte Carlo MCNP code. A preliminary assessment of the various reactor physics items that
are needed to model adequately the prismatic modular reactor designs was also done. The
findings of this study were reported in Reference 2. In the second study, which is embodied in the
current work, a whole-core calculation path has been developed for the physics analysis of the
VHTR prismatic core. With the model it is possible to provide preliminary estimates of the cycle
length, discharge burnup, fluence, and power distributions that are attainable with the current fuel
specifications.
The fuel cycle optimization study performed in this study assumes that the NGNP utilizes
a VHTR prismatic core design that employs a once-through fuel cycle. A single fuel particle
(fissile) will be used, as opposed to the application of fissile and fertile fuel particles as in some
previous prismatic gas-cooled core designs. Enrichment zoning can be employed for optimizing
the core power distribution. The current work assumes that the targeted core operational cycle
length is 18 to 24 months to be consistent with current practices in U.S. utilities and an average
fuel discharge burnup of 100 to 150 GWd/t.
Design constraints have been imposed on the fuel packing fraction in the compact, the
fuel kernel diameter, and the fuel enrichment. It has been indicated by fuels expert that the fuel
packing fraction should be below 40%. A limit of 30% has been used for this work. In the current
study, the fuel enrichment required to meet the targeted cycle length and burnup will be
determined. However there is a limit of 20% imposed by the AGR program for non-proliferation
reasons and for the planned fuel test specifications. Previous studies indicated a value in the 12-
15% range will probably be sufficient, and hence a limit of 15% is considered in this work.
Regarding the fuel kernel size, a diameter in the 350 to 450 �m range has been recommended by
the fuel experts. For the purpose of sensitivity studies, the thicknesses of the buffer, inner and
outer pyrolytic carbon, and SiC layers can be assumed constant from the reference values that
have been specified in the fuels specifications. In addition to these constraints, it is desirable to
minimize the core reactivity control requirements and to have core designs with reactivity
coefficients that ensure reactor safety.

13
The expected output data from this study include power peaking factors, fluence, and fuel
burnup levels consistent with the cycle length. It is currently proposed that the peak fuel
temperature be less than 1250oC at operating conditions. Somewhat lower peak fuel temperatures
are however desirable, if possible. The peak fast fluence should be less than 4 x 10²¹ n/cm2
(> 0.18 MeV).
In Section 2.0, the characteristics of the VHTR core and fuel element are briefly
described. Because the current effort is not a design activity, the NGNP point design [3] based on
a GT-MHR core design previously developed by General Atomics [4] has been assumed; features
unique to the VHTR prismatic core are used to augment the core description (an example is the
absence of fertile fuel in the NGNP).
The lattice and core physics tools employed in this study are discussed in Section 3.0,
along with a description of the calculational path involving the codes. To gain preliminary
understanding of the VHTR prismatic core behavior during reactor fuel operation (burnup),
sensitivity studies have been performed using the two-dimensional lattice codes for core scoping
study. Results of this core scoping study are presented in Section 4.0. This study provides the
analyst a reduction of the problem search space that would have been required for the whole-core
calculations.
The whole-core models and results of parametric studies are summarized in Section 5.0.
The impact of different fuel management schemes on core performance is discussed in that
section. Single-batch, two-batch, and three-batch fuel management schemes were investigated,
and the impacts of fuel shuffling, both radially and axially, were also investigated.
In Section 6.0, the conclusions from this work and potential future activities are
discussed.

14
2.0 Description of NGNP Core and Fuel Elements
The current study is not directed towards the design of the NGNP core. It is focused on
providing confirmatory data that the fuel to be tested under the advanced gas cooled reactor fuels
program would be adequate for meeting the system design targets on cycle length, burnup, and
safety. Consequently, the core design parameters for the study have been obtained from existing
NGNP point design [3] based on the General Atomics design for the GT-MHR. [4] It is
recognized that final design and specifications for the NGNP would be quite different from that
for the GT-MHR.
Based on the GT-MHR design, the current NGNP reactor core consists of hexagonal
graphite fuel and reflector elements, and reactivity control material. The core is designed for a
power level of 600 MWt and a power density of 6.6 W/cm3. [4] The core radial arrangement
extracted from Ref. 4 is shown in Figure 1. An annular core design is assumed for the NGNP.
This annular design is dictated by the requirement of passive core heat removal that ensures the
fuel temperature is less than 1,600oC during a conduction cooldown event. The core is composed
of fuel or graphite reflector columns. The active core has 102 fuel columns that are located in
rings 6, 7, and 8. Ten graphite fuel elements (blocks) comprise a fuel column. (The height of the
active core is 7.93 m and the effective inner and outer diameters are 2.96 m and 4.83 m,
respectively.) Each fuel element contains holes for fuel and burnable compacts, and full-length
channels for helium coolant flow. The inner five rings of the core contain removable graphite
columns. Removable columns are also located in rings 9 and 10. Beyond the outer removable
columns are the permanent side reflectors.
Thirty-six of the outer reflector columns and twelve core columns have channels for
control rods. The twelve in-core columns are reserved for start-up and shutdown functions. The
thirty-six control rods located in the outer reflector are used for operational power control and
trip of the reactor. Additionally to these rods there are also 18 columns in the active core
containing channels for reserve shutdown material.
In the GT-MHR design in Ref. 4, the core reactivity is controlled by a combination of
lumped burnable poison, movable poison and a negative temperature coefficient. In the event that

15
the movable control rods are inoperable, an independent reserve shutdown control is utilized.
This control mechanism employs borated pellets that are released into the reserve shutdown
channel in the active core.
The axial dimension of the fuel and graphite elements is 79.3 cm. The principal fuel
element structural material is H-451 graphite (density is 1.74 g/cm3) in the form of a right
hexagonal prism, with a flat-to-flat width of 36 cm. There are differences between the three types
of elements containing fuel in the active core (i.e., the standard fuel elements, reserve shutdown
elements, and control elements). The standard fuel element contains a regular pattern of fuel and
coolant channels (there is a central position for the fuel-element handling hole). There are about
two fuel holes per each coolant hole in the standard fuel element. The control and reserve
shutdown elements differ from the standard fuel elements because they contain larger diameter
channels of different sizes (9.53 cm and 10.16 cm diameter) that replace 24 fuel and 11 coolant
holes. These holes are for the control rods/material. Fuel element geometrical details can be
found in Ref. 4.
The NGNP fuel is contained in fuel compacts that are loaded into the fuel holes. Each
compact has a diameter of 1.245cm and a height of 4.93 cm. Coated fuel particles (TRISO) are
dispersed in the compact graphite medium. In the GT-MHR design, a mixture of fissile and
fertile fuel kernels are utilized. In the current conceptualization of the NGNP, only fissile fuel is
being considered for non-proliferation reasons. The fuel form is uranium oxy-carbide (UC0.5O1.5),
in order to minimize kernel migration of UO2. Table 1 contains data for the fuel compact. The
fuel element has 216 fuel compacts (including six lumped burnable poison rods) and 108 coolant
holes (see Figure 2). In the current study, the lumped burnable poison rods have not been
modeled. The pitch of the coolant hole or fuel compact is 1.8796 cm and the radii of the fuel
compact and fuel holes are 0.6223 and 0.635 cm, respectively. There are 102 large coolant holes
with 0.794 cm radius and 6 small coolant holes with 0.635 cm radius.

16
Table 1. NGNP Fuel Element Data.
Radius, cm Material Density, g/cc
Fuel Particle - Fuel kernel - Buffer - Inner Pyro-Carbon - SiC - Outer Pyro-Carbon
0.0175 0.0275 0.0310 0.0345 0.0385
UC0.5O1.5
Graphite Graphite SiC Graphite
10.50
1.00 1.90 3.20 1.87
Fuel compact 0.6225 Graphite 1.1995
Coolant a) 0.6350 He 0.0032
Graphite Element b) Graphite 1.74
a) Helium gas was replaced with a void in this study. b) Graphite element side-to-side width is 35.997 cm, and fuel and
coolant hole pitch is 1.8796 cm.

17
Figure 1. NGNP Core Radial Arrangement.
Figure 2. Standard Fuel Assembly of NGNP.
Coolant hole Fuel compact
Fuel pin cell

18
3.0 Description of Analysis Codes
The NGNP prismatic design has several levels of heterogeneity effects that require proper
treatment in order to obtain accurate physics predictions for the core. The fuel elements are
hexagonal prismatic blocks of graphite containing parallel vertical holes, arranged in a triangular
pitch, into which fuel or burnable poison (BP) compacts are loaded or which are vacant and serve
as coolant flow paths. Other holes are also employed as pathways for control rods and fuel
loading devices. The fuel compacts comprise of multi-layer ceramic-coated particles dispersed in
a graphite matrix. Significant neutronic heterogeneities are created by these small particles. Fuel
element heterogeneity arising from the heterogeneous arrangement of fuel, BP and coolant
channels in the element, also exists in this design. Core level heterogeneity is also present
because of the annular core layout that employs inner and outer reflector zones and the fueled
core zone.
Deterministic analysis codes have been utilized in the current studies. The traditional
whole-core analysis path using both two-dimensional lattice capability and three-dimensional
whole-core nodal tools has been developed for analyzing the NGNP. For the lattice calculations
in this study, the WIMS8 and DRAGON codes [5,6] have been used for modeling the fuel
element. Depletion calculations are performed with the REBUS-3/DIF3D whole-core analysis
code. [7,8,9] Brief descriptions of the codes are provided in following sub-sections.
3. 1 WIMS8 and DRAGON Lattice Codes
The bulk of the lattice calculations for this study were performed with the WIMS8 code.
The DRAGON code was however utilized to provide an independent check of the depletion
results obtained with WIMS8, as the two codes provide models for the treatment of particulate
fuel in a matrix. For completeness, therefore, the two codes are briefly discussed in this Section.
A more detailed discussion of the lattice code models used for the NGNP can be found in Ref 2.
The WIMS8 code provides an extensive software package for neutronics calculations.[5]
The code employs an open structure that permits the linking of various models to create a
calculational scheme for a given thermal reactor design. These could range from simple
homogeneous cells to complex whole-core calculations. Most generally, however, the lattice

19
capabilities of the code are used for reactor analysis. Geometries are available for analyzing
PWR, BWR, VVER, AGR, RBMK, CANDU, other reactor core designs, storage pools, and
experiments. Methods for the neutron flux solution in WIMS8 include collision probability (1-D
or 2-D), method of characteristics, Sn method (1-D or 2-D), diffusion theory, and hybrid
methods. The code also provides an integrated Monte Carlo method (MONK) for the purpose of
internal validation. WIMS8 is supplied with 69- and 172-group libraries based on the validated
JEF2.2 nuclear data. It is noted that the WIMS8 code has the PROCOL module that provides a
collision probability calculation capability for particulate fuel in an annular geometry that could
be used in flux solvers to model the double heterogeneity effect of that fuel form.
The DRAGON code has a collection of models for simulating the neutronic behavior of
a unit cell or a fuel lattice in a nuclear reactor. [6] The typical functionalities found in most
modern lattice codes are contained in DRAGON. These include interpolation of microscopic
cross sections supplied by means of standard libraries; resonance self-shielding calculations in
multidimensional geometries; multigroup and multidimensional neutron flux calculations which
can take into account neutron leakage; transport-transport or transport-diffusion equivalence
calculations; and modules for editing condensed and homogenized nuclear properties for reactor
calculations. The code also performs isotopic depletion calculations. The code user must
however supply cross sections in one of the following standard formats: DRAGON, MATXS
(TRANSX-CTR), WIMSD4, WIMS-AECL, and APOLLO. Macroscopic cross sections can also
be read by DRAGON via the input data stream. At ANL, the 69- and 172-group cross section
libraries created in WIMSD4-format by the Reduced Enrichment for Research and Test Reactors
(RERTR) project are used with the DRAGON code.
An assessment of the accuracy of the WIMS8 and DRAGON codes when used for
analyzing the NGNP fuel element has been done by comparing results from the codes to those
from the high fidelity MCNP4C code. [11] Results show that eigenvalues, power distributions,
neutron spectra, and magnitude of the double heterogeneity effect predicted with the
deterministic codes generally agree well with the reference values obtained from MCNP4C
calculations with stochastic (random) particle distribution models.

20
The accuracy of the WIMS8 depletion calculation has been evaluated by comparing the
code results to those from the DRAGON code for an NGNP fuel element problem. The fuel
element used in the problem contains fuel with kernels diameter of 350 µm and has a specific
power density of 128.2 W/g-initial-heavy-metal.
The element eigenvalue and heavy-metal number densities as function of burnup
calculated by the WIMS8 and DRAGON codes have been compared. As observed for the static
calculations summarized in Ref. 2, the initial eigenvalue predicted by DRAGON is higher than
the WIMS8 value by 602 pcm (the MCNP4C result is always between the results of the two
codes). At high burnup, however, the DRAGON eigenvalue is lower than the corresponding
WIMS8 value (e.g., by 749 pcm at 500 EFPD).
These discrepancies are mainly caused by the different flux levels for the same power
density and the different isotopic depletion chains used in the codes. For the flux calculation, the
DRAGON code accounts for the fission energy yield only (due to the WIMS-ANL library used),
while the WIMS8 code accounts for both the fission and capture energy yields. As a result, the
energy yield is underestimated by about 2-3% in DRAGON calculations, which give a higher
flux level for the same power density.
For more consistent comparison, the depletion calculations were repeated with a
constant flux level, and the resulting eigenvalue letdown curves are plotted in Figure 3. It can be
seen that the DRAGON eigenvalue is consistently higher than the WIMS8 eigenvalue for the
whole depletion period. Very similar eigenvalue letdown trends are however predicted by the two
codes. This comparison provides an independent check of the WIMS8 depletion chains.

21
3.2 REBUS-3/DIF3D Fuel Cycle Analysis Code System
A burnup module is required for depletion calculations that track the time evolution of
the fuel nuclides. The transmutation equations for the heavy metals and the pertinent fission
products are usually solved by the depletion module for discrete spatial zones (burn zones). In
addition to the nuclide reaction rates obtained from the flux solver, the depletion module requires
decay constants for the nuclides and fission yields of the fission products. The energy released
per fission and capture are parameters that are also required for the depletion calculations. These
parameters are generally obtained from the lattice code or from base cross section data sources
like ENDF/B or JEF data libraries.
REBUS-3 Depletion and Fuel Cycle Analysis Code
The Argonne REBUS-3 code [7] was developed for fast reactor depletion and fuel cycle
analysis and hence does not have thermal feedback capability. However, it provides attractive
features for thermal reactor calculations. The code contains a robust algorithm that permits the
user to specify the burnup nuclides and the transmutation chains for the nuclides. There is no
Figure 3. Eigenvalue Letdown Curve with Constant Flux Level.
1.10
1.20
1.30
1.40
1.50
1.60
0 100 200 300 400 500
Burnup, EFPD
Eig
enva
lue
DRAGONWIMS-S

22
limit on the number of nuclides that can be represented. Ten reaction types are permitted by the
code. These are (n,γ), (n,f), (n,p), (n,α), (n,2n), (n,d), (n,t), �- decay, �+ decay, and alpha decay.
The solution of the transmutation and decay equations are obtained using the block depletion
approach that permits the user flexible definition of planar and axial depletion zones. The code
also allows the specification of burnup-dependent microscopic cross sections that are fitted with
respect to a base isotope. This permits the accurate treatment of the nuclide self-shielding and
neutron spectrum effects with burnup. The REBUS-3 code allows the user to select from a menu
of different flux solvers. These include the DIF3D finite-difference and nodal diffusion theory
solvers, and the VARIANT nodal transport solver. Additionally, the code can use the
TWODANT module for calculating the neutron flux and power distribution.
The REBUS-3 code contains unique features not generally found in three-dimensional
burnup codes. These include the ability to perform equilibrium cycle calculation in addition to
the common non-equilibrium calculation. An external cycle capability is also provided by the
code for modeling mass flows at the post-irradiation cooling, reprocessing, and fabrication stages
of the fuel cycle. For these cases, radioactive decay can be additionally modeled for specified
time delays between various processes.
For the equilibrium (infinite repetition of periodic fuel management) type problems, the
code uses specified external fuel supplies to load the reactor that is assumed operating under a
fixed fuel management scheme. Optionally, reprocessing may be included in the specification of
the external fuel cycle and discharged fuel may be recycled back into the reactor. For non-
equilibrium (or explicit cycle-by-cycle) cases, the initial composition of the reactor core may be
explicitly specified or the core may be loaded from external feeds, and discharged fuel may be
recycled back into the reactor as in equilibrium problems. This second option permits modeling
reactor operation under a specified periodic or non-periodic fuel management program. Four
types of search procedures may be carried out in order to satisfy user-supplied constraints during
fuel cyce calculations: 1) adjustment of the reactor burn cycle time to achieve a specified
discharge burnup, 2) adjustment of the fresh fuel enrichment to achieve a specified multiplication
constant at a specified point during the burn cycle, 3) adjustment of the control poison density to
maintain a specified value of the multiplication constant throughout the reactor burn cycle, and 4)

23
adjustment of the reactor burn cycle time to achieve a specified value of the eigenvalue at the end
of the burn step.
DIF3D Eigenvalue and Flux Solver
The REBUS-3 code uses DIF3D or TWODANT as the flux and eigenvalue solver. The
DIF3D module [8,9,10] contains solution options for multigroup steady-state neutron diffusion
and transport theory calculations. Cross section data provided in standard format (arbitrary group
structure) are used in these calculations. Both nodal and finite-difference spatial discretization
approaches are available in the code. The nodal options solves both the diffusion and transport
equations in two- and three-dimensional hexagonal and cartesian geometries. One-, two- and
three-dimensional orthogonal (rectangular and cylindrical) and triangular geometry diffusion
theory problems are solved by the DIF3D finite difference option. Eigenvalue, adjoint, fixed
source and criticality search problems are permitted. Upscattering and internal black boundary
conditions are also treated by the code. Solution for anisotropic scattering is available in the
nodal transport solver VARIANT which uses the variational nodal transport method. The robust
code editor allows flexible definition of edit regions and energy ranges. Flux and power density
maps by mesh cell and regionwise balance integrals can be requested by the user.
3.3 WIMS/DIF3D/REBUS-3 Calculation Procedure
Whole-core physics calculations using deterministic codes are usually performed in three
major steps. These are: (1) Calculation of cell or assembly (element) broad-group neutron cross
sections using a lattice code; (2) Retrieving broad group cross sections and transferring cross
sections to a whole-core analysis code; (3) Application of the cross-sections in multidimensional
static and depletion calculations using a whole-core analysis code. The latter tool is also
sometimes used for spatial kinetics calculations.
Depletion calculations for thermal reactors require that burnup dependent cross sections
be available for the time points within the fuel irradiation interval. In order to provide this
representation for the REBUS-3 depletion code, cross-section data for the different time points
are required in the ISOTXS file format. However, since REBUS-3 accepts only one ISOTXS file

24
during each calculation, the multiple ISOTXS files have to be merged. Consequently, the
calculation path must include stages for generating the ISOTXS files and for merging the files.
Figure 4 shows such a path.
Following the WIMS8 transport calculation, cross section data are stored in interface
files. An auxiliary code, named WIMS_TXS, is used for writing the cross section data into
ISOTXS file format. In this procedure, the ISOTXS files are generated separately for each
burnup step. Hence, the number of ISOTXS files is identical to the number of burnup steps in the
WIMS8 calculation. As a result, a merging procedure is necessary. The SDX code module is
used for this purpose. Finally, in order to assign unique identifiers to the nuclides in each burnup
step, another auxiliary code, called MDISO, is utilized.
Additionally to cross section data, the transmutation and decay chain data are also of
importance in REBUS-3 calculations. These data are described in cards 9 and 25 of the
REBUS-3 input file A.BURN. In order to obtain a result consistent with the WIMS8 code, the
REBUS-3 code should use the same decay chain and fission-product yield data as WIMS8. These
data have been obtained from the WIMS8 code authors [12] and utilized in the current study.
Figure 4. ISOTXS File Generation Procedure.

25
4.0 NGNP Depletion Sensitivity Studies with WIMS8 Lattice Code
The goal of the current work is to develop whole-core depletion models and to use them
to evaluate the feasibility of achieving the targeted performance goals of the NGNP core for a
given fuel design. In order to narrow the scope of the design space that would have to be
evaluated by the more computationally intensive whole-core calculations, preliminary parametric
studies have been done using the WIMS8 code. The main objective of these studies is to
optimize the fuel element design such that the discharge burnup and cycle length are maximized.
The targeted discharge burnup is >100 GWd/t and targeted cycle length is 18 to 24 months. The
effects of fuel kernel size, particle packing fraction, and uranium enrichment were investigated,
while using the NGNP reference values for the other design parameters such as the fuel compact
size and particle coating thicknesses. Table 2 is a summary of the NGNP reference values (in this
study) and investigated ranges of these fuel parameters.
Table 2. NGNP Reference Values and Investigated Ranges of Fuel Particle Parameters.
Design Parameter Reference Value Investigated Range
Uranium enrichment, w/o U-235 10.36 8 to 14
Fuel kernel size, µm 350 200 to 500
Packing fraction 0.280 0.1 to 0.5
4.1 Trend of Multiplication Factor with Fuel Parameters
The k∞ letdown curve as function of kernel size and packing fraction has been generated
in order to investigate the impact of these fuel parameters on the cycle length. Figures 5 and 6
show the trends for cases using fuel kernel diameters of 200 �m and 300 �m. Two distinct trends
are evident regarding the critical burnup point (where k∞ is 1.0) predicted by WIMS8. For a low
moderator-to-fuel number density ratio (NC/NU), e.g., the 300 �m case and with high packing
fraction (greater than 0.20), the burnup (cycle length) decreases with packing fraction.
Conversely for high NC/NU (e.g., the 200 �m case and with low packing fraction), the cycle
length increases with packing fraction. To provide fundamental understanding of reactivity trends
resulting from variation in lattice design, the traditional four factors of the fuel element k∞ at the
initial state (beginning of life) have been evaluated using WIMS8 results. Figures 7 to 10 show

26
the initial-state infinite multiplication factor (k∞) and the four factors for the NGNP fuel element
as a function of NC/NU for five different fuel kernel diameters (d). The four factors were
determined using a thermal cutoff energy of 4 eV. It can be seen that the effect of moderator-to-
fuel ratio is much larger than that of fuel kernel size. As the moderator-to-fuel ratio increases, the
fraction of epithermal neutrons absorbed in fuel material decreases, and the fraction of neutrons
reaching thermal energies increases. This can be seen clearly from the thermal-to-fast flux ratios
shown in Figure 11. As a result, the resonance escape probability (p) increases with NC/NU, while
the fast fission factor (ε) and the thermal utilization factor (f) decrease.
0.60
0.80
1.00
1.20
1.40
1.60
1.80
0 10 20 30 40 50 60 70 80 90 100
Burnup (GWD/t)
k-in
finity
PF=0.1
PF=0.2
PF=0.3
PF=0.4
PF=0.5
0.60
0.80
1.00
1.20
1.40
1.60
1.80
0 10 20 30 40 50 60 70 80 90 100
Burnup (GWD/t)
k-in
finity
PF=0.1
PF=0.2
PF=0.3
PF=0.4
PF=0.5
Figure 5. k∞∞∞∞ Letdown Curve for 200 �m Kernel. Figure 6. k∞∞∞∞ Letdown Curve for 300 �m Kernel.
1.20
1.25
1.30
1.35
1.40
1.45
1.50
1.55
1.60
1.65
1.70
0 500 1000 1500 2000 2500 3000 3500
Nc/Nu
k-in
finity
D=0.20mmD=0.25mmD=0.30mmD=0.35mmD=0.40mm
Figure 7. k∞∞∞∞ as Function of Moderator to Fuel Ratio.

27
Figure 8. Fission Yield per Absorption (Eta) and Fast Fission Factor for Initial State.
Eta
1.970
1.975
1.980
1.985
1.990
1.995
0 500 1000 1500 2000 2500 3000 3500 4000
NC/NU
eta
d=0.20mm
d=0.25mm
d=0.30mm
d=0.35mm
d=0.40mm
Fast Fission Factor
1.00
1.05
1.10
1.15
1.20
1.25
1.30
0 500 1000 1500 2000 2500 3000 3500 4000
NC/NU
fast
fis
sion
fac
tor
d=0.20mm
d=0.25mm
d=0.30mm
d=0.35mm
d=0.40mm
Thermal Absorption Fraction in U+Si
0.80
0.82
0.84
0.86
0.88
0.90
0.92
0.94
0.96
0.98
1.00
0 500 1000 1500 2000 2500 3000 3500 4000
NC/NU
ther
mal
abs
orpt
ion
fract
ion
in U
+Si
d=0.20mm
d=0.25mm
d=0.30mm
d=0.35mm
d=0.40mm
Thermal Utilization Factor
0.80
0.82
0.84
0.86
0.88
0.90
0.92
0.94
0.96
0.98
1.00
0 500 1000 1500 2000 2500 3000 3500 4000
NC/NU
ther
mal
util
izat
ion
fact
or
d=0.20mm
d=0.25mm
d=0.30mm
d=0.35mm
d=0.40mm
Figure 9. Thermal Utilization Factors for Initial State.
Resonance Escape Probability
0.45
0.50
0.55
0.60
0.65
0.70
0.75
0.80
0.85
0.90
0.95
0 500 1000 1500 2000 2500 3000 3500 4000
NC/NU
reso
nanc
e es
cape
pro
babi
lity
d=0.20mm
d=0.25mm
d=0.30mm
d=0.35mm
d=0.40mm
Figure 10. Resonance Escape Probability (p) and Double Heterogeneity Effects.
Double Heterogeneity Effects
500
1000
1500
2000
2500
3000
3500
4000
4500
0 500 1000 1500 2000 2500 3000 3500 4000
Nc/Nu
Dou
ble
hete
roge
neity
effe
ct, p
cm
D=0.20mm
D=0.25mm
D=0.30mm
D=0.35mm
D=0.40mm

28
The fission neutron yield per thermal neutron absorption in fuel (η) is relatively constant.
At low moderator-to-fuel ratios, the resonance escape probability changes more rapidly than the
other factors, and therefore an increase in the ratio increases k∞. As the ratio increases, however,
neutron thermalization tends to saturate and thermal neutron captures in the moderator offset the
reduction in epithermal neutron captures. As a result, k∞ initially increases with increasing
moderator-to-fuel ratio, attains a maximum value, and then decreases. The optimum moderator-
to-fuel number density ratio is approximately 1700 to 2100. This optimum ratio slightly
decreases with the kernel size.
To maximize the cycle length, it is desirable to design the fuel element around this
optimum ratio. However, a highly under-moderated design is required to meet the targeted cycle
length and discharge burnup with low enriched fuel as discussed below.
For a fixed moderator-to-fuel ratio, the thermal utilization factor increases with kernel
size. This is due to the reduced neutron absorption in Si resulting from the fixed coating layer
thicknesses assumed in this parametric study. (Silicon mass decreases with kernel size for fixed
Figure 11. Thermal-to-Fast Flux Ratio (Thermal Cutoff Energy = 4 eV).
0.0
0.5
1.0
1.5
2.0
2.5
3.0
3.5
4.0
4.5
5.0
0 500 1000 1500 2000 2500 3000 3500
NC/NU
Ther
mal
-to-F
ast F
lux
Rat
io
d=0.20mm
d=0.25mm
d=0.30mm
d=0.35mm
d=0.40mm

29
NC/NU and coating layer thicknesses.) In fact, it was observed that the fraction of thermal
neutrons absorbed in U and Si is almost independent of kernel size (see Figure 9). The resonance
escape probability also increases slightly with kernel size because of increased self-shielding
effect. The fission neutron yield per thermal neutron absorption and the fast fission factor were
found to be relatively independent of kernel size.
4.2 Estimation of Core Cycle Length and Discharge Burnup
The (single-batch) critical burnup and cycle length have been calculated for different fuel
kernel sizes and enrichments as a function of NC/NU, using the WIMS8 model for the NGNP fuel
element. To account approximately for core leakage effects, the critical burnup is assumed
reached when the assembly k∞ is 1.05 (i.e., assuming a 5% neutron leakage at the core boundary).
The critical burnup determined with this approach is presented in Figure 12 for different
fuel kernel sizes and enrichments as a function of the moderator-to-fuel ratio. The legend denotes
the uranium enrichment in weight percent and fuel kernel diameter in µm. As aforementioned, at
low fuel loadings (i.e., large moderator-to-fuel ratios), the initial-state k∞ increases with
increasing fuel loading due to increased thermal utilization factor. On the other hand, at high fuel
loadings, initial-state k∞ decreases with additional fuel loading due to reduced resonance escape
probability. As a result, the critical burnup increases initially with increasing fuel loading,
reaches a maximum value and then decreases. However, the moderator-to-fuel ratio for the
maximum critical burnup (700 to 900) is much smaller than that for the maximum initial-state
k∞ (1700 to 2100), since the fuel burns out more quickly at low fuel loadings.
For a fixed kernel size and packing fraction, the critical burnup increases with increasing
uranium enrichment as expected. It is also observed that for a fixed moderator-to-fuel ratio, the
critical burnup increases slightly with increasing kernel size.

30
Similar evaluation has been performed for the cycle length. The cycle length for a
single-batch fuel management scheme, which was determined as the ratio of critical burnup to
specific power, is shown in Figure 13 for different fuel kernel sizes and enrichments as a function
of the moderator-to-fuel ratio. The cycle length increases initially with increasing fuel loading,
reaches maximum value and then decreases. However, it shows a different behavior than the
critical burnup, since the critical burnup is proportional to the cycle length and inversely
proportional to the initial fuel loading. As a result, the moderator-to-fuel ratio for the maximum
cycle length (400 to 600) is smaller than that for the maximum critical burnup (700 to 900).
For a fixed moderator-to-fuel ratio, the cycle length increases with enrichment and
kernel size. Consequently, to increase the cycle length with a fixed amount of fissile loading, it is
desirable to use a larger kernel size. It was also found that the targeted cycle length of 18 to 24
months could be met with a single batch scheme using enrichment of 10 to 15% and packing
fraction of 0.2 to 0.3. Achieving the targeted cycle length requires a small number of fuel batches,
but a large number of batches are preferred for high discharge burnup and low reactivity control
requirement.
Figure 12. Critical Burnup vs. Moderator-to-Fuel Ratio.
0
20
40
60
80
100
120
140
0 500 1000 1500 2000 2500 3000 3500
Nc/Nu
Cri
tical
bur
nup
(GW
d/t)
14.0%D200 14.0%D250 14.0%D300 14.0%D350 14.0%D400
10.4%D200 10.4%D250 10.4%D300 10.4%D350 10.4%D400
31
The cycle length and discharge burnup evaluated for the optimum packing fractions (i.e.,
moderator-to-fuel ratios) to maximize the cycle length are summarized in Table 3. The three-
batch results were estimated using a linear reactivity model. The results show that the optimum
packing fraction decreases with increasing kernel size, but increases slightly with increasing
enrichment. For the reference particle design parameters (350 �m kernel and 10.4% enrichment),
the optimum packing fraction is found to be ~0.25.
For a single batch scheme, the discharge burnup achievable with this packing fraction is
only ~70 MWd/kg, which is much lower than the target value of 100 MWd/kg. This discharge
burnup can be increased to the target burnup range with a three-batch fuel management scheme,
but the cycle length is reduced to ~240 effective full power days (EFPD). The cycle length can be
increased by the use of bigger kernel size and higher enrichment. For example, using 400 �m
diameter fuel kernel and 14% enrichment, a discharge burnup of ~150 MWd/kg and a cycle
length of ~350 EFPD can be achieved with a three-batch scheme.
Based on these findings, the whole-core calculations would assume large diameter fuel
kernels (425 �m). However, a medium size kernel (350 �m) would also be used for sensitivity
studies.
Figure 13. Cycle Length vs. Moderator-to-Fuel Ratio.
0
100
200
300
400
500
600
700
800
0 500 1000 1500 2000 2500 3000 3500
Nc/Nu
Cyc
le L
engt
h (E
FPD
)
14.0%D200 14.0%D250 14.0%D300 14.0%D350 14.0%D400
10.4%D200 10.4%D250 10.4%D300 10.4%D350 10.4%D400

32
Table 3. Cycle Length and Discharge Burnup for Optimum Packing Ratio.
Single batch Three batch Enrichment (w/o U-235)
Kernel diameter
(µm)
Optimum packing
ratio Cycle length
(EPFD)
Discharge burnup
(GWd/t)
Cycle length (EPFD)
Discharge burnup
(GWd/t) 200 0.625 590 95 295 143 250 0.440 622 92 311 138 300 0.329 653 93 327 139 350 0.262 667 92 334 138
14
400 0.209 697 97 349 146 200 0.620 425 69 213 104 250 0.432 446 67 223 101 300 0.319 463 67 232 102 350 0.253 484 68 242 103
10.36
400 0.209 509 71 255 107

33
5.0 Whole-Core Model Evaluation and Studies
Whole-core analysis and optimization of the NGNP fuel cycle has been performed using
the REBUS-3/DIF3D/WIMS8 calculational path discussed in Section 3.0. The fuel management
optimization study of this work is minimized by using the information garnered from the lattice
studies of Section 4.0. Consequently, for the whole-core depletion studies, two kinds of fuel
elements have been considered: one employing a 350 µm diameter fuel (enrichment of 10% and
packing fraction of 0.289) and the other 425 µm fuel (enrichment of 14% and packing fraction of
0.25). The larger size fuel kernel is considered the base case. In Section 5.1, the
REBUS-3/DIF3D model used for the whole-core calculations are first discussed. Justifications
for some of the simplifying assumptions that were employed are provided in Section 5.2. Various
fuel management and fuel shuffling schemes have been evaluated. These include single-, two-,
and three-batch schemes with radial and axial fuel element shuffling. An evaluation of the
transitional cycle for the two-batch fuel management scheme has also been done. For each of the
fuel management schemes, an assessment of the sensitivity of core performance to the fuel
loading (kernel size and packing fraction) has been performed. The results for whole-core
depletion studies are presented in Sections 5.4 to 5.8.
5.1 REBUS-3/DIF3D Whole-Core Model for NGNP Core
The REBUS-3 calculational path chosen for this work uses as flux solver the DIF3D-
nodal capability that solves the multigroup neutron diffusion equations. In the DIF3D
calculations, six neutron energy groups have been employed predominantly. An assessment of
this approximation is presented in Section 5.2. The products of the DIF3D calculations are the
eigenvalue, neutron flux and power distributions, and reaction rate distributions. The reaction
rates are passed to the REBUS-3 depletion solver. Following the depletion calculation at a given
step, the latest number densities are used for composing updated cross sections that are then
passed to the DIF3D module.
The DIF3D code solves the multigroup diffusion equations over homogeneous
hexagonal-prismatic nodes (see Figure 14). An assembly pitch of 36 cm is assumed. In the
current study, each column is spatially represented using 32 axial nodes. The whole length of the

34
active core (about 793 cm) and the lower and upper graphite reflector zones are modeled (the
lower and upper reflectors have heights of 160.0 and 120.0 cm, respectively). Twenty of the 32
axial nodes are used for representing the active core. The remaining 12 axial nodes are used for
the lower and upper reflector zones. Eleven rings of columns are represented radially in the
DIF3D model. Ten of these rings correspond to the ten core rings containing the annular core and
the surrounding inner and outer replaceable reflectors. The eleventh ring is used for representing
Figure 14. DIF3D Core Model for NGNP Whole-Core Calculations.

35
the permanent reflector that surrounds the core. The sixth, seventh, and eighth rings contain
nodes representing the active core. The first to fifth and ninth and tenth rings contain the inner
and outer graphite reflectors. A no-return-current boundary condition is imposed on all external
surfaces.
The core boundary symmetry used for minimizing the DIF3D computational burden
depends on the problem being solved. Fuel shuffling in particular affects application of this
solution feature, as fuel shuffling will only be possible between fuel elements of the same kind
because the configurations of control, shutdown and standard fuel elements are different from
each other. Consequently, while a sixth-core symmetry model could be used to reduce the
computational time for a single-batch fuel management core and a third-core symmetry model for
a two-batch core, no such azimuthal symmetry is available for the three-batch scheme, and a full
core model is therefore used in this case.
Both the equilibrium cycle and non-equilibrium cycle options of the REBUS-3 code with
no recycle have been employed for the depletion calculations. The non-equilibrium cycle option
has been used for calculating the transitional cycles, while the equilibrium cycle option is used
for deriving the equilibrium-core performance data. The actinides represented in the REBUS-3
transmutation chain are U-233, U-234, U-235, U-236, U-237, U-38, Np-237, Np-239, Pu-238,
Pu-239, Pu-240, Pu-242, Pu-242, Am-241, Am-242m, Am-243, Cm-242, Cm-243, Cm-244, and
Cm-245. Two models for representing the fission products have been utilized. In the first, the
nearly 100 fission products that are used in the WIMS8 lattice calculations and for which broad
group cross sections are generated have been included explicitly in the REBUS-3 model. This
model is however time consuming because of the size of the transmutation (burn) matrix whose
exponential is to be computed. A sensitivity study summarized below indicated that a reduction
of the number of fission products to few nuclides (Xe-135, I-135, Sm-149, Pm-149 and parent-
dependent lumped fission products) does not significantly affect solution accuracy but reduces
the overall computational time substantially (about a factor of ten), because of the drastic
reduction in the time utilized for the fuel depletion calculation. The reduced fission products
chain is the basis of simplified lumped fission product (LFP) model that was used predominantly
in this work.

36
With the simplified LFP model, it was possible to perform routinely depletion
calculations with large number of burn zones. The burn zones correspond to the distinct regions
over which transmutation and decay equations are solved. Each burn zone typically includes a
group of axial nodes in the active core. Models with one, five, and 10 axial burn zones were
developed and utilized in this study. The number of radial burn zones depends on the particular
problem (fuel management scheme and shuffling option). In the case of fuel shuffling, the fuel
element would reside in at most n locations in the core (where n is the number of fuel batches).
To track the fuel burnup, each of these locations would be designated a distinct burn zone.
Therefore in a full core model (employing no radial symmetry), one could have 102 burn zones
in the radial direction. It is noted that the REBUS-3 computation time is strongly related to the
number of burn zones, particularly for large problems.
Burnup-dependent, broad-group, nuclide cross sections data have been generated for the
core and reflector regions using the WIMS8 code. Data for heavy-metals (U-233 to Cm-245),
light elements (oxygen, carbon (graphite), boron, silicon, helium, etc.), and fission products
(about 100) were generated by the code at the core average temperatures (fuel at 1350oK and
graphite block at 1200oK). An auxiliary program has been used to write these cross-section data
into a format usable by the REBUS-3/DIF3D fuel cycle (and depletion) code. The REBUS-3
code capability that permits the fitting of both capture and fission cross sections of the active
isotopes is employed in the calculations. This approach accounts for cross section variations due
to changes in the nuclide self-shielding and neutron spectrum as a function of the depletion.
5.2 Verification and Sensitivity Studies of REBUS-3/DIF3D Model
Evaluation of REBUS-3 Transmutation and Decay Chains
Fuel-element burnup calculations have been performed to confirm that the cross section
representation of the NGNP fuel element has been accurately implemented. This was done by
comparing the REBUS-3 calculation results for the fuel element to those obtained with WIMS8.
The fuel element data used in this study are taken from Section 2.0 along with fuel kernel
diameter of 350 µm and enrichment of 10.31 w/o U-235. Figure 15 displays the fuel element k∞
calculated by the two codes. AFP-32G and AFP-06G denote the 32-group and 6-group results,

37
respectively, of the REBUS3 calculations utilizing all the fission products (about 100) employed
in the WIMS8 calculations explicitly. The different WIMS8 cases denote results with different
structures for the group condensation of cross sections. Very similar results are obtained by the
two codes.
This exercise confirmed that the data generated by WIMS8 are correctly transferred to the
ISOTXS file. It also confirmed that the cross-section data have been appropriately interpolated by
REBUS-3 and that the transmutation and decay chain data are consistent. This REBUS-3
transmutation and decay model has been used for generating the data reported in following
sections.
Figure 15. Fuel Element k∞∞∞∞ from WIMS8 and REBUS-3 Depletion Calculations.
Evaluation of REBUS-3 Lumped Fission Products (LFP) Model
Preliminary sensitivity studies indicated that even with modern day computers the
computation time for whole-core depletion calculations employing about 100 fission products in
the transmutation (burn) chains could result in substantial computation time. In order to be able
to perform the planned calculations within reasonable time it was necessary to reduce the size of
the burn matrix used in the solution of the nuclide number densities. This was done by using a
0.90
1.00
1.10
1.20
1.30
1.40
1.50
0 100 200 300 400 500 600
Burnup (EFPD)
k-in
finity
WIMS-32GWIMS-06GAFP-32GAFP-06G

38
lumped fission products (LFP) representation of the detailed fission products. In this model, a
few of the fission products (Xe-135, I-135, Sm-149, Pm-149) were explicitly represented because
of their reactivity impacts, and the remaining fission products were lumped together into a few
parent-dependent lumped fission products. This process requires that representative LFP yields
and cross sections be generated in a systematic way. Figures 16 and 17 display the impact of the
LFP model on the REBUS-3 fuel element and whole-core results. The whole-core calculations
were performed with two different fuel kernel diameters (350 and 425 µm). The figures show
that the LFP and “all-fission products” (AFP) models give very similar trends for the
multiplication factor (k∞ or k-effective) but there are non-negligible differences at the end of
cycle. The sensitivity studies performed to date indicate that the difference in the k-effective
calculated by the LFP and AFP models is about 0.2 to 1.5%, with the LFP model giving the
higher value. In order to correct for this difference in the whole-core depletion calculations using
the LFP model, the end of cycle searches have been done for a k-effective value of 1.01.
Figure 16. Fuel Element Burnup-Dependent Multiplication Factors with Lumped and Explicit Fission Products Models.
0.90
1.00
1.10
1.20
1.30
1.40
1.50
0 100 200 300 400 500 600
Burnup (EFPD)
k-in
finity
WIMS-06GAFP-06GLFP-06G

39
Figure 17. Whole Core Burnup-Dependent Multiplication Factors with
Lumped and Explicit Fission Product Models.
Evaluation of Number of Axial Depletion (Burn) Zones
Computation time considerations dictate that an optimum number of burn zones be
defined and used in the whole-core calculations. Ideally, it is attractive to let each spatial
computation mesh have its own burnup zone. This however is impractical, particularly with a
large number of spatial meshes and in equilibrium cycle calculations. While it is possible in
principle to reduce the number of radial burn zones (i.e. collecting radial columns into the same
burn zone), this was not done in this study because of the need to track very accurately the impact
of fuel management scheme (fuel batches) on the power peak. As a result, we have attempted to
minimize the number of burn zones by finding the optimum number of axial burn zones. This
was done by evaluating the results obtained with 1, 5, and 10 burn zones in REBUS-3
calculations. An evaluation of the impact of the LFP and AFP models on the results was also
performed. For this study, a single-batch or two-batch fuel management scheme for a core using
425 µm diameter and 14 w/o-U235 enriched fuel with a packing fraction of 25% was used. The
results from this study are summarized in Figure 18.
These results indicate that regardless of the fission products model used, the eigenvalue
letdown is independent of the number of axial burn zones employed for the depletion
0.90
0.95
1.00
1.05
1.10
1.15
1.20
1.25
1.30
1.35
1.40
0 100 200 300 400 500 600 700 800
Burnup (EFPD)
k-ef
fect
ive
350-AFP350-LFP425-AFP425-LFP

40
calculations. However, the core total power peaking factor is strongly dependent on the number
of axial burnup zones. The result show consistently that for most cases the 5 and 10 axial burn-
zones give very similar results for the core power peaking factor, hence suggesting that either of
these models could be used for the whole-core calculations. These trends apply to both the 425
and 350 µm fuel cases. Most of the calculations performed in the present work used 10 axial
burn zones.
Figure 18. Sensitivity Study on Number of Axial Burn Zones. (Top figure: peak power; bottom figure: k-effective).
1.50
1.60
1.70
1.80
1.90
2.00
2.10
2.20
2.30
2.40
2.50
0 100 200 300 400 500 600
Burnup(EFPD)
Pea
k po
wer
10AZ-AFP5AZ-AFP1AZ-AFP10AZ-LFP
0.90
0.95
1.00
1.05
1.10
1.15
1.20
1.25
1.30
1.35
1.40
0 100 200 300 400 500 600 700 800
Burnup(EFPD)
k-ef
fect
ive
10AZ-AFP5AZ-AFP1AZ-AFP10AZ-LFP

41
Comparison of Equilibrium and Non-Equilibrium Models
The REBUS-3 code has an equilibrium cycle capability that provides an efficient search
for the equilibrium core state for a reactor operating under a fixed fuel management scheme. The
solution for the core state could also be found by performing repeated cycle-by-cycle analysis
using the non-equilibrium cycle capability of the code.
For completeness of this report, the results from the two models for the same depletion
case have been compared. This comparison was done for a core using a two-batch fuel-
management scheme with 350 µm diameter fuel (packing fraction of 28%, enrichment of 10%)
and 425 µm diameter fuel (packing fraction of 25%, enrichment of 14%). Ten axial burn zones
were used in the calculations.
The results for the two fuel diameter cases are summarized in Figure 19. The non-
equilibrium calculation followed the core evolution over six cycles, starting with a core of
uniform fresh fuel loading. At the beginning of a given cycle, one half of the fuel elements are
discharged and replaced with fresh fuel.
In Figure 19, the equilibrium cycle results for the total power peaking factor and the
k-effective have been repeated for the six cycles, primarily to show the convergence of the non-
equilibrium cycle model to the equilibrium cycle state. It can be seen that the non-equilibrium
cycle results converge to those of the equilibrium cycle results. However, relative to the
equilibrium cycle model, the non-equilibrium cycle model slightly overestimates the k-effective
and underestimates the peaking factor at BOC even after the 6th cycle, since the burned fuel
compositions are not fully converged to the equilibrium state.

42
Figure 19. Comparison of Equilibrium and Non-Equilibrium Results (top picture: 425 µm fuel; bottom picture: 350 µm fuel).
0.90
1.00
1.10
1.20
1.30
1.40
0 500 1000 1500 2000
Burnup (EFPD)
k-ef
f
1.00
1.20
1.40
1.60
1.80
2.00
2.20
Pea
k po
wer
k-eff K-eff, Eq peak power Peak Power, Eq
0.90
0.95
1.00
1.05
1.10
1.15
1.20
1.25
1.30
1.35
1.40
0 500 1000 1500 2000 2500 3000 3500
Burnup (EFPD)
k-ef
f
1.00
1.20
1.40
1.60
1.80
2.00
2.20
2.40
2.60
Pea
k po
wer
k-eff K-eff, Eq peak power Peak Power, Eq

43
Evaluation of Number of Groups
The number of energy groups used in depletion calculation affects both the computation
time and the solution accuracy. For the extensive depletion calculations done in this work, six
energy groups have been used; the group boundaries are 20 MeV, 0.820 MeV, 9.118 KeV,
4.0 eV, 0.625 eV, 0.1 eV, and 0.0 eV. The impact of the number of energy groups on the
k-effective letdown curve has been evaluated. The calculations were done for a core employing
single-batch fuel management scheme with 350 µm diameter fuel kernel. Cases utilizing 6-group
and 32-group ISOTXS libraries generated by WIMS8 have been compared and results are shown
in Figure 20. These results show that for the k-effective letdown, the 6- and 32-group structures
give quite similar results. Similar conclusions can be made for the peaking factor, though in this
case there is about a 5% difference in the power peaking value between the cases. The group
effect may be more pronounced for reactivity coefficients, but this has not been investigated in
this work. It is recommended that a higher number of groups (than 6) be used in the depletion
calculations if higher precision in the peaking factor is required. Computational requirements
necessitates that an optimum value be found.
Figure 20. k-effective with 6- and 32-Group REBUS-3/DIF3D Calculations.
0.9
1.0
1.1
1.2
1.3
1.4
0.0 100.0 200.0 300.0 400.0 500.0 600.0
Burnup (EFPD)
k-ef
f
1.00
1.20
1.40
1.60
1.80
2.00
2.20
2.40
Pea
k po
wer
keff-32Gkeff-06Gpeak-power-32Gpeak-power-06G

44
5.3 Radial Peaking Factor Calculation with MCNP4C
The nodal method used for the whole-core analysis employs spatial solution meshes
greater than the fuel compact (pin) dimension. Typically in the state-of-the-art analysis of
reactors, the intra-nodal power distributions recovered from such solutions are modulated with
those from local (assembly) pin power calculations to obtain accurate representation of the pin
power distribution. This is sometimes referred to as the de-homogenization step. The DIF3D-
nodal code currently does not have an integrated de-homogenization capability applicable to the
block-type VHTR design. The code however does a conservative estimation of the power
peaking factor and those are the ones presented so far in Section 5.2 and would be used as
indicators of the core power peaking for the balance of this report. The approach involves
sampling surface-averaged values of the power and choosing the maximum value. The nodal
power is approximately reconstructed in this case.[8,9] More elaborate and correct evaluation of
the power peaking factor can also be obtained using the VARIANT capability of the DIF3D code
or the RCT code [13] that reconstructs the pin power and burnup characteristics from nodal
solutions, but has not been tested in this work.
To get an accurate indication of the radial power peaking within the core, MCNP4C
calculations have been done for the representative problem shown in Figure 21. This case is for a
core with 14% enriched fuel and 425 µm kernel diameter. The same fuel loading and age is used
for the calculation. This case would be quite representative of the initial core state for the single-
batch fuel management scheme design. One million neutron histories were used for the
calculation. The resulting normalized element peaking factor is shown in Figure 22. Quite
significant power peaking is observed (1.84 at the corner point adjacent to the reflector). When
this is multiplied by the maximum axial peaking factor for a given column (typically about 1.29
at BOC), it is evident that large core total peaking factors (about 2.37) could result. The
conservatively estimated value from DIF3D-nodal is about 2.40 for this core (see Figure 19
above). Clearly, this is not for the actual fuel compact positions, but provides a fairly accurate
estimate of the core total peaking factor. However, more elaborate formulation has to be
developed in future work.

45
This large power peaking factor (2.4) could be mitigated by using (1) multiple batches;
(2) a graded fuel loading in the element, with fuel compacts of lower loading (fuel buffer) in the
outer rows adjacent to the inner graphite reflector; (3) using strategically placed burnable poison
pins is fuel elements; (4) using absorber pins in the inner reflector rows adjacent to the active
core; and etc. Options involving different fuel-element loadings would however complicate fuel
handling and shuffling functions at the plant.
Simplified core fuel element fuel cell
Figure 21. Simplified Core Model for Peaking Factor Estimation with MCNP4C.

46
Figure 22. Pin Power Distribution in Fuel Element Adjacent to Inner Reflector.
1.84
1.78
1.61
1.50
1.52
1.52
1.37
1.59
1.40
1.31
1.43
1.35
1.22
1.16
1.47
1.39
1.25
1.16
1.10
1.45
1.24
1.20
1.09
1.08
1.32
1.24
1.11
1.06
1.03
1.01
1.35
1.28
1.12
1.10
1.01
0.99
1.28
1.15
1.11
1.02
0.98
0.96
1.19
1.12
1.01
0.98
0.95
0.93
1.04
1.00
0.94
0.92
0.88
0.88
0.88
1.02
0.94
0.91
0.88
0.88
0.84
0.81
0.97
0.93
0.89
0.86
0.83
0.83
0.83
0.80
0.89
0.86
0.82
0.82
0.82
0.79
0.77
0.90
0.85
0.83
0.81
0.80
0.79
0.77
0.86
0.84
0.80
0.80
0.77
0.78
0.76
0.77
0.82
0.81
0.79
0.77
0.76
0.77
0.76
0.82
0.81
0.80
0.78
0.77
0.77
0.77
0.84
0.81
0.78
0.79
0.77
0.78
0.77
0.79
In contact with inner reflector

47
5.4 Fuel Management Option – Single-Batch Core
The results of depletion calculations for a core using a single-batch fuel management
scheme are summarized in this section. The two- and three-batch equilibrium cycle results are
presented in Sections 5.5 and 5.6, respectively. Section 5.7 presents the transitional cycle results
for two- and three-batch schemes. An integrated summary is provided in Section 5.8.
A single-batch core implies that the fuel elements in the core are loaded and discharged
at the same time. The end of core corresponds to the minimum reactivity states that ensure that
the core is still critical. Two sets of calculations using different fuel design parameters have been
performed for this core. In the first, 350 µm diameter and 10% enriched fuel with a packing
fraction of 28.9% is used, whereas in the second, 425 µm, 14% enriched fuel with a packing
fraction of 25% is used. For most of the discussions that follow, the fuel loadings are referred to
simply by the fuel kernel diameter.
Table 4 is a summary of the cycle length, discharge burnup, peak power (derived
conservatively by DIF3D-nodal) and the k-effective for the beginning and end of cycle (BOC and
EOC). The predicted cycle lengths and discharge burnup are quite consistent with those
contained in Table 3 in Section 4.0. Those results were obtained with lattice calculations.
Table 4. Single-Batch Fuel Management Option with 350 µµµµm and 425 µµµµm Kernel-Diameter Fuel.
Results
Fission products modeling
Number of axial burning
zones Cycle length
(EFPD)
Discharge burnup, GWd/t
Peak Power a) keff at BOC/EOC
350 µm Diameter/10% Enriched/28.9% Packing Fraction Fuel 1 486.5 55.3 2.13 5 476.6 54.2 2.10 Explicit fission products
10 474.5 53.9 2.12 Lumped fission products 10 465.8 52.9 2.10 1.3301/1.0100
425 µm Diameter/14% Enriched/25% Packing Fraction Fuel 1 781.4 76.8 2.38 5 783.7 77.1 2.38 Explicit fission products
10 794.0 78.1 2.40 Lumped fission products 10 799.4 78.6 2.38 1.3690/1.0100
a) Peak power as calculated by DIF3D-nodal..

48
The results show that using the higher fuel loading and enrichment (425 �m case) gives a
higher reactivity swing (37% versus 33% ∆k) than the 350 µm fuel case. This implies that a
higher loading of burnable poisons or higher strength control rods might be needed for the
425 µm kernel-diameter case (relative to the 350 µm case), as would be expected.
With the 425 µm kernel-diameter core, it is possible to achieve a cycle length of about
800 days (over 2 years assuming a capacity factor of 90%). However, only a burnup of about
90 GWd/t is possible with this loading and so, the targeted discharge burnup is not met.
Additionally, the 425 �m case gives a higher total core peaking factor (2.4). This high
peaking factor occurs at the beginning of cycle for the 350 and 425 �m kernel-diameter cases.
The core radial and axial power distributions for the two cases are presented in Figures 23
to 27. It is observed that the core radial distribution are fairly flat for the two cases and the
maximum column power density is about 1.20 -1.25 of the core average. Consistently with the
higher total core peaking value, the 425 �m case has higher values for the core axial and radial
peak powers. It is noted that for both cases, the power peaks (total, radial, and axial) become
smaller with burnup (i.e., the core power distribution becomes flatter with burnup).
Figure 23. Core Total Power Peaking Factor as Function of Burnup
(Single-Batch Core: 350 µm Kernel-Diameter Case).
1.50
1.60
1.70
1.80
1.90
2.00
2.10
2.20
0 100 200 300 400 500 600
Burnup(EFPD)
Pea
k po
wer
10AZ-AFP10AZ-LFP

49
Figure 24. Core Axial Power Distributions at Beginning and End of Cycle
(Single-Batch Core: 350 µm Kernel-Diameter Case).
Figure 25. Core Radial Power Distributions for Single-Batch Core with 350 µµµµm Kernel-Diameter Fuel.
0.00
0.20
0.40
0.60
0.80
1.00
1.20
1.40
0 200 400 600 800 1000 1200
Height (cm)
Axi
al p
ower
BOC EOC
1.09
1.08
1.21
1.10
1.09
0.97
1.09
0.97
1.21
1.10
0.95
1.01
0.95
1.03
0.99
1.05
0.89
0.94
1.00
1.06
0.95
1.03
0.84
0.84
0.96
0.99
0.99
1.00
1.00
1.01
0.85
0.87
0.95
0.95
AB
A : BOCB : EOC

50
Figure 26. Core Axial Power Distributions at Beginning and End of Cycle. (Single-Batch Core: 425 µm Kernel-Diameter Case).
Figure 27. Core Radial Power Distributions for Single-Batch Core with 425 µµµµm Kernel-Diameter Fuel.
1.07
1.07
1.24
1.11
1.13
0.98
1.13
0.98
1.24
1.11
0.93
1.00
0.91
1.00
0.95
1.03
0.87
0.92
0.96
1.03
0.91
1.00
0.87
0.87
0.97
1.00
1.00
1.02
1.01
1.02
0.86
0.88
0.97
0.98
AB
A : BOCB : EOC
0.00
0.20
0.40
0.60
0.80
1.00
1.20
1.40
0 200 400 600 800 1000 1200
Height (cm)
Axi
al p
ower
BOCEOC

51
5.5 Fuel Management Option – Two-Batch Equilibrium Core
The results of depletion studies using two-batch fuel management schemes are presented
in this section. This fuel loading scheme implies that at the beginning of each cycle, a half of the
core is replaced and loaded with fresh fuel elements. Because the NGNP power peaks at the inner
core interface with the reflector, the fuel loading scheme devised for the two-batch core prohibits
(when possible) the loading of fresh elements in the inner ring of the active core. Figure 28
shows one of the two-batch loading patterns used in this work. The other is presented as a
parametric case that reduces the core radial power peaking factor. As noted in Section 5.1, a
1/3-core symmetry was used for the two-batch calculations because of the different core element
types. Different fuel management paths (movements) have been used for the standard fuel,
reserve-shutdown, and control elements. In Figure 28, PF, PS and PC denote the fuel
management paths for standard fuel, reserve-shutdown, and control elements, and the number of
resident cycle is presented in the parenthesis. There are several sub-paths within each path. For
example, there are 12 sub-paths for standard fuel elements; The fuel assembly located in location
PF1(0) is shuffled to location PF1(1) in the second cycle and then is discharged from the core.
Calculations have been done for two cases having different fuel parameters. These are the
350 µm kernel-diameter case (using 350 µm kernel diameter/10% enriched fuel and 28.9%
packing fraction) and the 425 µm kernel-diameter case (using 425 µm diameter/14% enriched
fuel and 25% packing fraction). Results for these cases are summarized in Table 5. The peak
power values in the table are those estimated conservatively by DIF3D calculations.
The general trends in the cycle length and discharge burnup values for the 350 and 425
µm kernel-diameter cases are similar to those for the single-batch scheme. The 425 µm kernel-
diameter case gives the longer cycle length and higher discharge burnup, due primarily to the
higher fissile loadings, relative to the 350 µm kernel-diameter case. Compared to the single-batch
scheme, the two-batch scheme has a lower reactivity swing (about 20% versus ~35%). As
expected, the two-batch scheme gives a longer discharge burnup and a shorter cycle length
compared to the single-batch scheme.

52
The most significant result is that the two-batch core using 425 µm kernel-diameter fuel
meets the requirements on both the cycle length and the discharge burnup (about 1.61 years and
~100 GWd/t, respectively, assuming a capacity factor of 90%). This is not however the case for
the two-batch core using 350 µm kernel-diameter fuel.
Figure 28. Two-Batch Fuel Management Scheme for NGNP Core.
C Fresh control orshutdown column
C Once burnt control orshutdown column
Fresh fuel column
Once burnt fuel column
PF12(1)
C
PF12(0)
PS2(0)
C
PF11(1)
PF11(0)
PF10(1)
C
PC2(1)
PS3(1)
PF10(0)
C
PC2(0)
PF9(0)
PF9(1)
PF8(1)
PF8(0)
PS2(1)
C
PF7(1)
PF7(0)
C
PF5(1)
PF6(0)
PF6(1)
PC1(1)
PF5(0)
PS1(0)
C
PC1(0)
PS3(0)
PF4(1)
C
PF2(1)
PF3(0)
PF4(0)
C
PF1(1)
PF2(0)
PF3(1)
C
PF1(0)
PS1(1)
C
C

53
Table 5. Two-Batch Fuel Management Option with 350 µµµµm and 425 µµµµm Diameter Fuel.
Results
Fission products modeling
Number of axial burning
zones Cycle length
(EFPD)
Discharge burnup, GWd/t
Peak Power keff at BOC/EOC
350 µm Diameter/10% Enriched/28.9% Packing Fraction Fuel Explicit fission products 1 319.8 72.1 2.19
1 316.2 71.4 2.18 5 309.7 69.9 2.03 Lumped fission products
10 317.9 71.7 2.04 1.1961/1.0028 425 µm Diameter/14% Enriched/25% Packing Fraction Fuel
Explicit fission products 1 528.4 100.4 2.50 1 533.0 101.2 2.49 5 559.6 105.3 2.57 Lumped fission products
10 526.1 99.9 2.35 1.2205/1.0098
The power distributions for both the 350 and 425 µm kernel-diameter cases are quite
similar, hence only the power distribution results for the 425 µm kernel-diameter case are
presented here. These power distributions are displayed in Figures 29 to 31. The column-wise
power distribution is quite flat (see Figure 31). Although not the same distributions as for the
single-batch core, the maximum values (about 1.25) for the two cores are quite similar. In
Figures 29 and 30 the core average and maximum column axial power distributions are
presented. It is noted that the column power distributions are the local power density divided by
the core average power density. The flattening of the axial power distribution with burnup is
evident.
Sensitivity Study on Radial Loading Pattern
An attempt was made to flatten the column-wise distribution further. It was noticed that
the maximum column power (1.27 in location (6,3) in the fractional core) occurs in a once-
burned column location surrounded mostly by fresh fuel elements (see Figure 28). In order to
reduce the power in this location (6,3) the fresh fuel element located in (7,4) is exchanged with
the once-burnt fuel element in location (8,2). This exchange does not affect the cycle length, but
the column power in location (6,3) changes from 1.27 to 1.20. This power distribution is
displayed in Figure 32. (The calculation is for a core loaded with 425 �m kernel-diameter fuel).
The maximum column power in this case is 1.20.

54
Figure 29. BOC Axial Power Distributions at Leading Peak Power Locations for the Two-Batch Core with 425 µµµµm Kernel-Diameter Fuel.
Figure 30. EOC Axial Power Distributions at Leading Peak Power Locations for the Two-Batch Core with 425 µµµµm Kernel-Diameter Fuel.
0.00
0.20
0.40
0.60
0.80
1.00
1.20
1.40
1.60
0 200 400 600 800 1000 1200
Height (cm)
Axi
al p
ower
BOC (6,2)BOC (7.3)BOC (4.6)BOC ave.
0.00
0.20
0.40
0.60
0.80
1.00
1.20
1.40
0 200 400 600 800 1000 1200
Height (cm)
Axi
al p
ower
EOC (6,2)EOC (7,4)EOC (4,6)EOC ave.
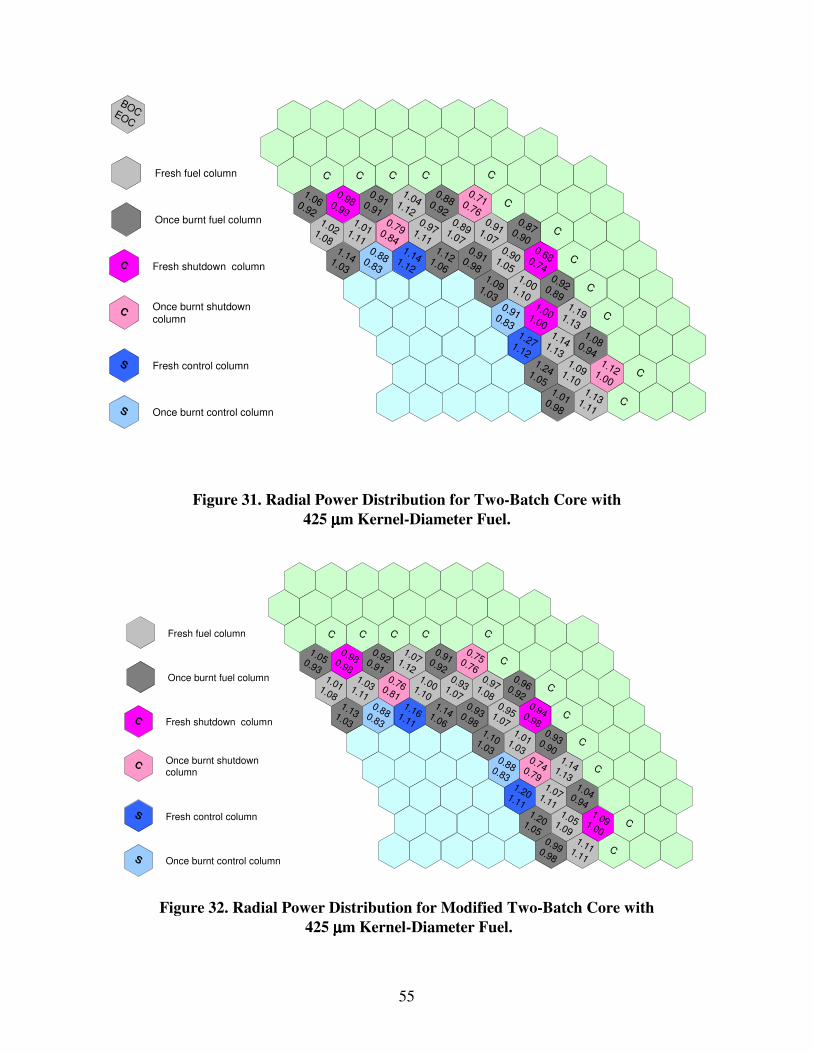
55
Figure 31. Radial Power Distribution for Two-Batch Core with 425 µµµµm Kernel-Diameter Fuel.
Figure 32. Radial Power Distribution for Modified Two-Batch Core with
425 µµµµm Kernel-Diameter Fuel.
1.060.92
C
1.021.08
0.980.99
C
1.141.03
1.011.11
0.910.91
C
0.880.83
0.790.84
1.041.12
C
1.141.12
0.971.11
0.880.92
1.121.06
0.891.07
0.710.76
C
0.910.98
0.911.07
C
1.091.03
0.901.05
0.870.90
0.910.83
1.001.10
0.680.74
C
1.271.12
1.001.00
0.920.89
C
1.241.05
1.141.13
1.191.13
C
1.010.98
1.091.10
1.080.94
C
1.131.11
1.121.00
C
C
BOCEOC
C Fresh shutdown column
C Once burnt shutdowncolumn
S Fresh control column
S Once burnt control column
Fresh fuel column
Once burnt fuel column
1.050.93
C
1.011.08
0.980.98
C
1.131.03
1.031.11
0.920.91
C
0.880.83
0.760.81
1.071.12
C
1.161.11
1.001.10
0.910.92
1.141.06
0.931.07
0.750.76
C
0.930.98
0.971.08
C
1.101.03
0.951.07
0.960.92
0.880.83
1.011.03
0.940.98
C
1.201.11
0.740.79
0.930.90
C
1.201.05
1.071.11
1.141.13
C
0.990.98
1.051.09
1.040.94
C
1.111.11
1.091.00
C
C
C Fresh shutdown column
C Once burnt shutdowncolumn
S Fresh control column
S Once burnt control column
Fresh fuel column
Once burnt fuel column

56
Sensitivity Study on Axial Shuffling
The utilization of fuel elements stacked end-to-end in the core suggests that fuel shuffling
can be done axially. The goal would be to use this approach to lower the fuel axial power
peaking factor, and potentially the radial peaking factor. Different schemes could be envisaged.
In one approach, fuel of the same age (burnup) could be grouped into a single axial plane and the
most burned fuel could be loaded into the core center. Another approach is to use alternating
radial loading patterns axially. This approach ensures that a given fuel element is surrounded by
assemblies of a different age. This loading pattern, called the alternating fuel pattern, was
considered for the GT-MHR, and has been evaluated for the NGNP in this study. A schematic of
the core loading pattern concept is shown in Figure 33.
The core axial power distributions for the base radial shuffling case and alternating fuel
pattern case for a core using 425 �m kernel-diameter fuel are compared in Figures 34 and 35.
The two cases give very similar core axial power distributions. The core radial power distribution
and the axial power distributions for the columns with the highest powers are displayed in
Figures 36 to 38. The undulating column axial power shapes are not dissimilar from those shown
for three-batch GT-MHR core in Ref. 4. The peak values of the column power distributions for
the alternating fuel pattern case are much higher than those of the radial shuffling case (about
1.76 versus 1.49). The core radial power distribution for the alternating fuel pattern case is
displayed in Figure 38. The maximum column power is slightly higher in this case than for the
radial fuel shuffling case (1.29 versus 1.27).

57
Figure 33. Alternating Fuel Pattern Scheme for Two-Batch Core.
C Fresh shutdown column
C Once burnt shutdowncolumn
S Fresh control column
S Once burnt control column
Fresh fuel column
Once burnt fuel column
C C C C C
C
C
C
C
C
C
C
C C C C C
C
C
C
C
C
C
C
Eve
n La
yer C
onfig
urat
ion
Odd
Lay
er C
onfig
urat
ion

58
Figure 34. BOC Axial Power Distributions for Two-Batch Alternating Fuel Pattern and
Regular Shuffling Scheme with 425 µµµµm Kernel-Diameter Fuel.
Figure 35. EOC Axial Power Distributions for Two-Batch Alternating Fuel Pattern and
Regular Shuffling Scheme with 425 µµµµm Kernel-Diameter Fuel.
0.00
0.20
0.40
0.60
0.80
1.00
1.20
1.40
0 200 400 600 800 1000 1200
Height (cm)
Axi
al p
ower
Radial Shuffling Only Alternative Axial Shuffling
0.00
0.20
0.40
0.60
0.80
1.00
1.20
0 200 400 600 800 1000 1200
Height (cm)
Axi
al p
ower
Radial Shuffling Only Alternative Axial Shuffling

59
Figure 36. BOC Axial Power Distributions at Leading Column Power Locations for
Alternating Fuel Pattern Two-Batch Core with 425 µµµµm Diameter Fuel.
Figure 37. EOC Axial Power Distributions at Leading Column Power Locations for
Alternating Fuel Pattern Two-Batch Core with 425 µµµµm Diameter Fuel.
0.0
0.2
0.4
0.6
0.8
1.0
1.2
1.4
0 200 400 600 800 1000 1200
Height (cm)
Axi
al p
ower
EOC (6,2)EOC (6,5)EOC (5,6)EOC Ave.
0.0
0.2
0.4
0.6
0.8
1.0
1.2
1.4
1.6
1.8
2.0
0 200 400 600 800 1000 1200
Height (cm)
Axi
al p
ower
BOC (6,2)BOC (6,5)BOC (5,6)BOC Ave.

60
Figure 38. Radial Power Distributions for Alternating Fuel Pattern Two-Batch Core with 425 µµµµm Kernel-Diameter Fuel.
1.031.00
C
0.870.98
0.850.87
C
1.281.15
0.921.00
1.011.02
C
1.080.98
0.880.92
0.991.01
C
1.070.98
0.941.01
1.001.01
1.291.16
0.860.96
0.880.87
C
1.091.09
0.930.99
C
1.281.15
0.880.98
1.031.01
1.080.98
0.921.00
0.850.87
C
1.080.98
0.890.92
1.010.02
C
1.291.16
0.941.01
1.001.01
C
1.091.09
0.870.96
1.001.01
C
0.930.99
0.880.87
C
C
BOCEOC
C Fresh shutdown column
C Once burnt shutdowncolumn
S Fresh control column
S Once burnt control column
Fresh fuel column
Once burnt fuel column

61
5.6 Fuel Management Option – Three-Batch Equilibrium Core
Depletions calculations have been done for a core using the three-batch fuel management
scheme. As in the two-batch case, fresh fuel elements are not loaded (when possible) into the
inner ring positions in order to minimize core power peaking factors. Figure 39 shows the three-
batch core loading pattern used in the work. Because of the arrangements of the core control
elements, no core symmetry exists and hence only whole-core calculations are performed. In
Figure 39, PF, PS and PC denote the fuel management paths for standard fuel, reserve shutdown
and control elements, and the number of resident cycle is represented in the parenthesis. PF1(0),
PF1(1) and PF1(2) respectively denote for example the path of an assembly from the initial
loading and subsequent shuffling position. Calculations have been performed for cores using 350
and 425 �m kernel-diameter fuel. Because of the enormous computational time requirements,
only cases with five axial burn zones have been performed. Core performance results are
summarized in Table 6. Power distributions for the 425 �m kernel-diameter fuel only are
displayed in Figures 40 to 42. The shapes of these distributions are similar to those for the 350
�m kernel-diameter case, although the 425 �m diameter case has a higher total peaking factor.
Results in Table 6 show that the 425 �m fuel-diameter case gives a discharge burnup of
about 115 GWD/t, which meets the targeted discharge burnup range. The cycle length is however
about 390 EFPD (1.18 years, assuming 90% capacity factor) and hence does not meet the
targeted value of 1.5 years.
The core radial power distribution shows that the maximum column power is 1.35
(located in an inner ring position that has fresh fuel). More work could be done to reduce this
power level, however, this additional work was not done here because the targeted cycle length is
unmet.
The core and column axial power distributions follow the same trends as the single- and
two-batch cases, with the distribution having pronounced peaks at the beginning of cycle (BOC);
these peaks burn out and the power distribution are relatively flatter at the end of cycle (EOC).
The core total power peaking factors for this case is however 2.21. The core reactivity swing
(about 15%) is also the lowest of the three fuel management schemes considered.

62
Figure 39. Three-Batch Fuel Management Scheme for NGNP Core.
C
C
C
C
C
C
C
PF12(2)
PS3(0)
PF11(1)
PF10(2)
PF10(1)
PS3(1)
C
PS4(2)
PF13(1)
PF12(0)
PF11(0)
PS3(2)
PF10(0)
PF9(0)
PF9(1)
PF8(2)
C
C
PF14(1)
PF13(0)
PF12(1)
PF11(2)
PC2(2)
PC2(1)
PF9(2)
PF8(1)
PF8(0)
PS2(0)
C
C
PF14(2)
PF14(0)
PF13(2)
PF7(2)
PF7(0)
PF7(1)
C
C
PF15(1)
PS4(1)
PC3(0)
PC2(0)
PS2(1)
PF6(2)
C
C
PS4(0)
PF15(0)
PC3(1)
PC2(2)
PF6(0)
PF6(1)
PF16(2)
PF16(0)
PF15(2)
PF5(2)
PF5(0)
PS2(2)
C
C
PF17(1)
PF16(1)
PF5(1)
PF4(1)
C
C
PS5(1)
PF17(0)
PF17(2)
PF3(2)
PF4(0)
PF4(2)
PF18(1)
PF18(0)
PC3(2)
PC1(1)
PF3(0)
PS1(0)
C
C
PF18(2)
PS5(2)
PC4(0)
PC1(0)
PS1(2)
PF3(1)
C
C
PF19(1)
PF19(0)
PF19(2)
PF1(2)
PF2(0)
PF2(2)
C
C
PS5(0)
PF20(0)
PF20(1)
PF21(2)
PC4(1)
PC4(2)
PF23(2)
PF1(1)
PF1(0)
PF2(1)
C
C
PF20(2)
PF21(1)
PF21(0)
PF22(0)
PS6(1)
PF23(0)
PF24(0)
PF24(1)
PS1(1)
C
PS6(2)
PF22(1)
PF22(2)
PF23(1)
PS6(0)
PF24(2)
C
C
C
C
C
C
C
C Fresh control or shutdowncolumn
C Once burnt control orshutdown column
Fresh fuel column
Once burnt fuel column
C Twice burnt control orshutdown column Twice burnt fuel column

63
Table 6. Three-Batch Fuel Management Option with 350 µµµµm and 425 µµµµm Kernel-Diameter Fuel.
Results
Fission products modeling
Number of axial burning
zones Cycle length
(EFPD)
Discharge burnup, GWd/t
Peak Power keff at BOC/EOC
350 µm Diameter/10% Enriched/28.9% Packing Fraction Fuel Explicit fission products 1 238.7 82.3 2.13 Lumped fission products 5 226.0 78.0 1.92 1.1495/1.0173
425 µm Diameter/14% Enriched/25% Packing Fraction Fuel Explicit fission products 1 385.6 114.9 2.49 Lumped fission products 5 396.9 115.2 2.21 1.1600/1.0103

64
Figure 40. Radial Power Distribution for Three-Batch Core with 425 µµµµm Diameter Fuel.
Twice burnt fuel
C Fresh control
C Once burnt control
S Fresh shutdownFresh fuel
Once burnt fuel S Once burnt shutdown
S Twice burnt shutdownC Twice burnt control
C
C
C
C
C
C
C
0.900.86
1.001.04
1.011.03
0.800.86
0.971.02
0.850.87
C
0.880.86
0.981.02
1.021.12
1.051.15
0.620.73
0.991.13
0.981.12
0.971.02
0.920.86
C
C
1.051.01
1.051.13
1.101.10
1.000.96
0.740.75
0.920.92
1.051.01
1.081.10
1.071.14
1.071.05
C
C
0.890.87
1.141.17
1.171.03
1.070.98
1.161.18
1.101.04
C
C
1.131.04
0.720.76
1.351.22
1.301.20
0.690.75
0.850.86
C
C
1.091.05
1.181.18
1.080.95
0.800.75
1.051.13
1.011.00
0.940.86
1.091.13
1.070.96
1.060.98
1.011.11
0.870.85
C
C
1.001.01
1.111.09
1.111.09
0.991.01
C
C
0.880.85
1.021.11
1.101.00
1.060.96
1.091.13
0.960.88
1.011.01
1.061.13
0.800.75
1.080.95
1.171.18
1.091.05
C
C
0.860.86
0.690.75
1.301.20
1.341.22
0.720.76
1.131.04
C
1.101.04
1.171.12
1.070.98
1.131.00
1.131.16
0.890.87
C
C
1.071.05
1.081.14
1.081.10
1.051.01
0.920.92
0.740.75
1.000.96
1.101.10
1.051.13
1.041.01
C
C
0.920.86
0.981.02
0.981.12
0.991.13
0.620.73
1.051.15
1.021.12
0.981.02
0.880.86
C
0.850.87
0.971.02
0.800.86
1.021.03
1.001.04
0.920.88
C
C
C
C
C
C
C

65
Figure 41. BOC Axial Power Distribution at Leading Peak Power Locations for Three-Batch Core with 425 µµµµm Diameter Fuel.
Figure 42. EOC Axial Power Distribution at Leading Peak Power Locations for
Three-Batch Core with 425 µµµµm Diameter Fuel.
0.00
0.20
0.40
0.60
0.80
1.00
1.20
1.40
1.60
1.80
0 200 400 600 800 1000 1200
Height (cm)
Axi
al p
ower
BOC (6,9)BOC (16.13)BOC (9,6)BOC ave.
0.00
0.20
0.40
0.60
0.80
1.00
1.20
1.40
0 200 400 600 800 1000 1200
Height (cm)
Axi
al p
ower
EOC (6,9)EOC (16,13)EOC (9,6)EOC ave.

66
5.7 Evaluation of Two- and Three-Batch Transitional Cores
The whole-core depletion calculations presented in the previous sections have been for
equilibrium cores. Approaches to these equilibrium cores are evaluated in this section by
performing transitional core calculations using the 425 �m kernel-diameter fuel. Transitional
cores for both the two-batch and three-batch fuel management schemes have been evaluated
using the non-equilibrium option of the REBUS-3 code.
In designing the transitional cores, it is first assumed that elements containing the 425 um
kernel-diameter and 14% enriched fuel and with a packing fraction of 25% (base fuel loading)
would be present in the equilibrium cycle core. Then lower enrichments are found for fractional
loading of the core in the early cycle to ensure that the equilibrium cycle length is preserved. For
example, for the first transitional cycle of the two-batch core, a half of the core is loaded with the
base fuel, and a half is loaded with fuel of lower enrichment (in this case 5% instead of 14%). At
the beginning of the second transitional cycle, the burnt 5% enriched fuel is replaced by 14%
enriched fuel. For subsequent cycle, the most burned 14% enriched fuel is discharged and
replaced by fresh 14% enriched fuel.
The above stated approach is also used for the three-batch core, with the exception that in
the first core, 2/3 of the core is loaded with two sets of lower enrichment fuel (7% and 3%). At
the end of the first transitional cycle, the burned 3% fuel is replaced by 14% enriched fuel and at
the end of the second transitional cycle the twice burnt 7% enriched fuel is discharged and
replaced by 14% enriched fuel. Subsequently, the most burned 14% enriched fuel is replaced
with fresh 14% enriched fuel.
Figures 43 and 44 show the evolution of the k-effective and core total power peaking
factors predicted by REBUS-3/DIF3D for the two- and three-batch cores using 425 �m kernel-
diameter fuel. Results for the equilibrium cycles are included for comparison (actually repeated,
to show the evolution of the transitional cycles towards the equilibrium cycle). Figures 45 and 46
show the evolution of the discharge burnups for the cases. After about n+1 transitional cycles (n
is number of batches), the equilibrium cycle values are approached. Similar trends were found for
the axial power and radial power distributions (see Figures 47 and 48 for example).

67
Figure 43. Core k-effective and Total Peaking Factor during Transitional Cycles for
Two-Batch Fuel Management Scheme with 425 µµµµm Kernel-Diameter Fuel.
Figure 44. Core k-effective and Total Peaking Factor during Transitional Cycles for
Three-Batch Fuel Management Scheme with 425 µµµµm Kernel-Diameter Fuel.
0.90
1.00
1.10
1.20
1.30
0 500 1000 1500
Burnup (EFPD)
k-ef
f
1.0
1.5
2.0
2.5
3.0
Pea
k po
wer
k-eff K-eff, Eq Peak power Peak Power, Eq
0.90
1.00
1.10
1.20
1.30
1.40
0 500 1000 1500 2000 2500 3000 3500
Burnup (EFPD)
k-ef
f
1.10
1.60
2.10
2.60
Pea
k po
wer
k-eff K-eff, Eq Peak power Peak Power, Eq

68
Figure 45. Average Discharge Burnup during Transitional Cycles for Two-Batch Fuel Management Scheme with 425 µµµµm Kernel-Diameter Fuel.
Figure 46. Average Discharge Burnup during Transitional Cycles for Three-Batch Fuel
Management Scheme with 425 µµµµm Kernel-Diameter Fuel.
23.6
65.2
124.8119.2 115.54
0
20
40
60
80
100
120
140
1 2 3 4 Eq
Cycle
Dis
char
ge B
urnu
p (G
Wd/
t)
37.5
109.0102.5 101.1 100.9 100.8 99.9
0.0
20.0
40.0
60.0
80.0
100.0
120.0
1 2 3 4 5 6 Eq
Cycle
Dis
char
ge B
urnu
p (G
Wd/
t)

69
Figure 47. BOC Axial Power Distributions during Transitional Cycles for Two-Batch Fuel
Management Scheme with 425 µµµµm Kernel-Diameter Fuel.
Figure 48. BOC Axial Power Distributions during Transitional Cycles for Three-Batch
Fuel Management Scheme with 425 µµµµm Kernel-Diameter Fuel.
0.0
0.2
0.4
0.6
0.8
1.0
1.2
1.4
0 200 400 600 800 1000 1200
Height (cm)
Axi
al p
ower 1
234Eq
0.0
0.2
0.4
0.6
0.8
1.0
1.2
1.4
0 200 400 600 800 1000 1200
Height (cm)
Axi
al p
ower
123456Eq

70
5.8 Summary of Fuel Management Studies
Tables 7 and 8 summarize some of the key results derived from the numerous
calculations performed in this work. The following conclusions are evident:
• Cycle length decreases with increasing number of batches.
• Discharge burnup increases with increasing number of batches.
• Reactivity swing decreases with increasing number of batches.
• Peak power decreases with increasing number of batches.
• Generally, the cycle length, discharge burnup, peak power, reactivity swing and peak fast
fluence increase with increasing uranium enrichment, for the combination of other fuel
parameters (kernel diameter and packing fraction).
• Three-batch scheme is better than the single- and two-batch schemes in terms of
discharge burnup, peak power, and reactivity swing. However, its cycle length is shorter
than the targeted cycle length (18 month). Thus, to attain a three-batch scheme that meets
the cycle length and burnup requirements, a higher enrichment (> 14%) is necessary.
• The peak fast fluence (E > 0.18 MeV) is satisfied by the single- and two-batch fuel
management schemes, but not by the three-batch scheme (based on the estimates for
E > 0.11 MeV).
• Results indicate that the two-batch scheme with 425 µm kernel-diameter fuel (with 14%
enrichment, 25% packing fraction) satisfies the targeted cycle length and discharge
burnup.

71
Table 7. Summary of NGNP Excess Reactivity, Peak Power and Fluence .
Kernel diameter
(�m)
Number of batches NC/NU
a) ∆keff between BOC & EOC
Peak power Peak fast fluence (n/cm2)
Single 0.3201 2.10 1.71E+21
Two 0.1933 2.04 2.50E+21 350
Three
427.0
0.1322 1.92 2.67E+21
Single 0.3590 2.38 3.09E+21
Two 0.2107 2.35 3.88E+21 425
Three
363.5
0.1497 2.21 4.53E+21
a) Number density ratio of carbon to uranium in homogenized fuel element.
Table 8. Summary of NGNP Heavy-Metal Loading, Cycle Length and Discharge Burnup.
Discharge burnup, GWd/t Kernel diameter
(�m)
Number of batches
Initial heavy metal loading
(kg)
Cycle length (EFPD) Core average Peak value
Single 5209.3 465.8 52.9 112.3
Two 5101.7 317.9 71.8 121.6 350
Three 5056.7 226.0 78.0 131.9
Single 6101.3 799.4 78.6 162.6
Two 5926.8 526.1 99.9 188.1 425
Three 5836.1 396.9 115.2 211.7
72
6.0 Conclusions
ANL has developed whole-core deterministic depletion models and utilized them for
analyzing the NGNP core. This activity was conducted in the framework of a task defined to
provide reactor physics support for fuel specification and testing efforts ongoing under the
advanced gas-cooled reactor program. Both ANL and INEEL participated in this task, with
INEEL focusing of the stochastic Monte Carlo capability (MCNP coupled to ORIGEN). The
current report is a summary of ANL depletion models and fuel management results obtained with
the models. This is a companion report to another one completed and submitted to the USDOE in
April 2004, in which lattice (WIMS8 and DRAGON) and MCNP code models for the NGNP
were developed and assessed.
In the current report, the deterministic depletion calculational path that was developed for
the NGNP is discussed. Since this task is not an NGNP core design effort, pertinent calculations
were performed for a previously designed General Atomics GT-MHR core, with minor
modifications to represent the NGNP.
The fuel cycle optimization study performed in this study assumes that the NGNP utilizes
a VHTR prismatic core design that employs a once-through fuel cycle. A single fuel particle
(fissile) is used, as opposed to the application of both fissile and fertile fuel particles as in some
previous prismatic gas-cooled core designs. The current work assumes that the targeted core
operational cycle length is 18 to 24 months to be consistent with current practices in U.S. utilities
and an average fuel discharge burnup of 100 to 150 GWd/t. Design constraints were imposed on
the fuel packing fraction in the compact, the fuel kernel diameter, and the fuel enrichment. Based
on input from fuel experts a limit on fuel packing fraction of 30% is imposed on this study.
Similarly a limit of 15% is imposed on the enrichment. For the fuel kernel diameter a range of
300 to 450 �m range has been employed. In addition to these constraints, the minimization of
core reactivity control requirements was also considered.
The WIMS8 lattice code was used for preliminary analysis of the NGNP core with
respect to meeting performance goals for the cycle length and discharge burnup, under the
constraints on fuel specification parameters such as the fuel diameter, fuel enrichment, and fuel

73
packing fraction in the graphite compact. The preliminary evaluation facilitated limiting the
search space for the more computationally expensive whole-core depletion calculations, by
providing a narrow range for the pertinent design parameters to be evaluated.
The whole-core depletion studies evaluated various fuel management schemes (single-,
two-, and three batch schemes) for the equilibrium and transitional cycles. The study also
evaluated the impact of radial and axial fuel shuffling on the core power peaking and reactivity
swing, which directly affect reactor safety requirements. The neutron fluence loads on the fuel
particle designs that meet reactor core performance requirements (e.g., the cycle length and
discharge burnup) were also evaluated.
The results indicated that within the limits on the fuel packing fraction (less than 30%)
and the fuel enrichment (less than 15%), only the two-batch fuel management scheme can meet
simultaneously the targeted cycle length and discharged burnup goals. The single-batch scheme
could only satisfy the cycle length goal (about 18 month) when a fuel kernel diameter of 425 �m
is employed. By increasing the number of fuel batches it is possible to increase the discharge
burnup to 100 GWd/t with a two-batch scheme and 115 GWd/t with a three batch scheme. Using
the three-batch scheme however, the cycle length is reduced to less than
15 months. Regarding the reactivity swing, it was found that this quantity can be reduced by a
factor of ~2.4 if the three-batch fuel management scheme is used versus the single-batch scheme.
The application of more fuel batches and fuel shuffling would also help to reduce the power
peaking factor. The study found that utilizing axial element shuffling is possible but would
provide only limited benefit to the reduction of the power peaking factor. (The fuel column axial
power peaks are significantly increased with the axial shuffling approach used in this study.) The
maximum fast fluence estimated with cutoff energy of 0.11 MeV is less than the limiting value of
4 x 10²¹ n/cm2 (> 0.18 MeV) for all the single- and two-batch cores; this value is exceeded in the
three-batch core. A summary of results is presented in Section 5.8.
The current capabilities employed in this study require additional improvements to
support the final analysis of the NGNP. Specifically, a more robust cross section
functionalization capability is required for the representation of feedback effect on the broad-
group neutron cross sections. In this regard, a simplified and accurate thermal-hydraulic

74
capability should be incorporated into the REBUS-3 code for the analysis of the NGNP core.
Additionally, the impacts of solution refinements (spatial details and transport effect) on the
results need to be evaluated. The deterministic code results could also be compared to higher
fidelity capability such as those based on coupled Monte Carlo and ORIGEN codes. This latter
effort would only be for a representative benchmark state, as these tools do not currently have the
capability to model reactivity-feedback effects. In addition to the core physics parameters that
have been studied in this work, it is necessary to provide values of safety-related parameters (e.g.,
reactivity coefficients). It is therefore recommended that these parameters be calculated in follow
on studies. The availability of a robust capability with a reactivity feedback model would make
this task straightforward (less tedious).

75
References
1. Technical Program Plan for the Advanced Gas Reactor Fuel Development and Qualification
Program, developed by the Advanced Gas Reactor Team, ORNL/TM-2002/262, April 2003.
2. T. K. Kim, W. S. Yang, M. A. Smith, T. A. Taiwo, and H. S. Khalil, “Assessment of Monte
Carlo and Deterministic Codes for Next Generation Nuclear Plant (NGNP) Core Modeling,”
Argonne National Laboratory Gen IV Report, April 15, 2004.
3. P. E. MacDonald et al., “NGNP Preliminary Point Design – Results of Initial Neutronics
and Thermal-Hydraulic Assessment,” INEEL/EXT-03-00870 Rev. 1, Idaho National
Engineering and Environmental Laboratory, September 2003.
4. R. C. Potter et al., “Gas Turbine-Modular Helium Reactor (GTMHR) Conceptual Design
Description Report,” GA Report 910720, Revision 1, General Atomics, July 1996.
5. “WIMS – A Modular Scheme for Neutronics Calculations,” User’s Guide for Version 8,
ANSWER/WIMS(99)9, The ANSWERS Software Package, AEA Technology.
6. G. Marleau, et al, “A User Guide for DRAGON,” Technical report IGE-174 Rev. 4, Ecole
Polytechnique de Montréal, September 1998 (1998).
7. B. J. Toppel, “A User’s Guide to the REBUS-3 Fuel Cycle Analysis Capability,” ANL-83-2,
Argonne National Laboratory (1983).
8. K. L. Derstine, “DIF3D: A Code to Solve One-, Two-, and Three-Dimensional Finite-
Difference Diffusion Theory Problems,” ANL-82-64, Argonne National Laboratory (1984).
9. R. D. Lawrence, “The DIF3D Nodal Neutronics Option for Two- and Three-Dimensional
Diffusion Theory Calculations in Hexagonal Geometry,” ANL-83-1, Argonne National
Laboratory (1983).
10. G. Palmiotti, E. E. Lewis, and C. B. Carrico, “VARIANT: VARIational Anisotropic Nodal
Transport for Multidimensional Cartesian and Hexagonal Geometry Calculation,” ANL-
95/40, Argonne National Laboratory (1995).
11. “MCNP – A General Monte Carlo N-Particle Transport Code,” Version 4C, Los Alamos
National Laboratory, LA-13709-M.
12. T. Newton, Private Communication, June 2004.
13. W. S. Yang, Argonne National Laboratory, unpublished information, 1993.