Who Should be Interviewed? A Response from Cluster …jpcp.uswr.ac.ir/article-1-176-en.pdfwith other...
10
143 Who Should be Interviewed? A Response from Cluster Analysis Farzad Radmehr 1 *, Hassan Alamolhodaei 2 1.PhD Candidate, School of Mathematical Sciences, Ferdowsi University of Mashhad, Iran. 2. Professor, School of Mathematical Sciences, Ferdowsi University of Mashhad, Iran. * Corresponding Author: Farzad Radmehr, PhD Candidate Address: School of Mathematical Sciences, Ferdowsi University of Mashhad, Iran. Tel/Fax: +9821-88790082 E-mail: [email protected] Objective: This article presents an application of cluster analysis for social sciences researches especially those studies that have an interview as part of their data collection. This application is more suitable for sequential mixed method researchers who use quantitative data to frame subsequent qualitative subsamples for conducting interviews. Method: In more detail, the algorithm (i.e., single linkage) employed for cluster analysis in this article is suitable for identifying the potential candidates for conducting interviews when the researcher is interested in outliers. Outliers provide interesting contrasts and distinction with other observations in a data set and are an interest for qualitative data analysis strategies. Results: The authors believe that cluster analysis is a better option than the traditional procedures for finding outliers (e.g., using explore or boxplot in SPSS) because cluster analysis finds outliers while considering different variables whereas the traditional methods has limitations and find outliers in respect to one variable. To present this application, first, cluster analysis and the single linkage which can be used for finding outlier data is presented. Then, a data set related to the psychology of learning mathematics was used to illustrate how outliers can be identified with cluster analysis via IBM SPSS 22. Conclusion: Finally, the results obtained from cluster analysis was interpreted. This is happened in order to explore whether the chosen algorithm for cluster analysis is accurate for finding suitable candidates for interviews. A B S T R A C T Article info: Received: 12 Mar 2014 Accepted: 22 Jun 2014 Key Words: Cluster Analysis, Single Linkage, Outliers, Interview, Psychology of Learning Mathematics 1. Introduction luster analysis is “an unsupervised tech- nique used to group objects which are close to one another in a multidimensional feature space, usually for of uncovering some in- herent structure which the data possesses” (Brock, Pihur, Datta, & Datta, 2008, p. 1). It can be applied for recognizing homogenous groups of observations (or objects), called clusters. Observations in the same cluster have many similar characteristics, while they are different from those of other clusters (Mooi, & Sarstedt, 2011). Cluster analysis has been applied in a wide range of disciplines such as market research (e.g., Chakrapani, 2004), bioinformatics and genetics (e.g., Selinski, & Ickstadt, 2008), and archaeology (Sutton, & Reinhard, 1995). It has been also used in educational research for different intentions such as grouping institu- tions (e.g., Boronico, & Choksi, 2012), teaching styles (e.g., Bennet, 1975), concepts (Shavelson, 1979), and students (e.g., Yukselturk, & Top, 2013). In more detail, in educational psychology, for example, it has been used to compare students’ performance (e.g., mathematical performance) within different clusters that are created based on several variables (e.g., mathematics anxiety, Working memory capacity, etc.) In clinical research, it has been applied for finding homogenous groups that hold multivariate information from a heterogeneous sample (Clatworthy et al., 2005) C August 2014, Volume 2, Number 3
Transcript of Who Should be Interviewed? A Response from Cluster …jpcp.uswr.ac.ir/article-1-176-en.pdfwith other...

143
Who Should be Interviewed? A Response from Cluster AnalysisFarzad Radmehr 1*, Hassan Alamolhodaei 2
1.PhD Candidate, School of Mathematical Sciences, Ferdowsi University of Mashhad, Iran.2. Professor, School of Mathematical Sciences, Ferdowsi University of Mashhad, Iran.
* Corresponding Author: Farzad Radmehr, PhD CandidateAddress: School of Mathematical Sciences, Ferdowsi University of Mashhad, Iran.Tel/Fax: +9821-88790082 E-mail: [email protected]
Objective: This article presents an application of cluster analysis for social sciences researches especially those studies that have an interview as part of their data collection. This application is more suitable for sequential mixed method researchers who use quantitative data to frame subsequent qualitative subsamples for conducting interviews.
Method: In more detail, the algorithm (i.e., single linkage) employed for cluster analysis in this article is suitable for identifying the potential candidates for conducting interviews when the researcher is interested in outliers. Outliers provide interesting contrasts and distinction with other observations in a data set and are an interest for qualitative data analysis strategies.
Results: The authors believe that cluster analysis is a better option than the traditional procedures for finding outliers (e.g., using explore or boxplot in SPSS) because cluster analysis finds outliers while considering different variables whereas the traditional methods has limitations and find outliers in respect to one variable. To present this application, first, cluster analysis and the single linkage which can be used for finding outlier data is presented. Then, a data set related to the psychology of learning mathematics was used to illustrate how outliers can be identified with cluster analysis via IBM SPSS 22.
Conclusion: Finally, the results obtained from cluster analysis was interpreted. This is happened in order to explore whether the chosen algorithm for cluster analysis is accurate for finding suitable candidates for interviews.
A B S T R A C TArticle info:Received: 12 Mar 2014Accepted: 22 Jun 2014
Key Words:
Cluster Analysis, Single Linkage, Outliers, Interview, Psychology of Learning Mathematics
1. Introduction
luster analysis is “an unsupervised tech-nique used to group objects which are close to one another in a multidimensional feature space, usually for of uncovering some in-herent structure which the data possesses” (Brock, Pihur, Datta, & Datta, 2008, p. 1).
It can be applied for recognizing homogenous groups of observations (or objects), called clusters. Observations in the same cluster have many similar characteristics, while they are different from those of other clusters (Mooi, & Sarstedt, 2011). Cluster analysis has been applied in a wide range of disciplines such as market research (e.g., Chakrapani, 2004), bioinformatics and genetics (e.g.,
Selinski, & Ickstadt, 2008), and archaeology (Sutton, & Reinhard, 1995). It has been also used in educational research for different intentions such as grouping institu-tions (e.g., Boronico, & Choksi, 2012), teaching styles (e.g., Bennet, 1975), concepts (Shavelson, 1979), and students (e.g., Yukselturk, & Top, 2013). In more detail, in educational psychology, for example, it has been used to compare students’ performance (e.g., mathematical performance) within different clusters that are created based on several variables (e.g., mathematics anxiety, Working memory capacity, etc.)
In clinical research, it has been applied for finding homogenous groups that hold multivariate information from a heterogeneous sample (Clatworthy et al., 2005)
C
August 2014, Volume 2, Number 3

144
including classifying patients (e.g., Chignell, & Sta-cey, 1981; Sampogna, Sera, & Abeni, 2004) and nurses (Hillhouse, & Adler, 1997). It helps data to be more manageable for researcher(s) and also has potentials for identifications of groups that might benefit from inter-vention, specific health promotion campaign, services, at risk of developing medical conditions, and at risk of poor outcomes research (Clatworthy et al., 2005).
In this study, another application of cluster analysis for social sciences studies is presented, particularly, for those studies that have interviews as part of data col-lection. There is a sparse literature about sampling in research that consists of interview. Robinson (2014) provides a theoretical and practical guide for sampling in interview-based qualitative research because it has been given less attention in methodological references. It consists of four parts, including (1) setting a sample universe, (2) selecting a sample size, (3) devising a sample strategy, and (4) sample sourcing. The applica-tion of cluster analysis is related to devising a sample strategy.
There are two main sampling strategies, random/convenience and purposive sampling strategies. In purposive sampling strategies, due to understanding of the topic and literature, researchers assume that cer-tain groups of individuals may have important or dif-ferent viewpoint on the research question in hand and they consider participants of the groups as their sample (Mason, 2002; Robinson, 2014). Within purposive sampling strategy, sometimes researchers are inter-ested in extreme cases because the aim of the research is to show the possibility of a phenomenon (Robinson, 2014). Extreme cases or outlier data are those observa-tions which are placed near the end of the distribution in respect to some variables or some topic of interest. These observations provide interesting contrasts and distinctions with the other observations in a data set (Teddlie, & Yu, 2007).
Failing to consider outliers may cause misunder-standing of the phenomena in hand. For instance, if the researchers study the effects of anxiety on the perfor-mance in any discipline, and do not consider extreme cases, they will not find out to what extent anxiety can impede learning or performance. Imagine that the re-searchers choose random sampling, and no extreme cases are included in the sample. Then, the results of interviews may not shed light on all possible effects of anxiety on performance.
In sampling for interview, another important issue to consider is gathering information about the factors re-lated to the research question in hand. Failing to con-sider these factors may oversimplify the research and finding of these studies may not be acceptable. The present research in social sciences is now focusing on multivariate data. Researchers consider different vari-ables when they study the relationship between factors (e.g., Maloney, Risko, Ansari, & Fugelsang, 2010). For instance, in the previous question" to what extent anxi-ety can impede learning and performance?" anxiety is not considered as an isolated variable that only affect learning and performance. Other variables such as at-titude, Self-efficacy, and working memory capacity me-diate this relationship.
Moreover, gathering information about the factors re-lated to the research question will help the interviewer to know where to start in the interview. For instance, in the previous example, if the researcher have some information about the level of the interviewee’ attitude, Self-efficacy, and working memory; and know that for example the interviewee suffers from low working memory capacity, then, the interviewer can focus on this problem in the interview. And investigate how low working memory capacity relates to anxiety and other variables. In contrast, if the interviewer does not have this information before the interview, he/she may not identify this issue in the interview, or recognize it near the end of interview. Therefore, the interviewer may not handle this problem because he/she has not considered the problem in the study.
Keeping in mind the importance of considering outli-ers and different factors related to the research ques-tion, the next question arises that how outliers should be identified within a sample? The traditional procedures for finding outliers such as using explore or boxplot in SPSS software (e.g., Parke, 2012) is not the best option. The reason is that these procedures identify outliers considering one variable. So, it is beneficial to consider a method (e.g., cluster analysis) that identifies outliers with respect to different variables. By doing this, ex-treme cases are not identified only with respect to one variable but also considering different variables.
To introduce the application of cluster analysis for finding potential candidates for interview, first, cluster analysis and the algorithm that can be applied for find-ing outlier data is presented. Then, a sample related to the psychology of learning mathematics is used to il-lustrate how outlier data can be identified with cluster analysis by IBM SPSS 22. Finally, the obtained results
August 2014, Volume 2, Number 3

145
are interpreted in order to find out whether the chosen algorithm is accurate for finding suitable candidates for interview.
Steps in Cluster Analysis
For performing cluster analysis, several steps should be taken and different issues should be considered to avoid unrealistic results (Mooi, & Sarstedt, 2011; Pas-tor, 2010). These steps include deciding on clustering variables, clustering procedure, selecting a measure of similarity/dissimilarity, choosing clustering algorithm, deciding on the number of clusters, and validating and interpreting the cluster solution (Mooi, & Sarstedt, 2011). In this section, these steps are briefly described in order to provide a guideline for those researchers who interested in using cluster analysis for finding out-liers that serve as potential candidates for interview.
Deciding on Clustering Variables
The first step in cluster analysis is deciding on the vari-ables that the clustering will be executed on. The cho-sen variables should be related to research question(s) at hand and should not have a high degree of collin-earity with each other (Mooi, & Sarstedt, 2011; Pastor, 2010). In relation to the application explored in this article (i.e., finding outlier samples for interview), the chosen variables are among the variables that have been considered in the quantitative part of the study. There-fore, the researcher only needs to check the correlation between clustering variables to ensure that they do not have a correlation around 0.9. In this case, factor analy-sis can be an option to reduce the number of variables before conducting cluster analysis (Mooi, & Sarstedt, 2011). If checking for high collinearity has not been considered, variables which are highly correlated will affect the clustering. This will happen by overpowering on the cluster solution (Bennett, 1975; Pastor, 2010). For instance, if clustering is performed based on three variables (i.e., mathematics attitude, beliefs, and anxi-ety), mathematics attitude and belief will have a greater impact on the final solution since these two variables are highly correlated.
The number of clustering variables also affects the minimum sample size of the study (Formann, 1984). Formann (1984) suggested a minimum of sam-ples for a data set, where “ ” shows the number of clustering variables. For instance, if a data set includes 100 observations (e.g., students), cluster analysis can be performed on at most 6 variables (since
.
The final concern in this section is related to vari-ables with the same value for the entire sample. To be more specific, if the majority of the sample responds to a questionnaire/test in the same manner, the variable should not be considered since it can not be a useful discriminator (Bennett, 1975; Pastor, 2010).
For instance, if students in a study respond to a ques-tionnaire about mathematics anxiety on a five likert scale (e.g., Ferguson, 1986), choose 4 or 5 for each question, then the whole sample have high mathematics anxiety; therefore, this variable is not a useful discrimi-nator. For checking this issue, it is suggested to draw a frequency table for each question in the questionnaire that was used in the quantitative section before choos-ing the variable for clustering. On the other hand, if the clustering variable is indicated by responding to a test, then the participants should have different performanc-es on it. For instance, if participants took a mathematics test as part of the data collection, all of them should not get the same result in the exam. Checking the range or frequency table can be an option in this case if the researcher wants to consider the mathematical perfor-mance as a clustering variable.
Deciding Clustering Procedure
The second step in cluster analysis is deciding the clustering procedure which shows how the researcher is interested in forming the clusters (Mooi, & Sarstedt, 2011) and it may be chosen based on the intention of clustering (e.g., finding outliers, creating clusters with almost equal observations in each).
There are two main procedures for performing cluster analysis: hard (crisp), where each observation belongs to one cluster, and fuzzy, where each observation be-longs to more than one cluster (Hosseini, 2013). Ap-plications of cluster analysis for educational research were explored in hard clustering (e.g., Boronico, & Choksi, 2012; Yukselturk, & Top, 2013). Within hard clustering, there are three main procedures which are hierarchical, partition, and density-based clustering (for more information see Everitt, Landau, Leese, & Stahl, 2011; Kaufman, & Rousseeuw, 2005). Among these, the algorithm which is suitable for finding outlier data belongs to hierarchical clustering.
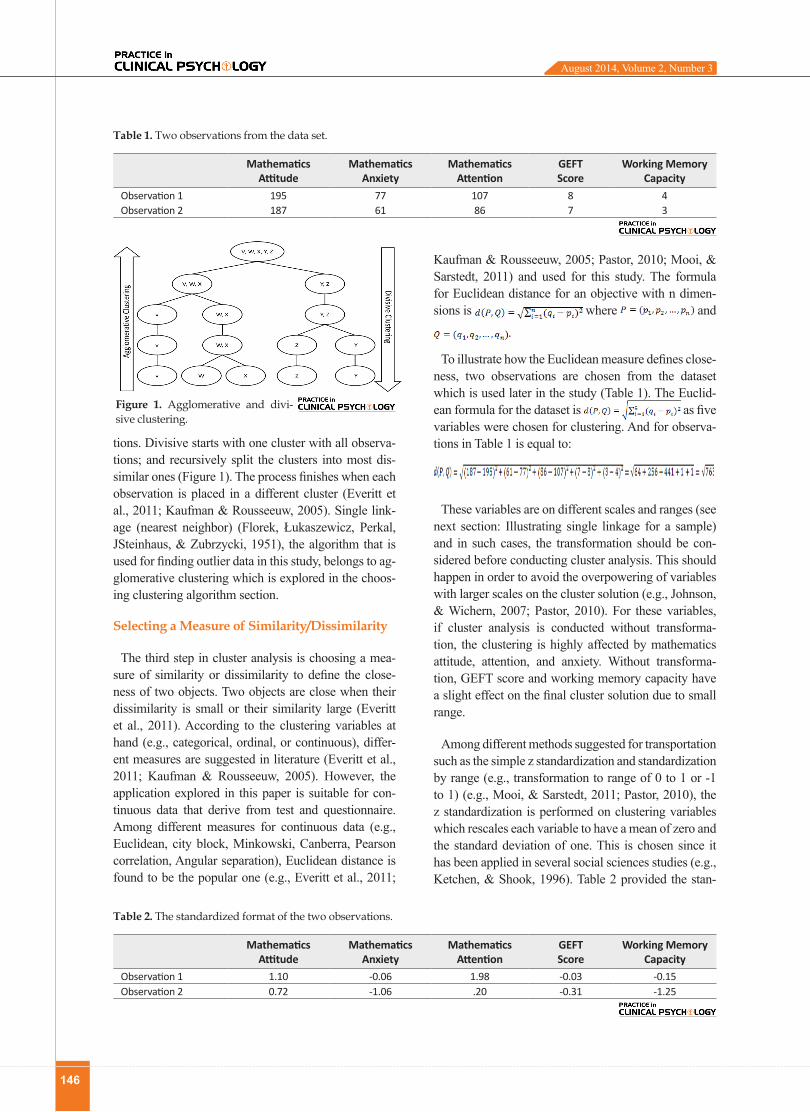
Hierarchical clustering is divided into two main groups: agglomerate and divisive. Agglomerative starts with each observation as a separate cluster; and in a stepwise procedure, the most similar clusters merge together, ending with one cluster with all the observa-
August 2014, Volume 2, Number 3
146
tions. Divisive starts with one cluster with all observa-tions; and recursively split the clusters into most dis-similar ones (Figure 1). The process finishes when each observation is placed in a different cluster (Everitt et al., 2011; Kaufman & Rousseeuw, 2005). Single link-age (nearest neighbor) (Florek, Łukaszewicz, Perkal, JSteinhaus, & Zubrzycki, 1951), the algorithm that is used for finding outlier data in this study, belongs to ag-glomerative clustering which is explored in the choos-ing clustering algorithm section.
Selecting a Measure of Similarity/Dissimilarity
The third step in cluster analysis is choosing a mea-sure of similarity or dissimilarity to define the close-ness of two objects. Two objects are close when their dissimilarity is small or their similarity large (Everitt et al., 2011). According to the clustering variables at hand (e.g., categorical, ordinal, or continuous), differ-ent measures are suggested in literature (Everitt et al., 2011; Kaufman & Rousseeuw, 2005). However, the application explored in this paper is suitable for con-tinuous data that derive from test and questionnaire. Among different measures for continuous data (e.g., Euclidean, city block, Minkowski, Canberra, Pearson correlation, Angular separation), Euclidean distance is found to be the popular one (e.g., Everitt et al., 2011;
Kaufman & Rousseeuw, 2005; Pastor, 2010; Mooi, & Sarstedt, 2011) and used for this study. The formula for Euclidean distance for an objective with n dimen-sions is where and
.
To illustrate how the Euclidean measure defines close-ness, two observations are chosen from the dataset which is used later in the study (Table 1). The Euclid-ean formula for the dataset is as five variables were chosen for clustering. And for observa-tions in Table 1 is equal to:
These variables are on different scales and ranges (see next section: Illustrating single linkage for a sample) and in such cases, the transformation should be con-sidered before conducting cluster analysis. This should happen in order to avoid the overpowering of variables with larger scales on the cluster solution (e.g., Johnson, & Wichern, 2007; Pastor, 2010). For these variables, if cluster analysis is conducted without transforma-tion, the clustering is highly affected by mathematics attitude, attention, and anxiety. Without transforma-tion, GEFT score and working memory capacity have a slight effect on the final cluster solution due to small range.
Among different methods suggested for transportation such as the simple z standardization and standardization by range (e.g., transformation to range of 0 to 1 or -1 to 1) (e.g., Mooi, & Sarstedt, 2011; Pastor, 2010), the z standardization is performed on clustering variables which rescales each variable to have a mean of zero and the standard deviation of one. This is chosen since it has been applied in several social sciences studies (e.g., Ketchen, & Shook, 1996). Table 2 provided the stan-
Figure 1. Agglomerative and divi-sive clustering.
Table 1. Two observations from the data set.
Mathematics Attitude
Mathematics Anxiety
Mathematics Attention
GEFT Score
Working Memory Capacity
Observation 1 195 77 107 8 4Observation 2 187 61 86 7 3
Table 2. The standardized format of the two observations.
Mathematics Attitude
Mathematics Anxiety
Mathematics Attention
GEFT Score
Working Memory Capacity
Observation 1 1.10 -0.06 1.98 -0.03 -0.15Observation 2 0.72 -1.06 .20 -0.31 -1.25
August 2014, Volume 2, Number 3

147
dardized format of the two observations in Table 1. The Euclidean distance for these standardized variables is computed as follows:
.
By comparing and , it can be seen that after
standardization, GEFT score and working memory ca-pacity have equal chance as the other variables to affect the cluster solution.
Choosing Clustering Algorithm
Among different hierarchical clustering algorithms, single linkage (nearest neighbor) (Florek et al., 1951) was chosen to be applied in this article due to its ten-dency to detect outliers (Mooi, & Sarstedt, 2011). In the single linkage algorithm, the distance between the two clusters is defined as the minimum distance between any two observations in the two clusters as shown in
Deciding on the Number of Clusters
Deciding on the number of clusters is an important issue in cluster analysis and affects the knowledge ob-tained from cluster analysis. If lots of clusters are con-sidered, it is hard to interpret them, and having a small number of clusters will reduce the knowledge obtained from cluster analysis. However, instead of focusing on all solutions, researchers usually choose a small manageable number of clusters based on the research question(s) and intentions of cluster analysis. For in-stance, only the solutions ranging from 2 to 7 clusters may be seriously considered (Pastor, 2010).
In hierarchical clustering, the elbow method (Thorn-dike, 1953) that is based on the distance that observa-
tions are combined during cluster analysis is used as a criterion for deciding the number of clusters. For using this method, “Agglomeration schedule” is employed when cluster analysis is done by SPSS software. Then, “steps” and “coefficients” are saved from this table on a spreadsheet program like Microsoft Excel. It is done in order to draw a line chart which has “steps” as x-axis and “coefficient” as y-axis. In this graph, where a dis-tinctive break (elbow) happened, the step is considered and subtracted from the sample of the study. The result is the number of the clusters that are suggested by the elbow standard. For instance, if the elbow happened in the 100th step and 106 observations were in the data set, the number of clusters suggested by this method is six (106-100=6).
Validating and Interpreting the Cluster Solution
Several ways are suggested in literature to validate and interpret the final cluster solution (Everitt et al., 2011; Kaufman, & Rousseeuw, 2005; Mooi, & Sarstedt, 2011; Pastor, 2010). However, only a few of them are useful for this study. For instance, it was suggested to use dif-ferent procedures and algorithms to check the stability of the final cluster solution (Pastor, 2010). But among the well-known algorithms, the single linkage is found to be performed well for recognizing outliers (Mooi, & Sarstedt, 2011). Therefore, checking the results for the other procedures and algorithms are not useful in this case.
Among the different procedures for cluster validation, the followings are recommended to be performed on the data set if the purpose is to find the potential candidates for interview. First of all, it is suggested to split the data-set into half and perform cluster analysis independently on each to evaluate the stability of the cluster analysis solution (e.g., Pastor, 2010). In relation to this study, it is suggested for to find more outliers (i.e., the potential candidates for interview) within a dataset. Moreover, in a hierarchical procedure, it was suggested to reorder the data in the dataset and re-run the cluster analysis to evaluate the stability of the final cluster solution to be regardless of the order of the data in the dataset (Mooi, & Sarstedt, 2011). Regarding the purpose of this study, by doing so, more outliers may be recognized.
In relation to interpreting the final cluster solution in regards to our intention for cluster analysis, the researcher should investigate whether observations which were placed apart from the main cluster, have distinctive characteristics to be interviewed. For in-stance, if cluster analysis is done for mathematics at-
Figure 2. The single linkage pro-cedure for calculating distance be-tween clusters.
August 2014, Volume 2, Number 3

148
titude, anxiety, and attention, the outliers should obtain a high or low score in at least one of these variables to be an interest to be interviewed. Also, if any dependent variable is available in the dataset which is related to clustering variables and research question(s) at hand, the researcher should investigate whether there is any relationship between the clustering variables and the dependent variable for these outliers in relation to lit-erature.
For instance, if students’ mathematical performances were available in the dataset, and also these three clus-tering variables (i.e., mathematics attitude, anxiety, and attention), the researcher should consider the interac-tion between these variables and the mathematical per-formance to find out whether they are consistent with literature or they provide something against the litera-ture. For example, if an outlier has high mathematics anxiety with slightly negative attitude toward mathe-matics and average mathematics attention, the research-er anticipate that this observation has low mathematical performance due to high math anxiety. But if he/she has a good grade in mathematics, the participant is a candidate for interview since it may reveal something that can explore the literature about the psychology of learning mathematics, especially how anxiety affects the students’ mathematical performance.
Illustrating the Single Linkage for a Sample
For illustrating how the single linkage finds outliers, a dataset related to how affective factors (i.e., math anxiety, attention, attitude, working memory capacity, and field dependency) influence students’ mathematical performance is used (Hajibaba, Radmehr, & Alamolho-daei, 2013). The intention is to find the potential candi-dates for interview in terms of these factors to explore their relationships with mathematical performance.
The sample group was consisted of 169 Year 11 high school girl students (aged 17-18) from Iran. From this sample, 112 students answered to all questionnaires and tests; therefore, 112 observations were considered by SPSS for cluster analysis. All the six steps described above are explored for the dataset. In order to famil-iarize researchers who interested in applying cluster analysis for finding potential candidates in their mixed methods studies.
Deciding on Clustering Variables
According to literature, mathematics attitude (e.g., Saha, 2007), attention (e.g., Amani, Alamolhodaei, &
Radmehr, 2011), group embedded figure test (GEFT) score (e.g., Mousavi, Radmehr, & Alamolhodaei, 2012), and working memory capacity (WMC) (e.g., Raghubar, Barnes, & Hecht, 2010) are positively, and mathematics anxiety (e.g., Alamolhodaei, 2009) is negatively related to mathematical performance. There-fore, when a researcher is interested in the psychology of learning mathematics, all of these variables are worth being chosen for clustering and therefore, were used for this study.
In relation to checking for high collinearity, Pearson correlation is conducted since the variables are continu-ous. Results obtained showed that they have moderate significant correlation with each other (-.311 to .346). Therefore, they can be considered for clustering. More-over, since 5 variables are chosen for clustering, the minimum sample should be and this prereq-uisite is also met due to having 112 observations in the sample for clustering.
Finally, as stated, clustering variables should be con-sidered as a discriminator for clustering. Therefore, fre-quency tables were called from SPSS for each question of mathematics attitude, Modified Fennema-Sherman Attitude Scales (Doepken, Lawsky, & Padwa, 2004), attention (mathematics attention test (For more in-formation see Hajibaba, Radmehr, & Alamolhodaei, 2013)), and anxiety questionnaire (Mathematics Anxi-ety Rating scale based on Fergusen, 1986) to check the diversity of responses.
These three questionnaires are on five likert scales and have 47, 25, and 32 questions, respectively. For math-ematics anxiety and attention, all of the choices (1=very little to 5= too much) were chosen by the participants for each question. For mathematics attitude, except the first question, where no one chose “strongly disagree” or “disagree”, all the other choices in the questionnaire were chosen by the participants. Therefore, these three questionnaires can act as a discriminator. Regarding GEFT (Oltman, Raskin, & Witkin, 1971), they had different performances on the test and obtained scores ranging 1 to 20. For WMC (Digit span backward test, for more information see Raghubar et al., 2010), that can be 3 to 7, students had different WMC in this range. Therefore, these variables can be considered as a dis-criminator.
August 2014, Volume 2, Number 3

149
Clustering Procedure, Selecting a Measure of Similarity / Dissimilarity, and Choosing Cluster-ing Algorithm
As noted previously, the purpose of cluster analysis for this study is to find outliers of the sample; therefore, the single linkage within hierarchical clustering was used for this study. Moreover, Euclidean distance was chosen as a measure of dissimilarity since clustering variables are continuous.
Deciding on the Number of Clusters, Validating and Interpreting the Cluster Solution
The single linkage was performed on the standardized variables in the data set with Euclidean distance as a measure of dissimilarity. Figure 3, which is created by Microsoft Excel, provides the coefficients for the final
22 steps. It was done in order to better visualize where the elbow happened. As can be seen in Figure 3, the el-bow occurs in the 105th step and 112 observations were in the data set. Therefore, the number of clusters is sug-gested by the elbow method to be seven (112-105=7).
3. Results
After finding the number of clusters, cluster mem-bership for each observation was saved for k=7 by re-running cluster analysis. Table 3 provides the mean of clustering variables and the mathematical performance for the observations in each cluster. As can be seen in this table, the single linkage creates a cluster with the majority of observations (n=106) and the outliers form 6 other clusters. In the following paragraphs, the cluster solution is interpreted by explaining how these outliers are potential candidates for interview with respect to the psychology of learning mathematics.
The observation in cluster 2 has one of the lowest mathematics anxiety and attention within the sample. This observation also has mathematical performance less than the sample mean and mathematics attitude, WMC, and GEFT score more than the sample mean. According to the participant’s mathematical attitude, anxiety, GEFT score, and WMC, she should be suc-cessful in mathematical exams since, as mentioned above, mathematics attitude, GEFT score, and WMC are positively and mathematics anxiety is negatively related to the mathematical performance. However, the participant’s mathematics attention was among the lowest in the sample; therefore, this fact informs the re-searcher that the participant may suffer from low math-ematics attention, which leads her being unsuccessful on mathematical tests. Interviewing this observation will explore how these factors interact with mathemati-cal performance (especially the role of mathematics at-tention on mathematical performance).
Cluster 3 has a student with the highest score on GEFT and WMC, but, unfortunately, the student’s mathemati-cal performance is below the sample mean. She also has mathematics anxiety and attitude more than sample mean, and mathematics attention less than the sample mean. This information suggests a claim to be inves-
Table 3. Mean of the clustering variables and mathematical performance based on the single linkage (k=7).
Number of Obser-vations in Cluster
Mathematics Anxiety
Mathematics Attention
Mathematics Attitude
GEFT Score WMC Mathematical
Performance
Cluster 1 106 77.47 83.05 171.28 8.06 4.03 43.04Cluster 2 1 40 61 198 14 5 37.50Cluster 3 1 83 72 183 20 7 40.25Cluster 4 1 41 99 191 18 7 54.50Cluster 5 1 69 104 178 10 6 69.50Cluster 6 1 44 108 178 10 6 70.75Cluster 7 1 50 114 230 12 4 73Total sample 112 76.24 83.58 172.51 8.43 4.10 43.91
Figure 3. Line graph for coefficients of the final 22 steps of the single linkage clustering.
August 2014, Volume 2, Number 3

150
tigated in more detail in research in the psychology of learning mathematics and also follow up interviews. It seems that the effects of mathematics anxiety, attention, and attitude to mathematical performance are more than the GEFT score and WMC. This claim is proposed because having the highest WMC and GEFT possible score in these tests cannot adequately help this student to manage her mathematics anxiety which is more than the sample mean and her attention which is less than the sample mean. Furthermore, having a slightly positive attitude toward mathematics is not adequate enough to help this student to be successful in the mathematics test. All these suggest that this observation is a potential candidate to be interviewed with respect to the psychol-ogy of learning mathematics.
The next four clusters are related to students who have a mathematical performance more than the sample mean. For the first one (i.e., cluster 4), all the five fac-tors suggest that this student should have a good math-ematical performance. It is because she has one of the lowest mathematics anxiety of the sample while has mathematics attitude and attention more than the sam-ple mean. Concerning WMC and GEFT score, she has one of the highest scores on GEFT and has the highest possible WMC. Therefore, interviewing her, particu-larly, in terms of mathematics anxiety, GEFT score, and WMC, may explore in more detail how these factors af-fect the students’ mathematical performance.
The observation in the cluster 5 has mathematics at-titude and GEFT score slightly more than, and math-ematics anxiety less than the sample mean, but has one of the highest score on WMC and mathematics atten-tion. Therefore, interviewing her will reveal more about how these factors effects mathematical performance. Comparing observations in the cluster 5 and 6 show how having low mathematics anxiety help students to be successful in mathematical exams. The reason is that these two observations have the same score on GEFT, WMC, and mathematics attitude, while the one in the cluster 6 has one of the lowest anxiety towards math-
ematics that may help her to have better mathematical performance than the student in the cluster 5.
Finally, the student in cluster 7 who has one of the highest scores in the mathematical exam, and a WMC slightly less than the mean, obtained the highest math-ematics attitude and attention in the sample. Also, her anxiety was lower and her GEFT score was more than the sample mean that suggests a good performance in mathematical exams. However, what is more inter-esting about this observation is interviewing her with respect to interaction between mathematics attitude, attention and mathematical performance and how her mathematics attitude and attention help her to have one of the highest mathematical performances while her WMC was almost average.
Regarding the validation of the cluster solution, first, the data was reordered by ascending based on the GEFT score and cluster analysis was rerun (reordering the data can be done by other variables or in different ways). Then, the line chart for coefficients was created and no change was seen in terms of the location of the elbow for the sample. Furthermore, the sample was di-vided into half and cluster analysis was performed for each. The elbow method for each half suggested 6 clus-ters and the single linkage created one cluster with most of the observation in it and the other five clusters had one observation in each.
Among the 10 outliers (i.e., 5 from each), five were the same as outliers suggested by the single linkage when cluster analysis was employed for the entire sam-ple. For one, the math performance was not available, so, it was not possible to interpret it in terms of the rela-tionship between clustering variables and mathematical performances and the rest is provided in Table 4. These two procedures show the stability for the single link-age in terms of finding outliers. Because reordering the data does not affect the cluster solution, and the outliers that is suggested for the whole sample, is also suggested when the sample divided into half.
Table 4. Clustering variables and mathematical performance for 4 new outliers found by dividing sample to half.
MathematicsAnxiety
Mathematics Attention
Mathematics Attitude GEFT Score WMC Mathematical
Performance
Outlier 1 77 90 177 15 6 43.25
Outlier 2 72 88 198 2 5 54.25
Outlier 3 69 104 186 16 3 69.5
Outlier 4 46 82 185 14 6 75.5
August 2014, Volume 2, Number 3

151
The first outlier has a mathematical performance less than the sample mean, while having one of the highest WMC and obtained GEFT score more than the sample mean. Besides, her mathematics anxiety, attitude, and attention were slightly more than the sample mean. So, these suggest that researchers should investigate in more detail why this student can not use these abilities (i.e., having high GEFT score and WMC) to have well performance in the mathematics exam. This should be investigated because the student does not suffer a lot from mathematics anxiety since it is just slightly more than the mean, and also has an acceptable amount of attention and attitude toward mathematics. Therefore, in terms of these five factors, if interviews being fol-lowed up for this sample, it should be more focused on investigating why the student can not use her abilities to perform well in mathematics.
The next three outliers have mathematical perfor-mance more than the sample mean. The second one has low mathematics anxiety and GEFT score, and math-ematics attitude, attention, and WMC more than the sample mean. What is more interesting about this out-lier is its GEFT score which is among the lowest in the sample. This should be explored in more details how it influences her mathematical performance.
The third outlier has low mathematics anxiety and WMC, and mathematics attitude, attention, GEFT score more than the sample mean. While this observation is suffering from low WMC, it seems that her attention toward mathematics, which was the third rank in the sample, helped her to be successful in the mathematical exam. Investigating the relationship between attention and WMC and their interaction with mathematical per-formance for this sample could be an interest for re-searchers in the psychology of learning mathematics. Because attention and WMC are closely related to each other (e.g., Cowan et al., 2005) and the relationship be-tween mathematics attention and mathematical perfor-mance is not explored well in literature.
Finally, the last outlier has the highest mathematical performance in the sample. It is not a surprise since this participant has low mathematics anxiety, and math-ematics attitude, GEFT score, and WMC more than the sample mean. The only issue is that this student has a mathematics attention slightly less than the sample mean that can be explored in follow up interviews. Moreover, since this observation obtained the highest results in the mathematics exam, interviewing this ob-servation could be an interest to explore how these fac-tors influence her performance.
4. Conclusion
This paper explored one of the applications of cluster analysis for mixed methods studies in social sciences research which is finding outlier for follow up inter-views. For this purpose, the steps that the researcher should take into account in cluster analysis for finding outliers are addressed in this paper and illustrated by a sample dataset related to the psychology of learning mathematics. Furthermore, how the cluster solution should be interpreted and validated is mentioned and illustrated by the sample. The results of the single link-age for cluster analysis were consistent with previous studies suggesting this algorithm is useful for finding outliers within the sample (Mooi, & Sarstedt, 2011). The authors encourage researchers to use this method because the single linkage finds outliers by considering different variables, while the traditional methods have limitations such as finding outliers with respect to only one variable.
Acknowledgement
The authors would like to express their sincere grati-tude and appreciation to Mrs. Maryam Hajibaba for sharing her Master thesis database for this project and also Mr. Danial Sadeqi for his useful comments on the initial draft of this paper.
References
Alamolhodaei, H. (2009). A working memory model applied to mathematical word problem solving. Asia Pacific Educa-tion Review, 10(2), 183-192.
Amani, A., Alamolhodaei, H., & Radmehr, F. (2011). A gender study on predictive factors of mathematical performance of University students. Educational Research, 2(6), 1179–1192.
Bennett, N. (1975). Cluster analysis in educational research: a non-statistical introduction. Research Intelligence, 1(1), 64-70.
Boronico, J., & Choksi, S. S. (2012). Identifying peer institu-tions using cluster analysis. American Journal of Business Education (AJBE), 5(3), 233-244.
Brock, G., Pihur, S., Datta, S., & Datta, S. (2008). ClValid: an R package for cluster validation. Journal of Statistical Soft-ware, 25(4), 1-22.
Chakrapani, C. (2004). Statistics in Market Research. Arnold, London.
Cowan, N., Elliott, E. M., Saults, J. S., Morey, C. C., Mattox, S., Hismjatullina, A., & Conway, A. R. A. (2005). On the capacity of attention: Its estimation and its role in working memory and cognitive aptitudes. Cognitive Psychology, 51, 42-100.
August 2014, Volume 2, Number 3

152
Chignell, M. H., & Stacey, B. G. (1981). The classification of pa-tients into diagnostic groups using cluster analysis. Journal of Clinical Psychology, 37(1), 151-153.
Clatworthy, J., Buick, D., Hankins, M., Weinman, J., & Horne, R. (2005). The use and reporting of cluster analysis in health psychology: A review. British Journal of Health Psychol-ogy, 10(3), 329-358.
Doepken, D., Lawsky, E., & Padwa, L. (2004). Modified fenne-ma-sherman attitude scales. Retrieved from http://www.woodrow.org/teachers/math/gender/08scale.html.
Ferguson, R.D. (1986). Abstraction anxiety: A factor of math-ematics anxiety. Journal for Research in Mathematics Edu-cation, 17(145), 145-150.
Everitt, B. S., Landau, S., Leese, M., & Stahl, D. (2011). Cluster Analysis (5th ed). Wiley Series in Probability and Statistics.
Formann, A. K. (1984). Die Latent-Class-Analyse: Einführung in Theorie und Anwendung. Beltz.
Florek, K., Łukaszewicz, J., Perkal, J., Steinhaus, H., & Zubrzy-cki, S. (1951). Sur la liaison et la division des points d’un en-semble fini. Colloquium Mathematicae ,2, No. 3-4, 282-285.
Hajibaba, M., Radmehr, F., & Alamolhodaei, H. (2013).A psy-chological model for mathematical problem solving based on revised Bloom taxonomy for high school girl students. Journal of the Korean Society of Mathematical Education Series D: Research in Mathematical Education. Vol. 17, No. 3, 199–220.
Hillhouse, J. J., & Adler, C. M. (1997). Investigating stress effect patterns in hospital staff nurses: results of a cluster analysis. Social Science & Medicine, 45(12), 1781-1788.
Hosseini, R. (2013). Topics in data mining (Master’s thesis, Ferdowsi University of Mashhad, Mashhad, Iran).
Kaufman, L., & Rousseeuw, P. J. (2005). Finding groups in data: An introduction to cluster analysis. Hoboken, NJ: Wiley.
Ketchen, D. J., & Shook, C. L. (1996). The application of cluster analysis in strategic management research: an analysis and critique. Strategic Management Journal, 17(6), 441-458.
Maloney, E. A., Risko, E. F., Ansari, D., & Fugelsang, J. (2010). Mathematics anxiety affects counting but not subitizing during visual enumeration. Cognition, 114(2), 293-297.
Mason, J. (2002). Qualitative researching (2nd end). London: Sage.
Mousavi, S., Radmehr, F., & Alamolhodaei, H. (2012). The role of mathematical homework and prior knowledge on the re-lationship between students’ mathematical performance, cognitive style and working memory capacity. Electronic Journal of Research in Educational Psychology, 10(3), 1223-48.
Mooi, E., & Sarstedt, M. (2011). A concise guide to market research: The process, data, and methods using IBM SPSS statistics. Springer.
Oltman, P. K., Raskin, E., & Witkin, H. A. (1971). A manual for the embedded figures test. Palo Alto, CA: Consulting Psychologists Press, Inc.
Parke, C. S. (2012). Essential First Steps to Data Analysis: Sce-nario-based Examples Using SPSS. Sage.
Pastor, D. A. (2010). Cluster Analysis. In G. R. Hancock & R. O. Mueller (Eds.). The reviewer’s guide to quantitative methods in the social sciences. (pp.41-54). Routledge.
Raghubar, K. P., Barnes, M. A., & Hecht, S. A.(2010). Work-ing memory and mathematics: A review of developmental, individual difference, and cognitive approaches. Learning and Individual Differences, 20(2), 110–122.
Robinson, O. C. (2014). Sampling in Interview-Based Qualita-tive Research: A Theoretical and Practical Guide. Qualita-tive Research in Psychology, 11(1), 25-41.
Saha, S. (2007). A study of Gender Attitude to Mathematics, Cognitive style and Achievement in mathematics. Experi-ments in Education, 35, 61–67.
Sampogna, F., Sera, F., & Abeni, D. (2004). Measures of clini-cal severity, quality of life, and psychological distress in pa-tients with psoriasis: a cluster analysis. Journal of Investiga-tive Dermatology, 122(3), 602-607.
Selinski, S. and Ickstadt, K. (2008) Cluster analysis of genetic and epidemiological data in molecular epidemiology. Jour-nal of Toxicology and Environmental Health, 71, 835–844.
Shavelson, R. J. (1979). Applications of cluster analysis in edu-cational research: looking for a needle in a haystack. British Educational Research Journal, 5(1), 45-53.
Sutton, M. Q., & Reinhard, K. J. (1995). Cluster analysis of the coprolites from Antelope House: implications for Anasazi diet and cuisine. Journal of Archaeological Science, 22(6), 741-750.
Teddlie, C., & Yu, F. (2007). Mixed methods sampling a typol-ogy with examples. Journal of Mixed Methods Research, 1(1), 77-100.
Thorndike, R. L. (1953). Who belongs in the family?. Psycho-metrika, 18(4), 267-276.
Yukselturk, E., & Top, E. (2013). Exploring the link among en-try characteristics, participation behaviors and course out-comes of online learners: An examination of learner profile using cluster analysis. British Journal of Educational Tech-nology, 44(5),716–728.
August 2014, Volume 2, Number 3