Who feeds bristol report
140
Who feeds Bristol? Towards a resilient food plan Research report written by Joy Carey A baseline study of the food system that serves Bristol and the Bristol city region March 2011 Production • Processing • Distribution • Communities • Retail • Catering • Waste
-
Upload
daniel-scienfan -
Category
Economy & Finance
-
view
85 -
download
0
Transcript of Who feeds bristol report

Who feeds Bristol?Towards a resilient food plan
Research report written by Joy Carey
A baseline study of the food system thatserves Bristol and the Bristol city regionMarch 2011
Production • Processing • Distribution • Communities • Retail • Catering • Waste

ForewordFor over a thousand years, the supply and trade of food has been integral to the economic, socialand cultural life of Bristol. During my career in public health I have always been aware not just ofthe paramount importance of food, but also of the contrasts and paradoxes it brings; fromdesperate shortage in refugee camps and conflict zones, to the plenty and variety in wealthycapital cities, the intense visibility of food in parts of the world like Africa and India, and of courseits curious invisibility in the UK now that highly mechanised production, distribution, processingand retail operate beyond our everyday view.
Bristol is regaining its awareness of food – for the health of our local economy, for the health of ourpeople, and for the health of the ecosystems upon which our future food production will depend.We read dire predictions of potential global food shortages, and conflicting reports as to whetherthese problems are real or imagined, and whether the solution lies with more biotechnology orwith less. Yet we cannot begin to assess whether our own food system is healthy and robust unlesswe know more about it.
The task of tracking down and making sense of what information is available has not been easy. Weare indebted to Joy Carey, who in a short time and with a very modest amount of funding, haspulled together information from numerous sources and pieced it all together into this importantresearch report.
At the same time, work has been progressing behind the scenes to establish Bristol’s new FoodPolicy Council. This will be a small group of committed individuals with expertise and localexperience relating to food production, preparation, distribution and retail. Under thechairmanship of Professor Kevin Morgan from Cardiff University, the Food Policy Council will driveforward the changes needed to make Bristol a city where eating and celebrating good foodbecomes something that everyone is proud to be part of.
We already know this is what people in Bristol want. In a survey conducted in late 2010, our ownCitizen’s Panel tells us that the majority of ordinary people in Bristol care about the quality and theingredients in the food they eat, and a very significant proportion are concerned about productionmethods, local farming, and animal welfare. Over a third of respondents said they are involved infood growing in gardens or allotments, and half had switched to healthier ways of eating in theprevious year.
The Bristol city region has not yet lost its diversity of independent local producers, wholesalers,processors, caterers and shopkeepers. With the right mechanisms and with the growing publicinterest in the future of food, we can start to rebuild a food culture for Bristol that has the health ofpeople and planet at its heart.
Dr Hugh AnnettBristol Director of Public Health
Bristol City Council and NHS Bristoli

Foreword i
Executive summary 1 – 5
1. Introduction 6
2. Context 7 – 11
3. Research approach 12 – 13
4. The food businesses: 14 – 18Who feeds Bristol and the city region?
5. Retail: 19 – 31Where do residents in Bristol and the city region buy food?
6. Wholesale & distribution: 32 – 41Who supplies food to the businesses which sell to us?
7. Production: 42 – 50Which staple foods are produced in the South West region?
8. Local food supply: 51 – 67How much food comes from within a 50 mile radius?
9. Catering: 68 – 77Which companies prepare and cook our food for us?
10. Processing: 78 – 83Which companies prepare and cook the food we buy from shops or when we eat out?
11. Waste: 84 – 89What happens to food waste in Bristol?
12. Community food-related activity: 90 – 102Does bristol have the skills to cook and to grow food?
13. How can we assess the resilience of Bristol’s current food system?103 – 108
14. What are the city’s positive food planning powers? 109 – 115
15. What are the specific strengths and vulnerabilities in Bristol? 116 – 123
16. Suggestions for action 124 – 127
Glossary 128 - 134
Contributors 135 - 136
Appendices and full case studies (see separate ‘Who Feeds Bristol?: appendices and case studies’ atwww.bristol.gov.uk/whofeedsbristol)
The full report and appendices are available at www.bristol.gov.uk/whofeedsbristol
We are happy for the information in this report to be shared provided that appropriateacknowledgements are made. Please contact the author Joy Carey to discuss [email protected]
Contents
ii

Executive summary
The need to look at the food system for Bristol was identified as a priority by Bristol’s ‘Green CapitalMomentum Group’ in late 2009 following the production of Bristol’s Peak Oil Report(1) . The ‘WhoFeeds Bristol?’ research was designed to take the issues raised in the Peak Oil report and to explorethe characteristics of the current food system in more depth.
The work of researching and preparing the ‘Who Feeds Bristol?’ report was commissioned andfunded by NHS Bristol, and designed and conducted by Joy Carey. A multidisciplinary AdvisoryGroup provided advice and guidance, and met on seven occasions.
The report is primarily a descriptive analysis of the food system serving Bristol. In addition, thereport gives some global context, and in later chapters there is a discussion of resilience in relationto inputs, outputs and threats. It includes an analysis of the positive powers that Cities have inshaping their food system, and it makes suggestions for action.
Much of the information used in this report came from national, regional and local data designedfor purposes other than for understanding food supplies. It included marketing information,regulatory information on food standards and food businesses, and data held by Defra. Someinformation was from surveys and interviews conducted exclusively for this report.
The lack of specific information about food supplies inevitably means that some conclusions werederived as best estimates drawing on data from a number of different sources. Explanations ofsources, the basis of essential assumptions, and of the limitations of the data are containedthroughout the report, and in the appendices.
Bristol’s food system is inextricably linked, now and in the future, with that of the wider region andthe rest of the nation. This report looks at the national picture, the South West region and in detailat the area known as the West of England, comprising the four Local Authorities of Bath & NorthEast Somerset, Bristol, North Somerset, and South Gloucestershire. In food planning terms this canbe described as a ‘city bioregion’.
The report confined its analysis to staple food items namely meat, dairy, eggs, fruit, vegetables,cereals, grains and bread. The report did not look at luxury items (confectionary and chocolate), oralcohol, and nor did it look at fish.
How did the report come about and what is its scope?
What are the main findings in relation to the foodsystem serving Bristol?
The UK imports 40% of its annual food requirements. The percentage ofimports varies widely between food types, with 90% of fruit, and 60% ofvegetables being imported. Alongside the fruit and vegetables weimport poultry, beef, cereals, and animal feed.
The South West of England is a major producer of livestock, accountingfor 23% of England’s cattle and sheep, with 90% being sold to thesupermarket trade. The suitability of the land for pasture combined with
Production
Source:1. Osborn S. Building a Positive Future for Bristol after Peak Oil. Bristol Partnership. October 2009
http://www.bristol.gov.uk/ccm/content/Environment-Planning/sustainability/file-storage-items/peak-oil-report.en Accessed 26 May 20101
Exec
utive
summary

2
Garden food growing and allotments are a centuries-old tradition, bothin Bristol and in England as a whole. They fell from fashion in recentdecades but are now returning to favour. Food growing within the Citycan be educational, health enhancing and recreational.
An estimated 2,000 hectares of land in Bristol could potentially be usedfor food growing. This includes existing farmland and smallholdings,allotments, a proportion of council-owned empty land, a proportion ofland within school grounds and private gardens and 20% of parks andgreen spaces if this could be made available. It excludes other privately
owned land, although there is potential here also.
Potentially these 2,000 hectares if used for food growing in the City could produce severalthousands tonnes of produce, with a cash value of several million pounds, in addition to theeducational and recreational benefits.
the presence of numerous large and small abattoirs, means that it is still possible for smaller-scalelivestock farmers to survive economically despite the increasing market difficulties associated withthe major consolidation that has occurred in the food business sector. Lack of infrastructure forlocal distribution is a barrier to increasing direct sales to independent local retailers, to households,and to local restaurants and caterers.
There are some 5,500 dairy farms in the South West that produce 37% of England’s milk, channelledthrough three large national dairy processors – Milk Link, Dairy Crest, and Wisemans. The region ishome to Yeo Valley, which is the national retail market leader for organic yoghurt.
The South West has the greatest concentration of organic producers of anywhere in the UK, andcontains 38% of England’s organic producers. In the UK as a whole 17.5 million hectares is farmedorganically equivalent to 4.2% of UK farmland. Over 10% of this land (1.9 million hectares) is in theSouth West.
Vegetable production in the South West makes up around 6% of Great Britain’s production. Themain crops produced in the region are potatoes, cauliflower, swedes, brassicas, carrots, parsnipsand celeriac. There is some production of cider apples and soft fruit, but less than there was fiftyyears ago. Cereal production in the South West is mainly used for livestock feed because theclimate is too damp and cool for producing wheat of the quality required for bread flour.
The area of land needed to supply the City of Bristol with food extends well across the sub regionand into Wales. Variations in topography and climate mean some areas are better for pasture,others for arable, so it is essential to look at national as well as regional patterns of production.Meat and dairy are two staples where the production within a fifty-mile radius of Bristol is sufficientto meet the needs of the City.
Estimates by Simon Fairlie (2), and by Geofutures(3), suggest that the UK could be self-sufficient inbasic foodstuffs whilst still maintaining soil health and biodiversity. Estimates of the agriculturalland area needed vary according to assumptions made about the model of production, forexample meat or vegan, organic, chemical or permaculture, with or without crops for fuel andtextiles. The estimates vary from between 0.2 hectares to 0.5 hectares per person.
Food growing in the City
Sources:2. Fairlie S. Can Britain Feed Itself? The Land 4 Winter 2007-8 p18-26 http://transitionculture.org/wp-content/uploads/2007/CanBritain.pdf
(accessed Feb 2011).3. Geofutures GIS tools. Food footprints: re-localising UK food supply July 2009 http://www.geofutures.com/2009/07/food-fooprints-re-localising-
uk-food-supply/ (Accessed Feb 2011)
Executive su
mmary

The food processors and manufacturers are an essential part of the foodsystem. They are the sector that often has the least transparent foodsourcing and often uses cheap imports. These businesses supply tomost of the ‘eat-out’ kinds of caterers, including pubs and restaurantsalong with smaller retailers selling cheaper products. Meatmanufacturers are the largest single category of food manufacturers inthe city region. In the meat sector they ensure that meat is not wastedby using all parts of an animal carcass (eg to make pies, sausages etc).Bristol city region has good access to a network of processing facilities
including a number of smaller scale abattoirs that provide a crucial link in the supply of locallyproduced meat. Retaining an infrastructure of skilled food processing professionals including localbakers and butchers who can provide high quality services will form an important part of a resilientfood system.
The Wholesale Fruit Centre in St Philips Bristol operates a wholesale fruitand vegetable market serving an area stretching from Fishguard toPortsmouth, and from Penzance to beyond Oxford. It serves virtuallythe entire independent greengrocery sector across the South West andSouth Wales and employs some 500 people locally.
The scale of the operation at St Philips is declining year by year dueprimarily to knock-on impacts arising from ‘in-house’ distributionnetworks controlled by a small number of multiple chain supermarkets.These include reduced market diversity, and distortion of competition (4).
If the St Philips wholesale market were to collapse, this would cause significant loss of local jobsand would cause a domino effect for thousands of producers throughout the South West andfurther afield, and for hundreds of caterers and independent retailers. Without Bristol, the nextclosest markets are Western International Market just outside London near Heathrow, or Birmingham.
Several factors could ensure the future of the wholesale centre. These include a stronger link withBristol’s public sector catering establishments, establishment of a consolidated and co-operativetransport infrastructure, stronger links with catering training establishments, and stronger linkswith the expanding network of local farmers markets and with forward-looking food businesses.
The pattern of food shops in Bristol has changed significantly in the pastfew decades. It used to consist of independent high street grocers,butchers, bakeries, greengrocers, and off-licenses, together with localcorner shops. Most shopping was done on foot, or with home deliveries.Prices were consistent from store to store, and no premium was chargedfor buying smaller quantities. This pattern has largely been replaced bylarge multiple chain stores selling food and non-food goods, andaccessed by motorised vehicles.
There are some 70 supermarket outlets in Bristol. These make up 1.5% of Bristol’s food businesses,yet they account for the vast majority of food shopping by Bristol residents. Nationally, 75% of food
Wholesale and distribution
Retail
Processing
Source:4. Competition Commission October 2000. Supermarkets: A report on the supply of groceries from multiple stores in the United Kingdom.
http://www.competition-commission.org.uk/rep_pub/reports/2000/446super.htm (accessed Feb 2011) 3
Exec
utive
summary

retail is controlled by four companies, collectively known as ‘the Big Four’(5). In the early 1990s themarket share for these four companies was 50%. The four are Tesco, Morrisons, Asda, andSainsbury’s, and in Bristol they own approximately 32 of the supermarket stores. Tesco has shownconsiderable expansion nationally and it is now estimated that one in every three pounds spend ongroceries is spent in a Tesco store. There is evidence that the greater Bristol area has a higherconcentration of Tesco stores than other comparable English Cities and their surrounding areas.
Traditional independent greengrocers have disappeared from many of Bristol’s local shoppingcentres. Westbury on Trym still has four registered greengrocers, whilst some parts of the City suchas Brislington, Filwood and Lockleaze have none. In general it is the more deprived parts of the citythat have the least choice of food shops.
It is commonplace for supermarkets to offer low prices on ‘Known Value Items’ such as milk andbread. Prices for other goods, particularly fresh vegetables, smaller packs, and items sold in smalllocal supermarkets, can be more expensive than in independent shops. This has an impactparticularly for elderly and vulnerable members of the community, who may live alone and needsmall quantities, and who may not have access to a car or may be too frail to drive. The impact iscompounded in bad weather.
Supermarket sales data show that within their sales, purchase of ‘cooking from scratch’ freshingredients is declining, and that there is a relationship with customer age. Older customers buymore fresh ingredients, whereas younger customers buy more ready meals.
Bristol, in common with the rest of the UK, is seeing a consistent and serious rise in the percentageof people, including children, who are overweight and obese. This is related to the food systemboth through car-dependant shopping habits, and through the shift in cultural patterns of eatingwith heavy promotion and availability of calorie-dense foods(6).
The current system of food production, distribution and retail results insome 40% of food being wasted, either before being sold, or withinhouseholds, restaurants and caterers.
At the St Philips Wholesale market, significant quantities of fit-to-eatproduce have to be sent to landfill, partly because of Defra standards onsize, shape and appearance.
Waste
Sources:5. Welch D. Endless choice or limitless damage? We name the greenest supermarkets. Ethical Consumer 128 Jan/Feb 2011 6. Kessler D. A, The end of overeating: taking control of our insatiable appetite. Penguin Books 2009. ISBN 978-0-141-04781-2
There are over 2,000 food catering businesses dealing with staple foodsregistered in Bristol. Many of these are small and medium sizedenterprises offering home catering, or running small cafes or takeaways.
Around 25% of the catering businesses are institutional caterers for thehealth and education sectors. These businesses will be preparing andserving a significant number of meals in hospitals, care homes, schools,and colleges. A further 24% are serving businesses and work canteens.Many of these catering companies depend on the St Philips wholesalemarket for their fruit and vegetable supply.
The other major section of catering companies comprises the many hundreds of restaurants, pubsand other businesses in Bristol’s diverse ‘eating out’ sector.
Catering
4
Executive su
mmary
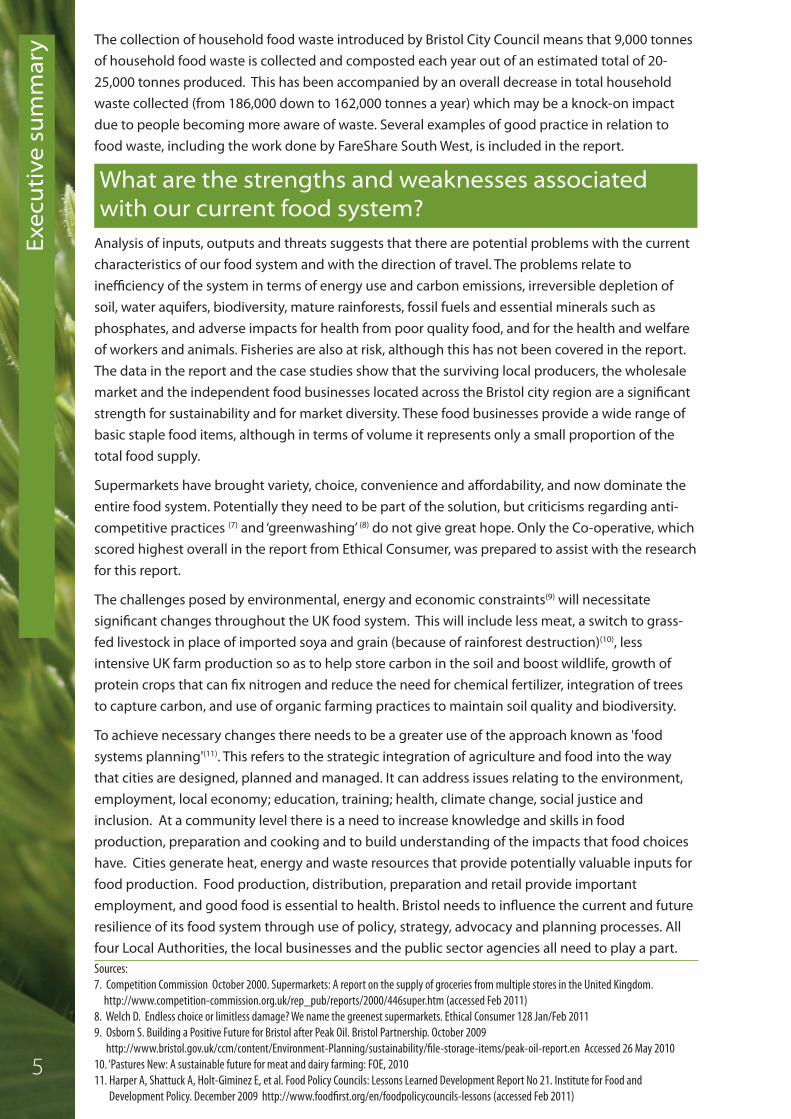
What are the strengths and weaknesses associatedwith our current food system?
Analysis of inputs, outputs and threats suggests that there are potential problems with the currentcharacteristics of our food system and with the direction of travel. The problems relate toinefficiency of the system in terms of energy use and carbon emissions, irreversible depletion ofsoil, water aquifers, biodiversity, mature rainforests, fossil fuels and essential minerals such asphosphates, and adverse impacts for health from poor quality food, and for the health and welfareof workers and animals. Fisheries are also at risk, although this has not been covered in the report. The data in the report and the case studies show that the surviving local producers, the wholesalemarket and the independent food businesses located across the Bristol city region are a significantstrength for sustainability and for market diversity. These food businesses provide a wide range ofbasic staple food items, although in terms of volume it represents only a small proportion of thetotal food supply.
Supermarkets have brought variety, choice, convenience and affordability, and now dominate theentire food system. Potentially they need to be part of the solution, but criticisms regarding anti-competitive practices (7) and ‘greenwashing’ (8) do not give great hope. Only the Co-operative, whichscored highest overall in the report from Ethical Consumer, was prepared to assist with the researchfor this report.
The challenges posed by environmental, energy and economic constraints(9) will necessitatesignificant changes throughout the UK food system. This will include less meat, a switch to grass-fed livestock in place of imported soya and grain (because of rainforest destruction)(10), lessintensive UK farm production so as to help store carbon in the soil and boost wildlife, growth ofprotein crops that can fix nitrogen and reduce the need for chemical fertilizer, integration of treesto capture carbon, and use of organic farming practices to maintain soil quality and biodiversity.
To achieve necessary changes there needs to be a greater use of the approach known as 'foodsystems planning'(11). This refers to the strategic integration of agriculture and food into the waythat cities are designed, planned and managed. It can address issues relating to the environment,employment, local economy; education, training; health, climate change, social justice andinclusion. At a community level there is a need to increase knowledge and skills in foodproduction, preparation and cooking and to build understanding of the impacts that food choiceshave. Cities generate heat, energy and waste resources that provide potentially valuable inputs forfood production. Food production, distribution, preparation and retail provide importantemployment, and good food is essential to health. Bristol needs to influence the current and futureresilience of its food system through use of policy, strategy, advocacy and planning processes. Allfour Local Authorities, the local businesses and the public sector agencies all need to play a part.
The collection of household food waste introduced by Bristol City Council means that 9,000 tonnesof household food waste is collected and composted each year out of an estimated total of 20-25,000 tonnes produced. This has been accompanied by an overall decrease in total householdwaste collected (from 186,000 down to 162,000 tonnes a year) which may be a knock-on impactdue to people becoming more aware of waste. Several examples of good practice in relation tofood waste, including the work done by FareShare South West, is included in the report.
Sources:7. Competition Commission October 2000. Supermarkets: A report on the supply of groceries from multiple stores in the United Kingdom.
http://www.competition-commission.org.uk/rep_pub/reports/2000/446super.htm (accessed Feb 2011) 8. Welch D. Endless choice or limitless damage? We name the greenest supermarkets. Ethical Consumer 128 Jan/Feb 2011 9. Osborn S. Building a Positive Future for Bristol after Peak Oil. Bristol Partnership. October 2009
http://www.bristol.gov.uk/ccm/content/Environment-Planning/sustainability/file-storage-items/peak-oil-report.en Accessed 26 May 201010. ‘Pastures New: A sustainable future for meat and dairy farming: FOE, 201011. Harper A, Shattuck A, Holt-Giminez E, et al. Food Policy Councils: Lessons Learned Development Report No 21. Institute for Food and
Development Policy. December 2009 http://www.foodfirst.org/en/foodpolicycouncils-lessons (accessed Feb 2011)
5
Exec
utive
summary
1. Introduction
‘Resilience is ... the ability of a system or organisation to withstand and recover
from adversity’
(Sir Michael Pitt, UK Cabinet Office, 2007).
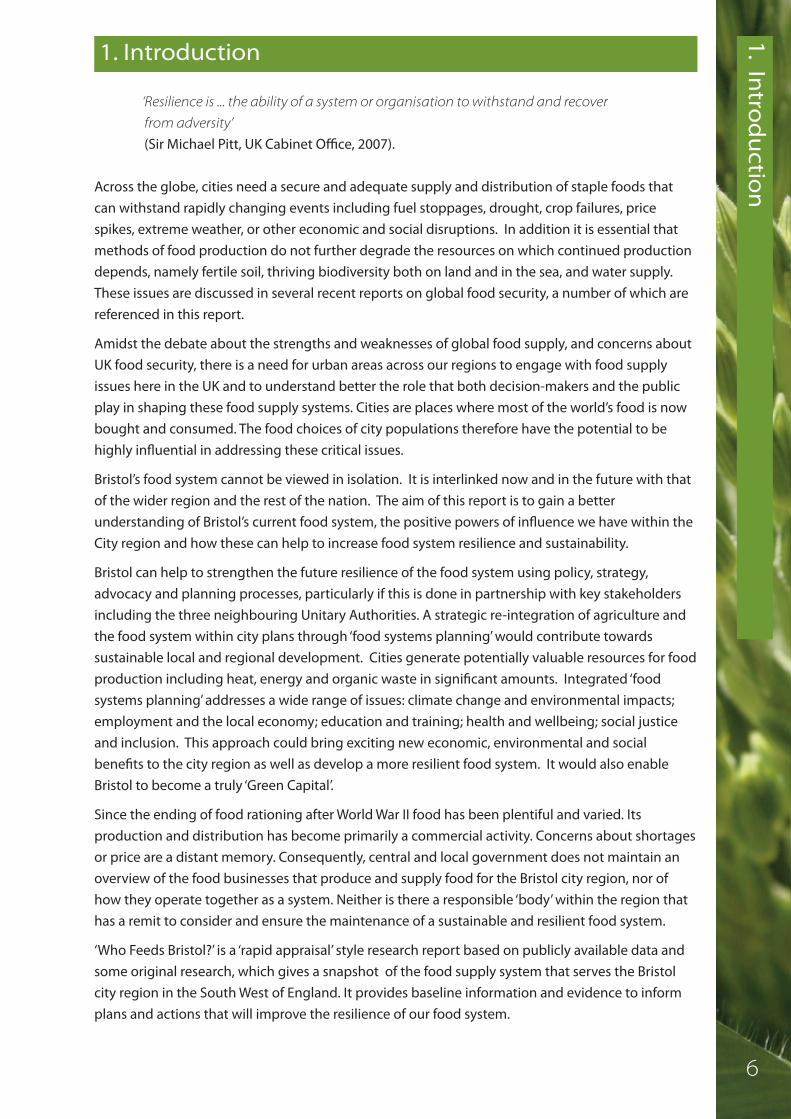
Across the globe, cities need a secure and adequate supply and distribution of staple foods thatcan withstand rapidly changing events including fuel stoppages, drought, crop failures, pricespikes, extreme weather, or other economic and social disruptions. In addition it is essential thatmethods of food production do not further degrade the resources on which continued productiondepends, namely fertile soil, thriving biodiversity both on land and in the sea, and water supply.These issues are discussed in several recent reports on global food security, a number of which arereferenced in this report.
Amidst the debate about the strengths and weaknesses of global food supply, and concerns aboutUK food security, there is a need for urban areas across our regions to engage with food supplyissues here in the UK and to understand better the role that both decision-makers and the publicplay in shaping these food supply systems. Cities are places where most of the world’s food is nowbought and consumed. The food choices of city populations therefore have the potential to behighly influential in addressing these critical issues.
Bristol’s food system cannot be viewed in isolation. It is interlinked now and in the future with thatof the wider region and the rest of the nation. The aim of this report is to gain a betterunderstanding of Bristol’s current food system, the positive powers of influence we have within theCity region and how these can help to increase food system resilience and sustainability.
Bristol can help to strengthen the future resilience of the food system using policy, strategy,advocacy and planning processes, particularly if this is done in partnership with key stakeholdersincluding the three neighbouring Unitary Authorities. A strategic re-integration of agriculture andthe food system within city plans through ‘food systems planning’ would contribute towardssustainable local and regional development. Cities generate potentially valuable resources for foodproduction including heat, energy and organic waste in significant amounts. Integrated ‘foodsystems planning’ addresses a wide range of issues: climate change and environmental impacts;employment and the local economy; education and training; health and wellbeing; social justiceand inclusion. This approach could bring exciting new economic, environmental and socialbenefits to the city region as well as develop a more resilient food system. It would also enableBristol to become a truly ‘Green Capital’.
Since the ending of food rationing after World War II food has been plentiful and varied. Itsproduction and distribution has become primarily a commercial activity. Concerns about shortagesor price are a distant memory. Consequently, central and local government does not maintain anoverview of the food businesses that produce and supply food for the Bristol city region, nor ofhow they operate together as a system. Neither is there a responsible ‘body’ within the region thathas a remit to consider and ensure the maintenance of a sustainable and resilient food system.
‘Who Feeds Bristol?’ is a ‘rapid appraisal’ style research report based on publicly available data andsome original research, which gives a snapshot of the food supply system that serves the Bristolcity region in the South West of England. It provides baseline information and evidence to informplans and actions that will improve the resilience of our food system.
1. Introduction
6
1. Intro
ductio
n

2.1 Potential problems ahead
Bristol has a thriving local economy of shops, cafes, restaurants and markets selling a diverse rangeof affordable food from around the world and from local producers. Therefore it might seemstrange to be concerned about food. However, behind this rosy picture are some clues that point toproblems ahead unless City leaders become more actively concerned with what we eat, where ourfood comes from and how it is produced and distributed. Critical issues that relate to food includeenergy supply, environmental impacts, health and the local economy.
2.1.1 ‘Peak oil’ and future energy supplies. The UK Energy Research Centre is warning that oil supply problems are likely before 2020(1). Thereport ‘Building a positive future for Bristol after peak oil’ was commissioned by the BristolPartnership in 2009. This report identified that ‘any interruption in food supply or increase in costrisks devastating consequences’. Our current dependence on cheap oil for the production anddistribution of food is far greater, and far more vulnerable, than many people realize. In the US, thefood system has been estimated to require 10 calories of fossil fuel for every 1 calorie that ends upon our plates(2). In order for Bristol to avoid potential food crises, shortages, panic-buying andconsequent social unrest, we need a food production and distribution system that can provideadequate healthy, affordable, food equitably to every member of Bristol's population even in theface of fossil fuel depletion and economic shocks.
2.1.2 Environmentally sustainable productionThe food we eat in the UK – growing, producing and importing it – accounts for 30% of the UK’scarbon footprint. If the UK is to meet its own legally binding target to reduce greenhouse gasemissions by 80% by 2050 then food-related emissions need to be cut by 70% by 2050(3). There is astrong grassroots movement in Bristol concerned with ethical, sustainable, and environmentallyfriendly methods of food production. The voluntary sector’s Bristol Food Network produced a‘Sustainable Food Strategy for Bristol’ in 2009. This makes recommendations for building asustainable food system including mapping land for potential food production and protecting landin and around the city; providing a supportive policy and planning framework to enable producersto make a shift towards less reliance on fossil fuels; ‘local food sourcing’ targets for caterers;research; training, education and awareness raising; improving local infrastructure to support morelocal food processing and trade(4).
In 2010 Bristol City Council adopted a Climate Change and Energy Security Framework(5); and aFood Charter and Food Standards(6). These initiatives make commitments to environmentallyfriendly approaches to food production.
2.1.3 HealthConcerns have been growing since the 1970s about the adverse health impacts caused byincreasing availability and promotion of highly processed foods consisting mainly of fat, sugar andsalt, and of high calorie snacks and fizzy drinks. Traditional skills in ‘cooking from scratch’ using freshingredients are on the decline, sales of fresh ingredients have reduced significantly and smallindependent fresh food retailers which used to exist in all localities are now found only in local centres.
2. Context - why does Bristol need this report?
7
2. C
ontext
Sources:1. www.ukerc.ac.uk2. Giampietro and Pimentel 19943. ‘How Low Can We Go?’: An assessment of greenhouse gas emissions from the UK food system and the scope for reduction by 2050. WWF-UK & FCRN, 20094. http://www.bristollocalfood.co.uk/wp-content/uploads/bristols-local-food-update-july-aug1.pdf5. http://www.bristol.gov.uk/ccm/content/Environment-Planning/sustainability/climate-change.en?page=26. http://www.bristol.gov.uk/ccm/content/Health-Social-Care/health-policy/food-for-bristol.en

Obesity levels have increased dramatically, significantly among children. Obesity is primarily aconsequence of poor food or lack of physical activity or both. The associated health problemsinclude diabetes, high blood pressure and heart disease. Portion sizes of biscuits, confectionary,fizzy drinks and ready meals have increased 20 to 100 percent in the UK in the last ten years(7). Onein four people in Britain are now obese compared with fewer than one in ten three decades ago.Obesity in men has increased 75% in the last decade. If current trends continue, then by 2025 over40% of Britons will be obese(8).
2.1.4 Business sector diversity and the local economyThe opening of self-service supermarkets in the 1950s heralded a transformation in the way Britishpeople did their food shopping. However, fifty years on there are growing concerns about anti-competitive practices and the global monopoly of a handful of giant corporations. Tesco is now theworld’s third largest retailer, measured by revenues and the second largest (after Wal-Mart)measured by profits.
Bristol, like any other city in the UK, is dependent on 5 large food supply companies whocollectively control 84% of the UK grocery market share. The monopoly of the major chains appliesnot just to retail, but extends back through the supply chain. Whilst economies of scale bringgreater profitability, the consequences for the local economy are not all beneficial.
2.2 Vulnerabilities in the global agriculture and food supply system
The UK is inevitably affected by any changes in the global food system, whether through risingfood and oil prices, phosphorus depletion (a key mineral fertilizer vital to plant growth)(9),marketing techniques of multinational corporations or moves to introduce intensive animalhusbandry into the UK (rearing pigs or cattle indoors under intensive conditions in a similar way tobattery chickens as a way of improving economies of scale). The following sections provide a briefoverview of some of the key global food system vulnerabilities that have an impact on the UK andtherefore also impact on Bristol’s food supply system.
2.2.1 Feeding the worldVulnerabilities in the global food system are increasingly being recognized including:a Impacts of climate change - higher temperatures, drought, increased flooding, extreme events,
rise in sea levelsa Resource depletion - oil, gas, coal, phosphorus, soil, watera Food-related ill health - 1 billion malnourished, 1 billion obese(10)
a Pressures on food supply due to population growth – projected 9 billion by 2050(10)
In 2008 a major international joint assessment of the global agriculture and food supply systemwas carried out by over 400 scientists. The report concluded that current intensive models basedon high inputs derived from fossil fuels (oil and gas) are neither sustainable nor resilient and thatnew models for food production and distribution based on agro-ecological approaches areneeded. IAASTD Director Professor Robert Watson (now the Chief Scientific Advisor for the UKDepartment of Environment, Food and Rural Affairs) emphasized the need for governments to takea proactive lead in addressing food security concerns.
‘If we persist with business as usual, the world’s people will not be fed adequately over the
next 50 years.’ (11)
8
2. Context
Sources:7. Kessler D. A, The end of overeating: taking control of our insatiable appetite. Penguin Books 2009. ISBN 978-0-141-04781-28. UK Department of Health foresight analysis9. ‘A rock and a hard place: Peak Phosphorus and the threat to our food security’: Soil Association, 201010. Food and Agriculture Organisation of the United Nations 200911. ‘Agriculture at a crossroads’; IAASTD report 2009 http://www.agassessment.org

2.2.2 Impacts of global food production National and international statistics indicate some of the underlying problems with the global foodsystem(11) featuring:
a Energy – conventional agriculture is highly inefficient in terms of energy use and contributesaround 18-20% of greenhouse gas emissions through a combination of fertilizers made fromgas, pesticides made from oil, high fuel usage, deforestation and loss of soil carbon(12).
a Intensive livestock production and animal feed - the need for greenhouse gas reductionsconflicts directly with current global trends towards increased western-style high meat anddairy diets. These diets rely on intensive agricultural production systems using animal feeds ofsoya and grains. Tropical rainforests are being cleared to grow these feeds and fossil fuel inputsare high(13). A significant proportion of soya is produced from GM seed(14) .
a Waste - the global food system wastes a high proportion of the food produced, and generatesconsiderable waste packaging. Every year in the UK 5.2 million tonnes of food-relatedpackaging goes to waste, 40% of which cannot be recycled. UK homes waste around 30% offood contributing towards 6.7 million tonnes of food waste annually(15).
a Water resources - there is inefficient use of water for food production, and most of the waterused has been treated to drinking water standard which is resource intensive:
• UK agriculture uses 742 million m3 of water• Food & drink industry 155 million m3 used(16)
a Concerns about the earth's finite supplies of freshwater and international ‘water security’ aregrowing especially as it is inextricably linked with food production. By 2030 water supplies willonly satisfy 60 per cent of global demand. This will be compounded by the fact that by 2011over 60 per cent of the world's population will live in urban areas. The realities of water scarcityin the sprawling megacities that have sprung up across the developing world accelerate theneed for sustainable water management in emerging urban areas(17).
a Soil erosion - every year worldwide an estimated 24 billion tons of topsoil are lost, 100 millionacres of farmland are lost and 15 million acres of desert created, largely due to unsustainableagricultural practices(18).
a Health - in the USA obesity and diabetes caused by food have increased dramatically since the1960s, and similar trends are being recorded in Europe. According to David Kessler, formerCommissioner of the USA Food and Drug Administration, the primary reason is the businessmodel of the multinational food corporations(19). The food production system can also damagehuman health directly, for example from the use of harmful pesticides.
a ‘Between 1 and 5 million cases of pesticide poisoning are reported each year around the
world. 99% of pesticide deaths, which average 20,000 a year are in developing countries’
(FAO)
9
2. C
ontext
Sources:11. ‘Sustainable Diet: Implications for public health and environment’; Tim Lang 2010; Centre for Food Policy, City University London 12. LUCCG / WAG et al; 201013. Food Futures: strategies for resilient food and farming; Soil Association, 200914.‘ Genetically modified animal feed briefing’; FOE, 2006; Food Standards Agency, 201015. WRAP: 200716. ‘Water use in the supply chain’; Defra, 200717. Water Scarcity And Its Impact Of Foreign Policy; Dr David Tickner, WWF-UK; Josephine Osikena, the Foreign Policy Centre; Dec 201018. The Meaning of the 21st Century; Martin J; 2006 Eden Project Books19. Kessler D. A, The end of overeating: taking control of our insatiable appetite. Penguin Books 2009. ISBN 978-0-141-04781-2

2.2.3 Prices and climate change
‘The 2008 food price crisis and global warming have brought food security and climate
change to the top of the international agenda. Agriculture plays a significant role in both
and these two challenges must be addressed together, rather than in isolation from each
other’ (FAO, 2009) (20).
Two years ago food prices rose suddenly, triggering food riots in several countries. In 2010 therewere more global food price spikes. Wheat prices reached a two-year high with an increase of 70%in the latter half of 2010. Reasons for this included drought and fires in Russia, wet weather rottingstocks of grain in India, concern about or crop failure in Australia and June floods in Canada. Risingprices of sugar, grain and oilseed drove world food prices to a record high in December 2010,prompting warnings of food prices being in "danger territory"(21) .
A United Nations report in June 2010 warned that food prices could rise as much as 40% over thecoming decade. Growing demand from emerging markets and competition from land use forbiofuel production both play a part (22). The press has reported warnings from economists thathouseholds in Britain and around the world should prepare for more price rises in staples such asbread. Research by the World Development Movement has highlighted the role of financialspeculators in driving spikes in prices of global commodities (23)
2.2.4 Control of seed supplySignificant changes have taken place in recent years with regard to control of the supply of seedswithin the agricultural business sector. Major consolidation of companies that produce seeds hasled to increasing concerns about unfair competitive practices and high prices of seed controlled bya small number of large corporations(24). Currently, ten seed companies control over two-thirds ofthe global commercial seed sales(25).
‘Non-renewable seeds’ are guarded by the intellectual property rights of international monopolies.According to Context Network, the proprietary seed market (that is, brand- name seed that issubject to exclusive monopoly – i.e. intellectual property), now accounts for 82% of the commercialseed market worldwide(26). It is illegal for farmers to save patented seed and there are nownumerous cases of farmers in developing countries caught in lawsuits over seed they have savedthat has been unknowingly cross-contaminated with patented seed. The result is farmers gettingcaught in a downward spiral of dependency and debt (27).
2.2.5 Land-grabs and changes in land useIn addition to these global food system vulnerabilities, a phenomenon known as ‘land grabbing’ isadding extra vulnerabilities and potential inequalities. Millions of hectares of farmland indeveloping countries are being acquired by other countries seeking to ensure their food supplies.For example, China has invested US$800 million in Mozambique to expand rice production forsupply to China, and both Sweden and the UK have secured land in Mozambique for biofuelproduction (28). These new arrangements for land use, production and supply will have a significantimpact on food available within ‘host’ countries and on global food availability and trade.
10
2. Context
Sources:20. ‘Food Security and Agricultural Mitigation in Developing Countries: Options for Capturing Synergies’; FAO Oct 200921. Abdolreza Abbassian, Senior Economist, the Food and Agricultural Organisation; The Guardian, 6 January 201122. OECD-FAO Agricultural Outlook 2010-2019 23. ‘Commodity prices soar as spectre of food inflation is back’; Philip Inman and Simon Bowers; the Guardian, 6 August 201024. ‘Rising food prices may start with seeds’: P. J. Huffstutter, Los Angeles Times, USA, 11.03.2010 25. Levitt T. October 2010 The Ecologist. Revealed: how seed market is controlled by Monsanto, Syngenta, Bayer, Dow and DuPont.
http://www.theecologist.org/News/news_round_up/625294/revealed_how_seed_market_is_controlled_by_monsanto_syngenta_bayer_dow_dupont.html
26. www.contextnet.com27. ‘Soil not oil’; Vandana Shiva; 200728. http://www.ifpri.org/publication/land-grabbing-foreign-investors-developing-countries
2.3 New policies to meet new priorities
A third contextual angle to this research is the need for new policies and planning processes thatbuild resilience in the food system.
‘Feeding over 6 billion people – and over 9 billion by 2050 – will require a wide range of
creative, sustainable agricultural systems which not only provide food, but also factor in the
economic value of nature-based services such as forests, wetlands and soil organisms that
underpin agriculture. Simply applying the ‘industrial’ agricultural models of the twentieth
century into the twenty-first as a single, global solution will not serve us well’.
(UNEP/UNCTAD 2008 (29)).
2.3.1 Building local resilience and ecological sustainability of the food systemThe United Nations, FAO and other international agencies all warn of severe disruptions to globalfood supply in the near future. It is their view that different policies are now needed. Whilst somewould argue that biotechnology and genetic engineering will solve all these problems, this isprobably over optimistic. Faced with the combined challenges of energy and resource depletion,environmental degradation, and a highly vulnerable debt-based global economic system, it seemswise to address these risks and impacts by planning for locally resilient and ecologically sustainablemodels of food production and supply rather than waiting for some as yet undisclosed technical fix. (30)
2.3.2 Interconnected policy-makingA new UK government Foresight report published in January 2011 adds to the global food securitydebate. A major conclusion of the Foresight report is ‘the critical importance of interconnectedpolicy-making’. Included in its summary are the following points:
‘The food system must become sustainable, whilst adapting to climate change and
substantially contributing to climate change mitigation….(There is) a strong case for
governments, the private sector and civil society to continue to prioritise global food
security, sustainable agricultural production and fisheries, reform of trade and subsidy,
waste reduction and sustainable consumption. Addressing the many challenges facing
global farming and food will require decision-making that is fully integrated across a diverse
range of policy areas which are all too often considered in isolation, and for action to be
based on sound evidence… The solution is not just to produce more food, or change diets,
or eliminate waste. The potential threats are so great that they cannot be met by making
changes piecemeal to parts of the food system. It is essential that policy-makers address all
areas at the same time.’ (31) (‘The Future of Food and Farming: Challenges and choices forglobal sustainability’: Foresight 2011)
2.3.3 City food policy & planningAt a city level, there is a growing movement of ‘food policy councils’ or multidisciplinarystakeholder groups which are being established to help integrate food into wider strategic andpolicy planning in order to increase food security. In North America some of the largest cities aredriving this change – New York, Seattle, San Francisco(32).
A similar baseline study to ‘Who Feeds Bristol?’ was carried out in Oakland, California with the aimof initiating discussion among City policymakers, staff, and community members to consider the
11
2. C
ontext
Sources:29. ‘Organic Agriculture and Food Security in Africa’; UNEP-UNCTAD 200830. ‘The Right to Food and the Political Economy of Hunger’; Olivier De Schutter Nov 2009; UN Special Rapporteur on the right to food 31. ‘The Future of Food and Farming: Challenges and choices for global sustainability’: Foresight, The Future of Food and Farming 2011; The
Government Office for Science, London32. ‘Feeding the City: The Challenge of Urban Food Planning’: Kevin Morgan, Department of City and Regional Planning, Cardiff University;
International Planning Studies Vol. 14, No. 4, 429–436, November 2009

impact that the City’s food system might have on different areas of public concern. The studyincluded an exploration of how systems of production, distribution, processing, consumption,andwaste, as well as city planning and policymaking could support the objective of having at least30 percent of the City's food needs sourced from within the City and immediate region(33).
3. Research approach
3.1 Main areas of investigation
The ‘Who Feeds Bristol’ report looks at the six key components of the food system: production;processing; distribution; retail; catering and waste. It investigates the provision of basic staple fooditems; land use for current and potential food production; and the current food supply capacityfrom the surrounding region in relation to the food needs of Bristol and the city region. It alsoinvestigates which businesses are involved in preparing, distributing, selling, recycling or disposingof food across the city region and within the city itself. Information has been gathered fromexisting reports, databases, websites, surveys and business interviews.
The research for this report has been shaped around the following questions: a Who feeds Bristol and where does the food come from? a How does Bristol city’s food supply system fit into the wider region’s food supply system? a What are the strengths and vulnerabilities? a To what extent is the current food supply system that serves Bristol city region resilient to
shocks and projected circumstances in the longer-term? a Which areas of the city and which groups of Bristol residents would be most adversely affected
by vulnerabilities in the food supply system? a What role and powers do the city’s decision-makers and key stakeholders have in shaping the
food system that serves the city and the city region? a What are the priority areas that need to be addressed in order to develop a more resilient food
supply system for the future?
3.2 ‘Rapid appraisal’ research approach
This study is concerned with the long term resilience of the food supply system for Bristol, ratherthan with short-term emergencies. It is a ‘rapid appraisal’ carried out in a limited time by a verysmall team of people and gives an indication of trends and issues.It is based on available information and includes a number of specially designed ‘snapshot’ surveysand interviews. An important finding is that there is a lack of comprehensive information and datain the public domain. Our conclusions are therefore inevitably based on estimates andapproximations.
Evidence of ‘resilience’ in the food system could be seen as the availability & affordability of UKproduced staple ‘cook from scratch’ food items (ie food items from which a healthy well balancedmeal can be made). The report therefore concentrates on ‘staple’ food items, and explores theextent to which they are currently being produced in the South West and the West of Englandregions, namely:a Meat a Dairy a Eggsa Fruit and vegetablesa Cereals, grains and bread.
12
3. Research
approach
Source:
33. A Food Systems Assessment for Oakland, CA; Unger and Wooten, 2006

Businesses that deal with ‘luxury’ food and drink products (alcohol, confectionary, cakes etc) havenot been included. We were unable in the time available to look at the fishing industry, althoughitis of course a very important staple food item and is the subject of much debate concerning long-term sustainability of supply. Beer could arguably be viewed as a staple food item in England butwe have not included it in the research. The report has not considered issues of food quality andshould not be interpreted as having done so. This report should be seen as a baseline study whichhas aimed to collate available facts and figures upon which further work can be based.
Land use andfood supply
Staplefoods
Foodbusinesses
Community
Figure 1: Research focus - the food system
Catering Retail
ProcessingProduction
Waste Distribution
3.3 Bristol city ‘bioregion’
The South West is the largest region in England and includes Bristol, Gloucestershire, Somerset,Dorset, Wiltshire, Devon, Cornwall and the Isles of Scilly. It has a population of five million. Bristol isthe largest city in the South West region, located 105 miles west of London, and 24 miles east ofCardiff. It is the UK’s 8th most populous city. The unitary authority of Bristol had an estimatedpopulation of 433,100 in 2009.
The City of Bath is 11 miles to the East of Bristol. The total population of Bristol, Bath and thesurrounding rural/urban area is approximately one million and covers four unitary authority areasin total (Bath & North East Somerset, Bristol, North Somerset, and South Gloucestershire).
This area is usually known as the West of England but will be referred to in this report as the ‘Bristolcity region’ with the purpose of viewing the area as a ‘bioregion’. The concept of a bioregion isrelevant when discussing food systems. It denotes a political, cultural, and environmental system,defined through physical and environmental features and through culture, local populations,knowledge, and solutions.
In some sections of this report data for the whole of the Bristol city region have been used and inother sections the focus is just on Bristol city. Bristol’s food system, as already stated, cannot beviewed in isolation but an in-depth analysis of the entire city region is beyond the scope of this report.
3. R
esea
rch approac
h
13
Joy Carey, ‘Who Feeds Bristol’ research design

4. The food businesses

4. The food businesses
This report investigates the businesses involved in supplying food to the Bristol city region. There isno single source of information about the food system serving the Bristol city region. The startingpoint for finding out about non-farming food businesses has been Local Authority public foodregisters (as of July-August 2010). All food premises are required to be registered with LocalAuthority Environmental Services for food safety purposes. Responsibility for registration lies withthe food business and there are gaps. For example some farmers’ market traders are registered butnot all. Not all supermarkets were registered at the time of this research.
In investigating food production (ie farmers and growers) we have used specially commissionedagricultural information for the South West region provided by the English Food and FarmingPartnership (see section 7) and information for the West of England region provided by the RoyalAgricultural College, Cirencester (see appendix 8). We have also carried out surveys via the NationalFarmers Union’s South West office and with a number of Bristol farmers’ market traders (see section 8).
4.1 The city region’s food businesses – an overview
Data from the Bristol, South Gloucestershire, Bath & North East Somerset and North Somersetpublic food registers (Table 1) suggest that there are approximately 6,600 registered businesses inthe city region that deal with staple food items including meat, dairy, eggs, fruit and vegetables,bread, flour, pasta and rice. While these figures are approximate, they give an indication of typesand spread of businesses within the city region.
These figures suggest that across the Bristol city region around 75% of the registered foodbusinesses are involved with catering; 20% are involved with retail; and around 4% are involvedwith processing, manufacturing and distribution.
Table 1: Registered food businesses in Bristol city region dealing with staple foods
Food distributor/distributioncentres/cold stores/ wholesalers Food manufacturersFarms/city farmsAbattoir and cutting facilitiesCaterers (catering companies)Hospitality/eat out (hotels,restaurants, takeaways etc)Public, educational and carepremises (catering)Specialist retail (includingbakers, butchers, fishmongers,delis, health food shops,greengrocers)Other retail (includingsupermarkets)Total
Category Bristol SouthGlos
B&NES NorthSomerset
Total % ofTotal
9027
69
543
1058
653
183
5203089
262913
3135
399
330
46
1501131
241345124
447
256
52
2081133
205
133
196
486
380
58
1571318
160743620
998
2390
1619
339
10356671
2.51
0.50.315
36
24
5.2
15.5100
(Data source: Food registers for Bristol, South Gloucestershire, B&NES, North Somerset)Note: Excludes all other categories listed under registered food businesses and excludes registered businesses trading in alcohol,confectionery and non-food.
4. Who feeds Bristol and the city region?
15
4. The fo
od busin
esses4.2 Bristol city food businesses – an overview
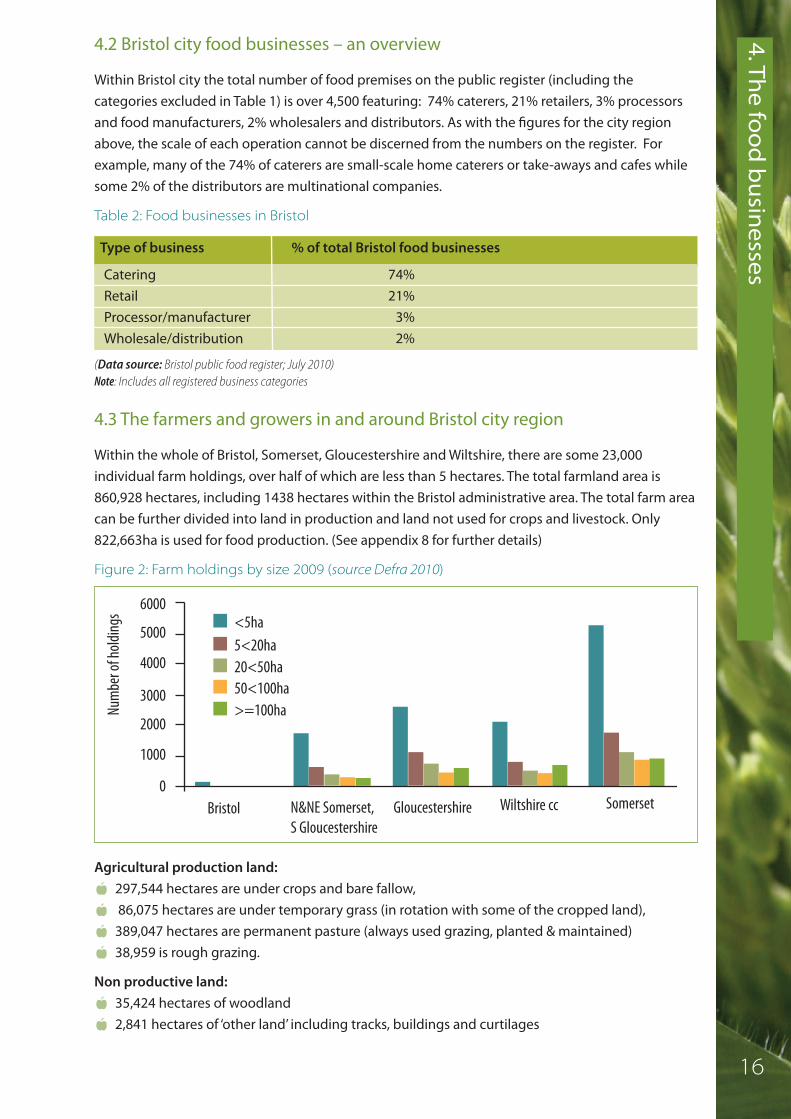
Within Bristol city the total number of food premises on the public register (including thecategories excluded in Table 1) is over 4,500 featuring: 74% caterers, 21% retailers, 3% processorsand food manufacturers, 2% wholesalers and distributors. As with the figures for the city regionabove, the scale of each operation cannot be discerned from the numbers on the register. Forexample, many of the 74% of caterers are small-scale home caterers or take-aways and cafes whilesome 2% of the distributors are multinational companies.
Table 2: Food businesses in Bristol
4.3 The farmers and growers in and around Bristol city region
Within the whole of Bristol, Somerset, Gloucestershire and Wiltshire, there are some 23,000individual farm holdings, over half of which are less than 5 hectares. The total farmland area is860,928 hectares, including 1438 hectares within the Bristol administrative area. The total farm areacan be further divided into land in production and land not used for crops and livestock. Only822,663ha is used for food production. (See appendix 8 for further details)
Figure 2: Farm holdings by size 2009 (source Defra 2010)
Agricultural production land: a 297,544 hectares are under crops and bare fallow, a 86,075 hectares are under temporary grass (in rotation with some of the cropped land),a 389,047 hectares are permanent pasture (always used grazing, planted & maintained)a 38,959 is rough grazing.
Non productive land:a 35,424 hectares of woodland a 2,841 hectares of ‘other land’ including tracks, buildings and curtilages
(Data source: Bristol public food register; July 2010)Note: Includes all registered business categories
Type of business % of total Bristol food businesses
CateringRetailProcessor/manufacturerWholesale/distribution
74%21%
3%2%
Bristol N&NE Somerset,S Gloucestershire
Gloucestershire Wiltshire cc Somerset
6000
5000
4000
3000
2000
1000
0
Num
ber o
f hold
ings <5ha
5<20ha20<50ha50<100ha>=100ha
16
4. The food businesses Farm type:
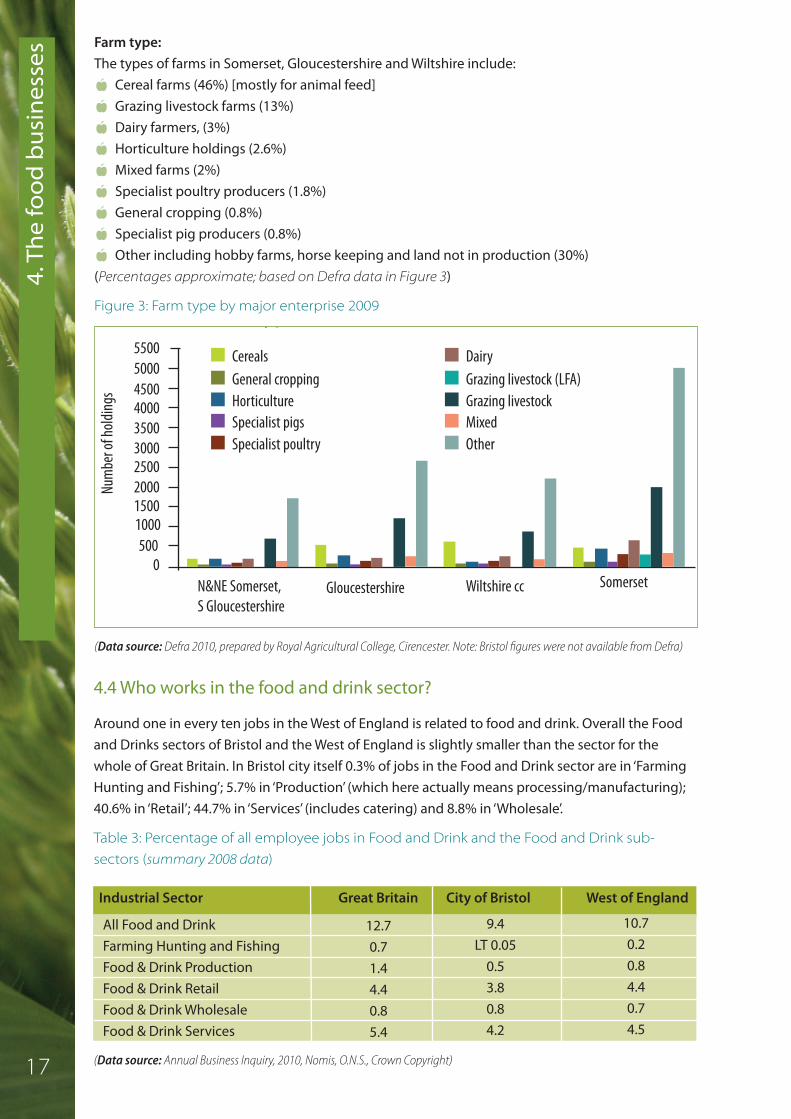
The types of farms in Somerset, Gloucestershire and Wiltshire include: a Cereal farms (46%) [mostly for animal feed]a Grazing livestock farms (13%)a Dairy farmers, (3%)a Horticulture holdings (2.6%)a Mixed farms (2%)a Specialist poultry producers (1.8%)a General cropping (0.8%)a Specialist pig producers (0.8%)a Other including hobby farms, horse keeping and land not in production (30%)(Percentages approximate; based on Defra data in Figure 3)
Figure 3: Farm type by major enterprise 2009
N&NE Somerset,S Gloucestershire
Gloucestershire Wiltshire cc Somerset
55005000
4000
3000
2000
1000
0
Num
ber o
f hold
ings
CerealsGeneral croppingHorticultureSpecialist pigsSpecialist poultry
yp
4500
3500
2500
1500
500
DairyGrazing livestock (LFA)Grazing livestockMixedOther
(Data source: Defra 2010, prepared by Royal Agricultural College, Cirencester. Note: Bristol figures were not available from Defra)
(Data source: Annual Business Inquiry, 2010, Nomis, O.N.S., Crown Copyright)
4.4 Who works in the food and drink sector?
Around one in every ten jobs in the West of England is related to food and drink. Overall the Foodand Drinks sectors of Bristol and the West of England is slightly smaller than the sector for thewhole of Great Britain. In Bristol city itself 0.3% of jobs in the Food and Drink sector are in ‘FarmingHunting and Fishing’; 5.7% in ‘Production’ (which here actually means processing/manufacturing);40.6% in ‘Retail’; 44.7% in ‘Services’ (includes catering) and 8.8% in ‘Wholesale’.
Table 3: Percentage of all employee jobs in Food and Drink and the Food and Drink sub-
sectors (summary 2008 data)
Industrial Sector Great Britain City of Bristol West of England
All Food and DrinkFarming Hunting and FishingFood & Drink ProductionFood & Drink RetailFood & Drink WholesaleFood & Drink Services
12.70.71.44.40.85.4
9.4LT 0.05
0.53.80.84.2
10.70.20.84.40.74.5
17

4. The fo
od busin
essesFigure 4: West of England Food and Drink sector employment in relation to other sectors
3% advanced engineering and aerospace4% Communications and ICT
4% Construction5% Creative industries
10% Education
3% Environmental technologies
6% Finance
11% Food and drink13% Health and social work
6% Professional services
6% Public admin and defence
29% Other
(Data source: Dr. Stephen Usmar, Economic Development, Bristol City Council)
Figure 5: Food and Drink sector jobs in the West of England
42% Food and
drink services
6.2% Food and drink wholesale 2.3% Farming, hunting and �shing7.4% Food and drink production
41.7% Food and drink retail
(Data source: Dr. Stephen Usmar, Economic Development, Bristol City Council)
18
Bristol City Council data are remarkably consistent with the Annual Business Inquiry figures andshow that around eleven percent of jobs in the West of England relate to food and drink.

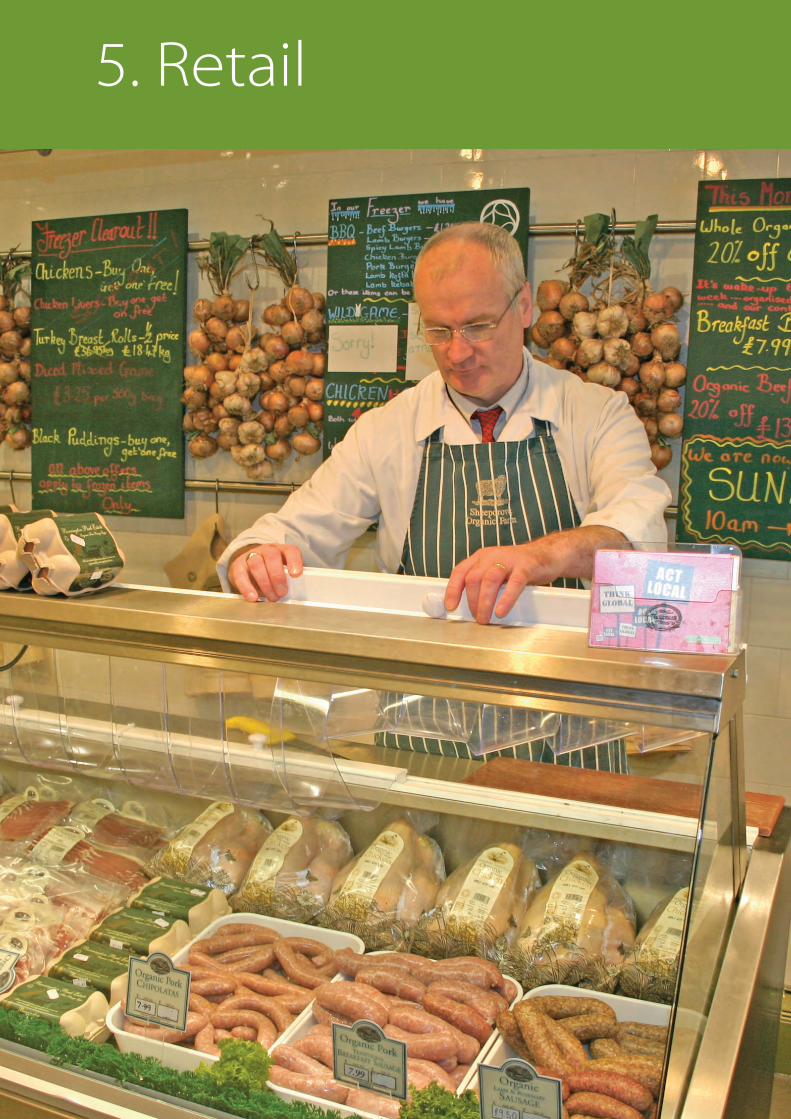
5. Retail
19
5. Retail

5.1 Context – the national food retail picture
Since the opening of the UK’s first supermarket in 1951, the food retail picture in the UK has beentransformed from one of diversity and balanced competition to one of consolidation andmonopoly. There has been phenomenal growth in the past few years of the four largestsupermarket chains, Tesco, Sainsbury's, Asda and Morrisons (the ‘big four’).
At the end of 2009, the ‘big four’ of Tesco, Asda, Sainsbury’s and Morrisons had a combined share of75.6% of the UK grocery market(1). Tesco led with 30.7% of market share (it is now estimated thatone in every three pounds spend on groceries is spent in a Tesco store) ; Asda were second with17.3%; Sainsbury’s had 15.9% and Morrisons had 11.7%. The Co-operative, having boughtSomerfield, is now the fifth largest food retailer in the UK, operating mainly smaller supermarketsand convenience stores and has 8% share of the UK grocery market, followed by Waitrose in sixthplace with 4% market share(2) . The arrival of the Co-operative has now created a new ‘big five’which together have around 84% of the UK grocery market share.
In 2009 the UK Competition Commission urged the UK government to introduce tighter planningrules to stop the large supermarkets squeezing out rivals. All the ‘big four’ continue to plan forstrategic expansion. Sainsbury’s were on track to open over 60 new convenience stores in 2010while Tesco planned to open 125 Tesco Express and One Stop stores(3). Recent BBC research foundthat Planning Authorities gave Tesco, Sainsbury's, Asda and Morrisons permission for at least 480stores in England in the past two years(4).
Supermarket expansion plans also extend beyond food retail. Retail-led regeneration plans fortown centres are on the increase. For many Local Authorities, particularly in deprived areas, theinvolvement of the big supermarkets is seen as a vital part of regeneration. For example Tesco isbuilding a £200m complex in West Bromwich, West Midlands, which includes a retail park, newschool and a police station. Leeds City Council is currently negotiating an agreement with Asda togive just over £1m towards public transport and the relocating of a medical technology companyto its proposed new site in Middleton(5). Tesco’s regeneration arm, Spenhill has recently submitted aproposal for Kirby Town Centre, Merseyside(6).
Within the UK, views are divided over the merits of supermarkets and about the desirability of‘buying’ planning consent through finance for local facilities. Some point out the negativeconsequence of their growth and domination while others argue that supermarkets have madegood quality food widely available and affordable to everyone and that their dominance means thepotential for these large players to have a huge impact through their development of sustainabilityinitiatives. These issues and rankings for the most ‘green’ supermarket are all discussed in detail inthe first 2011 edition of ‘Ethical Consumer’(7).
5.2 Supermarkets across the city region
Again, there is no single up to date list of supermarkets in the city region. For this research we havehad to use various sources of information. Analysis of the food registers suggests that Bath & NE
5. Where do residents in Bristol and the city region buy food?
Sources:1. TNS Global2. Wikipedia3. The Times, Business Section, 11 Nov, 20104. BBC1 Panorama, Dec 20105. www.bbc.co.uk/news/uk-england-119367346. www.planningresource.co.uk7. ‘Endless Choice or Limitless Damage?’; Ethical Consumer Jan/Feb 2011; www.ethicalconsumer.org
5. Retail
21
Somerset and North Somerset each have around 17 supermarket stores owned by the ‘big five’:Tesco, Asda, Morrison, Sainsbury and the Co-operative. South Gloucestershire has a highernumber, with approximately 30. In Bristol 40-50 are owned by the big five’ (see table 4 below). Anumber of these are ‘superstores’ (ie the large supermarket stores that provide the broadest rangeof products, for example Tesco Extra which typically occupy over 2000 sq metres of floor space).
These data combined with national figures suggests that the Bristol city region is supplied witharound 84% of its food & grocery retail sales by approximately 100 stores/shops owned by 5supermarket companies.
Recent BBC research found that in 2004, Greater Bristol had 19 stores owned by the ‘big four’ and by2010 this number had increased to 76 (8). In Greater Bristol at least 21 new supermarkets from the'big four' chains were given planning approval in the last two years(9).
5.3 Bristol’s food retail sector
The food retail category (21% of all Bristol’s food businesses) combines a wide range of types ofshops, not all of which sell much food although they are still required to be registered as foodbusinesses. If businesses like petrol stations, chemists, off licenses, ice cream vans and milk deliveryvans, newsagents, sweetshops and other shops selling snacks are excluded then the percentage offood businesses that are classified as retail drops from 21% to 5%.
Therefore, around 5% of Bristol’s food businesses are retailers that actually sell fresh staple fooditems (this figure includes all large and small supermarkets, convenience stores, cash and carrystores and some post offices and newsagents). The 70 registered supermarket businesses accountfor around 1.5% of all Bristol’s food businesses.
Of the overall 21% retail figure, the retail business breakdown is approximately as follows:a 7% of Bristol food retailers are supermarkets.a Specialist food retailers including butchers, bakers, fishmongers, greengrocers,
and delicatessens account for 17%. a The remaining 76% of retailers are cash & carry stores, corner shops, small scale convenience
stores (franchise operations like Costcutter, Spar, Best One, Martin McColl), petrol stations,newsagents etc.
5.3.1 Supermarkets in BristolAt the start of our study, Bristol’s Director of Public Health wrote to the Chief Executives of all themajor supermarkets explaining the ‘Who Feeds Bristol’ project and seeking their cooperation (seeappendix 13). Only the Co-operative was prepared to share any information with us. It hastherefore been difficult to find out exactly how many people buy supermarket food, and whattypes of food they buy. However we can investigate the range, number and size of supermarketbranches around the city. This report refers to both numbers of stores owned by the ‘big four’ andthe ‘big five’ because the reality is that there are now 5 main supermarket companies, but mostnational reports and statistics still refer to the ‘big four’. It is also not clear exactly how many Co-operative stores there now are in Bristol.
Of the 70 supermarket outlets listed in the Bristol public food register in August 2010, 23 are ownedby the ‘big four’ ie Tesco, Morrisons, Asda, Sainsbury’s (Table 4). Reflecting national figures, thissuggests that 4 companies, with at least 23 stores, supply 75% of food & grocery retail sales inBristol. If the Co-operative stores are added, the total number of stores in Bristol owned by the ‘bigfive’ could be 43, collectively accounting for 84% of Bristol’s grocery market share.
Sources:8. www.bbc.co.uk/news/uk-120078359. BBC1 Panorama, Dec 2010
5. Retail
22

(Data source: Bristol public food register 2010; Company’s own store locator websites)
*Note: There is a discrepancy between data on the public food register and on the company store locator websites. In the interestsof consistency the report uses data from the public food register as of July/August 2010. It is the company’s responsibility to registerand not all do so immediately. Tesco’s own on-line store locator lists around 20 stores within the Bristol city boundary. This wouldincrease the total number of stores owned by the ‘big four’ to 32. As well as the 70 stores across the city, there are stores on theedges of the Bristol city boundary eg Cribbs Causeway. Tesco’s on-line store locator lists a total of 31 stores across the Greater Bristolregion ie Bristol and extending over the city boundary a short way to the north and east. The Co-operative, now owner ofSomerfield, lists 10 Bristol city stores on their store finder, but there are over 25 Co-operative stores on the Bristol food register.
In terms of number of supermarkets to population, the Greater Bristol urban area, comprising thecity and the built up area around the city boundary, has a relatively high density of Tesco stores pernumber of residents compared to other similar size cities like Leeds, Sheffield, Manchester, andLiverpool, for comparison: a Greater Bristol – population of 587,400, has 31 Tesco storesa Greater Manchester – population of over 2 million, has 37 Tesco storesa Sheffield city region – population of 640,720, has 16 Tesco storesa Leeds city region – population of 761,200, has 20 Tesco stores (10)
Based on these figures, and given that Bristol has all five of the big superstore chains present withinthe city, it may be that Bristol overall has a relatively high density of stores owned by the ‘big four’compared with other cities.
5.3.2 Specialist independent food retailersThis group of independent businesses providing fresh food on a daily basis accounts for 17% of thecity’s food retailers and totals around 180 shops owned by 140 businesses:a Bakery shops: 70 (run by approximately 30 different making bread businesses)a Fishmonger shops: 10a Butcher shops selling fresh meat: 40a Greengrocer shops: 35a Delicatessens: 25(11)
Table 4: Main supermarkets within Bristol City boundary - the ‘big four’ in red
Supermarket Number of large stores(2,000 sq m and above)
Number ofsmaller stores
Total on register(store locator data inbrackets)
Tesco J Sainsbury Asda Aldi LidlMorrisonsSomerfield The Co-operativeWaitrose Marks & SpencerIceland frozen foods TOTAL
4423626411
74
1151
8
11 (*20)8
2 (*3)3 627
19 (*10)218
69 (70)
Sources:10. Tesco store locator11. Bristol public food register
5. Retail
23

5.4 Provision of fresh staple foods in Bristol shops
5.4.1 Analysis by electoral ward This uses the data from the food register. A ‘fresh food’ mapping exercise shows the number andlocation of fishmongers, bakers, butchers, grocers, greengrocers, health food shops, delicatessens.market stalls, frozen food retailers and supermarkets across the city. It provides a baselineindication of the likely provision of staple food items in shops across the city including meat, fruitand vegetables, eggs, dairy, bread, flour, pasta and rice. The results are presented on the fresh foodmap and in an accompanying ward comparison table (see Table 5). Milk rounds were not includedbut there are approximately 60 registered local milk delivery rounds operating from 3 depots inAshton, Stoke Bishop and Henleaze.
Map 1: Fresh food provision
5. Retail
24

The shading of the wards indicates the density of fresh food retailers per ward. The pie chartsprovide a breakdown of the proportion of each type of food outlet in the ward. Map 5 shows the rankings of Bristol wards in terms of deprivation scores and is useful to comparewith the other two food retail maps.
Note: Not all farmers’ market stalls, temporary and mobile units have been included. Branches of the same company have beencounted separately, and some shops may have been included that shouldn’t have been eg sandwich shops which sell pies and areregistered as bakers or post offices and newsagents which are registered as grocers but do not actually stock a range of staple fooditems. It is also possible that some stores that are on the food register could have ceased trading but have not yet been removedfrom the register.
Table 5: Fresh food purveyors by ward
The purpose of this table is to show the provision of staple food items from independent retailersacross the city in a way that enables comparison between Bristol’s 35 wards. Further research isneeded to gather more accurate figures and to identify the shops that provide an adequate rangeof staple ‘cook from scratch’ food items. It is the basis for the fresh food provision map and the datais from the Bristol food register 2010.
5. Retail
25

Map 2: Supermarkets and fresh food markets
Map 2 locates the large supermarket superstores and smaller supermarkets in and around Bristolcity. There are 9 of the ‘big four’ superstores within the city and 8 close to the city. It also shows thelocations of the 4 Council-operated fresh produce markets and a further 8 fresh produce markets ofvarious kinds.
5. Retail
26
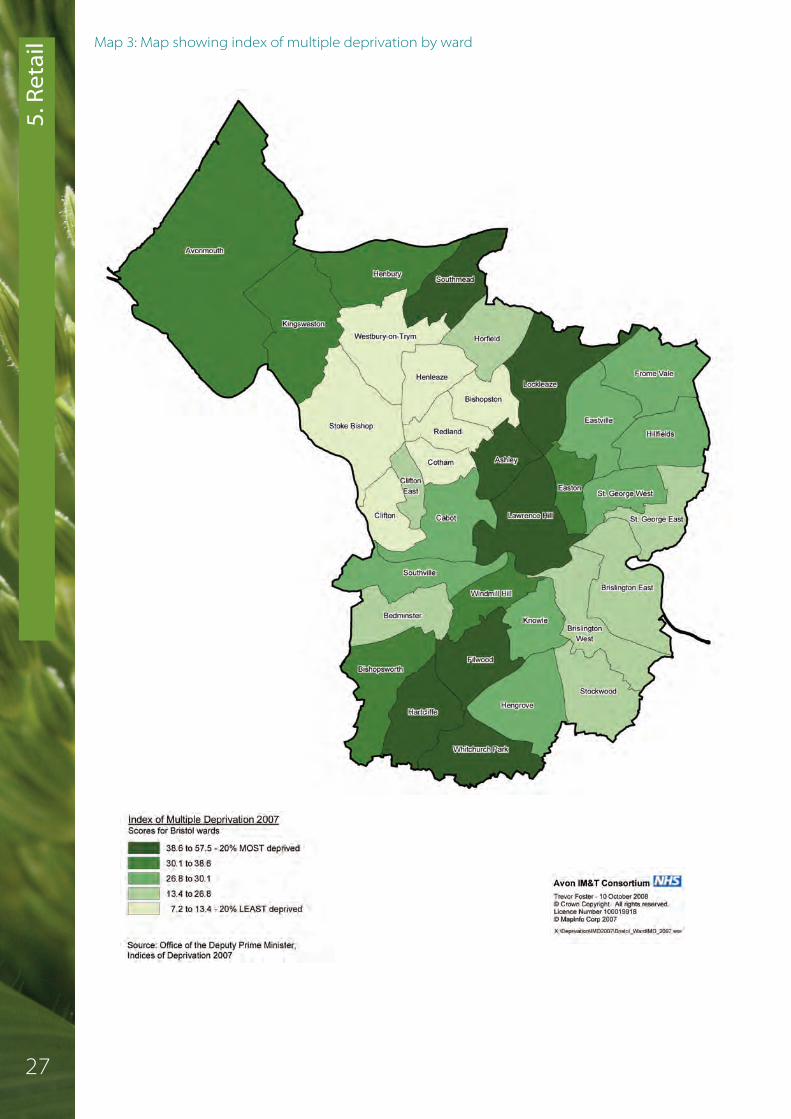
Map 3: Map showing index of multiple deprivation by ward 5. Retail
27

5.4.2 Food mapping analysis - key points Whilst large supermarkets offer a good range of ‘cook from scratch’ ingredients, this is notnecessarily the case in smaller stores and prices can also vary (see section 12.2).Independent retailers selling fresh produce can be found all over the city but do seem to be locatedin geographical clusters. The maps and table of figures in Table 5 can only give an indication ofprovision of fresh ‘cook from scratch’ food items. Identifying all the independent retailers who areeither grocers or provide a limited range of basic food items is difficult due to the limited data heldon the food register. Mapped food businesses include bakers, greengrocers, butchers, fishmongers,organic and health food shops, delicatessens, convenience shops and some newsagents and postoffices.
Analysis of the provision of fresh food data reveals strong contrasts in fresh food provision betweenBristol’s communities:a Ten wards have no independent greengrocers on the food register. These include 4 out of the 7
most highly ranked wards in terms of deprivation (see map 3). All of these wards have largesupermarkets or are close to wards with supermarkets (see map 2). Nine of these wards have atotal of 10 or less food retailers. We do not have access to information about numbers of foodretailers that used to exist. It nevertheless seems likely that independent retailers havedisappeared in these areas because of the establishment of large supermarkets.
a Half of the wards in Bristol have 10 or less fresh independent food retailers.
a At one extreme - Hengrove and Whitchurch Park have no independent butcher, fishmonger,baker or greengrocer - but each community has a large superstore.
a At the other extreme - Filwood (Bristol’s most deprived ward) with less than 10 food retailers,has a butcher and baker but no greengrocer and has no supermarket.
a Five wards have no supermarket: Filwood, Ashley, Easton, Eastville and St Georges East.
a Lockleaze has only 6 food shops two of which are actually Tesco in Eastville, but officially Tescofalls just inside Lockleaze ward; the one bakery is also located in Tesco.
a After the 5 wards with no supermarket, the least deprived wards (Clifton, Cotham, Bishopston,Redland, Westbury-on-Trym, Stoke Bishop, Henleaze) have the lowest density of supermarketsand over 10 independent food retailers each (with the exception of Stoke Bishop which has only3 independent retailers and also has the highest car ownership in the city).
a Lawrence Hill has the second highest number of food shops and is also the ward with thehighest population. Most of the grocers in Lawrence Hill ward are located on Stapleton Rd.
a Cabot ward in the city centre has by far the highest number of food shops (and around 16% ofthe city’s total food businesses, the majority of which are cafes, restaurants and pubs). Eightbutcher/fishmonger businesses are listed but some of these are weekly farmers market stalls inCorn Street. Its 15 bakers include 6 branches of Greggs (a national chain) and 2 branches ofParsons (an independent Bristol bakery with 22 shops in the city region) and 3 bread stalls atthe weekly farmers market. (12)
Source:12. Bristol public food register; Deprivation IMD 2007 Rank of Electoral Wards within Bristol (Department of Community and Local Government
5. Retail
28

CASE STUDY 1:
Bristol Sweet Mart – innovative food retail in a diverse community
Bristol Sweet Mart was established in 1978 by Mr Kassam Majothi, a Ugandan refugee whomigrated to the UK. It is now managed by Mr Majothi’s four sons and employs over 50 staff. Thiswell known food retail business began as a simple one-shop family business selling Indian home-made foods in Easton. Located in the heart of a vibrant local community, the business hasexpanded along St. Marks Road now offering a local food shop, a wholesale service and a newdelicatessen. Its product range has grown to include specialist Indian and exotic foods, fresh fruitand vegetables as well as a wide selection of herbs and spices. The family has developed anddiversified Sweet Mart’s food retail business in response to the rich variety of cultures andcommunities within Bristol.
Bristol Sweet Mart stocks 11,000 different products in store and sells on-line via its website. Theytry to source their products locally and from the UK, Europe and Asia. Around 30% of their rangeof fresh produce and dairy products are sourced locally and from the SW region. They buy in bulkfrom Essential Trading based in Bristol and from Queenswood based in Somerset. The businesspromotes local sourcing and has experienced an increase in demand for local and organic foodsfrom their regular customers.
The business is very much part of the local community and has built a loyal customer base. Intotal around 80% of its sales are to local customers, Bristol restaurants and cafes. It supplies over100 Indian restaurants, take-aways and specialist food outlets in the Bristol area. The rest of itssales are to customers and businesses across the South West region. It also sells a wide range ofcooked Indian delicatessen foods that are prepared on the premises in their own kitchens. Thebusiness is planning to develop sales to local schools, colleges and hospitals, and to develop newtrade with buying groups across the city and South West region.
www.sweetmart.co.uk(See full case study, appendix 11)
5.4.3 Local shopping areas and multi-cultural food provision There are a number of locations around the city where independent food retailers are clustered.Ashley ward for example has 25 independent food retailers, most of which are clustered in MinaRoad, Ashley Road and Stokes Croft. In wards like Easton, Ashley, Lawrence Hill and Eastville,independent retailers provide a wide range of foods used by culturally diverse groups and thesefood items may not be found in supermarkets. St Mark’s Rd in Easton is a well known example of alocal shopping area and is home to the thriving independent food retail enterprise, Bristol SweetMart.
5. Retail
29

5.4.4 Comparison of fresh food map data with Bristol’s ‘Quality of Life’ surveyEach year Bristol City Council conducts a postal questionnaire with a sample of residents across thecity. In 2008 analysis of responses to a question about easy access to a shop selling fresh fruit andvegetables identified a wide variation in reported access. The following list is of the wards that fellinto the top, middle and bottom ‘access’ categories. a Poor access – Filwood; Lawrence Hill; Lockleaze; Bishopsworth; St George West; Hillfields;
Cabot; Brislington East a Limited access – Southmead; Kingsweston; Avonmouth; Hengrove; St George East; Brislington
West; Clifton.a Good access – Henleaze; Westbury on Trym; Bishopston; Clifton East; Southville
The wards in red are those for which the food register shows no independent greengrocers. Half ofthese wards have less than 10 independent fresh food retailers. Based on information from Map 2:(Supermarkets and fresh food markets), a number of these wards are located in areas ‘in between’the superstores, although there are some smaller supermarkets. Despite Lawrence Hill having thesecond highest number of fresh food retailers, fruit and vegetables are reported not easilyaccessible. This could be because survey respondents are less mobile and cannot access the shops,or because the perceived quality/range/price is poor. The wards with best access correlate withwards where there are greengrocers, for example Westbury-on-Trym has 4, the most in the city.Further research is needed to properly understand access and availability issues, looking at bothretailers and fresh produce markets.(13)
5.5 Direct delivery to households
Direct deliveries to households are growing, with several supermarkets doing home deliveriesincluding Tesco, Sainsbury’s, Waitrose, Asda and Morrisons. There are also milk rounds that deliverother products alongside dairy products including bread, fruit and vegetables. In addition thereare mobile greengrocers, fishmonger vans, local food distribution businesses and independent boxschemes (see section 8 on local produce supply), food cooperatives and buying groups which buyin bulk and distribute amongst their members. Good examples include Essential TradingCooperative’s buying groups and Hartcliffe Health and Environment Action Group food coop (seecase studies).
5.6 Summary & key points
Reflecting the national situation, Bristol city region is supplied with over 80% of its food retail salesby a total of around 100 stores/shops owned by the five largest supermarket chains.
In Bristol city itself, around 32 food retail outlets are owned by the ‘big four’ ie Tesco, Morrisons,Asda, Sainsbury’s. Reflecting national figures, this suggests 4 companies are responsible for supplyof 75% of food retail sales in Bristol through 32 stores. The 70 registered supermarkets businessesaccount for around 1.5% of all Bristol’s food businesses i.e. including caterers etc.
It is clear that the number of supermarket outlets is increasing rapidly and that independent shopsare declining.
Supermarkets account for around 7% of the food retailers in Bristol; specialist independent foodretailers (butchers, bakers, fishmongers, greengrocers, delicatessens) account for 17% of the sector.The remaining 76% is made up of a wide range of shops and businesses including corner shopsand small scale convenience stores.
Source:13. Bristol City Council Quality of Life survey; ‘Factsheet 4 - Create and develop healthy and sustainable places and communities’, NHS Bristol 2010
5. Retail
30

Analysis of the public food register suggests that around 5% of Bristol’s food businesses supplyfresh staple ‘cook from scratch’ food items, of which volume, range and quality varies. These freshfood retailers include a mix of types and sizes of outlets ranging from supermarkets togreengrocers, bakers and butchers, to corner shops.
Bristol city has approximately 180 specialist independent food retail outlets run by around 140independent retail businesses including 35 independent greengrocers, 40 butchers, 10fishmongers, 25 delicatessens and 70 bakery shops run by 30 bakery companies. To put this incontext, if the 35 greengrocers were all evenly spread around the city, each would provide for anaverage population size of 1,100 people.
Under a third of Bristol wards do not have an independent greengrocer and half of Bristol wardshave 10 or less fresh staple food retailers. The fresh food mapping data suggests that there is acorrelation between the presence of large supermarkets and lower numbers of independentretailers. Further research is needed to understand better the local access to fresh staple fooditems across the city and the viability of the independent food retail sector.
5. Retail
31

6. Wholesale anddistribution

6.1 Food distribution/ wholesale facilities in the Bristol city region
The 2.5 % of the city region’s food businesses that are food distributors, distribution centres, coldstores and wholesalers (see section 4, Table 1) are a largely unseen aspect of the food supplysystem, except for the large haulage vehicles and delivery vans that travel up and down themotorways and into our towns and cities. The distributors and wholesalers supply a large networkof retailers and caterers.
There are a total of 160 distribution/wholesale facilities registered in the city region with 56% ofthese facilities registered in Bristol and the rest evenly spread across the other three unitaryauthorities. Bristol’s geographical location and proximity to the M4 and M5 motorways hasresulted in Tesco, Sainsbury, Asda, the Co-operative, and Morrisons supermarkets all locating theirSouth West and Wales distribution centres at Avonmouth, Portbury, Patchway and CribbsCauseway. Within Bristol, distribution and wholesale facilities are clustered in two main areas: StPhilips and Avonmouth/Royal Portbury. Figure 7 explains in more detail what kinds of companiesare involved in wholesale and distribution.
Figure 6: Food distribution and wholesale facilities in the Bristol city region –
breakdown by Local Authority area
56% Bristol
16% South Glos
13% North Somerset
15% B&NES
Figure 7: Food distribution and wholesale facilities in the Bristol city region – breakdown by
nature of facilities
44% Distributioncentre
9% Cash and carry12% Cold store/freezer centre
15% Meat, milk/dairy, !sheggs, herbs/spices, bread specialist facilities
14% Greengrocery /f&VWholesaler/ veg packer
6% Food packers
(Data source: Food registers for Bristol, B&NES, South Gloucestershire, North Somerset)
6. Who supplies food to the businesses which sell to us?
6. W
holesale and distribution
33

6.1.1 Bristol Port Health AuthorityBristol Port Health Authority covers Bristol Port Company's Royal Portbury and Avonmouth Docks.Although Royal Portbury is located in North Somerset, it is mainly the responsibility of Bristol PortHealth Authority which is run by Bristol City Council under a Port Health Order approved by theSecretary of State. In 1991, First Corporate Shipping Limited, a private company, purchased a 150year lease for the Avonmouth and Royal Portbury Dock Estate from Bristol City Council. It is one ofthe smaller UK ports but there has been significant expansion since 1991 and it is recognised asamong the most productive and technically advanced ports in Europe.
Relative to the ports of Southampton and Felixstowe, the amount of food currently coming into theBristol port is small. This is largely because of the size of ship that the port can accommodate.Imported food items at present are all ‘low risk’ (ie dried, preserved or non-perishable) and includewine from South Africa; sultanas and raisins, apricots, pears and chickpeas from Turkey; tomatopastes and sauces from the European Union; gum Arabic from Africa; apple juice from Spain. In2009-10 a total of 229k tonnes of food came through the docks, a 20% reduction on the previousyear. Figures from 2008-9 suggest that over 4000 containers brought in 281k tonnes of importedfood items.
Bristol Port Company has registered cold stores on site which are used by the distributioncompanies. There are terminals for fresh produce, grain and animal feeds. The port has capacity forbulk liquids and deals with molasses and orange juice concentrate. The fresh produce terminal hasa capacity of 14,500 pallet spaces with temperature controlled chambers, receiving and deliveryhalls and dispatch bays. The computer system tracks the location and status of each pallet until it isredelivered to road transport. At present the terminal handles fresh produce from a number ofexporting countries. During the Northern Hemisphere's off season imports are handled from Chile,Argentina & South Africa. During the Northern Hemisphere season products are imported from theEastern Mediterranean. Products handled include grapes, apples, pears and citrus. However at themoment all fresh fruit imports are stopped. We were not able to find out why this has happenedbut it is most likely to be related to economic issues.
The next major phase in Port development is to build the new Deep Sea Container Terminal. Thisexpansion into a deep water terminal could make Bristol into one of the biggest ports in the UKand the only deep water port with direct motorway and rail access. Bristol would be able to delivercontainers to key UK markets more quickly than ports in the South and East as this developmentwould make it 40 miles closer to the supermarket regional distribution centres than any other portterminal. Bristol Port also has its own dedicated motorway junctions giving quick access to thelarge consumer markets in the Midlands, South West and West London. Increased food importswould transform it into the major import hub for this side of the country with potentially 1.5 millioncontainers arriving each year, many of which could be food products. (1)
6.1.2 Avonmouth Distribution/wholesale companies account for approximately 30% of registered food businesses inAvonmouth, the majority of which are involved with regional and national supply chains. Half ofthese companies are concerned with warehousing and food storage.(2)
Sources:1. 1. Bristol Port Company; http://dsct.bristolport.co.uk2. Public Health Services; food safety records, Bristol City Council;
6. Wholesale an
d distrib
utio
n
34
6. W
holesale and distribution 6.2 The role of wholesale
The role of wholesaling is to supply goods to trade and business customers for whom dealingdirectly with suppliers is not feasible and/or practical. By buying in bulk and selling on by caseloads, the wholesalers enable small traders to purchase as much or as little as their businessesrequire.
In addition many wholesalers also provide a range of business support services for customers, suchas logistics and distribution/delivery services. The broad categories of wholesale businessesdefined by the Institute of Grocery Distribution are:1. General Grocery Wholesalers
Supply a wide range of food and grocery categories. Their primary customers are independentretailers and caterers.
2. Specialist WholesalersThese focus on a narrow range of often specialist categories. For example, fresh fish, fruit andvegetables, meat and poultry.
3. Catering/Foodservice WholesalersThese tend to deliver to a diverse range of businesses including cafes, restaurants, fast foodestablishments and schools and hospitals.
The wholesale market function has changed since the 1970’s, because of the expansion of thesupermarket sector to encompass its own in-house suppliers, logistics and distribution. Previouslythe wholesale trade served most of the retail sector. Now that the supermarket sector deals directlywith its own suppliers and has its own consolidation and distribution facilities, this hasfundamentally changed the way that market forces operate in the food system. The currentfunction of wholesale in the UK is now to service the surviving independent retailers, the cateringindustry, local authority outlets including schools, colleges, and hospitals, and processors andmanufacturers. Whilst these elements combine to create a significant independent sector, thewholesale market suffers from fluctuations in supply and demand. Frequent oversupply can resultin poor financial returns for the grower.
The major supermarket chains use distribution and ‘just in time’ ordering and delivery techniqueswhich mean that producers carry more of the risk from oversupply. Because of their size thesupermarket chains can call on diverse global production sources to meet fluctuating demand – forexample for ice cream, salad and barbecue items in hot weather. The fact that food may cross thecountry several times on its journey from producer to customer does not matter in economicterms, because fuel prices are low and road charging is not part of the UK transport policy. This hasin turn influenced consumer expectations for year round availability. One consequence of this isthat many people are no longer familiar with what products are and are not in season in the UK inany given month, and may therefore view the offer from independent greengrocers as lessattractive if these greengrocers focus predominantly on seasonal goods.
The wholesale market can act as a safety valve for importers and producers whose primary functionis to service the supermarket sector and who may have produce for sale that is surplus because offluctuating requirements or because it falls outside supermarket specifications. For example, manygrowers who have been supplying supermarkets are now seeking to reconnect with theindependent sector because of the difficulties they face in servicing the narrow specifications, lowprices and unpredictable demands of the supermarket trade. However, the wholesale trade cannotalways cope with the fluctuating volumes that producers need to input into the independentsector. For a fuller description, see ‘Hungry City’ (3).
35 Source:3. Hungry City: How food shapes our lives’; Carolyn Steel, 2006
6. Wholesale an
d distrib
utio
n6.3 Fruit & vegetable wholesale markets in the UK
Imported fruit and vegetables currently constitute 90% of the UK’s fresh produce wholesale trade.The remaining 10% of fresh produce is sourced from the UK and represents around 25- 30% of theUK production of fruit and vegetables, which for various reasons has not been placed directly intoretail or foodservice supply chains.
In terms of future resilience, fruit and vegetable wholesale is key if local production (to conservetransport fuel), sustainable farming methods (to maintain soil health and biodiversity) and humanhealth (food prepared from good quality fresh ingredients) are our priorities. The commercialviability of UK fruit and vegetable production depends on a network of wholesale, retail andconsumption that takes account of what is efficient to produce within the context of the landscapeand weather pattern for UK farming.
There are 24 primary wholesale fruit and vegetable markets in the UK including: Belfast,Birmingham; Borough (London); Bradford; Brighton; Bristol; Cardiff; Derby; Dublin; Gateshead;Glasgow; Hull; Leeds; Leicester; Liverpool; Manchester; New Covent Garden (London); NewSpitalfields (London); Nottingham; Preston; Sheffield, Southampton; Western International(London); Wolverhampton. Most are owned by their city councils(4).
The Bristol Wholesale Fruit Centre at St Philips specializes in fruit and vegetables and is one of justtwo wholesale markets in the country that are owned and run independently of the local authority.
6.4 Bristol Wholesale Fruit Centre
Bristol Wholesale Fruit Centre in St Philips was established as a co-operative with a not for profitethos in 1968. It is run by a board of 8 Directors elected by the shareholders who are also theleaseholders of the units in the market (ie the companies that trade out of the market). BristolWholesale Fruit Centre runs the market site, deals with security, maintenance, waste, health andsafety and legal issues. It is a wholesale market that exists to provide services and facilities towholesale companies dealing with fresh fruit, vegetables, salad and flowers. Each morning,customers shop around and compare prices between the different shareholder companies.
6.4.1 Scale of operationThe market supplies an area that stretches from Fishguard, to Portsmouth, and from northeast ofOxford to Penzance. Main customers are independent retailers, catering suppliers and caterers,Local Authorities and the NHS. Individual companies tender for supply contracts, which in turn helpto keep the wholesale market buoyant.
The market serves virtually the entire independent greengrocery sector across South Wales and theSouthwest of England. Supply within the Bristol city region accounts for some 20% of the market’strade. It has managed to remain viable despite the severe pressures that have led to the loss ofmuch of the wholesale infrastructure throughout the country, including Wales and the South West.Bristol is now the nearest wholesale market to Penzance, which is just about reachable in a daysreturn journey. If the St Philips wholesale market were to collapse, this would cause significant lossof local jobs and would cause a domino effect for thousands of producers throughout the SouthWest and further afield, and for hundreds of caterers and independent retailers. Without Bristol, thenext closest markets are Western International Market just outside London near Heathrow, orBirmingham.
36Source:4. The re:fresh directory 2010

6. W
holesale and distribution In the 1960s the Wholesale Fruit Centre moved from its central site in St Nicholas market where it
operated alongside the meat and fish markets, to the site at St Philips because of improvedtransport links and greater space. The site at St Philips was located beside railways sidings and theoriginal plan was to make use of rail links to serve the market. However, the railway goods depotwas closed in 1967.
Today the market is entirely reliant on road transport and has changed considerably since it wasestablished. Road haulage is the fastest way to get perishable short shelf-life goods to market.Large 40 ton haulage trucks have transformed the market into a regional hub for fresh producedistribution involving several different businesses based at the St Philips site.
It has shifted from solely supplying retailers to also supplying the bulk of the catering sector. Thischange is largely due to the rise of supermarkets who now dominate the retail sector for freshproduce. The wholesale businesses have been sustained by the growth of the catering market andsupply contracts to schools and the NHS. One of the companies has set up a subsidiary to processvegetables for school and NHS contracts. It is estimated that some 5 million people receive somepart of their ‘five a day’ requirement by means of fresh fruit and vegetables that have come throughthe Bristol Wholesale Fruit Centre.
6.4.2 Business operation There are eight parent fruit and vegetables businesses based at the Wholesale Fruit Centre site in StPhilips, a number of which own subsidiaries. All leases are 99 years from 1968. Annual turnoverranges from £4 billion for Fyffes, the largest parent business which leases 45% of the property onsite, to £1-2 million by the smallest company. Mack is another large wholesaler, owned by aprivately owned international company the Fresca Group Ltd, ‘the biggest produce company in theUK’. Fresca Group Ltd have established the 91 hectare ‘Thanet Earth’ site in Kent, the UK’s largestand most high-tech hydroponic greenhouse complex supplying cucumbers, peppers and tomatoesto all the major supermarkets.
All the companies operate independently of each other. Most are wholesalers that either sell directto retail and catering customers who either come to the market or receive deliveries ordered viatelesales operations. There are 3 retail companies that rent storage space on the site. The smallestcompanies are M&D Kidner, Jenkins and Bath Wholesale, all independently owned. A number ofsecondary wholesalers also operate on the site, operating as buyers from the large wholesalersthen selling on to retailers and caterers in smaller quantities.
6.4.3 Sources of fresh produceFresh produce comes into the market daily, mainly from the UK and Europe, predominantly fromHolland and Spain but also further afield. The individual businesses have their own direct tradingrelationships with growers or with brokers who sell on behalf of growers. Much of the UK producecomes from the Midlands and East Anglia or the Northeast and Northwest of England and isdistributed around South Wales and Southwest England. Some growers within 100 miles of Bristoldeliver their own produce to the market. Currently the volume of fruit and vegetables sourcedfrom the South West and the Bristol city region is minimal. M&D Kidner is one company that tries tosource as much seasonally available and organically grown produce as possible from within theregion. (See case study)
37

6. Wholesale an
d distrib
utio
nCASE STUDY 2:
M & D Kidner – wholesale local
and organic fruit &vegetables
Ownership & scale of operationM & D Kidner is a small independent wholesale company that operates out of the BristolWholesale Fruit Centre in St Philips. Delivery represents 70% of its business activity with 30% ofactivity being on-site sales. Mark Kidner set up the business 20 years ago and it has been at the StPhilips site for 9 years. The company is one of the smallest in the market, employing 25 peopleand has an annual turnover of £12 million. It also has a small organic enterprise.
Local and organic supply When seasonal and local produce is available 75-80% sold by Kidners is English. Annually thepercentage is less with the rest being imported from abroad. The company buys fromapproximately 50 suppliers. Supporting local growers by buying high quality produce and locallydistinctive varieties is part of Mark Kidner’s personal conviction. The proportion of locally sourcedproduce varies according to season. As part of Kidners local produce sourcing approach, thecompany buys surplus seasonal produce from the farms that run the farm shops it supplies, and italso work with small scale local growers including organic businesses, but finds there is notenough produce grown in the local area. Kidners have developed an organic box scheme forretailers. The shops collect and pre-sell orders for boxes. The company also works closely withSomerset Organic Link.
CustomersOf Kidner’s 100 customers, about 70% are farm shops, and the rest are mainly secondarywholesalers who supply caterers, fruit and vegetable shops and small restaurants, mainly in theBristol city region. Most of these customers want local and UK produce. In Bristol city, customersare mainly Asian shopkeepers who come to the market in person to buy onions and potatoes.Organic produce customers in Bristol include Penny Brohn Cancer Care and the Watershed.
Public sector supplyKidners are interested in developing contracts for fruit and vegetable supply for school meals inBristol.
www.kidners.co.uk(See full case study, appendix 11)
38

6. W
holesale and distribution 6.4.4 Significance for Bristol
The wholesale market provides employment for well over 500 people, excluding the SundayMarket. It supplies most of the city’s greengrocers, several mobile greengrocers and a number ofgrocers that stock fresh produce. The site is rented out each Sunday to an outside market companythat organizes markets for the public from all over the country. The Sunday Market fresh producestall holders are in effect secondary wholesalers who buy from the companies at Bristol WholesaleFruit Centre and sell on to the public. It attracts a wide cultural mix of regular customers who tendto come from within a 10 mile radius. An estimated 10,000 people shop there each Sundayaccording to an audit in 2004. Those numbers may have fallen slightly but the market still draws abig clientele with over 1,000 customer vehicles and significant sales of fruit and vegetables. Forexample, in one day a stallholder sold over 75 tons of potatoes, equivalent to 50 pallets or two anda half articulated lorry-loads.
6.4.5 Food Waste The market generates a significant amount of waste each day including spoiled fresh produce,excess pallets and waste packaging. Approximately 2-3% of the market’s total daily fresh produceis wasted each day, largely due to non-compliance with Defra inspector grading standards. Ifsamples of produce do not meet the required standards then the whole pallet can be rejected. Thismeans the produce is not allowed to be sold, and officially not even allowed to be given away so itis compressed on site and sent to landfill. Market traders estimate that at least 10% of this waste isperfectly edible.
The market has its own compressor for dealing with waste and Biffa has the disposal contract. Thisis expensive and costs the market £120 per ton to send to landfill. Individual companies can maketheir own waste disposal arrangements or pay for use of the facilities available on site. Somecompanies supply fresh produce waste to farmers who come to collect, or take it to a biodigestercomposting facility in Cannington near Bridgwater.
6.5 Bristol Wholesale Fruit Centre vulnerabilities
The Wholesale Fruit Centre is vulnerable to a range of issues and impacts including:
a Supply – finding sufficient steady supply of local or regional produce is becoming more difficultas growers go out of business.
a Transport – interruptions to road transport like blockages on motorways, port blockades (aswith recent industrial action in France) or closure of the channel tunnel would cause seriousdisruption.
a Haulage – companies don’t share transport capacity with competitors. This means there is lessthan optimal use of transportation space in the wholesale distribution system. This could beaddressed if there was an independent haulage contractor servicing the market.
a Retail Links – the close interdependency between the wholesale sector and the independentretail sector and the catering sector means that stress or failure in any one area impacts on theothers.
a Contamination – the St Philips area has become a favoured location for waste companies with10 now located close to the wholesale market. There have been increased incidents of rottingwaste and rats. The market organizers are seriously concerned about potential contamination offresh produce.
39

6. Wholesale an
d distrib
utio
n6.6 Future opportunities for St Philips wholesale market
One aspect of a resilient food system is the need for easy access to diverse markets for producers,caterers, retail businesses and the public. St Philips wholesale market enables growers to sell theirproducts flexibly in large volumes on a daily basis and plays a very significant role in supporting theexistence of the independent retailers including farm shops across South West England and SouthWales.
The supermarket chains achieve financial efficiencies through the scale of their operations but thishas led to loss of market diversity. Supermarket practices have been the subject of high-profilecriticism, and investigations, in relation to anti-competitive practices. If the Bristol Wholesale Centrewere to collapse, this would further erode the diversity of the market, and would signal the end ofnumerous small businesses throughout the region, with the loss of many jobs.
The wholesale market represents a significant business resource for the city and the region. Atpresent it has only a small connection with actually feeding Bristol city except through the smallnumber of greengrocers and through some NHS and school meal catering. NHS and Local authorityfruit and vegetable supply contracts currently play a significant role in keeping the Bristolwholesale market buoyant.
Some businesses involved in the Wholesale Fruit Centre believe there is scope for the co-locationand development of a composite farmers’ wholesale market serving the public and operating as alocal producer distribution hub, linked with training opportunities, mentoring and a food college.Ideally this would be on new site, given the limitations of the buildings at St Philips.
A huge amount of fresh fruit and vegetable waste is generated at the wholesale market, asignificant amount of which is being compressed and land filled. More of the produce that doesn’tconform to DEFRA grading standards could be redistributed, for example by working in partnershipwith organizations like FareShare (see case study.) There is a significant opportunity for recyclingfresh produce and wood waste generated at the St Philips market.(5)
‘For a resilient food system we need easy access to markets for both growers and the public.
Bristol could have a new composite market selling fresh fish, meat and other food products,
creating a growers hub - like a wholesale farmers market. It could provide easier access for
people who want to get involved in the trade. The City of Bristol College could re-locate its
catering department alongside a fresh produce market. Additionally a training facility could
be developed delivering nutritional training to schools and colleges. There’s no reason why
that couldn’t work here. Bristol is a place that is trying to do new things’.
(Tim Down, MD of Percy J Down)
40
Source:5. Information taken from interviews with Richard Laurence, Secretary/Market Manager, Wholesale Fruit Centre (Bristol) Ltd, and with Tim Down,MD of Percy J Down, September 2010.

6.7 Other wholesale operators
This study has focused on fruit and vegetables but there are specialist wholesalers for otherproducts too, for example eggs, meat and bakery ingredients. Essential Trading Co-operative is asuccessful Bristol business – a worker-owned cooperative that supplies a wide range of ethical andorganic grocery products. In Bristol, 60% of its trade is with retailers and 40% with restaurants andconsumer buying groups and it is a significant player in the city’s food system.
6.8 Summary and key points
One of the biggest barriers to increasing the supply of locally produced food is the limitations ofthe current infrastructure for distribution. This factor was frequently mentioned in the ‘Who FeedsBristol?’ producer survey. Bristol has some very successful wholesale and distribution businesses,including well established companies that specialise in local and ethical products which alreadysupply the independent retail and catering sectors. Any future planning to develop food systemresilience needs to include such highly skilled food supply professionals who are experienced inthe logistics of shifting large volumes of food on a daily basis.
In addition there is the opportunity to address carbon emissions within the food transport system,for example though the use of biogas made from landfilled waste to run distribution vehicles, aspiloted by Sainsbury’s ‘Running on Rubbish’ initiative. The company has converted a number ofheavy goods vehicles to use a combination of diesel and biomethane, thus reducing CO2emissions(6).
CASE STUDY 3:
Essential Trading Co-operative– ethical products, ethical
wholesale business
Essential’s 2,000 active accounts include buying groups across the UK. Within Bristol 40% of theirtrade is with restaurants, caterers and buying groups. Essential offers a catalogue of 6,000products including a complete range of natural, vegetarian and Fairtrade foods, 80% of which areorganic, including dried, tinned and preserved foods, and bulk commodities including flour andrice.
Sourcing local and natural foods is very important to Essential which buys a wide range of foodproducts from local producers and processors. The co-operative shapes its catalogue to matchcustomers’ needs, for example stocking local and organic, Fairtrade and raw foods, GM and glutenfree products. Essential promotes ‘healthy eating’ and the business has expanded with thegrowth of buying groups and shoppers returning to independent retailers to buy higher qualitylocal foods with personal service. Ethical trading is helping Essential to withstand both therecession and competition from the supermarkets.
www.essential-trading.co.uk(See full case study, appendix 11)
Source:6. www.biogasmax.co.uk/360-new-development-in-uk-bio-methane-for-dual-fuel-vehicle.html
6. W
holesale and distribution
41
7. Production

7. P
roduction
One factor in food system resilience is the availability & affordability of staple ‘cook from scratch’food items produced as close to the Bristol city region as possible. Section 7 therefore explores thenature of food production in the South West and looks at where this food is sold.
7.1 UK self-sufficiency - national picture
As a nation we are dependent on other countries to feed us. Less that 2% of the UK’s population isinvolved in actual food production. The UK currently imports 40% of all its food which includes 90%of its fruit and 60% of its vegetables, mainly by sea and road transport routes. 70% of animal feedused across the EU is imported.
Presented another way, the UK is around 60% self-sufficient in food overall, and around 74% self-sufficient in the types of food that can be grown in this country. This means that although our foodsupply is fairly secure at present, that situation could change in response to global economic orenvironmental changes. (1)
As shown in the graph below, the UK needs to import poultry, fresh fruit, fresh vegetables,potatoes, beef and some cereals for human consumption. In addition (not shown in Figure 8)animal feed is also an important import, see 7.2.
Figure 8: UK self-sufficiency varies greatly from commodity to commodity
2005
120
100
80
60
40
20
0
%
Total cereals
Cattle & calves, beef & vealPoultry and poultry meat
Fresh fruit
Fresh vegetables
Milk
2000199519901985
Potatoes
(Data source: Food Matters; UK Cabinet Office, 2008)
Over the last 10 years the supply of fruit and vegetables into the UK market place has increasedsignificantly, through greater volumes of imports rather than through domestic production.During this period we have seen a significant decline in domestic vegetable production. This meansalthough we are consuming more fruit and vegetables, the rise in demand is not helping tosupport increased domestic vegetable production. Whether we are in fact both purchasing as wellas wasting more, in effect eating the same amount is not known.
7. Which staple foods are produced in the South West region?
43Source:1. Food and Drink Federation ; http://www.fdf.org.uk/imports_exports.aspx

7. Productio
nThe domestic production of fruit has increased slightly during the last decade but as a percentageof total supply, the volume of UK production remains low (Figure 9). We are increasingly reliant onimported fruit and vegetables to meet domestic requirements. Whilst a substantial part of theseimports are to supply produce that we are physically unable to produce or are out of season in theUK, we are seeing a fall in home production at the expense of imports, in particular forvegetables(2).
Figure 9: Home (fruit and vegetable) production marketed (HMP) as a percent of total supply
2008
80
70
60
40
30
20
0
%
HPM as % of totalvegetable supply
2005200219981997
50
10
1999 2000 2001 2003 2004 2006 2007
HPM as % of totalfruit supply
(Data source: DEFRA basic horticulture statistics 2009; ‘Driving Change in the Fresh Produce Sector’, EFFP, April 2010)
7.2 Animal feed imports and the link to unsustainable diets
Another significant import to the EU and also to the UK is animal feed which accounts for asignificant proportion of the world’s harvest – estimates range from one third to nearly half. Arange of crops can be used in animal feeds; the most common are soya, maize, oilseed rape andcotton seeds. 90% of the world’s soya is used to feed animals and vast quantities are exportedaround the world. A number of recent reports have raised serious concerns about the negativeimpacts of animal feed production. These issues are included here as contextual, given that theSouth West region of England is a significant livestock producer.
‘Global per capita consumption of meat has increased 87 per cent between 1961 and 2002
(World Resources Institute: Earth trends). A trend towards intensive factory farming systems
over the past 60 years has meant that cows, chickens and pigs are now eating less grass and
food waste and more grains and imported proteins like soya. These practices have added to
the vulnerability and the unsustainability of our food chain. We are using more land and
resources to feed farm animals – destroying rainforests and grasslands and contributing
towards climate change in the process. Dependence on animal feed like grain and soya,
imported from across the globe, makes our food systems much less resilient.’
(Feeding the animals that feed us: The Soil Association, 2010).
The two crops used in European animal feed that are most likely to be genetically modified are soyaand maize, and almost all is imported. Imported soya and maize by-products account for about20% of raw materials used by UK feed manufacturers and farmers(3).
44Sources:2. ‘Driving Change in the Fresh Produce Sector, EFFP, April 20103. ‘Genetically modified animal feed briefing’; FOE, 2006

7. P
roduction 7.3 South West food supply in a national context
Within UK food production, the South West region is most significant for red meat, dairy productsand certain vegetables. It is an important meat supplier to the rest of the country and producesmore than 23% of England’s cattle and sheep. In total, 90% of livestock slaughtered in the SouthWest is sold through processors, wholesalers and supermarkets, while around 10% is sold throughindependent retailers or direct to consumers. The region provides 37% of England’s milk supply,through three large national dairy processors. 70% of the cereals grown in the South West aredestined for animal feed for the livestock industry in the region.
The South West region produces only 6% of the nation’s vegetables. Its main crops are brassicasand root crops; it dominates in national supply of potatoes and cauliflowers and it supplies 18% ofthe country’s swedes. The land is suitable for vegetable production but the farms tend to be toosmall to meet the requirements for supplying the large scale multiple retailer supply chains. Theresult is that vegetable production in the region has declined in favour of cattle, sheep and dairy.The South West has only two large scale growers and packers. These two companies account forhalf the region’s production of cauliflowers and they supply mainly to supermarkets.
The South West is also home to the highest concentration of organic* producers and processorbusinesses in the UK. In national terms, the region has 26% of the UK’s organic producers and 38%of England’s organic producers. Organic farming in the UK covers 4.2% of total agricultural areawhich signifies 17.5 million hectares. The South West has the greatest proportion of organic land ofall of the English regions, representing 1.9 million hectares. Two of England’s largest organicbusinesses are based in the South West: Yeo Valley Organic dairy and Riverford Organic fruit &vegetables box home delivery.
Table 6: Numbers of organic producers and processors by UK region 2009 (also illustrated in
the graph below)
(Data source: Defra Organic Sector UK statistics, 2009)
Note:*Only food that has been produced in accordance with organic standards by farmers/producers registered with an approvedinspection body may be legally sold as ‘organic’ within the EU. The inputs and practices used in organic farming are strictlyregulated in accordance with EU Regulation. (See appendix 1)
Region/country Number ofproducers only
Number ofprocessors only
Number of producer/ processors
Total
UKEnglandWalesScotlandSouth West England
494630891,009 610
1,466
20117327 10 76
24112016140 200 446
755852781,176 820
1,988
45
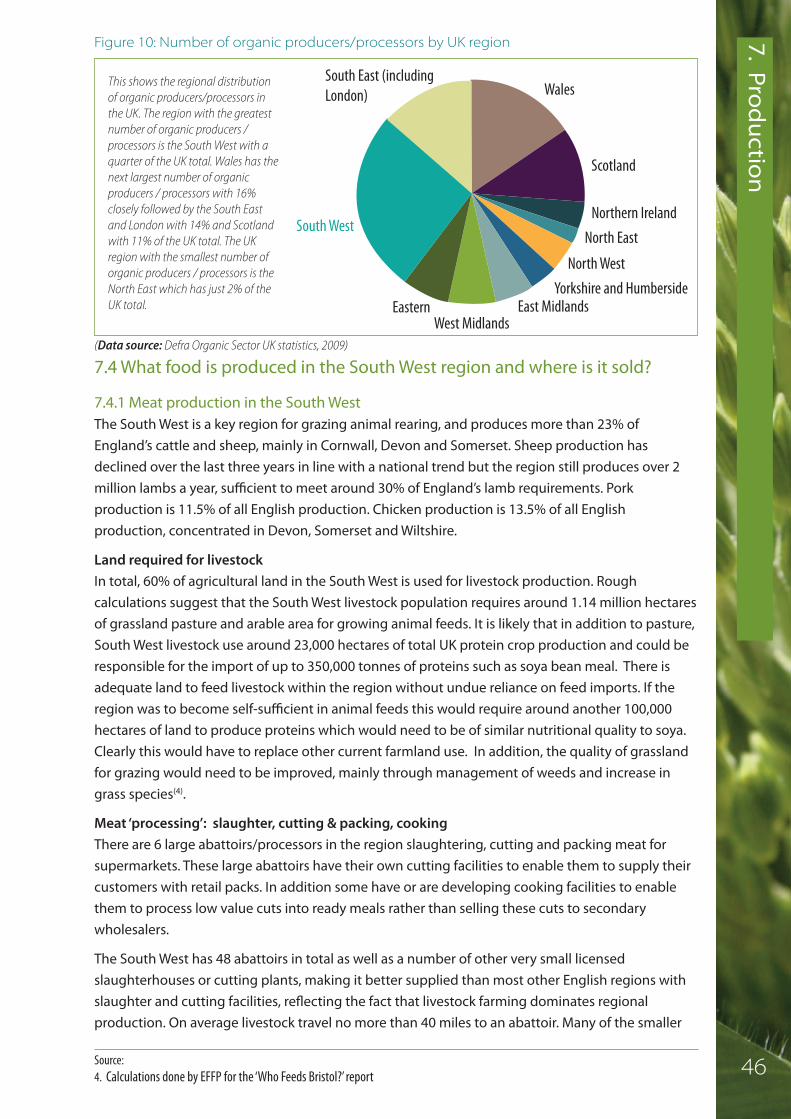
7. Productio
n
Wales
Scotland
Northern Ireland
North WestYorkshire and Humberside
East MidlandsWest Midlands
Eastern
South West
South East (includingLondon)
North East
(Data source: Defra Organic Sector UK statistics, 2009)
7.4 What food is produced in the South West region and where is it sold?
7.4.1 Meat production in the South West The South West is a key region for grazing animal rearing, and produces more than 23% ofEngland’s cattle and sheep, mainly in Cornwall, Devon and Somerset. Sheep production hasdeclined over the last three years in line with a national trend but the region still produces over 2million lambs a year, sufficient to meet around 30% of England’s lamb requirements. Porkproduction is 11.5% of all English production. Chicken production is 13.5% of all Englishproduction, concentrated in Devon, Somerset and Wiltshire.
Land required for livestockIn total, 60% of agricultural land in the South West is used for livestock production. Roughcalculations suggest that the South West livestock population requires around 1.14 million hectaresof grassland pasture and arable area for growing animal feeds. It is likely that in addition to pasture,South West livestock use around 23,000 hectares of total UK protein crop production and could beresponsible for the import of up to 350,000 tonnes of proteins such as soya bean meal. There isadequate land to feed livestock within the region without undue reliance on feed imports. If theregion was to become self-sufficient in animal feeds this would require around another 100,000hectares of land to produce proteins which would need to be of similar nutritional quality to soya.Clearly this would have to replace other current farmland use. In addition, the quality of grasslandfor grazing would need to be improved, mainly through management of weeds and increase ingrass species(4).
Meat ‘processing’: slaughter, cutting & packing, cookingThere are 6 large abattoirs/processors in the region slaughtering, cutting and packing meat forsupermarkets. These large abattoirs have their own cutting facilities to enable them to supply theircustomers with retail packs. In addition some have or are developing cooking facilities to enablethem to process low value cuts into ready meals rather than selling these cuts to secondarywholesalers.
The South West has 48 abattoirs in total as well as a number of other very small licensedslaughterhouses or cutting plants, making it better supplied than most other English regions withslaughter and cutting facilities, reflecting the fact that livestock farming dominates regionalproduction. On average livestock travel no more than 40 miles to an abattoir. Many of the smaller
Figure 10: Number of organic producers/processors by UK region
This shows the regional distributionof organic producers/processors inthe UK. The region with the greatestnumber of organic producers /processors is the South West with aquarter of the UK total. Wales has thenext largest number of organicproducers / processors with 16%closely followed by the South Eastand London with 14% and Scotlandwith 11% of the UK total. The UKregion with the smallest number oforganic producers / processors is theNorth East which has just 2% of theUK total.
46Source:4. Calculations done by EFFP for the ‘Who Feeds Bristol?’ report
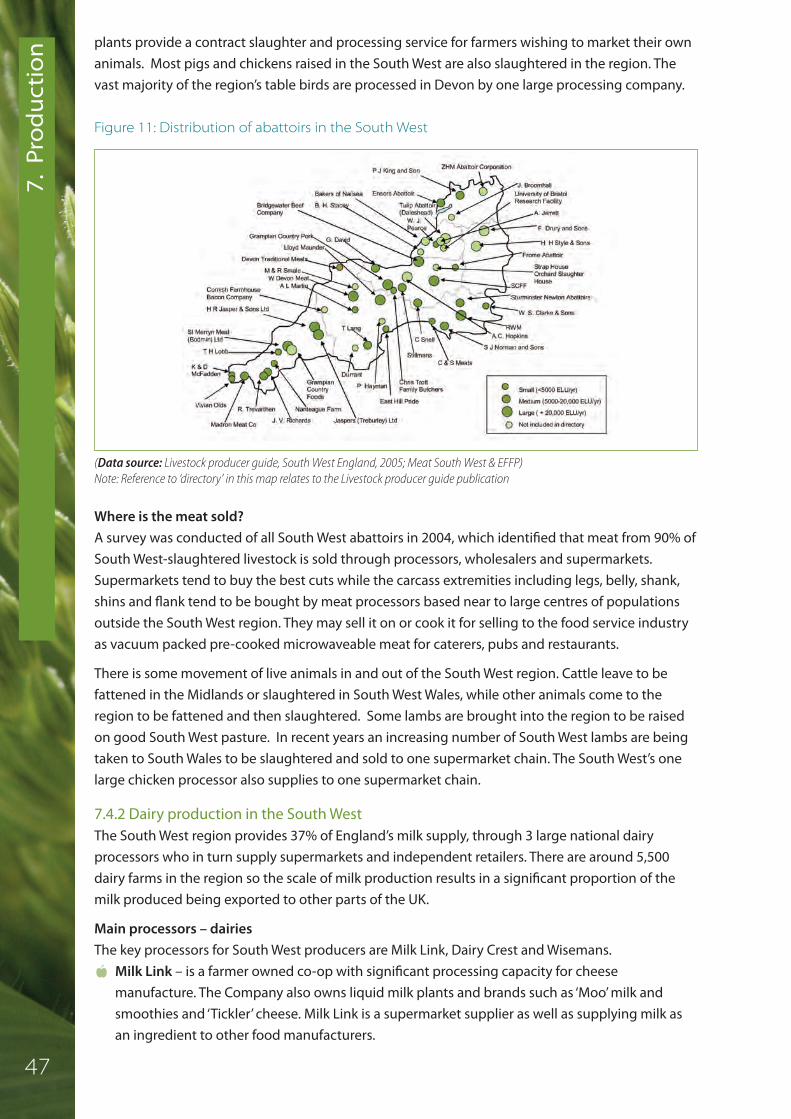
7. P
roduction plants provide a contract slaughter and processing service for farmers wishing to market their own
animals. Most pigs and chickens raised in the South West are also slaughtered in the region. Thevast majority of the region’s table birds are processed in Devon by one large processing company.
Figure 11: Distribution of abattoirs in the South West
(Data source: Livestock producer guide, South West England, 2005; Meat South West & EFFP)Note: Reference to ‘directory’ in this map relates to the Livestock producer guide publication
Where is the meat sold?A survey was conducted of all South West abattoirs in 2004, which identified that meat from 90% ofSouth West-slaughtered livestock is sold through processors, wholesalers and supermarkets.Supermarkets tend to buy the best cuts while the carcass extremities including legs, belly, shank,shins and flank tend to be bought by meat processors based near to large centres of populationsoutside the South West region. They may sell it on or cook it for selling to the food service industryas vacuum packed pre-cooked microwaveable meat for caterers, pubs and restaurants.
There is some movement of live animals in and out of the South West region. Cattle leave to befattened in the Midlands or slaughtered in South West Wales, while other animals come to theregion to be fattened and then slaughtered. Some lambs are brought into the region to be raisedon good South West pasture. In recent years an increasing number of South West lambs are beingtaken to South Wales to be slaughtered and sold to one supermarket chain. The South West’s onelarge chicken processor also supplies to one supermarket chain.
7.4.2 Dairy production in the South West The South West region provides 37% of England’s milk supply, through 3 large national dairyprocessors who in turn supply supermarkets and independent retailers. There are around 5,500dairy farms in the region so the scale of milk production results in a significant proportion of themilk produced being exported to other parts of the UK.
Main processors – dairiesThe key processors for South West producers are Milk Link, Dairy Crest and Wisemans. a Milk Link – is a farmer owned co-op with significant processing capacity for cheese
manufacture. The Company also owns liquid milk plants and brands such as ‘Moo’ milk andsmoothies and ‘Tickler’ cheese. Milk Link is a supermarket supplier as well as supplying milk asan ingredient to other food manufacturers.
47

7. Productio
na Dairy Crest – has liquid milk plants close to Bristol at Severnside and a cheese factory in
Cornwall. The Company has a producer group and buys milk from all over the country butdirects South West milk into supplying the South West processing plants to minimise ontransport costs.
a Wisemans – opened a milk plant near Bridgewater in the last five years and now has anagreement with Milk Link over milk procurement. Wisemans is a main supplier to Tesco,marketing local milk from Devon and Cornwall into retail stores.
The South West is also a key organic milk production area with many producers supplyingcompanies such as Yeo Valley through OMSCo (Farmer Co operative). Yeo Valley is the national retailmarket leader for organic yoghurt. The company buys milk from many different organic dairyfarmers across the region.
Other dairy businessesIt is easier for dairy than meat producers to develop independent processing facilities and theirown branded products. This is because the scale of investment required is lower than for the meatindustry and retailers are receptive to a range of interesting dairy products. Within the region thereis a diverse range of dairy businesses that buy milk from local dairy farmers and produce a widerange of high quality dairy products for consumers, both via the supermarkets and independentretailers.
7.4.3 Cereal production in the South WestOverall 70% of cereals grown in the South West are supplied to the livestock industry in the region.This equates to around 2 million tonnes of cereals.
The region is not renowned for producing bread-making wheat because the weather is too dampand cool, but the volume of wheat attaining biscuit making quality is increasing. The most commonuse for the majority of cereals produced in the region is for animal feeds including oilseed rape,beans, oats, wheat, spring and winter barley.
The flour milling industry has experienced significant consolidation in recent years with the twomain millers in the UK now being ADM and Premier Foods, both based outside the South West.Some South West food processors have pursued the opportunity to use South West cereals in theirproducts but have found it difficult to find millers and maltsters prepared to keep South Westproduce separate from their other supplies.
7.4.4 Fruit & vegetable production in the South WestThe South West produces around 6% of the vegetables grown in Great Britain but it dominates inspecific crops including potatoes and cauliflowers, and it supplies 18% of swedes. Good climaticconditions allow crops to be harvested earlier than in other parts of the country. Its main crops arebrassicas and root crops - potatoes, carrots, parsnips, celeriac, swedes. For all other vegetable cropsthe South West cultivates less than 300 hectares per crop (Defra Statistics). The region has around2,000 hectares of orchards including cider apple orchards in Devon and Somerset, and around13,000 hectares of soft fruit.
The small amount of fruit and vegetables currently produced in the South West is a consequence ofthe predominant large scale supply chain business models. In the late 1970’s, prior to the advent ofsupermarkets, the region was a more significant fresh produce grower. South West growers used tosupply individual greengrocer businesses, but were unable to scale up to supply the supermarketsdue to the relatively small field and holding size.
Within the South West, suitable land is available and could be used to increase fruit and vegetableproduction, and the farmers who know how to grow vegetables are still farming, but at the
48

7. P
roduction moment it is not a viable option for local producers because of lack of consolidation and because
of competition from cheap imports.
The competitive advantage of imports is partly because of better climatic conditions, cheaperlabour costs abroad (fruit & vegetables require manual labour in specific seasons), economies ofscale, low fuel cost for transportation and the take-up of EU subsidies that have not been utilised inthe UK. In addition, the current retail expectation is for absolute consistency and year-roundavailability of produce. If seasonal fruit and vegetables were to again become a cultural norm thenUK home-produced fruit and vegetables could become more valued products.
Where is it sold?The South West has two large scale growers and packers and they control half the region’sproduction of cauliflowers and supply mainly supermarkets. Half the crop is sent to be packed inLincolnshire for the supermarkets, and some goes to dicing and slicing processors in the East ofEngland.
The region lacks food storage and processing infrastructure, so currently most of the produce thatdoesn’t meet supermarket specification (‘out-of-spec’: too light/heavy; mis-shapen; slightlyblemished) is sent to the North of England to be processed.
Overall 75-80% of fresh produce is supplied to supermarkets and the rest to wholesalers.Mainstream producers of brassicas in the South West will aim to sell around 90% or more intosupermarket outlets because they get better prices. The ‘out-of-spec’ produce is aimed at wholesalemarkets. The situation for swedes is somewhat different with a higher proportion being sold toprocessing businesses in the East of the country.
Generally South West growers prefer not to sell their produce through wholesalers as the prices arelower and change regularly with strong competition from cheap imports.
It is impossible to know how much South West fresh produce is supplied into Bristol, as the finaldestination of produce sold into retail will depend on the depots served at any particular momentin time. During the winter months the South West supplies a significant proportion of both Bristol’sand the UK’s demand for potatoes, cauliflowers and swedes.
There are fruit and vegetable producers who sell direct to consumers through box schemes,farmers markets, and farm shops, a proportion of these are organic. These sales represent a verysmall proportion of total fruit and vegetables sales. The box schemes supplement their range ofproduce by sourcing imports from outside the South West and UK. Riverford Farm is the largest UKorganic box scheme operator, based in Devon and has four regional sister farms elsewhere inEngland in order to reduce food miles. (5)
7.5 Summary points
Around 90% of South West meat is sold through 6 large abbatoirs/processors into the nationalsupermarket supply chains. Perhaps 10% of South West meat is likely to be sold through the localbutchers and independent stores who get their meat from the smaller abattoirs and cutting plantbusinesses. Bristol is currently in the fortunate position of having 6 smaller abattoirs close by whichsupply the independent retail sector with traceable meat products. This processing capacitysupporting smaller scale livestock farmers is a key asset in terms of future food resilience.
If the South West region was to become self-sufficient in animal feeds this would require aroundanother 100,000 hectares of land to produce proteins which would need to be of similar nutritional
49 Source:5. Liz Bowles, English Food and Farming Partnership
7. Productio
nquality to soya. The impact on current land use and food production of finding another 100,000hectares to produce animal feeds of suitable nutritional quality would need further investigation.
Most of the milk from the region is sold through 3 large national dairy processors who in turnsupply supermarkets and independent retailers. There are many small scale dairy and cheesebusinesses along with Yeo Valley, a significant organic milk processor, based within the Bristol cityregion. Together they represent additional local supply capacity of dairy products alongside the 3national dairies.
The region produces a good range of cereals including oilseed rape, beans, oats, wheat, springbarley, winter barley, at least 70% of which is used for animal feeds. The region therefore relies forits cereals and wheat for human consumption on other areas of the UK and on foreign imports.Cereals supply is an area of potential vulnerability for the region.
Fruit and vegetable production on a significant scale across the region is limited. However, the landis suitable for vegetable production, which before the advent of the supermarkets used to be morewidespread. Somerset and Devon have areas suitable for orchards, which were once widespreadacross these counties. Lack of consolidation to allow efficiencies of scale that are required by thesupermarket supply chain business models, labour costs and a lack of viable alternative marketshave led to these significant reductions in fruit and vegetable production. Vegetable and especiallyfruit supply is an area of vulnerability for the region
50

8. Loca
l food supply
51

8. Local food supply

8. Loca
l food supply
‘The real mileage is not simply in buying local, but in making the best of local. The best local
supply chains can out-perform supermarkets on all these counts by a mile (supplier
relationships, environmental impacts, risks/vulnerabilities and the extractive shareholder
ownership business model) – the challenge is to create the circumstances in which buying
local does so as a rule.’ (Tom MacMillan, Food Ethics Council)
8.1 Importance of local food supply and local food economies
There has been much debate recently over the merits of re-localised food supply systems. There areconcerns about the impact of long supply chains(1). The case for re-localised supply of food stapleswhich can be produced in the UK and for production of highly perishable and bulk foods nearer tothe point of sale, has been strengthened by a better appreciation of food security issues, and ofgreenhouse gas emissions generated by global food production and distribution. A recent reporton local food and climate change sums up the current understanding.
‘Food accounts for at least a fifth of UK greenhouse gas emissions and the sector faces the
daunting challenge of reducing emissions by more than two thirds within the next forty
years. Until recently, the focus of public and political debate around the contribution food
makes to climate change was on transport. This saw local food become closely associated
with tackling climate change and other environmental problems. A succession of life cycle
assessments and scientific reviews over the past decade have highlighted that other factors
besides transport, such as the use of energy intensive farm inputs or even cooking in the
home, make a bigger overall difference to climate change.’ (Local food and climate change:the role of community food enterprise’; Making Local Food Work, 2010)
Local economic factors are also important. The opening section of the Food Ethics Council’s ‘FoodDistribution’ report tells a story about a farmer in Lincolnshire who supplies ‘beef boxes’ to localcustomers. It works out about as profitable for him to take a single animal to an abattoir in a trailerthan to send a load to the supermarket: the economies of scale on the latter are huge, but the pricehe gets from the supermarket is so poor that it justifies him slaughtering and selling animals one byone via a local meat box scheme.
The report concludes by setting out a vision of ethical and more localized distribution based on afuture scenario in 2022 in which:
‘The biggest reduction in greenhouse gas emissions from food and farming comes from
changes to our diets and to production systems rather than from cutting food miles. We eat
less meat and dairy and more fruit and vegetables, which benefits public health.’
‘Food is still traded internationally but there is a shift away from highly perishable produce
and bulk commodities towards products that acquire added value and durability through
primary processing near the point of production, as happens today with some fair trade
chocolate. Both importers and local food initiatives are expected to demonstrate that their
work contributes to sustainable development globally.’
‘Short-distance distribution networks flourish, as efficient shared infrastructure gives towns
and cities access to the social and cultural benefits of a thriving local food economy. The
weekly car trip to the supermarket is replaced by thriving community convenience shops,
diverse town-centre shopping and direct delivery for ‘drudge’ items. Urban food production is
commonplace.’ (‘Food Distribution: an ethical agenda’; Food Ethics Council 2008.)
8. How much food comes from within a 50 mile radius?
53 Source:1. ‘Food Distribution: an ethical agenda’; Food Ethics Council 2008; ‘Cooking up a storm’; Food & Climate Research Network 2008
8. Local fo
od su
pply
It is important to state at this point that the focus on local food supply in this report is in thecontext of increasing the supply of available staple foods from as close as possible and ofstrengthening the local food economy. As Vandana Shiva says in her book ‘Soil not Oil’:
“Most local food supporters agree that a transition to greater food localization doesn’t mean
imposing trade barriers and building walls of parochialism. Rather, it is about strengthening
local food networks and shifting our focus back to home turf. That way, we can source most
of our food from our immediate locality, while the food that is brought in beyond
community, regional, and national lines is done as sustainably as the extended food miles
will allow (i.e. with the same respect for producers, adherence to organic standards, and with
as minimal a dependence on fossil fuels as possible. As the import-hungry developed world
relocalises its tastes and purchases, this will also allow producers and farmers overseas to
concentrate on feeding their own communities and nourishing their own soil, instead of
working to satisfy the whims of fluctuating international food markets and the profit-
chasing aims of multinational food businesses.”(2)
Over the last decade the UK local food sector has developed significantly with much of the workled by environmental organisations in the voluntary sector. There has been much discussion ondefinitions of ‘local food’, for example from Sustain, the Soil Association, the Farmers’ Marketsmovement, Food Links UK, regional food groups and supermarkets. From the work on developingmore sustainable localised food systems the following guiding principles have been central:
a Proximity – food is produced and sourced as locally as possible minimising energy usage.a Provenance – the origin of all food ingredients are clearly traceable and labelled.a Local control – local ownership enables greater local financial re-investment and re-connection
with local communities.a Social Justice – food that is produced, processed and traded in a way that respects and
enhances environmental, animal and human health and welfare.
In considering the importance of local food supply, the key is to look at the whole food supplysystem including the kind of farm production system as well as the processing, packaging andtransportation. It is not just about food miles - it is about building a stronger local economy andhealthy communities. This can be achieved using resources more efficiently, improving soil andbiodiversity so as to maintain productivity in the long term and reaping the additional benefits ofbetter physical and mental health and stronger communities.
54
Lamb curry carbon footprint
The University of Manchester has developed a new carbon calculator (CCaLC) anddemonstrated that the carbon footprint of supermarket lamb curries is the equivalent of 140million car miles. They considered all life cycle stages in estimating the carbon emissions –including long-distance transportation for imported food and short distances related to foodshopping. They found that food production and processing are responsible for up to threequarters of the total carbon footprint for most food products, including:a Ingredients: 65% of the carbon footprint (lamb = half of the total) a Meal manufacture: 12-14% a Packaging: 4%a Transport: 2% a Storage at the retailer: 16%
“The same lamb curry prepared at home has a 20% lower carbon footprint, mainly because of
the elimination of the refrigeration stage at retailer needed for the ready-made meals,”
(Professor Azapagic, CCaLC, Manchester University) www.ccalc.org.uk
Source:2. ‘Soil not oil’; Vandana Shiva; 2007

8. Loca
l food supply 8.2 Assessing local food supply
This report focuses on staple food items. ‘Local food’ is taken to mean food that has been grown,reared and processed within a radius of 50 miles around Bristol city. No routine data exists aboutthe level of supply of locally produced food in the Bristol city region. Within the limited resourceand time available, a specific inquiry was conducted on local food supply for ‘Who Feeds Bristol?’.Although all the main supermarket chains have some level of regional food sourcing, supermarketswere not included in this investigation of local supply.
8.2.1 What food is produced within or close to the Bristol city region?The area that falls within a 50 mile radius of Bristol includes all of Somerset, Gloucestershire andWiltshire. This West of England agricultural region is similar to the rest of the South West andsupplies a wide range of staple foods: potatoes, milk, cream and dairy products, beef, lamb, poultryand eggs. 30% of wheat grown is for human consumption. Other crops serve both people andlivestock, for example oil seed rape where most extracted oil goes for human use and the pressedmeal for animal feed.
8.2.2 Assessment of the current and potential local food provision for BristolWe can consider the extent to which Bristol city itself could currently be supplied with food staplesfrom farms within a 50 mile radius, by relating population numbers and average adult foodrequirements to annual food production figures.
Analysis of Defra figures suggest that for Bristol city there is:a Adequate production of potatoes; milk, cream and dairy products; beef, lamb, poultry and eggs. a Insufficient supply of high quality wheat suitable for bread-making a Insufficient supply of fruit, vegetables, pork and bacon. (3)
However, this does not take account of similar demands from other areas of population in the Westof England like Gloucester, Swindon, Bath and Taunton; nor the larger urban areas of Birminghamand London, for which the ‘foodshed’ area extends right across England (See Geofutures map,section 12).
8.3 Available information on local food supply in the Bristol city region
There has been significant work to promote and support smaller scale food businesses has in SouthGloucestershire and in North Somerset. Both areas have local food directories. SouthGloucestershire council organizes an annual ‘Taste Festival’ for local foods and drinks to encouragemore direct links between producers and consumers(4). North Somerset has also worked to supportlocal food producers(5).
The ‘Eat Somerset’ project (2006-9) produced a directory to help connect producers to retailoutlets(6). Bristol has an on-line food directory for where you can buy local food and various foodfestival events(7). Bath and North East Somerset has a farmers’ market website with contact detailsfor all the producers(8).
Bristol city and the three other authority areas have a number of groups and individuals organizingurban food growing, links with local producers, cooking classes and other food-related communityevents. (See also section 12). To date, work in the region on local food supply has mainly focused on
55
Sources:3. Defra agricultural statistics and land use figures for 2009 & 2010; Royal Agricultural College, Cirencester. See appendix 84. www.southgloslocalfood.org5. http://consult.nsomerset.gov.uk/consult.ti/food_producers_survey/consultationHome; www.n-somerset.gov.uk/Business/Food/Local+Food+Directory/6. www.sustainweb.org/eatsomerset/eat_somerset_directory7. www.bristollocalfood.co.uk8. .www.bathfarmersmarket.co.uk)
8. Local fo
od su
pply
developing markets for local producers, on healthy eating, or on improving public foodprocurement of food from the region.
8.4 Overview of local food supply in the city region
Analysis of available data on local food supply in the 4 public food registers, local food directoriesand local food websites, and information collected in the ‘Who Feeds Bristol’ snapshot surveys withfood businesses and farmers markets suggests that across the city region: a 3% of registered food businesses are specifically known to supply food from the local region.a 39 fresh produce and farmers’ markets across the city region provide regular trade for around
*700 local food businesses, assuming an average of 20 traders per market.a At least 40% of the independent bakers (non-supermarket, non-franchise/chain), 30% of the
independent butchers and 7% of fishmongers are known to source locally.
(Note: *There are no exact figures available. If on average each trader attends 2 markets then perhaps the more realistic number
may be 350 businesses.)
8.5 Who Feeds Bristol survey on local food supply
In order to gain a better picture of the supply of food produced within the Bristol city region, weanalysed data from four different sources:
56
a) publicly available information and data to identify local food retail outlets; b) a snapshot survey of independent food retailers to find out who supplies them and how muchis sourced locally; c) a snapshot producer survey to find out to what extent local producers are selling direct intothe city region; d) a snapshot survey of the fresh produce and farmers markets to find out numbers of tradersand range of food products sold.
8.5.1 Bristol city region specialist retail premises: butchers, bakers and fishmongers As a first step towards finding out more about local food sourcing by independent specialist foodretailers, we used available data from the four food registers, to find out the total number ofbutcher, baker and fishmonger premises across the city region. These kinds of food retailbusinesses often have links with local suppliers and play an important role in local food supply.
Numbers are as follows:
a 116 butchers (includes 11 butcher sections within supermarkets)a 15 fishmongersa 120 bakers (includes 9 bakery sections within supermarkets; and at least 49 premises which are
part of chains: 26 Greggs, 18 Parsons, 5 Pullins). This leaves approximately 62 independentbakeries.
(For more detail see appendix 4)
8.5.2 Businesses specifically known to sell food produced locally As a second step, we reviewed available information on businesses known to work with localsuppliers. Collectively the farmers’ and country markets, farm shops, farm gate sales and theindependent shops listed as selling local food in the Bristol city region account for around 3% of allregistered food businesses dealing with staple food items in the city region. (Section 4, Table 1) Inaddition there are 39 farmers markets which between them may provide regular trade forapproximately 350-700 local food and drink businesses.

8. Loca
l food supply
8.6.3 Key bakery findings - 10% sample of Bristol city region bakery businesses
• Most of the small bakeries sell a similar range of baked goods and most usually bake most oftheir products on the premises with the exception of pies and pastries.
• Bako in Cullompton is a popular supplier for all bakery ingredients. Two reasons given for thisare its keen prices and as they are a co-operative their members get dividends.
• A number of ‘artisan’ bakeries source their flour from Shipton Mill in Gloucestershire (whichsupplies both local and organic flours). Locally grown wheat is also milled at Wessex Mill,Oxfordshire, another popular supplier.
• Having a local bakery is very important to customers but in general there is little interest inwhere the flour is sourced.
8.6.1 Key butcher findings - 10% sample of Bristol city region independent butcher shops
• Independent butchers sell a wide range of products including local meat products, provide aunique meat cutting service to the public and also prepare meat products from the cheapercuts eg sausages, burgers.
• Definition of ‘local produce’ as used by some butchers varies. • A wide variety of meat suppliers are used by the butchers surveyed, over half of which could be
termed ‘local’. • Sourcing locally produced halal meat is not possible – it comes from Wales or Birmingham
suppliers. • Customers seem to want to buy local meat products.• Local companies like Bakers of Nailsea (abattoir) and Freemans in Newent are key suppliers to
butchers shops.• People want to know where meat is from and how it’s been looked after – they do ask their
butchers about the provenance of their purchase.
Both the city regions fish wholesalers and distributors are based in Bristol and are key suppliers tothe retailers. • Fish is harder to define as local but there is interest from both consumers and the retailers to
source as much fish as possible from the South West if the price is right. • For the most part, fish products come from all over the world. • The personal touch is an important part of sales. Fishmongers know their customers personally
and can supply them with the fresh produce they want.
8.6.2 Key fish business findings - 20% sample of Bristol fishery businesses
At least 30% of the independent butchers and 40% of the independent bakers (non-supermarket,non-chain) are known to source food produced locally, and 40% of fishmongers are known tosource fish from Devon and Cornwall.
8.6 Snapshot surveys of independent retailers
Having identified the specialist independent retailers, a sample of butcher, fishery, bakery and fruit& vegetable businesses were surveyed. Samples for butcher and bakery businesses were fromacross the city region. Samples of fishery and fruit & vegetables were from Bristol. The surveysinvestigated types of products, suppliers, the importance of local sourcing and retailers’perceptions around their role in feeding Bristol.
57

8. Local fo
od su
pply
CASE STUDY 4:
Mark’s Bread – a successful ‘real’bread business
Mark’s Bread was established in 2009. It bakes and sells awide range of breads including sourdough, rye and speltloaves, wholemeal, baguette and ciabatta, cakes,croissants and buns. The bakery’s customers are localresidents and businesses including the Tobacco FactoryTheatre, Riverside Garden Centre, Hen & Chicken Pub.
The bakery employs 6 staff and sells between 200 and 500 loaves per week (in addition to cakesand croissants) to around 300 customers per day, alongside 5 wholesale customers. Mark hasbeen marketing his baked goods via his bakery shop and website, and through positive mediacoverage and word of mouth. Currently all sales are generated within the Bristol area, but Mark isconsidering repeating his bakery model elsewhere in the region.
Local sourcing and sustainability are very important to both Mark and his customers. Marksources local organic flour from Shipton Mill in Gloucestershire. For specialist breads the nuts,seeds and spices are sourced from Essential Trading in Bristol, olives from the Real Olive Co, oliveoil from Kassare, local free range eggs for cakes are from a local producer and catering dry goodsfrom Burtons Go Bananas at Avonmouth. Recently he invested in a Dutch delivery bicycle andtrailer so the shop can deliver larger orders of baked goods to its customers in south and centralBristol in a sustainable way while beating the traffic.
www.marksbread.co.uk(See full case study, appendix 11)
8.6.4 Key fruit & vegetable findings - 10% sample of Bristol greengrocers
• All the retailers sell a wide range of local and seasonal fresh fruit and vegetables.• Retailers are also sourcing complementary products from other suppliers like eggs, honey,
herbs, nuts & seeds, olives.• 90% of fresh produce sold by small retailers across Bristol is sourced from the St Philips Market.• Both retailers and their customers prefer to buy local, seasonal and British.• Retailers would buy more produce from producers in the West of England and South West
region if it was available. However, currently small local and organic producers are not wellrepresented at St Philips Market.
• All report they feel threatened by supermarkets like Tesco and Sainsbury opening ‘express’ and‘local’ stores on high streets.
• Often fresh produce is ‘more expensive’ in supermarkets than from local fruit and vegetableshops despite perceptions that supermarkets are cheaper (for example the supermarket ‘twofor one’ offers).
• Local retailers feel they are offering a personal service versus ‘automated or self service’ withtime to talk to older people and families. Some of them offer a ‘home delivery’ service orvegetable box scheme to increase and diversify trade. 58
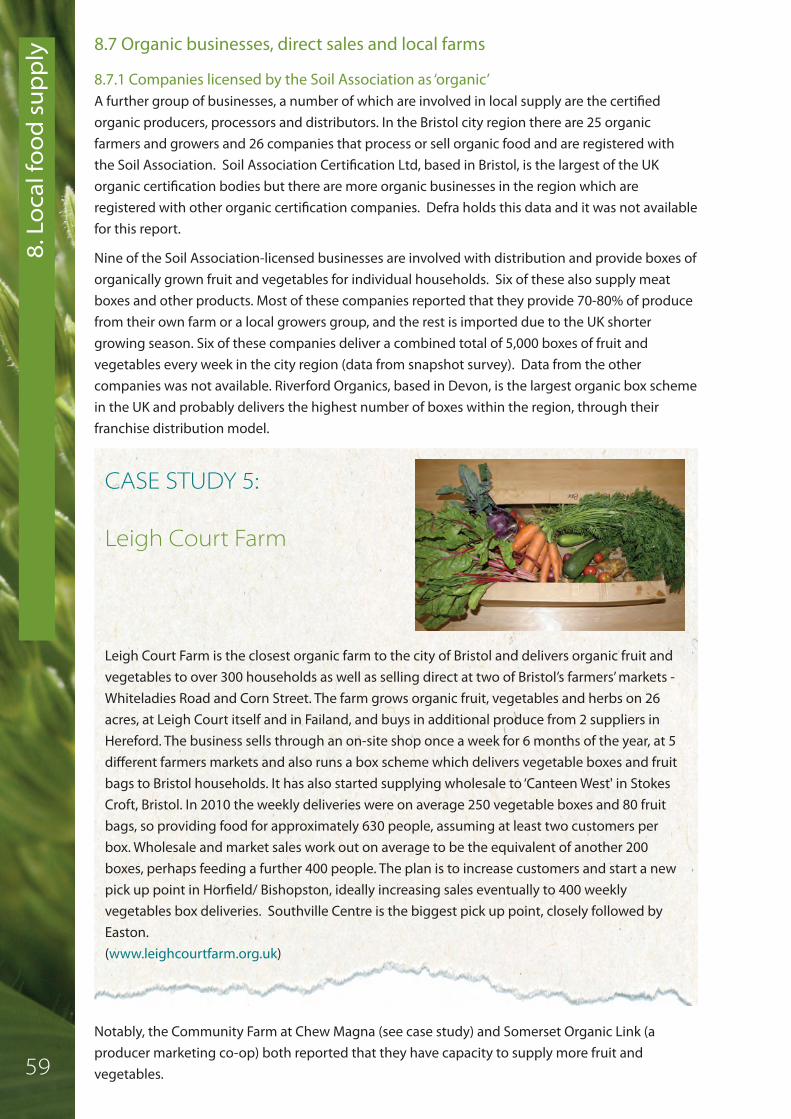
8. Loca
l food supply 8.7 Organic businesses, direct sales and local farms
8.7.1 Companies licensed by the Soil Association as ‘organic’ A further group of businesses, a number of which are involved in local supply are the certifiedorganic producers, processors and distributors. In the Bristol city region there are 25 organicfarmers and growers and 26 companies that process or sell organic food and are registered withthe Soil Association. Soil Association Certification Ltd, based in Bristol, is the largest of the UKorganic certification bodies but there are more organic businesses in the region which areregistered with other organic certification companies. Defra holds this data and it was not availablefor this report.
Nine of the Soil Association-licensed businesses are involved with distribution and provide boxes oforganically grown fruit and vegetables for individual households. Six of these also supply meatboxes and other products. Most of these companies reported that they provide 70-80% of producefrom their own farm or a local growers group, and the rest is imported due to the UK shortergrowing season. Six of these companies deliver a combined total of 5,000 boxes of fruit andvegetables every week in the city region (data from snapshot survey). Data from the othercompanies was not available. Riverford Organics, based in Devon, is the largest organic box schemein the UK and probably delivers the highest number of boxes within the region, through theirfranchise distribution model.
CASE STUDY 5:
Leigh Court Farm
Leigh Court Farm is the closest organic farm to the city of Bristol and delivers organic fruit andvegetables to over 300 households as well as selling direct at two of Bristol’s farmers’ markets -Whiteladies Road and Corn Street. The farm grows organic fruit, vegetables and herbs on 26acres, at Leigh Court itself and in Failand, and buys in additional produce from 2 suppliers inHereford. The business sells through an on-site shop once a week for 6 months of the year, at 5different farmers markets and also runs a box scheme which delivers vegetable boxes and fruitbags to Bristol households. It has also started supplying wholesale to ‘Canteen West' in StokesCroft, Bristol. In 2010 the weekly deliveries were on average 250 vegetable boxes and 80 fruitbags, so providing food for approximately 630 people, assuming at least two customers perbox. Wholesale and market sales work out on average to be the equivalent of another 200boxes, perhaps feeding a further 400 people. The plan is to increase customers and start a newpick up point in Horfield/ Bishopston, ideally increasing sales eventually to 400 weeklyvegetables box deliveries. Southville Centre is the biggest pick up point, closely followed byEaston. (www.leighcourtfarm.org.uk)
Notably, the Community Farm at Chew Magna (see case study) and Somerset Organic Link (aproducer marketing co-op) both reported that they have capacity to supply more fruit andvegetables. 59

8. Local fo
od su
pply
CASE STUDY 6:
The Story Group – organicmeat producers selling direct
Luke Hasell and Jim Twine took over their neighbouring family farms in the Chew Valley in 2004and now farm in partnership as an organic beef enterprise which covers 415 acres and supports astrong suckler herd of 60 cattle. They do not buy in any animal feed since the animals are allgrass-fed and the farm grows their own cereals for winter feed. Jim and Luke established theStory Group Ltd to develop direct sales, a buying group and promotion of their organic meat boxscheme. The Story Group markets their meat direct to pubs, restaurants, schools and box schemecustomers. On average the Group sells one animal per month directly which has the advantagesof adding abattoir and haulage costs into the retail price of the meat. This means Jim and Lukecan cover all their costs within the price they charge their customers.
In 2010 Bill and Emma Yeats joined forces with Story Group Ltd. They manage an organic poultryfarm in Wrington producing 200 chickens a week and a small amount of pork and lamb. Thebenefits of working together include a wider range of branded products, and the opportunity todevelop a farm shop and collective meat processing area. The company now has 4 directors, 1 fulltime employee on the farm and 1 part time employee working for the Group. Bill and Emma nowbreed some of their stock of chickens on Luke and Jim’s farms.
The Story Group uses 3 local abattoir and meat cutting businesses, Langfords of Bristol University,Bakers of Nailsea and Will Simmons of Priddy. At the moment the Group delivers on a monthlybasis to customer collection points. Its main customers in Bristol are the Better Food Company, StChristopher’s School, Pony and Trap pub and Stoke Inn in Chew Valley, and several box schemecustomers. Currently, 40% of total sales are generated in the Bristol area and the aim is to expanddirect sales to increase income. A major challenge for the Group is that they do not turnoverenough product to enable the business to offer customers the same discounts and deals as thesupermarkets.
www.thestorygroup.co.uk(See full case study, appendix 11)
8.7.2 Direct salesThere are a few companies that specialize in locally sourced food products or foods with a clearprovenance (ie place of origin). They may use internet marketing and mail order or sell at foodmarkets. Somerset Local Food Direct provide a delivery service of meats, fish, bakery, fruit &vegetables, delicatessen products, 90% of which originates from Somerset. They have reportedcapacity to supply more.
8.7.3 Farms located within Bristol Within its administrative boundary Bristol has four city farms, in the north, south and central areasof the city, all of which are involved in some level of food production and education. There are alsocouncil owned smallholdings and tenant farms which are leased out. There are at least two otherfarms within Bristol city that produce food. Elm Tree farm has a small number of livestock (cows,pigs, poultry), keeps bees and grows fruit and vegetables on 27 acres (11 hectares) which is sold at 60

8. Loca
l food supply
the weekly Corn Street farmers market. Cherry Orchards in North Bristol has around 30 acres of landclose to the residential area of Coombe Dingle and is keen to supply local households with fruit andvegetables.
8.8 Snapshot producer survey
An on-line survey of producers in the South West and Bristol City region was undertaken to gain abetter understanding about: a) the extent to which local producers are selling direct into the Bristolcity region, b) the barriers to increasing local supply through direct sales and c) the type of supportthat is needed in order to increase direct sales. ‘Direct’ was defined as selling directly to a retailoutlet, at a farmers market or supplying a restaurant, as opposed to selling to regional or nationalwholesalers or processors. The survey also investigated the level of producer interest in developingnew supply into the Bristol area. This was a rapid ‘snapshot’ survey, but the results provide anindication of the current range of local supply and practical ways to support growth in local foodsupply in Bristol.
8.8.1 RespondentsThe survey was circulated to unknown producers via the regional NFU newsletter, to known directsellers via farmers’ market co-ordinators and to a number of producers identified in the course ofthis research whose markets were unknown. In total 63 producers responded to the survey. Ofthese, 60% are primary producers ie farmers and growers who raise livestock and or grow crops. 51respondents are direct sellers (not all exclusively Bristol area) and 5 additional producers who areinterested in selling direct.
8.8.2 Current local supply and direct sales - summary of responsesThe headings below relate to the questions in the on-line survey.
Types of respondents
Type of products
Potential for increased sales
• Of the primary producers who responded, 71% farm grassland (reflecting the pattern of SouthWest livestock production).
• 34% are horticultural growers (which is much higher than the regional average - see section 5).
• Around two thirds of the producers surveyed would like to sell more produce directly toconsumers in the Bristol area.
• There is potential for growth in direct sales particularly in meat, poultry and dairy products • The strongest desire to sell more of a product direct and the strongest interest from producers
who are not yet selling that product direct was with dairy products.
• The direct sellers reported that most commonly they sell beef, lamb, dairy products and eggs. • There are a high number of pig producers selling direct. Pig producers in the UK struggle to
remain economically viable due to low prices so have to find interesting ways to sell theirproducts at better prices. The high number of pig producers selling direct therefore reflects a)the need to ‘add value’ to processed pork products, for example sausages, bacon and pies andb) the need to find alternative markets.
• A number of large scale meat producers reported that they are already selling direct, or areinterested to sell direct. Given that large scale meat producers in the South West regiongenerally already have good market opportunities for selling large volumes into themainstream supply chains (see section 7), this is an interesting finding and seems to indicatethat there is potential for growth in direct meat sales.
61

8. Local fo
od su
pply
Estimated economic impactsThe survey asked producers about annual turnover, and about percentage of turnover generatedby various markets.
• Producers of bread, preserves and game already rely heavily on direct sales, in contrast toproducers of beef, dairy and eggs who sell a proportion of their produce to wholesalers andfood processors.
• Half of the producers surveyed are interested in increasing direct sales by a minimum of 50%.This indicates that current direct sales are restricted by access to customers rather than theavailability of local produce.
• 50% of producers who currently don’t but are interested in starting to sell direct into the Bristolarea would like to sell around 25% of their produce into this market, while a third of this groupwould be interested to start selling up to 75% of their produce direct to consumers. Thissuggests there is a significant level of interest from producers in more local supply.
• 72% of producers surveyed employ none or less than 5 staff, partly as many are family managedfarm-based businesses and the majority of respondents can be characterised as small tomedium size businesses.
• Local food products which are regularly sold through wholesalers and processors include SouthWest branded cheeses, dairy products, fish and non-alcoholic drinks.
• Most of the producers surveyed sell their products into several markets. • The primary market for 67% of producers surveyed is direct sales to consumers in the Bristol
area through farmers markets, farm gate sales and box schemes. • 56% sell to national and regional wholesalers and processors. • 29% sell to independent food retailers, compared to only 14% who sell to caterers, restaurants
and pubs. 7% reported mail order sales.• Direct sales to consumers as well as sales to wholesalers and processors are preferred over
other markets as they offer a higher return for a lower investment in terms of staff, marketingand distribution.
• Sales to South West wholesalers and processors are very low other than for dairy producers (thisrelates to high levels of regional dairy production, large processor dairies and the production ofSouth West branded cheeses – see section 7).
Types of markets used
Scale of operation
• Only a minority of producers can sell all their produce through direct sales.• 54% of businesses who sell direct have between 10 and 25% of their turnover from those sales• A small majority (57%) of businesses who sell to national wholesale markets or processors (e.g.
livestock market or abattoir) have over 50% of their turnover from those sales• Some businesses who are not selling direct currently sell all their produce through national
wholesale markets or processors• There are a number of other outlets which are significant for some respondents: direct sales
outside Bristol area, retail outlets and markets in London, Gloucester, Stroud, food festivals andshows, caterers.
Relative importance of different markets (based on % turnover from different sales)
• Direct sales – Using data provided by 46 respondents, their combined estimated total annualdirect sales turnover value is around £3million. If it was possible to find out how manybusinesses actually sell direct into the Bristol city region, it might be possible to extrapolate anestimated overall turnover figure for direct sales.
Potential for increased sales cont.
62

8. Loca
l food supply
8.8.3 Barriers to selling direct into the Bristol city region – summary of responsesThe headings below emerged from analysis of the responses.
• Farmers markets – There are 39 markets in the Bristol city region. The snapshot market surveysuggests that on average each market has 20 stall holders – which suggests up to a total ofaround 700 businesses. Taking into account that on average each business may attend twomarkets, the number may be closer to 350 businesses. If 92 of these businesses (just over 25%)fall into the 25-50k turnover category, using the previous figure for 46 producers, we can makea very rough estimate that the farmers markets alone may support total annual sales turnoverin the region of £6 million. In the context of national farmers’ market average turnover thisfigure may be too high but these findings suggest that further support and research into therole that food markets in the region play in the local food economy would be very valuable.
• Cash flow – Regular farmer and country markets provide traders with a regular cash flow whichin the world of farming where credit is very difficult to get is a business lifeline. This isparticularly vital for livestock producers whose income from sales are often seasonal. Sellingweekly at a market provides weekly income.
Promotion
Transport and distribution
• Producers selling direct through farmers markets, food festivals and farm shops haveexperienced a reduction in sales since the start of the recession as customers have lessdisposable income. Consequently, the majority of producers would welcome support to findand target new customers interested in local food, and additional marketing and promotion oftheir products’ quality and value to win increased sales.
Staff capacity limitations
• Many producers reported that the lack of capacity in terms of time and staff to produce,process, transport and sell their products was a barrier. Some producers have had to reducestaff during the recession and have difficulty staffing farmers markets. Some farming familybusinesses are hoping that younger family members will want to take over and develop thebusiness in new ways. A real issue for small farm businesses is product pricing and profitability.
High costs of meat infrastructure for local marketing
• Meat traders reported a range of issues that were barriers to growth including: need to developon-farm butchery facilities in order to develop new markets; slaughtering and delivery fordirect sales of meat is difficult and expensive; costs for developing cold storage, labelling,refrigerated transport and staffing can be prohibitive for an independent trader.
Limited supply capacity
• Some producers of local foods including meat, eggs and vegetables reported they only hadsufficient volumes of produce to meet current demand from their existing outlets and forseasonal sales. In order to invest in increased production they would need to be confident ofincreased and sustained demand.
• Producers reported that the costs of transport and distribution prevented many of them sellingtheir products to retailers, caterers, hotels, restaurants and pubs in the Bristol area. Someproducers had tried selling into these markets but found it was expensive to do lots of smalldeliveries, also since the recession the demand from local shops and cafes has fallen. Someproducers reported they would like to sell to these markets but a key barrier relates tocollection and distribution of their produce. It is not efficient or financially viable for everyproducer to individually undertake small deliveries, and an effective distribution network islacking.
63

8. Local fo
od su
pply
8.8.4 Support needed to expand supply of local foods into Bristol and the city region –summary of responsesAgain, the headings below have emerged from analysis of the survey responses.
(For more detail on the Who Feeds Bristol producer survey, see appendix 3)
Market research & information
• Producers suggested a range of market support initiatives to help them sell increased varietyand volumes of local foods into new markets in Bristol including schools and hospitals, retailersand restaurants. Producers requested market research to identify new customer groupsinterested in buying local food. In particular, market intelligence on bulk buyers of stapleproducts like eggs, dairy, meat and vegetables. It is more profitable for producers to sell largequantities to wholesalers or regular orders to networks of retailers and restaurants.
A local food distribution hub
• Producers identified the need for development of a local food hub for the Bristol area to co-ordinate collection from farmers and growers, wholesale orders, and refrigerated transport anddistribution services. A local food hub could deliver new opportunities for local producers withhigher volumes of sales, wider distribution networks and cheaper delivery costs. A food hubcould collaborate with market organisers to deliver advertising and promotion campaigns onthe value and benefits of buying local food to new customer groups. A local food hub websitecould offer collective marketing and internet sales. In addition, it could offer access to linkedbusiness advice and training for local producers and processors on how to brand and markettheir products, and on new product and niche market development. This service could besupported with access to ‘local food business development grants’.
• Fruit and vegetable producers in the Severn Vale and Vale of Evesham already organize freshproduce auctions three mornings a week between themselves. The auction is run by oneperson as his business and it enables those businesses that sell direct, for example farm shopsand market traders, to buy in other locally grown items from farms known to them and thusextend their range of produce. The auction is aimed at farms within a 50 mile radius.(Information from snapshop producer interview)
Producer co-operation
• Some meat producers identified the need to develop collective slaughtering and butcheryfacilities in the Bristol area and suggested this could be designed as a co-operative scheme.(Given that there are good abattoir services in the city region, this area needs moreinvestigation but it may relate to the economics of dealing with small volumes).
Consumer awareness
• Many producers believe that consumers would benefit from guidance on how to store, prepareand cook fresh local foods with access to cooking demonstrations and classes, recipes andtasting sessions. These opportunities could be promoted through campaigns and eventsinitiated by the food hub and through a local food website with leaflets distributed at farmersmarkets and via retailers.
Potential for future growth
• Local producers suggested there was scope to attract other farmers, growers and processors oflocal foods to help expand supply into Bristol. With the support from a food hub that deliveredco-ordinated promotion, public awareness, cookery demonstrations, price comparisons andawareness raising there is potential to establish additional farmers markets in districts of Bristolthat are not well supplied with fresh produce. The producers identified opportunities todiversify and develop new ranges of value added local food products to expand the offer tocustomers and increase sales. Good examples of successful products include sausages, pies,cakes and preserves. 64

8. Loca
l food supply 8.9 Farmers/fresh produce & country markets snapshot survey
The purpose of the markets snapshot survey was to find out about the numbers and types ofmarkets, the numbers and types of traders and the range of produce sold. Currently, there are 39farmers’ and fresh produce markets in the Bristol city region. 17 of these were surveyed ie 40%.(Note: These are specifically food markets and do not include secondary wholesaler market traders like the St
Philips Sunday market or the Eastville Fri-Sun market in Bristol.)
8.9.1 Number of tradersThe number of traders at the different markets varies substantially. Of the 17 surveyed marketsthere were a total of 470 producers. The Love Food festival has 150 traders at its market eventswhile Fishponds has a very small market of just 5 stalls. Excluding these two extremes, the averagenumber of traders is 20 with (the highest is 47 at Bath farmers market and 11 at both University ofWest of England and Willsbridge markets). The average number of stalls per market in the cityregion is 20.
8.9.2 Range of market produceNot all markets provided full lists of numbers and types of traders. The categories we foundincluded meat, poultry and game; dairy; bread; eggs; fish, fruit & vegetables; drinks; delicatessen/prepared savouries/ preserves etc; cakes & chocolates; other edibles.
Analysis of the main product categories for a sample of 5 markets identified the following range ofproducts and proportion of traders:
• Delicatessen products, prepared savories and preserves overall account for the highest numberof stalls, ranging from 18% to 46% of all market trade within the sample surveyed.
• Meat stalls account for 20% of trade at each market. • Number of fresh fruit and vegetable stalls range from 4% (Slow food market) to 18% (Bristol
farmers market).• All markets feature higher numbers of cakes and sweets stalls than dairy, bread, eggs or fish
stalls.
• Weekly – 13 (33% ie a third of all markets)• Monthly – 21 (53% ie over half of all markets)• Twice monthly – 4 (10% of all markets)• Quarterly - 1
• Weekly – 4 (2 in Bristol, Bath, Willsbridge)• Monthly – 10 • Twice monthly – 2• Quarterly – 1 (Love Food festival in Bristol)
(Note: Markets included in the sample: Bristol Corn St farmers market; Bristol Slow Food market; Keynsham
farmers market; Midsomer Norton farmers market; Nailsea farmers market)
8.9.3 Regularity of marketsWe reviewed the regularity of all 39 markets with the following results
The regularity of markets in the sample of 17 was as follows:
65

8. Local fo
od su
pply
8.9.5 Contributors to market successThere are a range of reasons that influence the success of local food markets the most important ofwhich are location and timing, range of products, promotional activities like sampling and cookingdemonstrations and complementary social activities around the market. The face to face humanfactor of committed stallholders interested in their customers is an important factor. For example,Bath Farmers’ Market stated “we make friends with our customers”.
8.9.6 Barriers to market success:These reflect views from the producer survey and include the following key points:
8.9.4 Market principles & farmers market certificationThe markets and stallholders surveyed are specifically fresh produce ‘country’ and ‘farmers’ markets,almost entirely focused on food from the local area.
• Of the 40% of markets surveyed Clevedon, Portishead and Nailsea are the only markets listedon the farmersmarket.net website (ie members of FARMA), although Nailsea is not certified withthem.
• Bath is the only market surveyed which defines their ‘local’ produce: sourced from within a 40-mile radius of the city, although that is a flexible rule in order to allow a varied and interestingrange of sellers.
• The majority of markets are not certified with FARMA because they include popular stallholderswho sell products they do not produce themselves which does not comply with the criteria, sothe market organisers have chosen to forgo certification. For example, Nailsea market statedthey are not certified with FARMA as by public demand they have a fish stall which doesn’tmeet the strict certification criteria.
• Local food markets specialise in promoting producers selling products that are ‘local’,‘traditional’, ‘fair trade’, ‘high quality’ and ‘eco-friendly’.
• The Love Food Festival states the aim of their festival is “to get children and adults learningabout how and where our food comes from, how to grow and cook food”.
• The Slow Food market has a list of criteria for its produce on www.slowfoodbristol.org. The organisers commented “The criteria will develop and evolve with the market”.
• Perception that farmers’ market produce is expensive. Some markets reporting lowerattendance since the ‘credit crunch’.
• Location – eg too far from a central busy area; no parking or easy public transport access • Lack of cooking skills – people less likely to buy fresh raw ingredients (the markets surveyed
have a high percentage of deli/’ready to eat’ food stalls).• Weather/seasons – bad weather keeps customers (and sometimes producers) away. Holiday
seasons can be quiet.• Competing traders nearby – eg supermarkets opening up on High Streets.• Consumers’ lack of understanding of seasonality – customers may expect the complete range
of worldwide foods as in supermarkets.• Lack of publicity – and the time required to increase publicity.• Lack of producers – difficult to get hold of; many are already busy at other markets.• Lack of resources – funding, staff/volunteers etc.
66

8.10 Summary - Key Points
There is a rich resource of local producers, food and drink businesses located around the Bristol cityregion which represents a significant strength in terms of longer term food resilience. The ‘WhoFeeds Bristol’ research findings suggest that the main barriers to increased direct supply of locallyproduced food are practical distribution logistics and consumer support rather than a lack ofsupply. In terms of volume, the direct sale of locally produced food currently represents a very smallproportion of the total food supply but there is a wide range of basic staple food types available.
Some producers reported additional capacity to supply but a lack of market opportunities. Thereare some larger scale producers who are looking for more local and direct markets. More support is needed to strengthen and develop market opportunities and build on those that are already asuccess.
Regular farmer and country markets provide traders with a regular cash flow which in the world offarming where credit is very difficult to get is a business lifeline.
There are some significant barriers to expansion of local supply, but the producers themselvessuggested a range of practical solutions and support. In short, much of the local supplyinfrastructure is currently in place but without focused support it is difficult to achieve furthergrowth. In addition, without far sighted policy and planning in place the current infrastructure oflocal supply remains vulnerable.
In the long term it is likely that the UK will need to rely more heavily on food produced with lessfossil fuel and with less external inputs of chemicals. Therefore there is a need to preserve andenhance the infrastructure that supports local production in preparation for changes relating toenergy, economy and environment.
8. Loca
l food supply
67

9. Catering

9. Catering
9.1 The city region’s caterers, food processors/manufacturers
Companies that prepare and cook food for us include caterers, food processors and manufacturers.Across the city region, caterers account for some 75% of registered food businesses whileprocessors and manufacturers account for around just 1.5 % (section 4, table 1). These figuressuggest that catering must therefore be a much larger sector than processing and manufacturing.However many of the caterers are small-scale home caterers, take-aways and cafes while some ofthe manufacturers are large-scale and owned by national and multinational companies. It isbeyond the scope of this report to precisely quantify the scale of each sector. Sections 9 & 10 lookat both sectors and at the potential for these businesses to help drive positive change andcontribute towards the development of a more resilient food system. The focus in section 9 & 10 ison businesses within Bristol city. In both these sectors information on where the food originatesfrom ie. food provenance, is often unavailable to the end customer.
9.2 Bristol’s catering sector
Table 7: Food businesses in Bristol city
Within Bristol itself around 74% of registered food businesses are caterers. This totals some 3400businesses. The Bristol public food register catering category covers a wide range of businessesincluding alcohol licensed clubs, pubs serving snacks, sports centres and community halls. Evenexcluding these businesses, there is still a wide range of types of caterers with varying scales ofoperations as shown in Table 8.
9.3 Caterers serving meals
On closer analysis, the proportion of Bristol businesses that actually serve meals made from stapleingredients is around 62% of all Bristol’s food businesses equivalent to some 2,254 businesses.These catering businesses can be subdivided into six main types (see Table 2) but getting accuratefigures is problematic.
We estimate that: a Takeaways and cafes account for 30% of catering businessesa Restaurants account for 13% a Pubs account for around 8%. a Health, social and education catering establishments account for approximately 25%a Catering companies (of different types and scales) account for the remaining 24%.
Type of business % of total Bristol food businesses
CateringRetailProcessor/manufacturerWholesale/distribution
74%21%
3%2%
(Data source: Bristol public food register; July 2010)
9. Which companies prepare and cook our food for us?
69

9. Caterin
g
Dining out:
• Cafes, restaurants, pubs• B&B’s, hotels, cafes and restaurants (ie hospitality sector).Takeaway & convenience food:
• Takeaways (inc: chinese, pizza, burgers, fish and chips, sandwich shops) • Mobile caterers. Commercial catering businesses:
• Contract caterers• Home caterers.
Business institutions:
• Staff and work canteens,• Sports and leisure centres.
Educational institutions:
• School & college kitchens, cafes and canteens • Breakfast and after school clubs.
Table 8: Breakdown of Bristol caterers by type
Health and social care institutions:
• Hospital kitchens, cafes & canteens• Care homes, nursing homes, residential homes, day centres, social service kitchens, meals on
wheels, lunch clubs.
70

9. Catering
It is interesting to note the higher density of takeaways in a swathe from east to west across thecity. Notably, these are the same communities in which FareShare distributes ‘free food’ (see casestudy and appendix 11).
9.4 Convenience food caterers
Takeaways and cafes account for 30% of catering businesses; restaurants for 13% and pubs around8%. The map below shows the distribution of takeaways around the city.
71
Map 4: Bristol takeaways
9. Caterin
g9.5 Key players in the catering sector
The health, social and education catering establishments account for approximately 25% of allcatering companies in Bristol and collectively are likely to provide a much greater volume ofcatered food than the other caterers. Typically the health, social and education establishments areinvolved in public sector catering and public procurement processes.
Within Bristol there are several major hospital sites, 2 main universities with multiple sites, 4 furthereducation colleges and over 180 schools, all of which provide meals for their staff, patients andstudents. In addition, the City Council has its own contracted catering company. Most of theschools in the city are catered for by one of four companies: Eden Food Service; ISS Caterhouse;BAM FM; and Early Years Catering.
Bristol is home to several large companies and agencies which will either have their own caterers orwill contract-in commercial catering companies. For example, Milburns, part of Compass Group,has the catering contract for Bristol Zoo Gardens.
Further research is needed to understand this group of public and private sector caterers, theircatering arrangements, procurement and food purchasing policies and the collective value thattheir food purchasing power represents. It will be a very high proportion of the total catering in thecity.
9.6 Caterers can drive change towards a more resilient food system
‘Aberystwyth University’s canteen now sources 80% of its beef, pork and lamb and 20% of its
fruit and vegetables from university-owned farms, with the remainder coming from small
local producers.’ (The Guardian, October 2010)
There are now a number of best practice examples around the UK where public sector caterers inschools, universities, hospitals and company canteens are helping to drive positive changestowards sustainable food using fresh seasonal ingredients and by increasing the amount of foodthat is bought from local food producers. Aberystwyth University Canteen and Early Years Cateringin Bristol (see below) are two examples. (Full case study details in appendix 11).
There have also been recent national legislative changes to public sector catering in response tocampaigning work about improving school meals. In 2006 national ‘nutritional standards’ wereintroduced. All food provided by local authorities must now meet the following standards:
a High quality meat, poultry or oily fish regularly availablea At least two portions of fruit and vegetables with every meala Bread, other cereals and potatoes regularly available
Existing tools like the Soil Association’s Food for Life catering mark link in with these standards (theSoil Association was one of the organizations that actively campaigned for such standards) andoffer public and private sector caterers a clear structure and targets. It is a valuable tool for cateringcompanies and one that enables them to contribute to creating a more resilient food system in thelonger term through making step changes in food purchasing practices.
72

9. Catering
73
CASE STUDY 7:
Food for Life catering mark
This is a Soil Association accreditation scheme to help caterers give information to theircustomers about the standards they achieve. The three tiers of Bronze, Silver and Gold allowcaterers to make step-wise progress towards greater use of fresh, seasonal, local and organicingredients, high welfare meat and sustainable fish. The catering mark is now available toapplicants from across the UK. Caterers in all sectors can apply including local authority andprivate school meal providers, hospitals, nurseries, sports stadia, workplace canteens andrestaurants. Food for Life catering mark logos are awarded for use on approved menus, and onany related marketing materials. More than 71,000 children in 711 schools across London now gethealthier and planet-friendly school dinners everyday. The improvement is due to nine catererswho have been awarded the Soil Association’s Food for Life Catering Mark in 2010.
The experience of Nottinghamshire County Council illustrates what can be achieved when thechanges are applied across a wide number of schools.
‘Local purchasing saves public money and delivers nutritious school meals’
Nottinghamshire County Council was the first local authority caterer in the country to provide allits schools – primary and secondary – with Food for Life ‘silver’ standard food. This means thatevery day 30,000 children in Nottinghamshire eat school meals that are at least 75% freshlyprepared with a range of local and organic ingredients. All chicken, eggs and pork are FreedomFood-certified or free-range and no fish from unsustainable sources is served. The cateringmanager explained:
“By contacting local producers directly and setting up direct links we have actually been able to cut
out the middleman and save money. This has enabled us to spend more on other quality products
such as local game from Sherwood Forest… As we have applied the standards across all of our
schools we have seen a positive increase in meal uptake”.
(‘Ahead Only: A fair future for school food policy’, Food for Life Partnership, 2010)
9.7 Food for Life catering mark in Bristol
Bristol has the most varied group of caterers who have signed up to the Soil Association’s Food forLife Catering Mark compared to the rest of the UK (see Table 7). While this represents a relativelysmall number of meals in the city, it demonstrates that a number of different kinds of cateringcompanies are concerned about where their food comes from and how it has been produced,reared or fished.
Early Years Catering is one example, a small but rapidly growing Bristol business which won thecontract with Bristol City Council to supply meals for 15 nursery schools in the city. The companyalso supplies a further 28 privately run nurseries. The company has now gained the Silver Level‘Food for Life Catering Mark’ award. Since setting up in 2006, they have seen an increase in staffmembers from 3 to 13 and the number of meals they serve each day has risen by over 1,500, to2,100. (For further details see appendix 11)

9. Caterin
gTable 9: Food for Life caterers in the Bristol city region
Gold
• Abbeywood Tots Nurseries, Bristol: 3 sites; 120 meals per day • Bordeaux Quay, Bristol: For both their menu in the brasserie and restaurant. • The Folk House Cafe, Bristol: Serves students attending courses, private functions and in the
public cafe. Can cater for up to 150.• Lettuce & Lovage: Events caterer based in the outskirts of Bristol catering for all manner of
events large and small, corporate or private. • Lakewood Conference Centre, Blagdon, near Bristol: Conference facility serving 50 meals per
day. • Tall Trees Kindergarten, Frome, Somerset: For children aged 4 months to pre-school the
Kindergarten serves meals containing high proportions of local and organic food to 50 childrena day.
• Early Years Catering, Bristol: 43 nursery sites; 2100 meals per day • The Thali Cafe, Bristol: Small chain of award winning restaurants, serving authentic
Indian street food.
• North Bristol NHS Trust, Bristol: Covering the catering requirements for Southmead andFrenchay hospitals, providing approximately 1,300 and 1,400 covers respectively per day.
• Bath and North East Somerset Council: Primary school menu; 66 sites; 2,600 meals per day.
Silver
Bronze
(Data source: Food for Life catering mark, The Soil Association;http://www.sacert.org/Gettingcertified/Whatwedo/Restaurantscatering/tabid/1056/language/en-GB/Default.aspx)
The Soil Association has recently published a report on the state of hospital food in the UK withseveral examples of positive change which are keeping costs down; improving food for patients,staff and visitors; and benefiting UK farmers and the local economy. The North Bristol NHS Trust iscited as one of the pioneers.
‘The North Bristol NHS Trust has found that they can make significant changes to where they
buy their food, increasing local sourcing substantially, while staying within a budget -
around £2.20 per day - which is below the national average. The Trust achieved the Soil
Association’s Food for Life Bronze Catering Mark, after the Trust Chief Executive attended a
seminar addressed by HRH The Prince of Wales. The Trust buys local milk. Ice-cream comes
from a farm near Bath, and is better quality and better tasting, with no chemical colours or
flavours, but sold at the same price as the ice-cream the Trust used to buy, which came to
them from Belgium via Bolton. The Trust has also introduced winter and summer menus to
make the best use of seasonal, local produce.’
(‘First Aid for Hospital Food’; Soil Association, January 2011).
9.8 Bristol school meals
Most of the schools in Bristol are provided with school meals by one of the following fourcompanies: Eden Food Service; ISS Caterhouse; BAM FM; and Early Years Catering. Eden, ISS andBAM are all national companies. Early Years Catering is a local company. Each of these companieswill have their own approved food suppliers. With large scale companies and contracts it is mostlikely that the supply companies are themselves food service wholesalers or processors (seesections 6 and 10).
74
9. Catering 9.8.1 Number of schools:
a 21 Secondary Schools of which 13 are BCC maintained and 8 are academies a 104 Primary Schools.a 9 Special Schools.a 2 Pupil Referral Unit Schools.a 31 established Children Centres 30 of these are BCC maintained with the other one being in the
voluntary sector. There are also 3 BCC maintained nursery schools. a 22 Independent schools
The total number of private nurseries is unclear but Bristol City Council can advise that the numberof grant-registered early years settings in the private sector is in the region of 55. There arecurrently a little over 400 registered childminders.(1)
9.8.2 School caterers progress on sustainable food procurementa Early Years Catering has just been awarded the Silver Food for Life award (see above). a Five schools catered for by BAM FM have achieved the Bronze Food for Life award. a Eden have said they aim to achieve the Bronze Food for Life status by April 2011 which will
cover all the 135 schools they supply. They have already achieved provision of 100% Fairtradebananas and also using free range eggs.
a ISS Caterhouse has been exploring introducing two meat free days a week in the secondaryschools they supply.
(Both ISS Caterhouse and Eden Food Service are working to the food for life catering markstandards with some schools in London. ISS Caterhouse supply over 4000 Bronze level meals a dayto schools in Merton. Eden Food Service supplies over 10,000 Silver level meals a day to schools inCroydon.)
9.8.3 Total spend on Bristol school mealsWithout asking all the food providers for figures it is difficult to say what the total school mealsfood purchasing budget is for Bristol schools. However based on recent school meal contract workdone by Bristol City Council, the average expenditure on food is £20,000 p.a. Across 171 schoolsthis would total around £3.5 to £4 million per year.(2)
9.9 Catering summary & key points
Around 25% of catering businesses in Bristol are institutional caterers for the health and educationsectors and 24% are business and commercial catering operations.
It is not possible without further investigation to accurately reflect the nature of or quantify thescale of these businesses, but it would be reasonable to assume that the main volume of meals areserved in schools, hospitals, residential homes and staff canteens.
The large catering businesses providing commercial catering operations are likely to be influentialin public sector food procurement. They will tender for publicly advertised contracts to supplymeals to other organisations and businesses.
The majority of health and educational institutions procure meals from a range of cateringcompanies. Therefore the group of institutional caterers serving the health and education sectorsare also likely to be separate to the institutions themselves. Only a minority of schools and hospitalshave in-house catering functions.
75
Source:1. Jackie Brown, Children and Young People's Services, Bristol City Council)2. Sharon Sexton, Transforming School Meals Co-ordinator, Bristol City Council; Matthew Roberts, Client Contract Officer, CYPS, Bristol City Council
9. Caterin
gGiven their large scale of operations, the large catering companies supplying the public sectorcould make a significant difference to shaping a more resilient food system through their foodpurchasing choices. Public sector procurement of sustainably produced, low carbon footprinthealthy food produced from fresh and seasonal ingredients would have a strong positive effect onthe supply chain.
The remaining 50% of catering companies are ‘eating out for leisure’ meal providers includingtakeaways, cafes, restaurants and pubs. They also represents a potential force for driving change inreshaping the city’s eating out food culture, through their food sourcing policies by selecting andpromoting seasonal UK food, and food produced within the region from sustainable methods ofproduction wherever possible. There are several excellent examples of privately owned restaurantsin Bristol that are serving meals using locally sourced seasonal ingredients.
76

10. P
roce
ssing
77

10. Processing
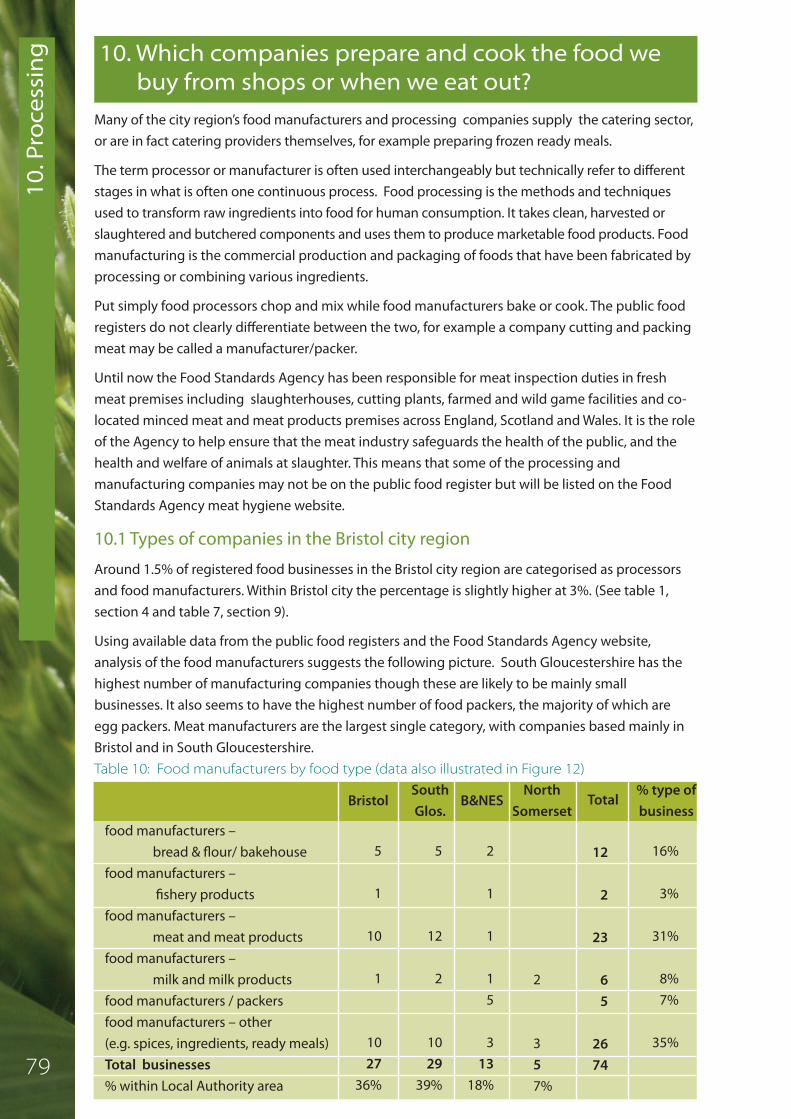
10. P
roce
ssing
Many of the city region’s food manufacturers and processing companies supply the catering sector,or are in fact catering providers themselves, for example preparing frozen ready meals.
The term processor or manufacturer is often used interchangeably but technically refer to differentstages in what is often one continuous process. Food processing is the methods and techniquesused to transform raw ingredients into food for human consumption. It takes clean, harvested orslaughtered and butchered components and uses them to produce marketable food products. Foodmanufacturing is the commercial production and packaging of foods that have been fabricated byprocessing or combining various ingredients.
Put simply food processors chop and mix while food manufacturers bake or cook. The public foodregisters do not clearly differentiate between the two, for example a company cutting and packingmeat may be called a manufacturer/packer.
Until now the Food Standards Agency has been responsible for meat inspection duties in freshmeat premises including slaughterhouses, cutting plants, farmed and wild game facilities and co-located minced meat and meat products premises across England, Scotland and Wales. It is the roleof the Agency to help ensure that the meat industry safeguards the health of the public, and thehealth and welfare of animals at slaughter. This means that some of the processing andmanufacturing companies may not be on the public food register but will be listed on the FoodStandards Agency meat hygiene website.
10.1 Types of companies in the Bristol city region
Around 1.5% of registered food businesses in the Bristol city region are categorised as processorsand food manufacturers. Within Bristol city the percentage is slightly higher at 3%. (See table 1,section 4 and table 7, section 9).
Using available data from the public food registers and the Food Standards Agency website,analysis of the food manufacturers suggests the following picture. South Gloucestershire has thehighest number of manufacturing companies though these are likely to be mainly smallbusinesses. It also seems to have the highest number of food packers, the majority of which areegg packers. Meat manufacturers are the largest single category, with companies based mainly inBristol and in South Gloucestershire. Table 10: Food manufacturers by food type (data also illustrated in Figure 12)
food manufacturers –bread & flour/ bakehouse
food manufacturers –fishery products
food manufacturers –meat and meat products
food manufacturers –milk and milk products
food manufacturers / packers food manufacturers – other (e.g. spices, ingredients, ready meals)Total businesses% within Local Authority area
5
1
10
1
1027
36%
5
12
2
1029
39%
2
1
1
15
313
18%
2
357%
12
2
23
65
2674
16%
3%
31%
8%7%
35%
BristolSouthGlos.
B&NES Total% type ofbusiness
NorthSomerset
10. Which companies prepare and cook the food webuy from shops or when we eat out?
79

10. Processin
gFigure 12: Food manufacturers in the Bristol city region by number and nature of facilities per
Local Authority area
Bread & �our/bakehouse
Food manufacturers
14
12
10
8
6
4
0
BristolSouth GlosB&NESNorth Somerset
2
Fishery products
Meat andmeat products
Milk and milk products
Packers Others (eg. spices,
ingredients,ready meals)
10.2 Meat businesses in the Bristol city region
In addition to the 116 retail butchers (who cut as well as sell meat), analysis of the food registersidentified: a 20 abattoirs, slaughterhouses and cutting plants in the Bristol area: 7 of those are on-farm
poultry slaughter facilities or seasonal poultry slaughter facilities a 23 food manufacturers for meat or meat products a 9 distribution/wholesale/cold store facilities
Of the 23 manufacturers, most of the Bristol companies deal with cooked and cold cut meats andwith meat pies for supply to caterers and independent retail outlets. The South Gloucestershirecompanies are largely small scale butcher and meat manufacturer companies linked to local farmshops selling cuts of meat and sausages. With the exception of Weddel Swift Distribution, a nation-wide chilled and frozen meat distributor serving butchers shops, the remaining 6 companies listedas meat distribution/wholesalers are all small scale. The cold stores are a national TGC TemperatureControlled Services depot in Avonmouth and a farm cold store in South Gloucestershire.
Table 11: Meat businesses in the Bristol city region
Abattoirs (often include co-located cutting plant)Slaughterhouse - Poultry (include seasonal andon-farm)Cutting plantsFood manufacturers - meat and meat productsDistribution/wholesale facilities - meatCold store meat
3
610
41
3
1211
1
4
12
3 7
76
2372
BristolSouthGlos.
B&NES TotalNorth
Somerset
(Data source: Food Standards Agency website and public food registers)
10.3 Snapshot survey of Bristol meat manufacturers/processors: products,suppliers and markets
Within Bristol itself the main large scale food manufacturing companies dealing with meat areregistered as approved premises. Table 12 provides an indication of where these companiespurchase their own supplies and the markets that they in turn supply. All of them supply retailers 80
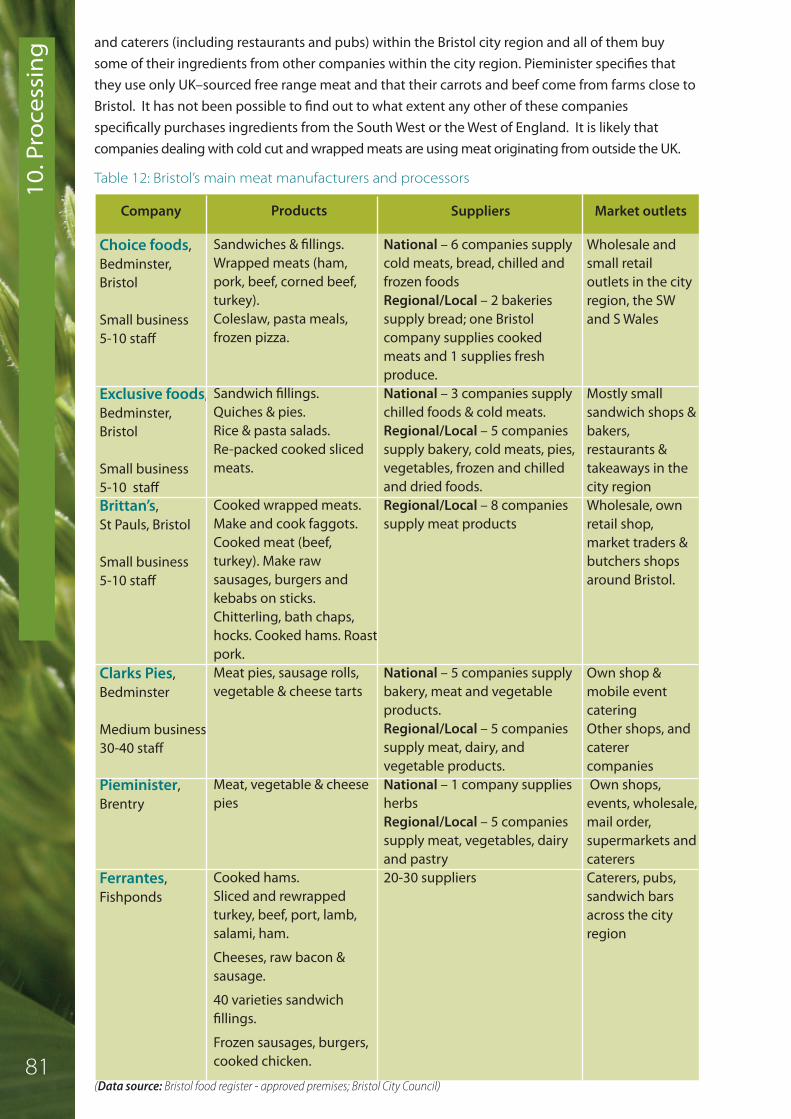
10. P
roce
ssing and caterers (including restaurants and pubs) within the Bristol city region and all of them buy
some of their ingredients from other companies within the city region. Pieminister specifies thatthey use only UK–sourced free range meat and that their carrots and beef come from farms close toBristol. It has not been possible to find out to what extent any other of these companiesspecifically purchases ingredients from the South West or the West of England. It is likely thatcompanies dealing with cold cut and wrapped meats are using meat originating from outside the UK.
Table 12: Bristol’s main meat manufacturers and processors
Choice foods,Bedminster,Bristol
Small business 5-10 staff
Exclusive foods,Bedminster,Bristol
Small business5-10 staffBrittan’s, St Pauls, Bristol
Small business5-10 staff
Clarks Pies,Bedminster
Medium business30-40 staff
Pieminister,Brentry
Ferrantes,Fishponds
Sandwiches & fillings. Wrapped meats (ham,pork, beef, corned beef,turkey). Coleslaw, pasta meals,frozen pizza.
Sandwich fillings. Quiches & pies. Rice & pasta salads. Re-packed cooked slicedmeats.
Cooked wrapped meats.Make and cook faggots.Cooked meat (beef,turkey). Make rawsausages, burgers andkebabs on sticks.Chitterling, bath chaps,hocks. Cooked hams. Roastpork.Meat pies, sausage rolls,vegetable & cheese tarts
Meat, vegetable & cheesepies
Cooked hams.Sliced and rewrappedturkey, beef, port, lamb,salami, ham.
Cheeses, raw bacon &sausage.
40 varieties sandwichfillings.
Frozen sausages, burgers,cooked chicken.
National – 6 companies supplycold meats, bread, chilled andfrozen foodsRegional/Local – 2 bakeriessupply bread; one Bristolcompany supplies cookedmeats and 1 supplies freshproduce.National – 3 companies supplychilled foods & cold meats.Regional/Local – 5 companiessupply bakery, cold meats, pies,vegetables, frozen and chilledand dried foods.Regional/Local – 8 companiessupply meat products
National – 5 companies supplybakery, meat and vegetableproducts.Regional/Local – 5 companiessupply meat, dairy, andvegetable products.National – 1 company suppliesherbsRegional/Local – 5 companiessupply meat, vegetables, dairyand pastry20-30 suppliers
Wholesale and small retailoutlets in the cityregion, the SWand S Wales
Mostly smallsandwich shops &bakers,restaurants &takeaways in thecity region Wholesale, ownretail shop,market traders &butchers shopsaround Bristol.
Own shop &mobile eventcateringOther shops, andcaterercompaniesOwn shops,
events, wholesale,mail order,supermarkets andcaterersCaterers, pubs, sandwich barsacross the cityregion
Company Products Suppliers Market outlets
(Data source: Bristol food register - approved premises; Bristol City Council)81

10. Processin
g10.4 Dairy businesses in the Bristol city region
Analysis of the food registers suggests that there are:a 6 dairy food manufacturers – including Yeo Valley organic and Alvis Brothers in North Somerset
and smaller cream, cheese and milk product manufacturersa 9 dairy distributors, depots or warehouses – 5 of which are Dairy Crest depots, 1 Robert
Wiseman depot, the rest are independent milk and cheese distributors. No further research was done on supplies to the dairy businesses.
Table 13: Dairy businesses in the Bristol city region
10.5 Food labelling
Food labelling is strictly governed by law. For example a food can’t claim to be ‘reduced calorie’unless it is much lower in calories than the usual version. However health and nutrition claims onfood labels can mean different things on different products as not all these kinds of claims are yetdefined in law. For example ‘low-fat’ has been defined in law and means the product shouldcontain no more than 3g fat per 100g but a claim like ‘helps maintain a healthy heart’ as yet has nolegal definition.
The Food Standards Agency (FSA) has responsibility for overseeing food safety and is alsoconcerned with what is sold and how it is labelled. It works closely with Local Authority food lawenforcement officers to make sure that food law is complied with throughout the food chain. Foodlabelling is governed by regulations and exists primarily to inform and protect consumers. Someaspects of food labelling are now being taken over by the Department of Environment, Food andRural Affairs (Defra). The Food Labelling Regulations 1996 means that food has to be marked orlabelled with certain requirements such as:a the name of the food a a list of ingredients (including food allergens) a the amount of an ingredient which is named or associated with the food a an appropriate durability indication (e.g. 'best before' or 'use by') a any special storage conditions or instructions for use a the name and address of the manufacturer, packer or retailer a the place of origin (where failure to do so might mislead)
The FSA had advocated a consistent approach to front of pack nutritional labelling using ‘trafficlight colours’ based on evidence that consumers find this easiest to understand. The traffic lightsshow if a food item has high, medium or low amounts of fat, saturated fat, sugars and salt. Somemanufacturers and retailers prefer a rival scheme based on Guideline Daily Amounts. The currentlabelling rules are a compromise and are voluntary. Some supermarkets and food manufacturersvoluntarily use traffic lights.
The UK’s main supermarkets recently also signed up to a new voluntary code on country of originlabelling of meat, processed meat and dairy products. This labelling will be done by the companiesthat process these products for the supermarkets(1). (2)
(Data source: Public food registers)
Food manufacturer – dairyDistributor/food warehousing/wholesaling/dairy depot
1
3
2
2
1
3
2
1
6
9
BristolSouthGlos.
B&NES TotalNorth
Somerset
82Sources:1. Ethical Consumer; Jan/Feb 20112. Food Standards Agency website and webarchive

10.6 Food manufacturers & processors summary & key points
The food processors and manufacturers are an essential part of the food system. In the meat sectorthey play a key role by using the parts of the carcass that shoppers prefer not to buy and cookthemselves. They therefore close a gap in the supply loop and ensure that meat is not wasted.Bristol city region has access to a well established processing infrastructure. However, they are thesector that often has the least transparent food sourcing and often uses cheap imports. They alsosupply to most of the ‘eat-out’ kinds of caterers, including pubs and restaurants along with smallerretailers with cheaper products.
The potential to drive change towards a more resilient food system and more healthy andsustainable diets through caterers choosing to source more seasonal fresh sustainably and locallyproduced ingredients is interlinked with the decision making of the range of companies fromwhich they source their ingredients. The food manufacturing sector is less likely to source seasonallocal produce unless it makes economic sense. Therefore the food manufacturing sector couldprove to be the most difficult part of the food system to influence, unless it is achieved throughlarge scale catering contracts that have specific food sourcing requirements to which the foodmanufacturers are required to comply. Food labelling legislation is a potentially useful tool forinfluencing changes to food quality across the entire food processing sector.
10. P
roce
ssing
83

11. Waste

11. W
aste
“Food waste is so widespread that experts believe if it could be eliminated there is already
enough to feed the expected world population of 9 billion in 2050.” (Jane Bird, FinancialTimes, 26 January 2010)
11.1 Household food waste facts – national context
In the UK, we throw away around one third of the food we buy. This is in addition to the food thatgets wasted before it even arrives for sale in the shops. Most of this is avoidable and could havebeen eaten if only we had planned, stored and managed it better. Less than a fifth is trulyunavoidable – things like bones, cores and peelings.
As households for example: a Of the bought food that is wasted, most could actually have been eaten – 61% or 4.1 million
tones of food waste a year is avoidable.a The most common reason for food being wasted is that it’s left unused – 2.5 million tonnes of
food waste is avoidable.a Of this, 40% – almost one million tonnes isn’t even touched and at least a tenth or 340,000
tonnes is still in date.a We also cook and prepare too much, resulting in an additional 1.6 million tonnes of food waste
a year.(1)
11.2 How much household food waste does Bristol produce?
The total amount of food waste generated per household will be higher than the amount that iscollected, as some food waste is put down the drain, home composted, or fed to animals. This willmore than make up for the proportion of collected home waste that is inedible including vegetablepeelings, meat bones etc.
Bristol City Council collects food waste, together with cardboard, from households on a weeklybasis. All food, cardboard and garden waste is collected and co-mingled by the Council's collectioncontractor, SITA. It is then transported via Avonmouth to an in-vessel composting facility inSharpness in Gloucestershire, operated by New Earth Solutions. The final product is used onfarmland as soil improver.
Because the food collected is then mixed with garden waste and cardboard (collected by the samevehicle), data is not available on the total tonnages of food waste collected through the scheme.Resource Futures estimate that food waste generated by households in Bristol annually is likely tobe in the region of 20-25,000 tonnes, of which around 9,000 tonnes is currently collected, and whenall purpose built blocks of flats have the collection rolled out this could increase by a further 1,000tonnes. (See appendix 5.)
Since the introduction of the food waste collection service, Bristol City Council has seen totalhousehold waste reduce from 186,000 tonnes in 2004/ 05 to 162,000 tonnes in 2009/ 10. Thispattern has been repeated in other areas that have food waste collections. Most of this reductionin the amount of waste is assumed to be as a result of behaviour change by householders partlytriggered by them seeing exactly how much food they are throwing away which prompts them tochange their habits and reduce the amount of waste food. The service has also made recyclingvisible as something that “everyone does”.
11. What happens to food waste in Bristol?
85 Source:1. ‘The Food We Waste’; WRAP, 2009

11. Waste
11.3 School food waste
As with household waste, all school food waste is collected and co-mingled with cardboard andwith other household food waste, along with some garden waste, as part of the Council’s OrganicWaste Collection Service and composted in an in-vessel composting facility.
11.4 Bristol University composting scheme
In June 2010 a new composting scheme to reduce Bristol’s food waste going to landfill sites waslaunched at the University's halls of residence and selected accommodation sites. The project,which is in partnership with Bristol City Council and SITA involves around 2,000 students at six ofthe halls of residence participating in food waste composting collections. Each hall kitchen hasbeen supplied with internal and external food waste caddies. On collection of the caddies, thefood is turned into soil-enriching compost.
Based on tonnages from a pilot scheme, it is estimated that 60 tonnes of food waste per year arecollected from Halls of Residence that have access to a food waste service, servicing approximately3,400 students. This scheme has now been rolled out to all but 3 University of Bristol sites. It ishoped the scheme will be extended to Unite and University of the West of England (UWE) sites inthe future. It is estimated that schools and university halls will produce approximately 1,500 tonnesof food and cardboard waste for recycling annually.
86
Food recycling leaflet for
blocks of flats

11. W
aste From Cardboard to Caviar
The ABLE Project was set up to deal with cardboard recyclingwhile at the same time providing employment opportunities foryoung people. Trials into the shredding of cardboard for animalbedding proved successful, and mixed with manure thecardboard bedding proved ideal for composting. A composting
operation at Huddersfield Community Farm combined recycled livestock bedding andcomposting in a specially constructed wormery. Vocational Enterprises, an organisationproviding sheltered employment opportunities for disadvantaged groups agreed to house andstaff a shredding machine and supplied the Community Farm with bedding.
The benefits of the scheme have included reducing the volumes of waste going to landfill andsaving money for both local businesses and Huddersfield Community Farm. The revenuegenerated from the sale of waste derived products (compost, plant-food, and worms to localanglers) was an added benefit. This recycling venture took the next step by developing aninnovative fish tank system to produce Siberian Sturgeon fed on the excess worms from thecomposting beds. When the Sturgeon reaches an appropriate size it is harvested and sold forhuman consumption. Some are also raised to produce caviar. The compost is also used in thehorticultural area to grow food.
www.theableproject.org.uk/produce/sustainable-fish
11.5 Food waste generated in the commercial sectors
This report was unable to undertake further investigation in the time available. It is presumed thatmost shops, cafes, restaurants and large scale kitchens are unlikely to separate out food waste andthat it is therefore taken to landfill with all other waste through private contractors.
11.6 Food waste generated by the wholesale sector
Bristol Wholesale Fruit Centre in St Philips generates a significant amount of waste each daycomprising pallets, packaging and wasted produce. Potentially this is an untapped resource whichrequires further investigation. Pallets are the most difficult item to dispose of and a long-termsolution is yet to be found. Approximately 2-3% of the market’s total daily fresh produce is wastedeach day, largely due to non-compliance with Defra inspector grading standards. The market runsits own waste disposal service for leaseholders. Waste fresh produce including pallets of rejectedfruit and vegetables are compressed on site and transported for landfill by Biffa. Somecompostable waste is collected by local farmers while some is taken to a biodigester in Cannington.
‘We’ve institutionalized waste of perfectly good produce into our system through the
horticulture marketing standards which define class 1,2 & 3 produce. These standards are
mainly about appearance – minor blemishes, shape or weight. There is a vast amount of
waste at a farm level too if produce doesn’t quite meet the standards, for example if lettuces
are too light they will get ploughed back in.’(Tim Down, MD, Percy J Down, Wholesalers, Bristol Wholesale Fruit Centre)
87
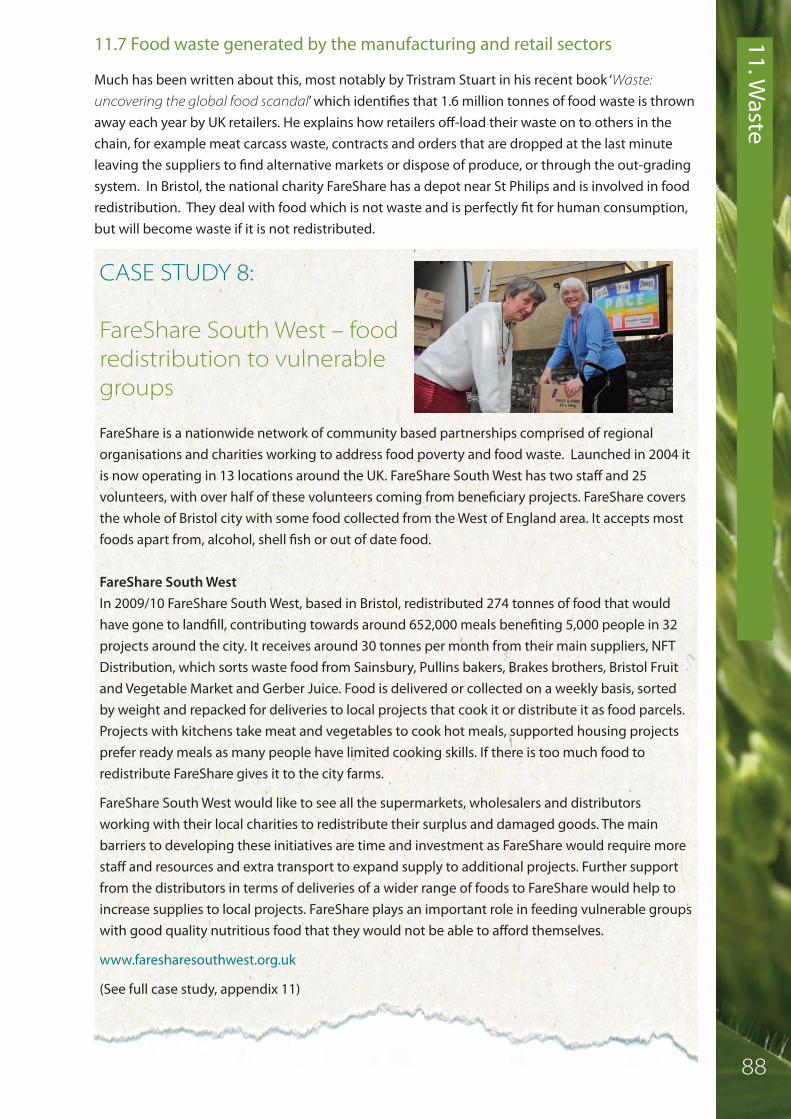
11. Waste
11.7 Food waste generated by the manufacturing and retail sectors
Much has been written about this, most notably by Tristram Stuart in his recent book ‘Waste:
uncovering the global food scandal’ which identifies that 1.6 million tonnes of food waste is thrownaway each year by UK retailers. He explains how retailers off-load their waste on to others in thechain, for example meat carcass waste, contracts and orders that are dropped at the last minuteleaving the suppliers to find alternative markets or dispose of produce, or through the out-gradingsystem. In Bristol, the national charity FareShare has a depot near St Philips and is involved in foodredistribution. They deal with food which is not waste and is perfectly fit for human consumption,but will become waste if it is not redistributed.
CASE STUDY 8:
FareShare South West – foodredistribution to vulnerablegroups
FareShare is a nationwide network of community based partnerships comprised of regionalorganisations and charities working to address food poverty and food waste. Launched in 2004 itis now operating in 13 locations around the UK. FareShare South West has two staff and 25volunteers, with over half of these volunteers coming from beneficiary projects. FareShare coversthe whole of Bristol city with some food collected from the West of England area. It accepts mostfoods apart from, alcohol, shell fish or out of date food.
FareShare South WestIn 2009/10 FareShare South West, based in Bristol, redistributed 274 tonnes of food that wouldhave gone to landfill, contributing towards around 652,000 meals benefiting 5,000 people in 32projects around the city. It receives around 30 tonnes per month from their main suppliers, NFTDistribution, which sorts waste food from Sainsbury, Pullins bakers, Brakes brothers, Bristol Fruitand Vegetable Market and Gerber Juice. Food is delivered or collected on a weekly basis, sortedby weight and repacked for deliveries to local projects that cook it or distribute it as food parcels.Projects with kitchens take meat and vegetables to cook hot meals, supported housing projectsprefer ready meals as many people have limited cooking skills. If there is too much food toredistribute FareShare gives it to the city farms.
FareShare South West would like to see all the supermarkets, wholesalers and distributorsworking with their local charities to redistribute their surplus and damaged goods. The mainbarriers to developing these initiatives are time and investment as FareShare would require morestaff and resources and extra transport to expand supply to additional projects. Further supportfrom the distributors in terms of deliveries of a wider range of foods to FareShare would help toincrease supplies to local projects. FareShare plays an important role in feeding vulnerable groupswith good quality nutritious food that they would not be able to afford themselves.
www.faresharesouthwest.org.uk
(See full case study, appendix 11)
88

11.8 Summary and key points:
a Bristol’s household waste – since the introduction of the food waste collection service, BristolCity Council has seen a reduction in household waste from 186,000 tonnes in 2004/ 05to162,000 tonnes in 2009/ 10. Most of this reduction is assumed to be as a result of behaviourchange by householders.
a Bristol’s food waste – Resource Futures think that food waste generated by households inBristol annually is likely to be in the region of 20-25,000 tonnes, of which around 9,000 tonnes iscurrently collected, and when all purpose-built blocks of flats have the collection rolled out thiscould increase by a further 1,000 tonnes.
a Education establishments – it is estimated that schools and university halls will produceapproximately 1,500 tonnes of food and cardboard waste for recycling annually.
a Wholesale market – the wholesale market at St Philips generates a significant amount of woodand fresh produce waste which is compostable and recyclable but currently this potential is notrealized. Smarter solutions for recycling food waste would enable this part of the loop to beclosed and significantly reduce the loss of potential heat energy and soil nutrients as well aswaste of perfectly edible food.
a Food redistribution – FareShare provides a valuable service in redistributing good quality foodperfectly fit for human consumption and within sell by dates, but which would otherwise bethrown away. They deal with over 200 tonnes of food per year but this is just a small proportionof the total that is still being landfilled. This waste of good quality food represents a serious lossof nutritional value and is an issue that urgently needs more attention, especially if the city hasvulnerable groups of people whose lack of income makes eating healthy food a daily challenge.
a Defra grading standards and the specifications within catering procurement contracts arecondemning significant quantities of produce inappropriately on the basis of size, shape,appearance. The rationale for this needs to be reconsidered.
a Further opportunities – more research is needed to establish the volume of food wastegenerated by the city, including commercial food waste, and to explore collaborative solutionsthat can serve the city as a whole.
11. W
aste
89

12. Community food-related activity

12. C
ommunity food-related
activity
12.1 Community food resilience
Any city, Bristol included, has to be supplied with food from beyond the city boundary. However,city residents do have opportunities to get involved in food growing, especially salads, vegetablesand fruit in their gardens, allotments and local parks. Gardening and food growing has been anEnglish tradition at least since Tudor times, and the expectation that each dwelling should havegarden space has influenced the historical layout of villages, towns and cities(1). Some residentsmay have space for small scale eggs and livestock production on smallholdings. Every resident hasa crucial part to play in helping to build resilience in the food system through their own daily eatingchoices. As a community we have the potential to develop a thriving healthy food culture in thecity with strong links to the city region’s food producers.
12.2 Vulnerable groups
‘While many people in Bristol eat well, a large number do not, especially disadvantaged and
vulnerable groups in our community. Lack of access to local food shopping outlets, limited
or no transport and support services, lack of skills and facilities for cooking, physical
disabilities, and lower income and isolation all combine to create a potential for poor
nutrition, especially among our growing population of older people.’ (Liz Fox, Senior Health Promotion Specialist, Food & Health, NHS Bristol).
Those on lower incomes have the least access to a range of affordable and healthy food in theirlocal shops. The small supermarkets in deprived areas often have higher prices on certain itemsthan the large stores. A snapshot price comparison of Tesco Extra at Eastville and two Tesco Expressstores, one in the city centre and one on the Gloucester Rd, identified that exactly the same staplefood items cost more in the ‘Express’ stores when compared with the ‘Extra’ store including bread,vegetables, salad, fruit, meat, dairy, rice, pasta and flour. (See table 14.)
Table 14: Price comparisons of staple food items in Tesco Extra and Express stores
Tesco basmati riceTesco mature cheddarBeef mince (12% fat)Tesco penne pastaTesco value medium slicedwhite bread large
£1.50 per 1kg£1.95 per 250g£4.79 per 1kg £1.10 per 1kg£0.30 per loaf
£1.74 per 1kg£2.03 per 250g£3.00 per 500g (no larger pack available)£0.78 per 500g (no larger pack available)£0.74 per loaf
Food item Tesco Extra price Tesco Express price
(Data source: Who Feeds Bristol snapshot price comparison August 2010)
Customers often believe supermarkets are cheaper because of below-cost sales of ‘Known ValueItems’. These are products or brands with prices that are known to customers because they buythem frequently and that may influence where they choose to shop.
Independent greengrocers, bakers and butchers are disappearing from some of Bristol’s moredeprived areas. These types of retailers generally offer competitive prices, for example a butchercan offer a wide range of cuts and different kinds of meat; a greengrocer will offer reduced priceson produce that needs to be sold quickly. They are more flexible and more able to respond tocustomer requests and will sell any quantity without charging a premium for small volumes. Those
12. Does bristol have the skills to cook and to grow food?
91 Source:1. Thomas K. Man and the Natural World. Penguin books 1983
12. Community fo
od-related
activityon lower incomes, many of whom have less access to specialist independent food shops will alsobe hardest hit by increased staple food prices such as bread (due to a rise in wheat prices).
Major cultural change has occurred since the 1950s with a switch away from cooking from freshingredients. The food industry has successfully promoted tasty, convenient and affordable productsto replace the need to cook from fresh. Unfortunately many of these products are high in fat, sugarand salt, heavily flavoured and processed to make them palatable and skillfully promoted, often inways that appeal to children. The extent of the health damage caused by this trend is only justbeing fully recognized with increased rates of obesity, diabetes, hypertension, heart disease andcancer (Kessler 2009). Healthy living campaigns to ‘persuade’ people to ignore the advertising andcultural cues are only a partial solution. Food culture needs to change if healthy food is to becomesomething that all sections of society can enjoy.
‘The current food system is based on ‘false’ accounting, where the food supply system is not
held to account for the impacts that the system has on the environment or human or social
health. These are often called the hidden or external effects (externalities). With respect to
other externalities the World Health Organization has challenged the global food industry
over its role in promoting certain types of fats and processed foods and the impact on
human health as well as damage to the environment.’ (Dr Martin Caraher, Professor of Food and Health Policy, City University London)
12.3 Cooking from scratch
One of the major concerns as illustrated in the quote above is that damaging health consequencesare arising from the growing trend towards eating pre-prepared, highly processed conveniencefoods instead of cooking from scratch with fresh ingredients. A second and related concern is theloss of cooking skills.
12.3.1 What is Bristol eating? It would be a major challenge to find out exactly what Bristol residents are eating and to whatextent city residents are preparing their own meals using fresh ingredients. Most food is boughtfrom supermarkets so to help answer this question we looked at available data from dunnhumby(market research company) whose database comprises purchasing data from a sample of 1.7millionsupermarket shoppers, representative of 40% of UK households.
The Centre for Value Chain Research at Kent Business School have provided an analysis ofdunnhumby data for this report on a selection of product categories to show performance (iepurchases) for fresh ‘cook from scratch’ (CFS) ingredients compared to pre-processed andconvenience foods in the ‘Wales & the West region’ (which includes Bristol) over the last 12 monthsfor large hypermarket and small convenience stores.
The analysis also looks at ‘store level data’ showing: a) ‘customer penetration’ – percentage of shoppers who have made at least one purchase in the last
year giving an indication of scope for attracting new buyers b) ‘spend per customer’ – the average spend per customer per year and which products/categories
shoppers spend most on, for selected product groups
A ‘store level’ data analysis was carried out in the following large hypermarket stores in Bristol:a Bristol Eastvillea Brislingtona Bradley Stoke
(For more details on this analysis see appendix 9)92

12. C
ommunity food-related
activity 12.3.2 Definition of ‘cooking from scratch’ (CFS) categories
The following products categories were used for the analysis and are based on existingsupermarket food categories. While bread and breakfast cereals are technically not ‘cook fromscratch’ items, they have been included in the data provided by Kent Business School. This isbecause they are not classified as pre-prepared or convenience foods within the supermarketsystem. Similarly, pre-prepared fresh fruit which we might not think of as a processed product isnevertheless classified as pre-prepared/convenience within the supermarket categories because itis provided to the customer in sealed ready to eat packs.
12.3.3 Analysis of data from the Wales & West storesIn terms of share of sales, the figures for CFS are encouraging (meat & poultry at 27.4%, vegetables& salad at 25.1%; fruit at 21.2% compared with prepared chilled ready meals at 9.7%, preparedmeat & poultry at 3.3%). The year on year sales growth figures in both sale and volume termsindicate that sales of CFS items are falling while prepared food sales are increasing, with the oneexception of sales of prepared frozen ready meals which are decreasing. This suggests that theoverall trend is away from cooking from scratch. The decrease in frozen meals could be due to theincrease in smaller stores selling more convenience foods and a pattern of more frequent shoppingby younger adults.
Data from dunnhumby is based on customer lifestage’ categories (‘older adults, young adults,young families, older families, pensioners, mixed’ - see appendix 9). Customer lifestage profileinformation suggests that pensioners are 60% more likely than the rest of the lifestage categoriesto buy CFS products, while older adults are 15% more likely to buy CFS. In contrast, families andyoung adults are almost 20% less likely to buy CFS. Customer lifestyle profile information suggestthat households who live a convenience lifestyle are 45% less likely to buy CFS and families whoseshopping choices are heavily influenced by childrens’ demands will be 25% less likely to buy CFS.The ‘traditional’ and ‘prices sensitive’ households are respectively 40% and 20% more likely to buyCFS than the other ‘lifestage’ customer categories.
The data for Wales & West stores suggest that the categories of customer that buys the most fresh‘cook from scratch’ items (ie fruit and vegetables, fresh meat, eggs, dairy products) are the oldercustomers. The categories of customers that buy the least ‘cook from scratch’ and are increasinglybuying pre-prepared and convenience food such as frozen and ready meals are families and youngadults.
CFS’ food categoriesa Floura Fruita Grains/Rice/Pastaa Vegetables/Salada Meat & Poultrya Dairya Eggsa Breada Cerealsa Fish
Pre-prepared and convenience food categoriesa Prepared Ambient Rice, Pasta, Snack Mealsa Prepared Fresh Fruita Prepared Meat & Poultrya Prepared Chilled Ready Mealsa Prepared Frozen Ready Mealsa Prepared Fresh Vegetables Salad
93

12. Community fo
od-related
activity12.3.4 Data from the three Bristol storesAnalysis of the data for each of the selected three Bristol stores on ‘customer penetration’ and‘spend per customer’ was limited in what it could add to the findings above, but suggests that: a There is lowest spend at Eastville and highest spend at Bradley Stoke. This is likely to reflect the
income level of customers. a Of all the food categories, CFS fruit and vegetables have the highest ‘spend’ and ‘customer
penetration’. That means there is scope to attract new buyers and that customers spend themost money over the year on this category of products.
a Second highest ‘spend’ is on CFS meat and then on dairy products, though the customerpenetration figures suggest that there is more scope to attract new buyers for dairy than for CFSmeat.
These data suggest that cooking from scratch ingredients are widely purchased at these threeselected large Bristol stores, although the trend is downwards.(2)
12.4 Cooking classes around Bristol
It was not possible to identify all the cooking activity going on across the city but the communityfood growing and cooking map 5 compiled from available data, gives an indication of the level ofactivity. (See also list of initiatives in appendix 6) This does not include college courses or adulteducation classes. Most of the cooking classes are short-term and dependent on funding. NHSBristol supports a number of cooking classes in the north, south and inner city areas. A number ofcommunity projects and voluntary sector organisations provide cooking classes, for exampleHHEAG (see case study 9).
CASE STUDY 9:
Hartcliffe Health andEnvironment Action Group(HHEAG) tackling food issuesin the community
Hartcliffe is a relatively deprived area on the southern edge of Bristol. Its health andenvironmental action group is another hidden treasure in Bristol and offers a ‘plot to plate’ holisticapproach to working on food issues in the community. Cooking classes began 14 years agofollowed by the establishment of market gardening and increased use of existing localallotments. Around 1,500 people have attended their cooking and nutrition courses. GreensCommunity Market Garden produces a range of fresh vegetables, herbs, fruit and flowers for thelocal community on sites in Hartclffe and Withywood. Around 150 people have been involvedwith growing activities over the last ten years. Greens provides a range of fruit and vegetables forHHEAGs courses on nutrition and cooking and for the “Food for All” food co-op at the GatehouseCentre which is run by members and buys good quality food in bulk at wholesale prices.
www.hheag.org.uk
(See full case study, appendix 11)
94Source:2. Centre for Value Chain Research, Kent Business School, University of Kent analysis of dunnhumby data for ‘Who feeds Bristol?’

12. C
ommunity food-related
activity Map 5: map of community food activity
12.5 Land in the city & food production
The Bristol Peak Oil(3) report recommended that an assessment should be undertaken on what landis available within the city for food growing, including land which could be reclaimed. It alsorecommended that research should be done to identify the area of gardens, allotments andcommunity garden space needed per capita to produce at least 50% of required fruit and vegetables.
95Source:3. Osborn S. Building a Positive Future for Bristol after Peak Oil. Bristol Partnership. October 2009http://www.bristol.gov.uk/ccm/content/Environment-Planning/sustainability/file-storage-items/peak-oil-report.en Accessed 26 May 2010

12. Community fo
od-related
activityDefinitive data on the amount of land available for food production within the Bristol city boundaryhas proved difficult to gather. This study reviewed Defra’s data from the 2009 agricultural censusand also gathered data from various Bristol City Council departments on the different kinds of landowned by the council.
12.5.1 Defra data on Bristol’s agricultural landDefra’s 2009 records of registered agricultural holdings in Bristol show a total of 1438 hectares ofagricultural land, of which 126 hectares is rented and 1305 is owned. It is not clear how this figurerelates to other figures from Bristol City Council, or whether it includes council-owned farms andsmall holdings. It is assumed that the owned land is farms on the outskirts of the city inAvonmouth, Frome Vale and in the south of the city. Further investigation is needed.(4)
12.5.2 Land in the city with potential for food productionAccording to our estimates other land available in the city that iscurrently used or potentially available for food production totalsapproximately 930 hectares. This figure includes council ownedagricultural land, a notional 20% of parks & green spaces, ‘empty land’sites most of which are owned by private landlords, a proportion ofprivate gardens and school land. It excludes commercial, institutionaland privately owned land. The way that we have derived this estimate is shown below:
Bristol City Council-owned agricultural land This totals 485 hectares, including:a 199 hectares total allotment within and close to Bristol city boundarya 239 hectares farm/agricultural landa 47 hectares grazing land.
Council-owned parks and green spaces This totals 1814 hectares and we estimate that 363 hectares of this ‘parks and green space’ landcould potentially be used for producing food. This total figure includes all of the major estates withthe exception of Stoke Park. Some of this area is already used, for example grazing land supportingvenison in Ashton Court. It is not clear at this stage how much of the parks and green space areacould realistically be used for food production, but if 20% of all parks and green spaces were usedfor food including for example fruit and nut shrubs and trees, that could bring an additional 363hectares into ‘productive’ landscape.
‘Empty land’ Land available for food production on empty land and derelict sites around the city could be up to45 hectares (estimate based on BCC Empty Land Officer’s work in 2009/10). At this stage it isdifficult to assess the total area of ‘empty land’ available as Bristol City Council’s site allocationconsultation is not yet complete. In the interim for the purpose of this study a conservativeestimate of 20 hectares of empty land may be available for (temporary) food production.
Private gardensAccording to 2001 census data there were 120,270 houses, and 45,450 flats in Bristol(5). At aconservative estimate, assuming that flats have no gardens and houses have an average gardensize of 10 square metres - this totals some 120 hectares of land in private gardens. If we assume50% of private gardens are available for growing food, that is a total of 60 hectares in privategardens.
96Sources:4. Assessment of local food provision for ‘Who Feeds Bristol?’ by Royal Agricultural College, Cirencester; Source Defra 2010. See appendix 8 5.Office for National Statistics

12. C
ommunity food-related
activity School land:
The amount of school-owned land is currently unknown. If Bristol’s 190 schools each grew food onan average area of 20 square meters that would total just over 3.8 hectares of school grounds. (6)
Private property: Land available within properties owned by commercial companies, institutions and privatelandlords is unknown. For example, residential homes for the elderly often have significant groundsthat could be used for market gardening.
Conclusion: If we add the Defra figure (1438 hectares) and city areas (930 hectares) of landtogether but exclude the 239 hectares of council owned farm/agricultural land and 47 hectaresgrazing land (assuming they are already counted as registered agricultural holdings in the DEFRAfigure of 1438 hectares), then there may be a total of 2082 hectares of land available for foodproduction in Bristol. This includes existing farmland and smallholdings, allotments, a proportion ofcouncil-owned empty land, a proportion of land within school grounds and private gardens and20% of parks and green spaces if this could be made available. It excludes other privately ownedland, although there is potential here also.
Figure 13: Council owned land in Bristol by ward
Ashley 10Avonmouth 178Bedminster 4Bishopston 12Bishopsworth 37Brislington East 29Brislington West 6Cabot 0Clifton 0Clifton East 0Cotham 0Easton 1
Eastville 16Filwood 19Frome Vale 22Hartcliffe 8Henbury 3Hengrove 5Henleaze 0Hillfields 3Horfield 2Kingsweston 15Knowle 0Lawrence Hill 0
Lockleaze 15Redland 7Southmead 1Southville 8St George East 6St George West 9Stockwood 4Stoke Bishop 1Westbury-on-Trym 3Whitchurch Park 52Windmill Hill 3
Council owned land in Bristol by wardThe map gives an indication of howmuch council-owned land is in the city.The figures in the table show theamount of hectares of land available ineach ward. Avonmouth (178ha) andWhitchurch Park (52ha) have thehighest amounts of land available forpotential food production.
97Source:6. BCC website & staff

12. Community fo
od-related
activity12.6 How much food could be produced in Bristol?
In terms of the amount of productive land available it is possible to estimate the quantity of foodthat could be produced in Bristol. This will of course require more than just land, as knowledge,skills, experience and time are all essential.
12.6.1 Vegetable production on farm land in Bristol If Bristol has around 2,000 hectares of land potentially available for food production, this might beenough land to produce around 10,000 tonnes of vegetables. Based on available figures, Bristol’stotal annual vegetable requirements may be around 60,000 tonnes per year. 10,000 tonnestherefore represents around 16% of its annual vegetable requirements.
The Peak Oil report (7) raised the question about whether Bristol could be 50% self sufficient in fruit& vegetables. 50% of vegetable requirements for 400,000 people would be in the region of 30,000tonnes per year. Therefore our estimates suggest that 50% is not achievable but nevertheless asignificant quantity could be produced within the city. (See appendix 7 for source of figures)
12.6.2 Vegetable production on allotment land in Bristol‘The average gardener grew on their 300 square yard plot 745 kg of fruit and vegetables, the
highest value items being things like raspberries and currants’.(‘What is your plot worth?’ survey 2008-2009: National Society of Allotment and LeisureGardeners)
Based on figures from a year-long Bristol allotment trial there is the potential for 3,800 allotmentplots in Bristol to collectively produce £2,660,000 worth of fruit and vegetables(8).
In terms of weight, Bristol’s 3,800 allotment plots could collectively produce 2,831,000kg of fruitand vegetables (or 2,831 tonnes) which would contribute around 4%-5% of the city’s requirements.
12.6.3 Roof SpaceThis study has not looked at available food space in Bristol but evidence from around the worldsuggests that it is another potential resource for food production in urban areas. There arenumerous innovative examples of roof growing food projects in urban settings, using flat roofs onapartment blocks or offices(9).
Thorntons Budgens supermarket ‘Food from the Sky’ initiative in Crouch End, London is a smallfranchised supermarket which is using its flat roof to grow a selection of organic fruit, vegetablesand salads in containers. It is a collaboration between the store, a local social enterprise and thelocal community. The roof garden produce is sold in the store once a week in the growing season ata special stand run by garden volunteers(10).
Food can also be grown in streets (for example the Totnes nut tree project); in window boxes, onbalconies and by the sides of buildings. In 2010 the London ‘Capital Growth’ project, which aims toestablish 2012 new food growing spaces around the city by the year 2012, ran an ‘Edible Estates’competition to encourage the use of small areas of land for food in and around London housingestates(11).
98
Sources:7. Osborn S. Building a Positive Future for Bristol after Peak Oil. Bristol Partnership. October 2009
http://www.bristol.gov.uk/ccm/content/Environment-Planning/sustainability/file-storage-items/peak-oil-report.en Accessed 26 May 20108. Steve Clampin, Allotments Manager, Bristol City Council9. http://www.cityfarmer.info/2010/10/12/ for international examples10. www.thorntonsbudgens.com/social-environment/food-from-the-sky11. www.capitalgrowth.org/edibleestates/

12. C
ommunity food-related
activity 12.7 How much food growing is going on around the city?
The city has a very active allotment community of 66 active sites alongside a number of groups andorganisations that are involved in urban food production and in food education activities includingfood co-ops and buying groups. The Bristol Food Network (a network of individuals and groups concerned about sustainable food) has been gathering data on community food growing activityaround the city. Map 5 summarises information about schools, cooking clubs, gardening, adultcooking classes and lunch clubs. It shows a high level of food-related activity within some of themore deprived areas of the city. While it cannot show all the community growing and cookingactivities taking place in the city, it gives an indication of the current scale of activity. It also showsthe level of interest and potential to engage new audiences in community food activity therebyhelping to build community engagement in developing a more resilient food system.
With some planning and organization, it would be possible to increase Bristol’s ‘urban agriculture’and connect up the various ‘patchwork’ food producing areas around the city through a centrallyco-ordinated ‘city food hub’. Some of the parkland could be included, for example Stoke Park farmland (12). Links could be made to supply local greengrocers, community markets, communitykitchens and cooking classes. Avon Organic Group which is open to everyone who is interested inpromoting organic gardening and organic foods, already has ideas along these lines and is talkingwith other groups in the city including the Bristol Food Hub, a not for profit organization that runsfood related workshops and practical activities in the community, and the Bristol Food Network. Ifthe city food growers collaborated on working towards a specific food production target,supported by communications with Bristol residents and by organization of distribution and sales,this could become a valuable element of food knowledge and resilience for the city. If this couldalso be connected with food supply from producers around the city region, then this wouldconstitute a significant step towards developing a more resilient food system. GrowingCommunities, a social enterprise in London has pioneered a combined food production anddistribution model that could be applied in Bristol, based on sourcing food from concentric circlesor ‘food zones’ around the city. (See appendix 2)
Growing Communities, Hackney – ‘community- led trade’
supporting local producers.
Growing Communities supplies food into Hackney from over 40farms around London, many of whom also attend a weeklyfarmers market (London’s only 100% organic farmers market).
The enterprise distributes fruit & vegetable bags to various drop-off points, from whichcustomers collect, and it also runs a shop. High value perishable items are grown in andaround Hackney on small ‘patchwork market gardens’ by growers who are part of the GrowingCommunities apprenticeship scheme, and supply into the central food distribution. TheGrowing Communities food production and distribution model is based on a carefullyconsidered set of principles that all relate to developing a more resilient food system. Themodel is available for other community groups to use.
www.growingcommunities.org
Case study 10, Growing Power, is from the USA and gives an idea of how an urban agriculture socialenterprise can make a significant contribution to a city on several fronts.
99 Source:12.Feasibility Study for the Stoke Park Project, Bristol City Council in partnership with South Gloucestershire Council, Natural England and Local Residents

12. Community fo
od-related
activityCASE STUDY 10:
Growing Power – urbanagriculture social enterprise
Growing Power is an active urban farm in Milwaukee, USA. It produces large quantities ofvegetables and fruit in its greenhouses, raises goats, ducks, bees, turkeys and freshwater fish – intotal 159 varieties of food based on the only land within the city limits zoned as farmland. Thefarm has 14 greenhouses on two acres of land in the midst of a northern suburb of the city. Itoperates as a food distribution hub and training centre. It also has a 40-acre rural farm outsideMilwaukee, with five acres devoted to vegetable growing, hays, grasses, and legumes whichprovide food for the urban farm’s livestock.
The project uses worms to composts 6 million pounds of food waste a year, including the farm’sown waste, material from local food distributors, spent grain from a local brewery and coffeegrounds from a local café. Growing Power’s farm shop is a vital community meeting place andprovides 35 jobs in an area of high unemployment. The farm shop is the only place for milesaround that sells fresh produce, free-range eggs, grass-fed beef, and homegrown honey.
www.growingpower.org
(See full case study, appendix 11)
12.8 How much land would be needed for Bristol to be self sufficient in food?
Although this appears to be a hypothetical question, it is useful when linked to the bigger questionof ‘what is the best use of agricultural land in the UK in the future in order to increase self-sufficiency?’
12.8.1 Bristol’s ‘food footprint’Geofutures(13) have developed a ‘food footprint’ mapping system which uses Simon Fairlie’s(14)
’Livestock Permaculture’ agricultural model in which 1 hectare of combined agricultural andforestry land for food‚ fibre and fuel production supplies 4.4 people. That is 0.2 hectares perperson. Fairlie’s conclusion is that Britain can feed itself if a transformation occurs in agriculturalpractices, land use and food supply systems. The map below gives an indication of the amount ofland that would be required for the population of Bristol, and also shows how this landrequirement starts to overlap with other communities. (See more details in appendix 2)
Bristol city’s population is around 400,000 people, so the city would need just under 100,000hectares of land. However the population of the wider city region is more like 1 million (covering NSomerset, B&NES, S Glos), so that would require over 200,000 hectares. According to the Defrafigures (see section 4.3) there is over 800,000 hectares of agricultural land available in Bristol,Somerset, Gloucester and Wiltshire. Therefore a quarter of the land currently used for foodproduction in the West of England would be needed for the Bristol city region. However relativelylarge towns like Swindon and Gloucester not far away have their own food footprints which overlapwith Bristol’s food footprint.
100
Sources:13.Geofutures GIS tools. Food footprints: re-localising UK food supply July 2009 http://www.geofutures.com/2009/07/food-fooprints-re-localising-uk-
food-supply/ (Accessed Feb 2011)14.Fairlie S. Can Britain Feed Itself? The Land 4 Winter 2007-8 p18-26 http://transitionculture.org/wp-content/uploads/2007/CanBritain.pdf (accessed
Feb 2011).

12. C
ommunity food-related
activity Map 6: South West food footprints
12.8.2 Feeding the Bristol city region population from a network of organic farms based ona sustainable diet The Soil Association has calculated figures for feeding populations from a sustainable low carbonorganic farming system that uses rotations, based on typical yields from a mixed organic farm ieanimals and crops (see appendix 1B). The Soil Association has also looked at organic farmingfigures based on a changed diet and changed land use in the future, accepting that there may be aforthcoming shift in diet towards less meat and more vegetables due to energy and climate changeissues and associated cost. Given that an average organic farm size is approximately 100 hectares,they propose as a new approach, networks of organic farms working together to supply a range ofproducts though a ‘central hub’.
‘The food hub would form different relationships with different farms and there would be no
one route for food to the community.’ (Romsey Enquiry by Design – food and farming within the proposed new development:Phil Stocker, Soil Association, 2009)
Based on the Soil Association’s future sustainable diet figures, it would require a network of 5,000organic farms to feed the city region’s 1,006,600 residents with basic staple food items of dairyproducts, beef, lamb, chicken, eggs, cereals, vegetables(15). It is well within the limits of the landcurrently available in the West of England and is a lower amount of land than the Simon Fairliemodel, largely because unlike Fairlie’s calculation it does not take account of land needed for fuel,textiles (or beer). (For more details on these calculations see appendix 1B). For recent figures onorganic systems production see the Reading University report ‘England and Wales under organicagriculture: how much food could be produced?’ by Philip Jones and Richard Crane(16).
12.8.3 Food storageIn the context of increasing food system resilience within the community through increased urbanfood production and cooking with fresh ingredients, the inevitable issue of food storage needs to
101Sources:15. ‘Romsey Enquiry by Design – food and farming within the proposed new development’: Phil Stocker, Soil Association, 2009)16. http://www.apd.reading.ac.uk/AgriStrat/projects/org-exec.html
12. Community fo
od-related
activitybe considered. Food storage is both a traditional domestic skill and important within the foodindustry. The storage of food is important for several reasons, including preparation for periods ofscarcity, using surplus at times of harvest and enabling a balanced diet throughout the year. At adomestic level, managing a household food store or pantry based around cooking from scratchusing fresh produce with minimal waste and within careful budgets is a vanishing skill. This reporthas not looked at this issue in any more detail but it is an important element of building resiliencein the food system.
12.9 Summary of key points
Vulnerable groupsa Those with lower incomes will be harder hit by increased staple food prices and several
authoritative international reports suggesting that global food prices increases will beinevitable.
a The dunnhumby supermarket purchase data suggests that families and young adults areincreasingly buying pre-prepared and convenience ready meals rather than cooking fromscratch. This suggests a loss of cooking activity, and most likely the absence of cooking skillswithin these groups in particular, thus making them vulnerable to any disturbances that mightaffect the availability or price of such foods such as increased fuel prices impacting on theprocessing and refrigeration costs required for pre-prepared and convenience foods.
a Older people are more likely to buy more cook from scratch food items but access to shops isvital and those who experience the greatest difficulties in food shopping are more likely to beat the greatest nutritional risk.
Food production potential within Bristola An estimated 2,000 hectares of land is potentially available in and on the outskirts of the city.
This could be used to grow high value perishable crops like salads and greens and soft fruit aswell as more tree crops for fruit and nuts in public spaces. (See appendix 2)
a Using the Soil Association figures, Bristol city’s requirements (for 400,000 people) of 60,000tonnes of vegetables per year would require 12,000 hectares of land. If Bristol has around 2,000hectares land (this figure includes allotment land) potentially available for vegetableproduction, this might be enough land to produce around 10,000 tonnes of vegetables whichcould meet 16% of the city’s requirements.
a Based on data from a year’s food production assessment on a typical Bristol allotment, Bristol’s3,800 allotment plots alone could potentially produce some 2,831,000kg of fruit and vegetables(or 2,831 tonnes) which would contribute 4 - 5% of the city’s requirements. This amount offresh produce could collectively be worth over £2.5million which would represent a significantsaving to household food bills as well as supplement diets nutritionally through the provisionof a wide range of vitamin and mineral requirements
Land required for producing Bristol city region’s staple food requirementsa The city region area has approximately 1,006,600 residents and, based on the Soil Association’s
figures, would need 500,000 hectares of land to produce an adequate range of staple fooditems in a low-carbon production system. The Soil Association suggests that in the future thiscould be possible and would require a network of around 5,000 organic farms working togetherin collaborative hubs.
a There are as yet no blueprints for the best way to re-allocate land use for increasing food self-sufficiency in the UK the future. The Geofutures model and the Soil Association calculationssuggest that Bristol city region would require up to a quarter of land currently available withinthe West of England, possibly less, to produce a good amount of staple food items.
102

13. How can
we assess the resilie
nce
of B
ristol’s curren
t food system?
103

13. How can
we assess th
e resilience o
f Bristo
l’s curren
t food system
?
Each day we eat food with hardly a thought as to how it arrived on our plate. Yet as we have seen inthe preceding chapters, the range of inputs that combine to put it there is breathtaking in its scaleand complexity. In Section 2 (Context) some key concerns were described. These formed the basisfor why the ‘Who Feeds Bristol?’ report was commissioned. In this section we summarise how wemight approach the task of moving our food system towards a more resilient position.
13.1 Inputs, outputs and threats
When thinking of the resilience of our food system we need to be aware of all the inputs, whichcurrently we take for granted, and we need to consider how confident we can be as to theircontinued availability.
We also need to consider the outputs of the current system, and whether some may have negativeimpacts now and in the future.
Thirdly we need to be mindful of threats and impacts we will face in coming decades. Resourcedepletion, population growth, environmental degradation and economic instability are not justprobable, they are certain.
Below is a summary of key inputs, outputs and impacts for our food system. Relating these to theinformation about our food system reveals that all are relevant for Bristol given our current andincreasing dependence on imports, complex supply chains, industrialised agriculture, long distancetransport, refrigerated warehousing, and the progression away from diversity of independentbusinesses and local wholesale markets.
13.1.1 Key Inputsa Fertile agricultural landa Seeds, some under monopoly controla Water, including infrastructure for storage and distributiona Sunlighta Chemical fertilisers and chemical pest control agentsa Capital intensive and specialised plants for industrial scale farming, processing, packaging,
manufacturing, warehousing, refrigeration, including maintenance and/or replacement servicesa Cheap flexible labour, 24 hour, and migrant to cope with seasonal workinga Animal feedsa Materials for packaginga Finance and insurancea Legal and contracting servicesa Logistics and distributiona Routes to market and retail infrastructurea Fuel
13. How can we assess the resilience of Bristol’s current food system?
104

13.1.2 Key Outputsa Variety of fresh and manufactured foods, and range of quality and affordabilitya Employment and economic exchange in broad range of sectors including equipment supply
and infrastructure, advertising, logistics, IT systems etc a Degradation of soil, loss of biodiversity, pollution of water courses, greenhouse gas emissions,
noise and air pollution from transport, rainforest clearance for growing animal feeda Progressive reduction in workforce on the land, and in local distribution, local wholesale,
independent retail and small scale food businessesa Adverse impacts for illegal workers in UK, knock-on impacts on welfare and health services, and
labour issues in other countriesa Poor productivity in calories of fossil fuel per calorie of food energy produced (likely 5 calories
or more of fuel to produce one calorie of food, contrast with other models eg mixed, low-input,agro-ecological approaches to farming with much wider diversity of crops that use 1 calorie fuelto produce 5 calories of food)
a Many households and individuals reliant on shops beyond walking distance, and without skillsor facilities for cooking in the home
a Waste products going to landfill including packaging and food wastea Obesity, diabetes, heart disease related to excess calorie consumption and high fat, salt, sugar
processed foods
13.1.3 Key threatsa Fossil fuel depletion with consequent volatile price, shortages and knock-on impacts for
economic growtha Water shortages due to loss of aquifers, droughts, and growing population demanda Scarcity of other natural resources including for example phosphatesa Biodiversity loss leading to crop failuresa Shortage of land for food due to soil degradation, loss of agricultural land to building
development, competition from land use for biofuela Extreme weather events including floods, storms, heat, drought, and severe cold, affecting
crops and impacting on transportation and other elements of the supply chaina Economic shocks leading to collapse within key sectors including the banking sector, and
failure in other infrastructure sectorsa Price volatility and speculation causing loss of food access for vulnerable sections of society and
triggering social unresta Continued loss of plurality and diversity in food markets due to increasing monopoly of giant
food businesses, consequent continued loss of local capacity and skills in food productiona Increasing likelihood of short term failures in transport system and refrigeration infrastructure
due to extreme weather, fuel stoppage, grid failure, industrial action, conflict etc means that‘just-in –time’ long distance distribution networks could become a vulnerability rather than astrength
13.2 How concerned is the UK Government about food resilience?
In Britain, until the early 1990s, secret food stocks of easily stored basics were held officially. Nowthe Government depends on retailers like Tesco to keep ‘buffer’ reserves which means that foodsecurity is currently in the hands of multi-national businesses. Whilst government has clear dutiesand accountabilities to the entire population the same does not apply to a multinational businesswhose legal duty is to produce profits for shareholders. The nature and consequences of thisrelationship has not yet been tested in anything other than short term localized incidents (1).
Source:1. Hungry City: How food shapes our lives’; Carolyn Steel, 2006
13. How can
we assess the resilie
nce
of B
ristol’s curren
t food system?
105
The recent Labour Government acknowledged the need to ensure that the UK can grow enoughfood to feed itself sustainably in the years to come. ‘Food 2030’ set out their vision for a sustainableand secure food system for 2030, and the steps needed to get there (2). Their priorities were:
1. Enabling and encouraging people to eat a healthy, sustainable diet 2. Ensuring a resilient, profitable and competitive food system 3. Increasing food production sustainably 4. Reducing the food system’s greenhouse gas emissions 5. Reducing, reusing and reprocessing waste 6. Increasing the impact of skills, knowledge, research and technology
The UK government published its ‘UK Food Security Assessment: Detailed Analysis in August 2009’,and this was updated in January 2010(3).
A weakness of the Food Security Assessment report is that it explicitly supports the contemporaryofficial government position which is that peak oil is not an issue. This is despite a thoroughassessment by the UK Energy Research Centre(4) concluding that the peak in conventional oilproduction is likely before 2020, and despite acknowledgment by the International EnergyAgency(5) that world crude oil production has plateaued and has not regained its 2006 peak. Inrecent months the Energy Secretary Chris Huhne has indicated in media interviews (September and
December 2010) that oil price shocks will hit the economy very seriously, and that although we donot know when oil production will start to decline the UK needs to ensure that it is not dependanton volatile oil markets. This is the first concrete evidence that the UK government may be startingofficially to recognise the significance of peak oil.
The UK Food Security Assessment uses a system of green, amber and red lights to rate a range ofrisks to UK food supply and distribution, both for the current situation and for the future (5-10 yearsahead). Food chain resilience is scored amber for areas like diversity of oil supply, businesscontinuity planning and average retailer grocery stocks. At global level the ratings are red or amberfor global land use, fertiliser usage, and water withdrawal by agriculture. The report notes that‘diversity within the domestic supply chain promotes resilience as well as competition’ which isperhaps a recognition of concerns about adverse market impacts of the dominance of the majorchains in food retail. (6)
13.3 How concerned should we be?
The lists of inputs, outputs and impacts suggest there is cause for concern. Our current direction oftravel is only wise if;a We are confident of cheap oil for ever, a We have a never ending supply of new fertile land, aquifers, and mature rainforests to replace
those that have been lost, a We ignore the health damage, particularly for children, due to the shift to highly processed and
heavily promoted poor quality food, anda We ignore the damage caused by labour markets using exploited workers.
Sources:2. ‘Food 2030’ and ‘Food 2030: How we get there’; DEFRA; Jan 20103. http://www.defra.gov.uk/foodfarm/food/pdf/food-assess100105.pdf4. Sorrell S, Speirs J, Bentley R, Brandt A, Miller R. Global Oil Depletion. An assessment of the evidence for a near-term peak in global oil production.
UK Energy Research Centre. August 2009. ISBN 1-903144-0-35 http://www.ukerc.ac.uk/support/Global%20Oil%20Depletion 5. World Energy Outlook 20106. UK Food Security Assessment: Summary; DEFRA Food & Farming Analysis Group, Jan 2010
13. How can
we assess th
e resilience o
f Bristo
l’s curren
t food system
?
106
13.4 What would a more resilient food system look like?
The question of what constitutes a resilient and sustainable food system is exercising the minds ofpolicy-makers the world over.
13.4.1 Bristol Food CharterIn 2010 Bristol City Council adopted a Food Charter committing them to ten key ambitions, and isnow working with key partners to establish a ‘Food Policy Council’ with the aim of ensuring that allresidents and visitors in Bristol have access to:a Healthy fooda Produced in such a way that non-renewable resources, soil integrity, and biodiversity are
maintained rather than depleteda That is affordable and fairly available to alla Where workers involved in the food system are fairly treated, anda With production, distribution, retail and supply systems that are resilient to the impacts of
projected climate change and fossil fuel depletion.
13.4.2 Principles of a Healthy, Sustainable Food SystemFor a more thorough and detailed expansion of what some of these aspirations could entail, it ishelpful to look at recent work lead by the American Planning Association, together with healthrelated associations in the USA. The APA statement on ‘Principles of a Healthy, Sustainable FoodSystem’ (June 2010) is reproduced below:
APA Statement ‘Principles of a Healthy, Sustainable Food System’ (June 2010)
We support socially, economically, and ecologically sustainable food systems that promotehealth – the current and future health of individuals, communities, and the naturalenvironment.A healthy, sustainable food system is:
Health-Promotinga Supports the physical and mental health of all farmers, workers, and eaters a Accounts for the public health impacts across the entire lifecycle of how food is produced,
processed, packaged, labelled, distributed, marketed, consumed, and disposedSustainablea Conserves, protects, and regenerates natural resources, landscapes, and biodiversity a Meets our current food and nutrition needs without compromising the ability of the system
to meet the needs of future generationsResilienta Thrives in the face of challenges, such as unpredictable climate, increased pest resistance,
and declining, increasingly expensive water and energy suppliesDiverse in a Size and scale – includes a diverse range of food production, transformation, distribution,
marketing, consumption, and disposal practices, occurring at diverse scales, from local andregional to national and global
a Geography – considers geographic differences in natural resources, climate, customs, andheritage
a Culture – appreciates and supports a diversity of cultures, socio-demographics, andlifestyles
a Choice – provides a variety of health-promoting food choices for all(cont.)
13. How can
we assess the resilie
nce
of B
ristol’s curren
t food system?
107

13. How can
we assess th
e resilience o
f Bristo
l’s curren
t food system
?
13.5 Summary
Our current food system for Bristol relies on a range of complex inputs many of which are highlyvulnerable to disruption from resource depletion, population growth, environmental degradationand economic instability. Some of the consequences of the current system are actually detrimental,now and/or in the future. System redesign is therefore desirable in order to minimise thesenegative impacts.
The UK Government recommends that food for the UK needs to be produced more sustainably,with less greenhouse gas emissions, with less reliance on imports, better health, more competitionwithin the marketplace, and less waste. The UK Government does not yet officially acknowledgepeak oil as an issue.
Bristol can play a major role in reshaping the way that food is produced and procured for residentsand visitors to the City. The information contained in chapters 1 to 12 of this report provides thestarting point for planning how to make changes. The June 2010 statement prepared by theAmerican Planning Association is a helpful description of a sustainable, resilient and healthy foodsystem.
Faira Supports fair and just communities and conditions for all farmers, workers, and eaters a Provides equitable physical access to affordable food that is health promoting and
culturally appropriateEconomically Balanceda Provides economic opportunities that are balanced across geographic regions of the
country and at different scales of activity, from local to global, for a diverse range of foodsystem stakeholders
a Affords farmers and workers in all sectors of the system a living wageTransparenta Provides opportunities for farmers, workers, and eaters to gain the knowledge necessary to
understand how food is produced, transformed, distributed, marketed, consumed, anddisposed
a Empowers farmers, workers and eaters to actively participate in decision making in allsectors of the system
A healthy, sustainable food system emphasizes, strengthens, and makes visible theinterdependent and inseparable relationships between individual sectors (from production towaste disposal) and characteristics (health-promoting, sustainable, resilient, diverse, fair,economically balanced, and transparent) of the system.
108

14. W
hat are the city’s positive
food planning powers?
109

‘Both food and cities are so fundamental to our everyday lives that they are almost
too big to see’. (Carolyn Steel, Hungry City, 2006)
14.1 ‘Food systems planning’
Over half the world’s population now live in towns and cities and the United Nations predict thatthis will increase to 80% by 2050. Alongside this increase, there is evidence that as people movefrom rural to urban areas, their diets change too, with an increased demand for the water andenergy-intensive western meat-based diet. Cities already consume around 75% of the world’s foodand energy resources, indicating the need to review the relationship between the food supplysystem and urbanization.
‘There is a very real question over the sustainability of the current global and UK food
systems. Cities as major consumers of food have a part to play in reducing their
environmental impact, they can do this by ensuring use of local and seasonal food, using
procurement to ensure this and other important issues such as fair trade are addressed. This
should involve a role for local decision makers including politicians, planners, food activists
and citizens.’ (Dr Martin Caraher, Professor of Food and Health Policy, City University,London)
There is a growing ‘food systems planning’ movement in North American cities which is nowmaking its way towards Europe and the UK via the academic community who are drawingattention to the role of planners in shaping city food systems. The ‘food planners’ are mixedstakeholder groups of professionals, food businesses and campaigners who share the same visionof a sustainable food system. A strategic integration of agriculture and the food system into cityplans, ie ‘food systems planning’, contributes to sustainable regional development plans andaddresses a wide range of issues including: climate change and environmental concerns;employment and the local economy; education and training; health and wellbeing; social justiceand inclusion.
Professor Kevin Morgan has identified that the ‘urban foodscape’ has many facets and that there aretherefore several different angles from which cities can begin to improve resilience in the foodsupply system: a Public plates where low cost masquerades as best valuea Food service where transparency is absenta Supermarkets where localisation should be a planning requirementa Public spaces for farmers’ markets and healthy food zones around schools.(1)
Cities actually generate potentially valuable resources for food production in significant amountsincluding heat, energy and organic waste. Therefore, rather than being a part of the problem, withcareful planning cities can provide food system solutions that recognize the multi-functionality ofagriculture and integrate food into urban planning and design practices. The food systeminterconnects with many activities that are central to urban planning.
‘The planning process needs to focus on the concept of ‘ecological public health’ and take
into consideration a number of challenges or ‘new fundamentals: climate change; fuel / oil /
energy; water; land use; biodiversity; labour; population; urbanisation; affluence and
inequality; nutrition transition; healthcare costs; waste.’ (Professor Tim Lang, Centre for Food Policy, City University, London).
14. What are the city’s positive food planning powers?
Source:1. Feeding Bristol in the future conference; March 2010; Professor Kevin Morgan, School of City and Regional planning, Cardiff University
14. What are th
e city’s positive fo
od plan
ning powers?
110

‘Food systems planning’ provides cities with the opportunity to build a green economy with food atits heart in a way that builds a mutually supportive relationship between the city and its hinterland.It enables the development of a ‘productive green infrastructure’ embedded within the city, wheregreen spaces have multiple benefits and can function as ‘green corridors’ linking the city with itsrural surroundings, for example: cycle and walking routes; food production; leisure space; carbonsequestration; nature conservation; improved recycling of nutrients and energy. This approach canfacilitate the design of smart ‘closed loop’ systems that make efficient use of both organic wasteand renewable energy resources for agriculture that are generated by the city, and the applicationof green building technology and adaptive re-use of sites and buildings.
14.2 Integrating food into new-build housing plans
An innovative planning and design process for a new-build area of housing in the South of Englandaddressed ways to integrate sources of home grown, local and regionally produced foods suppliedby regional farms and food related businesses into the development proposals. The designersstated that the proposals resulted in both new and existing communities having better access tosupplies of healthy fresh ingredients and food helping to provide:a Increased food security in the face of uncertain economic stability and energy suppliesa Healthy ingredients leading to improved dietsa Business and employment opportunities for local residentsa Improved environments, wildlife and landscapesa Opportunities to be involved in food production and reconnect with the landa A chance for community activities around food combined with new economic models to
improve access to healthy food across all income brackets (2)
14.3 Some ideas for positive planning powers for supporting thedevelopment of a resilient food system for Bristol
The town planning system helps to ensure that development takes place in the public interest, ineconomically, socially and environmentally sustainable ways. The core elements of the planningsystem are development plan-making, for example the Bristol Development Framework, anddevelopment management including the determination of planning applications, planningenforcement and pre-application advice.
Although planning can influence different elements of the ‘food system’ from growing, processing,manufacturing and distribution to retail, consumption and waste, traditionally food has not beenconsidered as an explicit aspect of development planning or looked at in a holistic way. A recentreport by Sustain reviews the range of national planning policies that could support moresustainable food systems, and the reasons they are not routinely being put into practice(3). Thereare ways in which the planning system could start to support the development of a resilient foodsystem and these are listed below.
14.3.1. Food growing:a A strong presumption against the development of any of the best and most versatile
agricultural land (grades 1, 2 and 3a) and general protection of all other agricultural land(grades 3b and 4) except the very poorest (grade 5). Increasing building densities in urban areaswill reduce the pressure to develop agricultural land.
Sources:2. ‘Romsey Enquiry by Design – food and farming within the proposed new development’: Phil Stocker, Soil Association, 2009)3. ‘Good planning for good food: How the planning system in England can support healthy and sustainable food’: Sustain, January 2011;
http://www.sustainweb.org/pdf/Good_planning_for_good_food.pdf
14. W
hat are the city’s positive
food planning powers?
111

a A specific use class or land use designation in plans for ‘food growing’ that includes agriculturalland, allotments and community growing areas. There may already be protection in terms ofgreen belt or green open space and although this protects against built development, it doesnot prevent loss to other open space uses such as golf courses and sports facilities.
a New housing developments to encompass allotments as part of the redevelopment, ormitigation through off-site provision. Bristol’s Allotment Strategy has a standard of 7 allotmentsper 1,000 people that is reflected in Bristol’s draft Development Management policy DM6.
a Private amenity space such as gardens to be designed and located to facilitate opportunities forgrowing food. Policy DM6 aims to do this.
a Policies to encourage green roofs or greenhouse roofs on large buildings that could be used forfood production.
a Policies to encourage temporary or interim uses such as food growing, pending development ofsome sites.
14.3.2 Food processing and manufacture:a Promoting food business parks where business clusters and networks could develop supported
by access to sustainable transport services, where higher air quality and other environmentalstandards would apply, in contrast to general industrial and warehousing areas. Examples ofgood models and practice include: Cross Hands Food Park, Carmathenshire; Southglade FoodPark, Nottingham; European Halal Food Park, Norfolk; Malmo Park, Hull and Fleetwood Fish andFood Business Park, Lancashire.
14.3.3 Food distribution and retail:a Policies regulating town, district and local centres to protect and restrict the loss of
independent food retailers and address the issue of access to food. It is a common practice tohave policies restricting the loss of premises to non-retail uses such as for estate agents, banks,pubs and take-aways (eg Bristol’s draft Development Management policy DM2), but not the lossof food shops to other retail uses such as fashion stores. To achieve this would require a changein the Use Classes Order or the use of Article 4 directions.
a Policies covering the sub-division or amalgamation of retail units. This would mean thatproposals to merge a number of small shops (200 – 250 sq metres) together to create one largestore or supermarket would need planning permission, or vice versa.
a Allocate sites for markets in all urban community centres. Bristol’s draft DevelopmentManagement policy DM6 encourages new street markets.
a Restrict the development of hot-food takeaways near schools, youth clubs and parks as part of astrategy to support healthy eating, particularly by children and young people.
14.3.4 Food consumption:a Housing developments, including flat conversions, to include specification of a minimum size
for kitchens offering sufficient space to store and cook fresh foods.
14.3.5 Food waste:a All residential developments including flat conversions, hotels, care homes, prisons, and student
accommodation to incorporate space for separate food waste storage. This is included inBristol’s draft Development Management policy DM21 on recycling and refuse provision fornew developments.
a All food retailers and catering establishments to have separate food waste storage to facilitatefood recycling and composting.
a Providing facilities for both organic waste composting and food waste recycling. Policy 3 of thedraft West of England Joint Waste Core Strategy covers ‘open windrow composting’.
14. What are th
e city’s positive fo
od plan
ning powers?
112

14.3.6 Community benefits:a Section 106 on payments and community infrastructure levy/tariff to support healthy eating
and local food initiatives, for example via allotment provision.
14.3.7 Changes to national planning policy to support resilient food systems: In December 2010, the Government introduced the Localism Bill, which reforms the planningsystem, and launched a consultation on its plans to consolidate existing policy statements, circularsand guidance documents into a single national planning policy framework. These provideopportunities to better integrate food into national planning policy. Ideas to do this include:
a Strengthen the advice in paras 28 & 29 of PPS7 (Sustainable Development in Rural Areas (2004))so that the protection of best and most versatile agricultural land for food growing, defined asland in grades 1, 2 and 3a of the Agricultural Land Classification, is given the highest priority,rather than just taken into account alongside other considerations.
a There should be a general protection of all other agricultural land, in particular grades 3b and 4,except the very poorest grade 5 land. This is in contrast to the current national policy that littleweight in agricultural terms should be given to the loss of agricultural land in grades 3b, 4 and 5except in areas such as uplands where particular agricultural practices may themselvescontribute in some special way to the quality and character of the environment or the localeconomy.
a Create a new use class for food growing that would cover agricultural land, market gardens,small holdings, allotments and community growing areas.
a Amend national planning policy statement (PPS4) and the advice in Circular 11/95 (para 106) sothat the impact on the resilience of the food system would be a material consideration inplanning decisions, including the use of conditions, as well as issues such as the impact on thecharacter, diversity, vitality and viability of a centre.
a Planning policy can currently manage the loss of shops to other non-retail uses such as estateagents, banks, pubs and take-aways. However it does not address the issue of access (or lack ofit) to food. To protect food shops, the current Use Class A1 (retail) should be split into twoseparate use classes - food retailing and non-food retailing. This would mean that proposals tochange from a food store to another type of shop (eg clothes, books or electrical goods) wouldneed planning permission, or vice versa.
a Amend the General Development Order so that amalgamation and sub-division of retail unitswould not be considered permitted development and thus be subject to planning permission.This would mean that proposals to merge a number of small shops (200 - 250 sq m) together tocreate a larger store or supermarket would need planning permission, or vice versa.
a To stop big retail developments dominating a centre, undermining small local shops or creatinglocal monopolies there should be national upper size limit or floor space cap on all retaildevelopment. Local authorities would be free to set a lower cap if that is more appropriate totheir local circumstances. The Republic of Ireland has a cap of 3,000 sq metres net retailfloorspace outside Dublin (3,500 sq metres in Dublin), which can be reduced down to 2,000 sqmetres locally.
a To stop the growth of “Clone Town Britain”, planning authorities need to be able to limit thenumber or proportion of retail and restaurant multiples or chains within a centre,neighbourhood or local authority area(4). This will need changes in national planning legislation
Source:4. Re-imagining the high street: Escape from Clone Town Britain’: the new economics foundation, 2010
14. W
hat are the city’s positive
food planning powers?
113

aand planning policy and an agreed definition of a chain. Chains are a range of retail outlets withsome or all of the following elements: under the same ownership (but can include franchiseoperations); share a brand and central management, usually with standardised businessmethods and practices; dealing in the same merchandise. New Economics Foundation defines amultiple as having ten or more branches. Chains can also be defined by their geographic spreadie they may operate within a local area, or within a region or across the country.
Footnote: Agricultural Land Classification: Grade 1 – excellent; Grade 2 - very good; Grade 3a - good; Grade 3b
– moderate; Grade 4 – poor; Grade 5 - very poor (See appendix 10 for more detail)
Figure14: planning powers for food
(Data source: Stephen Hewitt, Bristol City Council)
Consumption
Growing, production
andprocessing
Waste Distributionand retail
A specific allocation forfood growing to coveragriculture and allotmentsand community growinginitiatives.
New housing to include newallotments (or contribution tooff-site provision).
Encourage green/greenhouseroofs on large buildings thatcould be used for foodproduction
Private amenity space (such asgardens) to be designed andlocated to facilitateopportunities for growing food.
Promoting food business parkswhere higher air quality andother environmental standardscould apply than in generalindustrial and warehousingareas
Policies for town,district and localcentres to restrict theloss of food shops(both to non-retailuses and to non-foodretail) and to cover thesub-division oramalgamation of retailunits (so thatproposals to merge anumber of small shopstogether to create onelarge store orsupermarket wouldneed planningpermission)
Allocate sites formarkets in all localcentres
Restrict thedevelopment of hot-food takeaways nearschools, youth clubsand parks as part of astrategy to supporthealthy eating,particularly by childrenand young people.
Housing developments(including flatconversions) to have aminimum size ofkitchens so that there isspace to store food andcook (ie not just amicrowave under the stairs).
Housingdevelopments (including flatconversions) to have space forseparatefood waste
storage.
Providingfacilities forcomposting andfood wasterecycling.
Encourage temporary/interim uses such as foodgrowing, pendingdevelopment of a site
114
14. What are th
e city’s positive fo
od plan
ning powers?

14.4 Summary & key points – development of a resilient food system forBristol
‘Food systems planning’ provides cities with the opportunity to build a green economy with food atits heart in a way that builds a mutually supportive relationship between the city and its hinterland.
There are a number of ways that the planning system can have an impact on all of the six maincomponents of the food system (from production through to waste) and could therefore start tosupport the development of a resilient food system as well as improve new housing and greenspace developments. This may become easier with the recent introduction of the Localism Bill.
For Bristol this approach could provide exciting new economic, environmental and social benefitsas well as supporting development of a more resilient food system. It would also enable Bristol tobecome a truly ‘Green Capital’.
14. W
hat are the city’s positive
food planning powers?
115

The Bristol Peak Oil (1) report concluded that if we want to build a positive future for Bristol withoutoil, with regard to food supply, we need to prioritise the following:a support for farming methods which build soil fertility and don’t rely on pesticides and artificial
fertilisera protection of productive farmland on the outskirts of the city a promotion of more seasonal food from local producersa a switch to a reduced meat-based diet (selecting meat reared in grass and forage fed, over meat
from intensive production systems) a encouraging people to grow their own food in private gardens, community gardens and
allotmentsa utilising public space to produce food.
So how well is Bristol doing? Although the ‘Who Feeds Bristol?’ report can only be a snapshot ofwhat is going on, it provides a baseline study of current activity and an initial indication of foodsystem strengths and vulnerabilities that relate to the recommendations in the Peak Oil report.
15.1 Assessment of strengths
The research looked at strengths in the food system that serves Bristol and the city region and wehave much cause to celebrate. The summary below has been drawn from the analysis in theprevious sections of this report. Case studies have been selected to illustrate some of theinnovation that is already making a contribution to strengthening the resilience of Bristol’s foodsystem
15.1.1 Production & processingThe city region still has a basic supply infrastructure in place in the form of local food producers andprocessors. The smaller scale abattoirs are a crucial link in the supply of locally produced meat inthe region. The meat processing and manufacturing companies provide an infrastructure for usingall parts of an animal carcass (pies, sausages etc), which is an important link in the supply chain forusing the cheaper cuts of meat and preventing waste. Butchers provide a unique and highly skilledmeat cutting service for the public which is a crucial link in the chain regarding ‘full carcassutilisation’ ie they take in whole carcasses and cut it up, minimizing waste. They also often cook thecuts of meat that are less popular and turn them into sausages and burgers, providing a range ofprices to customers.
Bakers also provide a specialist food processing service which delivers a fundamental staple fooditem to the public in the form of bread and baked goods. There has been much debate about thequality of mass-produced cheap white bread and possible links to food-related health issues. Thereal bread campaign has drawn attention to the issue of additives in bread and promoted ‘real’bread as a healthy option that is made with the simple ingredients of flour, water, salt and yeast.
‘The making of Real Bread doesn’t involve the use of any processing aids, artificial additives,
flour 'improvers', dough conditioners, preservatives, chemical leavening or, well, artificial
anything.’ (The Real Bread Campaign, www.realbreadcampaign.org)
Retaining an infrastructure of skilled food professionals like bakers and butchers who can providehigh quality services will form an important part of a resilient food system.
15. What are the specific strengths and vulnerabilitiesin Bristol?
Source:1. Osborn S. Building a Positive Future for Bristol after Peak Oil. Bristol Partnership. October 2009
http://www.bristol.gov.uk/ccm/content/Environment-Planning/sustainability/file-storage-items/peak-oil-report.en Accessed 26 May 2010
15. What are th
e specific stren
gths an
d vu
lnerab
ilities in Bristo
l?
116

The producer survey indicated that there is capacity to supply more staple food items into the cityregion. Although in reality local supply is very small scale, there is a wide range of staple food itemsstill being produced in the South West and in the area surrounding Bristol city region. This offersmarket opportunities to increase local production and provision of cereals, dairy, fruit andvegetables.
In particular, although a number of farmers in the South West have stopped growing vegetables,they are still farming and therefore, for the time being, their skills are still potentially available.Currently there are some twelve different organic box schemes operating around Bristol providinghouseholds with fresh seasonal organic fruit and vegetables. There is ‘Best and Most Versatile’ landwell suited to fruit and vegetable production close to Bristol and within the city region. Forexample, in the last year two new community supported farms are being established that link inwith Bristol: Sims Hill Shared Harvest Community in the north of Bristol (2) and the Community Farmin Chew Valley (see case study below). Both these community farms offer the public an opportunityto become members and get more involved in their own food supply.
CASE STUDY 11:
The Community Farm, ChewValley – local ownership andcommunity involvement
The Community Farm is 8 miles from the centre of Bristol in the Chew Valley. It intends to be acommunity-owned farm enterprise based on environmental sustainability and communityengagement that will supply local and organic seasonal produce. The enterprise has beenestablished on 22 acres of land which are currently in production growing organic vegetables. Ifsuccessful this will be extended to 50 acres in the next few years. The Farm is being developed inpartnership between the landowner, the growers, and the ‘eaters’.
Established as a Community Benefit Society it launched a public share offer in November 2010giving local people the opportunity to own a share in the farm. If sufficient investment is raised,this will enable the newly formed not-for-profit Community Farm to buy the existing assets andtake on the horticultural growing operation. It is about creating a prototype for a different kindof farming.
People living in Bristol, Bath and the Chew Valley area will be able to take out annualmembership. Benefits to members will include a discount on vegetable boxes, involvement ingrowing, community farmer days, horticulture courses and the satisfaction of supporting a socialenterprise that is helping to build the local food economy. The farm runs volunteer days and workdays for staff groups from organisations based in Bristol and Bath.
www.thecommunityfarm.co.uk(See full case study, appendix 11)
15.1.2 Market support for local food and drink producersSupport to local food and drink businesses has been a significant area of work for both SouthGloucestershire and North Somerset Councils, both have produced local food directories and runlocal food events. Bristol is home to the Love Food Festival which showcases over 150 producersfour times a year and the annual Organic Food Festival and Bristol Wine & Food Fair.
Source:2. http://simshillsharedharvest.wordpress.com
15. W
hat are the sp
ecific strengths an
d vulnerab
ilities in
Bristol?
117

Bath was the first city in the UK to establish a farmers market in 1997, which now hosts 47producers, while Bristol swiftly followed now hosting 34 producers. Both markets run weekly andremain successful. In total there are now 39 markets being run across the city region providingbusiness opportunities for around 350-700 businesses, demonstrating there is significant consumerdemand for local food and drink products.
15.1.3 Independent and specialist food retail and wholesaleThere are still independent butchers, fishmongers, bakers, delicatessens and specialist shops sellinglocally produced foods, whole foods and organic produce. These businesses provide evidence ofconsumer commitment to a more personal shopping experience, for local products from localretailers.
Bristol still has a varied wholesale sector which supplies the network of independent retailers. Itincludes a large fruit and vegetable wholesale market which sells fresh produce in bulk toindependent retailers and caterers. It also has meat and seafood wholesalers, and wholesalers ofcooked, frozen and fresh foods.
CASE STUDY 12:
The Better Food Company, St Werburghs – organic andlocal retail
The Better Food Company was established in1992 by the owner Phil Haughton and has 6shareholders. The motivation for setting it up was a passion for sustainable food and farming. Thecompany has 65 employees and £2.2 million turnover. The business activities cover Bristol and itssurrounding area combining retail, a fruit and vegetable box delivery scheme and a wholesaleoperation. In total, the business sells local foods to around 7,000 people per week.
The company sources local food products from 150 suppliers of various sizes and from two largedistributors, Essential Trading based in Bristol and Queenswood Natural Foods Ltd based inSomerset. Local supply is a top priority for the business after organic, so it sources freshvegetables, fruit, meat, milk, cheese, eggs and some cereals direct from farms within a 50 mileradius of Bristol.
In contrast to the model for most supermarkets of non-involved company shareholders, theBetter Food Company is looking at a community/business partnership approach withoutexpectation of big returns. Based on the company’s commitment to local involvement the BetterFood Company is helping to establish the Community Farm as a community owned foodenterprise. If successful the Community Farm will run organic vegetable growing on a not-for-profit basis and with community involvement.
www.betterfood.co.uk(See full case study, appendix 11)
15.1.4 CateringThe city has a lively ‘eating out’ culture. There are some inspirational examples of excellent cateringat affordable prices. For example, St Werburghs Farm Café attracts many young families and offerslocally sourced tasty meals made from fresh ingredients, including meat from the city farm and fruitand vegetables supplied by local allotment holders. The Canteen on Stokes Croft, part of the
15. What are th
e specific stren
gths an
d vu
lnerab
ilities in Bristo
l?
118
Coexist Community Enterprise Company, is serving two course meals made from fresh locallysourced ingredients, often for just £6-7 (see case study 5 on Leigh Court farm, page number 59).
Bristol city has a significant number of catering companies and amongst them are cateringentrepreneurs who are providing more sustainable diet options to local communities. Section 9 ofthis report referred to the Soil Association’s ‘Food for Life’ catering mark as a tool for driving changetowards a more resilient food system. There are already a number of Bristol caterers workingtowards this catering mark.
15.1.5 Community food activityThe city already has a surprisingly high level of community food growing and cooking activity,though much of it is unseen. This includes community allotments and gardens, communityorchards, food buying groups, community kitchens, small organizations running food growingcourses and supporting residents to grow food in their gardens and neighbourhoods or asmembers of specialist gardening groups. For example:a HHEAG (see case study page 94 and appendix 11) offers a successful model based on many
years experience of tackling food issues and disadvantage in a community context. a Transition Bristol network is instigating food activity and discussion around the city related to
community resilience in a wider sense (finance, energy, food, transport, housing). a Bristol permaculture network has over 400 members a Bristol Food Network has made recommendations for building a sustainable food system(3) and
has developed a project proposal ‘Dig Bristol’ supporting existing local food groups in thenetwork to engage more people in growing food and work towards transforming Bristol into a‘food-garden city’. Local Food Lottery funding has been applied for but unfortunately has notbeen successful.
15.2 Assessment of vulnerabilities
Alongside the celebration of strengths, there are some potentially significant threats to agriculturalland and food supply in the South West and in the Bristol city region.
15.2.1 Climate change impacts in the South WestHigher temperatures, drier summers and wetter winters are expected across much of England.There is risk of more frequent extremes of drought and flooding and agricultural crops in Britainmay need to be moved to new areas as the threat of both drought and flooding rises in the comingdecades. Crops that need irrigation, such as sugar beet and vegetables, may be forced to shift fromthe drier east of England to the wetter west of the country where water will be more available. (4)
The main changes that the South West region is likely to see will have a significant impact onfarming and food production including warmer drier summers with heat stress and droughts,wetter milder winters and flooding, and rising sea levels(5).
Impacts could include crop damage and loss, soil erosion, drainage and building maintenancecosts, disruption to transport, stress to livestock and increased fire risk. The South West region isalready vulnerable to existing climate events . Impacts of the flooding in Gloucestershire in thesummer of 2007 included lost water and power supplies, disrupted transport routes, 1177 hectaresof arable land and 2185 hectares of grassland were flooded over an area of 33 square kms. Farmerslost an average £1,150 per flooded hectare and the cost to UK agriculture was an estimated £50million (6). (See appendix 10)
Sources:3. A sustainable food strategy for Bristol, 20094. ‘Water for Agriculture: Implications for future policy and practice’; Royal Agricultural Society of England; Oct 20105. UK Climate Projections 09, UKCP096.Climate South West. http://www.oursouthwest.com/climate/
15. W
hat are the sp
ecific strengths an
d vulnerab
ilities in
Bristol?
119

15.2.2 Safeguarding land for food production‘Protecting highly productive soils which could be used for agriculture and food production if
required, and valuing the other benefits, for example aquifer recharge and flood control,
whilst allowing for other required land use changes such as the creation of new habitats,
coastal change and the development of the rural economy, will also allow us to respond
positively to the challenges of food security in the future. This high quality resource is also
that which is likely to be most flexible, productive and efficient in response to inputs and can
therefore make a positive contribution to sustainable agriculture.’ (Gill Shaw, Natural England, 2010)
If Bristol city region is going to be more food resilient in the future it will need to both value themultiple benefits that arise from sustainable agriculture and land management and ensure thatproductive land in the city region remains available for food production.
Within the city region the two potential threats to agricultural production are loss of agriculturalland to new urban development or loss of land due to flooding. It is important to have a clearunderstanding of where the best agricultural land is located and the risks to these areas. As yetthere has not been any detailed assessment by any of the four unitary authorities of the risk fromflooding in the region to agricultural land and the impact this might have on food production andsupply in the future. Nor is there a cross-authority approach to decisions about change of land usein the context of building the region’s food security and resilience.
There are maps that show the status of soils in the region and where the most valuable agriculturalland is located. There are separate maps that show flood risks. Ideally these two sets of maps needto be overlaid and further investigation carried out into the potential impacts of flooding on foodproduction and supply in the region.
Map 7: Bristol region land classification map Map 8: Bristol region soil survey map
Maps 7 and 8 give an overview of land quality across the Bristol city region. Grading is used todescribe the different types of land and suitable usage. Grades 1, 2 and 3a are considered the bestland for agricultural use and producing food, in planning policy this is referred to as ‘Best and MostVersatile Land’. Non-agricultural land is predominantly large areas of woodland and areas used forthe military.
15. What are th
e specific stren
gths an
d vu
lnerab
ilities in Bristo
l?
120
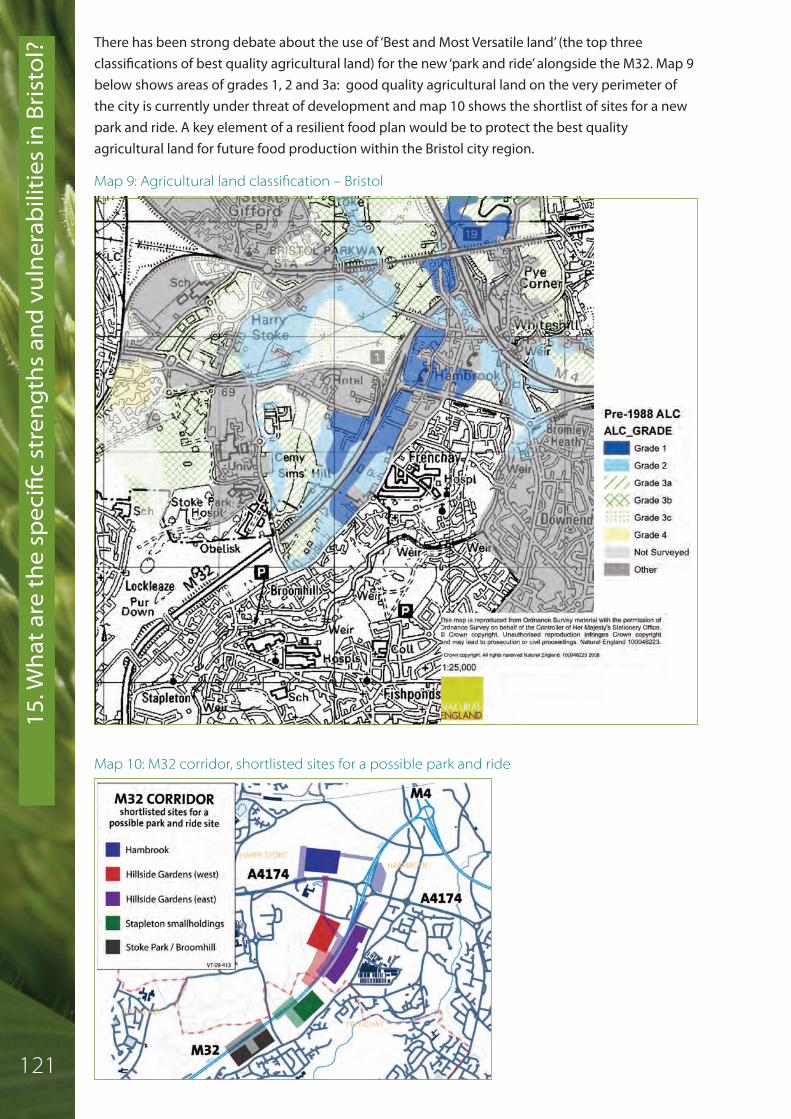
There has been strong debate about the use of ‘Best and Most Versatile land’ (the top threeclassifications of best quality agricultural land) for the new ‘park and ride’ alongside the M32. Map 9below shows areas of grades 1, 2 and 3a: good quality agricultural land on the very perimeter ofthe city is currently under threat of development and map 10 shows the shortlist of sites for a newpark and ride. A key element of a resilient food plan would be to protect the best qualityagricultural land for future food production within the Bristol city region.
Map 9: Agricultural land classification – Bristol
Map 10: M32 corridor, shortlisted sites for a possible park and ride
15. W
hat are the sp
ecific strengths an
d vulnerab
ilities in
Bristol?
121

15.2.3 Threats to food distributionThe depletion of fossil fuel reserves and subsequent increase in fuel prices will have a significantimpact on food distribution. But flooding is also a threat to the current food distribution system.Bristol City Council flood risk maps indicate that there is a risk of Avonmouth flooding, which wouldaffect the largest area of agricultural land within the city boundary and also would affect the foodwarehousing, distribution centres and the M5 itself. A risk of flooding on sections of the M32 hasalso been identified(7).
15.2.4 Loss of farms and farmersThis report has not carried out an assessment of loss of farms and farmers in the city region or theSouth West, but this is a key issue in terms of future food system resilience for the whole of the UK.Today less that 2% of the UK population works in farming. Defra agricultural census data suggeststhat between 1951 and 2003 there was a 79% decline in the number of farm workers. In his book‘Sow Shall We Reap’ author Colin Tudge suggests that the UK would need 20% of its population towork in farming in order to produce the required amount of home-grown food needed under thecoming constraints of climate change and peak oil.
15.2.5 Loss of diversity in both retail and productionThe importance of diversity in nature is to spread risk and increase resilience. The growth ofsupermarkets which supply the bulk of our food here in the UK has had the effect of reducingdiversity in retail and also in the range of foods produced on farms due to the economies of scalethat are required. So far this business model has significantly increased the efficient supply of foodbut we do not know how it will fare if fossil fuel resources become depleted.
15.2.6 Vulnerabilities elsewhere in the food system As identified in Section 13 our food system is also dependant on numerous inputs from othersectors of the economy including for example transport, finance, and specialised equipment.
15.3 Summary
For Bristol and the city region, increasing food system resilience could include increasing foodsupply from the local area and the surrounding regions with as much production of staple items aspossible including fruit and vegetables, diary, meat, fish, eggs, bread, cereals and grains. It mightalso mean producing a small proportion of fresh fruit and vegetables in the city where possible.These staple items could be produced in low carbon production systems using renewable energyand working with soil nutrients that are carefully recycled and built up without dependence oncostly imported inputs. To be able to feed themselves on these staple food items, residents ofBristol would need to know how to prepare and cook meals from fresh raw seasonal ingredients.We would also need to reduce our consumption of meat and dairy while eating more fruit andvegetables.
Who are the most effective players to affect such changes is an ongoing discussion? Bristol hasstrong foundations on which to build a resilient food system for the future, with many of the keybuilding blocks already in place including land, skills, entrepreneurs and community interest.However, the city is not making the most of the potential for local food supply and currently riskslosing some of these building blocks due to economic pressures and the impact of large scalesupply chain business models. Building a resilient food system is about ensuring diversity, flexibilityand mitigating potential risks.
Source:7. Stephen Sodek, Flood Risk Manager, Bristol City Council
15. What are th
e specific stren
gths an
d vu
lnerab
ilities in Bristo
l?
122

The main challenges are to:
a Increase the amount of fresh seasonal staple food items available through a wide range ofmarkets, making the most of the available potential for local supply, thereby ensuring its viabilityin the longer term by strengthening market opportunities.
a Ensure that more staple food items are produced closer to urban areas. It may be that we are ata tipping point on the high street and that if attention is not given to maintaining and in somecases re-establishing a more diverse mosaic of food retailers with strong links to local producersand processors, these opportunities could be lost.
15. W
hat are the sp
ecific strengths an
d vulnerab
ilities in
Bristol?
123
If we are to make progress towards a more sustainable and resilient food system then key playerswith influence will need to work together to make this happen.
To make this possible it is recommended that a Food Policy Council should be established forBristol. This will be a small group of committed individuals with expertise and local involvement infood production, preparation, distribution and retail. Their task will be to drive necessary changeswith the common objective of achieving a healthier, more sustainable and resilient food system.
Food Policy Councils have been used to good effect in North America. Experience to date showsthat the following characteristics are associated with success(1):
a A formal relationship with and the support of the local authority is essential.a In order to achieve their potential, FPCs need a strategic vision, access to decision making, clear
objectives and evaluation mechanisms, and a strong understanding of the local food system. a Successful FPCs act as a strategic umbrella to coordinate all aspects of system change.a Those which focus on a single issue tend to falter; those which succeed are properly grounded
in the local area and include high profile, rapid impact projects which demonstrate howprinciples can be put into action.
a FPCs are most successful when they build on local groups and campaigns and tackle issues thathave already been identified as needing to change; they bring authority to grassrootsmovements.
a Successful FPCs often start by researching and mapping the local food system and bycampaigning for a local food charter or strategy.
16. Suggestions for action
Source:1. Harper A, Shattuck A, Holt-Giminez E, et al. Food Policy Councils: Lessons Learned Development Report No 21. Institute for Food and Development
Policy. December 2009 http://www.foodfirst.org/en/foodpolicycouncils-lessons (accessed Feb 2011)
a Establish a food systems planning process with key stakeholders.a Safeguard the diversity of food retail.a Safeguard land for food production in and around the built up area.a Support urban community food production and processing. a Redistribute, recycle and compost food waste to support production of more food.a Protect key infrastructure, transport and distribution networks for supply of food from the
surrounding area.a Increase the opportunities for local food producers to sell into the city.a Support community food enterprise models.a Engage Bristol’s community in transforming the city’s food culture.
The key strands of work identified in this report as priorities for the Food Policy Council are as follows:
16. Suggestio
ns fo
r action
124

Safeguard diversity of food retail
Transform Bristol’s
food culture
Redistribute recycle & compost
food waste
Protect key infrastructure for local food
supply
Support community
food enterprise models
Safeguard land
for food
Increase markets
for local food producers
Urban food production
& distribution
Food systems planning process
Figure 15: Developing a resilient food plan: summary of priorities
The remainder of this section considers each of these work themes in turn.
16.1 Establish a food systems planning process with key stakeholders:
'Food systems planning' refers to the strategic integration of agriculture and food into the way thatcities are designed, planned and managed. It can address issues relating to the environment,employment, local economy; education, training; health, climate change social justice andinclusion.
16.2 Safeguard the diversity of food retail:
A healthy, sustainable and resilient food system needs diversity of production and supply, andrequires market and regulatory mechanisms that recognise the importance of health, environment,and local prosperity. Potential measures for strengthening the wholesale, distribution and retailmechanisms for sustainable food are contained throughout this report. The Food Policy Council willneed to implement these measures using business support mechanisms, transformation ofprocurement practices particularly in the public sector, and planning powers.
16.3 Safeguard land for food production in and around the built up area:
The following suggested actions could contribute to this
a Mapping and audit of productive land in Bristol and in the city region – includingidentification of best agricultural land, and of risks and threats from impacts such as change ofland use and flooding.
16. Suggestions for ac
tion
125

a Establishment of mechanisms for initiating urban agriculture – including consultation withcurrent leaseholders and government officers, review of local authority policies on agriculturalland lettings and usage, further work on ‘Empty Land’ plots in Bristol, food-mapping inconjunction with Connecting Bristol and Geofutures. By way of an example, positive work hasbeen undertaken by Devon and Gloucestershire County Councils to consolidate theirlandholdings and transfer selected farms to community enterprise.
16.4 Support urban community food production and processing:
Informed by the mapping and audit work, potential initiatives to expand local food productioncould include:
a Development of glass horticulture units, linked sustainable fish farming and integratedcomposting enterprises using eco-technologies of recycled waste, water and heat system atAvonmouth (see also Growing Power and Cardboard to Caviar case studies).
a Establishment of ‘forage’ areas of fruit and nut trees and shrubs in municipal parks and greenspaces, planting of community orchards.
a Expanding allotments and community gardens for community growing, developingcommunity kitchens for processing surplus food, for example preserves and jams, soups andjuices.
These work strands need to build on and support the considerable grassroots activity that alreadyexists in Bristol. Funding to enable the ‘Dig Bristol’ project proposal developed by Forum for theFuture could significantly enhance existing and new community food growing in the City.
16.5 Redistribute, recycle and compost food waste to produce more food:
The findings of this report show there is considerable scope for making better use of food waste,and for involving supermarkets, wholesalers, distributors, caterers and householders in this work.
16.6 Protecting key infrastructure, transport and distribution networks forsupply of food from the surrounding area:
The key infrastructure for food production and distribution needs to be the subject of a riskassessment and resilience plan.
16.7 Increase opportunities for local food producers to sell into the city:
The findings in this report suggest considerable scope for supporting the numerous smallbusinesses involved in local and sustainable food. Mechanisms that enable collaboration and co-operation could bring about an overall expansion of the market share for local and sustainablefood. Areas of work that need to be considered include;
a Customer awareness: The majority of producers would welcome support to find and targetnew customers interested in local food, together with additional marketing and promotion oftheir products’ quality and value. Producers requested market research to identify newcustomer groups interested in buying local food. In particular, market intelligence on bulkbuyers of staple products like eggs, dairy, meat and vegetables (eg schools, hospitals, carehomes etc).
a Transport & distribution: Costs of transport and distribution prevent many of the producersfrom selling their products to retailers, caterers, hotels, restaurants and pubs in the Bristol area.Producers identified the need for development of a local food hub for the Bristol area to
16. Suggestio
ns fo
r action
126

a co-ordinate collection from farmers and growers, wholesale orders, and refrigerated transportand distribution services. A local food hub could be established possibly as a collectivecommunity enterprise or mutual interest company – offering membership and shares to localproducers. It could be established in St Philips or on the edge of Bristol possibly at the M5/M4junction or Avonmouth. Potential models, and the options and impacts need to be explored.
a Producer collaboration: Lack of capacity in terms of time and staff to produce, process,transport and sell their products is a barrier to increasing local supply into Bristol. For meatproducers costs for developing on-farm butchery, cold storage, labeling, refrigerated transportand staffing can be prohibitive for an independent trader. Collaboration between businessesmight help with this. Some producers of local foods including meat, eggs and vegetablesreported they only had sufficient volumes of produce to meet current demand from theirexisting outlets and for seasonal sales and would need further investment in order to expand.
a Increased market support, including public sector food supply: Producers suggested a rangeof market support initiatives to help them sell increased variety and volumes of local foods intonew markets in Bristol including schools and hospitals, retailers and restaurants. Localproducers suggested there was scope to attract other farmers, growers and processors of localfoods to help expand supply into Bristol. There is potential to establish additional farmersmarkets in districts of Bristol that are not well supplied with fresh produce.
16.8 Support community food enterprise models:
There is considerable scope for enabling local people to develop new means of buying their food ina way that supports local and sustainable produce. Potential suggestions include;
a Provide support for community food enterprise models including buying groups, communityfarms, box schemes and food co-ops, especially in the more disadvantaged areas of Bristol.
a Consider transferring selected Bristol City Council owned farmlands into ‘local food communityenterprises’ - farms close to the city could be supported by the people in Bristol.
a Explore suitable community market options for surplus food grown by tenant food producersin the city, allotment growers and gardeners.
a Establish a local food hub and linked web-sales that reaches out to new audiences. This couldbe based for example, on the USA model develop ‘Farm to City Market Basket’ of affordablypriced meat, vegetables, cheese, and fruit.
a Work in partnership with business support agencies, for example Bristol SpaceWorks andBRAVE, to offer local food businesses access to ‘enterprise development grants’ with affordablefinance from co-operatives; credit unions; Government schemes; community finance and re-investment models.
16.9 Engage Bristol’s community in transforming the city’s food culture:
The issue of transforming food culture is a nationwide challenge. Evidence from the past ten yearswithin the UK local food sector suggests that even very localised and small scale activity canachieve a positive impact for the local community. The information in this report highlights manyinnovative projects locally and further afield. These projects need to be supported, publicised, andcopied.
16. Suggestions for ac
tion
127

Glossary
Acre an area comprising 4,840 square yards. Roughly the amount of land an ox could plough in aday.
Allotment dating from the sixteenth century meaning a plot of land for food growing. Allotmentsoriginated to compensate tenant farmers for loss of common land from enclosures. A full sizeallotment plot in England and Wales is a ’10 pole plot’, equivalent to 300 square yards, 250 squaremetres, or one sixteenth of an acre. In 1943 there were 1.4 million UK allotments, by 1996 therewere 297,000. Each Bristol city allotment plot is 250sq metres,
Anti-competitive practices are business or government practices that prevent or reducecompetition in a market, for example selling below cost, exclusive dealing, barriers to entry, andprice fixing.
Artisan a skilled manual worker. Artisan food means products that are crafted rather than massproduced.
Avon Organic Group set up in 1984 to promote organic growing and organic foods in Bristol, thegroup is affiliated to the Soil Association and Garden Organic, meets regularly and produces anannual newsletter http://www.avonorganicgroup.org.uk/
Biodigester a means of managing waste using anaerobic micro-organisms to naturally decomposebiodegradable material. The resultant gas can be used as a fuel (biogas) and the nutrient richdigested material as a fertilizer.
Biodiversity describes the vast range of life on earth, everything from bacteria to oak trees, blue fintuna to human beings. Human life depends on ‘natural services’ (e.g. food, clean air, water, fertilesoils) maintained by our biodiverse ecosystem. For example recent loss of wild bees in somelocations has led to fruit trees needing pollination by hand to maintain fruit supplies.
Biofuel energy-rich materials (solid, liquid and gas) derived from renewable biological sources.Optimism that biofuels can substitute fully for fossil fuels must be viewed with caution, becauseproduction on such a scale would lead to deforestation, loss of biodiversity, and conflict over landneeded for food production.
Biogas a gaseous form of biofuel.
Biotechnology is defined as "Any technological application that uses biological systems, livingorganisms, or derivatives thereof, to make or modify products or processes for specific use." Modernbiotechnology includes genetic engineering (also known as genetic modification) where genesfrom different organisms are directly manipulated in a way that would not occur under naturalconditions, with the intention of producing a range of benefits such as increased shelf life, pest,disease and herbicide resistence.
Box schemes are a means of linking customers directly with food producers, to their mutualbenefit. Boxes with a variety of fruit & vegetables are delivered regularly usually weekly to drop offpoints in the city or in some schemes directly to individual homes.
Bristol City Council Food Charter contains 10 ambitions for Bristol and can be found onwww.bristol.gov.uk/food. These ambitions provide food policy guidance for the City Council in allaspects of its involvement with food from sustainable procurement to community supportedagriculture.
Glossary
128
Bristol City Council Food Standards provide guidance for minimum acceptable food standardsand are put in place when City Council catering contracts are renewed. The standards are acombination of Soil Association bronze level Catering standard and the Department of Health’sHealthier Food Mark standards
Bristol City Council Climate Change & Energy Security Framework adopted in February 2010. Itsets out 25 commitments for how the City Council will work with partners to achieve theopportunities presented by the transition to a low carbon, resilient city. The overarching targets areto cut Bristol’s CO2 emissions by 40% by 2020 and 80% by 2050, from a 2005 baseline.www.bristol.gov.uk/climatechange
Bristol Food Links was an umbrella organisation working to promote healthy, sustainable andaffordable food across the City. Founded in the mid-90's, as part of Voscur, Bristol Food Linksbrought together a variety of sectors to support community food initiatives in their work across theCity.
Bristol Food Network a growing network of interested individuals, groups and organizations inBristol. They subscribe (and contribute) to the bimonthly food newsletter ‘Local Food Update’, and acore group meets regularly and arranges hosting of briefings, discussions etc.
Bristol Partnership is the Local Strategic Partnership for the city. It is a group of agencies andorganizations from business, the public sector, voluntary sector, higher and further education,working together to make Bristol a successful city.
Carbon footprint is a measure of the carbon dioxide (or equivalent) greenhouse gas emissionsassociated with the production, distribution, processing, and storage for goods or services. Forexample, the carbon footprint of a pound of tomatoes will vary according to whether it is grown infossil fuel heated greenhouses, how it is irrigated, and how it is preserved and transported.
Climate Change has always happened but current concern relates to the 0.6 degrees centigraderise in global average temperature from 1961 to 1990, the major and continuing rise inatmospheric greenhouse gases which is certainly linked to the burning of fossil fuels and todeforestation, and the fact that human activity is the major influence although natural factors alsoplay a part. Projected effects include rising sea levels and flooding, droughts and water scarcity,extreme weather events including storms and heatwaves, and migration and human conflictrelating to shortages of food, water and productive or habitable land. Action now to mitigate andto adapt, will lessen or prevent the adverse effects.
Community Supported Agriculture (CSA) is a food producing system where the customers investin production along with the growers. This gives the growers have a reliable market, while thecustomer can visit and be involved with the farm, and can secure fresh, fairly-priced, good qualitylocal produce.
Co-operative a group of people acting together to meet their mutual needs. Worker owned co-operatives are a business model where the workforce own the business, make decisions collectivelyand shares the profits. The nature and function of co-operatives varies considerably.
Consolidation in business terms refers to the combining of separate smaller companies into largerones, through mergers and acquisitions.
Debt-based economics refers to the current global economic system of ‘fiat paper money’ andfractional reserve banking, which means that money is essentially created from debt irrespective ofany linkage to genuine assets.
Glossary
129

De-forestation refers to the removal of forests, and in particular rain forests, and conversion ofland to non-forest uses. The factors driving deforestation include the need for soya beans foranimal feed and for palm oil for food products, cosmetics and biofuel. Rain forests are one of theearths major carbon sinks and deforestation leads to more carbon being released into theatmosphere.
Defra is the UK government Department for Environment, Food and Rural Affairs.
Diabetes is a disorder of glucose regulation. The commoner type 2 diabetes is strongly associatedwith obesity and the number of people affected is increasingly sharply. There are around 1.5 millionpeople in the UK diagnosed with type 2 diabetes and probably many more who have the conditionbut are not yet diagnosed.
Foot-printing is a way of measuring the impact of humans on natural systems. An ecologicalfootprint is a measure of the total land area needed to produce the resources and process thewaste for human society. This is the basis for the estimate that modern lifestyles are requiring theequivalent of three planet earths in order for them to be sustainable.
Enclosures refers to land use changes in the late 1500’s under Elizabeth 1st, so that common landused for growing food and keeping animals began to be enclosed, dispossessing the poor.
Factory Farming refers to the practise of rearing livestock indoors at high density. The aim is toachieve highest output at lowest cost. Antibiotics and growth enhancers are needed to reduce thespread of disease amongst the animals. Chickens have been intensively reared for decades, and thepractice is now being adopted for pigs and cattle. Opinions are fiercely divided regarding thebenefits and harms. Concerns include issues of ethics, human health, animal welfare,environmental impacts, water pollution, economics and local employment.
Fairtrade the Fairtrade mark is an independent consumer label which appears on UK products as aguarantee that they have been certified against internationally agreed standards relating toworking conditions, local sustainability and fair terms of trade.
‘Five a day’ is a simple health message reminding everyone that fruit and vegetables are essentialfor good health. The message is that everyone needs at least five portions a day of fruit andvegetables. A portion is 80g, potatoes do not count, and the message covers fresh, dried, tinned,and frozen.
Food for Life is a network of schools and communities across England committed to transformingfood culture. The aim of the Partnership is to reach out through schools to give communities accessto seasonal local and organic food, and to the skills needed to cook and grow fresh food.
Food miles refer to the distance that food is transported from production to consumption. Theconcept was introduced in the 1990s. Food miles are one element of the environmental impact offood. Many other factors in the supply chain play a part. Transport miles matter not just because ofcarbon emissions, but also because of the adverse impacts of road haulage on traffic congestion,noise and air pollution, road injuries and deaths, highway maintenance costs etc.
Food Policy Council pioneered in America with the first being established in 1982, an FPC is anofficially sanctioned body comprising stakeholders from various segments of the food system, thatexists to improve the way food is produced and supplied with the aims of good health, strong localeconomy, strong communities and environmental sustainability.
Glossary
130

Food provenance much of our food at present is relatively untraceable, and may be made up ofingredients from a wide range of countries some of which have little or no welfare standards fortheir workforce or animals, or sustainability standards to safeguard natural resources. Produce fromthe UK may depend on lowly paid migrants working long hours in poor conditions that may fail tomeet UK minimum standards. Organisations that are committed to sustainability will ensure theyknow the provenance, and the standards adhered to, for all food and food ingredients theyprocure.
Foodshed the concept of a foodshed was used in the early 20th century to describe the global flowof foods. It has recently been readopted for discussion of local food systems as a way ofconceptualising the area from which it would be possible to source the food needed for apopulation, analogous to a watershed.
Food Standards Agency a UK government body responsible for food safety and food hygienethroughout the food chain, working with food producers through to local authority enforcementofficers.
Fossil fuel energy originates from fossilised remains of ancient living organisms. Millions of years oflife on earth have provided the coal, gas and oil currently being used for 95% of the worlds energyneeds. Since the first oil wells were drilled in the 1850s our use of fossil fuel energy has increaseddramatically as has the size of the human population. Fossil fuels are a non-renewable resource,and are nearing the point of peak global production, after which the energy return on energyinvested (EROI) will become less favourable, with consequences for the economy as well as forenergy supply.
Genetic Modification (GM) (also termed Genetic Engineering) is a biotechnology techniquewhere genes from different organisms are mixed with the intention of producing a range ofbenefits such as increased shelf life, pest, disease and herbicide resistence. Scientists and campaigngroups are seeking to exempt seeds and farm animals from patent protection, because GM seedpatents are being bought by a small number of giant biotechnology companies, which hasprofound consequences for food systems.
Global food price spikes have occurred in recent years stimulating much debate as to underlyingcauses. Poor harvests due to unseasonable weather, displacement of food crops by bio-fuel crops,and trends towards meat-based diets have all been implicated. The World Development Movement(WDM) has linked the spikes to international speculation on food commodities by financialinstitutions and is calling for market regulation to safeguard the lives and livelihoods of some of theworld’s most vulnerable people.
Green Capital Momentum Group for Bristol is a network of professionals across business, publicsector, voluntary sector and environmental organisations working together to support Bristol’sprogress towards being a sustainable city.
Greengrocer shop selling fresh fruit and vegetables.
Greenhouse gas emissions include carbon dioxide (CO2), methane, water vapour and nitrousoxides. They are emitted when fossil fuel is burned and their presence in the earth’s atmosphereleads to more of the sun’s heat being retained in a way that is analogous to a greenhouse. Whilstthe greenhouse effect is a natural phenomenon, the amount of warming in recent decades isprojected to cause significant problems for humans.
Glossary
131
Hectare an area comprising 10,000 square metres. There are 2.7 acres in a hectare, and 4,047 squaremetres or 4,840 square yards in an acre.
Hydroponic a method of growing plants in mineral solutions in water, without soil.
IAASTD International Assessment of Agricultural Knowledge, Science and Technology forDevelopment. An international project aimed at making information accessible and available.
IGD Institute of Grocery Distribution, an industry association concerned with international foodand grocery retailing and supply chain.
Intensive animal husbandry see factory farming.
‘Just in time’ stock management and distribution is the means by which modern supermarketsoperate with only 3 days supply available at any point in time. Sophisticated informationtechnology means that each purchase triggers procurement in the supply chain, and factors suchas weather forecasts, sporting events etc (will it be ice-cream, beer or hot chocolate?) are alsofactored in.
Land grabbing is hitting the headlines as wealthy nations are buying millions of hectares overseasfor food production. Concerns are being raised in relation to social justice issues, and in relation todiversion of scarce water supplies and the impacts for indigenous populations.
Life cycle assessment takes into account all aspects of manufacture, distribution, use and disposalto estimate the lifetime resource use for a product. This provides a more complete picture of the fullcosts than just the energy used in running it.
Local economy locally owned businesses are more likely to keep employment and wealthcirculating in the local economy whereas chain businesses, especially multinationals are likely todivert wealth and jobs out of the local economy, often to another country. This loss of wealth canbe compounded by failure of some large companies to pay the appropriate amount of tax.
Meadow grassland that is cut, as opposed to being grazed (see pasture).
Multinational corporations are corporations or enterprises that manage production or deliverservices in more than one country. Some have budgets that exceed the gross domestic product ofwhole nations. They exert considerable power and influence over national and global affairs, to theextent that they have attracted criticism for lack of democratic accountability.
NFU founded in 1908 as the National Farmers Union, the NFU exists to champion British farming.
Obesity means excess body weight, caused by an imbalance between calorie intake and calorieoutput. Overeating and physical inactivity are the major contributors. The adverse effects for healthare significant, and the role of cultural factors in affecting eating and physical activity areincreasingly being recognised. The availability and marketing of processed food that is ‘hyper-palatable’ is contributing to development of addictive behavioural habits known as ‘conditionedovereating’. ‘Car-centric’ built environments have designed physical activity out of everyday life. Thehealth impacts include diabetes, high blood pressure (hypertension), heart disease, arthritis,mobility problems and depression. NHS statistics show that 24% of men and 25% of women inEngland are obese. If overweight is included as well as obesity, then the percentages are 66% formen and 57% for women. In children, 31% of boys are overweight or obese and 29% of girls. Theprevalence of obesity has risen very steeply in recent years, and is following the pattern being seenin the USA. The definitions of overweight and obesity are based on Body Mass Index, computedfrom height and weight measurements. For a calculator seehttp://www.nhs.uk/Tools/Pages/Healthyweightcalculator.aspx
Glossary
132

Organic certification involves a set of legally recognised standards for farming and growing thatensures maintenance of natural soil fertility, encourages natural predators to control pests, ensuresanimal welfare, limits the use of chemical inputs and prohibits use of genetically modified produce.Standards vary between different countries. There are a number of certification agencies, of whichthe Soil Association is amongst the best known in England.
Pasture grass or other vegetation used for grazing of animals.
Peak Oil the point at which maximum output of oil has been achieved from a well, field, or nation,after which the output will decline and the energy needed for extraction rises.
Pesticides any substance or mixture of substances intended for preventing or destroying pests.Organic certification sets limits on what can be used for pest control. Pesticides can be harmful topeople, wildlife, soil and watercourses. Modern pesticides are designed to be short lived withreduced long-term harmful impacts but older versions may be present for many decades and canaccumulate in natural systems.
Permaculture a word created by Australian ecologists Bill Mollison and David Holmgren, as acontraction of ‘permanent’ and ‘agriculture’. It describes a system of design for agriculture andhuman settlements that mimic the relationships found in natural ecology. The aim is to achievesustainable growing systems that are efficient and low maintenance.
Phosphates one of many resources thought to be reaching a downturn in supply in the near future.An inorganic chemical obtained by mining from rock, they are commonly used in fertilizers forcrops.
Procurement the process of obtaining goods and services, starting from initial planning of what isrequired through to the final purchase and payment.
Public Food Register a register held by the local authority Public Health Services Food Safetydivision, of all businesses that handle food, for the purposes of enabling inspections andmaintenance of food safety standards for the benefit of the public.
Rapid appraisal: A research approach using a team comprised of members drawn from a variety ofappropriate disciplines. Rapid appraisals take only a short time to complete, tend to be relativelycheap to carry out and make use of more 'informal' data collection procedures. The techniques relyprimarily on expert observation coupled with semi-structured interviewing of key stakeholders.Similar to a social anthropologist's case study approach but executed over a period of weeks, or atmost months, rather than extending over several years. To date mainly been used in the field ofrural development as a short cut method to be employed at the feasibility stage of projectplanning.
Resilience is the capacity to cope with and recover from adversity.
Resource depletion the exhaustion of natural resources, including non-renewable resources suchas oil, coal, phosphates, and also renewable resources such as fish, fertile soil, and water, whichcome under threat if the balance of use and replacement is upset.
Seasonal food eating seasonally is one component of sustainable food systems. It means thathighly perishable foods can be produced at the times of year that are most efficient, rather thanrequiring heated greenhouses, refrigerated storage, air freight etc.
Glossary
133

Seed saving for thousands of years farmers the world over have saved some of the harvest forseeds to plant the following year. This practise is in effect a form of biotechnology as the seeds aresaved from the strongest plants, which therefore best suit the local conditions. There are concernsthat traditional seed saving is under threat due to patenting, and aggressive marketing of GM (seegenetic modification) seeds by large biotech companies, together with legal action against farmerswho do not buy GM and are accused of growing wind-blown patented seeds on their land illegally.
Small holding a piece of land under 50 acres but larger than an allotment, used for food growingand animal husbandry.
Soil carbon sequestration organic matter in soil contains considerable amounts of carbon. Modernintensive farming reduces the carbon storage capacity of soil, whereas organic growing increases it,therefore helping to reduce greenhouse gases.
Social justice based on the principles of equality, solidarity and human rights.
Staple the most common or regularly eaten food items in a country or society, forming themainstay of the diet. Typically they are inexpensive, readily available and easily stored.
Stoke Park an area of some 350 acres of historic parkland to the north of the M32 in Bristol, in frontof The Dower House.
Sustainability is the capacity to endure.
Sustainable development has been defined as meeting the needs of the present withoutcompromising the ability of future generations to meet their own needs.
Tendering the process of pitching or offering in order to seek a contract for goods or services.
Tonne a thousand kilograms, or a metric tonne
Voscur is a Bristol based Council for Voluntary Service working to support voluntary andcommunity service in the City.
Glossary
134

Ack
nowledgem
ents
135

Acknowledgements:
Contributors:
Author: Joy Carey
Assistance with editing: Deborah Harrison, Angela Raffle
Design and layout: Juliet Dearbergh
Advisory group: Angela Raffle( Chair), Simone Osborn, Kristin Sponsler, Steve Marriott, StephenHewitt, Christine Storry, Kevin Morgan, Tim Appleton
Research team: Joy Carey, Katrin Hochberg, Lucy Wallis, Deborah Harrison, Alec Duthie
Agricultural information: Liz Bowles, English Food and Farming Partnership; Laura Christele Rigoand Dr Richard Baines, Royal Agricultural College, Cirencester.
Positive planning powers: Stephen Hewitt, Specialist Professional Planner, Healthy Living/HealthImprovement, Bristol City Council
Other contributors:Adrian Jenkins; Simon Melican; David Horlick; Stephen Sodek, Dr. Stephen Usmar, James Wakefield,Sean Spencer Wort, Dave Tuffery, Steve Clampin, Dorothy Greaves, Henry Dawson, Anne Ambrose,Steve Morris, Helen Huertas, Sharon Sexton, Matthew Roberts, Jackie Brown (Bristol City Council);Jane Stephenson, Hannah Johnson (Resource Futures); Val Harding, Jane Thompson, AnnetteCrump (South Gloucestershire Council); Jane Wildblood, Sara Grimes, Sue Green, Andy Keyford,Kaoru Jacques (Bath & NE Somerset Council); Marc Hollier (North Somerset Council); AlisonBelshaw (Eat Somerset); Bristol Food Network; Gill Shaw (Natural England); Mark Thurstain-Goodwin (Geofutures); Caitlyn Jones (Federation of city farms and community gardens); SimonBilling; Jodi Peacham (Forum for the Future); Annette Luker, Emily VanDeVenter, Matthew Leaver,John Twigger, Liz Fox, Rachel Cooke, Jackie Beavington, Judith Taylor, Margaret Keller, MandyShute, Mohammed Elsharif (NHS Bristol); Michael Bond, Lisa Jones, Phil Stocker, Astrid Toner, PeteMundy (Soil Association); Gina Provis, Steve Townsend, Jim Wilkie, Mike Amos; Susan Burton, LoveFood Festival (and other Farmers market organizers across the West of England); Farmers markettraders at Whiteladies Rd and Corn Street; Luke Hasell, Phil Haughton, Ben Raskin, Jacqui Reeves,Mark Kidner, Tim Down, Richard Laurence, Sue Walker, Mark Newman, Abdul Majothi, Leigh CourtFarm, Andy Down (businesses interviewed as case studies); Dr Melanie Felgate (Kent BusinessSchool); The cooperative supermarket; Richard Spalding, Hugh Barton (UWE); Bryony Tooley (CardiffUniversity); the many food businesses that took part in the snapshot surveys; the producers whotook part in the on-line producer survey; NFU Southwest; The Environment Agency; Pieminister,Jason Ingram/Soil Association, Jackson Drowley, Helen Carey (photographers).
This research report was commissioned and funded by NHS Bristol and Bristol City Council. The Green Capital Momentum Group identified the need for the research and helped to initiate the work.
Ackn
owled
gem
ents
136

If you would like this information in another language, Braille, audiotape, large print, easy English, BSL video or CD rom or plain textplease contact 0117 922 4983