Who Benefits from Capital Account Liberalization? … · Who Benefits from Capital Account...
35
Who Benefits from Capital Account Liberalization? Evidence from Firm-Level Credit Ratings Data Alessandro Prati, Martin Schindler, and Patricio Valenzuela WP/09/210
Transcript of Who Benefits from Capital Account Liberalization? … · Who Benefits from Capital Account...
Who Benefits from Capital Account Liberalization? Evidence from Firm-Level
Credit Ratings Data
Alessandro Prati, Martin Schindler, and Patricio Valenzuela
WP/09/210

© 2009 International Monetary Fund WP/09/210 IMF Working Paper Research Department
Who Benefits from Capital Account Liberalization? Evidence from Firm-Level Credit Ratings Data
Prepared by Alessandro Prati, Martin Schindler, and Patricio Valenzuela1
Authorized for distribution by Andrew Berg
September 2009
Abstract
This Working Paper should not be reported as representing the views of the IMF. The views expressed in this Working Paper are those of the author(s) and do not necessarily represent those of the IMF or IMF policy. Working Papers describe research in progress by the author(s) and are published to elicit comments and to further debate.
We provide new firm-level evidence on the effects of capital account liberalization. Based on corporate foreign-currency credit ratings data and a novel capital account restrictions index, we find that capital controls can substantially limit access to, and raise the cost of, foreign currency debt, especially for firms without foreign currency revenues. As an identification strategy, we exploit, via a difference-in-difference approach, within-country variation in firms’ access to foreign currency, measured by whether or not a firm belongs to the nontradables sector. Nontradables firms benefit substantially more from capital account liberalization than others, a finding that is robust to a broad range of alternative specifications.
JEL Classification Numbers: F3; F4; G24; G32
Keywords: Capital account liberalization; capital controls; credit access; credit ratings
Author’s E-Mail Address: [email protected]
1 For helpful comments and suggestions, we are grateful to Andy Berg, Oya Celasun, Enrica Detragiache, Campbell Harvey, Antonio Spilimbergo and participants at the fRDB-IMF-CEPR conference on Structural Reforms Without Prejudice in Milan, especially our discussant, Riccardo Rovelli. We also thank Dennis Quinn for access to his data set. Jair Rodriguez provided outstanding research assistance

2
Contents Page
I. Introduction ............................................................................................................................3
II. Related Literature..................................................................................................................5
III. Data ......................................................................................................................................6
IV. Empirical Analysis and Main Results................................................................................11 A. Baseline regressions................................................................................................11 B. Narrowing down the channels.................................................................................16
V. Robustness ..........................................................................................................................21 A. Alternative measures of nontradability ...................................................................21 B. Direct versus indirect effects of capital controls.....................................................23 C. Structural reforms and macroeconomic conditions.................................................24 D. Capital controls measures and other robustness checks..........................................28
VI. Conclusions........................................................................................................................30 References................................................................................................................................31 Tables Table 1. Bond Ratings and Spreads ...........................................................................................8 Table 2. Bond Ratings Scale....................................................................................................10 Table 3. Data Summary and Descriptive Statistics..................................................................12 Table 4. Capital Account Restrictions, Foreign Currency Access and Corporate Ratings......14 Table 5. Narrowing Down the Channels..................................................................................18 Table 6. Foreign Currency Access and Export Surrender Requirements ................................19 Table 7. Total Coefficients based on Column 1, Table 6 ........................................................20 Table 8. Alternative Measures of Nontradability ....................................................................22 Table 9. The Sovereign Ratings Channel ................................................................................25 Table 10. Alternative Structural Reforms................................................................................27 Table 11. Alternative Macroeconomic Control Variables.......................................................28 Table 12. Alternative Capital Account Measures ....................................................................29

3
I. INTRODUCTION
Over the past three decades, global financial markets have become increasingly integrated, in terms of outcome measures, such as the level of cross-border asset holdings, as well as in terms of the extent to which countries impose legal restrictions on capital account transactions. Yet, almost no country has completely eliminated all capital controls, and indeed, more recent data indicate a reversal of the previous trend towards freer capital markets, with several countries imposing new legal restrictions on capital account transactions or tightening existing ones (see Schindler, 2009). Thus, the use of capital account restrictions remains an important and actively used policy instrument for countries aiming to limit or control the extent to which their economies are integrated with world financial markets. Despite the importance of capital controls, there remains considerable uncertainty regarding their relative costs and benefits. Although a large literature exists on the questions of how effective controls are, and through which channels they may operate, robust answers to these questions remain largely elusive. Among the many possible reasons for the lack of stronger results, two factors are likely to be important: the use of aggregated data in many studies, and the lack of sufficiently refined de jure measures of capital account openness. Aggregate data may hide important heterogeneities in the extent to which different subsets of an economy are affected, making it difficult to detect significant average effects. Finding a significant link between capital controls and economic outcomes is made difficult also by the fact that some of the most widely used capital controls indicators are crude, binary indicators which ignore variations in the degree of capital account restrictiveness. In this paper, we address both shortcomings by studying a broad firm-level panel data set to explicitly address heterogeneities, and by using a new data set of capital controls which captures more subtle differences in capital control regimes across countries and time. The new capital controls index can also be disaggregated in novel ways, allowing for additional and innovative tests of our hypothesis. More specifically, we estimate the effects of capital account restrictions on firms’ access to credit in international capital markets. We study this channel using firm-level variation in long-term foreign currency corporate credit ratings, a measure that is closely related to the cost at which private corporations can access credit, as well as to the pool of international investors they can access.2 We find that while evidence on aggregate effects of capital account
2 As the literature review in the following section shows, we are not the first to bring firm-level data to bear on the subject of the effects of capital controls, but we are, to our knowledge, the first to document this specific channel.

4
liberalization is mixed,3 the effects for some firms—in our analysis, those in the nontradables sectors—are large, positive and robust. To identify the effects of capital account liberalization, we employ a difference-in-difference methodology similar to that in Rajan and Zingales (1998) by exploiting differences across firms in their access to foreign currency, and how these different sets of firms are affected by the level of capital account restrictiveness.4 We argue that to issue foreign currency debt, debtors must expect the issuing firms to have reasonably reliable future access to foreign currency so as to be able to eventually repay the debt. Given that credit ratings aim to measure a firm’s credit worthiness for foreign currency debt, the ease with which a firm can obtain foreign currency should be reflected in the firm’s ratings assessment. As a proxy for such foreign currency access, we distinguish between whether a firm belongs to the tradables or the nontradables sector, on the grounds that firms in tradables have relatively easier access to foreign currency through their export earnings. Our key finding is that capital controls have a large negative effect on the credit ratings of firms in the nontradables sectors, while they are more neutral for firms in tradables sectors. Because tradables firms can generate foreign currency through exporting even when the capital account is restricted, lifting such restrictions has little impact on these firms’ ability to issue foreign currency debt. By contrast, a restricted capital account does constrain firms in the nontradables sector in terms of issuing foreign currency debt. It is therefore intuitive that these firms derive more substantial benefits from lifting capital account restrictions since such liberalization effectively mitigates their credit constraints. While capital account liberalization therefore appears beneficial for an individual firm, the credit channel of capital account liberalization also suggests potential aggregate risks: For example, exporters with foreign currency debt are naturally hedged against exchange rate fluctuations to the extent that both their earnings and their liabilities are denominated in foreign currency. By contrast, an increase in foreign currency debt of non-exporters increases these firms’ exposure to exchange rate risk, and this currency mismatch may carry risks for aggregate financial stability. Although we cannot provide an assessment of the aggregate net benefits in this paper, existing
3 Although average effects are strong in our baseline regressions, their significance (and sign) depends on the precise specification of some control variables, as we show and discuss.
4 Rajan and Zingales (1998) construct a measure of a firm’s technological dependence on external finance and show that firms more in need of external finance grow faster in economies with more-developed financial markets.

5
research suggests that the increase in foreign currency debt may, in fact, be limited (see Ağca and others, 2008). The remainder of the paper proceeds as follows. Section II provides a brief review of the related literature, Section III presents our data, Section IV discusses the empirical methodology and results, Section V summarizes robustness analyses, and Section VI concludes.
II. RELATED LITERATURE
A broad literature exists on the various aspects of financial globalization and, in particular, the merits of attempts by policy makers to insulate themselves from global financial markets. We review here only a subset of related papers that help provide context to our paper. Earlier work in this literature has focused on aggregate outcomes and point to only weak evidence of a positive association between a more open capital account and economic outcomes. In surveys of the literature, Kose and others (2009) and Edison and others (2004) document these inconclusive results for economic growth as well as in regards to the effects of capital account liberalization on macroeconomic volatility. These results are surprising if one takes the view that countries who open their capital account should benefit from lower costs of capital and thus increased investment and higher growth (assuming that the interest rate in international financial markets is lower than the domestic rate prior to opening the capital account); see, for example, Henry (2003, 2007). More recent work has started to reconcile the apparent disconnect between theory and empirics. Henry (2007) points out that while much of the empirical literature effectively tests for permanent growth effects, theory predicts only temporary growth effects on a country’s transition to a new steady state. He suggests employing an event-study approach to focus more directly on these temporary growth effects. Focusing on equity markets, Henry (2000a, 2000b, 2007) and, using a different methodology, Bekaert and Harvey (2000), find that stock market liberalizations indeed tend to raise equity prices, lower the cost of capital and increase investment and growth, at least in the medium term, in line with theory. Others, including dell’Ariccia and others (2008) have noted that non-linearities in the effects of capital account liberalization may dilute average effects; for example, proper institutions or sufficiently developed financial markets may be preconditions for countries to fully reap the benefits of increased financial integration. Other research suggests that the absence of more significant growth effects may be in part due to measurement issues. For example, Bekaert and others (2005) focus on arguably more precisely measured equity market liberalization events, while Quinn (1997) uses a more finely measured

6
capital account restrictions index; both find significant and strong growth effects arising from capital account liberalizations. By contrast, a different strand of the literature has moved away from aggregate analysis by taking advantage of microeconomic data and gaining insights from within-country variation, typically at the firm-level. Our paper is most closely related to this “microeconomic” literature. Unlike the broader “aggregate” literature, studies in this literature typically find substantial costs of capital controls at the microeconomic level and little evidence of benefits from imposing controls (e.g., Forbes, 2007), although Chari and Henry (2004), also using firm-level data, find evidence that liberalization brings risk-sharing benefits. Braun and Raddatz (2007) follow a similar approach to ours by exploiting differences between tradables and nontradables sectors, although their main interest is in the effects of domestic financial development on economic growth. They find that financial development is virtually irrelevant for tradable sectors, especially when the country is open to trade and capital flows, consistent with the notion that firms in tradable sectors, through their regular business activity, depend less on domestic financing.5 Our argument is similar, in that we find that firms in tradable sectors depend less on capital account liberalization to the extent that their business activities allow them to access financing even when regular capital account transactions are restricted.
III. DATA
The data set we study builds on that used in Borensztein and others (2007) and covers the period 1995–2004. It contains accounting and market data for an unbalanced panel of 492 firms in 11 industrial and 15 emerging economies.6 As a broad measure of firms’ cost of accessing foreign funds, we use firms’ private foreign currency credit ratings issued by Standard and Poor’s as the dependent variable. We view credit ratings as a broad measure of a firm’s cost of credit, and we focus on foreign currency ratings as most of emerging markets’ international bonds issuances are in foreign currency (see Eichengreen and others 2001). As we discuss in more detail below, credit ratings can affect costs directly, as they are a key determinant of firms’ interest rate spreads, but also indirectly, by restricting the potential investor base open to a firm.
5 Using a calibration approach, Mendozaand others (2008) examine how financial integration and differences in domestic financial development may interact to result in global financial imbalances.
6 The countries included in the sample are Argentina, Australia, Belgium, Brazil, Canada, Chile, China, Czech Republic, Denmark, Finland, Hungary, India, Indonesia, Ireland, Israel, Italy, Japan, Malaysia, Mexico, New Zealand, Peru, Philippines, Portugal, Spain, Sweden, and Thailand.

7
As such, firms’ interest rate spreads may arguably be a more direct measure of firms’ cost of credit, and thus their ability to raise capital. We prefer ratings for a number of reasons. First and foremost, focusing on ratings allows us to assemble a broad and consistent panel data set covering both advanced and emerging economies, while data coverage for spreads is more limited. Second, capital account liberalizations are likely to have more permanent, or structural, effects on credit market conditions; credit ratings are therefore a preferable measure of credit risk as they are intended to measure the permanent, long-term and structural component of private risk, precisely the component that we seek to investigate in this study (see, e.g., Löffler, 2004, and Standard and Poor’s, 2001).7 Spreads measures by contrast are more likely to reflect short-term factors that might obscure the long-lasting effects of reforms.8 Lastly, ratings are, in fact, remarkably good predictors of spreads, as Cantor and Packer (1996) and Ederington and others (1987) have demonstrated, and also reflected in the clear negative correlation between firms’ ratings and spreads shown in Table 1.9 By using foreign currency long-term bond issuers’ ratings, we focus on the structural component of debt issued in international markets, both at the firm-level and for the sovereign. Standard and Poor’s (2001) defines a foreign currency credit rating as “A current opinion of an obligor’s overall capacity to meet its foreign-currency-denominated financial obligations. It may take the form of either an issuer or an issue credit rating. As in the case of local currency credit ratings, a foreign currency credit opinion on Standard and Poor’s global scale is based on the obligor’s individual credit characteristics, including the influence of country or economic risk factors. However, unlike local currency ratings, a foreign currency credit rating includes transfer and other risks related to sovereign actions that may directly affect access to the foreign exchange needed for timely servicing of the rated obligation. Transfer and other direct sovereign risks addressed in such ratings include the likelihood of foreign-exchange control and the
7 Ratings are not perfect measures, but as Altman and Rijken (2004) note, concerns over their quality are typically in regards to the timeliness of ratings adjustments, less so regarding the accuracy of their ratings. Given our focus on annual frequencies, we are less concerned about the timing issue, which may be more relevant at higher frequencies. 8 The high-frequency variability of spreads could be addressed in part by employing averaging techniques, such as Hodrick-Prescott filtering. However, even at lower frequencies ratings may diverge from spreads. For example, during much of this paper’s sample period, emerging market spreads exhibited a secular downward trend over and above similar changes in ratings; thus, even filtered spreads may not reflect well the underlying fundamentals that we are concerned with in this paper. 9 Ratings also matter in a number of other contexts. Some regulations relating to financial institutions’ and other intermediaries’ investments in bonds are directly tied to credit ratings (Kisgen, 2006); lower bond ratings also impose direct costs on a firm as it may restrict access to other financial markets, such us commercial paper.
8
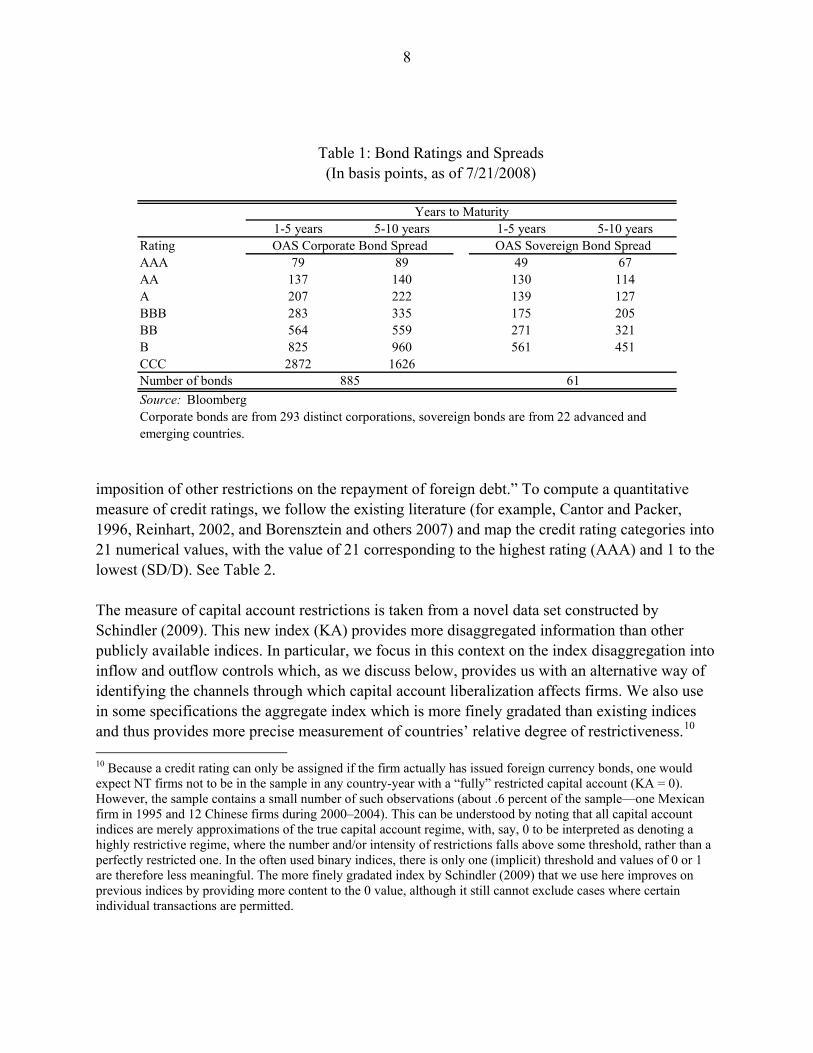
Table 1: Bond Ratings and Spreads (In basis points, as of 7/21/2008)
Years to Maturity1-5 years 5-10 years 1-5 years 5-10 years
Rating OAS Corporate Bond Spread OAS Sovereign Bond SpreadAAA 79 89 49 67AA 137 140 130 114A 207 222 139 127BBB 283 335 175 205BB 564 559 271 321B 825 960 561 451CCC 2872 1626Number of bonds 885 61
Source: BloombergCorporate bonds are from 293 distinct corporations, sovereign bonds are from 22 advanced and emerging countries.
imposition of other restrictions on the repayment of foreign debt.” To compute a quantitative measure of credit ratings, we follow the existing literature (for example, Cantor and Packer, 1996, Reinhart, 2002, and Borensztein and others 2007) and map the credit rating categories into 21 numerical values, with the value of 21 corresponding to the highest rating (AAA) and 1 to the lowest (SD/D). See Table 2. The measure of capital account restrictions is taken from a novel data set constructed by Schindler (2009). This new index (KA) provides more disaggregated information than other publicly available indices. In particular, we focus in this context on the index disaggregation into inflow and outflow controls which, as we discuss below, provides us with an alternative way of identifying the channels through which capital account liberalization affects firms. We also use in some specifications the aggregate index which is more finely gradated than existing indices and thus provides more precise measurement of countries’ relative degree of restrictiveness.10 10 Because a credit rating can only be assigned if the firm actually has issued foreign currency bonds, one would expect NT firms not to be in the sample in any country-year with a “fully” restricted capital account (KA = 0). However, the sample contains a small number of such observations (about .6 percent of the sample—one Mexican firm in 1995 and 12 Chinese firms during 2000–2004). This can be understood by noting that all capital account indices are merely approximations of the true capital account regime, with, say, 0 to be interpreted as denoting a highly restrictive regime, where the number and/or intensity of restrictions falls above some threshold, rather than a perfectly restricted one. In the often used binary indices, there is only one (implicit) threshold and values of 0 or 1 are therefore less meaningful. The more finely gradated index by Schindler (2009) that we use here improves on previous indices by providing more content to the 0 value, although it still cannot exclude cases where certain individual transactions are permitted.
9
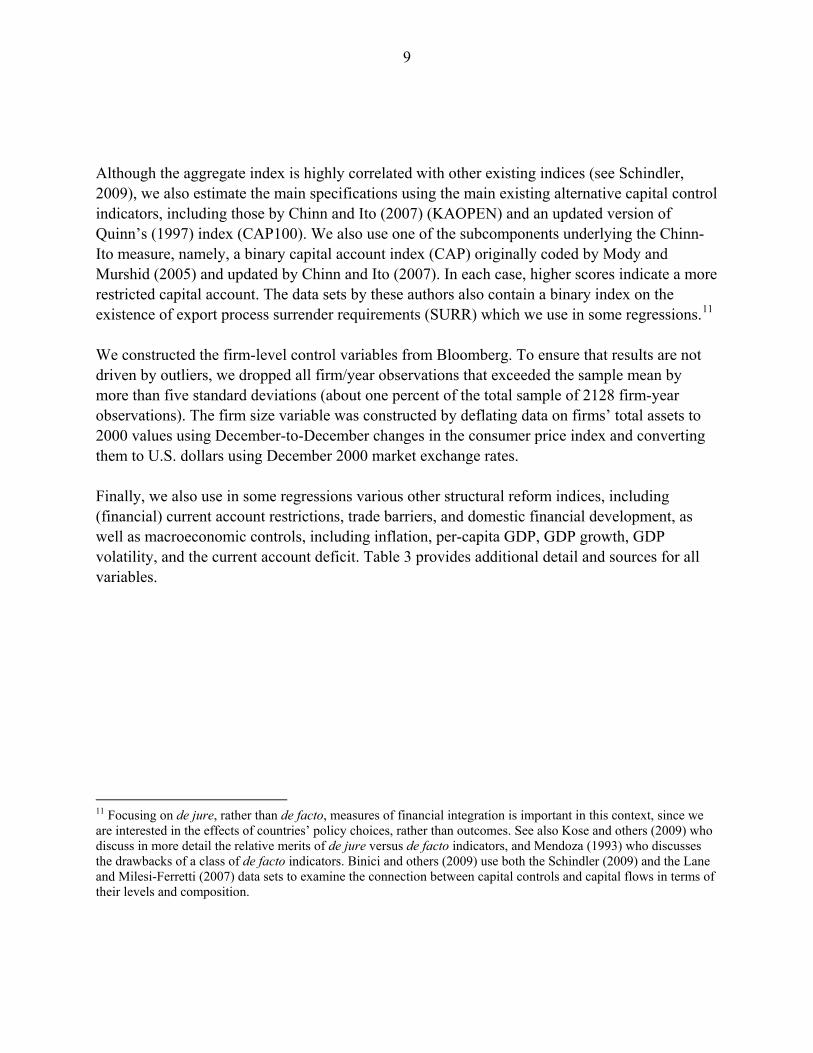
Although the aggregate index is highly correlated with other existing indices (see Schindler, 2009), we also estimate the main specifications using the main existing alternative capital control indicators, including those by Chinn and Ito (2007) (KAOPEN) and an updated version of Quinn’s (1997) index (CAP100). We also use one of the subcomponents underlying the Chinn-Ito measure, namely, a binary capital account index (CAP) originally coded by Mody and Murshid (2005) and updated by Chinn and Ito (2007). In each case, higher scores indicate a more restricted capital account. The data sets by these authors also contain a binary index on the existence of export process surrender requirements (SURR) which we use in some regressions.11 We constructed the firm-level control variables from Bloomberg. To ensure that results are not driven by outliers, we dropped all firm/year observations that exceeded the sample mean by more than five standard deviations (about one percent of the total sample of 2128 firm-year observations). The firm size variable was constructed by deflating data on firms’ total assets to 2000 values using December-to-December changes in the consumer price index and converting them to U.S. dollars using December 2000 market exchange rates. Finally, we also use in some regressions various other structural reform indices, including (financial) current account restrictions, trade barriers, and domestic financial development, as well as macroeconomic controls, including inflation, per-capita GDP, GDP growth, GDP volatility, and the current account deficit. Table 3 provides additional detail and sources for all variables.
11 Focusing on de jure, rather than de facto, measures of financial integration is important in this context, since we are interested in the effects of countries’ policy choices, rather than outcomes. See also Kose and others (2009) who discuss in more detail the relative merits of de jure versus de facto indicators, and Mendoza (1993) who discusses the drawbacks of a class of de facto indicators. Binici and others (2009) use both the Schindler (2009) and the Lane and Milesi-Ferretti (2007) data sets to examine the connection between capital controls and capital flows in terms of their levels and composition.

10
Table 2: Bond Ratings Scale
Interpretation S&P Rating Assigned valueINVESTMENT-GRADE RATINGS
Highest quality AAA 21
High quality AA+ 20AA 19AA- 18
Strong payment capacity A+ 17A 16A- 15
Adequate payment capacity BBB+ 14BBB 13BBB- 12
NONINVESTMENT-GRADE RATINGS
Likely to fulfill obligations, ongoing uncertainty BB+ 11
BB 10BB- 9
High-risk obligation B+ 8B 7B- 6
Currently vulnerable nonpayment obligationCCC+ 5CCC 4CCC- 3
Highly vulnerable to nonpayment CC/C 2
Default SD/D 1
Source: Standard and Poor’s and authors' calculations

11
IV. EMPIRICAL ANALYSIS AND MAIN RESULTS
A. Baseline regressions
We aim to measure the effects of capital account liberalization on long-term foreign-currency private credit ratings, controlling for other factors that might affect private ratings independently. Thus, as a baseline specification, we estimate the equation
β
β β
χ δ ε+ + +
= + ⋅
+ ⋅ + ⋅
+ ⋅ + ⋅ +
1...
1... 1... 10
Private Credit Rating Constant Country Dummies
Sector Dummies Year Dummies
' Capital Account Liberalization
ict m
m n n n
ict ct ictX
(1)
where the dependent variable is firm i’s private credit rating in country c at time t and Xict is a vector of firm-level control variables. For the latter, we follow the literature on corporate default and include variables that capture a firm’s profitability (the ratios of earnings before interest and taxes (EBIT) to assets and of retained earnings to assets), leverage (ratio of equity to capital), liquidity (ratio of working capital to assets), interest coverage (ratio of EBIT to interest expense) and size (total assets). In addition to these firm-level characteristics, we also include country, industry and year fixed effects to control for all factors that are time-invariant but specific to a country or an industry, as well as for any time-specific effects that have affected all countries, for example, world business cycles or other events, such us the Asian and Russian crises, that have affected world financial markets. Furthermore, as discussed below, we additionally include in most regressions a country-specific sovereign ratings measure, which can vary over time, and which captures a broad range of country-year risk factors correlated with sovereign risk that may affect firms’ credit ratings. Thus, the control variables we employ constitute a powerful set of controls. We estimate equation (1) by ordinary least squares with clustering of the errors by country and year. Table 4 reports in the first column the results from estimating equation (1). All variables have strong explanatory power in the expected directions (except for the negative coefficient of working capital/assets). Notably, capital account openness has a strong positive effect on firms’ credit ratings. This seems intuitive—in a country with a (relatively) open capital account, firms have more opportunities both of raising capital and of diversifying their assets. This would make firms more robust to shocks and less likely to default, thus resulting in a higher credit rating.
12
Table 3: Data Summary and Descriptive Statistics
Variables Obs. Mean Std. Dev. Min. Max. Description Source
Credit RatingsSovereign Rating 2051 17.66 4.15 1 21 Numerical ratings scale (see Table 2) Standard and Poor'sCorporate Rating 2051 13.46 3.47 1 21 Numerical ratings scale (see Table 2) Standard and Poor's
Firm-Level Performance IndicatorEBIT/Assets 2051 7.76 5.08 0.02 35.70 Percent BloombergRetained earnings/Assets 2051 18.12 17.24 -70.12 81.45 Percent BloombergWorking Capital/Assets 2051 6.73 14.91 -63.73 57.25 Percent BloombergEquity/Capital 2051 55.66 20.99 -37.67 100.00 Percent BloombergEBIT/Interest expense 2051 6.05 1.34 -0.37 12.80 Percent (log) BloombergSize Assets 2051 3.66 1.38 -3.84 8.11 Millions of 2000 US$, deflated by the CPI (log) BloombergNT 2051 0.46 0.50 0 1 Dummy=1 if non-tradable, 0 otherwise Bloomberg, own construction
Structural ReformsDF 2051 0.48 0.30 0 1 Normalized index (1 = least regulated) Abiad et al. (2008)Banking 2051 0.86 0.15 0.27 1 Normalized index (1 = least regulated) Abiad et al. (2008)Securities 2051 0.95 0.13 0.33 1 Normalized index (1 = least regulated) Abiad et al. (2008)Trade 2051 0.67 0.26 0 1 Normalized index (1 = least regulated) IMF (2008)Current Account 2018 0.60 0.29 0 1 Normalized index (1 = least regulated) Quinn (1997), IMF (2008)
Macroeconomic VariablesInflation 2051 3.02 4.68 -11.00 58.39 Annual CPI rate, percent WDICurrent account 2051 0.17 3.61 -10.41 15.92 Current account surplus, percent of GDP WDIGDP growth 2051 2.86 3.89 -98.40 11.28 Annual real GDP growth, percent WDIGDP volatility 2051 6.54 8.28 0.65 47.47 Variance of previous 10 year GDP growth WDIPer-capita GDP 2051 9.62 0.96 5.96 10.55 Millions of US$ of 2000 (log) WDI
Financial Integration MeasuresKA 2051 0.79 0.26 0 1 Normalized index (1 = least regulated) Schindler (2009)KA_IN 2051 0.78 0.27 0 1 Normalized index (1 = least regulated) Schindler (2009)KA_OUT 2051 0.81 0.30 0 1 Normalized index (1 = least regulated) Schindler (2009)Kaopen 2051 1.86 1.14 -1.80 2.54 Index (higher = less restricted) Chinn-Ito (2007)CAP100 2051 55.95 28.72 0 100 Normalized index (100 = least regulated) Quinn (1997), IMF (2008)CAP 2051 0.70 0.46 0 1 Dummy (0 = capital account is restricted) Chinn-Ito (2007), Mody-Murshid (2005)SURR 2051 0.10 0.30 0 1 Dummy=1 if surrender requirement in place Chinn-Ito (2007), Mody-Murshid (2005)Intlcapital 2051 1.67 1.14 0 3 Index (higher = less restricted) Abiad et al. (2008)

13
It is possible, however, that the capital account variable actually proxies overall macro conditions, to the extent that capital account openness is correlated with other macroeconomic factors, for example, because it often coincides with other types of structural reforms. We examine the issue of other reforms explicitly below in Section 4, but for now, we add to our baseline regression a measure of sovereign ratings. There are several reasons for doing this. First, sovereign ratings are an important determinant of firm ratings, as Standard and Poor’s notes itself12 and consistent with existing research (Borensztein and others 2007). And second, both overall macro conditions and structural reforms are good predictors of sovereign ratings (see IMF, 2008),13 suggesting that sovereign ratings are a convenient proxy variable to control for these other determinants of credit ratings. Thus, given that sovereign ratings change in response to sufficiently large changes in a country’s macroeconomic environment, their inclusion, in addition to country, year and industry fixed effects, helps substantially reduce any omitted variable bias. To focus more directly on capital account liberalization, we control only for the effect of sovereign ratings on corporate ratings that is unrelated to capital account liberalization. For this purpose, we follow Eichengreen and Mody (2000) by first regressing sovereign ratings on the capital account variable and then using the residual from that equation in our main equation. The resulting sovereign ratings residual still contains all of the macroeconomic information other than capital controls that affects sovereign ratings assessments and thus can be viewed as a parsimonious control for macroeconomic characteristics not related to capital account openness.14 While this is largely a presentational choice in regards to the key findings of this paper, we discuss this issue, and subtleties associated with it, in more detail in the robustness section below.
12 According to Standard and Poor’s (2001), “Sovereign credit risk is always a key consideration in the assessment of the credit risk of […] corporates. Sovereign risk comes into play because the unique, wide-ranging powers and resources of a national government affect the financial and operating environments of entities under its jurisdiction.”
13 Standard and Poor’s (2001) divides its analytical framework for sovereign credit ratings into nine categories: political risk, income and economic structure, economic growth prospects, fiscal flexibility, general government debt burden, offshore and contingent liabilities, monetary flexibility, external liquidity and external debt burden. Consistent with this, Cantor and Packer (1996) find that upwards of 90% of the variance in sovereign ratings can be explained by macro variables such as per-capita GDP, GDP growth, GDP growth volatility, inflation and the current account balance. Other related empirical studies include Carling and others (2007), Nickell and others (2000), and Ludvigson and Ng (2005).
14 See Cantor and Packer (1996) for a standard reference on the determinants of sovereign ratings and, consistent with their findings, the more recent work in IMF (2008).

14
Table 4: Capital Account Restrictions, Foreign Currency Access and Corporate Ratings
(1) (2) (3)
EBIT/Assets 0.046*** 0.043*** 0.031**
(0.013) (0.013) (0.013)
EBIT/ Interest Expense 0.326*** 0.367*** 0.387***
(0.075) (0.072) (0.077)
Retained Earnings/Assets 0.030*** 0.029*** 0.029***
(0.005) (0.005) (0.004)
Working Capital/Assets -0.021*** -0.025*** -0.025***
(0.006) (0.005) (0.005)
Equity/Capital 0.024*** 0.023*** 0.025***
(0.006) (0.005) (0.005)
Size 0.822*** 0.769*** 0.771***
(0.090) (0.082) (0.081)
Sovereign Credit Rating Residual 0.503*** 0.499***
(0.045) (0.044)
KA 2.093*** 2.743*** 1.162***
(0.617) (0.323) (0.441)
KA x NT 2.485***
(0.431)
Observations 2051 2051 2051
R-squared 0.694 0.716 0.722
Robust standard errors in parentheses
* significant at 10%; ** significant at 5%; *** significant at 1%
The results from the revised baseline, reported in column 2 of Table 4, are virtually the same, except for the capital account coefficient which becomes even stronger. The finding of a strong direct effect of capital account openness on corporate credit ratings is, in itself, an interesting finding—other authors have found capital account liberalization to affect investment and growth (see, for example, Henry, 2000 and 2003), but our finding provides evidence on a channel through which such effects may occur. Namely, capital account liberalization increases average corporate credit ratings, and higher credit ratings, in turn, improve access to credit by allowing firms to borrow at a lower cost as higher ratings are associated with lower interest rate spreads (see Table 1). This may lead to higher investment and economic growth. Also, as Kisgen (2006) notes, regulations on bonds investment restrict the extent to which some investors, such as banks or pension funds, are allowed to invest in a

15
firm’s bonds with a given ratings level; thus, in addition to lowering the cost of such capital, ratings also matter for the size of a given firm’s pool of potential investors. These results, however, are silent on how precisely firms’ ratings are affected by capital account liberalization. Establishing a plausible mechanism for these effects is important for being able to distinguish the observed effects from other explanations. For example, the results at this point leave open the possibility that capital account liberalization may simply proxy other concurrent events, such as simultaneous reform in other sectors. If so, the results may simply establish that better overall macro management improves the economy, including corporates’ average credit worthiness. In the following, we address these issues by refining our analysis. In particular, we provide evidence that capital account liberalization affects firms’ credit access in ways that are specific to the restrictiveness of capital account regulations, thus establishing a novel and distinct channel for the effects of capital account liberalization. Specifically, we propose a channel that emphasizes the fact that credit ratings reflect firms’ foreign currency risk. Namely, firms issuing foreign currency debt require access to foreign currency for servicing that debt. Such access will typically be more difficult in countries that impose restrictions on capital account transactions. However, capital controls will be less restrictive for firms that can obtain foreign currency through channels not affected by capital account restrictions—by implication, then, these firms will derive smaller benefits from capital account liberalization than others. For example, firms in the export sector can obtain foreign currency through their regular export activities and therefore do not need to rely on domestic foreign exchange markets; lifting capital account restrictions should therefore benefit relatively more the non-exporting firms. We test our hypothesis that capital account restrictions affect businesses through a foreign currency access channel in column 3 of Table 4. We do this by interacting the capital account openness variable with a binary variable indicating whether a firm is in the nontradables (NT = 1) or the tradables sector (NT = 0). The direct effect of capital account openness is smaller, but still positive and highly significant. By comparison, the coefficient on the KAxNT interaction is more than twice as large and also highly significant. To calculate the total effects, we obtain that a unit increase in capital account openness raises the average credit rating of firms in the tradables sector by 1.162 notches, while it raises those of firms in the NT sector by 3.647 (the sum of 1.162 and 2.485), more than three times the effect for tradables firms.15
15 While the binary TR/NT classification is an imperfect measure, we believe it is preferable over alternative measures for a number of reasons. We elaborate on these in the robustness section and, importantly, show that using actual export shares leaves the main results intact.

16
We interpret this finding as strong evidence in support of our hypothesis. That is, the effects of capital account liberalization are uneven across firms in an economy, in line with firms’ relative access to foreign currency. While removing capital account restrictions, on average, yields benefits for all firms in terms of improved credit ratings, it has a substantially larger effect on firms with previously more restricted access to foreign currency. Thus, while capital account liberalization does not benefit all actors in an economy, it can have substantial benefits for some groups.16 The finding that not all firms benefit may also help understand why the existing literature on the growth effects of capital account liberalization has not found the strong effects some have expected: our results show that existing restrictions are not equally binding for all firms, but for those firms for which they are, lifting these restrictions can have substantial benefits—aggregate analyses that, by definition, focus on averages, will therefore not be able to pick up these differences across firms and likely find more limited overall effects. Two additional comments are in order regarding these results. First, the results may be driven by different initial conditions in NT and tradables firms. For example, if the latter exhibit systematically higher ratings than the former independent of the capital account regime, then our regressions may not be able to detect a strong increase in tradables firms’ ratings following capital account liberalization, simply because they have less room for improvement. We can rule out this possibility: the sample properties are almost identical in both sets of firms, and indeed ratings are slightly higher in NT firms with a mean of 13.4, compared to 13.2 in tradables. Second, while higher credit ratings can both reduce the cost of credit and provide access to a broader investment pool, there may be additional “quantity” effects associated with a more liberal capital account regime unrelated to changes in ratings, simply because a freer capital account may provide firms at any given rating with an increased pool of funds. Presumably, this additional quantity effect benefits equally NT and non-NT firms, but in any case, the interpretation we give to our results in this paper focuses only on improved credit access that arises because of a change in ratings.
B. Narrowing down the channels
We further explore the differential effects of capital account openness in column 2 of Table 5, where we break down the capital account variable into two subcomponents, inflow
16 To put the results into perspective, a corporate ratings increase by 3 to 4 notches corresponds to a change from BBB to A/A+. The descriptive statistics in Table 1 suggest that such a ratings change is associated with a corresponding interest rate spread reduction on the order of 100 basis points,

17
controls and outflow controls. The ability to do so in a panel data set is one of the key novel features of the capital control measures in Schindler (2009).17 When including the subindices separately in the regression, including their interactions with the NT dummy, the direct effect of capital controls remains highly significant on the inflows side, but disappears on the outflow side. Conversely, no statistically significant difference emerges for firms in the NT sector for inflows, while outflow controls appear to only affect firms in the NT sector. We interpret this result as providing additional support for our hypothesis. In particular, an important factor in rating agencies’ assessments is whether companies have a steady flow of foreign exchange that allows them to service foreign exchange bonds. Thus, the extent to which firms are sheltered against exchange rate fluctuations will matter. For example, in the event of a currency devaluation, companies in the tradables sector still have access to foreign currency through their export proceeds while NT companies would obtain less foreign exchange for any given amount of revenues in domestic currency. Liberalizing capital outflows would make it easier for NT firms to convert domestic currency into foreign currency, and more generally, being able to invest abroad would enable NT firms to hedge against foreign exchange rate risk as it would allow them to accumulate foreign assets that pay a steady stream of foreign exchange independent of exchange rate fluctuations, and which they can tap into in the event of a devaluation. Hence, liberalizing outflows should matter more for NT firms, exactly as we find in column 2 of Table 5.18 By contrast, liberalizing capital inflows will improve credit access for all firms, independent of their export status, and it is not clear why one should benefit more than the other. The positive coefficient on inflows but not on the differential NT interaction in the second column of Table 5 is consistent with this view. In sum, the results suggest that NT firms benefit from both inflows (better credit access) and outflows (foreign exchange access) while tradables companies benefit predominantly from
17 To construct these subindices, we broadly follow the approach taken in Schindler (2009) by calculating the unweighted average over all inflow (outflow) related transactions of all asset categories. We exclude the bond category since data on bond restrictions do not exist prior to 1997. This avoids the need to splice the data series in 1997 but does not affect the results.
18 By contrast, an exchange rate appreciation would benefit NT firms in terms of foreign currency access. However, what is likely to matter for ratings assessment is the downward risk, that is, the probability of not being able to service debt. Upward risk in foreign currency receipt is less likely to matter for lenders. What matters for the reasoning in the text, however, is the relative importance of export demand risk for TR firms (following a currency appreciation) and the foreign exchange risk for NT firms (following a currency depreciation). The signs and statistical significance of the results suggest that the latter is economically more important than the former.
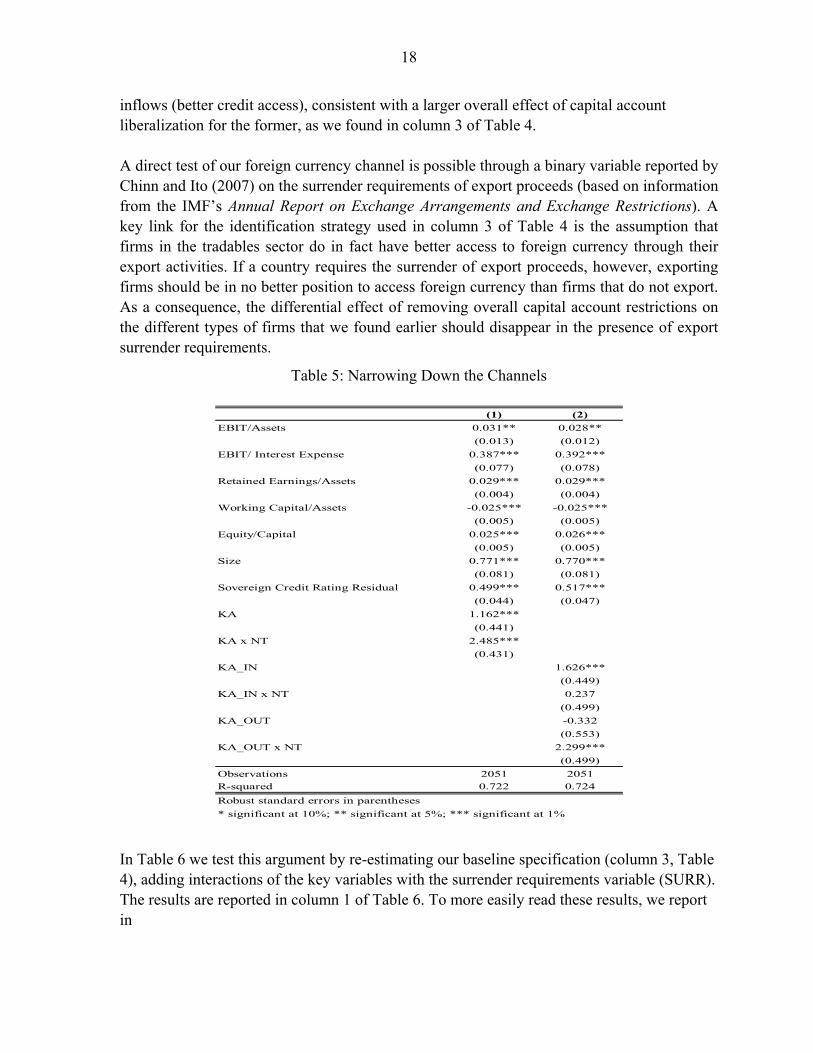
18
inflows (better credit access), consistent with a larger overall effect of capital account liberalization for the former, as we found in column 3 of Table 4. A direct test of our foreign currency channel is possible through a binary variable reported by Chinn and Ito (2007) on the surrender requirements of export proceeds (based on information from the IMF’s Annual Report on Exchange Arrangements and Exchange Restrictions). A key link for the identification strategy used in column 3 of Table 4 is the assumption that firms in the tradables sector do in fact have better access to foreign currency through their export activities. If a country requires the surrender of export proceeds, however, exporting firms should be in no better position to access foreign currency than firms that do not export. As a consequence, the differential effect of removing overall capital account restrictions on the different types of firms that we found earlier should disappear in the presence of export surrender requirements.
Table 5: Narrowing Down the Channels
(1) (2)
EBIT/Assets 0.031** 0.028**
(0.013) (0.012)
EBIT/ Interest Expense 0.387*** 0.392***
(0.077) (0.078)
Retained Earnings/Assets 0.029*** 0.029***
(0.004) (0.004)
Working Capital/Assets -0.025*** -0.025***
(0.005) (0.005)
Equity/Capital 0.025*** 0.026***
(0.005) (0.005)
Size 0.771*** 0.770***
(0.081) (0.081)
Sovereign Credit Rating Residual 0.499*** 0.517***
(0.044) (0.047)
KA 1.162***
(0.441)
KA x NT 2.485***
(0.431)
KA_IN 1.626***
(0.449)
KA_IN x NT 0.237
(0.499)
KA_OUT -0.332
(0.553)
KA_OUT x NT 2.299***
(0.499)
Observations 2051 2051
R-squared 0.722 0.724
Robust standard errors in parentheses
* significant at 10%; ** significant at 5%; *** significant at 1%
In Table 6 we test this argument by re-estimating our baseline specification (column 3, Table 4), adding interactions of the key variables with the surrender requirements variable (SURR). The results are reported in column 1 of Table 6. To more easily read these results, we report in

19
Table 7 the total coefficients for each subgroup of interest based on the results from column 1 in Table 6. When no surrender requirements are in place (SURR = 0), we replicate the results from column 3 in Table 4, with the effect of capital account openness statistically larger for firms in the NT sector than others.
Any statistically significant difference between the coefficients disappears, however, when firms are required to surrender their export proceeds (SURR = 1). That is, when export firms are required to surrender their foreign exchange receipts, capital account restrictions matter for them as much as for NT firms. Thus, lifting capital account restrictions results in statistically indistinguishable benefits for both groups of firms. Notably, the differential effect depending on whether surrender requirements are in place derives entirely from tradables firms—as Table 6 shows, the total coefficient for NT firms is not significantly different whether SURR is equal to 1 or to 0. Again, this is according to our hypothesis that NT firms have less access to foreign currency in the first place, hence, whether or not surrender requirements are in place matters little for them.
Table 6: Foreign Currency Access and Export Surrender Requirements
(1) (2) (3) (4) (5)
A 1.284*** 1.144** 0.741 0.645 3.317**
(0.457) (0.539) (0.590) (0.646) (1.573)
A x SURR 2.061** 2.467*** 3.832***
(0.881) (0.942) (1.256)
A x NT 2.231*** 2.232*** 2.868*** 2.925*** -0.357
(0.449) (0.448) (0.491) (0.505) (2.345)
x SURR x NT -1.876 -1.847 -4.079*
(1.524) (1.528) (2.258)
URR -0.277 -1.069*
(0.317) (0.614)
SURR x NT 1.224
(0.798)
bservations 2051 2051 2051 1840 211
squared 0.723 0.723 0.723 0.704 0.808
obust standard errors in parentheses
ignificant at 10%; ** significant at 5%; *** significant at 1%
K
K
K
KA
S
O
R-
R
* s
The results are largely the same in columns 2 and 3 where we separately include SURR and also (in column 3) its interaction with NT. In columns 4 and 5 of Table 6, we report the results from estimating the baseline equation from column 1 separately for the sub samples where SURR = 1 (column 5) and where SURR = 0 (column 4). Once again, firms in the NT sector experience a statistically different benefit from capital account openness only when no surrender requirements are in place. An important caveat is that variation in SURR is limited, with only 211 out of 2,051 observations reporting actual surrender requirements in place.
20
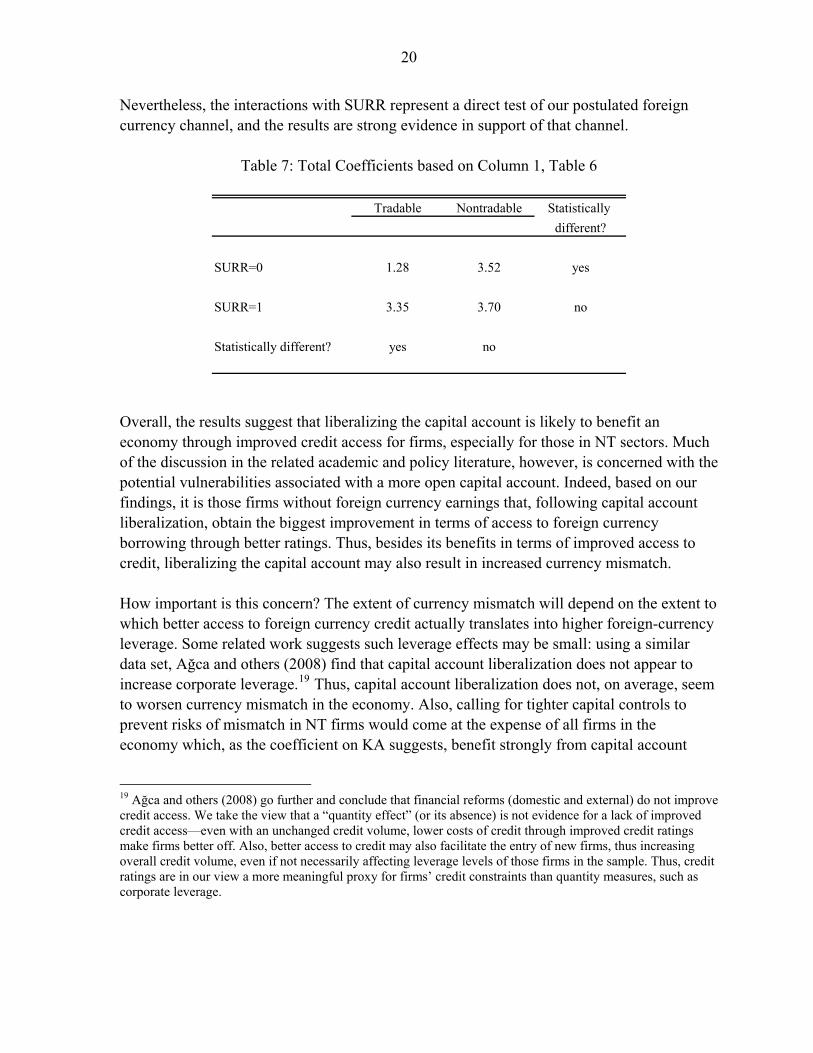
Nevertheless, the interactions with SURR represent a direct test of our postulated foreign currency channel, and the results are strong evidence in support of that channel.
Table 7: Total Coefficients based on Column 1, Table 6
Tradable Nontradable Statistically
different?
SURR=0 1.28 3.52 yes
SURR=1 3.35 3.70 no
Statistically different? yes no
Overall, the results suggest that liberalizing the capital account is likely to benefit an economy through improved credit access for firms, especially for those in NT sectors. Much of the discussion in the related academic and policy literature, however, is concerned with the potential vulnerabilities associated with a more open capital account. Indeed, based on our findings, it is those firms without foreign currency earnings that, following capital account liberalization, obtain the biggest improvement in terms of access to foreign currency borrowing through better ratings. Thus, besides its benefits in terms of improved access to credit, liberalizing the capital account may also result in increased currency mismatch. How important is this concern? The extent of currency mismatch will depend on the extent to which better access to foreign currency credit actually translates into higher foreign-currency leverage. Some related work suggests such leverage effects may be small: using a similar data set, Ağca and others (2008) find that capital account liberalization does not appear to increase corporate leverage.19 Thus, capital account liberalization does not, on average, seem to worsen currency mismatch in the economy. Also, calling for tighter capital controls to prevent risks of mismatch in NT firms would come at the expense of all firms in the economy which, as the coefficient on KA suggests, benefit strongly from capital account
19 Ağca and others (2008) go further and conclude that financial reforms (domestic and external) do not improve credit access. We take the view that a “quantity effect” (or its absence) is not evidence for a lack of improved credit access—even with an unchanged credit volume, lower costs of credit through improved credit ratings make firms better off. Also, better access to credit may also facilitate the entry of new firms, thus increasing overall credit volume, even if not necessarily affecting leverage levels of those firms in the sample. Thus, credit ratings are in our view a more meaningful proxy for firms’ credit constraints than quantity measures, such as corporate leverage.

21
liberalization. Thus, while there are risks and benefits of capital account liberalization that policy makers need to balance, the empirical evidence suggests that the risks, at least in terms of increased currency mismatch, appear limited.
V. ROBUSTNESS
A. Alternative measures of nontradability
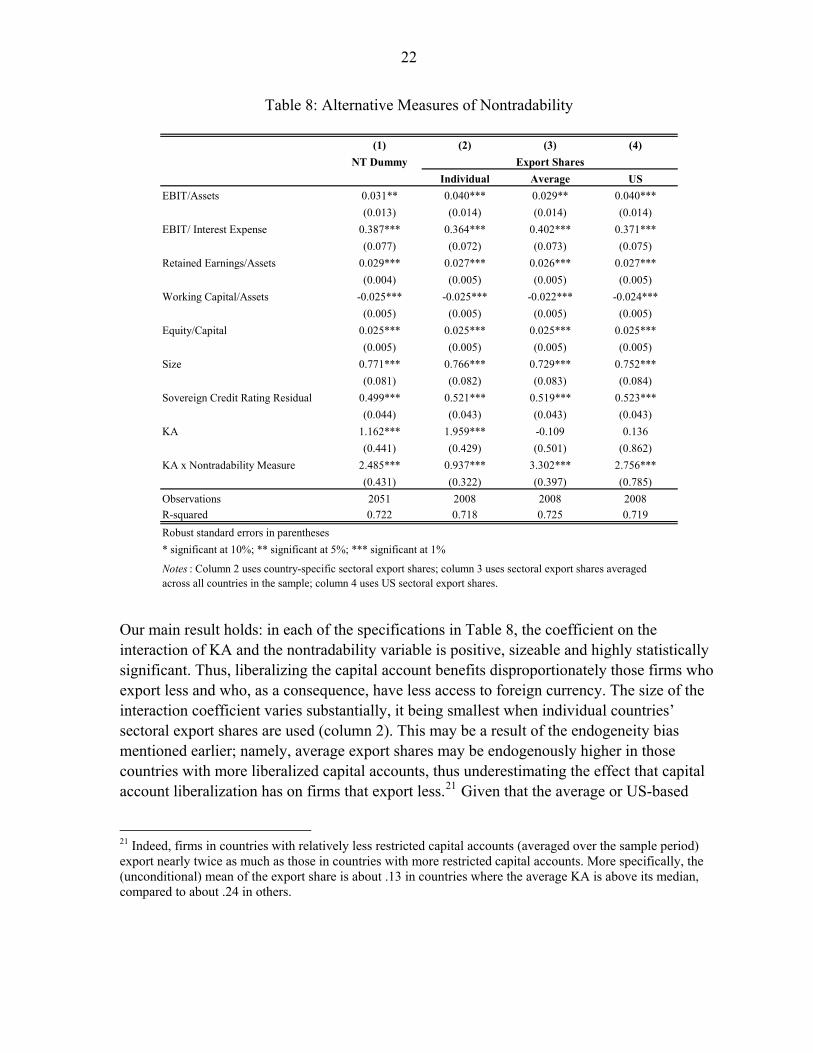
The binary TR/NT classification used so far is an imperfect measure. Arguably, actual export shares are more direct proxies for firms’ access to foreign exchange. For example, the Global Trade Analysis Project (GTAP) provides information on sectoral export shares.20 However, using such data is potentially problematic. The sectoral definitions in the GTAP differ from those in Bloomberg, the source of our firm-level data, and matching the two data sets thus involves a degree of judgment. Using actual export shares may also introduce a bias in the estimated coefficients: for example, the trade literature has shown that exporting firms tend to be more productive than non-exporters (see, e.g., Clerides, Lach, and Tybout, 1998, and Bernard and Jensen, 1999), thus, corporate credit ratings and firms’ decisions about how much to export may be jointly driven by the same underlying (unobserved) firm characteristics; export behavior may also respond endogenously to better access to credit, suggesting the possibility of reverse causality. The binary and essentially exogenous (to the individual firm) TR/NT classification we use in our baseline is less vulnerable to these issues. Nevertheless, with these caveats in mind, we re-estimate our baseline specification using three different versions of actual export share measures. We construct these export shares by matching the sectors as defined in Bloomberg with those in GTAP, and by using one minus the sector’s average share of the value of exports to the value of output as our proxy for nontradability. Table 8 reports the previous baseline results (using the T/NT dummy) in column 1, as well as the results based on three different export shares measures: country-specific sectoral shares (column 2), average sectoral shares across all countries in the sample (column 3) and sectoral export shares based on US data only (column 4). The specification in column 4 is similar to that used by Rajan and Zingales (1998) who used US estimates of sectoral dependence on external finance as a benchmark for all countries in their sample; the specification in column 3 is an intermediate version.
20 The GTAP database and documentation is available at https://www.gtap.agecon.purdue.edu/ .
22
Table 8: Alternative Measures of Nontradability
(1) (2) (3) (4)
NT Dummy Export Shares
Individual Average US
EBIT/Assets 0.031** 0.040*** 0.029** 0.040***
(0.013) (0.014) (0.014) (0.014)
EBIT/ Interest Expense 0.387*** 0.364*** 0.402*** 0.371***
(0.077) (0.072) (0.073) (0.075)
Retained Earnings/Assets 0.029*** 0.027*** 0.026*** 0.027***
(0.004) (0.005) (0.005) (0.005)
Working Capital/Assets -0.025*** -0.025*** -0.022*** -0.024***
(0.005) (0.005) (0.005) (0.005)
Equity/Capital 0.025*** 0.025*** 0.025*** 0.025***
(0.005) (0.005) (0.005) (0.005)
Size 0.771*** 0.766*** 0.729*** 0.752***
(0.081) (0.082) (0.083) (0.084)
Sovereign Credit Rating Residual 0.499*** 0.521*** 0.519*** 0.523***
(0.044) (0.043) (0.043) (0.043)
KA 1.162*** 1.959*** -0.109 0.136
(0.441) (0.429) (0.501) (0.862)
KA x Nontradability Measure 2.485*** 0.937*** 3.302*** 2.756***
(0.431) (0.322) (0.397) (0.785)
Observations 2051 2008 2008 2008
R-squared 0.722 0.718 0.725 0.719
Robust standard errors in parentheses
* significant at 10%; ** significant at 5%; *** significant at 1%
Notes : Column 2 uses country-specific sectoral export shares; column 3 uses sectoral export shares averaged across all countries in the sample; column 4 uses US sectoral export shares.
Our main result holds: in each of the specifications in Table 8, the coefficient on the interaction of KA and the nontradability variable is positive, sizeable and highly statistically significant. Thus, liberalizing the capital account benefits disproportionately those firms who export less and who, as a consequence, have less access to foreign currency. The size of the interaction coefficient varies substantially, it being smallest when individual countries’ sectoral export shares are used (column 2). This may be a result of the endogeneity bias mentioned earlier; namely, average export shares may be endogenously higher in those countries with more liberalized capital accounts, thus underestimating the effect that capital account liberalization has on firms that export less.21 Given that the average or US-based
21 Indeed, firms in countries with relatively less restricted capital accounts (averaged over the sample period) export nearly twice as much as those in countries with more restricted capital accounts. More specifically, the (unconditional) mean of the export share is about .13 in countries where the average KA is above its median, compared to about .24 in others.

23
measures are less prone to such endogeneity bias, the estimated interaction coefficients are substantially larger in columns 3 and 4, and on the same order of magnitude as that based on the NT dummy (column 1).
B. Direct versus indirect effects of capital controls
In Table 4, we show a significant effect of KA on credit ratings, and particularly so for NT firms, but across specifications, we also find a highly significant effect of sovereign ratings. We interpreted these findings as evidence for independent effects of both sovereign ratings and capital account regulations on firms’ credit ratings, but arguably, the fact that we use the sovereign ratings residual, rather than the actual sovereign ratings variable, leaves the results open to alternative interpretations. More specifically, suppose that capital account restrictions have no direct effect on firms’ credit ratings and only affect them through sovereign ratings such that
Private Credit Rating Constant + Sovereign Rating 'ict ct ict ictα β ε= ⋅ + ⋅X
Sovereign Rating KA Sovereign Rating Residual .ct ct ct
+
where, for ease of notation, Xict now contains all other determinants of private credit ratings (including fixed effects), and
δ γ= ⋅ + ⋅
Substituting the latter expression into the former implies
Private Credit Rating ( KA Sovereign Rating Residual ) '
KA Sovereign Rating Residual '
KA Sovereign Rating Residual ' .
ict ct ct ict ict
ct ct ict ict
ct ct ict ict
α δ γ β εαδ αγ β εφ λ β ε
= ⋅ ⋅ + ⋅ + ⋅ += ⋅ + ⋅ + ⋅ +
= ⋅ + ⋅ + ⋅ +
X
X
X
Thus, it is possible to estimate a significant effect of KA on private credit ratings even if the true effect occurs exclusively through sovereign ratings. This may affect the interpretation of our main results if, for example, firms in NT sectors are more influenced by the sovereign rating than other firms, that is, α is larger for NT firms. This possibility is plausible if domestic macroeconomic conditions are relatively more important for firms in NT sectors, whose private credit ratings would therefore be more strongly influenced by the sovereign rating. If so, our main regressions may simply pick up a stronger dependence of NT firms on the sovereign rating, rather than a stronger direct effect of KA on these firms’ ratings.

24
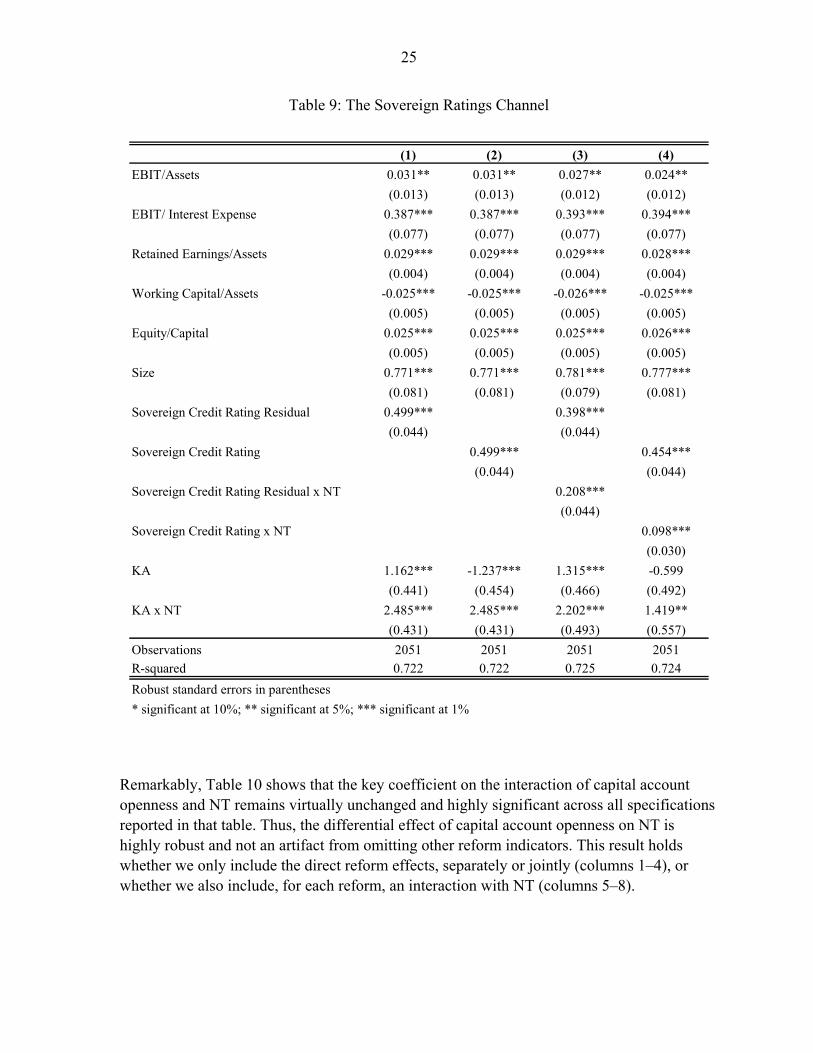
We address this issue in a number of ways. First, we note that the differential effects we observed across inflow and outflow controls are not easy to explain if the effects work entirely through sovereign ratings. Second, more formally, in Table 9 we replicate our baseline equation (column 1) and also re-estimate it using the “raw” sovereign ratings variable rather than the estimated residual (column 2). As expected from the above equations, the KA coefficients change, but importantly, the non-linearity for NT firms remains. In columns 3 and 4, we additionally allow for a non-linearity in the sovereign ratings themselves. If all effects occurred indirectly through sovereign ratings, the coefficients of KA should become insignificant, both for KA and its interaction with NT, especially in column 4, where we again use the “raw” sovereign ratings variable. The fact that they remain significant suggests that KA affects private credit ratings directly, over and above its indirect effects through sovereign ratings.22 Conversely, the fact that the non-linearity for sovereign ratings is also significant indicates that both direct and indirect effects play a role. However, and most importantly, that both direct and indirect effects may matter does not affect our key message: the finding remains that NT firms are substantially more affected by changes in capital controls than other firms, and whether this effect is direct, or indirect through changes in sovereign ratings, has no bearing on the fact that we have identified a subset of firms for which capital account restrictions have important implications.
C. Structural reforms and macroeconomic conditions
We also examine the possibility that the capital account variable may pick up other contemporaneous reform. To some extent, this possibility is limited by the fact that we include the sovereign ratings measure which captures other reforms, as we argued above and as also reported in IMF (2008). However, in Table 10 we report the results from more explicitly testing this possibility by including a number of other reform indicators, such as domestic financial sector reform and trade liberalization indicators, based on a newly constructed IMF database (see IMF, 2008). We add these variables, separately and simultaneously, to our baseline specification, both with and without an interaction with the NT indicator. In each case, we modify the sovereign ratings residual by also including in the first-stage regression the additional reform variable we consider; that is, the sovereign ratings residual is always “purged” of the main reform variables in any given specification.
22 Note that because all of the regressors in the first stage also appear in the second stage, the coefficient of sovereign ratings (“raw” or residual) is identical in columns 1 and 2. The equality in coefficients does not apply to columns 3 and 4 because the first-stage regression does not capture the sovereign ratings non-linearity we allow for in the second stage.
25
Table 9: The Sovereign Ratings Channel
(1) (2) (3) (4)
EBIT/Assets 0.031** 0.031** 0.027** 0.024**
(0.013) (0.013) (0.012) (0.012)
EBIT/ Interest Expense 0.387*** 0.387*** 0.393*** 0.394***
(0.077) (0.077) (0.077) (0.077)
Retained Earnings/Assets 0.029*** 0.029*** 0.029*** 0.028***
(0.004) (0.004) (0.004) (0.004)
Working Capital/Assets -0.025*** -0.025*** -0.026*** -0.025***
(0.005) (0.005) (0.005) (0.005)
Equity/Capital 0.025*** 0.025*** 0.025*** 0.026***
(0.005) (0.005) (0.005) (0.005)
Size 0.771*** 0.771*** 0.781*** 0.777***
(0.081) (0.081) (0.079) (0.081)
Sovereign Credit Rating Residual 0.499*** 0.398***
(0.044) (0.044)
Sovereign Credit Rating 0.499*** 0.454***
(0.044) (0.044)
Sovereign Credit Rating Residual x NT 0.208***
(0.044)
Sovereign Credit Rating x NT 0.098***
(0.030)
KA 1.162*** -1.237*** 1.315*** -0.599
(0.441) (0.454) (0.466) (0.492)
KA x NT 2.485*** 2.485*** 2.202*** 1.419**
(0.431) (0.431) (0.493) (0.557)
Observations 2051 2051 2051 2051
R-squared 0.722 0.722 0.725 0.724
Robust standard errors in parentheses
* significant at 10%; ** significant at 5%; *** significant at 1%
Remarkably, Table 10 shows that the key coefficient on the interaction of capital account openness and NT remains virtually unchanged and highly significant across all specifications reported in that table. Thus, the differential effect of capital account openness on NT is highly robust and not an artifact from omitting other reform indicators. This result holds whether we only include the direct reform effects, separately or jointly (columns 1–4), or whether we also include, for each reform, an interaction with NT (columns 5–8).

26
The effects of reforms indicators for domestic financial systems and current account regulations are in the expected direction (positive sign) and (marginally) significant. They do not, however, appear to affect NT firms any differently than other firms. Controlling for domestic financial development is potentially important insofar as one might expect that in countries with better developed domestic financial systems, not being able to tap international financial markets may therefore be less of a constraint. However, the results in Table 10 show that the differential effect on tradables and nontradables firms remains broadly unchanged even when controlling for domestic financial development (columns 1 and 5), suggesting that being able to access international financial markets appears to be valuable even in countries with well-developed domestic financial markets.23
However, the results are substantially different for the trade indicator, which measures the importance of import tariffs. The overall effect is large and negative and highly significant, while that on the NT interaction is positive and significant. A possible explanation for these results is that a reduction in import tariffs (that is, an increase in the trade reform indicator, see Table 3 for a description of the data) is likely to reduce the cost of imported inputs, but it may also increase import competition for firms in the tradables sector, with some of them facing a higher probability of going out of business and becoming unable to service their debt. The estimated coefficients suggest that the negative effects of import tariff reductions dominate, thus resulting in the downgrading of corporate ratings on average, perhaps because the focus of rating agencies on credit risk makes them give a greater weight to the higher probability of default of firms negatively affected by trade liberalization than to the higher profitability of those that benefit from it. The positive interaction term confirms the expected smaller negative average effects of trade liberalization on NT firms.24
Related to this, we also explored specifications where macroeconomic conditions are included. As with structural reforms, broad macroeconomic conditions are likely to be already reflected in the sovereign ratings measure, but a single measure cannot, of course, capture all dimensions of macroeconomic outcomes. Nevertheless, as we show in Table 11, results are robust and broadly unchanged when we include macroeconomic variables directly, rather than proxied by sovereign ratings.
23 One could also argue that the coefficient of capital account liberalization is itself a function of domestic financial sector development. In work not reported here, we also interacted capital controls, as well as the KAxNT interaction, with domestic finance, but these were not statistically significant.
24 However, while the effects are significantly smaller (in absolute terms) for NT firms than for others, the total coefficient remains negative even for NT firms. This is, in itself, a striking result which we consider an area for future research.

Table 10: Alternative Structural Reforms
(1) (2) (3) (4) (5) (6) (7) (8)
Sovereign Credit Rating Residual 0.495*** 0.497*** 0.492*** 0.483*** 0.495*** 0.500*** 0.492*** 0.486***
(0.045) (0.042) (0.046) (0.046) (0.045) (0.043) (0.046) (0.046)
KA 0.875* 1.014** 0.359 -0.009 0.779 1.599*** 0.501 0.685
(0.502) (0.419) (0.661) (0.714) (0.527) (0.488) (0.700) (0.799)
KA x NT 2.517*** 2.541*** 2.893*** 2.959*** 2.667*** 1.573*** 2.630*** 1.743***
(0.432) (0.428) (0.425) (0.422) (0.463) (0.547) (0.519) (0.576)
Domestic Finance 2.565* 0.721 2.859* 1.495
(1.463) (2.012) (1.565) (2.113)
Trade -11.316*** -11.298*** -13.097*** -12.814***
(2.973) (3.954) (3.102) (4.084)
Current Account 2.056* 2.541** 1.704 1.794
(1.091) (1.035) (1.210) (1.247)
Domestic Finance x NT -0.521 -1.383
(0.870) (1.102)
Trade x NT 4.062*** 4.042***
(1.420) (1.418)
Current Account x NT 0.655 1.356
(1.016) (1.381)
Observations 2051 2051 2018 2018 2051 2051 2018 2018
R-squared 0.723 0.723 0.724 0.726 0.723 0.724 0.725 0.727
Robust standard errors in parentheses
* significant at 10%; ** significant at 5%; *** significant at 1%
27

28
Table 11: Alternative Macroeconomic Control Variables
(1) (2) (3) (4) (5) (6)
EBIT/Assets 0.031** 0.031** 0.031** 0.031** 0.031** 0.031**
(0.013) (0.013) (0.013) (0.013) (0.013) (0.013)
EBIT/ Interest Expense 0.387*** 0.387*** 0.402*** 0.386*** 0.381*** 0.397***
(0.076) (0.077) (0.080) (0.077) (0.076) (0.079)
Retained Earnings/Assets 0.029*** 0.029*** 0.028*** 0.029*** 0.029*** 0.029***
(0.004) (0.004) (0.004) (0.004) (0.004) (0.004)
Working Capital/Assets -0.025*** -0.025*** -0.025*** -0.025*** -0.025*** -0.025***
(0.005) (0.005) (0.005) (0.005) (0.005) (0.005)
Equity/Capital 0.025*** 0.025*** 0.025*** 0.025*** 0.025*** 0.025***
(0.005) (0.005) (0.006) (0.005) (0.006) (0.006)
Size 0.771*** 0.771*** 0.785*** 0.771*** 0.775*** 0.787***
(0.081) (0.081) (0.081) (0.082) (0.082) (0.081)
Sovereign Credit Rating Residual 0.499*** 0.503*** 0.481*** 0.497*** 0.470*** 0.465***
(0.044) (0.050) (0.047) (0.047) (0.043) (0.055)
KA 1.162*** 1.170*** 0.990** 1.146** 0.593 0.528
(0.441) (0.438) (0.451) (0.447) (0.514) (0.515)
KA x NT 2.485*** 2.489*** 2.725*** 2.485*** 2.509*** 2.760***
(0.431) (0.433) (0.432) (0.431) (0.429) (0.432)
GDP growth 0.000 0.002
(0.007) (0.007)
GDP per capita -0.163 -0.376
(0.712) (0.780)
GDP volatility -0.016 -0.031
(0.015) (0.020)
Current Account Balance -0.005 0.046
(0.023) (0.029)
Inflation -0.047*** -0.053***
(0.013) (0.012)
Observations 2051 2051 2023 2048 2051 2020
R-squared 0.722 0.722 0.725 0.722 0.724 0.727
Robust standard errors in parentheses
* significant at 10%; ** significant at 5%; *** significant at 1%
D. Capital controls measures and other robustness checks
Of key importance in this paper is our measure of capital account restrictiveness. We focus on the novel data set in Schindler (2009) because unlike other indices, it allows for distinguishing between inflow and outflow controls, a dimension that is important for understanding the channel through which capital controls affect firms’ credit conditions, and because it is finely gradated, providing sufficient variation to distinguish between cases with few and cases with many restrictions. The novelty of the index itself, however, may raise concerns over the extent to which results are driven by measurement. Although Schindler (2009) shows that the aggregated version of this index is highly correlated with most other existing financial integration measures, we examine the issue directly by re-estimating our baseline specification (column 3 in Table 4) for a variety of alternative indices.

29
Table 12: Alternative Capital Account Measures
(1) (2) (3) (4) (5)
KA KAOPEN CAP100 CAP INTLCAPITAL
sets 0.031** 0.032** 0.032** 0.040*** 0.036***
(0.013) (0.012) (0.012) (0.013) (0.013)
terest Expense 0.387*** 0.393*** 0.391*** 0.371*** 0.377***
(0.077) (0.076) (0.076) (0.072) (0.072)
ed Earnings/Assets 0.029*** 0.029*** 0.029*** 0.029*** 0.029***
(0.004) (0.004) (0.004) (0.005) (0.004)
Capital/Assets -0.025*** -0.025*** -0.026*** -0.025*** -0.026***
(0.005) (0.005) (0.005) (0.005) (0.005)
apital 0.025*** 0.024*** 0.024*** 0.024*** 0.024***
(0.005) (0.005) (0.005) (0.005) (0.005)
0.771*** 0.782*** 0.767*** 0.771*** 0.764***
(0.081) (0.081) (0.082) (0.081) (0.081)
Credit Rating Residual 0.499*** 0.491*** 0.494*** 0.516*** 0.505***
(0.044) (0.041) (0.043) (0.040) (0.044)
unt measure 1.162*** 0.842** 2.121*** 0.809*** 0.014
(0.441) (0.366) (0.541) (0.252) (0.677)
unt measure x NT 2.485*** 2.307*** 2.753*** 0.528** 2.200***
(0.431) (0.415) (0.567) (0.241) (0.782)
ns 2051 2063 2067 2067 2067
0.722 0.724 0.721 0.719 0.719
andard errors in parentheses
ant at 10%; ** significant at 5%; *** significant at 1%
ere applicable, the capital account measure was rescaled to the [0,1] interval and inverted so that a score of 1 implies an estricted capital account.
EBIT/As
EBIT/ In
Retain
Working
Equity/C
Size
Sovereign
Capital acco
Capital acco
Observatio
R-squared
Robust st
* signific
Notes: Whunr
Specifically, we consider the measures by Quinn (1997) (updated through 2004; see IMF, 2008) (CAP100); a simply binary dummy that has been used in many capital-account related studies (CAP) and which has been made available by Mody and Murshid (1995) and Chinn and Ito (2007); the index KAOPEN by Chinn and Ito (2007), which is a summary measure of CAP and other variables related to a country’s financial openness; and, finally, the index INTLCAPITAL, a subcomponent of the financial reform database in Abiad and others (2008) covering exchange rate unification and restrictions on cross-border borrowing by banks. As documented in Table 12, none of these alternative specifications alter our key findings—namely, in each case, all firms benefit from capital account liberalization (although not always significantly so), but NT firms always benefit substantially and significantly more.25
25 In other robustness analyses not reported here, we also explored the use of lagged control variables, which did not alter the findings.

30
VI. CONCLUSIONS
In this paper, we have examined a novel channel through which capital account liberalization impacts an economy. In particular, we have found a strong positive effect of capital account liberalization on firms’ ability to raise funds in international credit markets. This channel operates through firms’ access to foreign currency, necessary for issuing foreign-currency denominated bonds. To test the importance of this channel, we exploited differences in the extent to which firms are actually constrained by capital account restrictions. In particular, we argued that firms in the tradables sector have potential access to foreign currency through their export earnings, independent of capital account restrictiveness, and are thus less constrained by such restrictions. Using firm-level data, we found that capital account restrictions have significantly larger effects for firms without alternative access to foreign currency than for others, substantially raising their cost of, and reducing their access to, credit. Our results add to the large literature on the effects of capital account liberalization by providing strong and novel evidence for a specific channel through which capital account restrictions operate. The heterogeneous impact of capital account restrictions on different subsets of an economy also helps better understand the more mixed evidence that has emerged from the past literature based on aggregate data. At the same time, it is important to recognize that we have examined only one area where capital account restrictions may matter, that is, firms’ ability and cost of issuing foreign currency debt. While this is an important area, it is only one of the many channels through which capital account restrictions may affect economic activity. Also, we have not examined the extent to which changes in corporate credit ratings affect aggregate outcomes such as growth or investment. It is likely that the effects are large—credit ratings are important determinants of access to and cost of credit, and thus are likely to affect investment decisions and, ultimately, firms’ profitability and growth outcomes. We have also briefly highlighted the potential risks that may arise in terms of currency mismatch if firms without foreign currency earnings increase their foreign currency debt leverage. These issues are the subject of future research.

31
References
Abiad, Abdul, Enrica Detragiache and Thierry Tressel, 2008, A New Database of Financial Reforms, IMF Working Paper 08/266.
Ağca, Şenay, Gianni De Nicolò and Enrica Detragiache, 2008, “Financial Sector Reforms
and Corporate Leverage: International Evidence,” Unpublished Manuscript. Alfonso, António, Pedro Gomes and Philipp Rother, 2007, What ‘Hides’ Behind Sovereign
Debt Ratings?, ECB Working Paper No. 711. Altman, Edward, and Herbert Rijken, 2004, How Rating Agencies Achieve Rating Stability,
Journal of Banking and Finance, Vol. 28, pp. 2679–714. Bekaert, Geert, and Campbell R. Harvey, 2000, Foreign Speculators and Emerging Equity
Markets, Journal of Finance, Vol. 55, 565–613. Bekaert, Geert, Campbell R. Harvey and Christian Lundblad, 2005, Does Financial
Liberalization Spur Growth?, Journal of Financial Economics, Vol. 77, pp. 3–55. Bernard, Andrew B., and J. Bradford Jensen, 1999, Exceptional Exporter Performance:
Cause, Effect, or Both?, Journal of International Economics, Vol. pp. 1–5. Binici, Mahir, Michael Hutchison and Martin Schindler, 2009, Controlling Capital? Legal
Restrictions and the Asset Composition of International Financial Flows, IMF Working Paper, forthcoming. Also forthcoming in Journal of International Money and Finance.
Borensztein, Eduardo, Kevin Cowan and Patricio Valenzuela, 2007, Sovereign Ceilings
‘Lite’? The Impact of Sovereign Ratings on Corporate Ratings in Emerging Markets Economies, IMF Working Paper 07/75.
Braun, Matías, and Claudio Raddatz, 2007, Trade Liberalization, Capital Account
Liberalization and the Real Effects of Financial Development, Journal of International Money and Finance Vol. 26, pp. 730–61.
Cantor, Richard and Frank Packer, 1996, Determinants and Impact of Sovereign Credit
Ratings, Federal Reserve Bank of New York Economic Policy Review (October), pp. 1–15.
Carling, Kenneth, Tor Jacobson, Jesper Lindé, and Kasper Roszbach, 2007, Corporate Credit
Risk Modeling and the Macroeconomy, Journal of Banking and Finance, Vol. 31, pp. 845–68.
Chari, Anusha and Peter Blair Henry, 2004, Risk Sharing and Asset Prices: Evidence from a
Natural Experiment, Journal of Finance, Vol. 59, pp. 1295–324.
32
Chinn, Menzie D., and Hiro Ito, 2007, A New Measure of Financial Openness, mimeo. Downloaded from http://www.ssc.wisc.edu/~mchinn/research.html.
Clerides, Sofronis, Saul Lach, and James Tybout, 1998, Is Learning by Exporting Important?
Micro-Dynamic Evidence from Columbia, Mexico and Morocco, Quarterly Journal of Economics, Vol. 113, pp. 903–48.
Dell’Ariccia, Giovanni, Julian di Giovanni, André Faria, Ayhan Kose, Paolo Mauro,
Jonathan Ostry, Martin Schindler, and Marco Terrones, 2008, Reaping the Benefits of Financial Globalization, IMF Occasional Paper, 264, Washington, DC: International Monetary Fund.
Desai, Mihir, C. Fritz Foley, and James Hines, 2006, Capital Controls, Liberalizations, and
Foreign Direct Investment, Review of Financial Studies, Vol. 19, pp. 1399–431. Durbin, Erik and David Ng, 2005, The Sovereign Ceiling and Emerging Market Corporate
Bond Spreads, Journal of International Money and Finance, Vol. 24, pp. 631–49. Ederington, Louis H., Jess B. Yawitz and Brian Roberts , 1987, The Informational Content of
Bond Ratings, Journal of Financial Research Vol. 10, 211–226. Edison, Hali, Michael Klein, Luca Ricci, and Torsten Sløk, 2004, Capital Account
Liberalization and Economic Performance: Survey and Synthesis, IMF Staff Papers 51, pp. 220–56.
Eichengreen, Barry, Ricardo Hausmann and Ugo Panizza, 2003, Currency Mismatches, Debt
Intolerance and Original Sin: Why They Are Not The Same and Why It Matters, NBER Working Paper No. 10036.
Eichengreen, Barry, and Ashoka Mody, 2000, What Explains Spreads on Emerging Market
Debt?, in Sebastian Edwards, ed., Capital Flows and The Emerging Economies: Theory, Evidence, and Controversies, Chicago: The University of Chicago Press, pp. 107–36.
Forbes, Kristin J., 2007, The Microeconomic Evidence on Capital Controls: No Free Lunch,
in Sebastian Edwards, ed., Capital Controls and Capital Flows in Emerging Economics: Policies, Practices, and Consequences, Chicago: The University of Chicago Press, pp. 171–199.
Henry, Peter Blair, 2000a, Do Stock Market Liberalizations Cause Investment Booms?,
Journal of Financial Economics, Vol. 58, pp. 301–34. Henry, Peter Blair, 2000b, Stock Market Liberalization, Economic Reform, and Emerging
Market Equity Prices, Journal of Finance, Vol. 55, pp. 529–64.
33
Henry, Peter Blair, 2003, Capital Account Liberalization, the Cost of Capital, and Economic Growth, American Economic Review, Vol. 93, pp. 91–6.
Henry, Peter Blair, 2007, Capital Account Liberalization: Theory, Evidence, and Speculation,
Journal of Economic Literature, Vol. 45, 887–935. International Monetary Fund (IMF), 2008, Structural Reforms and Economic Performance in
Advanced and Developing Countries, IMF Occasional Paper, Washington, DC: International Monetary Fund, forthcoming. Downloaded from http://www.imf.org/external/np/res/docs/2008/0608.htm.
Kisgen, Darren J., 2006, Credit Ratings and Capital Structure, Journal of Finance, Vol. 61, pp. 1035–72.
Kose, M. Ayhan, Eswar Prasad, Kenneth Rogoff and Shang-Jin Wei, 2009, Financial Globalization: A Reappraisal, IMF Staff Papers, 56, pp. 8–62.
Lane, Philip R., and Gian Maria Milesi-Ferretti, 2007, The External Wealth of Nations Mark
II: Revised and Extended Estimates of Foreign Assets and Liabilities, Journal of International Economics, Vol. 73, pp. 223–50.
Löffler, Gunter, 2004, An Anatomy of Rating Through the Cycle, Journal of Banking and
Finance, Vol. 28, 695–720. Ludvigson, Sydney C., and Serena Ng, 2005, Macro Factors in Bond Risk Premia, NBER
Working Paper No. 11703. Mendoza, Enrique G., 1993, The Robustness of Macroeconomic Indicators of Capital
Mobility, in Capital Mobility: The Impact on Consumption, Investment and Growth, ed. by L. Leiderman & Assaf Razin, Cambridge University Press, pp. 83–111.
Mendoza, Enrique G., Vincenzo Quadrini and José-Víctor Ríos-Rull, 2008, Financial
Integration, Financial Deepness and Global Imbalances, Journal of Political Economy, forthcoming.
Mody, Ashoka, and Antu Panini Murshid, 2005, Growing Up With Capital Flows, Journal of
International Economics, Vol. 65, pp. 249–66. Nickell Pamela, William Perraudin and Simone Varotto, 2000, Stability of Rating
Transitions, Journal of Banking and Finance, Vol. 24, pp. 203–27. Petersen, Mitchell, 2005, Estimating Standard Errors in Finance Panel Data Sets: Comparing
Approaches, NBER Working Paper No. 11280. Quinn, Dennis P., 1997, The Correlates of Change in International Financial Regulation,
American Political Science Review, Vol. 91, pp. 531–51.

34
Rajan, Raghuram, and Luigi Zingales, 1998, Financial Dependence and Growth, American Economic Review, Vol. 88, 559–86.
Reinhart, Carmen, 2002, Sovereign Credit Ratings Before and After Financial Crises,
Ratings, Rating Agencies and the Global Financial System, New York: Stern School of Business, New York University.
Schindler, Martin, 2009, Measuring Financial Integration: A New Data Set, IMF Staff Papers
Vol. 56, 222–38. Standard & Poor’s, 2001, Rating Methodology: Evaluating the Issuer. Downloaded from
http://www2.standardandpoors.com/spf/pdf/fixedincome/methodology.pdf. West, Richard R., 1973, Bond Ratings, Bond Yields and Financial Regulation: Some
Findings, Journal of Law and Economics, Vol. 16, 159–68.