Which nonprofits are exceeding digital expectations?
45
ECF DATA BENCHMARKS PRESENTATION 2017
-
Upload
duane-raymond -
Category
Government & Nonprofit
-
view
166 -
download
2
Transcript of Which nonprofits are exceeding digital expectations?

ECF DATA BENCHMARKS PRESENTATION 2017

we’ll review aggregate benchmark data for key metrics in digital fundraising and campaigningwe’ll look at some not-for-profits that exceeds the metric and consider the keys to their successWe’ll look at pictures of Data
what’s the plan?
2

3
what is the data source?
Organisations using the Engaging Networks platform
International data set 60,032,754 data records Just under 2 billion emails sent

MOBILEMOBILE

COMPUTING ERAS
1975 1985 1995 2005 2015
PC
Internet
Mobile


8
email and social drive mobile
“68% of emails were opened on a mobile device and 52% on smartphones” US Consumer Device Report

9
Mobile Conversion by Action Type
Transaction Type Percentage 2015 Percentage 2016
Petition 31.55% 33.2%
Email Advocacy 28.97% 32.56%
Single Donation 10.71% 14.57%
Recurring Donation 4.58% 15.60%

10
design for all mobile devices
Honk Kong, Korea, Mexico and Taiwan all over 70% mobile conversions for petitions

11
Humane Society International
36% of single gifts processed on mobile out
of 55,290 single gifts

12
Humane Society International
65.23% of email to
target actions
converted on a mobile

TEMPLATE #1

29% increase in conversion,
30% increase in revenue

15
responsive pages across devices pre-population of constituent data
from email – encrypted link that does not populate when forwarded
one-click donations that re-process stored token

DONOR CONVERSION

17
hypothetically, based on actual data
2.85m email advocacy unique records with average conversion to donation of 4%
- increased from 3.4% in 2015

18
hypothetically, based on actual data
Poor conversion rate to activist to donor of just 0.5% average gift of $53 representing $1,961 raised
WHAT IF… conversion rate of activist to donor of 7.8% average gift of $53 representing $30,591 raised

Post-Action is an important part of the supporter journey where they have the opportunity to reinforce their commitment by donating or sharing.
!

what’s the plan?
20
RETENTION

21
hypothetically, based on actual data
Retained SupportersYear-on-Year
Average retained Donors 27.19 Average retained Activists 25.29
22
hypothetically, based on actual data
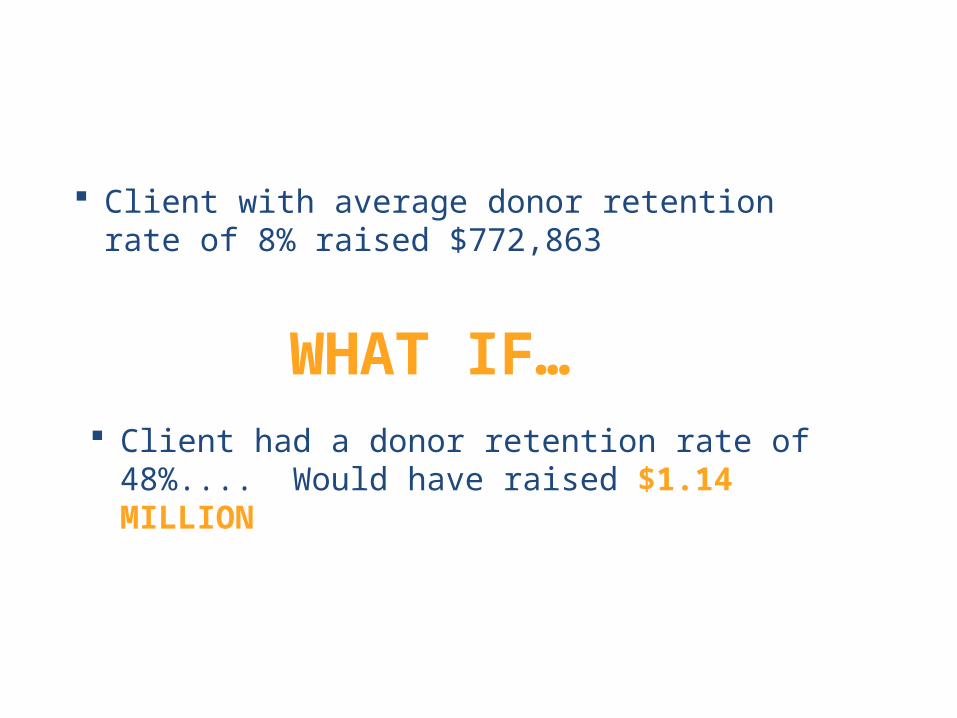
Client with average donor retention rate of 8% raised $772,863
WHAT IF… Client had a donor retention rate of 48%.... Would have
raised $1.14 MILLION

23
hypothetically, based on actual data
Need to sell fundraising to the campaigning team?
Retained donors who also integrate advocacy: 28.81 Retained activists who also integrate fundraising: 32.46

24
hypothetically, based on actual data
Need to sell campaigning to the fundraising team or vice versa?Integrated campaigning and fundraising: 30.64%
+4%!

NEW RECRUITS

26
acquisition
Transaction Type Percentage 2014-2015
Percentage 2015-2016
Petition 43.02% 36%
Email Advocacy 32.32% 37%
Single Donation ** 19.44% 21%
Recurring Donation ** 1.34% 4.9%

27
New signups from signup form:average doing well
New signups from signup form: average poor
2-4kper year
100-500per year

28

29

30

31
32

ENGAGEMENT SCORING


35
1-3 months
Level 1: 1+ page converted
Level 2: 2+ link clicked
Level 3: 1 link clicked
4-6 months
Level 4: 1+ page converted
Level 5: 2+ link clicked
Level 6: 1 link clicked
7-12 months
Level 7: 1+ page converted
Level 8: 2+ link clicked
Level 9: 1 link clicked
Level 10: Opened an email in the last 12 monthsLevel 11: No actions or opens in past 12 months

36
engagement dataEngagement Level
Percentage (March 2016)
Percentage (February 2017)
Level 1-3 8.23% 6.7%Level 4-6 3.75% 3.6%Level 7-9 4.41% 4.5%Level 10 33.61% 32.45%Inactive 49.97% 55.2%
*Based on evaluation of 34.8m constituent data records

20 Category 1 Highest Engagement send an average
of 20 emails per person
20 emails person

20 Category 1 Lowest Engagement send an average
of 6.9 emails per person

Highest Category 1 Engagement score was 46.81%Sending an average of 96.3 emails per person
27.3% inactive
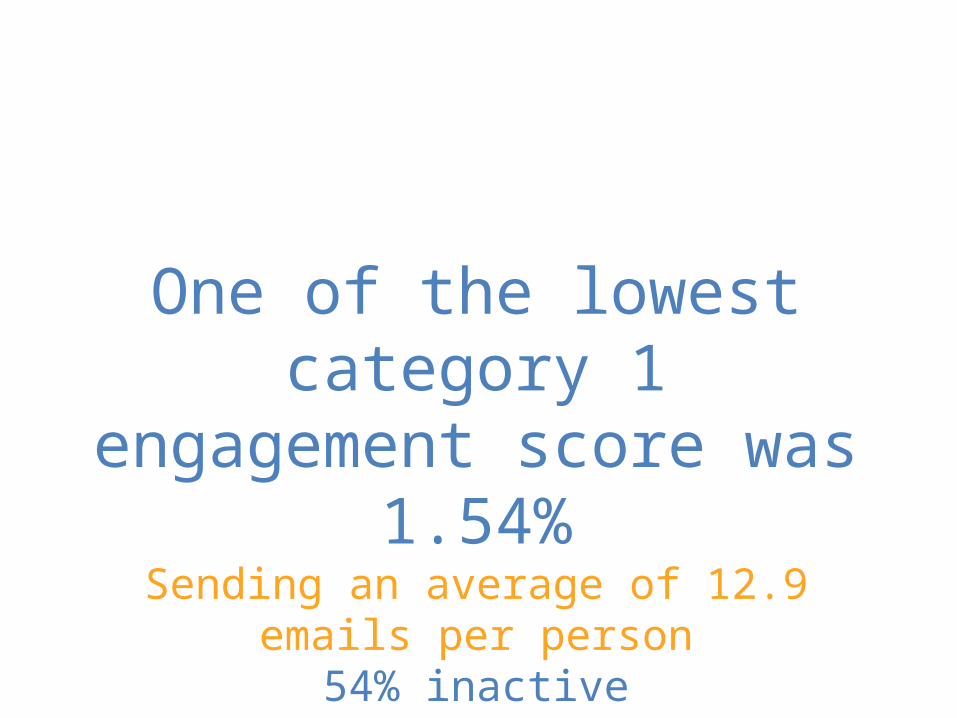
One of the lowest category 1 engagement score was 1.54%Sending an average of 12.9 emails per person
54% inactive

41
email frequency
10% biggest lists have 1.2m records and average inactive 54.4%
10% smallest lists have 6,700 records and average inactive of 50.4 %

42
hypothetically, based on actual data
INTERNATIONAL AVERAGES

!
AVOID CONFUSIONAVERAGE GIFTS BY CURRENCY - SINGLE
‣ 39.69 GBP‣ 90.59 USD‣ 157.56 CAN

!
AVOID CONFUSIONAVERAGE GIFTS BY CURRENCY
- RECURRING
‣ 9.78 GBP‣ 26.65 USD‣ 24.87 CAN