
Which is the best solar thermal collection technology for electricity generation...
56
1 Which is the best solar thermal collection technology for electricity generation in north-west India? Evaluation of options using the Analytical Hierarchy Process. J. D. Nixon 1 , P. K. Dey 2 and P. A. Davies 1* 1 Sustainable Environment Research Group, School of Engineering and Applied Science and 2 Aston Business School; both at Aston University, Aston Triangle, Birmingham, B4 7ET, UK *corresponding author, e-mail: [email protected], Tel +44 121 204 3724 Abstract This study of concentrating solar thermal power generation sets out to evaluate the main existing collection technologies using the framework of the Analytical Hierarchy Process (AHP). It encompasses parabolic troughs, heliostat fields, linear Fresnel reflectors, parabolic dishes, compound parabolic concentrators and linear Fresnel lenses. These technologies are compared based on technical, economic and environmental criteria. Within these three categories, numerous sub-criteria are identified; similarly sub-alternatives are considered for each technology. A literature review, thermodynamic calculations and an expert workshop have been used to arrive at quantitative and qualitative assessments. The methodology is applied principally to a case study in Gujarat in north-west India, though case studies based on the Sahara Desert, Southern Spain and California are included for comparison. A sensitivity analysis is carried out for Gujarat. The study concludes that the linear Fresnel lens with a secondary compound parabolic collector, or the parabolic dish reflector, are the preferred technologies for north-west India.
Transcript of Which is the best solar thermal collection technology for electricity generation...

1
Which is the best solar thermal collection technology for electricity
generation in north-west India? Evaluation of options using the
Analytical Hierarchy Process.
J. D. Nixon1, P. K. Dey2 and P. A. Davies1*
1Sustainable Environment Research Group, School of Engineering and Applied Science and
2Aston Business School;
both at Aston University, Aston Triangle, Birmingham, B4 7ET, UK
*corresponding author, e-mail: [email protected], Tel +44 121 204 3724
Abstract
This study of concentrating solar thermal power generation sets out to evaluate the main
existing collection technologies using the framework of the Analytical Hierarchy Process
(AHP). It encompasses parabolic troughs, heliostat fields, linear Fresnel reflectors, parabolic
dishes, compound parabolic concentrators and linear Fresnel lenses. These technologies are
compared based on technical, economic and environmental criteria. Within these three
categories, numerous sub-criteria are identified; similarly sub-alternatives are considered for
each technology. A literature review, thermodynamic calculations and an expert workshop
have been used to arrive at quantitative and qualitative assessments. The methodology is
applied principally to a case study in Gujarat in north-west India, though case studies based
on the Sahara Desert, Southern Spain and California are included for comparison. A
sensitivity analysis is carried out for Gujarat. The study concludes that the linear Fresnel lens
with a secondary compound parabolic collector, or the parabolic dish reflector, are the
preferred technologies for north-west India.

2
1. Introduction
Since independence in 1947, India has increased its electrical generation capacity from 1.4 to
148 GW, but has largely neglected its solar resource [1]. The current grid connected fuel mix
is 63% fossil-thermal, 3% nuclear, 25% hydroelectric and 9% from other renewable
resources; whereas grid connected solar generation capacity is a mere 2 MW [2]. Recently,
however, the Indian Government has announced a new policy direction through its National
Action Plan on Climate Change, one of whose eight national missions, namely the National
Solar Mission, proposes substantial investment in R&D and infrastructure to increase the
share of solar energy within the total energy mix [3].
India benefits from a sunny climate, in particular in its north west region, which receives
some 5.5 kWh/m2 of solar energy daily. To take advantage of this resource, one option that is
currently of much interest is Concentrating Solar thermal power (CSP). This technology has
been successfully implemented in California, and is being vigorously promoted for schemes
to provide Europe with power from the Sahara. Detailed feasibility studies for such schemes
have been prepared [4, 5]. In India, the uptake of solar thermal electricity has so far been
limited to demonstrations, though solar thermal concentrators are currently used in at least
two locations to provide heat for milk pasteurisation processing and cooking [6, 7].
This study has arisen in the context of a project to construct and test a solar power plant in
Gujarat. During the early stages of the project, it became apparent that a factor critical to the
success of the plant would be the correct selection of the solar collector technology for use in
India. Elsewhere in the world the preferred choice has been the parabolic trough type, which
is used in most of the large installed CSP plants in the US and Spain. Alternatives are being

3
actively pursued, however, such as heliostat type concentrators with central tower receivers
and parabolic dishes coupled to Stirling engines. As is frequently the case with energy
technologies, there is a myriad of options each with its advantages and drawbacks. Moreover,
the best solution for India may not be the same as for the US or Europe, as the economic and
technological environment is different.
The aim of this paper is to review and evaluate the competing solar thermal collection
technologies applicable to electricity generation in India with the help of a structured method.
Specifically, the objective is to provide a recommendation about which technologies to
pursue in the context of the current project in Gujarat and others that are expected to follow.
The Analytical Hierarchy Process (AHP) has been adopted because it is a decision-making
tool well suited to multifaceted problems where simple cost-benefit analysis is too simplistic.
It is a process that facilitates discussion among the designers and other stakeholders.
Furthermore, it generates documentation thus lending transparency to the decision making
rationale. The process is based both on mathematics and psychology to provide an overall
answer and differs from other decision making models by encompassing both certain and
uncertain data. The essence of the process is that judgment is used to evaluate the problem as
well as factual information and expert opinion. This is particularly useful in the case of
evaluating solar concentrator technologies where the varying scale and prototype nature of
some of these systems gives uncertainties when drawing a direct comparison between their
operating characteristics [8].
Saaty, who originated AHP in the 1970s, described applications ranging from transportation
planning to choosing a school for his son [9]. More recently, AHP and other multi-criteria
decision making (MCDM) methods have been applied to many issues in energy planning, as

4
reviewed by Pohekar and Ramachandran [10] along with other energy selection decisions
including the assessment of oil pipeline inspections and energy resource allocation for
households [11-13]. One paper from Marttunen and Hamalainen uses the AHP process to
help assess the environmental impact of hydropower [14]. Bhattacharya and Dey use the
AHP for power sector market selection in southern India [15]. Kaya and Kahraman use a
combined Fuzzy and the AHP approach for renewable energy planning in Istanbul. The AHP
is a tool that is being consistently used for the implementation and growth of technology
throughout the energy sector [16, 17]. In this sector, it is typical to find a large choice of
technologies, surrounded by controversial issues and variations in expert opinion. This makes
AHP a particularly valuable tool that can be used to help obtain a consensus.
The essence of AHP is that it simplifies a complex decision by decomposing the problem into
a hierarchy of ‘criteria’ or sub problems to be analysed individually. In this study, we have
categorised the evaluation criteria as technical, economic and environmental related. The
methodology is outlined as follows (see fig.1).
1. A comparative literature review of solar collector technologies has been carried out. The
output is a shortlist of technology alternatives and evaluation criteria.
2. The technology alternatives were scored against the criteria, through a pair-wise
comparison of factual data from the literature review. In addition, a thermodynamic
analysis has been used to provide numerical values against certain criteria.
3. A workshop has been convened among solar energy experts in India, at which the
technological alternatives and criteria were presented. The expert panel was invited to
review the criteria and weight them for four case studies to produce a set of
recommendations.

5
Fig.1. Flow diagram showing the methodology for technology evaluation and selection based on the AHP.
The choice of case studies encompassed the target location of Gujarat and three others:
California’s Mojave Desert, Southern Spain and the Sahara desert. These last three were
included to broaden the frame of reference to include locations where CSP plants are already
operational, or where advanced stages of planning have been carried out. The outcome is a
recommendation of a solar thermal collection technology in each case.
2. Comparative literature review
The purpose of this review is to identify the main technology alternatives relating to solar
collectors, to define the criteria (technical, economic and environmental), and to research
factual data for use in the AHP study. Some new or little-investigated technologies are
deliberately neglected due to the paucity of relevant information. For reviews of more general
scope the reader is referred elsewhere [18].
2.1 Parabolic Trough Collector (PTC)
Parabolic trough collectors (PTCs) are typically made from highly reflective glass mirrors
using a single-axis tracking mechanism to follow the sun’s trajectory, thus focusing the solar
Case Studies
Literature Review
AHP Workshop & Analysis
- Refined Criteria - Weightings
Recommendations
Technology Alternatives
Criteria and Scores

6
energy onto a linear receiver at the focal axis. Typically, the receiver is an evacuated glass
tube and absorbing pipe, carrying synthetic oil for the heat to be transferred to a heat
exchanger, in order to power a conventional steam power plant. Such PTCs can concentrate
direct sunlight to generate working temperatures up to 400ºC [19] and achieve concentration
ratios in the range of 30 – 100. The world’s largest solar thermal facility is currently the nine
Solar Energy Generating Systems (SEGS) built by Luz Industries in the Mojave Desert in
California providing a total installed capacity of 354 MW [20].
Collector fields usually follow a north-south alignment with careful consideration given to
the distance between collector rows, as this distance will determine the amount of land and
piping used and therefore affect costs. It also affects fluid transport and optical shadowing
losses which in turn affect the efficiencies of the system [21]. Optical efficiencies of 80%
have been obtained at the SEGS, with a land usage of 3.2 m2/MWh/year [20, 22]. The on-line
parasitic load of the SEGS VI system varies monthly, but is on average around 10% of the
Gross Solar Output [23]. The newer SEGS VI – VII increased the outlet temperature from the
solar field from 320 – 390 ºC to raise the generated steam at the heat exchanger to a pressure
of 100 bar. For the parabolic trough collector stagnation temperatures in the region of 600 ºC
are typical [20]. The half-acceptance angle for a PTC is around 0.5º [18, 24]. For the standard
PTC, the projected total operational and maintenance cost is approximately 0.02 $/kWhe and
a total capital cost of 3972 $/kW or 424$/m2 [20, 25].
Though synthetic oil has been used in the absorbing tubes of most PTCs to date, this transfer
medium limits the operating temperature to around 400ºC. Molten salt has been suggested,
but only prototype systems have been built due to the problems of the higher viscosity and
high melting temperatures requiring trace heating. An alternative that has been investigated is
7
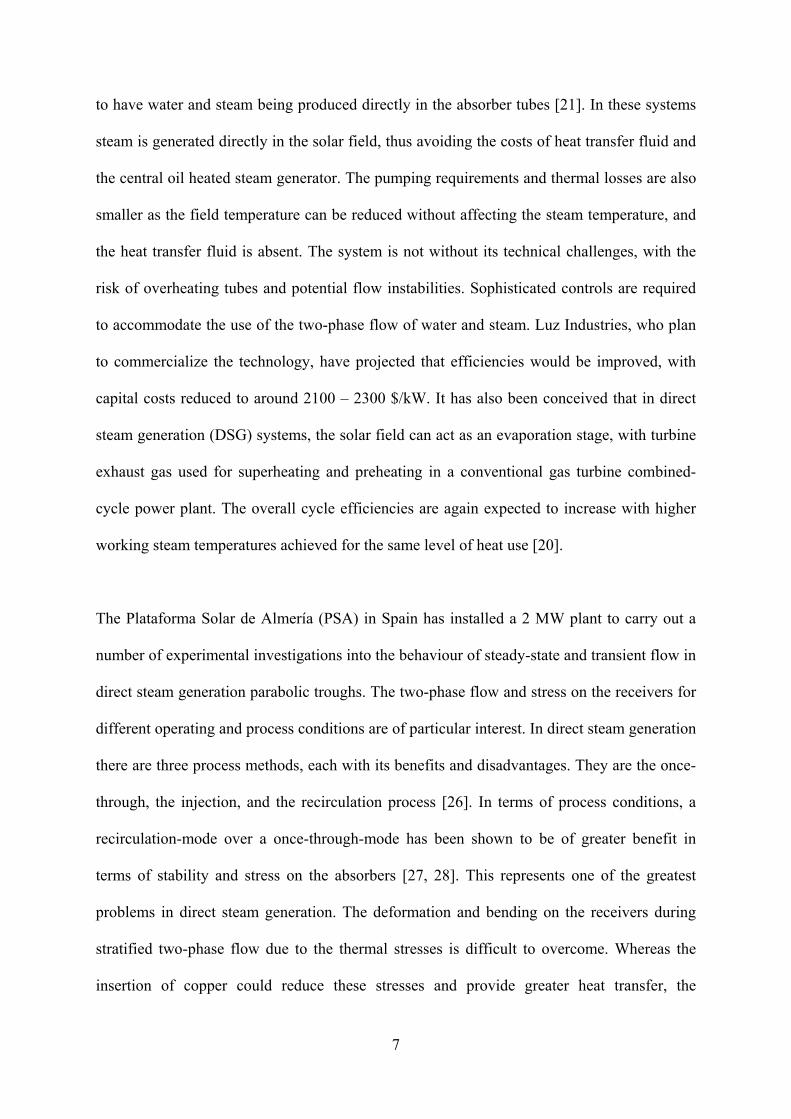
to have water and steam being produced directly in the absorber tubes [21]. In these systems
steam is generated directly in the solar field, thus avoiding the costs of heat transfer fluid and
the central oil heated steam generator. The pumping requirements and thermal losses are also
smaller as the field temperature can be reduced without affecting the steam temperature, and
the heat transfer fluid is absent. The system is not without its technical challenges, with the
risk of overheating tubes and potential flow instabilities. Sophisticated controls are required
to accommodate the use of the two-phase flow of water and steam. Luz Industries, who plan
to commercialize the technology, have projected that efficiencies would be improved, with
capital costs reduced to around 2100 – 2300 $/kW. It has also been conceived that in direct
steam generation (DSG) systems, the solar field can act as an evaporation stage, with turbine
exhaust gas used for superheating and preheating in a conventional gas turbine combined-
cycle power plant. The overall cycle efficiencies are again expected to increase with higher
working steam temperatures achieved for the same level of heat use [20].
The Plataforma Solar de Almería (PSA) in Spain has installed a 2 MW plant to carry out a
number of experimental investigations into the behaviour of steady-state and transient flow in
direct steam generation parabolic troughs. The two-phase flow and stress on the receivers for
different operating and process conditions are of particular interest. In direct steam generation
there are three process methods, each with its benefits and disadvantages. They are the once-
through, the injection, and the recirculation process [26]. In terms of process conditions, a
recirculation-mode over a once-through-mode has been shown to be of greater benefit in
terms of stability and stress on the absorbers [27, 28]. This represents one of the greatest
problems in direct steam generation. The deformation and bending on the receivers during
stratified two-phase flow due to the thermal stresses is difficult to overcome. Whereas the
insertion of copper could reduce these stresses and provide greater heat transfer, the

8
economics of this solution are doubtful. Bimetallic copper-steel receivers have been proven
to be superior to steel receivers particularly in low power applications (1 – 60 kWe), where
stratification is unavoidable [29]. Where tilted troughs have been used they have proved
unsuccessful and unnecessary to achieve direct steam generation [30].
Many of the environmental effects restricting the development of solar thermal power
stations are similar to those of other conventional power stations. However, locations that are
usually suited to solar applications, such as deserts and steppe areas, tend to be away from
populated areas, with plenty of available land. Although the accessibility of water can be a
problem which goes in hand with some of these places, solar thermal systems generally use
less water in comparison with other conventional power stations. The water requirement is
heavily dependent upon the entire plant cycle being used rather than the collector type alone.
With the land and water availability being very dependent on to the proposed location, the
type of collector most suited for the implementation of a solar thermal plant may vary [21].
While collectors may typically use around only a third of the land covered, it is difficult to
use the ground for anything else, unlike with wind turbines which can have crops growing
among them. It is claimed however that the SEGS plant use no more land than conventional
power plants when the full fuel cycle land requirements are considered [31].
2.2 Heliostat Field Collector (HFC)
Heliostat field collectors (HFCs), otherwise known as power towers, use an array of heliostat
mirrors to direct solar rays onto a central receiver. These mirrors can be flat or slightly
concave. Typically, water-steam has been used at the receiver, but some more recent systems
use a molten nitrate salt. The benefit of the molten salt is that the solar receiver can be started

9
quickly as it is a single phase fluid and the system is well suited to heat storage. Designing
the tower to be oversized in comparison to the generator enables storage of excess heat. The
majority of data on HFCs come from the demonstration projects, Solar 1 and Solar 2,
constructed in the Mojave Desert. The Solar Tres Tower in Andalusia, Spain, is a more recent
development that aimed to build upon the Solar 2 project and become the first commercial
molten salt power tower system. Spain is also home to the world’s first commercial water-
steam power tower PS10 and has the world’s largest solar tower, PS20, currently in
development near Seville. However, several other pilot test facilities around the world have
been built and remain in operation.
Such HFC systems are usually large at over 10MW as they benefit from economies of scale.
The use of a central receiver means that minimum thermal transport is required giving higher
optimal temperatures of around 500ºC [31], and stagnation temperature in the region of
1750ºC [18]. This can represent a technical challenge with thermal fatigue limiting the level
of solar flux that can be sustained. The Solar 1 tower operated at 516 ºC with an outlet
pressure of 105 bar, which are typical design parameters for all HFCs [20]. Typical
concentration ratios range between 300 – 1500 [18, 32]. With the higher temperatures, the
result is that these systems have the capacity for greater efficiencies, giving more output than
the more commonly employed parabolic trough. The parasitic loads are estimated to be
around 10% for a full scale system, with values being considerably higher in the non
commercial Solar 2 plant, due to the lower capacity factor, at over 20% [33].
The capital cost of these system is considerable at around 4000 $/kW or 476 $/m2 and with
operational and maintenance costs of 0.034 – 0.093 $/kWhe [20, 34]. As most of the cost
comes from the expensive heliostats, significant effort has gone into reducing the cost of

10
these components over the years, and by making them progressively larger, the cost has now
fallen from approximately 1000$/m2 to 150 $/m2. It is predicted that the cost for a large
central receiver system could fall as low as 2500$/kW [20, 25, 35].
From an environmental perspective, the nature of a heliostat array layout requires a large
amount of space and therefore HFCs use more land than any other CSP technologies at
around 4.6 m2/MWh/year [34]. Depending upon the layout and location, factors such as the
optical efficiency, capture efficiency and acceptance angle are variable [36]. The type of
terrain available is also variable, while levelled ground is the most common choice, hillsides
have also been utilized [37].
A number of other types of receivers have been conceived as well. In 1987 the CESA-1 tower
at the Plataforma Solar de Almería in Spain used an air receiver with operating temperatures
of up to 1000ºC at 10 bar with the use of ceramic receivers [18, 20]. Problems arose from the
ceramic receivers having to be 20 - 25 times larger than a molten salt receiver, making the
system very expensive and subject to high heat loss. A newer idea is to create a three
dimensional volume that came to be known as the volumetric air receiver. In spite of its
theoretical advantages, technical limitations have, as yet, restricted any large scale
developments of the technology. Solgate, erected in the CESA-1 tower, is one of the few
volumetric air receiver pilot projects in existence and has achieved operating temperatures of
over 1000 ºC with the direct drive of a gas turbine [21]. A comprehensive description of all
the power tower projects and types of receivers has been presented by Goswami and Kreith
[26].
11
2.3 Linear Fresnel Reflector (LFR)
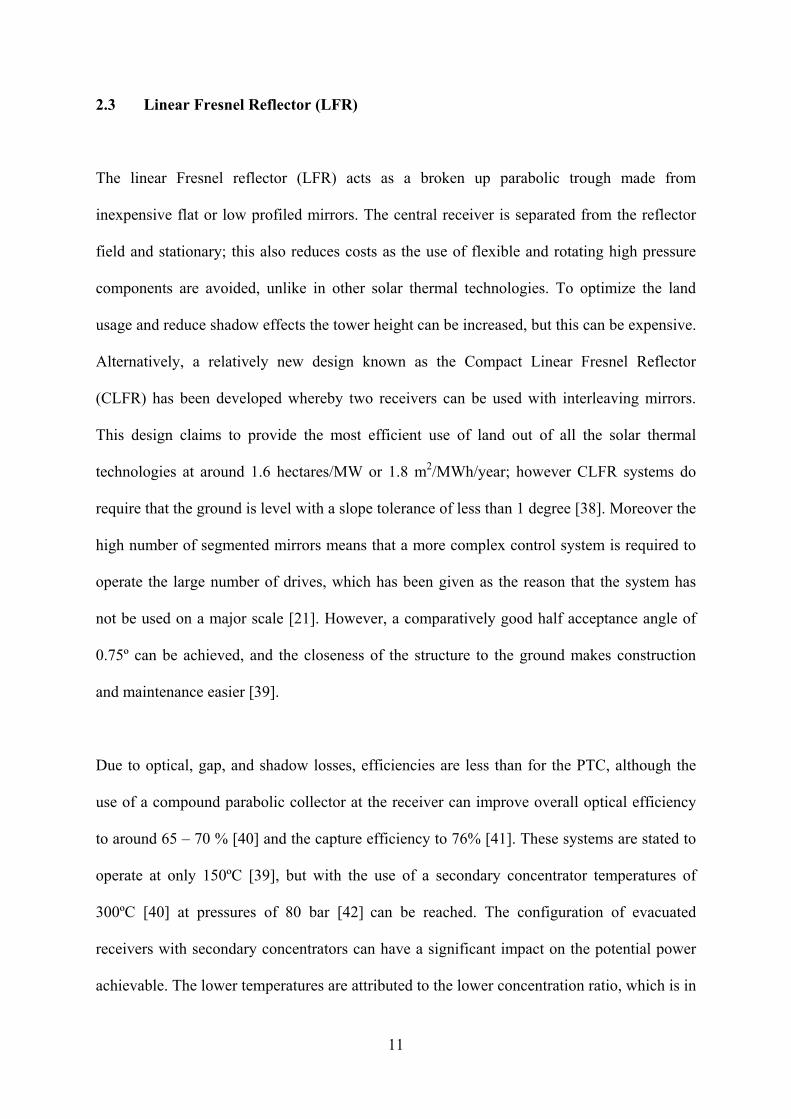
The linear Fresnel reflector (LFR) acts as a broken up parabolic trough made from
inexpensive flat or low profiled mirrors. The central receiver is separated from the reflector
field and stationary; this also reduces costs as the use of flexible and rotating high pressure
components are avoided, unlike in other solar thermal technologies. To optimize the land
usage and reduce shadow effects the tower height can be increased, but this can be expensive.
Alternatively, a relatively new design known as the Compact Linear Fresnel Reflector
(CLFR) has been developed whereby two receivers can be used with interleaving mirrors.
This design claims to provide the most efficient use of land out of all the solar thermal
technologies at around 1.6 hectares/MW or 1.8 m2/MWh/year; however CLFR systems do
require that the ground is level with a slope tolerance of less than 1 degree [38]. Moreover the
high number of segmented mirrors means that a more complex control system is required to
operate the large number of drives, which has been given as the reason that the system has
not be used on a major scale [21]. However, a comparatively good half acceptance angle of
0.75º can be achieved, and the closeness of the structure to the ground makes construction
and maintenance easier [39].
Due to optical, gap, and shadow losses, efficiencies are less than for the PTC, although the
use of a compound parabolic collector at the receiver can improve overall optical efficiency
to around 65 – 70 % [40] and the capture efficiency to 76% [41]. These systems are stated to
operate at only 150ºC [39], but with the use of a secondary concentrator temperatures of
300ºC [40] at pressures of 80 bar [42] can be reached. The configuration of evacuated
receivers with secondary concentrators can have a significant impact on the potential power
achievable. The lower temperatures are attributed to the lower concentration ratio, which is in

12
the region of around 30 [42]. Receivers can also be protected more easily than the PTC
receivers making them a practical alternative to linear PTCs with capital and maintenance
cost significantly lower [40]. Capital costs of the system are approximately 234 $/m2 [41].
2.4 Parabolic Dish Reflectors (PDR)
The Parabolic Dish Reflector (PDR) or Dish Engine is a concave mirror that focuses sunlight
onto a single point receiver. Mirrors can be facetted segmented surfaces or a single
parabolically shaped surface made in some forming process. The mounting structure will then
depend upon the type of mirrors used. The system requires continuous two-axis tracking as
the concentrated solar rays are focused onto a receiver at the single focal point. Stirling
engines are the most common receiver used; however PV modules, heat pipes, micro turbine
and other engines have been considered [21].
Technically, dish engines have the greatest potential, with one PDR holding the world record
for solar to electrical efficiency at 31.25% [43]. With the 2-axis tracking mechanism Dish
Engines allow the highest capture of the solar energy, with optical efficiencies of up to 94%,
and concentration ratios ranging from 500 – 2000. For a concentration ratio of 500 the
stagnation temperatures would be in the region of 1285ºC[18]. With the correct materials,
temperatures of over a 1000ºC can be reached [31]; common operating pressures for these
temperatures would be between 40 – 200 bar [21]. One proprietor of a 25kW Dish Engine
claim that their system focuses around 60000kWh/year, and in a good desert location can be
situated with one dish for every 500m2 equating to an average power of 14 W/m2 [44].

13
Even though the dish system has the greatest potential efficiency, the problem remains of
finding a reliable, inexpensive and efficient engine for the system. PDRs using as Stirling
engine typically have had the highest cost of electrical production, and difficulties with
hybridization and heat storage. The capital costs of prototype dish systems have been as high
as 12600 $/kW, with more recent designs costing 9000 $/kW; however large scale purchases
could reduce the price to 2000 $/kW [45]. Dish Engines do have the benefit of being modular
in regards to having the capability to come in all sizes so can be useful in small and off grid
applications. Another benefit of the dish is that unlike other solar thermal systems,
completely level ground is not a requirement [43]. Ground usage for the world’s largest
proposed CSP plant in California made by SES (Solar Energy Systems) can be calculated at
4.15 m2/MWh/year; however permits have yet to be obtained [46].
Mirrors are a major contributor to the high expense of these systems, costing around 80 - 150
$/m2. An alternative method that has been used on some pilot projects is to use a stretched
aluminium silvered polymer, which can be considerably cheaper at around 40 – 80 $/m2 [47].
2.5 Linear Compound Parabolic Collector (CPC) and Fresnel Lenses
The 2 dimensional linear Compound Parabolic Collector (CPC) is considered in this review.
The CPC is a non-imaging concentrator. Compared to imaging concentrators such as the
parabolic trough or dish, they accept radiation over a wider range of approaching angles for a
given concentration ratio. A typical configuration has a lower circular portion and an upper
parabolic section to form a trough with an absorber pipe located at the bottom [48]. However,
this type of design tends to be large, hence truncated CPCs are often used instead; only a
slight reduction in concentration results from a one-third decrease in height [49-51].

14
The advantages of CPCs is that they can achieve some concentration without any form of
tracking with half acceptance angles of over 20º; however this permits only a very low
concentration ratio of around 3 [19]. The aim with solar thermal systems is to have a device
that will operate at higher temperatures and efficiencies, which requires much higher
concentration ratios than this. Due to the impractically large size of a conventional CPC for
concentration ratios above 10, an alternative approach is to use a lens in front of the
collector’s aperture entrance. These are then referred to as primary and secondary
concentrators respectively. To reduce the size and weight of the lens, a Fresnel lens, either
linear or circular, would usually be selected [49]. The advantage of refractive materials, such
as polymethylmethacrylate which is often used to make Fresnel lenses, is that they are
generally cheaper and have a longer lifespan than reflective materials used to make mirrors
[52]. For the secondary concentrator again relatively cheap materials such as aluminium or
glass can be used. Furthermore, if a material is chosen that has some flexibility, a less rigid
frame is required to withstand wind loads without risk of fracture.
Lenses can be used in solar applications to create either an imaging or non-imaging system.
Imaging systems require very accurate 2-axis tracking to create an exact image of the light
source on a receiver. However, tracking inaccuracies and manufacturing process errors can
make it difficult to successfully implement lenses in this way for solar concentrators.
Therefore non-imaging arrangements, using the CPC or similar types of non-imaging
secondary, are often preferred and can be competitive with other types of collectors [53].
For a linear Fresnel lens-CPC arrangement to achieve temperatures of up to 200ºC, the half
acceptance angle would have to be reduced significantly to around 3º as compared to static

15
non-imaging CPCs. The benefit of this is that, although a tracking system would still have to
be used, the comparatively wide tracking error margin means a simpler clock mechanism
may suffice, rather than a sensor or programmed based mechanism. A flat Fresnel lens
located grooved side facing down and smooth surface up is usually preferred by most
designers. The lens protects the receiver from environmental damage without collecting dirt
in its grooves making maintenance far easier. However, high surface reflection losses and
large off-axis aberrations are found from this configuration. For these reasons curved linear
Fresnel lenses are often considered which can help overcome these disadvantages through
prism minimum deviation at each refractive surface [54]. Although only comparatively low
operating temperatures are achievable with a concentration ratio of up to 20 with single axis
tracking around a polar axis [55], and low capture efficiencies of up to 50% [56], and optical
efficiencies of 60 – 65%, the capital and operational costs are reduced significantly compared
to other solar thermal technologies. For a linear lens, tracking has to follow a north-south
alignment due to the shortening of the focal length from off-meridian rays. For a linear lens
with a 2-axis tracking system, higher concentration ratios of up to only 70 can be achieved. A
single axis tracking compound parabolic collector with focusing linear Fresnel lens is
predicted to cost in a similar region to the CLFR at 260 $/m2. For temperatures greater than
200ºC, Colleras Pereira recommends that a circular lens be used; however these are beyond
the scope of this review [49].
2.6 Output of literature review
The literature review has identified the main technology alternatives and sub-alternatives to
be the parabolic trough collector with synthetic oil or direct steam generation, the Heliostat
field collector with either a water-steam, molten salt, or volumetric air receiver, the linear

16
Fresnel reflector or compact linear Fresnel reflector, a parabolic dish reflector combined with
a Stirling engine, and finally a compound parabolic collector with or without a linear Fresnel
lens.
It has also revealed the detailed criteria deemed necessary to compare the different
technological alternatives, as summarised in Table 1. Where data has been unattainable,
judgement has been used as the AHP dictates. Values have been listed under the three
sections of technical, financial and environmental. Values for the ideal conversion and
collector efficiency have also been included from the idealised thermodynamic analysis of the
different collectors (see Electronic Annex 1 in the online version of this article). The criteria
and alternatives in this table can be developed into a decision hierarchy tree (see Fig 2a-d),
which forms the first part of the AHP study. The tabulated values can then be used to
complete the pairwise comparison mathematical model (see Electronic Annex 2 for sample
calculations and Annex 3 for full workings).
(a) Goal: Choose a solar collector for India
Technical Environmental Financial
Criteria Criteria Criteria
Sub-Criteria Sub-Criteria Sub-Criteria
Alternatives Alternatives Alternatives
Fig 2a–d: Decision hierarchy tree for selection of a suitable solar thermal collector for Gujarat (a) with the
expanded hierarchy tree for the technical criteria (b), environmental criteria (c), and financial criteria (d),
showing the technologies ordered on preference for each sub-criterion, using the characteristic values (Table
2.5) from the literature review.

17
(b) Technical
Compatibility Reliability Availability
Pressure Tolerance
Temperature
Tolerance
Chemical Compatibility
Annual Replacement of
Parts
Use of Standard Technologies or
Parts
CPC PDR HFC - Air
HFC - Air HFC - Air PDR CPC - Fresnel Lens
Number of Standard Parts
PDR HFC - Molten Salt HFC - Molten Salt LFR
LFR HFC -
Water/Steam HFC - Water/Steam CLFR
CLFR PTC - DSG CPC HFC -
Water/Steam CLFR
HFC - Molten Salt
PTC-Oil CPC - Fresnel Lens HFC - Molten Salt LFR
HFC - Water/Steam
CLFR CLFR HFC - Air CPC
CPC - Fresnel Lens
LFR LFR PDR CPC - Fresnel
Lens
PTC-Oil CPC - Fresnel
Lens PTC - DSG CPC
HFC - Water/Steam
PTC - DSG CPC PTC-Oil PTC - DSG PTC - DSG
PTC-Oil HFC - Molten Salt
PTC-Oil
HFC - Air
PDR
Efficiency
Collector Efficiency Ideal Conversion
Efficiency
Concentration of Direct Sunlight
Parasitic Load
Heat Transferred Carnot and
Optical Efficiency
Concentration
Ratio
Half Acceptance Angle
HFC - Air PDR PDR CPC CPC
HFC - Water/Steam HFC - Air HFC -
Water/Steam
CPC - Fresnel Lens
CPC - Fresnel
Lens
HFC - Molten Salt HFC -
Water/Steam HFC - Molten
Salt HFC - Air LFR
PDR HFC - Molten Salt
HFC - Air HFC - Molten Salt CLFR
PTC - DSG PTC - DSG PTC - DSG HFC - Water/Steam
PDR
PTC-Oil PTC-Oil PTC-Oil LFR PTC-Oil
CLFR CLFR CLFR CLFR HFC - Air
LFR LFR LFR PTC - DSG PTC - DSG
CPC - Fresnel Lens CPC - Fresnel
Lens
CPC - Fresnel Lens
PTC-Oil HFC - Molten Salt
CPC CPC CPC PDR HFC -
Water/Steam
Fig 2: (continued).

18
(c) Environmental
Resource Usage Scalability
Land Usage Slope
Tolerance Water Usage
Suitability to operate at scale
suggested in Proposal
CLFR PDR PDR
PTC - DSG HFC - Air CPC CPC -
Fresnel Lens
HFC - Water/Steam
HFC - Air Dependant on Location
LFR HFC -
Molten Salt
HFC - Molten Salt
PTC-Oil PTC-Oil CPC -
Fresnel Lens
Southern Spain
India - Gujarat
California Sahara Desert
HFC - Air PTC - DSG CLFR
HFC - Water/Steam
CLFR LFR PDR CLFR
HFC - Air HFC - Air
HFC - Molten Salt
LFR HFC - Water/Steam
HFC - Air LFR HFC -
Molten Salt
HFC - Molten Salt
PDR CPC PTC - DSG HFC -
Molten Salt
CPC - Fresnel Lens
HFC -
Water/Steam
HFC - Water/Steam
CPC CPC -
Fresnel Lens PTC-Oil
HFC - Water/Steam
PDR
PDR PDR
PTC - DSG PTC - DSG PTC - DSG PTC - DSG
PTC-Oil PTC-Oil PTC-Oil PTC-Oil
CLFR HFC - Air CLFR CLFR
LFR HFC -
Molten Salt
LFR LFR
CPC -
Fresnel Lens
HFC - Water/Steam
CPC -
Fresnel Lens
CPC - Fresnel Lens
CPC CPC CPC CPC
(d) Financial
Affordability
Capital Cost Total O&M Costs
LFR CPC ‐ Fresnel Lens
CPC LFR
CLFR CLFR
CPC ‐ Fresnel Lens CPC
PTC ‐ DSG PTC ‐ DSG
PTC‐Oil PTC‐Oil
HFC ‐ Air HFC ‐ Air
HFC ‐ Water/Steam HFC ‐ Water/Steam
HFC ‐ Molten Salt HFC ‐ Molten Salt
PDR PDR
Fig 2: (continued).

19
Table 1: Characteristic values for solar thermal technologies and their alternatives, under the criteria of; technical, financial, and environmental, developed from the literature review.
a Due to the prototype nature of some of these systems were data is not currently widely available or known values are represented with a ‘*’.
Alternatives Parabolic Trough HFC LFR PDR CPC Sub- Alternatives Synthetic
Oil DSG Salt
Receiver Water /Steam Volumetric CLFR LFR Glass CPC
with Fresnel lens
Criteria Sub criteria Metric Unit Comment
Tec
hnic
al
Efficiency Ideal Conversion Efficiency %
Optical, and Carnot efficiency 33% Higher 45% Higher 25% Lower 65% Lower 22%
Collector Efficiency % Heat transferred based on the ideal system 63% 72% 36% 66% 36%
Stagnation temperature °C 600 Highe
r 1750 * a 300 + 1200 + * *
Optical Efficiency % Ratio of sunlight capture to incident sunlight 80 Varied 73 67 Lower 94 * 60 - 65
Concentration of direct sunlight
Concentration ratio - 30 - 100 300 - 1500 Lower 30+
500 - 1500 3 10 to 20
Capture efficiency % 91 Varied * 76 Lower 100 * 40 - 50 Half Acceptance Angle Degrees
Affects required tracking accuracy 0.5 * 0.75 0.4 20 3
Parasitic load Fraction of electrical output % E.g. for tracking, pumps, etc. 10 Higher 10 - 20 10 Higher Low 4
Very low 2.3
Compatibility with working fluid
Pressure tolerance bar Flexible hosing, fixed receiver 40 - 100 100+ 10 -20 69 20 *
Temperature tolerance °C 100 - 400 Higher 150 -800 1000+ 100 - 300 500 - 1500 <100 < 200
Chemical compatibility of heat transfer medium
Freezing, fire hazard, corrosion
Synthetic Oil water
Molten Salt Steam Air Water Air Water
2-phase flow Are difficulties with 2phase flow encountered No Yes No Yes No Yes No Yes
Reliability Reliability
% /Prediction
Environmental Resistance, Annual Replacement of Parts 5.5 - V.Low Medium Medium
Med - Low Low High
Availability Use of standard technologies or parts
Number of standard parts
Med - Low
Medium
Med - Low
Medium Med - Low High Very low High Med - High
Fin
anci
al Affordability Capital cost Dollars/kW 3972 2300 4000+ - Lower 12578 Lower -
Dollars/m2 424 Lower 476 234 Lower - Lower 260
Total M&O cost Dollars/ kWhe
0.012 - 0.02 Lower 0.034 Low Lower 0.21 *
Env
iron
men
tal
Resource usage Land usage
m2/MWh/ year Land used per energy output 3.2 Lower 4.6 1.8 Higher 4.15 *
Tolerance of slope Degrees <1 Flexible <1 Flexible level
Water usage Dependant on System m3/MWhe Water cooled 3.07 * 2.27 Higher * * None *
Dry cooled 0.3 Higher * Higher * 0.04 None * m3/m2/year Water mirror washing 0.022 0.022 0.022 0.022 * Lower?
Scalability Efficiency at different scales
At the scale suggested in the proposal
The proposal suggested in scenario Better Poor Better Better Better
Suitable operating range Electrical Range MW 0.05-100 0.5-100
0.05-100
0.025-100 *

20
3. AHP Workshop and Analysis
Four case study scenarios were proposed to a panel of ten experts working in various fields
within the Solar Energy Centre. Located at Gurgaon, Haryana, the Solar Energy Centre was
built in 1991 to extend research into varying solar technologies. It is recognised by India’s
Ministry of Non-conventional Energy Sources as a centre for the testing and evaluation of
solar based devices [57]. Due to its nationally and internationally acknowledged expertise,
the centre was chosen for this AHP workshop.
A presentation explaining the purpose of the AHP study was delivered followed by a
synopsis for each of the different case studies. These synopses were presented to the panel in
written form also. They included information about each region’s climate and topography,
along with the policy setting and government legislation that exist to promote renewable
projects. Demographic factors were also mentioned, as was the probable scale of a solar
thermal power plant in these areas (see Electronic Annex 4 in the online version of this
article).
Firstly, the experts were given the opportunity to expand or reduce the list of criteria that had
been developed from the literature review given. However, in this case no sub-criteria were
added or removed. The experts were then asked to score the criteria from 1 to 10, for each of
the case studies. The pairwise comparison could then be completed to determine the criteria
weighting vectors (see Electronic Annex 5 in the online version of this article). Thus the
combination of the literature review (which gave the priority vectors) and the experts’
opinions (giving the weightings) enabled the analysis to be completed following the standard
AHP methodology [58].

21
4. Results and sensitivity analysis
The bar charts of Figure 3 gives the results for the four cases studies, in terms of percentages
which indicate relative levels of preference for each technology. For Gujarat, the preferred
technology is the linear Fresnel lens-CPC which scores 11.9%. The compact linear Fresnel
reflector at 11.5% was a close second.
These results for Gujarat arise from the high weighting given by the panel to the criteria of
good reliability, low cost and low ground usage for this location. For the other regions, the
study gives very different recommendations. Thus, with a score of 13.5%, the parabolic dish
reflector is preferred for the Sahara Desert. For the large scale implementation assumed in
this case study, the technical capabilities of the system were weighted as the most important
criteria, thus favouring the PDR due to its superior technical efficiencies. Surprisingly, the
PTC using synthetic oil receives an unfavourable rating of only 5.9%. Another factor
favouring the PDR is water usage, which for a system in a large desert like the Sahara is
crucial; the PDR with a Stirling engine has a very low water usage whereas the PTC with
steam turbine has a high usage.
The Heliostat field collectors and PDR are highly favoured for both the Mojave Desert and
Southern Spain. In the Mojave Desert the volumetric air receiver power tower is strongly
favoured at 14.2%, with the PDR a close second at 13.9%. A similar result profile is found
for southern Spain except with regard to the PTC which is less favoured than in the Mojave
Desert.

22
Fig 3a-d: Final results from the AHP study showing each solar thermal collector’s percentage preference for Gujarat (a), Southern Spain (b), Mojave Desert (c) and the
Sahara Desert (d).
PTC with Oil (8.7%)
PTC with DSG (6.9%)
HFC with Molten Salt (12.9%)
HFC with Water (12.4%)
HFC with Air (14.2%)
CLFR (8.3%)
LFR (8.3%)
PDR (13.9%)
CPC with Fresnel Lens (9.5%)
CPC (7.9%)
Mojave Desert(c)
PTC with Oil (5.9%)
PTC with DSG (7.2%)
HFC with Molten Salt (11.8%)
HFC with Water (10.8%)
HFC with Air (12.7%)
CLFR (8.5%)
LFR (9.3%)
PDR (13.5%)
CPC with Fresnel Lens (9.6%)
CPC (10.5%)
Sahara Desert(d)
PTC with Oil (6.2%)
PTC with DSG (7.5%)
HFC with Molten Salt (11.8%)
HFC with Water (11.5%)
HFC with Air (13.4%)
CLFR (8.9%)
LFR (8.9%)
PDR (13.1%)
CPC with Fresnel Lens (8.9%)
CPC (9.8%)
Southern Spain(b)
PTC with Oil (9.7%)
PTC with DSG (8.2%)
HFC with Molten Salt (10.2%)
HFC with Water (9.7%)
HFC with Air (10.9%)
CLFR (11.5%)
LFR (10.8%)
PDR (11.1%)
CPC with Fresnel Lens (11.9%)
CPC (9.2%)
Gujarat(a)

On-Line A
Fig 4: S
alternativ
For Guj
in very
to inves
(collect
subtract
pair-wis
The eff
importa
ideal co
effect o
In contr
still had
Parabol
Annex
Sensitivity stu
ve.
jarat, which
close comp
stigate the
tor efficienc
ting 1 to th
se comparis
fect of decr
ance of the
onversion e
of increasing
rast, increas
d a substant
Pa
lic Trough Collec
Heliostat
He
H
C
Compound Parab
udy for Guja
h was the m
parisons am
significance
cy, ideal co
he experts sc
son matrix.
reasing the
maintenan
efficiency an
g the percen
sing the we
tial effect on
arabolic Trough C
ctor with Direct S
Field Collector w
eliostat Field Coll
Heliostat Field Co
Compact Linear F
Linear F
Parabolic
bolic Collector w
Compound Pa
arat showing
main focus of
ong alternat
e of the dif
nversion ef
coring for e
top three w
nce costs, la
nd capital c
ntage prefer
eighting of t
n the result
Collector with Oil
Steam Generation
with Molten Salt (
lector with Water
ollector with Air (
resnel Reflector (
resnel Reflector (
c Dish Reflector (
ith Fresnel Lens (
arabolic Collector
Gujar
the potentia
f this paper
tives. There
fferences (s
fficiency, an
each one, th
weighted c
and usage,
cost moved
rence of the
the top thre
ts. With the
l (9.7%)
n (8.2%)
(10.2%)
r (9.7%)
(10.9%)
(11.5%)
(10.8%)
(11.1%)
(11.9%)
r (9.2%)
rat sensitivity
al range of th
r, it was note
efore a sens
see Fig 4).
nd capital c
hus altering
riteria re-or
and reliabi
d down the
Fresnel len
ee criteria d
ideal conv
y study
he percentage
ed that the A
itivity analy
The three t
cost) were v
the weight
rdered the
ility increas
weighting o
ns-CPC to 1
did not chan
ersion effic
ge preference
AHP study
ysis was car
top-ranking
varied by ad
ting given f
criteria so
ses; meanw
order. This
2.9%.
nge the orde
ciency and c
1
for each
resulted
rried out
g criteria
dding or
from the
that the
while the
has the
er, but it
collector

2 On-Line Annex
efficiency weighting increased, the more technically efficient PTC became favoured against
technologies like the linear Fresnel lens-CPC and CLFR.
5. Discussion
The variation in the results among the four regions merits further discussion about each
technology. Aspects of how the study was conducted may have influenced the outcomes and
it is therefore worth reviewing what has been learnt about the process in order to guide future
studies of this kind
The PTC, despite being the most widely adopted technology, is not especially strong against
any of the criteria used in this study. On the other hand, the very fact that the PTC is well
established could distort the results, because the data and opinions about them are the
consequence of many years of operational experience; whereas for other technologies the
information available sometimes has to be based on prototypes or theoretical estimates aimed
at promoting the technology. Comparisons based on expected values stated for newer or yet-
to-be-implemented systems have to be judged carefully.
The PDR fares very favourably in all four case studies. With the highest weightings for all
four case studies given to the ideal conversion efficiency and collector efficiency, the PDR
immediately gains an advantage with its greater operational efficiencies in comparison with
the other technologies. Power towers have been pioneered in both Spain and California;
however, the volumetric air receiver is a technology that has not been used as much as other
types of receivers. Again this suggests that the model is biased towards operational
capabilities rather than reliability and market establishment. While there is danger of making

3 On-Line Annex
over-optimistic assumptions about future technological advancements, it is also important not
to model a scenario that will only ever produce well established existing technologies as the
answer, as this might result in technology choices that are too conservative.
The variability in the results for the different regions is attributed primarily to the importance
given to the cost criterion for India, with the cheaper technologies, Fresnel lens-CPC and
CLFR, ranking highest in the final group order. The larger commercial-scale technologies
being more suitable for the economically developed countries of Europe and America, with
the HFC ranked first. The water usage in the Sahara desert, governing that the PDR, which
uses the smallest amount, ranked top. As a whole, greater confidence may be given to the
AHP results for Gujarat than for the other 3 regions due to the make-up of the expert panel.
The number of experts consulted in this study was 10. With a panel of different size or make-
up, the outcomes may have been different. This type of uncertainty applies to all AHP or
similar decision-making processes. While no literature is known that defines the exact
number of experts to consult, taking into account a greater amount of expert opinion will
benefit the process. However, a larger panel will make workshop facilitation and resolution
of conflicts more difficult. In practice, experience indicates that limiting the panel size
stimulates participation and contribution, leading the group to a consensus [59]. Moreover,
once an overall result has been produced the whole process can be examined and refined with
further opinion taken into account.
The AHP process does suffer from several other known drawbacks: subjectivity can never be
reduced to zero and the AHP does not necessarily highlight poor judgements [60, 61]. In
addition, the AHP cannot guarantee the independence of the results with regard to the

4 On-Line Annex
inclusion of an irrelevant alternative. An ideal decision-making process should be unaffected
by such alternatives; however in practice this is often violated in AHP [62]. The consequence
for this study is that the pre-selection process, whereby the experts were not presented with
all possible technologies but a shortlist based on the judgement of the authors, may in
principle have affected the outcome. We note however that even the weakest technology
considered (the CPC without Fresnel lens, which ranked very poorly against certain criteria)
did not rank poorly against all criteria; therefore there was no irrelevant alternative as such.
Nevertheless, the fact that this technology is unlikely to be considered a viable choice by any
expert leads the authors to believe that it would be better to exclude it from any re-run of this
study.
Another area of improvement relates to the choice of criteria. Although the expert panel
declined to change the criteria or alternatives chosen when given the opportunity to do so, the
authors consider that inclusion of ‘market establishment’ or ‘internal rates of return’ as
explicit criteria would be an improvement to the model.
Despite the several well-researched challenges facing the AHP, it remains the most popular
among MCDM techniques. The review by Pohekar and Ramachandran, of MCDM
techniques applied to sustainable energy planning, demonstrates how AHP is favoured over
other MCDM methods based on the numbers of publications in each field. These methods
include Preference Ranking Organization Method for Enrichment Evaluation
(PROMETHEE), the Elimination and Choice Translating Reality (ELECTRE), Multi-
Attribute Utility Theory (MAUT) and several other methods [10]. Wallenius et al. provide
evidence through publication history, that research via the use of the AHP is greater than that
of other MCDM techniques and other decision-making methods such as Multi-Objective

5 On-Line Annex
Decision-Making (MODM). Between 2000 and 2004 there were nearly 450 publications
relating to the AHP, MAUT had only 250. The use of MODM methods demonstrated
considerable growth through Evolutionary Multi-objective Optimization (EMO) with 330
publications. Other MODM methods such as Goal Programming and Math Programming had
substantially fewer with less than 250 and 150 publications respectively [63]. This trend in
publication history indicates a significant preference towards AHP over other decision-
making models. These different decision-making techniques are not necessarily in
competition with each other, and integration of methods could be complementary as it would
remove any shortcomings associated with each one. An integrated Goal Programming – AHP
model has been recommended, particularly in the field of energy where quantitative and
qualitative criteria are incorporated into the analysis [13]. Further work on the integration of
MCDM and MODM techniques would be the next logical step for their application in the
field of solar energy.
On a final note, it is worth observing that the results of the study may also be used to infer
how much more people may be willing to pay for improvements in certain criteria. This can
be obtained from the AHP weighting vectors, and the characteristic table of values, for the
different alternatives. For example, the attributes and weightings for the LFR and PTC can be
used to determine the value, in terms of the capital cost, for an improvement in the ideal
conversion efficiency and concentration ratio. A swing from 36-63% for the LFR to the PTC
is seen for the ideal conversion efficiency, implying a value of 224 $/m2 for this increase, as
these two criteria received equal weighting from the panel. However the value (in capital
cost) for an improvement in the concentration ratio is worth less as seen from the different
weightings given. With the capital cost receiving nearly twice the weight given to the
concentration ratio, the increase in concentration ratio from the LFR to the PTC is worth only
6 On-Line Annex
131 $/m2. In a future study these findings could be confirmed with the help of a separate
questionnaire designed explicitly to enquire about the monetary values placed by the experts
on such technical improvements.
6. Conclusion
The AHP study indicates that the preferred solar collector for the case of Gujarat in north-
west India is the linear Fresnel lens with CPC-type secondary. After the sensitivity analysis,
in which criteria weightings were varied to reflect likely uncertainties in the selection
process, the preferred technologies emerging are either the Fresnel lens-CPC or the parabolic
dish reflector. For the other cases of southern Spain and the Mojave Desert in California, the
study indicates the parabolic dish reflector; and for the Sahara Desert it indicates the heliostat
field collector with the air receiver.
These finding are unexpected in that these are not the technologies used mostly to date. In
particular, Fresnel lenses have hardly been used for solar thermal power, though they are used
for photovoltaic solar power. Nevertheless, this could be for historical reasons. Their
potential low cost and high reliability makes Fresnel lenses worthy of further investigation
and development which may be the subject of further work. It is our recommendation that the
Fresnel lens-CPC and the PDR are pursued in the context of the current project in Gujarat
following this study.

7 On-Line Annex
7. ANNEXES
Annex 1: Thermodynamic Analysis
The thermodynamic analysis of solar collectors for an idealised system is presented to
compare the achievable efficiency of different collectors based on consistent assumptions.
The calculations provide numerical values for the ideal conversion efficiency, and collector
efficiency criteria. Similar approaches have been used before, and further detailed analysis of
the entropy and non-isothermal properties of the system can be found elsewhere [18].
For a collector of aperture area Aa receiving irradiance, q* (W/m2), the solar radiation rate Q*
(W) is given by,
aAqQ ** 1
For a concentrating system, the optical efficiency is defined as the ratio of the energy
absorbed by the receiver to the energy incident on the collector aperture. The optical
efficiency takes into account tracking accuracy error, and optical errors, which includes the
optical properties of the receiver, and the mirror’s reflectance. With the optical efficiency 0 ,
the radiation falling on the receiver can be found.
** 00 qq 2
The power delivered via heat transfer, Q, is a function of the net solar radiation rate minus the
ambient heat loss at the receiver, Q0.

8
0* QQQ 3
)( 00 TTAUQ rrr 4
Where Ur is the overall heat transfer coefficient, Ar the area of the receiver, Tr the
temperature of the receiver and T0 the ambient temperature.
The collector efficiency, c can therefore be calculated as,
a
rrrac Aq
TTAUAq
Q
Q
*
)(*
* 0
00
5
A parameter often quoted for solar thermal collectors is the concentration ratio, C, which is
the area of the collector aperture divided by that of the receiver.
r
a
A
AC 6
Another factor that can be deduced is the stagnation temperature Tr,max, which occurs when
all the incoming solar radiation is lost to ambient heat loss. This can be measured by stopping
the fluid running through the receiver pipes and noting the maximum temperature reached.
00
max, *1
TAU
Q
T
T
rr
r 7
Therefore from these equations the overall heat transfer coefficient can be calculated

9
rr U
CqTT
*00max,
0max,
0 *
TT
CqU
rr
8
The maximum possible efficiency of the system can also be estimated based on the Carnot
cycle.
rCarnot T
T01 9
The multiplication of the optical and Carnot cycle efficiencies represents the ideal conversion
efficiencies of the collector system.
0 Carnottot 10
The theoretical overall efficiency of the system assuming conditions for an isothermal
collector can also be calculated.
CarnotcOverall 0 11
It can therefore be concluded that for any ideal receiver, operating at a known concentration
ratio, the optimum receiver temperature is [18, 26].
0max,, TTT roptr 12

10
Annex 2: Example Calculations
The criteria for the AHP are derived from the functional requirements and product
characteristics. From the literature review, the technological alternatives relating to solar
collectors have been assessed in terms of their technical, sustainable, and financial viability,
to develop a series of sub problems to be analysed.
Table 2.1
Sub criteria selected for the AHP study.
TECHNICAL Efficiency Ideal Conversion Efficiency Collector Efficiency Concentration Ratio Half Acceptance Angle Parasitic load Compatibility with working fluid
Pressure Tolerance
Temperature Tolerance
Chemical Compatibility of Heat Transfer Medium
Reliability Environmental Resistance
Availability Use of standard technologies or parts
FINANCIAL Affordability Capital cost Total M&O cost
SUSTAINABLITY Resource usage Land usage
Tolerance of slope
Water usage Scalability Efficiency at different scales

11
The following solar technologies have been selected as the possible solution alternatives
based on the review.
Table 2.2
List of the solar technology alternatives used in the AHP study.
Solar Technology Alternatives Acronym
Parabolic Trough using Synthetic Oil PTC ‐ oil
Parabolic Trough with Direct Steam Generation PTC ‐ dsg
Heliostat Field Collector with a Water/Steam Receiver HFC ‐ H20
Heliostat Field Collector with a Molten Salt Receiver HFC ‐ salt
Heliostat Field Collector with a Volumetric Air Receiver HFC ‐ air
Compact Linear Fresnel Reflector CLFR
Linear Fresnel Reflector LFR
Parabolic Dish Reflector PDR
Compound Parabolic Collector CPC
Fresnel Lens with a Secondary Compound Parabolic Collector CPC ‐ fl
By way of example, the method for the AHP analysis is now discussed and partially
demonstrated for the chemical compatibility criteria.
An order of preference for each criterion is first established, and a decision hierarchy tree is
developed. Data obtained on each collector is used to determine the favoured order for the
decision tree and judgment or expert opinion is used where data is unavailable.
Chemical Compatibility
HFC ‐ Air
PDR
HFC ‐ Molten Salt
HFC ‐ Water/Steam
CPC
CPC ‐ Fresnel Lens

12
Fig.5. The Decision Hierarchy Tree for sub criteria chemical compatibility.
To establish how much a certain collector is favoured over another for a given criterion,
priorities are ascertained to develop the Pairwise Comparison Matrix. Judgment of preference
is selected on a scale of 1 to 9.
Table 2.3
Pairwise comparison scale values for the level of preference to be used in the pairwise comparison matrix.
Pairwise Comparison Scale
Verbal Judgment of Preference Numerical Rating Extremely Preferred 9
Very strong to extremely 8
Very strongly preferred 7
Strongly to very strongly 6
Strongly preferred 5
Moderately to strongly 4
Moderately preferred 3
Equally to moderately 2
Equally preferred 1
The Pairwise Comparison Matrix is a mathematical process which orders the decision tree
into a matrix for the comparison scale to be applied.
Table 2.4
CLFR
LFR
PTC ‐ DSG
PTC‐Oil

13
Pairwise comparison matrix showing how preferred each alternative is in terms of their chemical compatibility.
HFC‐air PDR HFC‐salt HFC‐H20 CPC CPC‐fl CLFR LFR PTC‐dsg PTC‐oil
HFC‐air 1 1 2 3 3 3 3 3 5 5
PDR 1.00 1 2 3 3 3 3 3 5 5
HFC‐salt 0.50 0.50 1 2 2 2 2 2 4 4
HFC‐H20 0.33 0.33 0.50 1 1 1 1 1 3 3
CPC 0.33 0.33 0.50 1.00 1 1 1 1 3 3
CPC‐fl 0.33 0.33 0.50 1.00 1.00 1 1 1 3 3
CLFR 0.33 0.33 0.50 1.00 1.00 1.00 1 1 3 3
LFR 0.33 0.33 0.50 1.00 1.00 1.00 1.00 1 3 3
PTC‐dsg 0.20 0.20 0.25 0.33 0.33 0.33 0.33 0.33 1 1
PTC‐oil 0.20 0.20 0.25 0.33 0.33 0.33 0.33 0.33 1.00 1
Total 4.57 4.57 8.00 13.67 13.67 13.67 13.67 13.67 31.00 31.00
A Priority Vector for each collector in terms of capital cost is then calculated by dividing
each cell by the total column value and averaging the row.
Table 2.5
Priority vectors of each alternative for the chemical compatibility.
HFC‐air PDR HFC‐salt HFC‐H20 CPC CPC‐fl CLFR LFR PTC‐dsg PTC‐oil Priority Vector
HFC‐air 0.22 0.22 0.25 0.22 0.22 0.22 0.22 0.22 0.16 0.16 0.211
PDR 0.22 0.22 0.25 0.22 0.22 0.22 0.22 0.22 0.16 0.16 0.211
HFC‐salt 0.11 0.11 0.13 0.15 0.15 0.15 0.15 0.15 0.13 0.13 0.133
HFC‐H20 0.07 0.07 0.06 0.07 0.07 0.07 0.07 0.07 0.10 0.10 0.077
CPC 0.07 0.07 0.06 0.07 0.07 0.07 0.07 0.07 0.10 0.10 0.077
CPC‐fl 0.07 0.07 0.06 0.07 0.07 0.07 0.07 0.07 0.10 0.10 0.077
CLFR 0.07 0.07 0.06 0.07 0.07 0.07 0.07 0.07 0.10 0.10 0.077
LFR 0.07 0.07 0.06 0.07 0.07 0.07 0.07 0.07 0.10 0.10 0.077
PTC‐dsg 0.04 0.04 0.03 0.02 0.02 0.02 0.02 0.02 0.03 0.03 0.031
PTC‐oil 0.04 0.04 0.03 0.02 0.02 0.02 0.02 0.02 0.03 0.03 0.031
Total 1.00 1.00 1.00 1.00 1.00 1.00 1.00 1.00 1.00 1.00
This process is repeated till a priority vector for each alternative is developed for every
criterion. Thus giving the preference of each alternative for ever criteria, however the
importance of each criterion in relation to the other criteria is not specified. Therefore the
same process is applied to develop a weighting vector for each criterion with a priority order

14
and judgment of preference scale used again for a final pairwise comparison matrix. The final
overall value for how much each technology is preferred, is calculated by multiplying each
priority vector by its corresponding criterion’s weighting vector and totalling the values for
the corresponding technology. These weightings will however be very dependent upon the
location intended for the implementation of a solar thermal system.
A consistency check can also be carried out on the pairwise matrix to access the reliability of
process. The measure of consistency is expressed using the consistency ratio CR, which is
calculated from the consistency index CI and random consistency index RI following Saaty.
If the consistency ratio is smaller than or equal to 10% then the inconsistency is acceptable.
The consistency index is given by:
1max
n
nCI
13
Where λmax is the sum of the priority vectors multiplied by the corresponding totalled value of
the pairwise matrix column, and n is the size of the matrix.
Table 2.6
Calculation of λmax for the chemical compatibility sub criteria
λmax 0.96
0.96
1.07
1.05
1.05
1.05
1.05
1.05
0.95

15
0.95
Total 10.13
The consistency index can therefore be calculated as 0.14. From standard tables, the random
consistency index is 1.45 for n =9. The consistency ratio can now be calculated.
RI
CICR 14
Therefore we have acceptable consistency of 0.097 or 9.7% in this case.
Annex 3: Full pairwise Comparison of Alternatives for Every Criterion Table 3.1 Full pairwise comparison matrix for the development of the priority vectors Pairwise comparison matrix showing preferences for the collectors in terms of Ideal Conversion Efficiency PDR HFC‐air HFC‐H20 HFC‐salt PTC‐dsg PTC‐oil CLFR LFR CPC‐fl CPC Priority Vector
PDR 0.30 0.36 0.32 0.32 0.32 0.27 0.21 0.19 0.19 0.17 0.266
HFC‐air 0.15 0.18 0.21 0.21 0.21 0.20 0.18 0.16 0.16 0.15 0.183
HFC‐H20 0.10 0.09 0.11 0.11 0.11 0.13 0.14 0.14 0.14 0.13 0.119
HFC‐salt 0.10 0.09 0.11 0.11 0.11 0.13 0.14 0.14 0.14 0.13 0.119
PTC‐dsg 0.10 0.09 0.11 0.11 0.11 0.13 0.14 0.14 0.14 0.13 0.119
PTC‐oil 0.08 0.06 0.05 0.05 0.05 0.07 0.11 0.11 0.11 0.11 0.080
CLFR 0.05 0.04 0.03 0.03 0.03 0.02 0.04 0.05 0.05 0.07 0.040
LFR 0.04 0.03 0.02 0.02 0.02 0.02 0.02 0.03 0.03 0.04 0.027
CPC‐fl 0.04 0.03 0.02 0.02 0.02 0.02 0.02 0.03 0.03 0.04 0.027
CPC 0.04 0.03 0.02 0.02 0.02 0.01 0.01 0.01 0.01 0.02 0.019
Total 1.00 1.00 1.00 1.00 1.00 1.00 1.00 1.00 1.00 1.00 Pairwise comparison matrix showing preferences for the collectors in terms of Concentration Ratio
PDR HFC‐H20 HFC‐salt HFC‐air PTC‐dsg PTC‐oil CLFR LFR CPC‐fl CPC Priority Vector
PDR 0.22 0.22 0.22 0.24 0.22 0.22 0.20 0.20 0.18 0.14 0.209
HFC‐H20 0.22 0.22 0.22 0.24 0.22 0.22 0.20 0.20 0.18 0.14 0.209
HFC‐salt 0.22 0.22 0.22 0.24 0.22 0.22 0.20 0.20 0.18 0.14 0.209
HFC‐air 0.11 0.11 0.11 0.12 0.18 0.18 0.17 0.17 0.16 0.14 0.145
PTC‐dsg 0.04 0.04 0.04 0.03 0.04 0.04 0.07 0.07 0.08 0.10 0.056
PTC‐oil 0.04 0.04 0.04 0.03 0.04 0.04 0.07 0.07 0.08 0.10 0.056
CLFR 0.04 0.04 0.04 0.02 0.02 0.02 0.03 0.03 0.05 0.08 0.038
LFR 0.04 0.04 0.04 0.02 0.02 0.02 0.03 0.03 0.05 0.08 0.038
16
CPC‐fl 0.03 0.03 0.03 0.02 0.01 0.01 0.02 0.02 0.03 0.06 0.027
CPC 0.02 0.02 0.02 0.01 0.01 0.01 0.01 0.01 0.01 0.02 0.014
Total 1.00 1.00 1.00 1.00 1.00 1.00 1.00 1.00 1.00 1.00 Pairwise comparison matrix showing preferences for the collectors in terms of Collector Efficiency
HFC‐air HFC‐H20 HFC‐salt PDR PTC‐dsg PTC‐oil CLFR LFR CPC‐fl CPC Priority Vector
HFC‐air 0.21 0.21 0.21 0.23 0.21 0.21 0.17 0.17 0.17 0.17 0.196
HFC‐H20 0.21 0.21 0.21 0.23 0.21 0.21 0.17 0.17 0.17 0.17 0.196
HFC‐salt 0.21 0.21 0.21 0.23 0.21 0.21 0.17 0.17 0.17 0.17 0.196
PDR 0.10 0.10 0.10 0.11 0.14 0.14 0.14 0.14 0.14 0.14 0.128
PTC‐dsg 0.07 0.07 0.07 0.06 0.07 0.07 0.11 0.11 0.11 0.11 0.086
PTC‐oil 0.07 0.07 0.07 0.06 0.07 0.07 0.11 0.11 0.11 0.11 0.086
CLFR 0.03 0.03 0.03 0.02 0.02 0.02 0.03 0.03 0.03 0.03 0.028
LFR 0.03 0.03 0.03 0.02 0.02 0.02 0.03 0.03 0.03 0.03 0.028
CPC‐fl 0.03 0.03 0.03 0.02 0.02 0.02 0.03 0.03 0.03 0.03 0.028
CPC 0.03 0.03 0.03 0.02 0.02 0.02 0.03 0.03 0.03 0.03 0.028
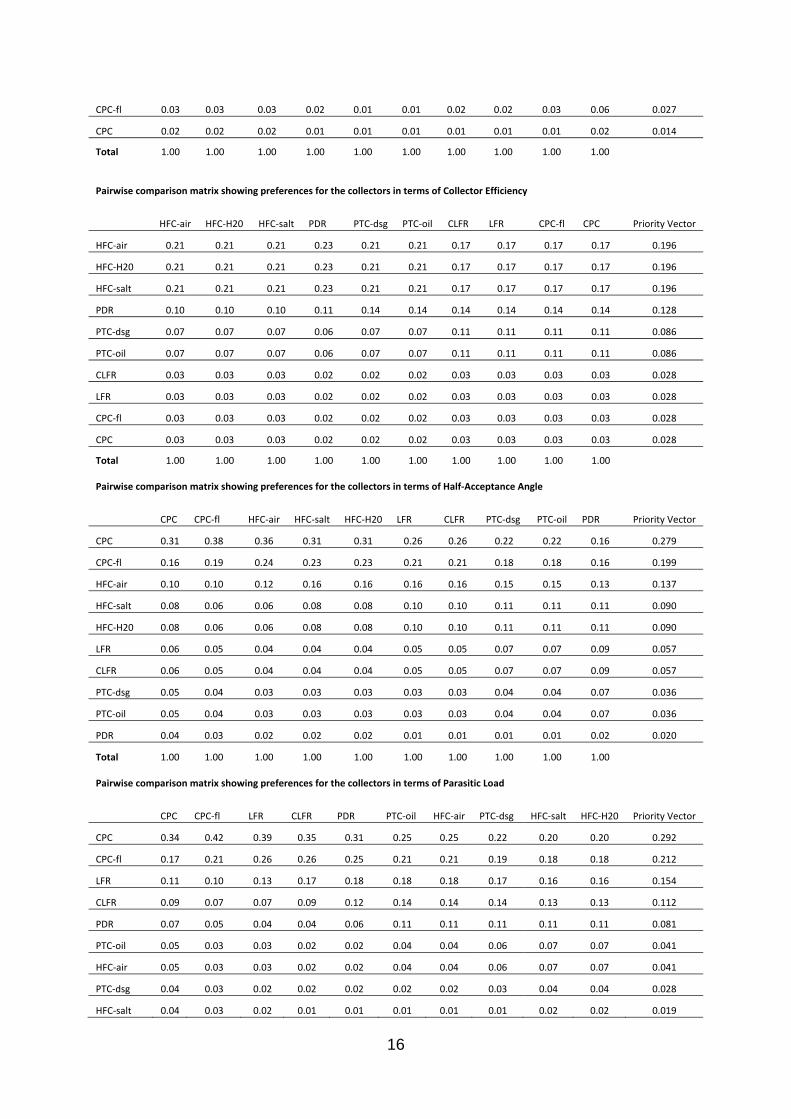
Total 1.00 1.00 1.00 1.00 1.00 1.00 1.00 1.00 1.00 1.00 Pairwise comparison matrix showing preferences for the collectors in terms of Half‐Acceptance Angle
CPC CPC‐fl HFC‐air HFC‐salt HFC‐H20 LFR CLFR PTC‐dsg PTC‐oil PDR Priority Vector
CPC 0.31 0.38 0.36 0.31 0.31 0.26 0.26 0.22 0.22 0.16 0.279
CPC‐fl 0.16 0.19 0.24 0.23 0.23 0.21 0.21 0.18 0.18 0.16 0.199
HFC‐air 0.10 0.10 0.12 0.16 0.16 0.16 0.16 0.15 0.15 0.13 0.137
HFC‐salt 0.08 0.06 0.06 0.08 0.08 0.10 0.10 0.11 0.11 0.11 0.090
HFC‐H20 0.08 0.06 0.06 0.08 0.08 0.10 0.10 0.11 0.11 0.11 0.090
LFR 0.06 0.05 0.04 0.04 0.04 0.05 0.05 0.07 0.07 0.09 0.057
CLFR 0.06 0.05 0.04 0.04 0.04 0.05 0.05 0.07 0.07 0.09 0.057
PTC‐dsg 0.05 0.04 0.03 0.03 0.03 0.03 0.03 0.04 0.04 0.07 0.036
PTC‐oil 0.05 0.04 0.03 0.03 0.03 0.03 0.03 0.04 0.04 0.07 0.036
PDR 0.04 0.03 0.02 0.02 0.02 0.01 0.01 0.01 0.01 0.02 0.020
Total 1.00 1.00 1.00 1.00 1.00 1.00 1.00 1.00 1.00 1.00 Pairwise comparison matrix showing preferences for the collectors in terms of Parasitic Load
CPC CPC‐fl LFR CLFR PDR PTC‐oil HFC‐air PTC‐dsg HFC‐salt HFC‐H20 Priority Vector
CPC 0.34 0.42 0.39 0.35 0.31 0.25 0.25 0.22 0.20 0.20 0.292
CPC‐fl 0.17 0.21 0.26 0.26 0.25 0.21 0.21 0.19 0.18 0.18 0.212
LFR 0.11 0.10 0.13 0.17 0.18 0.18 0.18 0.17 0.16 0.16 0.154
CLFR 0.09 0.07 0.07 0.09 0.12 0.14 0.14 0.14 0.13 0.13 0.112
PDR 0.07 0.05 0.04 0.04 0.06 0.11 0.11 0.11 0.11 0.11 0.081
PTC‐oil 0.05 0.03 0.03 0.02 0.02 0.04 0.04 0.06 0.07 0.07 0.041
HFC‐air 0.05 0.03 0.03 0.02 0.02 0.04 0.04 0.06 0.07 0.07 0.041
PTC‐dsg 0.04 0.03 0.02 0.02 0.02 0.02 0.02 0.03 0.04 0.04 0.028
HFC‐salt 0.04 0.03 0.02 0.01 0.01 0.01 0.01 0.01 0.02 0.02 0.019

17
HFC‐H20 0.04 0.03 0.02 0.01 0.01 0.01 0.01 0.01 0.02 0.02 0.019
Total 1.00 1.00 1.00 1.00 1.00 1.00 1.00 1.00 1.00 1.00 Pairwise comparison matrix showing preferences for the collectors in terms of Pressure Tolerance
CPC HFC‐air PDR LFR CLFR HFC‐salt HFC‐H20 CPC‐fl PTC‐oil PTC‐dsg Priority Vector
CPC 0.19 0.19 0.19 0.20 0.20 0.19 0.19 0.17 0.15 0.15 0.181
HFC‐air 0.19 0.19 0.19 0.20 0.20 0.19 0.19 0.17 0.15 0.15 0.181
PDR 0.19 0.19 0.19 0.20 0.20 0.19 0.19 0.17 0.15 0.15 0.181
LFR 0.09 0.09 0.09 0.10 0.10 0.12 0.12 0.13 0.12 0.12 0.110
CLFR 0.09 0.09 0.09 0.10 0.10 0.12 0.12 0.13 0.12 0.12 0.110
HFC‐salt 0.06 0.06 0.06 0.05 0.05 0.06 0.06 0.08 0.09 0.09 0.068
HFC‐H20 0.06 0.06 0.06 0.05 0.05 0.06 0.06 0.08 0.09 0.09 0.068
CPC‐fl 0.05 0.05 0.05 0.03 0.03 0.03 0.03 0.04 0.06 0.06 0.043
PTC‐oil 0.04 0.04 0.04 0.03 0.03 0.02 0.02 0.02 0.03 0.03 0.029
PTC‐dsg 0.04 0.04 0.04 0.03 0.03 0.02 0.02 0.02 0.03 0.03 0.029
Total 1.00 1.00 1.00 1.00 1.00 1.00 1.00 1.00 1.00 1.00 Pairwise comparison matrix showing preferences for the collectors in terms of Temperature Tolerance
PDR HFC‐air HFC‐salt HFC‐H20 PTC‐dsg PTC‐oil CLFR LFR CPC‐fl CPC Priority Vector
PDR 0.25 0.26 0.30 0.22 0.25 0.21 0.20 0.20 0.16 0.15 0.218
HFC‐air 0.25 0.26 0.30 0.32 0.25 0.21 0.20 0.20 0.16 0.15 0.229
HFC‐salt 0.12 0.13 0.15 0.22 0.19 0.17 0.16 0.16 0.14 0.13 0.157
HFC‐H20 0.12 0.09 0.07 0.11 0.19 0.17 0.16 0.16 0.14 0.13 0.134
PTC‐dsg 0.06 0.06 0.05 0.04 0.06 0.13 0.13 0.13 0.12 0.11 0.089
PTC‐oil 0.05 0.05 0.04 0.03 0.02 0.04 0.07 0.07 0.12 0.11 0.059
CLFR 0.04 0.04 0.03 0.02 0.02 0.02 0.03 0.03 0.07 0.08 0.039
LFR 0.04 0.04 0.03 0.02 0.02 0.02 0.03 0.03 0.07 0.08 0.039
CPC‐fl 0.04 0.04 0.02 0.02 0.01 0.01 0.01 0.01 0.02 0.05 0.023
CPC 0.03 0.03 0.02 0.01 0.01 0.01 0.01 0.01 0.01 0.02 0.014
Total 1.00 1.00 1.00 1.00 1.00 1.00 1.00 1.00 1.00 1.00 Pairwise comparison matrix showing preferences for the collectors in terms of Chemical Compatibility
HFC‐air PDR HFC‐salt HFC‐H20 CPC CPC‐fl CLFR LFR PTC‐dsg PTC‐oil Priority Vector
HFC‐air 0.22 0.22 0.25 0.22 0.22 0.22 0.22 0.22 0.16 0.16 0.211
PDR 0.22 0.22 0.25 0.22 0.22 0.22 0.22 0.22 0.16 0.16 0.211
HFC‐salt 0.11 0.11 0.13 0.15 0.15 0.15 0.15 0.15 0.13 0.13 0.133
HFC‐H20 0.07 0.07 0.06 0.07 0.07 0.07 0.07 0.07 0.10 0.10 0.077
CPC 0.07 0.07 0.06 0.07 0.07 0.07 0.07 0.07 0.10 0.10 0.077
CPC‐fl 0.07 0.07 0.06 0.07 0.07 0.07 0.07 0.07 0.10 0.10 0.077
CLFR 0.07 0.07 0.06 0.07 0.07 0.07 0.07 0.07 0.10 0.10 0.077
LFR 0.07 0.07 0.06 0.07 0.07 0.07 0.07 0.07 0.10 0.10 0.077
PTC‐dsg 0.04 0.04 0.03 0.02 0.02 0.02 0.02 0.02 0.03 0.03 0.031
PTC‐oil 0.04 0.04 0.03 0.02 0.02 0.02 0.02 0.02 0.03 0.03 0.031

18
Total 1.00 1.00 1.00 1.00 1.00 1.00 1.00 1.00 1.00 1.00 Pairwise comparison matrix showing preferences for the collectors in terms of Reliability
CPC‐fl LFR CLFR HFC‐H20 HFC‐salt HFC‐air PDR CPC PTC‐dsg PTC‐oil Priority Vector
CPC‐fl 0.38 0.50 0.50 0.35 0.35 0.29 0.25 0.25 0.25 0.25 0.337
LFR 0.09 0.12 0.12 0.18 0.18 0.17 0.16 0.16 0.16 0.16 0.149
CLFR 0.09 0.12 0.12 0.18 0.18 0.17 0.16 0.16 0.16 0.16 0.149
HFC‐H20 0.09 0.06 0.06 0.09 0.09 0.13 0.13 0.13 0.13 0.13 0.102
HFC‐salt 0.09 0.06 0.06 0.09 0.09 0.13 0.13 0.13 0.13 0.13 0.102
HFC‐air 0.05 0.03 0.03 0.03 0.03 0.04 0.06 0.06 0.06 0.06 0.047
PDR 0.05 0.02 0.02 0.02 0.02 0.02 0.03 0.03 0.03 0.03 0.029
CPC 0.05 0.02 0.02 0.02 0.02 0.02 0.03 0.03 0.03 0.03 0.029
PTC‐dsg 0.05 0.02 0.02 0.02 0.02 0.02 0.03 0.03 0.03 0.03 0.029
PTC‐oil 0.05 0.02 0.02 0.02 0.02 0.02 0.03 0.03 0.03 0.03 0.029
Total 1.00 1.00 1.00 1.00 1.00 1.00 1.00 1.00 1.00 1.00 Pairwise comparison matrix showing preferences for the collectors in terms of Use of Standard Technologies
CLFR LFR CPC CPC‐fl HFC‐H20 PTC‐dsg HFC‐salt PTC‐oil HFC‐air PDR Priority Vector
CLFR 0.20 0.20 0.20 0.22 0.21 0.21 0.19 0.19 0.16 0.15 0.193
LFR 0.20 0.20 0.20 0.22 0.21 0.21 0.19 0.19 0.16 0.15 0.193
CPC 0.20 0.20 0.20 0.22 0.21 0.21 0.19 0.19 0.16 0.15 0.193
CPC‐fl 0.10 0.10 0.10 0.11 0.14 0.14 0.14 0.14 0.14 0.13 0.124
HFC‐H20 0.07 0.07 0.07 0.06 0.07 0.07 0.09 0.09 0.11 0.11 0.081
PTC‐dsg 0.07 0.07 0.07 0.06 0.07 0.07 0.09 0.09 0.11 0.11 0.081
HFC‐salt 0.05 0.05 0.05 0.04 0.03 0.03 0.05 0.05 0.07 0.08 0.050
PTC‐oil 0.05 0.05 0.05 0.04 0.03 0.03 0.05 0.05 0.07 0.06 0.048
HFC‐air 0.03 0.03 0.03 0.02 0.01 0.01 0.02 0.02 0.02 0.05 0.024
PDR 0.02 0.02 0.02 0.01 0.01 0.01 0.01 0.01 0.01 0.02 0.015
Total 1.00 1.00 1.00 1.00 1.00 1.00 1.00 1.00 1.00 1.00 Pairwise comparison matrix showing preferences for the collectors in terms of Use of Capital Cost
LFR CPC CLFR CPC‐FL PTC‐dsg PTC‐oil HFC‐air HFC‐H20 HFC‐salt PDR Priority Vector
LFR 0.20 0.20 0.20 0.22 0.22 0.20 0.17 0.17 0.17 0.14 0.190
CPC 0.20 0.20 0.20 0.22 0.22 0.20 0.17 0.17 0.17 0.14 0.190
CLFR 0.20 0.20 0.20 0.22 0.22 0.20 0.17 0.17 0.17 0.14 0.190
CPC‐FL 0.10 0.10 0.10 0.11 0.11 0.13 0.14 0.14 0.14 0.13 0.121
PTC‐dsg 0.10 0.10 0.10 0.11 0.11 0.13 0.14 0.14 0.14 0.13 0.121
PTC‐oil 0.07 0.07 0.07 0.05 0.05 0.07 0.11 0.11 0.11 0.11 0.083
HFC‐air 0.03 0.03 0.03 0.02 0.02 0.02 0.03 0.03 0.03 0.06 0.031
HFC‐H20 0.03 0.03 0.03 0.02 0.02 0.02 0.03 0.03 0.03 0.06 0.031
HFC‐salt 0.03 0.03 0.03 0.02 0.02 0.02 0.03 0.03 0.03 0.06 0.031
PDR 0.02 0.02 0.02 0.01 0.01 0.01 0.01 0.01 0.01 0.02 0.014
Total 1.00 1.00 1.00 1.00 1.00 1.00 1.00 1.00 1.00 1.00

19
Pairwise comparison matrix showing preferences for the collectors in terms of Operational and Maintenance Costs
CPC‐fl LFR CLFR CPC PTC‐dsg PTC‐oil HFC‐air HFC‐H20 HFC‐salt PDR Priority Vector
CPC‐fl 0.23 0.23 0.26 0.26 0.24 0.21 0.19 0.19 0.19 0.15 0.216
LFR 0.23 0.23 0.26 0.26 0.24 0.21 0.19 0.19 0.19 0.15 0.216
CLFR 0.12 0.12 0.13 0.13 0.16 0.16 0.15 0.15 0.15 0.13 0.140
CPC 0.12 0.12 0.13 0.13 0.16 0.16 0.15 0.15 0.15 0.13 0.140
PTC‐dsg 0.08 0.08 0.06 0.06 0.08 0.11 0.11 0.11 0.11 0.12 0.093
PTC‐oil 0.06 0.06 0.04 0.04 0.04 0.05 0.08 0.08 0.08 0.10 0.062
HFC‐air 0.05 0.05 0.03 0.03 0.03 0.03 0.04 0.04 0.04 0.07 0.039
HFC‐H20 0.05 0.05 0.03 0.03 0.03 0.03 0.04 0.04 0.04 0.07 0.039
HFC‐salt 0.05 0.05 0.03 0.03 0.03 0.03 0.04 0.04 0.04 0.07 0.039
PDR 0.03 0.03 0.02 0.02 0.01 0.01 0.01 0.01 0.01 0.02 0.015
Total 1.00 1.00 1.00 1.00 1.00 1.00 1.00 1.00 1.00 1.00 Pairwise comparison matrix showing preferences for the collectors in terms of Land Usage
CLFR PTC‐dsg CPC‐fl LFR PTC‐oil HFC‐air HFC‐H20 HFC‐salt PDR CPC Priority Vector
CLFR 0.31 0.36 0.36 0.36 0.36 0.24 0.24 0.24 0.19 0.16 0.283
PTC‐dsg 0.10 0.12 0.12 0.12 0.12 0.15 0.15 0.15 0.13 0.13 0.128
CPC‐fl 0.10 0.12 0.12 0.12 0.12 0.15 0.15 0.15 0.13 0.13 0.128
LFR 0.10 0.12 0.12 0.12 0.12 0.15 0.15 0.15 0.13 0.13 0.128
PTC‐oil 0.10 0.12 0.12 0.12 0.12 0.15 0.15 0.15 0.13 0.13 0.128
HFC‐air 0.06 0.04 0.04 0.04 0.04 0.05 0.05 0.05 0.08 0.09 0.054
HFC‐H20 0.06 0.04 0.04 0.04 0.04 0.05 0.05 0.05 0.08 0.09 0.054
HFC‐salt 0.06 0.04 0.04 0.04 0.04 0.05 0.05 0.05 0.08 0.09 0.054
PDR 0.04 0.02 0.02 0.02 0.02 0.02 0.02 0.02 0.03 0.05 0.027
CPC 0.03 0.02 0.02 0.02 0.02 0.01 0.01 0.01 0.01 0.02 0.016
Total 1.00 1.00 1.00 1.00 1.00 1.00 1.00 1.00 1.00 1.00 Pairwise comparison matrix showing preferences for the collectors in terms of Tolerance of Slope
PDR HFC‐air HFC‐H20 HFC‐salt PTC‐oil PTC‐dsg CLFR LFR CPC CPC‐fl Priority Vector
PDR 0.19 0.19 0.19 0.19 0.19 0.19 0.19 0.19 0.19 0.19 0.192
HFC‐air 0.19 0.19 0.19 0.19 0.19 0.19 0.19 0.19 0.19 0.19 0.192
HFC‐H20 0.19 0.19 0.19 0.19 0.19 0.19 0.19 0.19 0.19 0.19 0.192
HFC‐salt 0.19 0.19 0.19 0.19 0.19 0.19 0.19 0.19 0.19 0.19 0.192
PTC‐oil 0.04 0.04 0.04 0.04 0.04 0.04 0.04 0.04 0.04 0.04 0.038
PTC‐dsg 0.04 0.04 0.04 0.04 0.04 0.04 0.04 0.04 0.04 0.04 0.038
CLFR 0.04 0.04 0.04 0.04 0.04 0.04 0.04 0.04 0.04 0.04 0.038
LFR 0.04 0.04 0.04 0.04 0.04 0.04 0.04 0.04 0.04 0.04 0.038
CPC 0.04 0.04 0.04 0.04 0.04 0.04 0.04 0.04 0.04 0.04 0.038
CPC‐fl 0.04 0.04 0.04 0.04 0.04 0.04 0.04 0.04 0.04 0.04 0.038
Total 1.00 1.00 1.00 1.00 1.00 1.00 1.00 1.00 1.00 1.00 Pairwise comparison matrix showing preferences for the collectors in terms of Water Usage

20
PDR CPC HFC‐air HFC‐salt CPC‐fl CLFR LFR HFC‐H20 PTC‐dsg PTC‐oil Priority Vector
PDR 0.30 0.36 0.33 0.33 0.27 0.27 0.27 0.18 0.18 0.18 0.269
CPC 0.15 0.18 0.22 0.22 0.20 0.20 0.20 0.16 0.16 0.16 0.185
HFC‐air 0.10 0.09 0.11 0.11 0.14 0.14 0.14 0.13 0.13 0.13 0.121
HFC‐salt 0.10 0.09 0.11 0.11 0.14 0.14 0.14 0.13 0.13 0.13 0.121
CPC‐fl 0.07 0.06 0.05 0.05 0.07 0.07 0.07 0.11 0.11 0.11 0.076
CLFR 0.07 0.06 0.05 0.05 0.07 0.07 0.07 0.11 0.11 0.11 0.076
LFR 0.07 0.06 0.05 0.05 0.07 0.07 0.07 0.11 0.11 0.11 0.076
HFC‐H20 0.04 0.03 0.02 0.02 0.02 0.02 0.02 0.03 0.03 0.03 0.025
PTC‐dsg 0.04 0.03 0.02 0.02 0.02 0.02 0.02 0.03 0.03 0.03 0.025
PTC‐oil 0.04 0.03 0.02 0.02 0.02 0.02 0.02 0.03 0.03 0.03 0.025
Total 1.00 1.00 1.00 1.00 1.00 1.00 1.00 1.00 1.00 1.00 Pairwise comparison matrix showing preferences for the collectors in terms of the Suitability to Operate at the Proposed Scale for Southern Spain (100MW)
PDR HFC‐air HFC‐salt HFC‐H20 PTC‐dsg PTC‐oil CLFR LFR CPC‐fl CPC Priority Vector
PDR 0.18 0.18 0.18 0.18 0.19 0.19 0.18 0.18 0.16 0.13 0.176
HFC‐air 0.18 0.18 0.18 0.18 0.19 0.19 0.18 0.18 0.16 0.13 0.176
HFC‐salt 0.18 0.18 0.18 0.18 0.19 0.19 0.18 0.18 0.16 0.13 0.176
HFC‐H20 0.18 0.18 0.18 0.18 0.19 0.19 0.18 0.18 0.16 0.13 0.176
PTC‐dsg 0.06 0.06 0.06 0.06 0.06 0.06 0.09 0.09 0.10 0.10 0.075
PTC‐oil 0.06 0.06 0.06 0.06 0.06 0.06 0.09 0.09 0.10 0.10 0.075
CLFR 0.05 0.05 0.05 0.05 0.03 0.03 0.04 0.04 0.06 0.09 0.049
LFR 0.05 0.05 0.05 0.05 0.03 0.03 0.04 0.04 0.06 0.09 0.049
CPC‐fl 0.04 0.04 0.04 0.04 0.02 0.02 0.02 0.02 0.03 0.07 0.034
CPC 0.02 0.02 0.02 0.02 0.01 0.01 0.01 0.01 0.01 0.01 0.014
Total 1.00 1.00 1.00 1.00 1.00 1.00 1.00 1.00 1.00 1.00 Pairwise comparison matrix showing preferences for the collectors in terms of the Suitability to Operate at the Proposed Scale for India (1MW)
CLFR LFR CPC‐fl PDR PTC‐dsg PTC‐oil HFC‐air HFC‐salt HFC‐H20 CPC Priority Vector
CLFR 0.17 0.17 0.17 0.17 0.17 0.17 0.17 0.17 0.17 0.15 0.166
LFR 0.17 0.17 0.17 0.17 0.17 0.17 0.17 0.17 0.17 0.15 0.166
CPC‐fl 0.17 0.17 0.17 0.17 0.17 0.17 0.17 0.17 0.17 0.15 0.166
PDR 0.17 0.17 0.17 0.17 0.17 0.17 0.17 0.17 0.17 0.15 0.166
PTC‐dsg 0.17 0.17 0.17 0.17 0.17 0.17 0.17 0.17 0.17 0.15 0.166
PTC‐oil 0.06 0.06 0.06 0.06 0.06 0.06 0.08 0.08 0.08 0.10 0.068
HFC‐air 0.03 0.03 0.03 0.03 0.03 0.02 0.03 0.03 0.03 0.05 0.029
HFC‐salt 0.03 0.03 0.03 0.03 0.03 0.02 0.03 0.03 0.03 0.05 0.029
HFC‐H20 0.03 0.03 0.03 0.03 0.03 0.02 0.03 0.03 0.03 0.05 0.029
CPC 0.02 0.02 0.02 0.02 0.02 0.01 0.01 0.01 0.01 0.02 0.015
Total 1.00 1.00 1.00 1.00 1.00 1.00 1.00 1.00 1.00 1.00 Pairwise comparison matrix showing preferences for the collectors in terms of the Suitability to Operate at the Proposed Scale for California (500MW)

21
HFC‐air HFC‐salt HFC‐H20 PDR PTC‐dsg PTC‐oil CLFR LFR CPC‐fl CPC Priority Vector
HFC‐air 0.19 0.19 0.19 0.19 0.21 0.21 0.17 0.17 0.16 0.12 0.182
HFC‐salt 0.19 0.19 0.19 0.19 0.21 0.21 0.17 0.17 0.16 0.12 0.182
HFC‐H20 0.19 0.19 0.19 0.19 0.21 0.21 0.17 0.17 0.16 0.12 0.182
PDR 0.19 0.19 0.19 0.19 0.21 0.21 0.17 0.17 0.16 0.12 0.182
PTC‐dsg 0.05 0.05 0.05 0.05 0.05 0.05 0.10 0.10 0.11 0.11 0.072
PTC‐oil 0.05 0.05 0.05 0.05 0.05 0.05 0.10 0.10 0.11 0.11 0.072
CLFR 0.04 0.04 0.04 0.04 0.02 0.02 0.03 0.03 0.05 0.11 0.042
LFR 0.04 0.04 0.04 0.04 0.02 0.02 0.03 0.03 0.05 0.11 0.042
CPC‐fl 0.03 0.03 0.03 0.03 0.01 0.01 0.02 0.02 0.03 0.09 0.031
CPC 0.02 0.02 0.02 0.02 0.01 0.01 0.00 0.00 0.00 0.01 0.012
Total 1.00 1.00 1.00 1.00 1.00 1.00 1.00 1.00 1.00 1.00 Pairwise comparison matrix showing preferences for the collectors in terms of the Suitability to Operate at the Proposed Scale for The Sahara Desert (2000MW)
HFC‐air HFC‐salt HFC‐H20 PDR PTC‐dsg PTC‐oil CLFR LFR CPC‐fl CPC Priority Vector
HFC‐air 0.22 0.22 0.22 0.24 0.23 0.23 0.19 0.19 0.17 0.15 0.207
HFC‐salt 0.22 0.22 0.22 0.24 0.23 0.23 0.19 0.19 0.17 0.15 0.207
HFC‐H20 0.22 0.22 0.22 0.24 0.23 0.23 0.19 0.19 0.17 0.15 0.207
PDR 0.11 0.11 0.11 0.12 0.18 0.18 0.16 0.16 0.15 0.14 0.142
PTC‐dsg 0.04 0.04 0.04 0.03 0.05 0.05 0.09 0.09 0.10 0.10 0.064
PTC‐oil 0.04 0.04 0.04 0.03 0.05 0.05 0.09 0.09 0.10 0.10 0.064
CLFR 0.04 0.04 0.04 0.02 0.02 0.02 0.03 0.03 0.05 0.07 0.035
LFR 0.04 0.04 0.04 0.02 0.02 0.02 0.03 0.03 0.05 0.07 0.035
CPC‐fl 0.03 0.03 0.03 0.02 0.01 0.01 0.02 0.02 0.02 0.05 0.025
CPC 0.02 0.02 0.02 0.02 0.01 0.01 0.01 0.01 0.01 0.02 0.015
Total 1.00 1.00 1.00 1.00 1.00 1.00 1.00 1.00 1.00 1.00
Annex 4: Case Study Scenarios
Southern Spain, California, The Sahara Desert, and Gujarat, have been selected for the
implementation of a solar thermal system. Each location’s climate is determined along with
their political standings in terms of government legislation that exists to promote renewable
projects. The land and local population has also been considered as well as the likely scale for
a solar thermal power plant in these areas. Using this information, four suitable case study
scenarios have been developed for the AHP analysis.

22
Southern Spain
Spain’s climate varies greatly from one region to another. Southern Spain, including the
eastern coast, has a Mediterranean climate with average temperatures of 11ºC in the winter
and 23ºC in the summer. Annual rainfall is between 230mm – 600mm in this region.
Temperatures in the past have reached 47ºC in Seville, which is home to the world’s largest
solar towers PS10 and PS20. Spain also has Europe’s first parabolic trough plant, Andasol 1.
Spain ranks as one of the most suitable locations for solar power, receiving more sunshine
than any other European country. Spain is also the fourth largest manufacturer of solar power
technology worldwide.
Spain was the first country to implement feed-in tariffs for CSP, meaning that the regional or
national electricity suppliers have to buy renewable generated electricity at an above-market
rate set by the government for a guaranteed 25 year period. Another aspect that was crucial in
developing the CSP industry in Spain was the granting of permission for solar plants to use
natural gas as a back up to increase their operational capacity factor. The combination of
these decrees meant that CSP technology could now compete with conventional power
plants. However a limit of 500MW of solar power generation in Spain has been set. Once this
capacity is reached, the tariffs will be removed. The current amount of solar thermal
generated energy, 183MW, is hoped to rise substantially within the next couple of years.
Southern Spain seems suitable for large scale grid-connected commercial generating power
stations providing power to the local populous, which has been proven successfully in
Seville. For this case study the following scenario is proposed:

23
Financing for the initial development has been easy to come by with many enthusiastic
investors keen to take advantage of the political incentives while they remain in place. Initial
proposals are for a mid to large scale 100MW plant. Conditions for the selected region are
seen to be very good, with few extreme weather conditions such as high winds and
temperatures below freezing.
California – Mojave Desert
The Mojave Desert occupies a significant area in south-eastern California. The summer
season in the Mojave brings with it temperatures as high as 50ºC in some of its basins, as
well as other weather extremes such as the North American Monsoon. While the Desert
receives less than 250mm of rain a year, windy days are common across the region. While
solar collectors can re-orientate to protect themselves, wind is a major factor in damaging
CSP systems, particularly the receivers which are expensive as well as the mirrors; around
3000 mirrors are replaced every year at the SEGS plant. Autumn is mainly dry with
temperatures between 21 - 32ºC. Winter can see extreme colds of -7ºC on the valley floor and
far less in higher elevations. Storms from across the Pacific bring rain and snow but with long
gaps between storms, temperature can rise back up to 27ºC. Spring temperatures are often
above 38ºC with some storms influencing these temperatures.
The Mojave Desert was once the location for the main developments of solar power pushing
the technology forward, but when tax credits and other subsidies were adjusted with a fall in
oil prices, expansion plans for the world’s largest solar power station fell through. This

24
caused its developers, Luz Systems, to file for bankruptcy in 1991, which led to concerns for
future developments of CSP technologies[20]. Luz Systems financial difficulties can be
attributed to the unpredictable nature of the then existing policies, which were based on fossil
fuel prices. Fossil fuel prices can be affected globally by many factors, emphasising why
guaranteed fixed tariffs are so important [64].
California has now also followed suit aiming to achieve an ambiguous 20% of their
electricity sales to be served by renewable energy sources by 2010 and extended to 33% by
2020. To achieve this, a number of financial incentive plans have been put into place, once
again starting a renewed enthusiasm in developing large solar power stations in this region.
Further detail on all the financial incentive plans can be obtained from the US Department of
Energy [65].
The case study scenario for California assumes that the development of a 500MW plant has
been initiated. Funding has however been difficult with some investors withdrawing due to
fears caused by historical records in this region of further large scale solar thermal
developments leading to financial difficulties. While weathers can see extreme temperature
highs, designers have also had to consider the problems faced with the below freezing
temperatures and the North American monsoon. It has also been suggested that some of the
hotter locations on the valley basins could be utilized as large available areas of suitable level
land can be difficult to come by.
Gujarat

25
The weather conditions across the whole of India, as well as Gujarat, are very variable. While
coastal regions have a humid, mild climate with moderate amounts of rainfall in the monsoon
period, inland areas experience a far more extreme climate. On average summers are very hot
and dry, with temperatures reaching as high as 46ºC during the day and 34ºC at night. The
winters are still very warm at 29 ºC during daylight and 12 ºC at night. The monsoon season
can extend from the middle of June to September with extremely hot humid conditions before
its arrival brings temperatures down to 38 ºC.
India has also recently announced feed-in tariffs to the maximum of Rs 15/kWh for grid
connected systems in March 2008, and states are now starting to take this up with West
Bengal being the first.
Gujarat, as well as numerous other places in India, may well be more suited to smaller off
grid CSP systems with a number of smaller communities not being on a large national grid
system. For the Indian case study, the following proposals are made:
Indian businesses have collaborated with European investors to develop a local small
marketable solar thermal system to power local communities that are away from a grid
network, while some states have yet to adopt the relatively new governments plans for feed-
in tariffs, these should be utilized were possible. Suggested scales range from 100kW –
1MW. Weather conditions to contend with in India are the monsoon season bringing with it
high winds, however freezing temperatures are likely to be infrequent.
Sahara Desert

26
The Sahara is the world’s largest hot desert at over 9 million kilometres squared. The region’s
climate can be categorized into two types; the north, a dry subtropical climate consisting of
annually high temperatures with cold winters and hot summers with two rainy seasons, and
the south, a dry tropical climate forming dry mild winters, and a hot dry season before the
rainy season.
The rainy seasons in the north can cause potential flash flooding, usually around August. The
dry tropical climate of the southern region, at high elevations, receives temperatures well
below freezing. In the western regions the cold Canary current reduces rainfall and lowers the
average temperature, increasing the humidity and the potential of fog.
The Sahara Desert has been linked with plans to establish huge scale solar thermal plants for
electricity to be exported to the whole of Europe, and while financing plans have been
initiated, it remain dubious to how far the projected plans will go.
With Africa receiving 95% of the world’s best winter sunlight and an abundance of other
renewable resources to harness, Africa is well situated to develop the means of providing
substantial amounts of energy for its own requirements and exportation. Around 50% of
Africa’s electricity is generated by Eskom who run mainly coal fired power stations,
producing 45% of the country’s greenhouse gases alone, and this is with the majority of
South Africa being without power. The reluctance towards renewable energy in Africa can be
linked to the lack of political legislation that has been pioneered in other countries. The
success seen with feed-in tariffs could promote numerous industries to develop a greater
interest in regions such as the Sahara Desert for renewable projects.

27
With the abundance of land unlike anywhere else, the Sahara stands out as a location with
great potential for huge scale CSP systems. In this case study the following hypothesis is
made:
African consortiums with large European investors with additional financial backing from the
EU have begun plans for a multi-networked solar system totalling over 2000MW. While
initial investments have been successful the total amount required for the project could be
difficult to come by. Africa’s lack of political incentives in the use and development of
renewables has also made the long term payback period a concern for some parties.

28
Annex 5: Pairwise Comparison of Criteria for Southern Spain, Mojave Desert,
Gujarat, and the Sahara Desert
Fig.6 Pairwise comparison matrix for the development of the weighting vectors for Southern Spain.
Fig.7 Pairwise comparison matrix for the development of the weighting vectors for the Mojave Desert.
0.000 0.020 0.040 0.060 0.080 0.100 0.120 0.140 0.160 0.180 0.200
Collector Efficiency
Ideal Conversion Efficiency
Concentration Ratio
Compatibility of Heat Transfer Medium
Use od Standard Technologies/Parts
Capital Cost
Half Acceptance Angle
Parasitic Load
Pressure Tolerance
Total M&O
Efficiency at Scale Suggested in Proposal
Reliability
Land Usage
Tolerance of Slope
Temperature Tolerance
Water Usage
Weighting Priority Vector
Weightings of each criteria for Southern Spain
0.000 0.020 0.040 0.060 0.080 0.100 0.120 0.140 0.160 0.180
Collector Efficiency
Ideal Conversion Efficiency
Reliability
Efficiency at Scale Suggested in Proposal
Concentration Ratio
Pressure Tolerance
Temperature Tolerance
Compatibility of Heat Transfer Medium
Use od Standard Technologies/Parts
Capital Cost
Tolerance of Slope
Half Acceptance Angle
Parasitic Load
Total M&O
Water Usage
Land Usage
Weighting Priority Vector
Weightings of each criteria for Mojave Desert

29
Fig.8 Pairwise comparison matrix for the development of the weighting vectors for Gujarat.
Fig.9 Pairwise comparison matrix for the development of the weighting vectors for the Sahara Desert.
0.000 0.020 0.040 0.060 0.080 0.100 0.120 0.140 0.160
Collector Efficiency
Ideal Conversion Efficiency
Capital Cost
Total M&O
Land Usage
Reliability
Temperature Tolerance
Concentration Ratio
Use od Standard Technologies/Parts
Water Usage
Half Acceptance Angle
Parasitic Load
Pressure Tolerance
Efficiency at Scale Suggested in Proposal
Compatibility of Heat Transfer Medium
Tolerance of Slope
Weighting Priority Vecotr
Weightings of each criteria for Gujarat
0.000 0.020 0.040 0.060 0.080 0.100 0.120 0.140 0.160 0.180
Collector Efficiency
Ideal Conversion Efficiency
Total M&O
Water Usage
Concentration Ratio
Temperature Tolerance
Use od Standard Technologies/Parts
Capital Cost
Tolerance of Slope
Half Acceptance Angle
Parasitic Load
Pressure Tolerance
Reliability
Efficiency at Scale Suggested in Proposal
Compatibility of Heat Transfer Medium
Land Usage
Weighting Priority Vector
Weights of each criteria for Sahara Desert

30
Figure and Table Fig.1. Flow diagram showing the methodology for technology evaluation and selection based on the AHP. Fig.2. Decision hierarchy tree for selection of a suitable solar thermal collecotor for Gujarat (a) with the expanded hierarchy tree for the technical criteria (b), environmental criteria (c), and financial criteria (d), showing the technologies ordered on preference for each sub-criterion, using the characteristic values (table.1) from the literature review. Fig.3. Final results from the AHP study showing each solar thermal collector’s percentage preference for Southern Spain (a), Gujarat (b), Mojave Desert (c) and the Sahara Desert (d). Fig.4. Sensitivity study for Gujarat showing the potential range of the percentage preference for each alternative. Table 1. Characteristic values for solar thermal technologies and their alternatives, under the criteria of; technical, financial, and environmental, developed from the literature review. Annexes Fig.5. The Decision Hierarchy Tree for the sub criteria, chemical compatibility. Fig.6. Pairwise comparison matrix for the development of the weighting vectors for Southern Spain. Fig.7. Pairwise comparison matrix for the development of the weighting vectors for the Mojave Desert. Fig.8. Pairwise comparison matrix for the development of the weighting vectors for Gujarat. Fig.9. Pairwise comparison matrix for the development of the weighting vectors for the Sahara Desert. Table 2.1 Sub criteria selected for the AHP study. Table 2.2 List of the solar technology alternatives used in the AHP study. Table 2.3 Pairwise comparison scale values for the level of preference to be used in the pairwise comparison matrix. Table 2.4 Pairwise comparison matrix showing how preferred each alternative is in terms of their chemical compatibility. Table 2.5 Priority vectors of each alternative for the chemical compatibility. Table 2.6 Calculation of λmax for the chemical compatibility sub criteria.
Table 3.1. Full pairwise comparison matrix for the development of the priority vectors. Acknowledgements

31
The authors acknowledge the assistance of the Solar Energy Centre (MNRE), Delhi, in
hosting the expert workshop. Financial support from the Department of Science and Technology
(DST, India) and Research Councils UK (EP/G039992/1) is also acknowledged along with
the contribution of anonymous reviewers, and the project partners at the Indian Institute of
Technology Delhi.
9. References
1. Grover, R.B. and S. Chandra, Scenario for growth of electricity in India. Energy Policy, 2006. 34(17): p. 2834-2847.
2. Buragohain, B., P. Mahanta, and V.S. Moholkar, Biomass gasification for decentralized power generation: The Indian perspective. Renewable and Sustainable Energy Reviews, 2010. 14(1): p. 73-92.
3. Center for Climate and Energy Solutions (2008) Government of India, National Action Plan on Climate Change.
4. Wolff, G. Clean Power from Deserts, Desertec Foundation. Oct 2009. Seminar at the London Energy Institute.
5. Franz, T. (2006) German Aerospace Centre (DLR), Trans-Mediterranean Interconnection for Concentrating Solar Power. Final Report.
6. Government of India, Ministry of New and Renewable Energy, Annual Report, 2004-2005.
7. Government of India, Ministry of New and Renewable Energy, Annual Report, 2005-2006.
8. Saaty, T., Decision making with the Analytic Hierarchy Process. International Journal of Services Sciences, 2008. 1(1): p. 83-98.
9. Saaty, T.L., The analytic hierarchy process : planning, priority setting, resource allocation. 1980, New York; London: McGraw-Hill International Book Co.
10. Pohekar, S.D. and M. Ramachandran, Application of multi-criteria decision making to sustainable energy planning--A review. Renewable and Sustainable Energy Reviews, 2004. 8(4): p. 365-381.
11. Dey, P., Decision support system for inspection and maintenance: a case study of oil pipelines. IEEE transactions on engineering management, 2004. 51(1): p. 47-56.
12. Dey, P., Integrated project evaluation and selection using multiple-attribute decision-making technique. International Journal of Production Economics, 2006. 103(1): p. 90-103.
13. Ramanathan, R. and L.S. Ganesh, Energy resource allocation incorporating qualitative and quantitative criteria: An integrated model using goal programming and AHP. Socio-Economic Planning Sciences, 1995. 29(3): p. 197-218.
14. Marttunen, M. and R.P. Hämäläinen, Decision analysis interviews in environmental impact assessment. European Journal of Operational Research, 1995. 87(3): p. 551-563.
15. Bhattacharyya, S. and P. Dey, Selection of power market structure using the analytic hierarchy process. International Journal of Global Energy Issues, 2003. 20(1): p. 36-57.

32
16. Kaya, T. and C. Kahraman, Multicriteria renewable energy planning using an integrated fuzzy VIKOR & AHP methodology: The case of Istanbul. Energy, 2010. 35(6): p. 2517-2527.
17. Ramanathan, R. and L.S. Ganesh, Energy alternatives for lighting in households: An evaluation using an integrated goal programming-AHP model. Energy, 1995. 20(1): p. 63-72.
18. Kalogirou, S.A., Solar thermal collectors and applications. Progress in Energy and Combustion Science, 2004. 30(3): p. 231-295.
19. Duffie, J.A. and W.A. Beckman, Solar engineering of thermal processes. 3rd ed. 2006, New York: John Wiley & Sons.
20. Johansson, T.B. and L. Burnham, Renewable energy : sources for fuels and electricity. 1993, Washington, D.C.: Island Press.
21. Kaltschmitt, M., W. Streicher, and A. Wiese, Renewable energy : technology, economics, and environment. 2007, Berlin; New York: Springer.
22. Technology Characterization Solar Parabolic Trough. 27/07/09]; Available from: http://www.solarpaces.org/CSP_Technology/docs/solar_trough.pdf.
23. Price, H., A Parabolic Trough Solar Power Plant Simulation Model, in Internation Solar Energy Confrence Hawaii Island. 2003, National Renewable Energy Laboratory: Hawaii. p. 5.
24. Weiss, W. and M. Rommel (2008) Process Heat Collectors. 25. (2003) National Renewable Energy Laboratory, Assessment of Parabolic Trough and
Power Tower Solar Technology Cost and Performance Forecasts. 26. Goswami, D.Y. and F. Kreith, Energy conversion. 2008, Boca Raton: CRC Press. 27. Eck, M. and W. Steinmann, D, Direct Steam Generation in Parabolic Troughs, First
Results of the DISS Project. Journal of Solar Energy Engineering, 2002. 124: p. 134-140.
28. Zarza, E., et al., Direct steam generation in parabolic troughs: Final results and conclusions of the DISS project. Energy, 2003. 29(5-6): p. 635-644.
29. Flores, V. and R. Almanza, Direct steam generation in parabolic trough concentrators with bimetallic receivers. Energy, 2003. 29(5-6): p. 645-651.
30. Mills, D., Advances in solar thermal electricity technology. Solar Energy, 2003. 76(1-3): p. 19-31.
31. Boyle, G., Renewable energy, power for a sustainable future. 2004, Oxford: Oxford University Press, in association with the Open University.
32. Energy Information Administration Official Energy Statistics from the U.S Government, Solar Thermal. 2008.
33. Pacheco, J., E, et al., Summary of the Solar Two: Test and Evaluation Program. 2000, SANDIA Labs: Alburquerque.
34. Technology Characterization Solar Power Towers. 27/07/09]; Available from: http://www.solarpaces.org/CSP_Technology/docs/solar_tower.pdf.
35. Kolb, G., J et al. (2007) Heliostat Cost Reduction, Sandia National Laboratories. 36. Collado, F.J., Quick evaluation of the annual heliostat field efficiency. Solar Energy,
2008. 82(4): p. 379-384. 37. Wei, L., Area utilization efficiency of a sloping heliostat system for solar
concentration. Applied Optics, 1983. 22(4): p. 568-572. 38. Compact Linear Fresnel Reflector (CLFR) Solar. 2008 [cited 2009 27 July];
Available from: http://www.energy.ca.gov/reti/steering/2008-06-18_meeting/SOLAR_FS-Compact_Linear_Fresnel_Reflector.pdf.
39. Mills, D. and G. Morrison, Compact linear Fresnel reflector solar thermal powerplants. Solar Energy, 2000. 68(3): p. 263-283.

33
40. Feuermann, D. and J. Gordon, Analysis of a two-stage linear Fresnel reflector solar concentrator. Journal of Solar Energy Engineering, 1991. 113: p. 272.
41. Stalix. 5¢ / KWh Electricity from Concentrated Solar Power (CSP) – Finally a Reality.
42. Mills, D., P. Le Lievre, and G. Morrison, First Results from Compact Linear Fresnel Reflector Installation. Proceedings of ANZSES Solar2004, 2004.
43. Taggart, S., CSP: dish projects inch forward. Renewable Energy Focus, 2008. 9(4): p. 52-54.
44. Stirling Energy Systems. 10/11/09]; Available from: http://www.stirlingenergy.com/. 45. Technology Characterization Solar Dish Systems. 22/07/09]; Available from:
http://www.solarpaces.org/CSP_Technology/docs/solar_tower.pdf. 46. (2008) Solar Energy, Stirling Energy Systems Solar Power Plant, California. 47. Jogi, K.S., Encyclopaedia of energy resource management : (priorities for 21st
century). 2000, Lucknow; New Delhi: Institute of Environmental Development Studies ; Sarup.
48. García-Rodríguez, L., A. Palmero-Marrero, and C. Gómez-Camacho, Comparison of solar thermal technologies for applications in seawater desalination. Desalination, 2002. 142(2): p. 135-142.
49. Collares-Pereira, M., High temperature solar collector with optimal concentration- Non-focusing Fresnel lens with secondary concentrator. Solar Energy, 1979. 23(5): p. 409-420.
50. Welford, W.T. and R. Winston, High collection nonimaging optics. 1989, San Diego: Academic Press.
51. Winston, R., Principles of solar concentrators of a novel design (from Solar Energy 1974). SPIE milestone series., 1995. 106: p. 18.
52. Kritchman, E., A. Friesem, and G. Yekutieli, Efficient Fresnel lens for solar concentration. Solar Energy, 1979. 22: p. 119-123.
53. Leutz, R., et al., Developments and Designs of Solar Engineering Fresnel Lenses. Tokyo University of Agriculture and Technology, Department of Mechanical Systems Engineering.
54. Kritchman, E., A. Friesem, and G. Yekutieli, Highly concentrating Fresnel lenses. Applied Optics, 1979. 18(15): p. 2688-2695.
55. Leutz, R. and A. Suzuki, Nonimaging Fresnel lenses : design and performance of solar concentrators. 2001, Berlin; New York: Springer.
56. Nelson, D., D. Evans, and R. Bansal, Linear Fresnel lens concentrators. Solar Energy, 1975. 17: p. 285-289.
57. Singh, D., Solar Energy Centre in India, in Alternative Energy eMagazine. Apr 2009. 58. Anderson, D.R., et al., An introduction to management science quantitative
approaches to decision making. 2000, Cincinnati, Ohio: South-Western College Pub. 59. Dey, P., Analytic hierarchy process helps evaluate project in Indian oil pipelines
industry. International Journal of Operations and Production Management, 2004. 24: p. 588-604.
60. Belton, V. and T. Gear, On a short-coming of Saaty's method of analytic hierarchies. Omega, 1983. 11(3): p. 228-230.
61. Sniezek, J.A. and R.A. Henry, Accuracy and confidence in group judgment. Organizational Behavior and Human Decision Processes, 1989. 43(1): p. 1-28.
62. Van Den Honert, R.C. and F.A. Lootsma, Group preference aggregation in the multiplicative AHP The model of the group decision process and Pareto optimality. European Journal of Operational Research, 1997. 96(2): p. 363-370.

34
63. Wallenius, J., et al., Multiple criteria decision making, multiattribute utility theory: recent accomplishments and what lies ahead. Management Science, 2008. 54(7): p. 1336–1349.
64. Ahmed, K. and D. Anderson (1994) Renewable Energy Technologies, A Review of the Status and Costs of Selected Technologies, Annex 5 The Luz Experience.
65. California, Incentives/Polices for Renewables and Efficiency, Database of State Incentives for Renewables and Efficiency (DSIRE). 25/08/09]; Available from: http://www.dsireusa.org/incentives/incentive.cfm?Incentive_Code=CA25R&state=CA&CurrentPageID=1.