
What's Your Digital IQ? Business Tech Trends & Applications by @PYMLIVE
Upload
martin-mrizoCategory
view
94download
1

JWBT150-Vallabhaneni fm August 7, 2009 19:5
ii

JWBT150-Vallabhaneni fm August 7, 2009 19:5
Praises for
WHAT’S YOUR MBA IQ?
I often tell the young professional we work with that I learned more in the first two chapters of this book than Idid in my first two months at Harvard Business School. This book has become our primary teaching tool for youngbusiness managers.—Ronald Mitchell, CEO & Co-Founder, CareerCore Inc.
This book defines a tough and tangible new standard for what every MBA graduate should know about business.With the degree’s credibility under fire, this quality benchmark is just in time. Test yourself and see how youmeasure up.—Tim Westerbeck, Managing Director and Principal, Lipman Hearne, Inc.
Kudos to Devi for creating what the business world has always needed – a simple guide and assessment that coversthe fundamental business skills all industry professionals need. This should be required reading for all corporatetraining professionals, business school faculty and students! Devi Vallabhaneni clearly gets it!—Doug Harward, CEO and Founder, TrainingIndustry.com
As one who has been involved in the hiring and promotion decisions of many professionals over my career, I wouldrecommend this book to those managers who are looking to take their careers to the next level. It gives the reader abroader understanding of business operations which so many companies need in today’s challenging and complexmarket.—Michael Sprague, Vice President–Marketing & Communications, Kia Motors America
i

JWBT150-Vallabhaneni fm August 7, 2009 19:5
ii

JWBT150-Vallabhaneni fm August 7, 2009 19:5
WHAT’S YOURMBA IQTM?
iii

JWBT150-Vallabhaneni fm August 7, 2009 19:5
iv

JWBT150-Vallabhaneni fm August 7, 2009 19:5
WHAT’S YOURMBA IQTM?
A Manager’s CareerDevelopment Tool
Devi Vallabhaneni
John Wiley & Sons, Inc.
v

JWBT150-Vallabhaneni fm August 7, 2009 19:5
Copyright c© 2009 by Devi Vallabhaneni. All rights reserved.
Published by John Wiley & Sons, Inc., Hoboken, New Jersey.Published simultaneously in Canada.
No part of this publication may be reproduced, stored in a retrieval system, or transmitted in any form or by anymeans, electronic, mechanical, photocopying, recording, scanning, or otherwise, except as permitted under Section107 or 108 of the 1976 United States Copyright Act, without either the prior written permission of the Publisher, orauthorization through payment of the appropriate per-copy fee to the Copyright Clearance Center, Inc., 222Rosewood Drive, Danvers, MA 01923, (978) 750-8400, fax (978) 750-4470, or on the web at www.copyright.com.Requests to the Publisher for permission should be addressed to the Permissions Department, John Wiley & Sons,Inc., 111 River Street, Hoboken, NJ 07030, (201) 748-6011, fax (201) 748-6008, or online atwww.wiley.com/go/permissions.
Limit of Liability/Disclaimer of Warranty: While the publisher and author have used their best efforts in preparingthis book, they make no representations or warranties with respect to the accuracy or completeness of the contentsof this book and specifically disclaim any implied warranties of merchantability or fitness for a particular purpose.No warranty may be created or extended by sales representatives or written sales materials. The advice andstrategies contained herein may not be suitable for your situation. You should consult with a professional whereappropriate. Neither the publisher nor author shall be liable for any loss of profit or any other commercialdamages, including but not limited to special, incidental, consequential, or other damages.
For general information on our other products and services or for technical support, please contact our CustomerCare Department within the United States at (800) 762-2974, outside the United States at (317) 572-3993 or fax (317)572-4002.
Wiley also publishes its books in a variety of electronic formats. Some content that appears in print may not beavailable in electronic books. For more information about Wiley products, visit our web site at www.wiley.com.
Library of Congress Cataloging-in-Publication Data:
Vallabhaneni, Devi, 1969–What’s your MBA IQ? : A Manager’s Career Development Tool / Devi Vallabhaneni.
p. cm.Includes bibliographical references and index.ISBN 978-0-470-43957-9 (pbk.)
1. Management–Research. 2. Leadership. 3. Strategy. I. Title.HD30.4.V35 2009658–dc22 2009015528
Printed in the United States of America
10 9 8 7 6 5 4 3 2 1
vi

JWBT150-Vallabhaneni fm August 7, 2009 19:5
To my parents
By word and by deed, you have showed me that the harder I work today,the easier tomorrow will be.
Well, that tomorrow is now here.
Devi
vii

JWBT150-Vallabhaneni fm August 7, 2009 19:5
viii
JWBT150-Vallabhaneni fm August 7, 2009 19:5
Contents
Preface xv
Acknowledgments xvii
Introduction xix
Learning Module 1 General Management, Leadership, and Strategy 1Learning Objective 1.1: Understand the Scope and Nature of Corporate
Strategies 2Learning Objective 1.2: Understand the Importance of Planning and
Organizing Skills 10Learning Objective 1.3: Understand the Importance of Directing and
Leading Skills 14Learning Objective 1.4: Understand the Importance of Controlling and
Measuring Skills 19Learning Objective 1.5: Understand the Importance of Motivating Skills 21Learning Objective 1.6: Understand the Importance of Problem-Solving and
Decision-Making Skills 23Learning Objective 1.7: Understand the Importance of Negotiating Skills 30Learning Objective 1.8: Understand the Importance of Communication Skills 32Learning Objective 1.9: Understand the Importance of Conflict Management
Skills 35Learning Objective 1.10: Understand the Various Issues in Organizational
Behavior, Culture, Change, Development, Effectiveness, and Decline 38Learning Objective 1.11: Understand How to Measure and Manage Business
Performance Results 42
Learning Module 2 Operations Management 45Learning Objective 2.1: Understand the Strategic Importance of Demand
Forecasting 46Learning Objective 2.2: Understand the Production Strategies and
Manufacturing Performance Measures 47Learning Objective 2.3: Understand the Production-Related Value Concepts 48Learning Objective 2.4: Understand the Philosophies of Just-In-Time and Lean
Operations 49Learning Objective 2.5: Understand the Principles and Techniques of Inventory
Management 52Learning Objective 2.6: Understand the Principles and Techniques of
Supply-Chain and Logistics Management 56
ix

JWBT150-Vallabhaneni fm August 7, 2009 19:5
x Contents
Learning Objective 2.7: Understand the Various Planning Systems Applicableto Manufacturing and Distribution Operations 58
Learning Objective 2.8: Understand the Various Short-Term SchedulingSystems Used in Production 60
Learning Objective 2.9: Understand the Theory of Constraints in Operations 62Learning Objective 2.10: Understand the Principles of Production Economics
and Application of Decision Tools 63Learning Objective 2.11: Understand the Principles and Techniques of
Equipment Maintenance and System Reliability 65Learning Objective 2.12: Understand the Production Process Flows and Metrics 66Learning Objective 2.13: Understand the Technology Deployed in
Manufacturing and Service Operations 67
Learning Module 3 Marketing Management 71Learning Objective 3.1: Understand the Components of Marketing Mix 72Learning Objective 3.2: Understand the Expectancy-Value Model in Consumer
Markets 72Learning Objective 3.3: Understand the Brand Elements and Calculate
a Brand Value 72Learning Objective 3.4: Understand Competitor Analysis 73Learning Objective 3.5: Understand the Pricing Strategies and Methods 73Learning Objective 3.6: Understand the Marketing Communications Mix 75Learning Objective 3.7: Understand the New-Product Development Process 75Learning Objective 3.8: Compute the Customer Retention Rate 76Learning Objective 3.9: Compute the Lifetime Value of a Customer 77Learning Objective 3.10: Compute the Customer Conviction in Terms of Net
Promoter Score 78Learning Objective 3.11: Compute the Customer Loyalty Score 78Learning Objective 3.12: Compute the Net Marketing Contribution Amount 78Learning Objective 3.13: Compute the Marketing Profitability Metrics 80Learning Objective 3.14: Compute the Market Development Index 80Learning Objective 3.15: Compute the Market Share Index 80Learning Objective 3.16: Compute a Product’s Lifecycle Cost and Economic
Value to a Customer 81Learning Objective 3.17: Compute the Relative Performance, Price, and
Customer Value of a Product 81Learning Objective 3.18: Compute a Marketing Channel Intermediary’s
Transaction Value 82Learning Objective 3.19: Understand the Relationships Among Price, Profit, and
Market Share 83Learning Objective 3.20: Understand a Marketing Channel’s Performance 83Learning Objective 3.21: Evaluate the Advertising’s Effectiveness with Customer
Response Index 83Learning Objective 3.22: Learn How to Conduct a Marketing Portfolio Analysis 85Learning Objective 3.23: Learn How to Develop a Marketing Budget 85Learning Objective 3.24: Understand the Financial Performance Metrics Related
to Marketing 85Learning Objective 3.25: Understand the Nature of Marketing of Services 86Learning Objective 3.26: Understand the Strategies in Product Management 87Learning Objective 3.27: Understand the Stages in a Product Lifecycle 88
Learning Module 4 Quality and Process Management 91Learning Objective 4.1: Understand the Basic Quality Concepts 91Learning Objective 4.2: Understand the Various Definitions of Quality 93

JWBT150-Vallabhaneni fm August 7, 2009 19:5
CONTENTS xi
Learning Objective 4.3: Calculate the Cost of Quality 94Learning Objective 4.4: Calculate the Six-Sigma Metric 94Learning Objective 4.5: Compute the Return-on-Quality Metric 96Learning Objective 4.6: Apply Quality Tools 96Learning Objective 4.7: Apply Statistical Process Control Techniques 98Learning Objective 4.8: Compute Taguchi’s Quality Loss Function 100Learning Objective 4.9: Understand the Role of Inspection and Quality
at Source 100Learning Objective 4.10: Understand the Process Management Methods
and Tools 101
Learning Module 5 Human Resources Management 103Learning Objective 5.1: Understand the Human Resources Planning Process 103Learning Objective 5.2: Understand the Relationship between Job Analysis
and Job Descriptions 104Learning Objective 5.3: Understand the Recruitment Methods
and Alternatives 105Learning Objective 5.4: Understand the Employee Selection Process 106Learning Objective 5.5: Understand the Employee Selection Tests and their
Characteristics 107Learning Objective 5.6: Understand the Employment Interview Process 108Learning Objective 5.7: Understand the Pre-Employment Screening Process 108Learning Objective 5.8: Understand the Employee Training and Development
Process 109Learning Objective 5.9: Understand the Management Development Process 110Learning Objective 5.10: Understand the Organization Development Process 111Learning Objective 5.11: Understand the Career Planning and Development
Process 112Learning Objective 5.12: Understand the Employee Performance Appraisal
Process 113Learning Objective 5.13: Understand the Employee Relations Issues 114Learning Objective 5.14: Compute the Human Capital Metrics 116
Learning Module 6 Accounting 119Learning Objective 6.1: Understand the Basic Concepts of Financial
Accounting 120Learning Objective 6.2: Understand the Purpose of the Accounting Cycle 121Learning Objective 6.3: Understand the Types and Contents of Financial
Statements 122Learning Objective 6.4: Understand the Intermediate Concepts of Financial
Accounting 128Learning Objective 6.5: Understand the Advanced Concepts of Financial
Accounting 132Learning Objective 6.6: Learn How to Analyze Financial Statements 133Learning Objective 6.7: Understand Various Cost Concepts and Cost
Behaviors 140Learning Objective 6.8: Understand the Principles and Techniques
of Operating Budgets 143Learning Objective 6.9: Understand the Application of Transfer Pricing 146Learning Objective 6.10: Understand the Application of Cost-Volume-Profit
Analysis 148Learning Objective 6.11: Understand the Meaning and Application
of Relevant Costs 150

JWBT150-Vallabhaneni fm August 7, 2009 19:5
xii Contents
Learning Objective 6.12: Understand Various Costing Systems for Products andServices 151
Learning Objective 6.13: Understand the Meaning and Application ofResponsibility Accounting 152
Learning Module 7 Finance 153Learning Objective 7.1: Understand the Need for Financial Plans and Controls 154Learning Objective 7.2: Understand the Principles and Techniques of Cash
Management 157Learning Objective 7.3: Understand the Techniques of Managing Current
Assets 160Learning Objective 7.4: Understand the Various Types of Debt and Equity in a
Capital Structure 163Learning Objective 7.5: Understand the Techniques for Evaluating the Cost
of Capital 169Learning Objective 7.6: Understand the Principles and Techniques of Capital
Budgeting 171Learning Objective 7.7: Understand the Various Types and Risks of Financial
Instruments 179Learning Objective 7.8: Understand the Various Types of Valuation Models 182Learning Objective 7.9: Understand the Nature of Business Mergers
and Acquisitions 185Learning Objective 7.10: Understand the Implications of Dividend Policies,
Stock Splits, Stock Dividends, and Stock Repurchases 187
Learning Module 8 Information Technology 191Learning Objective 8.1: Understand How to Plan and Manage the Information
Technology Function 192Learning Objective 8.2: Understand How Business Application Systems are
Developed and Maintained 196Learning Objective 8.3: Understand How Business Application Systems are
Operated and Improved 198Learning Objective 8.4: Understand the Need for Contingency Plans to Ensure
the Continuity of Business Operations 201Learning Objective 8.5: Understand How Information Technology Operations
Are Managed 207Learning Objective 8.6: Understand the Technology Behind Computer
Network Management 211Learning Objective 8.7: Understand how to Manage the Information
Technology Security Function 217Learning Objective 8.8: Understand How Databases are Designed
and Managed 223Learning Objective 8.9: Understand How Electronic Commerce is Facilitated
and Managed 228
Learning Module 9 Corporate Control, Law, Ethics, and Governance 235Learning Objective 9.1: Understand the Nature and Types of Corporate
Control Systems 236Learning Objective 9.2: Understand the Nature and Types of Corporate Risk 241Learning Objective 9.3: Understand the Scope and Nature of Business Law,
Policy, and Ethics, Including Social Responsibility 247Learning Objective 9.4: Understand the Various Issues in Corporate
Governance 256Learning Objective 9.5: Understand the Nature and Types of Corporate Audits 260

JWBT150-Vallabhaneni fm August 7, 2009 19:5
CONTENTS xiii
Learning Objective 9.6: Understand the Nature and Types of Corporate Fraud 263Learning Objective 9.7: Understand the Issues in Corporate Law Regarding
Agency Problems and Costs 266
Learning Module 10 International Business 269Learning Objective 10.1: Understand How to Develop and Manage
International Business Strategies 269Learning Objective 10.2: Understand the Various Issues in International Trade
and Investment 271Learning Objective 10.3: Understand the Nature of International Production
Economics 275Learning Objective 10.4: Understand the Nature of International Trade Laws 276Learning Objective 10.5: Understand the Various Issues in International
Financial Systems 280Learning Objective 10.6: Understand How to Staff and Manage International
Operations 281Learning Objective 10.7: Understand the Various Issues in Conducting
International Business in Cross Cultures 281
Learning Module 11 Project Management 287Learning Objective 11.1: Define Project Management and Identify Success
Criteria for Projects 287Learning Objective 11.2: Understand the Various Types of Risks in Project
Management 289Learning Objective 11.3: Understand the Various Types of Project Structures
and Organizations 291Learning Objective 11.4: Understand the Project Management Process,
Including its Lifecycles 294Learning Objective 11.5: Understand the Various Methods in Project Planning,
Estimating, Controlling, and Reporting 296Learning Objective 11.6: Understand the Various Methods in Project
Scheduling 303Learning Objective 11.7: Understand the Project Management Metrics,
Problems, and Governance Mechanisms, Including Project Audits 306
Learning Module 12 Decision Sciences and Managerial Economics 311Learning Objective 12.1: Learn How to Apply Quantitative Methods
to Business 311Learning Objective 12.2: Understand the Basic Principles and Concepts
in Economics 321Learning Objective 12.3: Understand the Basic Principles and Applications of
Microeconomics 322Learning Objective 12.4: Understand the Basic Principles and Applications of
Macroeconomics 325Learning Objective 12.5: Understand the Basic Principles and Applications of
Key Economic Indicators 332Learning Objective 12.6: Understand the Nature of Economic Business Cycles
and Industry Growth Levels 333
References 337
Index 339

JWBT150-Vallabhaneni fm August 7, 2009 19:5
xiv

JWBT150-Vallabhaneni fm August 7, 2009 19:5
Preface
This is the book I wish I had before I started my MBAat the Harvard Business School.
I thought I would be adequately prepared for therigors facing me, as I was a CPA and had workedfor four years as a consultant at Arthur Andersenin its Chicago, Singapore, and Hong Kong offices.Nevertheless, and despite an undergraduate degreein business, as I began my first year at Harvard, Ifelt that I didn’t have the core building blocks totake full advantage of the curriculum. I felt comfort-able with the accounting and finance classes, but Ihad not been exposed to the vocabulary and con-cepts of operations management or to the quantita-tive side of marketing. As a result, I had to worktwo to three times as hard to keep up with engineersin operations management class and with the Proc-ter & Gamble brand managers in marketing class.In other words, I had to work really hard just tohave what I refer to as Basic or even Intermediatetypes of discussions while the engineers and thebrand marketers were capable of Intermediate oreven Advanced discussions. Because they had beenexposed to the Basic or even Intermediate levelsduring their previous work experience, they wereable to jump in and really dig deep into the course-work, just as I could in the accounting and financeclasses.
How fast you move from engaging in Basic leveldiscussions to more Advanced level discussions willdetermine your success in business school. If youonly have minimal awareness of the issues and con-cepts, then you have a Basic level comprehension ina particular course. As you gain a better workingknowledge, perform quantitative analysis, and cansolve problems, you now have an Intermediate com-prehension level. With an Advanced comprehensionlevel, you can apply the concepts learned in oneclass to other classes in your MBA program and can
begin to visualize the consequences of your analysisand decisions on the rest of the company. See the fig-ure on the next page for further clarification. As youhave more exposure to the subject matter, you cantransition faster from the Basic types of discussionsto the Advanced level discussions.
What surprised me even more was that many ofmy classmates had even less business experiencethan I had. They were seeing most of the first-yearcurriculum for the first time. In general, the majorityof MBA aspirants probably is strong in two to threefunctional areas and will need to work on strength-ening themselves in the other areas. For example, anengineer is going to be great at operations and mayneed to focus on accounting and strategy. An in-vestment banker is strong in accounting and financeand may need to focus on marketing and operations.Your effectiveness in MBA coursework will dependon how fast you can get up to speed in the areas inwhich you are weak.
The top business schools excel at providing learn-ing opportunities outside the classroom, such asteam projects, independent study, job search and in-terviewing, attending company presentations, andsocializing and networking with fellow classmates.If MBA students have to spend too much time justkeeping their heads above water with coursework,they are not maximizing all of the learning opportu-nities that top business schools have to offer.
Earning an MBA is a big investment in time andmoney, so I encourage you to plan ahead. You pre-pared for your GMAT/CAT, so take the next stepand plan for your MBA coursework. It is often saidthat the hardest part of the top MBA programs is get-ting in. I challenge that notion; getting admitted isjust the starting point. In today’s environment, thereis more at stake than ever in doing well at school, soit is imperative that you prepare for what happens
xv

JWBT150-Vallabhaneni fm August 7, 2009 19:5
xvi Preface
Basic Discussions Intermediate Discussions Advanced Discussions
Can proficiently apply concepts to anycompany and industry+Can discuss impact of concepts on otherparts of the company+Can visualize the consequences of decisionson other stakeholders
Working knowledge of quantitative analysis+Can solve problems and make recommendations
Working knowledge of quantitative analysis+Can solve problems and make recommendations
Vocabulary+Minimal awareness of issues and concepts
Vocabulary+Minimal awareness of issues and concepts
Vocabulary+Minimal awareness of issues and concepts
with no previous exposure
with previous exposure
after you get in. You want to be armed with a solidfoundation across the entire curriculum so that youcan interact with peers and professors at a higher,more advanced level. The better prepared you are interms of subject matter from MBA IQ, the more youcan get out of the MBA program, ultimately result-ing in getting the job you want, which is the primarygoal of attending business school.
For those of you who do not want to pursue anMBA, this book and the accompanying online assess-ment provide a roadmap for further managementeducation irrespective of the MBA degree. Most ofthe topics covered in the book can be developed fur-ther through your corporate training and develop-ment department or through third-party training or-ganizations.
My experience over the last nine years as thefounder and CEO of Association of Professionals inBusiness Management (APBM), a nonprofit highereducation organization, has enabled me to assem-ble the range of topics necessary for all businessmanagers, with or without an MBA. Having workedthrough the dot-com rise and fall, the implosion ofEnron, WorldCom, and Arthur Andersen, increasedglobalization, and the latest financial industry cri-sis, I am more convinced than ever that all businessmanagers need to be proficient in the topics coveredin this book in order to have a job security, careeradvancement, and a positive societal impact.
My personal story is what inspired me to writethis book. However, two other books reinforced theMBA IQ process. Malcolm Gladwell’s Outliers andGeoff Colvin’s Talent Is Overrated suggest that excep-tional performance in any field, including business,is a result of “deliberate practice.” My goal for youis to view the MBA IQ process as deliberate prac-tice to build and develop your career. I don’t expectyou to master the 12 Learning Modules presented inthis book immediately. It may take several jobs andyears for you to truly see the interdependencies ofthese modules. I don’t want you to get discouragedat a low initial score. As you gain more knowledgeand experience, you will see for yourself how yourMBA IQ score progresses over time. That’s the wholepoint. In other words, your MBA IQ will mirror yourcareer development.
This book covers a lot of material—it reflects theincreased responsibility placed on today’s businessmanager. I am grateful to be in a position to helpmanagers in their career development efforts.
With no bias intended and for the sake of simplicity,the pronoun “he” has been used throughout the bookrather than “he/she” or “he” or “she.”
DEVI VALLABHANENI
Chicago, ILSeptember 2009
www.mbaiq.com

JWBT150-Vallabhaneni fm August 7, 2009 19:5
Acknowledgments
I would like to first and foremost thank Sheck Choof John Wiley & Sons for bringing forth this project.Sheck, thank you for seeing the vision and guidingme through this process. Stacey Rivera and NatashaAndrews-Noel of Wiley, I appreciate your patiencein reviewing and editing the very long and detailedmanuscript.
Dean Dipak Jain of Kellogg School of Manage-ment, Professor Rakesh Khurana of Harvard Busi-ness School, and Professor Deborah Ancona of MIT’sSloan School of Management: thank you for yoursuggestions and input regarding the topics to be cov-ered in this book. Rakesh, a hearty thanks to you forall of our touch-base calls and the tremendous sup-port you have shown over the years.
Dennis Chookaszian, thank you for discussing thevarious ways the self-assessment can be structuredas well as all of the other suggestions you have pro-vided me.
A special thanks to my friends and colleagues(in alphabetical order)—Carol Allen, Peri Altan,Carine Beer, Marie Cohen, Kerry Whorton Cooper,Alison and Greg Deldicque, Jen and AmitDhadwal, April Diehl, Mark Donofrio, Matt Finick,Lori Flees, Mary Glasser, Melissa Hayes, BarbHoffman, Karen Klutznick, Mary-Jo Kovach, AlexLach, William Levacy, Michael Littlejohn, LubaMcElroy, Armeen and Zeeshan Mirza, Ron Mitchell,
Sharon Novaaaaak, Bill Paladino, Helene Roux,Michael Sprague, Sean Stowers, John Wannamacher,Tim Westerbeck, and Craig Will—thank you for be-ing extremely supportive and for letting me askyou for your opinions and suggestions. Your guid-ance and patience are very much appreciated. Youknow that I can get rather focused at times. LisaSchuble, it’s great working with you to educate au-diences about the value of this book to their careerdevelopment.
I’d also like to thank Neal Maillet who, back in Jan-uary 2007, first inspired in me the idea that I couldbecome an author. You planted the seed that madethis book possible. Jon Malysiak and Scott Adling-ton, thank you for being part of the journey. I hopewe can find another project where we can work to-gether. Dad, I really couldn’t have completed thisproject without you. Mom, you made me who I amtoday.
I am truly grateful for my time at Harvard Busi-ness School, where I was convinced of the follow-ing: (1) a general management education needs to beaccessible to all managers and (2) there is indeed acommon body of knowledge that all managers needto know.
Last but not least, I’d like to thank my trustedcolleague Karen Murphy who makes my life easierevery day!
xvii

JWBT150-Vallabhaneni fm August 7, 2009 19:5
xviii

JWBT150-Vallabhaneni fm August 7, 2009 19:5
Introduction
This book provides business practitioners and MBAaspirants with a roadmap to facilitate advancedmanagement education (i.e., MBA or CBM) and pro-vides a structured approach for career developmentin the management profession.
ScopeAn individual’s MBA IQ is based on 12 LearningModules, which reflect the scope of a general man-agement education:
1. General Management, Leadership, and Strategy2. Operations Management3. Marketing Management4. Quality and Process Management5. Human Resources Management6. Accounting7. Finance8. Information Technology9. Corporate Control, Law, Ethics, and Governance
10. International Business11. Project Management12. Decision Sciences and Managerial Economics
These 12 Learning Modules have been compiledfrom multiple sources, such as MBA curricula, spe-cialty professional certification programs in busi-ness, and corporate training and development pro-grams. These modules together establish a commonbody of knowledge necessary for all business man-agers. This book exposes readers to that commonbody of knowledge.
Studies have revealed a positive correlation be-tween job performance and functional knowledgeand competence (i.e., the 12 Learning Modules).Strong job performance is also correlated to higher
compensation, greater job security, and increased ca-reer opportunities.
High MBAIQ Score
Greater JobPerformance
HigherCompensation
Greater JobSecurity
Greater CareerOpportunities
ScoreYou can compute your MBA IQ through the onlineself-assessment exercises at www.mbaiq.com. Eachof the 12 Learning Modules is divided into specificlearning objectives, which are the basis for the self-assessment exercises. The self-assessment exerciseshave awareness, knowledge, and experience compo-nents. In other words, your MBA IQ is a combinationof these three components.
Learning Modules
Learning Objectives
Self-Assessment Exercises
Awareness Knowledge Experience
xix

JWBT150-Vallabhaneni fm August 7, 2009 19:5
xx Introduction
LeadershipIn management literature and business media, theterm leadership has come to connote personal char-acteristics, or soft skills. I believe the view of lead-ership needs to be broadened to include and per-haps even emphasize knowledge competencies, orhard skills. Today we need the competency-basedtype of leader. The competency-based leader isrooted in equal knowledge of hard and soft skills.A figurehead leader who possesses only soft skillsis no longer acceptable to direct complex busi-nesses and to lead knowledge workers. This bookenables an individual to develop the knowledge,skills, and abilities to become a competency-basedleader.
What Are Hard and Soft Skills?
Hard skills include analytical; technical; mathe-matical or quantitative data analysis; problemsolving; strategic planning; negotiating; andfunctional skills, such as accounting/finance,marketing, and operations.
Soft skills include communication skills;decision-making skills; time-managementskills; and people/interpersonal skills, such asmotivation, teamwork, conflict management,and leadership skills.
Business School AdmissionsThe Graduate Management Admission Test (GMAT[worldwide]) and Common Admission Test (CAT[India]) are among the admissions requirements totop MBA programs worldwide. These standardizedtests assess MBA aspirants in valuable noncore busi-ness skills, such as verbal, reading comprehension,data interpretation, logical reasoning, mathematical,analytical, and writing skills.
However, prospective MBA applicants need bothcore and noncore business skills to succeed in busi-ness school. Core business skills, which can belearned from the MBA IQ process, include func-tional skills in marketing, operations, quality, humanresources, accounting, finance, information technol-ogy, corporate governance, managerial economics,business law, international business, and generalmanagement.
When combined with the GMAT/CAT knowledge,the MBA IQ knowledge enables MBA aspirants to
maximize their coursework due to enhanced busi-ness knowledge and to be well prepared to takeadvanced MBA courses. Furthermore, the MBA IQself-assessment enables people to cope with and puttheir best foot forward during the fast-paced MBAprogram.
GMAT/CAT → Noncore business skillsMBA IQ → Core business skillsGMAT/CAT + MBA IQ = Preparedness for an
MBA program
In other words, there is built-in synergy amongMBA IQ, GMAT/CAT, and MBA.
Business PractitionersCareer DevelopmentThe MBA IQ process is just as applicable to businesspractitioners who may never pursue an MBA degreebecause it provides them with a roadmap of hardskills needed to be effective business managers andto help in the transition from business specialists tobusiness generalists.
The MBA IQ score reveals a person’s knowledgegaps. We encourage business practitioners to useexisting company training programs or third-partytraining programs in order to actively close theseknowledge gaps. For example, if an accountant isstrong in accounting and finance and perhaps weakin marketing and human resources (HR), we encour-age him to be deliberate in strengthening his market-ing and HR skills.
As the business practitioner takes on more assign-ments, receives promotions, or participates in cross-functional projects, we encourage him to recalculatehis MBA IQ so that he actively manages his knowl-edge competencies. Upward career movement ne-cessitates generalist rather than specialist knowl-edge. Using the accountant example again, his careertrajectory is influenced more by his understanding ofnonaccounting issues than by an even deeper levelof understanding of accounting. More accountingknowledge and training will strengthen his special-ist skills but not his generalist skills.
In the job search and recruiting process, we en-courage business practitioners to include their MBAIQ score as part of their resumes, showing poten-tial employers that they are actively managing theirknowledge competencies in a generalist fashion. Em-ployers value the fact that potential hires are actively

JWBT150-Vallabhaneni fm August 7, 2009 19:5
INTRODUCTION xxi
monitoring their knowledge strengths and weak-nesses.
Professional CertificationsRegardless of the MBA IQ score, an individualcan pursue either the Certified Associate Manager(CABM) Credential or the Certified Business Man-ager (CBM) Credential. The CBM is a professionalcertification based on an MBA curriculum while theCABM is based on a pre-MBA curriculum. In otherwords, the CABM is a stepping-stone for the CBMor an MBA. There is a natural and built-in synergyamong MBA IQ, the CABM/CBM Credentials, andthe MBA due to a common syllabus.
The MBA IQ self-assessment can be used to sat-isfy the continuing professional education (CPE)hours required for various professional certificationsin business, including the CABM and CBM. Thereare approximately 100 certifications in various func-tional areas, so please check with the continuing ed-ucation requirements of your certification to makesure that the MBA IQ can be used for CPE hours.
Professional management certification optionsavailable to business practitioners with MBA IQinclude:
Option 1: MBA IQ → CABMOption 2: MBA IQ → CABM → CBMOption 3: MBA IQ → CABM → MBAOption 4: MBA IQ → CABM → MBA →CBMOption 5: MBA IQ → CABM → CBM →MBAOption 6: MBA IQ → CBMOption 7: MBA IQ → CBM → MBA
Business Specialist versus GeneralistBusiness specialists work in a specific business func-tion handling a single role. They still need to havea full understanding of the inner workings of otherfunctions in order to become effective and efficient intheir current jobs. To understand what it means to bea business generalist, please refer to the GeneralistManifesto at the end of this section.
Who Is a Business Specialist?
A business specialist is an individual work-ing in accounting, auditing, advertising, mar-keting, risk management, project management,operations, supply chain, procurement, human
resources, staffing and recruiting, informationtechnology, software development, computer se-curity, product development, sales, finance, trea-sury, brand management, engineering, programmanagement, manufacturing, management con-sulting, investment banking, government con-tracts, quality assurance and control, service man-agement, learning and development, logistics,organizational development, fraud, investmentmanagement, research and development, or in-ternational business.
At some point in a business specialist’s career de-velopment, there will be a trade-off between increas-ing specialization and transitioning into a generalist.The MBA IQ process exposes business specialists towhat is required in the transition. An example ofhow an accountant with CPA credential (a businessspecialist in accounting) can turn into a vice pres-ident of finance (a business generalist) either withCBM credential or MBA is shown next:
CPA + CBM → Vice President of FinanceCPA + MBA → Vice President of Finance
In today’s flat organizational structures, result-ing from downsizing and restructuring, generalistsare prized by employers for their cross-functionalknowledge. Management recognizes a business gen-eralist because of his resourcefulness in handlingmultiple roles and tasks. This is because a gener-alist is a person who appears to be a specialist to aspecialist and a generalist to a generalist.
A business specialist handles one role at a time. Abusiness generalist handles multiple roles at a time.
Very often, business generalists are promoted tobusiness managers, general managers, division/group directors, senior managers, vice presidents,senior vice presidents, executive vice presidents,and presidents due to their strong cross-functionalknowledge base, greater core competencies with big-picture focus, and general management skills. Inessence, these generalists manage more than onebusiness function at a time in an efficient and ef-fective manner.
The figure below shows why business specialistsmust move to become business generalists on theircareer trajectory, moving from an entry-level job to amid-level to an executive-level position. The MBA IQknowledge can facilitate a smooth transition amongthese levels.

JWBT150-Vallabhaneni fm August 7, 2009 19:5
xxii Introduction
Entry Level
Mid Level
ExecutiveLevel
Specialist Generalist
Competencyover narrowfocus
Competencyover largerfocus
What happenshere is crucialfor careertrajectory
Begin MBAIQ process
Generalist ManifestoA generalist:
1. Understands where, when, and how a businessfunction fits into the rest of the organization.
2. Is cognizant of the key drivers of each functionas well as the entire organization.
3. Makes decisions that are best for the entire orga-nization, not at the expense of other functions.
4. Has an understanding of the level of impact (i.e.,low, medium, and high) of a decision taken byone function on other, interrelated functions ofan organization.
5. Appreciates how the rate of business velocities(i.e., sales, inventory, production, finance, hu-man resources, and systems) in a specific busi-ness unit affects other business units.
6. Has an understanding of how the Chain ofKnowledge is established, maintained, and ap-plied to employees and to the management hier-archy in order to keep the knowledge base con-sistent and current.
7. Listens to all stakeholder voices at one time in-stead of listening to one voice at a time and hasthe ability to integrate all voices simultaneously.
8. Has a greater working knowledge of the indus-try in which an employee works and a companyoperates and how that industry knowledge af-fects the inter- and intra-industries.
9. Filters business noise and understands the impli-cations of management fads and has the abilityto select and apply only what is right for theorganization.
10. Possesses a strong functional knowledge of allbusiness requirements and has the ability tokeep that knowledge current through continu-ous learning, training, and self-improvement.
11. Solves business problems aimed at the rootcause, instead of at the symptom, so that solu-tions have a far-reaching and positive effect.
12. Possesses a big-picture view of the entire com-pany and the industry in which the companyoperates.
13. Is viewed by senior management as a poten-tial candidate in the succession planning pool oftalent.
14. Maintains an understanding and complies withall applicable laws, rules, and regulations affect-ing the organization and the industry to reduceor eliminate enterprise-wide risks.
15. Above all, is a person who appears to be a spe-cialist to a specialist and a generalist to a gener-alist.

JWBT150-Vallabhaneni fm August 7, 2009 19:5
WHAT’S YOURMBA IQTM?
xxiii

JWBT150-Vallabhaneni fm August 7, 2009 19:5
xxiv

JWBT150-Vallabhaneni c01 July 28, 2009 17:25
LEARNING MODULE 1
General Management, Leadership,and Strategy
Learning Objective 1.1: Understand theScope and Nature of CorporateStrategies 2Strategic Management Defined 2Strategic Management Process 2Strategic Planning Process 5Competitive Strategies 6Blue-Ocean/Red-Ocean Strategies 7McKinsey 7-S Framework 8Portfolio Techniques to Improve Strategy and
Competitiveness 8Learning Objective 1.2: Understand the
Importance of Planning andOrganizing Skills 10Management Functions 10Planning Defined 10Organizing Defined 11Characteristics of Organization Structure 11
Learning Objective 1.3: Understand theImportance of Directing and LeadingSkills 14Leadership Defined 14Leadership Theories 14Other Theories of Leadership 16Leadership Categories 16Management Defined 17Management Skills Defined 17Management Types 17Managerial Roles 18Management Assumptions
about Employees 18Leaders versus Managers versus
Entrepreneurs 19Mentoring 19Delegation 19
Learning Objective 1.4: Understand theImportance of Controlling andMeasuring Skills 19Controlling Defined 19Management Controls 20Measuring Defined 20
Learning Objective 1.5: Understand theImportance of Motivating Skills 21Motivation Defined 21Motivation Theories 21Motivation Strategies 22
Learning Objective 1.6: Understand theImportance of Problem-Solving andDecision-Making Skills 23Problem Defined 23Problem-Solving Process 23Impediments to Problem Solving 23Reasons Individuals Solve Problems
Differently 24Tools and Techniques for Problem Solving 24Decision Defined 24Decision-Making Process 24Facets of Decision Making 24Decision-Making Models 24Types of Decisions 25Types of Data Used in Decision Making 25Tools and Techniques for Decision Making 25Decision Making versus Problem Solving 25Group Dynamics 25Group Behaviors 26Factors Affecting Group Decisions 26Manager’s Information Processing Styles 26Stages of Group Development 26Criteria and Determinants of Group
Effectiveness 27Groups and Individuals 27Group Structures 28Methods Used in Team Building 29
Learning Objective 1.7: Understand theImportance of Negotiating Skills 30Negotiation Defined 30Process of Negotiation 30Why Opposition? 30What Is Negotiation? 30Elements of Negotiation 30Modes of Negotiation 31Compromise versus Collaboration 31
1

JWBT150-Vallabhaneni c01 July 28, 2009 17:25
2 Learning Module 1: General Management, Leadership, and Strategy
Do’s and Don’ts of Negotiations 31Added-Value Negotiating 32BATNA 32
Learning Objective 1.8: Understand theImportance of Communication Skills 32Communication Defined 33Communication Chain 33Formal Communications 34Informal Communications 34Barriers to Communication 34Essentials for Effective Communication 35Information Communicated by Others 35
Learning Objective 1.9: Understand theImportance of Conflict ManagementSkills 35Conflict Defined 35Personal Conflict Prevention and Control Methods 36Group or Organizational Conflict Prevention
and Control Methods 36Tools for Managing Conflict 37
Learning Objective 1.10: Understandthe Various Issues in OrganizationalBehavior, Culture, Change,Development, Effectiveness, andDecline 38Organizational Behavior Defined 38Organizational Culture Defined 39Organizational Change Defined 39Organizational Development Defined 41Organizational Effectiveness Defined 41Organizational Decline Defined 41
Learning Objective 1.11: UnderstandHow to Measure and ManageBusiness Performance Results 42Productivity Defined 42Components of Productivity Measurement 42Effectiveness, Efficiency, and Economy Defined 43Design of Performance Measurement
Systems 43
❑ Learning Objective 1.1:UNDERSTAND THE SCOPE ANDNATURE OF CORPORATESTRATEGIESThe scope of this learning objective includes definingstrategic management and its processes in terms ofgrand strategy and strategic planning, implementa-tion, and control. It concludes with describing strate-gic planning process and competitive strategies.
Strategic Management DefinedStrategic management is the set of decisions and ac-tions used to formulate and implement strategiesthat will provide a competitively superior fit be-tween the organization and its environment so asto achieve organizational goals. Managers ask ques-tions such as, “What changes and trends are occur-ring in the competitive environment? Who are ourcustomers? What products or services should we of-fer? How can we offer those products and servicesmost efficiently?” Answers to these questions helpmanagers make choices about how to position theirorganization in the environment with respect to rivalcompanies. Superior organizational performance isnot a matter of luck. It is determined by the choicesthat managers make.
Strategic Management ProcessTop executives use strategic management to definean overall direction for the organization. The strate-gic management process is defined as a series ofactivities:
Grand Strategy → Strategic Planning →Strategy Implementation → Strategic Control
Grand StrategyGrand strategy is the general plan of major action bywhich a firm intends to achieve its long-term goals.Grand strategies can be defined using four generalcategories: (1) growth, (2) stability, (3) retrenchment,and (4) global operations.
1. Growth can be promoted internally by investingin expansion or externally by acquiring additionalbusiness divisions. Internal growth can includedevelopment of new or changed products or ex-pansion of current products into new markets. Ex-ternal growth typically involves diversification,which means the acquisition of businesses thatare related to current product lines or that takethe corporation into new areas. The number ofcompanies choosing to grow through mergers andacquisitions is astounding, as organizations strive

JWBT150-Vallabhaneni c01 July 28, 2009 17:25
LEARNING OBJECTIVE 1.1: UNDERSTAND THE SCOPE AND NATURE OF CORPORATE STRATEGIES 3
to acquire the size and resources to compete on aglobal scale, to invest in new technology, and tocontrol distribution channels and guarantee ac-cess to markets.
2. Stability, sometimes called a pause strategy,means that the organization wants to remain thesame size or grow slowly and in a controlled fash-ion. The corporation wants to stay in its currentbusiness. After organizations have undergone aturbulent period of rapid growth, executives oftenfocus on a stability strategy to integrate strategicbusiness units and to ensure that the organizationis working efficiently.
3. Retrenchment means that the organization goesthrough a period of forced decline by eithershrinking current business units or selling off orliquidating entire businesses. The organizationmay have experienced a precipitous drop in de-mand for its products or services, prompting man-agers to order across-the-board cuts in personneland expenditures. Liquidation means selling off abusiness unit for the cash value of the assets, thusterminating its existence. Divestiture involves theselling off of businesses that no longer seem cen-tral to the corporation. Studies show that between33 and 50 percent of all acquisitions are later di-vested. Retrenchment is also called downsizing.
4. In today’s global operations, senior executives tryto formulate coherent strategies to provide syn-ergy among worldwide operations for the pur-pose of fulfilling common goals. Each country orregion represents a new market with the promiseof increased sales and profits. In the internationalarena, companies face a strategic dilemma be-tween global integration and national responsive-ness. Organizations must decide whether theywant each global affiliate to act autonomouslyor whether activities should be standardized andcentralized across countries. This choice leadsmanagers to select a basic grand strategy alterna-tive such as globalization versus multidomesticstrategy. Some corporations may seek to achieveboth global integration and national responsive-ness by using a transnational strategy.
Strategic PlanningThe overall strategic management process beginswhen executives evaluate their current position withrespect to mission, goals, and strategies. They thenscan the organization’s internal and external envi-
ronments and identify strategic factors that mightrequire change. Internal or external events might in-dicate a need to redefine the mission or goals orto formulate a new strategy at either the corporate,business unit, or functional level.
Strategy formulation includes the planning anddecision making that lead to the establishment of thefirm’s goals and the development of a specific strate-gic plan. Strategy formulation may include assessingthe external environment and internal problems andintegrating the results into goals and strategy. Thisis in contrast to strategy implementation, which isthe use of managerial and organizational tools todirect resources toward accomplishing strategic re-sults. Strategy implementation is the administrationand execution of the strategic plan. Managers mayuse persuasion, new equipment, changes in organi-zation structure, or a reward system to ensure thatemployees and resources are used to make formu-lated strategy a reality.
Planning (formulating) strategy often begins withan assessment of the internal and external factorsthat will affect the organization’s competitive situa-tion. Situation analysis typically includes a searchfor SWOTs (strengths, weaknesses, opportunities,and threats) that affect organizational performance.Situation analysis is important to all companies butis crucial to those considering globalization becauseof the diverse environments in which they will op-erate. External information about opportunities andthreats may be obtained from a variety of sources,including customers, government reports, profes-sional journals, suppliers, bankers, friends in otherorganizations, consultants, or association meetings.Many firms hire special scanning organizations toprovide them with newspaper clippings, Internet re-search, and analyses of relevant domestic and globaltrends. Some firms use more subtle techniques tolearn about competitors, such as asking potential re-cruits about their visits to other companies, hiringpeople away from competitors, debriefing formeremployees or customers of competitors, taking planttours posing as “innocent” visitors, and even buyingcompetitors’ garbage. In addition, many companiesare hiring competitive intelligence professionals toscope out competitors.
Executives acquire information about internalstrengths and weaknesses from a variety of reports,including budgets, financial ratios, profit-and-lossstatements, and surveys of employee attitudes andsatisfaction. Managers spend 80 percent of their time
JWBT150-Vallabhaneni c01 July 28, 2009 17:25
4 Learning Module 1: General Management, Leadership, and Strategy
giving and receiving information. Through frequentface-to-face discussions and meetings with peopleat all levels of the hierarchy, executives build an un-derstanding of the company’s internal strengths andweaknesses.
Internal strengths are positive internal character-istics that the organization can exploit to achieveits strategic performance goals. Internal weaknessesare internal characteristics that might inhibit or re-strict the organization’s performance. The informa-tion sought typically pertains to specific functionssuch as marketing, finance, production, and researchand development (R&D). Internal analysis also ex-amines overall organization structure, managementcompetence and quality, and human resource char-acteristics. Based on their understanding of theseareas, managers can determine their strengths orweaknesses vis-a-vis other companies.
External threats are characteristics of the externalenvironment that may prevent the organization fromachieving its strategic goals. External opportunitiesare characteristics of the external environment thathave the potential to help the organization achieveor exceed its strategic goals. Executives evaluate theexternal environment with information about var-ious sectors. The task environment sectors are themost relevant to strategic behavior and include thebehavior of competitors, customers, suppliers, andthe labor supply. The general environment containsthose sectors that have an indirect influence on theorganization but nevertheless must be understoodand incorporated into strategic behavior. The gen-eral environment includes technological develop-ments, the economy, legal-political and internationalevents, and sociocultural changes. Additional areasthat might reveal opportunities or threats includepressure groups, interest groups, creditors, naturalresources, and potentially competitive industries.
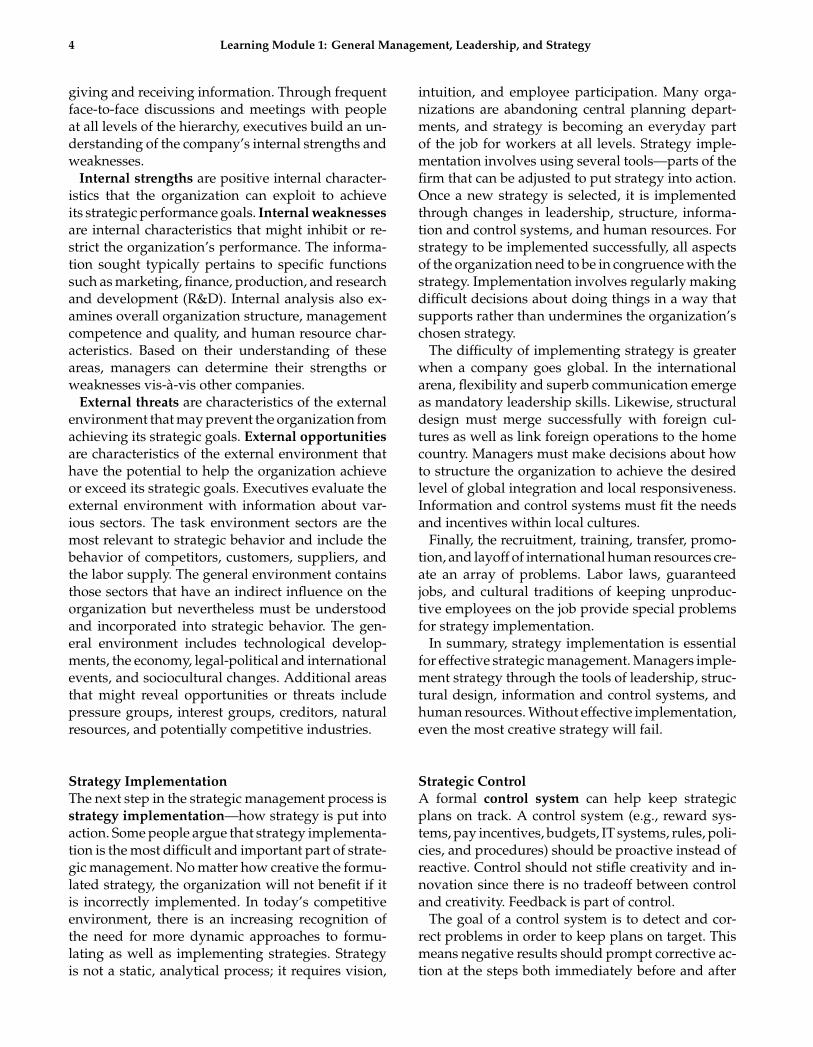
Strategy ImplementationThe next step in the strategic management process isstrategy implementation—how strategy is put intoaction. Some people argue that strategy implementa-tion is the most difficult and important part of strate-gic management. No matter how creative the formu-lated strategy, the organization will not benefit if itis incorrectly implemented. In today’s competitiveenvironment, there is an increasing recognition ofthe need for more dynamic approaches to formu-lating as well as implementing strategies. Strategyis not a static, analytical process; it requires vision,
intuition, and employee participation. Many orga-nizations are abandoning central planning depart-ments, and strategy is becoming an everyday partof the job for workers at all levels. Strategy imple-mentation involves using several tools—parts of thefirm that can be adjusted to put strategy into action.Once a new strategy is selected, it is implementedthrough changes in leadership, structure, informa-tion and control systems, and human resources. Forstrategy to be implemented successfully, all aspectsof the organization need to be in congruence with thestrategy. Implementation involves regularly makingdifficult decisions about doing things in a way thatsupports rather than undermines the organization’schosen strategy.
The difficulty of implementing strategy is greaterwhen a company goes global. In the internationalarena, flexibility and superb communication emergeas mandatory leadership skills. Likewise, structuraldesign must merge successfully with foreign cul-tures as well as link foreign operations to the homecountry. Managers must make decisions about howto structure the organization to achieve the desiredlevel of global integration and local responsiveness.Information and control systems must fit the needsand incentives within local cultures.
Finally, the recruitment, training, transfer, promo-tion, and layoff of international human resources cre-ate an array of problems. Labor laws, guaranteedjobs, and cultural traditions of keeping unproduc-tive employees on the job provide special problemsfor strategy implementation.
In summary, strategy implementation is essentialfor effective strategic management. Managers imple-ment strategy through the tools of leadership, struc-tural design, information and control systems, andhuman resources. Without effective implementation,even the most creative strategy will fail.
Strategic ControlA formal control system can help keep strategicplans on track. A control system (e.g., reward sys-tems, pay incentives, budgets, IT systems, rules, poli-cies, and procedures) should be proactive instead ofreactive. Control should not stifle creativity and in-novation since there is no tradeoff between controland creativity. Feedback is part of control.
The goal of a control system is to detect and cor-rect problems in order to keep plans on target. Thismeans negative results should prompt corrective ac-tion at the steps both immediately before and after

JWBT150-Vallabhaneni c01 July 28, 2009 17:25
LEARNING OBJECTIVE 1.1: UNDERSTAND THE SCOPE AND NATURE OF CORPORATE STRATEGIES 5
problem identification. Some examples of correctiveactions include updating assumptions, reformulat-ing plans, rewriting polices and procedures, makingpersonnel changes, modifying budget allocations,and improving IT systems.
Strategic Planning ProcessThe input to the strategic planning process is thestrategic management process. The output of thestrategic planning process is the development ofa strategic plan. Its four components include:
1. Organizational mission. Every organization ex-ists to accomplish something, and the missionstatement is a reflection of this. The mission state-ment of an organization should be a long-term vi-sion of what the organization is trying to become,the unique aim that differentiates the organiza-tion from similar ones. It raises questions such as“What is our business?” and “What should it be?”In developing a statement of mission, manage-ment must take into account three key elements:a. The organization’s historyb. The organization’s distinctive competenciesc. The organization’s environment
The organization’s environment dictates the op-portunities, constraints, and threats that must beidentified before a mission statement is devel-oped.
When completed, an effective mission state-ment will be focused on markets rather than prod-ucts, achievable, motivating, and specific. A keyfeature of mission statements has been an externalrather than internal focus. This means, the missionstatement should focus on the broad class of needsthat the organization is seeking to satisfy (exter-nal focus), not on the physical product or servicethat the organization is offering at present (inter-nal focus). As Peter Drucker put it, the question“What is our business?” can be answered only bylooking at the business from the outside, from thepoint of view of customer and market.
A mission statement should be realistic andachievable and should not lead the organizationinto unrealistic ventures far beyond its competen-cies. A mission statement is a guide to all em-ployees and provides a shared sense of purposeand strong motivation to achieve objectives of theorganization.
A mission statement must be specific to providedirection to management when they are choos-
ing between alternative courses of action. For ex-ample, a mission “to provide the highest qualityproducts at the lowest possible cost” sounds good,but it is not specific enough to be useful. Specificquantitative goals are easier to measure.
2. Organizational objectives. An organization’smission is converted into specific, measurable,and action-oriented commitments and objectives.These objectives in turn provide direction, estab-lish priorities, and facilitate management control.When these objectives are accomplished, the or-ganization’s mission is also accomplished. PeterDrucker advises at least eight areas for estab-lishing objectives, including: (1) market stand-ing, (2) innovations, (3) productivity, (4) phys-ical and financial resources, (5) profitability,(6) manager performance and responsibility, (7)worker performance and attitude, and (8) socialresponsibility.
3. Organizational strategies. Organizational strat-egy involves identifying the general approachesa business should take in order to achieve its ob-jectives. It sets the major directions for the orga-nization to follow. Specific steps include under-standing and managing the current customer andcurrent products and identifying new customersand new products. Mission and objectives lead anorganization where it wants to go. Strategies helpan organization to get there.
The organizational strategy described in termsof a product/market matrix is shown here:
Current products New products
Current Market penetration Productcustomers development
New customers Market development Diversification
Market penetration strategy focuses on im-proving the position of the present product withits present customers. It involves designing a mar-keting plan to encourage customers to purchasemore of a product. It can also include a produc-tion plan to produce more efficiently what is be-ing produced at present. Market developmentstrategy would seek to find new customers forits present products. With the product develop-ment strategy, new products are developed forpresent customers. Diversification strategy seeksnew products for new customers.
4. Organizational portfolio plan. An organizationcan be thought of as a portfolio of businesses (i.e.,combination of product lines and divisions and

JWBT150-Vallabhaneni c01 July 28, 2009 17:25
6 Learning Module 1: General Management, Leadership, and Strategy
service lines and divisions). It is understandablethat some product lines will be more profitablethan others. Management must decide whichproduct lines or divisions to build, maintain, add,or eliminate.
Competitive StrategiesPorter’s five competitive forces include (1) threatof new entrants, (2) rivalry among existing firms,(3) pressure from substitute products or services,(4) bargaining power of buyers, and (5) bargainingpower of suppliers. All five competitive forces jointlydetermine the intensity of industry competition andprofitability.
1. Threat of new entrants. New entrants to an in-dustry bring new capacity and the desire to gainmarket share, and they often also bring substan-tial resources. As a result, prices can be low, costcan be high, and profits can be low. There is a rela-tionship between threat of new entrants, barriersto entry, and reaction from existing competitors.For example:� If barriers are high and reaction is high, then the
threat of entry is low.� If barriers are low and reaction is low, then the
threat of entry is high.There are seven major barriers to entry, includ-
ing: (1) economies of scale, (2) product differentia-tion, (3) capital requirements, (4) switching costs,(5) access to distribution channels, (6) cost disad-vantages independent of scale, and (7) govern-ment policy.
2. Rivalry among existing firms. Rivalry tactics in-clude price competition, advertising battles, newproduct introduction, and increased customer ser-vice or product/service warranties. Competitorsare mutually dependent in terms of action andreaction, moves and countermoves, or offensiveand defensive tactics. Intense rivalry is the re-sult of a number of interacting structural factors,such as numerous or equally balanced competi-tors, slow industry growth, high fixed costs orstorage costs, lack of differentiation or switchingcosts, capacity increased in large increments, di-verse competitors, high strategic stakes, and highexit barriers.
3. Pressure from substitute products or services.In a broad sense, all firms in an industry arecompetitors with industries producing substituteproducts. Substitutes limit the potential returns
of an industry by placing a ceiling on the pricesfirms can profitably charge. The more attractivethe price–performance alternative offered by sub-stitutes, the stronger or firmer the lid on indus-try profits. Substitute products that deserve themost attention are those that are subject to trendsimproving their price–performance trade-off withthe industry’s product or produced by industriesearning high profits.
4. Bargaining power of buyers. Buyers competewith the industry by forcing down prices, bar-gaining for higher quality or more services, andplaying competitors against each other—all at theexpense of industry profits. A buyer group is pow-erful if the following circumstances hold true: itis concentrated or purchases large volumes rela-tive to seller sales; the products it purchases fromthe industry represent a significant fraction of thebuyer’s costs or purchases; the products it pur-chases from the industry are standard or undif-ferentiated; it faces few switching costs; it earnslow profits; buyers pose a credible threat of back-ward integration; the industry’s product is unim-portant to the quality of the buyers’ products orservices; and the buyer has full information aboutdemand, prices, and costs. Informed customers(buyers) become empowered customers.
5. Bargaining power of suppliers. Suppliers can ex-ert bargaining power over participants in an in-dustry by threatening to raise prices or reduce thequality of purchased goods or services. The con-ditions making suppliers powerful tend to mirrorthose making buyers powerful. A supplier groupis powerful if the following apply: it is dominatedby a few companies and is more concentrated thanthe industry it sells to; it is not obligated to con-tend with other substitute products for sale to theindustry; the industry is not an important cus-tomer of the supplier group; the supplier’s prod-uct is an important input to the buyer’s business;the supplier group’s products are differentiatedor it has built up switching costs; and the suppliergroup poses a threat of forward integration.
Competitive strategy involves taking offensive ordefensive actions to create a better position in an in-dustry and to cope with the five competitive forcesin order to achieve a superior return on investment.Porter’s three competitive strategies include: (1) dif-ferentiation, (2) low-cost leadership, and (3) focus.
The differentiation strategy involves an attemptto distinguish the firm’s products or services from

JWBT150-Vallabhaneni c01 July 28, 2009 17:25
LEARNING OBJECTIVE 1.1: UNDERSTAND THE SCOPE AND NATURE OF CORPORATE STRATEGIES 7
others in the industry. An organization may use ad-vertising, distinctive product features, exceptionalservice, or new technology to achieve a product thatis perceived as unique. This strategy usually targetscustomers who are not particularly concerned withprice, so it can be quite profitable. The differentia-tion strategy can be profitable because customers areloyal and will pay high prices for the product. Com-panies that pursue a differentiation strategy typi-cally need strong marketing abilities, a creative flair,and a reputation for leadership.
A differentiation strategy can reduce rivalry withcompetitors and fight off the threat of substituteproducts because customers are loyal to the com-pany’s brand. However, companies must remem-ber that successful differentiation strategies require anumber of costly activities, such as product researchand design and extensive advertising.
With a low-cost leadership strategy, the organi-zation aggressively seeks efficient facilities, pursuescost reductions, and uses tight cost controls to pro-duce products more efficiently than competitors. Alow-cost position means that the company can un-dercut competitors’ prices and still offer comparablequality and earn a reasonable profit. Being a low-costproducer provides a successful strategy to defendagainst the five competitive forces. For example, themost efficient, low-cost company is in the best posi-tion to succeed in a price war while still making aprofit. Likewise, the low-cost producer is protectedfrom powerful customers and suppliers because cus-tomers cannot find lower prices elsewhere and be-cause other buyers would have less slack for pricenegotiation with suppliers. If substitute products orpotential new entrants occur, the low-cost produceris better positioned than higher-cost rivals to preventloss of market share. The low price acts as a barrieragainst new entrants and substitute products.
The low-cost leadership strategy tries to increasemarket share by emphasizing low cost comparedto competitors. This strategy is concerned primar-ily with stability rather than taking risks or seekingnew opportunities for innovation and growth.
With Porter’s third strategy, the focus strategy, theorganization concentrates on a specific regional mar-ket or buyer group. The company will use either afocused differentiation or focused low-cost, but onlyfor a narrow target market.
Managers must think carefully about which strat-egy will provide their company with its competitiveadvantage. In his studies, Porter found that somebusinesses did not consciously adopt one of these
three strategies and were stuck with no strategic ad-vantage. Without a strategic advantage, businessesearned below-average profits compared with thosethat used differentiation, cost leadership, or focusstrategies.
These three strategies require different styles ofleadership and can translate into different corpo-rate cultures. A firm that is “stuck in the middle”is the one that has failed to develop its strategy inat least one of the three directions. The firm stuckin the middle has low profitability, lost high-volumecustomers, lost high-margin businesses, blurred cor-porate culture, and conflicting motivational systems.Risks in pursuing the three generic strategies includefailing to attain or sustain the strategy and erodingthe strategic advantage with industry evolution.
Blue-Ocean/Red-Ocean StrategiesAuthors Kim and Mauborgne (Havard Business Re-view, October 2004) first discussed the concept ofblue-ocean strategy where its scope encompasses allthe industries not in existence today—the unknownmarket space that is untainted by competition. Inblue-ocean strategy, demand is created rather thanfought over. There is ample opportunity for bothprofits and growth created by blue-ocean strategybecause it deals with new and uncontested marketspace that makes competition irrelevant.
On the other hand, red-ocean strategy workswithin the established market spaces that are slowlyand steadily shrinking. It deals with old and highlycontested market space where competition is rele-vant, vigorous, and overcrowded. One firm tries tosteal a share of demand from other firms, insteadof creating its own demand. The following tablepresents the differences between the red-ocean andblue-ocean strategies:
Red-Ocean Strategy Blue-Ocean Strategy
Compete in existing marketspace
Create uncontested marketspace
Beat the competition Make the competitionirrelevant
Exploit existing demand Create and capture newdemand
Make the value/cost trade-off Break the value/cost trade-offAlign the whole system of a
company’s activities withits strategic choice ofdifferentiation or low costseparately
Align the whole system of acompany’s activities inpursuit of differentiationand low cost simultaneously
It is interesting to note that both the blue- and red-ocean strategies have always coexisted and always

JWBT150-Vallabhaneni c01 July 28, 2009 17:25
8 Learning Module 1: General Management, Leadership, and Strategy
will, and the one who separates them and breaksout of the old mold will win big. Practical reality,therefore, requires that corporate management un-derstand the strategic logic of both types of oceansbefore diving into them.
McKinsey 7-S FrameworkThe premier management consulting firm, Mc-Kinsey & Company, has developed a 7-S frameworkas criteria for an organization’s success. This frame-work includes seven elements: structure, strategy,skills, staff, style, systems, and shared values.
Structure is the way in which tasks and peopleare specialized and divided and authority is dis-tributed. It consists of the basic grouping of ac-tivities and reporting relationships into organiza-tional sub-units. It includes the mechanisms bywhich the activities of the members of the organi-zation are coordinated. There are four basic struc-tural forms—functional, divisional, matrix, andnetwork, where the functional form is the mostcommon of all.
Strategy is the way in which competitive advantageis achieved. It includes taking actions to gain a sus-tainable advantage over the competition, adopt-ing a low-cost strategy, and differentiating prod-ucts or services.
Skills include the distinctive competencies that re-side in the organization. They can be distinctivecompetencies of people, management practices,systems, and/or technology.
Staff includes employees, their backgrounds, andcompetencies. It consists of the organization’s ap-proaches to recruitment, selection, and socializa-tion. It focuses on how people are developed, howrecruits are trained, socialized, and integrated,and how their careers are managed.
Style deals with the leadership style of top manage-ment and the overall operating style of the organi-zation. Style impacts the norms employees followand how they work and interact with each otherand with customers.
Systems include the formal and informal processesand procedures used to manage the organization,including management control systems; perfor-mance measurement and reward systems; plan-ning, budgeting, and resource allocation systems;information systems; and distribution systems.
Shared values are the core set of values that arewidely shared in the organization and serve as
guiding principles of what is important. Thesevalues have great meaning to employees becausethey help focus attention and provide a broadersense of purpose. Shared values are one of themost important elements of an organization’s cul-ture.
In order to manage the change process and seekimprovements needed, organizations are classify-ing these seven elements into two groups: hard S’sand soft S’s. Hard S’s include strategy, structure,and systems, which are easier to change than thesoft S’s, and the change process can begin withhard S’s. Soft S’s include staffing, skills, style, andshared values, which are harder to change directlyand take longer to do. Both hard S’s and soft S’sare equally important to an organization.
Portfolio Techniques to Improve Strategyand CompetitivenessA firm is said to have a sustainable competitiveadvantage over other firms when it has techni-cal superiority, low-cost production, good customerservice/product support, good location, adequatefinancial resources, continuing product innovations,and overall marketing skills.
Portfolio strategy pertains to the mix of businessunits and product lines that fit together in a log-ical way to provide synergy and competitive ad-vantage for the corporation. For example, an in-dividual might wish to diversify in an investmentportfolio with some high-risk stocks, some low-riskstocks, some growth stocks, and perhaps a few fixed-income bonds. In much the same way, corporationslike to have a balanced mix of business divisionscalled strategic business units (SBUs). An SBU hasa unique business mission, product line, competi-tors, and markets relative to other SBUs in the cor-poration. Executives in charge of the entire corpo-ration generally define the grand strategy and thenbring together a portfolio of strategic business unitsto carry it out.
Portfolio models can help corporate managementto determine how resources should be allocatedamong the various SBUs, consisting of productlines and/or divisions. The portfolio techniques aremore useful at the corporate-level strategy than atthe business-level or functional-level strategy. Twowidely used portfolio models are (1) the Boston Con-sulting Group (BCG) matrix and (2) the General Elec-tric (GE) model. Each model is presented in the fol-lowing sections.

JWBT150-Vallabhaneni c01 July 28, 2009 17:25
LEARNING OBJECTIVE 1.1: UNDERSTAND THE SCOPE AND NATURE OF CORPORATE STRATEGIES 9
BCG Matrix ModelThe BCG matrix model organizes businesses alongtwo dimensions—business growth rate and mar-ket share. Business growth rate pertains to howrapidly the entire industry is increasing. Marketshare defines whether a business unit has a larger orsmaller share than competitors. The combinations ofhigh and low market share and high and low busi-ness growth provide four categories for a corporateportfolio.
The BCG matrix model utilizes a concept of experi-ence curves, which are similar in concept to learningcurves. The experience curve includes all costs asso-ciated with a product and implies that the per-unitcost of a product should fall, due to cumulative ex-perience, as production volume increases. The man-ufacturer with the largest volume and market shareshould have the lowest marginal cost. The leader inmarket share should be able to underprice competi-tors and discourage entry into the market by poten-tial competitors. As a result, the leader will achievean acceptable return on investment.
The BCG model (growth/market share matrix)is based on the assumption that profitability andcash flows will be closely related to sales volume.Here, growth means use of cash, and market sharemeans source of cash. Each SBU is classified interms of its relative market share and the growthrate of the market the SBU is in, and each productis classified as stars, cash cows, dogs, or questionmarks. Relative market share is the market share ofa firm relative to that of the largest competitor in theindustry.
The following list describes the components of theBCG model:
� Stars are SBUs with a high market share of a high-growth market. They require large amounts of cashto sustain growth despite producing high profits.
� Cash cows are often market leaders (high mar-ket share), but the market they are in is a mature,slow-growth industry (low growth). They have apositive cash flow.
� Dogs are poorly performing SBUs that have a lowmarket share of a low-growth market. They aremodest cash users and need cash because of theirweak competitive position.
� Question marks (problem children) are SBUswith a low market share of a new, high-growthmarket. They require large amounts of cash in-flows to finance growth and are weak cash genera-tors because of their poor competitive position. The
question mark business is risky: it could become astar, or it could fail.
The following is the desirable sequence of portfolioactions for the BCG model:
� A star SBU eventually becomes a cash cow as itsmarket growth slows.
� Cash cow SBUs should be used to turn questionmarks into stars.
� Dog SBUs should either be harvested or divestedfrom the portfolio.
� The question mark SBUs can be nurtured to be-come future stars.
� Unqualified question mark SBUs should be har-vested until they become dogs.
GE ModelThe General Electric (GE) Model is an alternativeto the BCG model and it incorporates more in-formation about market opportunities (industry at-tractiveness) and competitive positions (company/business strength) to allocate resources. The GEmodel emphasizes all the potential sources of busi-ness strength and all the factors that influence thelong-term attractiveness of a market. All SBUs areclassified in terms of business strength (i.e., strong,average, weak) and industry attractiveness (i.e.,high, medium, low).
Business strength is made up of market share,quality leadership, technological position, companyprofitability, company strengths and weaknesses,and company image. The major components ofindustry attractiveness are market size, marketshare, market growth, industry profitability, andpricing.
Overall strategic choices include either to investcapital to build position, to hold the position by bal-ancing cash generation and selective cash use, or toharvest or divest. The GE model incorporates sub-jective judgment, and accordingly, it is vulnerableto manipulation. However, it can be made strongerwith the use of objective criteria.
BCG Matrix versus GE ModelBoth the BCG matrix model and the GE model helpin competitive analysis and provide a consistencycheck in formulating a competitive strategy for aparticular industry. Either model can be used as perthe manager’s preference. However, if a competitoruses the BCG model because of experience curves,then a company can benefit by using the same model.

JWBT150-Vallabhaneni c01 July 28, 2009 17:25
10 Learning Module 1: General Management, Leadership, and Strategy
The following is a comparison among BCG, GE,and Porter:
� Both the BCG matrix and the GE model focus oncorporate-level strategy accomplished through ac-quisition or divestment of business.
� Porter’s five competitive forces and three compet-itive strategies focus on business-level strategy ac-complished through competitive actions.
Despite its widespread use in allocating corpo-rate resources and acceptance by managers, the BCGmodel has been criticized for:
� Focusing on market share and market growth asthe primary indicators of profitability.
� Its assumption that the major source of SBU financ-ing comes from internal means.
� Its assumption that the target market has been de-fined properly along with its interdependencieswith other markets.
❑ Learning Objective 1.2:UNDERSTAND THE IMPORTANCEOF PLANNING ANDORGANIZING SKILLSPlanning and organizing are the first two functionsof management, as discussed in this learning objec-tive. Planning sets the direction for the other threefunctions of management, which are organizing, di-recting, and controlling.
Management FunctionsManagement is the attainment of organizationalgoals and objectives through planning, organizing,directing (leading), and controlling functions. Man-agers use a multitude of skills to perform these fourfunctions in the process of utilizing an organization’sresources in an effective and efficient manner. Thecorrect sequence of management functions is shownhere:
Planning → Organizing → Directing→ Controlling
Planning DefinedPlanning defines where the organization wants to bein the future and how to get there. Planning meansdefining goals for future organizational performanceand deciding on the tasks and use of resources
needed to attain them. A lack of planning—or poorplanning—can hurt an organization’s performance.
Types of plans include strategic, tactical, and oper-ational plans. The time horizon for a strategic planis between three and five years as it deals with thebroadest and most complex issues that will have adramatic impact, both positively and negatively, onthe success and survival of an entire organization.The time horizon for a tactical plan is between oneand two years as it deals with a specific businessand its product lines by translating strategic plans.The time horizon for an operational plan is less thana year as it deals with a specific department and itsfunctions by translating tactical plans. These threetypes of plans are interconnected.
Planning levels include corporate, business unit,and functional, which are developed by managers atvarious levels of the company. For example, strategicplans are developed at the corporate level and busi-ness unit level. Tactical plans are developed at thebusiness unit level and functional level. Operationalplans are developed only at the functional level. Thelower levels support the higher levels, meaning thatthe functional level supports the business unit andcorporate levels and that the business unit level sup-ports the corporate level. A corporate-level strategyis concerned with the question, “What business arewe in?”; “How do we compete?” is related to busi-ness unit–level strategy; and “How do we supportour chosen strategy?” is related to functional-levelstrategy.
The following shows a linkage of planning levelsto planning types:
Planning TypesPlanning Levels
Strategic PlansCorporate Level
Tactical PlansBusiness Unit Level
Operational PlansFunctional Level
The planning process consists of six stages orsteps: (1) analyzing external environment, (2) assess-ing internal resources, (3) establishing goals and ob-jectives, (4) developing action plans, (5) implement-ing action plans, and (6) monitoring outcomes.
The planning tools include portfolio techniques,budgets, and performance goals, resulting from thetranslation of plans. Portfolio techniques includemodels to improve portfolio strategy and compet-itiveness. Budgets are financial goals and includeoperating budgets (e.g., revenue, expense, and in-come budgets) and capital budgets (e.g., to acquirelong-term, fixed, assets). Budgets can be prepared
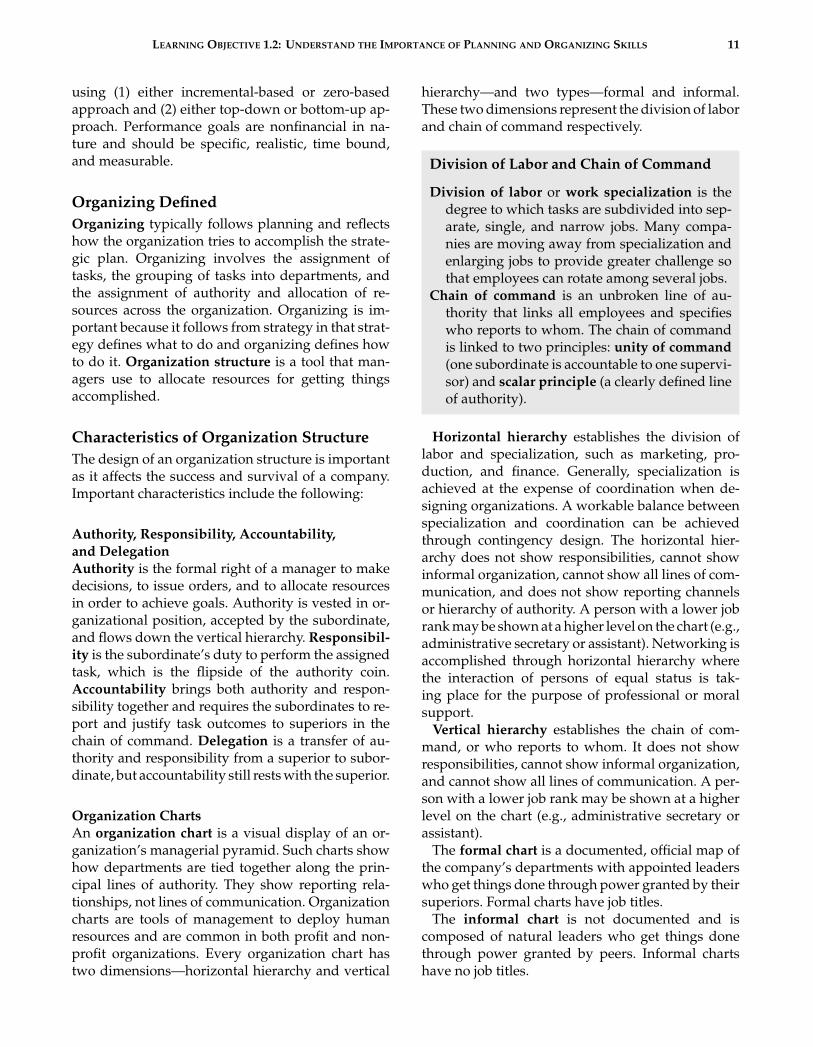
JWBT150-Vallabhaneni c01 July 28, 2009 17:25
LEARNING OBJECTIVE 1.2: UNDERSTAND THE IMPORTANCE OF PLANNING AND ORGANIZING SKILLS 11
using (1) either incremental-based or zero-basedapproach and (2) either top-down or bottom-up ap-proach. Performance goals are nonfinancial in na-ture and should be specific, realistic, time bound,and measurable.
Organizing DefinedOrganizing typically follows planning and reflectshow the organization tries to accomplish the strate-gic plan. Organizing involves the assignment oftasks, the grouping of tasks into departments, andthe assignment of authority and allocation of re-sources across the organization. Organizing is im-portant because it follows from strategy in that strat-egy defines what to do and organizing defines howto do it. Organization structure is a tool that man-agers use to allocate resources for getting thingsaccomplished.
Characteristics of Organization StructureThe design of an organization structure is importantas it affects the success and survival of a company.Important characteristics include the following:
Authority, Responsibility, Accountability,and DelegationAuthority is the formal right of a manager to makedecisions, to issue orders, and to allocate resourcesin order to achieve goals. Authority is vested in or-ganizational position, accepted by the subordinate,and flows down the vertical hierarchy. Responsibil-ity is the subordinate’s duty to perform the assignedtask, which is the flipside of the authority coin.Accountability brings both authority and respon-sibility together and requires the subordinates to re-port and justify task outcomes to superiors in thechain of command. Delegation is a transfer of au-thority and responsibility from a superior to subor-dinate, but accountability still rests with the superior.
Organization ChartsAn organization chart is a visual display of an or-ganization’s managerial pyramid. Such charts showhow departments are tied together along the prin-cipal lines of authority. They show reporting rela-tionships, not lines of communication. Organizationcharts are tools of management to deploy humanresources and are common in both profit and non-profit organizations. Every organization chart hastwo dimensions—horizontal hierarchy and vertical
hierarchy—and two types—formal and informal.These two dimensions represent the division of laborand chain of command respectively.
Division of Labor and Chain of Command
Division of labor or work specialization is thedegree to which tasks are subdivided into sep-arate, single, and narrow jobs. Many compa-nies are moving away from specialization andenlarging jobs to provide greater challenge sothat employees can rotate among several jobs.
Chain of command is an unbroken line of au-thority that links all employees and specifieswho reports to whom. The chain of commandis linked to two principles: unity of command(one subordinate is accountable to one supervi-sor) and scalar principle (a clearly defined lineof authority).
Horizontal hierarchy establishes the division oflabor and specialization, such as marketing, pro-duction, and finance. Generally, specialization isachieved at the expense of coordination when de-signing organizations. A workable balance betweenspecialization and coordination can be achievedthrough contingency design. The horizontal hier-archy does not show responsibilities, cannot showinformal organization, cannot show all lines of com-munication, and does not show reporting channelsor hierarchy of authority. A person with a lower jobrank may be shown at a higher level on the chart (e.g.,administrative secretary or assistant). Networking isaccomplished through horizontal hierarchy wherethe interaction of persons of equal status is tak-ing place for the purpose of professional or moralsupport.
Vertical hierarchy establishes the chain of com-mand, or who reports to whom. It does not showresponsibilities, cannot show informal organization,and cannot show all lines of communication. A per-son with a lower job rank may be shown at a higherlevel on the chart (e.g., administrative secretary orassistant).
The formal chart is a documented, official map ofthe company’s departments with appointed leaderswho get things done through power granted by theirsuperiors. Formal charts have job titles.
The informal chart is not documented and iscomposed of natural leaders who get things donethrough power granted by peers. Informal chartshave no job titles.

JWBT150-Vallabhaneni c01 July 28, 2009 17:25
12 Learning Module 1: General Management, Leadership, and Strategy
Implications of Organization Charts
Job title does not necessarily indicate everythingabout an employee’s level of authority.
Organization charts work in routine and pre-dictable task environments.
Organization charts do not work in nonroutineand unpredictable task environments.
Nominal power lies in formal organization charts.Real power lies in informal organization charts.Supervisors and managers need to use the infor-
mal power network to get things done.The formal organization chart may not always
keep track of changes in power relationships.Formal leaders have the nominal power, whereas
informal leaders have the real power.There may be several informal leaders but only
one or two formal leaders (natural leaders) ineach area of a company.
Span of Control or Span of ManagementThe span of control (or span of management) refersto the number of subordinates reporting to a superiorand indicates how closely a supervisor can monitorsubordinates. It has two dimensions:
1. Narrow and wide. The number of people whoreport directly to a manager represents that man-ager’s span of control or span of management. Theoptimal size of a span of control in a work area isdependent on the department’s function, organi-zational levels, changes in the nature of the work,and the clarity of instructions given employees.The optimal span of control is not dependent onthe total number of employees in the departmentor company.
Varieties of Span of Control
Narrow span of control means few people tooversee, which in turn creates many hierarchi-cal levels (tall organizations), which in turn re-quires many managers. The number of subor-dinates supervised is small. Workers may begeographically dispersed.
Wide span of control means many people to over-see, which in turn creates few hierarchical lev-els (flat organizations), which in turn requiresfew managers. Jobs are similar, procedures are
standardized, all workers are in the same workarea, and tasks are simple and repetitive. Anupper limit of the number of employees super-vised must exist.
Obviously, a balance between too little and toomuch supervision is required. The ideal span ofcontrol ranges from 4 subordinates at the top ofthe organization to 12 at the lowest level. The rea-son for the difference is that top-level managersare supervising people and lower-level managersare responsible for supervising specific tasks.
2. Tall and flat. A tall organization has many levelsof hierarchy and a narrow span of control. A flatorganization structure is one with relatively fewlevels of hierarchy and is characterized by a widespan of management control.
Varieties of Organization Structure
A tall structure has a narrow span, is verticallyfocused, and has more hierarchical levels.
A flat structure has a wide span, is horizontallyfocused, and has fewer hierarchical levels. Thetrend is toward wider span of control (flat struc-ture) to facilitate delegation.
Line and Staff Organization StructuresLine and staff organization structure is designed tomaximize the unity-of-command principle by giv-ing only the managers the authority to make deci-sions affecting those in the chain of command. Thereis no crossover between line and staff organizationstructure since each structure has its own chain ofcommand.
Line managers have the authority to make deci-sions and give orders to all subordinates in the chainof command. Staff authority is generally limited tosubordinates within its department. There is a natu-ral conflict between these two parties due to powerdifferences and various backgrounds.
One important source of conflict is that line em-ployees have formal authority while staff employeeshave informal power. Line managers tend to empha-size decisiveness, results, costs, and implementation,whereas staff members advise and prefer complete-ness, controls, adherence to policies and procedures,and systematic analysis to solve organizational prob-lems. The staff function supports the line functionbut does not control it.

JWBT150-Vallabhaneni c01 July 28, 2009 17:25
LEARNING OBJECTIVE 1.2: UNDERSTAND THE IMPORTANCE OF PLANNING AND ORGANIZING SKILLS 13
Differences between Line and Staff Authority
Managers with line authority can direct andcontrol immediate subordinates and resources,whereas managers with staff authority canmerely advise, recommend, and counsel.
Organization Systems andManagement StructuresTwo organization systems—closed system and opensystem—and two management structures—mecha-nistic and organic—are discussed. A relationship be-tween organization systems and management struc-tures is established.
A closed system is independent of its external en-vironment; it is autonomous, enclosed, and sealed offfrom the external environment. It focuses on inter-nal systems only. Its external environment is simple,stable, and predictable. The major issue for manage-ment is to run the business efficiently with central-ized decision making and authority. It represents abureaucratic organization. The traditional view oforganizations has closed-system thinking and as-sumes that the surrounding environment is fairlypredictable and that uncertainty within the organi-zation can be eliminated through proper planningand strict control. The primary goal is economic ef-ficiency. All goal-directed variables are known andcontrollable.
An open system is dependent on its environmentto survive; it both consumes resources and exportsresources to the external environment. It transformsinputs into outputs. It must continuously change andadapt to the external environment. Open systems arecomplex, unstable, and unpredictable and internalefficiency is a minor issue for management. It rep-resents a modern organization. The modern viewof organizations has open-system thinking and as-sumes that both the organization and its surround-ing environments are filled with variables that aredifficult to predict or control. The organization inter-acts continuously with an uncertain environment.The primary goal is survival in an environment ofuncertainty and surprise. The modern view dealswith more variables that cannot be controlled orpredicted.
A mechanistic structure is characterized by rules,procedures, and a clear hierarchy of authority. Or-ganizations are formalized and centralized, and theexternal environment is stable.
An organic structure is characterized by a fluid andfree-flowing nature, which adapts to changes in the
external environment with little or no written rulesand regulations and operates without a clear hierar-chy of authority. Organizations are informal and de-centralized, and responsibility flows down to lowerlevels. It encourages teamwork and problem solvingby letting employees work directly with each other.
Types of Management Structures
A mechanistic management structure resemblesa closed system of an organization.
An organic management structure resembles anopen system of an organization.
Centralized, Decentralized, andMatrix OrganizationsTwo methods of organizing are centralized and de-centralized. In a centralized organization, decisionsare made at higher levels of management. Decisionsin a decentralized organization are made at lowerlevels. Authority is delegated to lower levels of theorganization.
The extent of an organization’s centralization ordecentralization is determined by the span of con-trol, the number of levels in the hierarchy, and thedegree of coordination and specialization. Central-ization is typically used in those organizations thatemphasize coordination of decisions that must beapplied uniformly to a set of known or commonproblems. Companies that allow managers a greatdeal of autonomy are described as utilizing decen-tralized management.
Departmentalization is the basis for grouping po-sitions into departments and departments into thetotal organization. The three traditional approaches(e.g., the vertical functional approach, divisional ap-proach, and matrix approach), based on departmen-talization, rely on the chain of command to definedepartmental groupings and reporting relationshipsalong the hierarchy. The three contemporary ap-proaches (e.g., team approach, network approach,and virtual approach), not based on departmental-ization, have emerged to meet changing organiza-tional needs in a global knowledge-based businessenvironment.
In a matrix organization, people with vertical(down) and horizontal (across) lines of authority arecombined to accomplish a specific objective. Thisdesign is suitable to a project environment wherethe project manager is responsible for completing aproject without a formal line authority. Under these
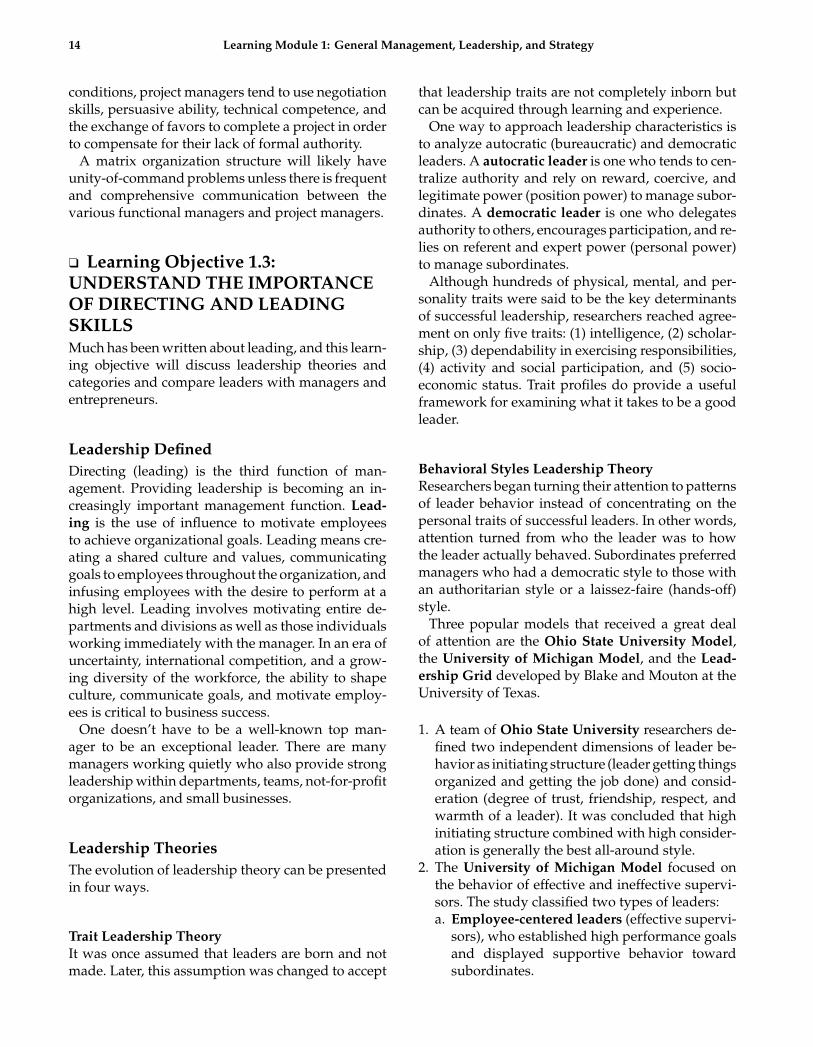
JWBT150-Vallabhaneni c01 July 28, 2009 17:25
14 Learning Module 1: General Management, Leadership, and Strategy
conditions, project managers tend to use negotiationskills, persuasive ability, technical competence, andthe exchange of favors to complete a project in orderto compensate for their lack of formal authority.
A matrix organization structure will likely haveunity-of-command problems unless there is frequentand comprehensive communication between thevarious functional managers and project managers.
❑ Learning Objective 1.3:UNDERSTAND THE IMPORTANCEOF DIRECTING AND LEADINGSKILLSMuch has been written about leading, and this learn-ing objective will discuss leadership theories andcategories and compare leaders with managers andentrepreneurs.
Leadership DefinedDirecting (leading) is the third function of man-agement. Providing leadership is becoming an in-creasingly important management function. Lead-ing is the use of influence to motivate employeesto achieve organizational goals. Leading means cre-ating a shared culture and values, communicatinggoals to employees throughout the organization, andinfusing employees with the desire to perform at ahigh level. Leading involves motivating entire de-partments and divisions as well as those individualsworking immediately with the manager. In an era ofuncertainty, international competition, and a grow-ing diversity of the workforce, the ability to shapeculture, communicate goals, and motivate employ-ees is critical to business success.
One doesn’t have to be a well-known top man-ager to be an exceptional leader. There are manymanagers working quietly who also provide strongleadership within departments, teams, not-for-profitorganizations, and small businesses.
Leadership TheoriesThe evolution of leadership theory can be presentedin four ways.
Trait Leadership TheoryIt was once assumed that leaders are born and notmade. Later, this assumption was changed to accept
that leadership traits are not completely inborn butcan be acquired through learning and experience.
One way to approach leadership characteristics isto analyze autocratic (bureaucratic) and democraticleaders. A autocratic leader is one who tends to cen-tralize authority and rely on reward, coercive, andlegitimate power (position power) to manage subor-dinates. A democratic leader is one who delegatesauthority to others, encourages participation, and re-lies on referent and expert power (personal power)to manage subordinates.
Although hundreds of physical, mental, and per-sonality traits were said to be the key determinantsof successful leadership, researchers reached agree-ment on only five traits: (1) intelligence, (2) scholar-ship, (3) dependability in exercising responsibilities,(4) activity and social participation, and (5) socio-economic status. Trait profiles do provide a usefulframework for examining what it takes to be a goodleader.
Behavioral Styles Leadership TheoryResearchers began turning their attention to patternsof leader behavior instead of concentrating on thepersonal traits of successful leaders. In other words,attention turned from who the leader was to howthe leader actually behaved. Subordinates preferredmanagers who had a democratic style to those withan authoritarian style or a laissez-faire (hands-off)style.
Three popular models that received a great dealof attention are the Ohio State University Model,the University of Michigan Model, and the Lead-ership Grid developed by Blake and Mouton at theUniversity of Texas.
1. A team of Ohio State University researchers de-fined two independent dimensions of leader be-havior as initiating structure (leader getting thingsorganized and getting the job done) and consid-eration (degree of trust, friendship, respect, andwarmth of a leader). It was concluded that highinitiating structure combined with high consider-ation is generally the best all-around style.
2. The University of Michigan Model focused onthe behavior of effective and ineffective supervi-sors. The study classified two types of leaders:a. Employee-centered leaders (effective supervi-
sors), who established high performance goalsand displayed supportive behavior towardsubordinates.

JWBT150-Vallabhaneni c01 July 28, 2009 17:25
LEARNING OBJECTIVE 1.3: UNDERSTAND THE IMPORTANCE OF DIRECTING AND LEADING SKILLS 15
b. Job-centered leaders (ineffective supervisors),who are less concerned about goal achieve-ment and human needs and more concernedabout meeting schedules, keeping costs low,and achieving production efficiency.
3. In the Leadership Grid, Blake and Mouton remainconvinced that there is one best style of leader-ship. They described this in a grid with two axes,scaling each axis from 1 to 9: horizontal (x) axisrepresenting a concern for production involvinga desire to achieve greater output, cost effective-ness, and profits; vertical (y) axis representing aconcern for people involving promoting friend-ship, helping coworkers get the job done, and at-tending to things that matter to people, like payand working conditions.
By scaling each axis from 1 to 9, the grid consistsof the following five leadership styles:a. Authority-compliance management where
primary concern is for production and peopleare secondary (9,1 style).
b. Country club management where primaryconcern is for people and production is sec-ondary (1,9 style).
c. Impoverished management where minimalconcern is for either production or people (1,1style).
d. Middle-of-the-road management where mod-erate concern is for both production and peopleto maintain the status quo (5,5 style).
e. Team management where high concern is forboth production and people as evidenced bypersonal commitment, mutual trust, and team-work (9,9 style).Most managers prefer the 9,9 style, regardless
of the situation at hand, since this style correlatespositively with better results, better mental andphysical health, and effective conflict resolution.The 9,9 style represents a high concern for bothproduction and people as evidenced by personalcommitment, mutual trust, and teamwork.
Situational Leadership TheorySituational theory or contingency thinking is basedon the assumption that successful leadership oc-curs when the leader’s style matches the situation. Itstresses the need for flexibility and rejects the notionof a universally applicable style.
Different approaches to situational leadershipinclude: Fiedler’s contingency theory, the path-
goal theory, and the Vroom/Yetton/Jago decision-making model.
1. Fiedler’s contingency theory, which is thor-oughly tested, is based on two assumptions. Theperformance of a leader depends on two inter-related factors: (1) the degree to which the sit-uation gives the leader control and influenceto accomplish the job and (2) the leader’s ba-sic motivation whether to accomplish the task orhave close supportive relations with others (task-motivated leader has a concern for productionand relationship-motivated leader has a concernfor people).
Fiedler and his colleagues summed up theirfindings by noting that “everything points to theconclusion that there is no such thing as an idealleader.” Instead, there are leaders, and there are sit-uations. The challenge to a manager is to analyzea leader’s basic motivation and then match thatleader with a suitable situation to form a productin combination. Fiedler believes that it is more ef-ficient to move leaders to a suitable situation thanto tamper with their personalities by trying to gettask-motivated leaders to become relationship-motivated or vice versa.
2. The path-goal theory, which is a derivative of ex-pectancy motivation theory, emphasizes that lead-ers should motivate their followers by providingclear goals and meaningful incentives for reach-ing them. Motivation is seen as essential to effectiveleadership.
Path-goal proponents believe that managersneed to rely contingently on four different leader-ship styles since personal characteristics of sub-ordinates, environmental pressures, and workdemands on subordinates will all vary fromsituation to situation. These four leadershipstyles include directive (tell people what to do),supportive (treat subordinates as equals), partic-ipative (consult with subordinates), and achieve-ment oriented (set challenging goals). For exam-ple, a directive situational leadership style wouldbe appropriate for a subordinate who possessesvery low task maturity for a particular assign-ment.
3. Vroom/Yetton/Jago decision-making model.Vroom helped develop the expectancy theoryof motivation based on the assumption thatmotivational strength is determined by per-ceived probabilities of success. The term ex-pectancy refers to the subjective probabilities (or

JWBT150-Vallabhaneni c01 July 28, 2009 17:25
16 Learning Module 1: General Management, Leadership, and Strategy
expectancy) that one thing will lead to another.Researchers Vroom, Yetton, and Jago (the Vroommodel) portray leadership as a decision-makingprocess with five distinct decision-making styles,each of which requires a different degree of sub-ordinates’ participation. The Vroom model qual-ifies as a situational-leadership theory because itprescribes different decision styles for varying sit-uations managers typically encounter.
The makeup of these five decision-makingstyles is: two are autocratic (low degree of subor-dinate participation), two are consultative (mod-erate degree of subordinate participation), andone is group directed (high degree of subordi-nate participation). In addition, the Vroom modelgives managers the tools for matching styles withvarious individual and group situations.
Transformational Leadership TheoryTransformational leaders are characterized as vi-sionaries who challenge people to achieve excep-tionally high levels of morality, motivation, and per-formance. The transformational leaders are mastersof change, have charisma, rely on referent power andcan envision a better future, effectively communicatethat vision, and get others to willingly make it a re-ality. A charismatic leader is one who has the abilityto motivate subordinates to transcend their expectedperformance. A charismatic leader is also a vision-ary leader who speaks to the hearts of subordinates,getting them to be a part of his vision.
There is a distinction between a transactionalleader and a transformational leader. Transactionalleaders monitor people so they do the expected, ac-cording to plan (i.e., maintain status quo). In con-trast, transformational leaders inspire people to dothe unexpected, above and beyond the plan (foster-ing creative and productive growth).
Other Theories of LeadershipSeveral new leadership theories are in place inlight of globalization, e-commerce, employee di-versity, and virtual organizations. They include thefollowing:
� Level 5 leader has no ego as he reaches the high-est level in the management hierarchy in terms ofknowledge, skills, and abilities (KSAs). He givescredit for successes to his subordinates while tak-ing responsibility for failures.
� Interactive leader is one who uses consensual andcollaborative process in problem solving and de-cision making by including subordinates, and hispower is derived from relationship building andcaring attitudes instead of position power. Femaleleaders are found to be better than male leadersas interactive leaders because often they can moti-vate, communicate, and listen better.
� Virtual leader is one who is open-minded, flexi-ble, and exhibits positive attitudes that focus onsolution instead of problems. He is good at com-municating, coaching, building relationships, andcaring skills.
� Servant leader is one who operates on two lev-els: (1) to fulfill subordinates’ needs and goals and(2) to achieve the organization’s mission. He givesaway power, ideas, information, recognition, andcredit to subordinates. He connects the subordi-nate’s motives to the organization’s mission. Theservant leadership position is upside down, mean-ing that the leader serves the subordinates work-ing for him and the organization that he works for.The servant leader is at the bottom and others are atthe top.
Leadership CategoriesLeadership is of two categories: formal and infor-mal. Effective leadership is associated with both bet-ter performance and more ethical performance. Ac-cording to Chester Schriesheim, James Tolliver, andOrlando Behling, leadership is “a social influenceprocess in which the leader seeks the voluntary par-ticipation of subordinates in an effort to reach orga-nizational objectives.”
The following list compares formal leaders withinformal leaders:
� Formal leaders have a measure of legitimate powerbecause of their formal authority. Informal leaderslack formal authority.
� Both formal and informal leaders rely on an ex-pedient combination of reward, coercive, referent,and expert power.
� Both formal and informal leaders can be an assetor a liability to the organization (asset when theywork for the organization; liability when they workagainst the organization).
Power is needed in all organizations. Power mustbe used because managers must influence those theydepend on. It is powerlessness, not power, that un-dermines organizational effectiveness.

JWBT150-Vallabhaneni c01 July 28, 2009 17:25
LEARNING OBJECTIVE 1.3: UNDERSTAND THE IMPORTANCE OF DIRECTING AND LEADING SKILLS 17
Power is the ability to manage all types of re-sources to accomplish something of value to theorganization. These resources could be human,material, and informational in content. Power af-fects organizational members in three areas: deci-sion making, behavior, and situations. Another di-mension to power is to distinguish between “powerover” (ability to dominate), “power to” (ability toact freely), and “power from” (ability to resist thedemands of others).
Experts on power say that power is neutral. It is atool that can be used in a positive or negative man-ner. Power exercised for power’s sake can be quitedangerous to all parties affected. The five sources ofpower exhibited by leaders include:
1. Reward power is gaining compliance throughrewards.
2. Coercive power is gaining compliance throughfear or threat of punishment.
3. Legitimate power is compliance based on one’sformal position and parallels formal authority(job title). It can be eroded by its frequent abuse(or overuse).
4. Referent power is compliance based on charisma,personal identification, or attraction and has norelation to job title.
5. Expert power is compliance based on the abilityto dispense valued information and is based onthe knowledge or skills possessed by a person.
Note that sources 1, 2, and 3 are based on positionpower while sources 4 and 5 are based on personalpower.
Management DefinedManagement is the attainment of organizationalgoals and objectives through four functions: plan-ning, organizing, directing (leading), and controllingorganizational resources in an effective and efficientmanner.
Management Skills DefinedManagement skills can be broadly classified as con-ceptual, human, and technical. These skills are notexhibited equally across management levels. Theyvary with the nature of the job, the level of decisionmaking, and the type of interaction with people.
Conceptual skill is the cognitive ability to see theorganization as a whole and the relationship amongits parts. It involves the manager’s thinking, infor-
mation processing, and planning. It requires the abil-ity to think strategically—to take a broad, long-termview. Conceptual skills are needed by all managersbut are especially important for managers at the top.Many of the responsibilities of top managers, suchas decision making, resource allocation, and innova-tion, require a broad view.
Human skill is the manager’s ability to work withand through other people and to work effectivelyas a group member. It includes the ability to moti-vate, facilitate, coordinate, lead, communicate, andresolve conflicts. As globalization, workforce diver-sity, uncertainty, and competition for highly skilledknowledge workers increase, human skills becomeeven more crucial. Here, focus is on emotional needsof employees instead of the physical needs relatedto the job.
Technical skill is the understanding of and pro-ficiency in the performance of specific tasks. It in-cludes mastery of the methods, techniques, andequipment involved in specific functions such asengineering, manufacturing, or finance. These skillsare particularly important at lower organizationallevels. Many managers get promoted to their firstmanagement job by having excellent technical skills.However, technical skills become less importantthan human and conceptual skills as managers moveup the hierarchy.
The following is a highest-to-lowest order of im-portance of these skills for three types of manage-ment levels:
First-line supervisor: technical, human, conceptualMiddle-level manager: human, technical, conceptualSenior-level manager: human, conceptual, technical
Management TypesManagers use conceptual, human, and technicalskills to perform the four management functionsof planning, organizing, leading, and controlling inall organizations. But not all managers’ jobs are thesame. Managers are responsible for different depart-ments, work at different levels in the hierarchy, andmeet different requirements for achieving high per-formance. Two management types include:
1. Vertical differences. An important determinantof the manager’s job is hierarchical level. Threelevels in the hierarchy include top managers, mid-dle managers, and front-line (first-line) managers.Top managers are responsible for setting organi-zational goals, defining strategies for achieving

JWBT150-Vallabhaneni c01 July 28, 2009 17:25
18 Learning Module 1: General Management, Leadership, and Strategy
them, monitoring and interpreting the externalenvironment, and making decisions that affect theentire organization. They share a long-term visionfor the organization, shape corporate culture, andnurture an entrepreneurial spirit that can help thecompany keep pace with rapid change. Middlemanagers are responsible for implementing theoverall strategies and policies defined by top man-agers. They are concerned with the near futureand are expected to establish good relationshipswith peers around the organization, encourageteamwork, and resolve conflicts. First-line man-agers are directly responsible for the productionof goods and services. They include titles such assupervisor, line manager, section chief, and officemanager. Their primary concern is the applicationof rules and procedures to achieve efficient pro-duction, provide technical assistance, and moti-vate subordinates. The time horizon is short, withthe emphasis on accomplishing day-to-day goals.
2. Horizontal differences. The other major differ-ence in management jobs occurs horizontallyacross the organization. These jobs include func-tional managers and general managers. Func-tional managers are responsible for departmentsthat perform a single functional task and have em-ployees with similar training and skills. Line man-agers are responsible for the manufacturing (oper-ations) and marketing departments that make orsell the product or service. Staff managers are incharge of departments such as finance and humanresources that support the line managers. Gen-eral managers are responsible for several depart-ments that perform different functions. Projectmanagers also have general management respon-sibility because they coordinate people across sev-eral departments to accomplish a specific project.
Managerial RolesHenry Mintzberg studied what managers do by fo-cusing on the key roles they play. He criticized thetraditional, functional approach as unrealistic in thatit does not tell what managers actually do. Mintzbergbelieves that the functional approach portrays themanagement process as far more systematic and ra-tional and less complex than it really is.
In his view, the average manager is not the re-flective planner and precise “orchestra leader” thatthe functional approach suggests. Mintzberg useda method called structured observation, which in-cluded recording the activities and correspondenceof a few selected top-level executives. He then iso-
lated ten roles he believed are common to all man-agers. These ten roles have been grouped into threemajor categories: interpersonal, informational, anddecisional.
1. Interpersonal category includes figurehead,leader, and liaison roles.
2. Informational category includes monitor (nervecenter), disseminator, and spokesperson roles.
3. Decisional category includes entrepreneur, dis-turbance handler, resource allocator, and negotia-tor roles.
Management Assumptionsabout EmployeesManagers have different assumptions about em-ployees regarding their nature and behavior towardwork. Some examples follow:
� Douglas McGregor outlined a set of highly op-timistic assumptions about human nature fromthe manager’s perspective (Theory Y), that peo-ple are creative, energetic, and capable of takingresponsibility, and can exercise self-control andself-direction. This is in contrast with the tradi-tional view of people by managers (Theory X),that most people are lazy, dislike work, must becoerced, must be directed, and are interested onlyin job security. He criticized Theory X for beingpessimistic, stifling, and outdated.
� William Ouichi discovered a type of organizationthat exhibited a style of management that effec-tively combines the traits and cultures of typi-cal American and Japanese companies. He calledthese hybrid companies Theory Z organizations.These companies focus on the employee in ar-eas such as: long-term employment; relativelyslow job evaluation and promotion; job rotation;cross-functional career paths; participative andconsensus-style decision making; individual re-sponsibility; concern for employees; and emphasison employee self-control.
� Theory T and Theory T+ are complementary the-ories based on Southeast Asian assumptions that:work is a necessity but not a goal itself; peopleshould find their rightful place in peace and har-mony with their environment; absolute objectivesexist only with God; in the world, persons in au-thority positions represent God, so their objectivesshould be followed; people behave as members ofa family and/or group; and those who do not arerejected by society.
JWBT150-Vallabhaneni c01 July 28, 2009 17:25
LEARNING OBJECTIVE 1.4: UNDERSTAND THE IMPORTANCE OF CONTROLLING AND MEASURING SKILLS 19
Leaders versus Managers versusEntrepreneursAn individual may have more of leadership quali-ties than management qualities and vice versa butideally should develop a balance of both quali-ties. Examples of leadership qualities include vision-ary, inspiring, creative, innovative, imaginative, andchange agent. Examples of management qualities in-clude problem solving, analytical skills, authority,and stability.
One of the major differences between manage-ment and leadership qualities relates to the sourceof power and the level of a follower’s compliancewith it. Power is the ability to influence the behav-ior of others. Management power comes from po-sition power (e.g., legitimate, reward, and coercivepower) while the leadership power comes from per-sonal power (e.g., expert and referent power). It istrue that an effective manager must have leadershipqualities.
Entrepreneurs are characterized as risk-takers,idea generators and implementers, opportunitygrabbers and exploiters, change agents and inno-vators, go-getters, and value creators. They have adifferent mindset, are a different breed, and have abigger mission and vision than managers and lead-ers to take advantage of uncertainty (risk). Both largeand small firms and new and established firms canbe entrepreneurial. All managers and leaders shouldthink and act like entrepreneurs.
MentoringMentoring is a relationship in which experiencedmanagers aid employees in the earlier stages of theircareers. Such a relationship provides an environ-ment for conveying technical, interpersonal, and or-ganizational skills from the more-experienced to theless-experienced person. Not only does the inexperi-enced employee benefit, but also the mentor may en-joy the challenge of sharing his wisdom and knowl-edge. Mentoring exhibits management and leader-ship skills.
However, mentoring has problems. Young minor-ity managers frequently report difficulty in findingmentors. Also, men generally show less willingnessthan do women to be mentors. Further, mentorswho are dissatisfied with their jobs and those whoteach a narrow or distorted view of events may nothelp a young manager’s development. Fortunately,many managers have a series of advisors or men-tors during their careers and may find advantages
in learning from the different mentors. For example,the unique qualities of individual mentors may helpless-experienced managers identify key behaviorsin management success and failure. Further, thosebeing mentored find previous mentors to be usefulsources for networking.
DelegationDelegation is the process of assigning various de-grees of decision-making authority to subordinates.It is not an all-or-nothing proposition. Authority maybe passed along to subordinates; ultimate responsi-bility cannot be passed along. Thus delegation is thesharing of authority, not the abdication of responsi-bility. Experts say that it is good to delegate those ac-tivities the manager knows best. Delegation exhibitsmanagement and leadership skills.
Advantages from Delegation� Managers can free more of their time for planning
and motivating.� Subordinates will be better trained and developed
as future managers.
Barriers to Delegation� Lack of confidence and trust in subordinates� Vague job definition� Fear of competition from subordinates� Poor example set by superiors who do not delegate� Reluctance in taking the risks involved in depend-
ing on others
❑ Learning Objective 1.4:UNDERSTAND THE IMPORTANCEOF CONTROLLING ANDMEASURING SKILLSIn this learning objective, we discuss the types ofmanagement controls and different ways of mea-suring performance. Controlling helps measuring inmeeting the established performance standards.
Controlling DefinedControlling is the fourth and final function of man-agement. Controlling means monitoring employees’activities, determining whether the organization ison target toward its goals, and making correctionsas necessary. Managers must ensure that the orga-nization is moving toward its goals. New trends to-ward empowerment and trust of employees have led

JWBT150-Vallabhaneni c01 July 28, 2009 17:25
20 Learning Module 1: General Management, Leadership, and Strategy
many companies to place less emphasis on top-downcontrol and more emphasis on bottom-up control interms of training employees to monitor and correctthemselves (i.e., a self-control).
Information technology (IT) is also helping man-agers provide needed organizational control withoutstrict top-down constraints. Companies may also useIT to put more constraints on employees if managersbelieve the situation demands it. Organization fail-ure can result when managers are not serious aboutcontrols or lack of controls.
Management ControlsManagement controls can be divided into feed-forward, concurrent, and feedback controls. A feed-forward control is a proactive control and worksin anticipation of problems, such as defect preven-tion through quality control inspection of raw ma-terials and work-in-process (WIP) inventory, pre-employment screening and background checking,training programs, forecasting inventory needs, ad-vance notice of a purchase, and budgeting. It focuseson inputs, affects timely solutions, and hence is im-portant to management.
A concurrent control solves problems as theyhappen and includes direct supervision, total qual-ity management (TQM) principles, just-in-time (JIT)techniques, and employee self-control and team-work. It focuses on ongoing processes.
A feedback control is used to evaluate past ac-tivity to improve future performance, and it fo-cuses on outputs. It measures actual performanceagainst a standard to ensure that a desired resultis achieved. Examples of feedback controls includecustomer/employee surveys, variance analysis, andperformance measures (e.g., sales per employee).Feedback control has been criticized because cor-rective action takes place after the fact (reactive).Feedback control can allow costs to build up dueto their back-end position. An example is humanresource managers holding exit interviews with em-ployees who have resigned to go to work for com-petitors. Management tabulates the interviewee’sresponses and uses the information to identify prob-lems with training, compensation, working condi-tions, or other factors that have caused increasedturnover. Other examples include increased finishedgoods inspections (final quality inspection), mon-itoring product returns, and evaluating customercomplaints, which are too late to take any correctiveaction.
Measuring DefinedMeasuring is identifying whether actual per-formance meets established standards. Managersshould assess what they will measure and howthey will define it. Measuring requires the followingsteps:
Step 1: Establish standards of performance.Step 2: Measure actual performance.Step 3: Compare actual performance with the estab-
lished standards.Step 4: Take corrective action in cooperation with
employees and other stakeholders.
Traditional measurement tools include operatingbudgets, capital budgets, analyzing financial state-ments for profitability and liquidity, adapting TQMprinciples, and complying with international stan-dards organization (ISO) quality standards. Notethat budgets can act as both planning and controllingtools.
Contemporary measurement tools include:
� Economic value added (EVA) is defined as a com-pany’s net operating profit (after-tax) minus thecost of capital invested in the company’s tangibleassets. EVA captures all the things a company cando to add value from its activities, such as runthe business more efficiently, satisfy customers,and reward shareholders. Each job, department, orprocess in the company is measured by the valueadded.
� Market value added (MVA) measures the stockmarket’s estimate of the value of a company’s pastand projected capital investment projects. A com-pany’s market value is the value of all outstandingstock plus the company’s debt. When a company’smarket value is greater than all the capital investedin it from shareholders, bondholders, and retainedearnings, the company has a positive MVA, whichis an indication that it has created wealth for itsstakeholders. A positive MVA goes hand in handwith a high EVA measurement.
� The activity-based costing (ABC) method allo-cates costs across all business processes, ensuringthat the price of a product is more than the cost toproduce it. The ABC method enables managers toevaluate whether more costs go to activities thatadd value or to activities that do not add value.They can then focus on reducing costs associatedwith non-value-added activities.
� Open-book management means sharing finan-cial information and operating results with all

JWBT150-Vallabhaneni c01 July 28, 2009 17:25
LEARNING OBJECTIVE 1.5: UNDERSTAND THE IMPORTANCE OF MOTIVATING SKILLS 21
employees in the organization, without hidinganything from employees. This sharing of infor-mation makes employees feel like a part ownerof the company, ties employee rewards to thecompany’s financial success, increases employee’scooperation and communication, and increases ef-ficiency and effectiveness of employee job perfor-mance.
� The balanced scorecard system is a comprehen-sive management control system that balancestraditional financial measures with nonfinancialmeasures, such as customer service, internal busi-ness processes, and the organization’s capacity forlearning and growth. Metrics can be a part of thebalanced scorecard system.
❑ Learning Objective 1.5:UNDERSTAND THE IMPORTANCEOF MOTIVATING SKILLSMotivating subordinates is an important function forboth managers and leaders and is not an easy task.The use of correct motivation strategies can bring bigresults to the supervisor.
Motivation DefinedThe term motivation refers to the psychological pro-cess that gives a purpose and direction to humanbehavior. Motivation theories are generalizationsabout the why and how of purposeful behavior. Thegoal is to move individual employees toward achiev-ing organizational objectives, including job perfor-mance, which is defined as follows:
Job Performance = KSAs × Motivation
Knowledge, skills, and abilities (KSAs) and moti-vation are necessary for effective and efficient jobperformance. KSAs are acquired through education,training, and on-the-job experience. The individual’smotivational factors—needs, satisfaction, expecta-tions, and goals—are affected by challenging work,rewards, and participation. Motivational factors areboth inborn and learned.
Motivation TheoriesFour popular motivation theories exist:
1. Maslow’s needs hierarchy theory. Maslow’s the-ory focuses on five needs structured as a hierarchy,from bottom to top, and includes physiological,
safety, love, esteem, and self-actualization needs.Individuals proceed up the hierarchy of needs,one level at a time. Higher needs emerge as lowerneeds are met. A fulfilled need does not moti-vate an individual. Needs are related to motiva-tion in that unsatisfied needs motivate behavior.Maslow’s esteem needs are most closely associ-ated with Herzberg’s concept of job enrichment.Maslow’s needs theory failed under actual testingsince it does not consider individual perceptions.
2. Herzberg’s two-factor theory. Herzberg’s theorywas based on employee satisfaction. A satisfiedworker is motivated from within to work harder,and a dissatisfied employee is not self-motivated.Herzberg’s two factors are satisfiers and dissatis-fiers.
Examples of satisfiers include achievement,recognition, work itself, responsibility, advance-ment, and growth.
Examples of dissatisfiers include company pol-icy and administration; supervision; relation-ship with supervisor, peers, and subordinates;work conditions; salary; personal life; status; andsecurity.
Dissatisfaction is associated with complaintsabout the job context or factors in the immedi-ate work environment. The elimination of dissat-isfaction is not the same as truly motivating anemployee. Herzberg is convinced that money isa weak motivational tool because, at best, it canonly eliminate dissatisfaction. To satisfy and moti-vate employees, an additional element other thanmoney is required, including meaningful, inter-esting, and challenging work. Critics argued thathis theory was weak on an empirical basis andthat individual’s perception was secondary. Oth-ers argued that one person’s dissatisfier may beanother’s satisfier. Herzberg’s biggest contribu-tion is the motivating potential for enriched work.
3. Expectancy theory. Individual perception, thoughsecondary in the Maslow and Herzberg models,is central to expectancy theory. The expectancytheory is based on the assumption that motiva-tional strength is determined by perceived prob-abilities of success. The term expectancy refersto the subjective probability (or expectation) thatone thing will lead to another. The focus of thismodel is as follows: one’s motivational strengthincreases as one’s perceived effort–performanceand performance–reward probabilities increase.This theory has received empirical support fromresearchers and is based on common sense since

JWBT150-Vallabhaneni c01 July 28, 2009 17:25
22 Learning Module 1: General Management, Leadership, and Strategy
Effort → Performance → Reward. Employeestend to work harder when they believe they havea good chance of getting personally meaningfulrewards.
4. Goal-setting theory. Goal setting is the process ofimproving individual or group job performancewith clear objectives and high standards. Man-agement by objectives (MBO) is an example ofgoal-setting theory.
MBO states that organizational goals can be bet-ter achieved if the goals of superiors and subordi-nates are integrated with organizational goals. Alllevels of management should be involved in set-ting the objectives of the organization in workingtoward the common goals.
The essence of MBO is close consultation be-tween superior and subordinate in the setting ofand agreement on goals. They must agree on thegoals to be achieved. Feedback is necessary dur-ing the period of working toward the goals andafter the goals are accomplished. A key require-ment is unity of command, which requires subor-dinates to be evaluated by a single superior—themanager.
Comparisons among Motivation Theories
� Maslow’s theory is built around the hierarchyof human needs.
� Herzberg’s theory is concerned with job perfor-mance and job satisfaction and focuses on main-tenance and motivational factors.
� Expectancy theory is based on the concept thatpeople’s expectations of rewards are derivedfrom their unique personal motive structure, be-liefs, and perceptions.
� Goal-setting theory is based on improving indi-vidual or group job performance.
Motivation StrategiesThe following four motivation strategies were de-rived from the motivational theories discussed pre-viously:
1. Motivation through job design. Motivationthrough job design deals with two specific strate-gies: (1) fitting people to jobs and (2) fitting jobs topeople. Three proven alternatives in fitting peopleto jobs include realistic job previews (written jobdescriptions and audiovisual presentations about
the job), job rotation, and limited exposure to frag-mented jobs. The strategy of fitting jobs to peopleincludes job enlargement (adds width to a job)and job enrichment (adds depth to a job).
2. Motivation through rewards. Every employeeexpects to be rewarded in some way for workperformed. Rewards may include material andpsychological payoffs for performing tasks in theworkplace. Managers have found that job perfor-mance and satisfaction can be improved by prop-erly administered rewards.
Two types of rewards exist: (1) extrinsic re-wards, which are payoffs granted to the individ-ual by other people (e.g., money, employee ben-efits, promotions, recognition/employee of themonth, status symbols, and praise) and (2) intrin-sic rewards, which are self-granted and internallyexperienced payoffs (e.g., sense of accomplish-ment, self-esteem, and self-actualization). An in-trinsic reward is an internally generated benefit orsatisfaction resulting from good work performed.
3. Motivation through employee participation.Participative management is defined as the pro-cess of empowering employees to assume greatercontrol of the workplace. Employees may partic-ipate in setting goals, making decisions, solvingproblems, and designing and implementing orga-nizational changes. Employee participation willnot work if individual values and attitudes arenot in tune with it. Organizational factors such asjob design and corporate culture can also help orhinder the process. Environmental factors such astechnological change and competition also affectthe participation process.
Two team-oriented approaches to employeeparticipation include quality control circles andself-managed teams. Quality control circles aresmall groups of voluntary, problem-solving em-ployees who meet regularly to discuss qualityimprovement and ways to reduce costs. To besuccessful, quality control circles should be intro-duced in an evolutionary manner rather than bymanagement order.
Self-managed teams (or autonomous workgroups) take on traditional managerial tasks aspart of their normal work routine. Advocates sayself-managed teams foster creativity, motivation,and productivity. The manager’s role will be moreof a facilitator than an order giver, and supervi-sion tends to be minimal. Hiring, training, andjob design need to be skillfully interlocked withself-managed teams, thus driving up front-end

JWBT150-Vallabhaneni c01 July 28, 2009 17:25
LEARNING OBJECTIVE 1.6: UNDERSTAND THE IMPORTANCE OF PROBLEM-SOLVING AND DECISION-MAKING SKILLS 23
costs. Traditional authoritarian supervisors viewself-managed teams as a threat to their authority,job security, and power.
4. Motivation through work schedules and ser-vices. New approaches such as flexible workschedules, family support services, and sabbati-cals are aimed at enhancing employee motivationand increasing job performance. While employ-ees like flexible work schedules, employers maynot because of greater administrative expense, su-pervisory resistance, and inadequate coverage ofjobs. Alternative approaches were invented suchas compressed workweeks (40 hours in fewer than5 days), permanent part-time jobs (workweekswith fewer than 40 hours), and job sharing (com-plementary scheduling that allows two or morepart-timers to share a single full-time job).
❑ Learning Objective 1.6:UNDERSTAND THE IMPORTANCEOF PROBLEM-SOLVING ANDDECISION-MAKING SKILLSManagers make decisions to solve current problemsor to seek future opportunities. In the former case,problems come first, and decisions come next. In thelatter case, opportunities come first, and decisionscome next. Group dynamics and team building arealso discussed.
Problem DefinedA problem exists when there is a gap between what isand what should be. Individuals recognize a problemwhen they feel frustrated, frightened, angry, or anx-ious about a situation. Organizations recognize prob-lems when outputs and productivity are low; whenquality of products and services is poor; when peo-ple are not cooperating, sharing information, or com-municating; or when there is a dysfunctional degreeof conflict among people in various departments.When the gap between what is and what should becauses anxiety and inefficiency, something needs tobe done to solve the problem (see the figure).
Point A
“What is”(actual condition)
GapPoint B
“What should be”(desired condition)
A problem is the gap between where one is andwhere one wants to be. The process of closing the
gap between the actual situation and the desired sit-uation is problem solving. Problems do not solvethemselves—people solve problems.
The management principle behind problemsolving is Theory Y in that managers will take re-sponsibility for and are interested in solving organi-zational problems. Effective written and oral communi-cation skills are prerequisites to effective problem-solvingskills.
Problem-Solving ProcessProblem solving is a systematic process of bringingthe actual situation or condition closer to the desiredcondition. Although there are many ways to handleproblems, the following four steps can explain theprocess:
Step 1: Identify the problem.Step 2: Generate alternative solutions.Step 3: Select a solution.Step 4: Implement and evaluate the solution.
Impediments to Problem SolvingBusiness problems are solved either by individualsor by groups. The most neglected area of problemsolving is human resources, the people who partici-pate in the problem-solving group. The group leadercan encourage new ideas and creativity in groupmembers by following these guidelines:
� Practice effective listening because people thinkmuch more rapidly than they speak. Effective lis-tening is the best way to gather information. Trynot to be distracted.
� Practice “stroking,” a concept borrowed fromtransactional analysis. A stroke is a unit of recogni-tion. Provide recognition to people and ideas. Pos-itive stroking makes people more important andsecure and invites more ideas and creativity.
� Discourage “discounting” (i.e., not paying atten-tion), another concept borrowed from transac-tional analysis. When discounting is high, groupmembers will feel reluctant to respond to questionsand will be constantly ready to attack or retreat.This is not a healthy climate for successful prob-lem solving, and it encourages dysfunctional be-havior and uncooperative attitudes among groupmembers.
� Keep the group members informed about progressand what is expected of them.

JWBT150-Vallabhaneni c01 July 28, 2009 17:25
24 Learning Module 1: General Management, Leadership, and Strategy
Reasons Individuals Solve ProblemsDifferentlyProblem-solving skills are different with differentpeople. Five factors influence a person’s problem-solving capabilities: (1) value system, (2) informationfiltration, (3) interpretation, (4) internal representa-tion, and (5) external representation.
Tools and Techniques for Problem SolvingSeveral major tools and techniques are availablefor the problem solver to solve problems, includ-ing brainstorming, synectics, nominal group tech-nique, force-field approach, and systems analysis.Differences exist among these tools, and all of themdo not work equally well in different situations.In any given situation, one or two tools mighthave a greater probability of leading to the desiredoutcomes.
� Brainstorming encourages uninhibited flow ofnew ideas—the more ideas, the better.
� Synectics is a highly structured approach usingexcursions, fantasies, and analogies.
� Nominal group technique has no real group as ituses a very structured approach.
� Force-field analysis identifies inhibiting and facil-itating forces.
� Systems analysis breaks down a large probleminto many smaller problems.
Other problem-solving tools and techniques in-clude imagineering; value analysis; leapfrogging;blasting, creating, and refining; attribute list-ing; Edisonian; investigative questions; cause-and-effect diagrams; Pareto charts; psychodramaticapproaches; checklists; general semantics; morpho-logical analysis; panel consensus techniques; Delphitechnique; work measurement; storyboards; humor;operations research; intuitive approach; T-analysis;closure; and TRIZ (a Russian-language acronym tosolve inventive problems by reframing the contra-dicting and competing goals so contradictions dis-appear).
Decision DefinedA decision is deciding on a specific course of actionfrom several choices.
Decision-Making ProcessDecision making is a process of choosing among al-ternative courses of action. The correct sequence ofthe decision-making process is shown below:
Step 1: Identify the right information.Step 2: Identify an acceptable level of risk.Step 3: Identify alternative courses of action.Step 4: Make a timely decision.
Note the difference between problem-solving anddecision-making steps. Identify an acceptable level ofrisk (step 2) does not enter into the problem-solvingprocess. Risk is unique to decision making and isan integral part of it. Decision making reduces orincreases the risk, depending on the quality of thedecision making and the level of uncertainty.
Facets of Decision MakingManagers and leaders make decisions. The type ofdecision made depends on the level of that man-ager in the organization hierarchy. To accommodatethis diversity, many facets of decision makingexist, including sequential/nonsequential, static/dynamic, structured/unstructured, programmed/nonprogrammed, and routine/nonroutine.
Decision-Making ModelsModels are predetermined procedures that specifythe step-by-step actions to be taken in a particularsituation. Two types of decision models exist: nor-mative and empirical.
Normative decision models prescribe thedecision-making process—what should be. Thesemodels do not describe actual management prac-tice in decision making. Instead, they describehow a decision procedure should be followed.Normative models are programmed decisions.They help lower-level operating management toimplement programs such as production schedulingor inventory control.
Empirical decision models do not describe how adecision-maker should go about making a decision.Instead, they describe the actual decision processesfollowed by a decision-maker—what is. Empiricalmodels are nonprogrammed decisions. They helpmiddle to senior management in making strategicdecisions such as pricing and new product introduc-tion. When there is no set of procedures for a decisionprocess, then by definition there is no “model” for it. Ex-amples include crisis handling and leadership.
JWBT150-Vallabhaneni c01 July 28, 2009 17:25
LEARNING OBJECTIVE 1.6: UNDERSTAND THE IMPORTANCE OF PROBLEM-SOLVING AND DECISION-MAKING SKILLS 25
Types of DecisionsDecision making is a frequent and important humanactivity and is a managerial activity. Decisions arenot all of one kind. The procedure for making onedecision, such as buying a home, is entirely differentfrom making another decision, such as buying a car.
Four general types of decisions exist that requiredifferent decision procedures: (1) decisions undercertainty, (2) decisions under risk, (3) decisions un-der uncertainty, and (4) decisions under conflict orcompetition.
Types of Data Used in Decision MakingDecision making is a process that incorporates theestimating and predicting of the outcome of futureevents. When specific events are known with cer-tainty, the decision-maker does not use probabil-ities in the evaluation of alternatives. When spe-cific events are uncertain, the decision-maker usesprobabilities in the evaluation of alternatives. Thedecision-maker often uses the most likely outcomestated in deterministic format rather than incorpo-rating all outcomes in a probabilistic (stochastic)format.
A decision-maker uses two types of data: deter-ministic data and probabilistic data. Deterministicdata are known and not subject to any error or dis-tribution of error. They are based on historical data;their environment is stable and predictable. Deci-sion results will be certain with a single unique pay-off. There is only a single outcome for each possibleaction.
Probabilistic data are used by the decision-makerto evaluate decisions under situations of risk anduncertainty. An estimation of distribution of possi-ble outcomes can be made, not an assured or a pre-dictable outcome. The environment is characterizedas unstable and unpredictable since each event is as-signed a probability of occurrence. Probabilistic dataallow for better risk evaluation since sensitivity anal-ysis can be performed on each action to measure thematerial impact of the various events.
An estimated payoff table or decision tree can bedeveloped for analysis. A drawback of using prob-abilistic data is the availability and integrity of datato determine multiple courses of action.
Tools and Techniques for Decision MakingThese include differential analysis, decision ta-bles, decision trees, payoff tables, flowcharts, cost–
benefit analysis, success–failure analysis, discrimi-nate analysis, management science/operations re-search applications, devil’s advocate techniques, re-ality checks, risk analysis, and activity analysis.
Decision Making versus Problem SolvingDecision making and problem solving are not thesame—they have two different time dimensions. Thebasic difference is that decision making is future ori-ented and problem solving is past oriented. Decisionmaking deals with major risk, while problem solvingdeals with resolving a specific issue. Problems comefirst, and decisions come next.
Examples of decision-making situations includeinvesting in a new product line, buying newequipment, and selecting an employee for a keyposition. Examples of problem-solving situationsinclude handling a tardy employee, correcting apoor-quality production, and working with a slow-paying customer.
Group DynamicsToday, groups or committees make many decisionsin organizations. There is a link between communi-cation concepts and the subject of group decisionmaking. Since messages are transmitted betweenmembers of the group, the effectiveness of this com-munication process will have a greater impact on thequality of the group’s decisions.
Robbins states that groups offer an excellent vehi-cle for performing many of the steps in the decision-making process. They are a source of both breadthand depth of input for information gathering. If thegroup is composed of individuals with diverse back-grounds, the alternatives generated should be moreextensive and the analysis more critical. When thefinal solution is agreed upon, there are more peo-ple in a group decision to support and implementit. These pluses, however, can be more than offsetby the minuses—time consumed by group decisions,the internal conflicts they create, and the pressuresthey generate toward conformity.
Strengths or assets of group decision making in-clude breadth of information, diversity of informa-tion, extensive analysis of alternatives, acceptance ofsolutions, and legitimacy of processes.
Weaknesses or liabilities of group decision mak-ing include time-consuming efforts, pressure toconform, possibility of conflicts, domination of

JWBT150-Vallabhaneni c01 July 28, 2009 17:25
26 Learning Module 1: General Management, Leadership, and Strategy
discussions, ambiguous responsibility, and loss ofpersonal accountability.
Group BehaviorsGroup psychology studies have revealed that vari-ous groups produced contradictory behavior. Some-times, people did better at their tasks when therewere other people around and sometimes they didworse. Groupthink, groupshift, and group polariza-tion are the three byproducts of group decision mak-ing, all of which have the potential to affect thegroup’s ability to evaluate alternatives objectivelyand arrive at quality decision solutions.
Groupthink is related to norms and describes situ-ations in which group pressures for conformity deterthe group from critically appraising unusual, minor-ity, or unpopular views. Groupthink is a disease thatattacks many groups and can dramatically hindertheir performance. Individuals who hold a minorityposition that is different from that of the dominantmajority are under pressure to suppress, withhold,or modify their true feelings and beliefs. Oppositionis viewed as disloyal and is discouraged. Groupthinkcan ignore risks and contingencies. The group leadermust remain impartial and play the devil’s advocateto come up with new challenges and alternatives.
Groupshift indicates that in discussing a givenset of alternatives and arriving at a solution, groupmembers tend to exaggerate the initial position thatthey hold. Groups move between conservative andrisky. Group decision frees any single member fromaccountability for the group’s final choice. Greaterrisk can be taken because even if the decision fails,no one member can be held fully responsible.
Group polarization can occur when a group de-cides to take more risks than any individual wouldhave judged reasonable. Groups tend to make moreextreme decisions than individuals who are part ofthe group. Group polarization (high-risk takers) andgroupthink (low-risk takers) are two extremes on arisk measurement scale.
Factors Affecting Group DecisionsMany factors affect group decisions, including own-ership of the problem either by individuals or bygroups (synectics is a good technique to solve thesekinds of problems), nature of the problem to besolved either by few or several people, structure ofthe problem (i.e., routine vs. nonroutine), nature ofthe group (i.e., implementers vs. nonimplementers),
maturity level of the group (i.e., short vs. long pe-riods of time), the size of the group (optimum isbetween 6 and 10), and the climate of the group (i.e.,passive and active behaviors).
Manager’s Information Processing StylesThe quality of a decision is a direct reflectionof how the decision-maker processes information.Managers approach decision making and problemsolving in very different ways, depending on theirinformation processing styles. Their approaches,perceptions, and recommendations vary becausetheir minds work differently. Researchers have iden-tified two general information-processing styles:(1) the thinking (objective) style and (2) the intuitive(subjective) style. One is not superior to the other.
The thinking style manager tends to be analytical,logical, precise, and objective. He prefers routine as-signments that require attention to detail and sys-tematic implementation. The manager uses deduc-tive reasoning. The thinking style is good to use inmodel-building exercises and forecasting involvingprojections.
The intuitive style manager is creative, is comfort-able in handling a dynamic and nonroutine environ-ment, follows his hunches, and is mostly subjective.He likes to address broad issues and use inductivereasoning. This manager sees things in complex pat-terns rather than as logically ordered bits and pieces.The intuitive style is good to use in brainstormingsessions and where traditional assumptions need tobe challenged.
In practice, many managers process informationthrough a combination of thinking and intuitivestyles.
Stages of Group DevelopmentEffectiveness and efficiency increase as the groupmatures. Similarly, immature groups are ineffectiveand inefficient. A significant benefit of group matu-rity is that a person’s individuality strengthens. Also,members of mature groups tend to be emotionallymature.
Kreitner suggests six stages of group develop-ment, including (1) orientation, (2) conflict and chal-lenge, (3) cohesion, (4) delusion, (5) disillusion,and (6) acceptance. During stages 1 through 3,group members attempt to overcome the obstacles ofuncertainty over power and authority, while duringstages 4 through 6, they overcome the obstacles of

JWBT150-Vallabhaneni c01 July 28, 2009 17:25
LEARNING OBJECTIVE 1.6: UNDERSTAND THE IMPORTANCE OF PROBLEM-SOLVING AND DECISION-MAKING SKILLS 27
uncertainty over interpersonal relations. An under-standing of group development stages will improvetime-management skills of an employee.
Stage 1: Orientation. Group members give the im-pression to managers and leaders that they wantpermanent control expressed through wants andneeds.
Stage 2: Conflict and change. Group members strug-gle for control by suggesting alternative coursesof action and strive to clarify and reconcile theirroles. Many groups do not continue past this stagebecause they get bogged down due to emotional-ism and political infighting. An I feeling is domi-nant at this stage for power and authority.
Stage 3: Cohesion. A we feeling becomes apparentat this stage as everyone becomes truly involvedin the project, and any differences over power andauthority are resolved.
Stage 4: Delusion. Issues and problems are dis-missed or treated lightly. Group members work inparticipation and promote harmony at all costs.
Stage 5: Disillusion. Disillusion sets in as unlimitedgoodwill wears off and disenchantment grows.Some members will prevail by showing theirstrengths while others hold back. Tardiness andabsenteeism are the norm, which is symptomaticof diminishing cohesiveness and commitment.
Stage 6: Acceptance. Some group members movefrom conflict to cohesion and act as group catalystsas their expectations are more realistic. Power andauthority structure are accepted. Consequently,the group members tend to be highly effectiveand efficient.
Criteria and Determinants of GroupEffectivenessA group is defined as two or more freely interactingindividuals who share a common identity and pur-pose. Individuals join groups for various reasons tosatisfy their personal and professional goals. Twokinds of groups exist, including informal and formalgroups. An informal group is a collection of indi-viduals seeking friendship while a formal group isa collection of individuals doing productive work.Individuals can be subjected to ostracism, which isrejection from a group.
Two criteria for group effectiveness include attrac-tiveness and cohesiveness. Attractiveness has theoutside-looking-in view, while cohesiveness has theinside-looking-out view. Cohesive group members
tend to stick together as they focus on we instead ofI. An individual’s perception and frames of referencehave lot to do with how groups can be attractive orcohesive.
Factors that can enhance a group’s attractivenessand cohesiveness include cooperative relationshipsamong members, a high degree of interaction amonggroup members, a relatively small-sized group, andsimilarities among group members.
Factors that can detract from a group’s attrac-tiveness and cohesiveness include unreasonable de-mands on the individual, disagreement over workrules and procedures, unpleasant experience withsome group members, and destructive competitionor conflict.
Groups and IndividualsEvery worker has a dual role: as an individual andas a member of a group. Weber states that a groupis defined by functional qualities, not by physicalproperties. A group consists of a minimum of twoor more people who interact, communicate with,and influence each other for a period of time. Tocomprise a group, a collection of people must sharemore than circumstances. They must share percep-tions and goals. Group members must be aware ofeach other, interact with each other, and exert influ-ence on each other. To communicate with each other,they must both send and receive messages. And theymust be engaged in these processes for more than afew moments.
Why do people join groups? Formal or otherwise,there are two common reasons people join groups:goal attainment and needs gratification. By work-ing together, people can accomplish goals that mightbe difficult or impossible for solitary individuals toachieve. Additionally, group participation addressesmany social needs such as access to approval, a senseof belonging, friendship, and love.
People do not inevitably lose their individualityin groups, although groups may help lessen self-awareness and produce a state of de-individuation.In fact, group membership can heighten certain as-pects of individual experience. Three important ef-fects of the group on the individual are:
1. Identity. Belonging to a group is a form of so-cial categorization in that the group becomes oneaspect of social identity (e.g., a member of a pro-fessional or trade association). Reference groupsare particularly important in defining not only
JWBT150-Vallabhaneni c01 July 28, 2009 17:25
28 Learning Module 1: General Management, Leadership, and Strategy
identity but also aspirations. A reference group isa social network one consults for social compar-ison. When groups come into contact with eachother, individuals may compare their own groupfavorably to the alternatives available.
2. Deviance. Group goals can sometimes override orconflict with individual members’ personal goals.When a member breaks with the group’s normsto satisfy personal needs, he becomes a deviant.Members of a group are important in validatingeach other’s beliefs. A deviant threatens that vali-dation by defecting and reducing consensus. Ulti-mately the deviant will most likely be pushed outof the group, thus restoring consensus with onefewer member.
3. Social impact. Social impact theory is an explana-tion of social influence. According to this theory,the degree to which a targeted individual is influ-enced depends on three factors: (1) the strength ofthe source of influence, (2) the immediacy of theinfluence, and (3) the number of sources. Groupmembership can be seen as having social impacton an individual. Taken factor by factor, a groupwill have greater influence on each member if it isstrong, if the group’s influence is immediate, andif the group is large in number.
Group StructuresGroups have tasks such as solving problems, mak-ing decisions (task agenda), and meeting the emo-tional needs and social roles of their members (socialagenda). Groups meet these two agendas throughseveral key processes and structures: norms, roles,and cohesiveness.
Norms are rules or guidelines for accepted andexpected behavior. Some norms are explicit; mem-bers know what they are and can explain them tonewcomers. Others are implicit or subtle, occasion-ally taken for granted until a deviation occurs. Mostgroups have a norm for how decisions are made. Forexample, a group of coworkers in a small businessmay agree that important contracts are to be voted onby all members, with a simple majority of more thanhalf ruling. The coworker who tries to play dictatorwill be violating norms and may be treated as a de-viant until the group restores consensus—or pushesthe deviant out.
Roles are sets of norms defining appropriate be-haviors. Groups usually involve roles; some arebroad (leaders and followers), while others are morespecific. Roles differentiate members’ functions and
contributions within the group. Roles may be orga-nized according to individual talents. Roles can bea source of reward, as well as a source of problemswithin a group. Group membership offers personalbenefits, and group participation achieves goals thatsolitary individuals may not.
Roles may differ in not only function but also valueto the group. Values are abstract ideas that shapean individual’s thinking and behavior. Roles associ-ated with greater prestige or respect are said to havehigher status-position or rank. Status affects the waymembers of the group communicate and work witheach other. For example, high-status members likeexecutives and managers may initiate communica-tion with lower-status members but not vice versa.A manager can interrupt a subordinate worker toask a question, but a subordinate is not free to entera manager’s office and ask questions without per-mission. Status can be a reward for specific mem-bers, but it carries a cost, since differences in statuscan be a source of resentment or competition amongmembers.
Two kinds of role conflict commonly occur:(1) person–role conflict and (2) inter-role conflict.Person–role conflict is where a person finds hisgroup role difficult to perform. For example, a com-mittee member may be required to criticize othermembers’ work, but he might feel uncomfortablewith having to do this. Inter-role conflict is where amember belonging to different groups competes fortime in balancing the completion of conflicting tasks.
When one’s responsibilities within a group are un-clear or unstable, the individual suffers the difficultyof role ambiguity. Roles are likely to be ambiguouswhen a member first joins a group, or when taskperformance changes. For example, if a small servicecompany shifts from paper recordkeeping to the useof computers, the roles of the file clerk may becomeambiguous. It is not yet clear what—if any—functionhe will have in the organization from this point on.
Cohesiveness is a feeling of attraction and loyaltythat motivates members to stay in the group. Mem-bers of cohesive groups like each other more andsupport common goals more strongly than membersof less cohesive groups. High cohesiveness can be asource of both benefits and liabilities. Members ofhighly cohesive groups enjoy their membership andinteraction more but are also prone to make mistakesby giving group feeling a higher priority than othergroup goals.
Anything that makes a group more valuable toits members increases cohesiveness. Competition

JWBT150-Vallabhaneni c01 July 28, 2009 17:25
LEARNING OBJECTIVE 1.6: UNDERSTAND THE IMPORTANCE OF PROBLEM-SOLVING AND DECISION-MAKING SKILLS 29
within the group can reduce cohesiveness, sincemembers fear threats from each other. Another bar-rier to fellowship is disliking or special preferencesamong members. When members are drawn to andaway from each other, subgroups form that breakdown organizational unity. Preferential differencesin members’ feelings are more likely to develop inlarge groups, and thus group size is negatively re-lated to cohesiveness—the larger the organization,the harder it is to maintain attraction, loyalty, andfairness evenly among all members.
Methods Used in Team BuildingAfter a team has been created, there are distinctstages through which it develops. New teams aredifferent from mature teams. In the beginning, teammembers had to get to know one another, establishroles and norms, divide the labor, and clarify theteam’s task. In this way, members became parts ofa smoothly operating team. The challenge for man-agers is to understand the stage of the team’s de-velopment and take action that will help the groupimprove its functioning.
Research findings suggest that team developmentis not random but evolves over definitive stagesin sequence. One useful model for describing thesestages contains five phases: (1) forming, (2) storming,(3) norming, (4) performing, and (5) adjourning.
Forming → Storming → Norming → Performing→ Adjourning
The forming stage of development is a period oforientation and getting acquainted. Members breakthe ice and test one another for friendship possibili-ties and task orientation. Team members find whichbehaviors are acceptable to others. Uncertainty ishigh during this stage, and members usually acceptwhatever power or authority is offered by either for-mal or informal leaders. Members are dependent onthe team until they find out what the ground rulesare and what is expected of them. During this initialstage, members are concerned about such things as“What is expected of me?,” “What is acceptable?,”and “Will I fit in?” During the forming stage, theteam leader should provide time for members to getacquainted with one another and encourage them toengage in informal social discussions.
During the storming stage, individual personali-ties emerge. People become more assertive in clar-ifying their roles and what is expected of them.
Conflict and disagreement mark this stage. Peoplemay disagree over their perceptions of the team’smission. Members may jockey for positions, andcoalitions or subgroups based on common interestsmay form. One subgroup may disagree with an-other over the total team’s goals or how to achievethem. The team is not yet cohesive and may be char-acterized by a general lack of unity. Unless teamscan successfully move beyond this stage, they mayget bogged down and never achieve high perfor-mance. During the storming stage, the team leadershould encourage participation by each team mem-ber. Members should propose ideas, disagree withone another, and work through the uncertainties andconflicting perceptions about team tasks and goals.
During the norming stage, conflict is resolved, andteam harmony and unity emerge. Consensus devel-ops on who has the power, who is the leader, andmembers’ roles. Members come to accept and un-derstand one another. Differences are resolved, andmembers develop a sense of team cohesion. Thisstage typically is of short duration. During the norm-ing stage, the team leader should emphasize onenesswithin the team and help clarify team norms andvalues.
During the performing stage, the major empha-sis is on problem solving and accomplishing the as-signed task. Members are committed to the team’smission. They are coordinated with one another andhandle disagreements in a mature way. They con-front and resolve problems in the interest of taskaccomplishment. They interact frequently and di-rect discussion and influence toward achieving teamgoals. During this stage, the leader should concen-trate on managing high task performance. Both so-cioemotional and task specialists should contribute.
The adjourning stage occurs in committees, taskforces, and teams that have a limited task to performand are disbanded afterward. During this stage, theemphasis is on wrapping up and gearing down. Taskperformance is no longer a top priority. Membersmay feel heightened emotions, strong cohesiveness,and depression or even regret over the team’s dis-bandment. They may feel happy about mission ac-complishment and sad about the loss of friendshipand associations. At this point, the leader may wishto signify the team’s disbanding with a ritual or cer-emony, perhaps giving out plaques and awards tosignify closure and completeness.
The five stages of team development typically oc-cur in sequence. In teams that are under time pres-sure or that will exist for only a short period of time,

JWBT150-Vallabhaneni c01 July 28, 2009 17:25
30 Learning Module 1: General Management, Leadership, and Strategy
the stages may occur quite rapidly. The stages mayalso be accelerated for virtual teams. For example,bringing people together for a couple of days ofteam building can help virtual teams move rapidlythrough the forming and storming stages.
❑ Learning Objective 1.7:UNDERSTAND THE IMPORTANCEOF NEGOTIATING SKILLSNegotiating is a soft skill that is important for man-agers to learn. In this learning objective, we discussthe negotiation process, its elements, and modes ofnegotiation. Do’s and don’ts are also presented.
Negotiation DefinedNegotiation is a decision-making process amongdifferent parties with different preferences. Twocommon types of negotiation include two party(buyer and seller) and third party (buyer, seller, andagent). Traditionally, negotiation takes a win-lose at-titude, which is based on power, position, and com-petition. Here, one person’s success is achieved at theexpense of the success of others. It takes somethingfrom the other party. However, a win-win attitudeis based on high principles and cooperation amongparties. Here, one person’s success is not achievedat the expense of the success of others. Every partygets something.
Process of NegotiationAccording to Cohen, negotiation is more than an ex-change of material objects and words. It is a way ofacting and behaving that can foster understanding,belief, acceptance, respect, and trust between twoor more parties. It is the manner of your approach,the tone of your voice, the attitude you convey, themethods you use, and the concern you exhibit forthe other side’s feelings and needs. All these thingscomprise the process of negotiation. Hence, the wayyou go about trying to achieve your objective may,in and of itself, meet some of the other party’sneeds.
The prerequisite to negotiation is a conflict situa-tion. Conflict is an unavoidable part of life. It occurswhen the goals of each party are in opposition. Butconflict can arise even if both parties are in agree-ment about what they want—sometimes the conflictmay be centered on how to get it (the means used).
Conflict may arise from differences in experiences,information, or attitudes about the different roles ofthe negotiators.
Why Opposition?Opposition is essential because it results in growthand progress. People who are dissatisfied with thestatus quo generate tension with their different ideas,which often leads to a creative solution.
What Is Negotiation?Negotiation is gaining the favor of people fromwhom we want things such as money, justice, sta-tus, and recognition. Both technical and nontechni-cal managers need negotiating skills to obtain helpfrom and support of colleagues, supervisors, peers,customers, suppliers, and even friends and familymembers.
Elements of NegotiationThree crucial elements exist in a negotiation: power,time, and information. People can negotiate any-thing with these three tightly interrelated variables:
1. Power. The other side always seems to have morepower and authority than you think you have.
2. Time. The other side does not seem to be underthe same kind of organizational pressure and timeconstraints you feel you are under.
3. Information. The other side seems to know moreabout you and your needs than you know aboutthem and their needs.
Negotiating is analyzing power, time, and infor-mation to affect people’s behavior—it is the meetingof two or more parties in order to make things hap-pen to their mutual satisfaction.
A simple test to make sure that you are ready fornegotiation is to ask the following three questions.A “yes” answer will indicate readiness.
1. Am I comfortable negotiating in this particularsituation?
2. Will negotiating meet my needs?3. Is the expenditure of energy and time on my part
worth the benefits that I can receive as a result ofthis encounter?

JWBT150-Vallabhaneni c01 July 28, 2009 17:25
LEARNING OBJECTIVE 1.7: UNDERSTAND THE IMPORTANCE OF NEGOTIATING SKILLS 31
Modes of NegotiationTwo modes of negotiating behavior/conflict resolu-tion exist: the competitive strategy and the collabo-rative (cooperative) strategy. The style of negotiatorscan range between these two strategies:
1. Competitive negotiation strategy focuses on get-ting what you want and defeating an opponent(I win, you lose). This may range from intimida-tion to manipulation. People applying competi-tive strategy often start with tough demands, getred-faced, raise their voices, act exasperated, de-lay making any concession, tend to be impatient,and ignore deadlines. When the other party is fo-cusing on a competitive negotiation strategy, it isbetter to switch to collaborative strategy.
2. Collaborative negotiation strategy shifts the ef-fort from trying to defeat an opponent to try-ing to defeat a problem and to achieve a mu-tually accepted outcome (I win, you win). Withthis method, all parties work together to find anacceptable solution or common ground that willmeet the needs of both sides. The best way to starta collaborative strategy is to say something like,“I need your help with this problem” or to em-ploy other kinds of tact and exhibit concern forthe other’s dignity.
Accomplishing mutual satisfaction using the col-laborative win-win style involves emphasis on threeimportant activities:
1. Building trust2. Gaining commitment3. Managing opposition
Compromise versus CollaborationCompromise is not synonymous with collaboration.Compromise results in an agreement in which eachside gives up something it really wanted. Compro-mise is an outcome where no one’s needs are fullymet. This is because the strategy of compromise restson the faulty premise that your needs and the otherparty’s needs are always in opposition. With thisthinking, it is never possible for mutual satisfactionto be achieved. Each party starts out with greater(extreme) demands, hoping to compromise at a mid-point. This is not to say that compromise is always apoor choice. Often the strategy of compromise maybe appropriate, depending on the particular circum-stances.
Successful collaborative negotiations depend uponfinding out what the other side really wants andshowing them a way to get it, while still getting whatyou want. It is the definition of win-win.
Do’s and Don’ts of NegotiationsTo be successful, a manager needs to know what todo and what not to do during negotiations.
Do’s of Negotiations:� Do use phrases such as “I don’t know,” or “I don’t
understand it,” which can result in negotiatingleverage.
� Do approach others and ask for help. It tends to setthe climate for a mutually beneficial relationship.At the very least, you will cause the other sideto make an investment that ultimately accrues toyour advantage.
Don’ts of Negotiations:� Don’t be too quick to “understand” or prove your
intellect at the outset of an encounter. Learn to askquestions, even when you think you might knowthe answers.
� Never give an ultimatum at the beginning of anegotiation. An ultimatum must come at the endof a negotiation, if at all.
� Don’t use hard ultimatums such as “Take it or leaveit,” or “It is this way or else!” These attitudes areself-defeating. Use soft ultimatums such as, “Yourposition is valid, but this is all I can do at the mo-ment. Help me.”
� Never leave the other side without alternatives.Always allow them to make some kind of choice.
� Don’t reduce the other side’s stress unless you re-ceive what you are shooting for.
� Don’t be abrasive because how you say somethingwill often determine the response you get.
� Avoid using absolutes when responding to people.Learn to preface your replies with, “What I thinkI may have heard you say. . . .” This “lubricant de-meanor” will soften your words, consecrate youractions, and minimize the friction.
� Avoid public embarrassment to the people withwhom you deal. Never ridicule anyone in front ofothers. Even when you are right, shun all oppor-tunities to humiliate people, especially in public.
� Never forget the power of your attitude.� Never judge the actions and motives of others.

JWBT150-Vallabhaneni c01 July 28, 2009 17:25
32 Learning Module 1: General Management, Leadership, and Strategy
Added-Value NegotiatingAdded-value negotiating (AVN) is a value-addedprocess (win-win) involving development of mul-tiple deals with multiple outcomes as opposed totraditional (win-lose) negotiating, which is based ona single outcome with a single winner.
AVN is based on openness, flexibility, and a mutualsearch for the successful exchange of value. AVNallows one to build strong relationships with peopleover time. It bridges the gap between win-win theoryand practice.
According to Kreitner, AVN comprises the follow-ing five steps:
Step 1: Clarify interests. Both parties jointly identifysubjective and objective interests so that a com-mon goal is found.
Step 2: Identify options. A variety of choices are devel-oped to create value for both parties.
Step 3: Design alternative deals. Multiple win-win of-fers are designed to promote creative agreement.
Step 4: Select a deal. Each party selects a mutuallyacceptable deal after testing the various deals forvalue, balance, and fit.
Step 5: Perfect the deal. Unresolved details are openlydiscussed and agreements are put in writing,which strengthens the relationship for future ne-gotiations.
BATNAThe members of the Harvard Negotiation projectdiscovered a new concept in negotiations knownas the best alternative to a negotiated agreement(BATNA) to establish a standard (i.e., bottom line)against which any proposed agreement should bemeasured. The BATNA describes the anchor pointfor both sellers and buyers when negotiations do notproduce the desired outcome(s) for each negotiatingparty in terms of a settlement amount.
Each negotiating party’s BATNA is a decisionpoint in terms of accepting or rejecting the offer bythe other party. The difference between the seller’sBATNA and the buyer’s BATNA is known as thebargaining zone, which becomes the only basis forfurther negotiation due to overlapping range of ac-ceptable outcomes. Negotiation is either useless orunnecessary outside the bargaining zone because itis not a common ground for the both parties. Agree-ment is possible within the bargaining zone and notpossible outside the zone. Therefore, estimating oneparty’s BATNA is essential in protecting the negoti-
ating parties from accepting offers that are unfavor-able and from rejecting offers that are favorable.
Example of Calculating the Bargaining ZoneGiven the Seller’s and Buyer’s BATNA
An item’s original price was $400, current ap-praised value is estimated at $500, its owner ismaking a final offer to sell the item at $600, anda buyer’s final offer to buy the same item is$350. The seller’s BATNA is $400 and the buyer’sBATNA is $500. What is the bargaining zone inamount and range?
The bargaining zone amount is Buyer’s BATNAminus Seller’s BATNA = $500 − $400 = $100.
The bargaining zone range is $400 to $500.
A realistic BATNA can protect from four decision-making traps, such as framing error, escalation ofcommitment, overconfidence, and negotiating with-out a standard, as follows:
� Framing error deals with how information is pre-sented (i.e., positively or negatively), which canlead to bias in behavior and decision making.
� Escalation of commitment is like “throwing goodmoney after bad” dilemma in that managers con-tinue to fund losing projects to save their face.
� A positive relationship exists between overcon-fidence and task difficulty. Managers exhibit ex-tra courage needed to handle difficult situations,which leads to unreasonable risks. Careful analysisof situations and critical thinking about decisionalternatives can help managers avoid overconfi-dence trap.
� Negotiating parties usually move aimlessly in thedark due to lack of a negotiating standard, whichresults in accepting unfavorable terms and reject-ing favorable terms. A negotiating standard suchas BATNA helps in making better decisions be-cause a seller’s BATNA becomes the standard foraccepting or rejecting offers
❑ Learning Objective 1.8:UNDERSTAND THE IMPORTANCEOF COMMUNICATION SKILLSCommunications can be either formal or informaland include both written and oral. Communication

JWBT150-Vallabhaneni c01 July 28, 2009 17:25
LEARNING OBJECTIVE 1.8: UNDERSTAND THE IMPORTANCE OF COMMUNICATION SKILLS 33
barriers are discussed along with essentials for effec-tive communication.
Communication DefinedOne thing that is common to all four functions ofmanagement (i.e., planning, organizing, directing,and controlling) is communication. Surveys haveshown that 80 percent of a manager’s time is spenton communication and 20 percent on other activities.Communication involves two or more people. Theeffectiveness of organizational communication canbe increased with clear verbal and written messageswith little or no noise. Nonverbal communications(messages sent through actions, not words) and lis-tening skills (the art of receiving messages) are alsoimportant.
Noise is not part of the chainlike communicationprocess. It is any interference with the normal flowof understanding of a message from one person toanother. Examples of noise include misperception,illegible print, speech impairment, and garbled com-puter data transmission. Understanding has an in-verse relationship with noise—the higher the noise,the less the understanding. Greater amounts of noisein communication not only waste resources (timeand money) but also create frustration between thesender and the receiver.
Communication ChainKreitner describes communication as a chain madeup of identifiable links—sender, encoding, medium,decoding, receiver, and feedback. The communica-tion chain is only as strong as its weakest link.
The following are the identifiable links in the com-munication chain:� Sender conveys the message to a receiver.� Encoding translates the message from sender.� Medium is the vehicle by which to send or receive
a message.� Decoding translates the message from sender to
receiver.� Receiver gets the message.� Feedback means the receiver acknowledges the
message.
SenderThe sender is an individual or a group of peoplewhose goal is to convey or transmit the message to areceiver via the best possible media and in the fastestway.
EncodingThe objective of encoding is to translate internalthought patterns into a language or code that theintended receiver of the message will be able to un-derstand. Words (written or oral), numbers, gestures,or other symbols are used in encoding. The purposeof the message affects the medium of encoding. Forexample, if a manager were proposing a new em-ployee benefit plan, which is a sensitive program, ameeting with emotional appeal and gestures wouldhave a bigger impact than a normal written (cold)report. A meeting conveys personal interest and em-pathy, unlike the report.
MediumMany types of media exist to send and receive a mes-sage, including face-to-face communications, tele-phone calls, regular meetings and electronic meet-ings (videoconferencing), memos, letters, reports,facsimiles, bulletin boards, newsletters, and others.Each media type varies in richness from high-rich tolow-rich. Media richness is described as the capacityof a given medium to convey information properlyand promote learning. The goal is to match media rich-ness with the situation. Otherwise, mismatching occurs,which can lead to confusion and embarrassment.
Comparison of Different Media
Examples of high-rich media include face-to-face conversation, telephone, or videoconfer-encing, since they provide multiple informa-tion cues (e.g., message content, tone of voice,and facial expressions), facilitate immediatefeedback, and are personal in focus. High-richmedia are good for discussing nonroutine is-sues and problems.
Examples of low-rich or lean media includebulletin boards, reports, company newsletter,memorandums, and letters. These media pro-vide a single cue, do not facilitate immediatefeedback, and are impersonal. Low-rich mediaare good for discussing routine problems.
DecodingDecoding is the translation of the transmitted mes-sage from the sender’s language and terminologyto that of the receiver. Effective decoding requiresthat these be the same between the sender and the

JWBT150-Vallabhaneni c01 July 28, 2009 17:25
34 Learning Module 1: General Management, Leadership, and Strategy
receiver. The receiver’s willingness to receive themessage is a primary criterion for successfuldecoding.
ReceiverThe receiver is an individual or a group of peoplewhose goal is to acknowledge and receive the in-tended message sent by a sender. The receiver willtake an action based on the message received.
FeedbackThe communication process is not complete untilthe receiver acknowledges the message via verbalor nonverbal feedback to the sender. Without feed-back, the sender is not sure whether the receiverhas received his message. Feedback affects follow-up: if the receiver does not understand the message,follow-up meetings should be scheduled.
Formal CommunicationsFormal communication channels are those that flowwithin the chain of command, and include down-ward, upward, and horizontal communication.
Downward communication refers to the mes-sages and information sent from a higher level to alower level in the management hierarchy (e.g., goals,strategies, mission, vision, directives, policies, proce-dures, and performance feedback).
Upward communication refers to the messagesand information transmitted from a lower level toa higher level in the management hierarchy (e.g.,grievances and disputes, routine progress and per-formance reports, suggestions for improvement, andproblems and exceptions).
Horizontal communication refers to the lat-eral or diagonal exchange of messages and in-formation among peers or coworkers, occurringwithin or across departments (e.g., intradepartmen-tal problem-solving requests, interdepartmental co-ordination on joint projects, and use of task forcesand committees). Horizontal communication is im-portant in learning organizations with teams solvingproblems.
Informal CommunicationsInformal communication channels exist that donot consider the organization’s formal hierarchyof authority and chain of command. Examples in-clude management by wandering around and thegrapevine.
Management by wandering around meanshigher-level employees (e.g., executives and seniormanagers) talk directly with lower-level employ-ees (e.g., hourly workers at factory, office, or ware-house) to learn about problems and issues con-fronting them, as well as to share their key ideasand values. These meetings are informal and unan-nounced.
A grapevine is the unofficial and informal com-munication system. It sometimes conflicts with theformal system and complements and reinforces itat other times. The grapevine will remain in orga-nizations as long as people are working in a groupenvironment. It has both positive and negative sides.From a positive side, the grapevine communicationcan help management learn how employees trulyfeel about policies, procedures, and programs—atype of feedback mechanism. On the other hand, anegative consequence to the grapevine is rumors.
Barriers to CommunicationIt is false to assume that if a person can talk, he cancommunicate. Talking is different from communicat-ing. There are many barriers that exist between allpeople, making communications much more diffi-cult than most people seem to realize. The managerneeds to know all the barriers that exist that canblock effective communication. The negative effectof roadblocks to communication includes diminish-ing of self-respect in others, triggering defensive-ness, resistance, and resentment. This can also leadto dependency, withdrawal, and feelings of defeat orof inadequacy.
Kreitner describes four types of barriers to com-munication representing extreme forms of noise: (1)process barriers, (2) physical barriers, (3) semanticbarriers, and (4) psychological/social barriers.
Communication Barriers = Process → Physical →Semantic → Psychological/Social
The scope of process barriers consists of senderbarrier, encoding barrier, medium barrier, decodingbarrier, receiver barrier, and feedback barrier—linksin the communication chain. The scope of physicalbarriers includes physical objects blocking the effec-tive communication (e.g., walls, medium). Semanticbarriers address the words used in the communi-cation. A manager who uses jargon in his report islikely to encounter the semantic form of communica-tion barrier. Psychological and social barriers dealwith peoples’ backgrounds, perceptions, values,

JWBT150-Vallabhaneni c01 July 28, 2009 17:25
LEARNING OBJECTIVE 1.9: UNDERSTAND THE IMPORTANCE OF CONFLICT MANAGEMENT SKILLS 35
biases, needs, and expectations—all of which differto varying degrees.
Perception is a process of giving meaning to one’senvironment and is a vital link in the communicationprocess. It consists of three subprocesses: (1) selec-tivity, (2) organization, and (3) interpretation. Selec-tivity is sensory screening and a sorting out process.Organization is mentally creating meaningful pat-terns from disorganized thoughts. Interpretation ishow people understand a message, which is oftendifferent for different people.
Essentials for Effective CommunicationAfter presenting 13 barriers to communication(e.g., criticizing, name-calling, diagnosing, prais-ing, finger-pointing, bossing, threatening, moral-izing, advising, excessive questioning, diverting,logical argument, and reassuring), Robert Bolton de-scribes three essentials for effective communication:
1. Genuineness means being honest and open aboutone’s feelings, needs, and ideas.
2. Nonpossessive love involves accepting, respect-ing, and supporting another person in a nonpa-ternalistic and freeing way.
3. Empathy refers to the ability to really see andhear another person and understand him fromhis perspective.
Information Communicated by OthersInformation can be improperly analyzed and incor-rectly interpreted. The causes of poor business de-cisions can be attributed not only to a lack of infor-mation but also to the failure to properly interpretinformation.
Proper interpretation of information dependslargely on the reliability of the source, the mannerin which the information is presented, and the per-sonal perception of the person receiving or givingthe information. The return on an investment in infor-mation is knowledge, which is difficult to quantify.
❑ Learning Objective 1.9:UNDERSTAND THE IMPORTANCEOF CONFLICT MANAGEMENTSKILLSConflict is normal between people due to differentperspectives and perceptions. Conflict has two sides:benefits and drawbacks. Tools for managing conflictare discussed.
Conflict DefinedSocial scientists say that conflict is inevitable be-tween people, and without conflict there is no majorpersonal change or social progress. Conflict manage-ment involves accepting or even encouraging con-structive conflict as necessary. The key point is tominimize the destructive form of conflict.
Conflict is the medium by which problems are rec-ognized and solved. Conflict is closely related tochange and interpersonal dealings. It refers to allkinds of opposition or antagonistic interaction. Notall conflict is bad.
Conflict is based on scarcity of power, availabilityof resources, social position, and difference in valuestructure between individuals or groups involved inthe situation.
To be human is to experience conflict. This conflictarises due to differences in personal values, opin-ions, desires, habits, and needs of people. It is impos-sible for people to rise completely above selfishness,betrayals, misrepresentations, anger, and strain. Thebest way to depict conflict is on a scale of disruptiveand destructive dimensions, as shown in the figure.
Best condition
Disruptive behavior
Worst condition
Destructive behavior
Conflict at best is disruptive and at worst is de-structive. Once it erupts, conflict is difficult to con-trol. Destructive conflict has a tendency to expanduntil it consumes all the things and people it touches.
Social scientists make an important distinction be-tween two types of conflict: realistic conflict and non-realistic conflict.
In realistic conflict, which is based on rationality,there are opposing needs, goals, means, values, or in-terests. Realistic conflict can be resolved by focusingon the emotions first followed by substantive issuesand using collaborative problem-solving methods.
Nonrealistic conflict, which is based on irrational-ity, arises from ignorance, error, tradition, prejudice,win-lose types of competition, hostility, or the needfor tension release. Unrealistic conflict creates un-warranted tension between people and can causeunnecessary destruction; it should be handled verycarefully as it can be prevented to some extent.
Another way of classifying conflict is betweenfunctional conflict and dysfunctional conflict.
� Functional conflict. The organizational benefitsof functional conflict are increased effort andimproved performance, enhanced creativity, and

JWBT150-Vallabhaneni c01 July 28, 2009 17:25
36 Learning Module 1: General Management, Leadership, and Strategy
personal development and growth. It is likeexpressing anger in a constructive manner, with-out actually showing the anger. Functional conflictis always encouraged, for obvious reasons.
� Dysfunctional conflict. The signs and symptomsof dysfunctional conflict include indecision, resis-tance to change, destructive emotional outbursts,apathy, and increased political maneuvering. Thegoal of management is to resolve or neutralize dys-functional conflict, which is always discouraged,for obvious reasons.
Despite its drawbacks, conflict has benefits. Itcan spur technological development, encourage per-sonal and intellectual growth, and help renew busi-ness organizations.
Personal Conflict Prevention andControl MethodsAlthough it is impossible to totally eradicate con-flict, personal conflict prevention and control canavert much needless strife (nonrealistic conflict).Both individuals and institutions need to developprevention and control methods. Robert Bolton rec-ommends the following:� One way of diminishing the amount of conflict
is to use fewer roadblocks. Ordering (dominat-ing), threatening, judging, name-calling, and otherroadblocks are conflict-promoting interactions.
� Reflective listening helps the other person dissi-pate “negative” emotions when he has a strongneed or a problem to address.
� Assertion skills enable a person to get needs metwith minimal strife. By asserting when needs arise,one can prevent the buildup of emotions that sooften cause conflict. Both assertion and listeningskills help to clear up two major sources of conflict:errors and lack of information.
� Awareness of which behaviors are likely to starta needless conflict between people can eliminatemany confrontations. Certain words, looks, or ac-tions tend to trigger specific people into conflict.These behaviors may be rooted in early childhoodexperiences. Some people can sense that a storm isbrewing.
� “Dumping one’s bucket” of tension without fill-ing the other’s bucket is another important conflictprevention and control method. Strenuous exer-cise, competitive athletics, and meditation also candrain off one’s tensions without adding to otherpeople’s stress.
� Increased emotional support from family andfriends can decrease one’s proneness to unneces-sary conflict. In general, the more we are loved andcared for, the less we need to fight.
� Heightened tolerance and acceptance of othersalso tends to diminish unrealistic conflict. Somesay that these tolerances and acceptances are con-ditioned by upbringing and even by genetic fac-tors. But each of us can become more tolerant andaccepting than we now are.
� “Issues control” is another important way of man-aging conflicts. It is often preferable to deal withone issue at a time, to break issues down intosmaller units rather than deal with enormous prob-lems with many parts, to start with easily resolvedissues (i.e., start with points of agreement), andto define the dispute in nonideological terms. Tryto find how your needs and the other’s needs canbe satisfied (i.e., win-win situation) through jointlyidentifying the cause of disagreement.
� A careful appraisal of the full consequences andthe cost of a conflict may deter you from involv-ing yourself in needless disputes. It is difficult toestimate the cost of a conflict because emotionalinteractions are unpredictable and frequently getout of hand.
Group or Organizational ConflictPrevention and Control MethodsIndividual actions alone are not enough. Groupand/or organizational actions are needed to preventand control the conflict that occurs in the workplace.The way an organization is structured has a bearingon the amount of conflict generated in it. The po-tential for conflict tends to be greater in centralized,bureaucratic organizations than in decentralized or-ganizations. The more rigid organizations are, theless effective communications are and the less adeptthey are at managing conflicts constructively.
Bolton suggests the following:� The personality and methods of the leader are im-
portant. Managers who have low levels of defen-siveness and who are supportive tend to help peo-ple in their organizations avert unnecessary strife.A person who is in a position of power, one whohas great charisma, or one who has developedeffective communication skills tends to have thegreatest influence on the way conflict is handled.
� The climate of a group also influences the amountof conflict it generates. Although some kinds ofcompetition can be healthy, research evidence

JWBT150-Vallabhaneni c01 July 28, 2009 17:25
LEARNING OBJECTIVE 1.9: UNDERSTAND THE IMPORTANCE OF CONFLICT MANAGEMENT SKILLS 37
suggests that win-lose competition fosters need-less conflict and diminishes the ability to re-solve disputes effectively. However, cooperating toachieve goals that could not be accomplished with-out joint effort promotes more genuine harmony.
� Well-conceived and clearly stated policies and pro-cedures that have the understanding and supportof the relevant individuals create orderly processesthat can help mitigate unnecessary chaos and con-flict. When policies and procedures do not matchthe needs of the organization or its members, whenthey are arrived at arbitrarily and administeredhigh-handedly, they can add to the level of unreal-istic conflict in the organization.
� The degree of change and the method by whichchange is introduced into a family or an organiza-tion influences the amount and severity of disputesin that institution. A certain amount of changeis necessary in all institutions, but too rapid achange or changes utilizing inadequate methodsof communication can create significant and need-less conflict.
� Mechanisms to settle grievances need to be estab-lished. A mechanism is practiced when resolvingdisputes between labor and management of an or-ganization.
� Training for conflict management is necessary bothfor the prevention of needless conflict and for theresolution of the conflicts that are inevitable in anyrelationship or organization. The scope of trainingshould include topics such as listening, assertion,and collaborative problem-solving skills.
� Much conflict needs to be faced and resolved atthe earliest possible moment. When preventionand control strategies are used improperly and un-wisely, they merely postpone the inevitable. Thefinal result is worse than an early, direct resolutionof the strife.
� When some people want to dodge conflict alto-gether, they tend to misuse the prevention andcontrol strategies listed above. Others use denial,avoidance, capitulation, or domination as mecha-nisms for keeping their lives free of the unpleas-antness of strife.
Tools for Managing ConflictTwo sets of tools are available for managing conflict:(1) conflict triggers, which stimulate conflict, and(2) conflict resolution techniques, which are usedwhen functional conflict deteriorates into dysfunc-tional conflict.
Conflict TriggersA conflict trigger is a factor or circumstance thatincreases the choices of intergroup or interpersonalconflict. It can stimulate either functional or dysfunc-tional conflict, where the former should be continuedand the latter should be removed or corrected. Ac-cording to Kreitner, examples of major conflict trig-gers include:
� Ambiguous or overlapping jurisdictions. (Reorga-nization will help to clarify job boundary prob-lems.)
� Competition for scarce resources. (This includesfunds, personnel, authority, power, and valuableinformation.)
� Communication breakdowns. (Communicationbarriers provoke conflict. Clear communicationsshould be practiced.)
� Time pressures. (Deadlines can prompt perfor-mance or trigger destructive emotional reactions.)
� Unreasonable standards, rules, policies, or proce-dures. (These can lead to dysfunctional conflict be-tween managers and their subordinates. The solu-tion is to correct the situation.)
� Personality clashes. (A solution is to separate theantagonistic parties by reassigning one or both toa new job.)
� Status differentials. (Job hierarchy creates statusdifferentials that lead to dysfunctional conflict.This can be minimized by showing a genuine con-cern for the ideas, feelings, suggestions, and valueof subordinates.)
� Unrealized expectations. (Dysfunctional conflictis another by-product of unrealized expectations.This can be avoided by taking the time to discoverwhat people expect from their employment.)
Conflict Resolution TechniquesManagers have two choices in resolving conflict: donothing, which is not a good strategy, or try one ormore of the following five conflict resolution tech-niques:
1. Problem solving. Problem solving encouragesmanagers to focus their attention on root causes,factual information, and promising alternativesrather than on personalities or scapegoats. It is atime-consuming process, but it is worth it.
2. Superordinate goals. Superordinate goals arehighly valued, unattainable by any one groupor individual alone, and commonly sought. The

JWBT150-Vallabhaneni c01 July 28, 2009 17:25
38 Learning Module 1: General Management, Leadership, and Strategy
manager brings the conflicting parties togetherand tries to resolve the dysfunctional conflict.
3. Compromise. Everybody wins and loses becausecompromise requires negotiation, or give andtake. Compromise is based on the idea that “some-thing must be given up if anything is to begained.” It is a time-consuming process, and theproblem is worked around rather than solved.
4. Forcing. Management steps into a conflict and or-ders the affected parties to handle the situationin a certain manner. It is based on the formal au-thority and power of superior position. Forcingdoes not resolve the personal conflict, and in factit could compound the situation by hurting feel-ings, fostering resentment, and creating mistrust.
5. Smoothing. Smoothing is a temporary, short-termaction, which does not solve the underlying prob-lem. It can be useful when management is at-tempting to hold things together until a criticalproject is completed, there is no time for prob-lem solving or compromise, or forcing is deemedinappropriate. Smoothing is appropriate in somesituations but not all.
❑ Learning Objective 1.10:UNDERSTAND THE VARIOUSISSUES IN ORGANIZATIONALBEHAVIOR, CULTURE, CHANGE,DEVELOPMENT, EFFECTIVENESS,AND DECLINEOrganizations go through lifecycles similar to prod-ucts, projects, and computer systems. The lifecycle ofan organization consists of phases or stages such asstartup, growth, maturity, and decline. The effective-ness of an organization’s behavior, culture, change,and development processes will determine the dis-tance to the decline stage or to its prolonged life.
There are many issues in the organization’s inter-nal environment that a business manager shouldbe familiar with in order to work properly withinthat environment. The scope of these issues includesorganizational behavior, culture, change, develop-ment, effectiveness, and decline. The more he learnsthese issues, the better he is prepared to handlehis job.
Organizational Behavior DefinedAccording to Robbins and Judge (Robbins andJudge), practicing managers cannot succeed on theirtechnical skills alone. They also have to have good
people skills (i.e., interpersonal skills)—broadlytermed as organizational behavior (OB). OB stud-ies three determinants of behavior in organizations:individuals, groups, and structure. In addition, OBapplies the knowledge gained about individuals,groups, and the effect of structure on behavior inorder to make organizations work more effectively.
Organizational Behavior = Individuals + Groups+ Structure
Organizational Behavior → OrganizationalEffectiveness
OB is concerned with the study of what employ-ees do in an organization and how their behav-ior affects the organization’s performance. It em-phasizes behavior as related to concerns such asjobs/positions; work assignments and tasks; em-ployee absenteeism, turnover, productivity, and per-formance; and management—all connected withemployment-related situations. These concerns inturn are translated into core topics such as motiva-tion, leadership, communication (written and oral),groups/teams, learning and listening, attitudes, per-ceptions, change and conflict management, work de-sign, and work-related stress.
An OB model is developed by identifying depen-dent variables and independent variables to under-stand employee behavior, where the latter variableimpacts the former variable. A dependent variable,which is the focus of OB, is the key factor to explainor predict and that is affected by some other factor(s).Examples of dependent variables include productiv-ity, absenteeism, turnover, deviant workplace behav-ior, organizational citizenship behavior, and job sat-isfaction. An independent variable is the presumedcause of some change in the dependent variable. Theindependent variable is further divided into threelevels: individual level (lowest level), group level(middle level), and organization level (highest level).
The individual level deals with issues such as per-sonality and emotions, values and attitudes, ability,perception, motivation, individual learning and de-cision making, and biographical characteristics (e.g.,age and gender).
The group level deals with issues such as group de-cision making, leadership and trust, group structure,communication, work teams, conflict, group power,and group or organizational politics.
The organization level deals with issues such asorganizational culture, human resource policies andpractices (e.g., employee selection processes, train-ing and development programs, and performance

JWBT150-Vallabhaneni c01 July 28, 2009 17:25
LEARNING OBJECTIVE 1.10: UNDERSTAND THE VARIOUS ISSUES IN ORGANIZATIONAL BEHAVIOR 39
evaluation methods), and organization structure anddesign.
In fact, the scope of OB is very broad as it touchesmost of the learning objectives (2 through 9) ad-dressed in this learning module.
Organizational Culture DefinedAccording to Robbins and Judge (Robbins andJudge), organizational culture (OC) refers to a sys-tem of shared meaning held by employees thatdistinguishes their organization from other organi-zations. OC provides direction to employees andhelps them understand how things are done in theorganization. In other words, OC defines the rules ofthe game.
A strong culture provides stability (asset) to an or-ganization, and at the same time it can become a ma-jor barrier to change (liability). Every organizationhas a culture, and it can have a significant influenceon the employees’ attitudes and behaviors.
Researchers have identified seven characteristicsto capture the essence of an organization’s culture:(1) innovation and risk taking, (2) attention to detail,(3) outcome (results) orientation, (4) people orienta-tion, (5) team orientation (team versus individual),(6) aggressiveness (competitive versus easygoing),and (7) stability (status quo versus growth).
Organizational Culture versus JobSatisfaction
� OC measures how employees see their organi-zation.
� Job satisfaction measures affective responses tothe work environment.
� OC is a descriptive term while job satisfactionis an evaluative term.
� Both OC and job satisfaction have some com-mon characteristics.
Culture has two sides: functional and dysfunc-tional. The functional aspects of culture includeboundary-defining role, a sense of identity and com-mitment, stability of the social system through stan-dards, and a control mechanism to guide and shapethe attitudes and behaviors of employees. The dys-functional aspects of a strong culture include bar-riers to change, barriers to diversity, and barriers toacquisitions and mergers.
The content and strength of culture can influencean organization’s ethical climate and the ethical be-havior of its employees. An OC most likely to shape
high ethical standards is one that is high in risk toler-ance, low to moderate in aggressiveness, and focuseson means as well as outcomes. A strong OC will ex-ert more influence on employees (e.g., on turnover)than a weak one. If the culture is strong and supportshigh ethical standards, it should have a very power-ful and positive influence on employee behavior. Acombination of the following practices can create astronger and more ethical culture:
� Be a visible role model by taking the ethical highroad.
� Communicate ethical expectations through a codeof ethics.
� Provide ethics training to address ethical dilem-mas.
� Visibly reward ethical acts and punish unethicalones.
� Provide protective mechanisms to employeesthrough ethical counselors, ombudsmen, or ethi-cal officers.
Culture is first formed from the founder’s philoso-phy, which is reflected in hiring employees at all lev-els. Later, the current top management set the gen-eral climate of what is acceptable behavior and whatis not. Culture is transmitted to employees throughstories, rituals, material symbols, and language.
Culture is shared among employees throughwidened span of control, flattened organizationstructures, introduction of teams, reduced formal-ization, and empowered employees to ensure thatevery employee is pointed in the same directionto achieve the organization’s common goals andobjectives.
Culture is made more customer responsivethrough employee selection, training and socializa-tion, organization structures, empowerment, leader-ship, performance evaluation, and reward systems.
Organizational Change DefinedOrganizations must change to survive in a compet-itive environment. This requires everyone in the or-ganization believing in and accepting the change.Ideally, managers need to be architects or agents ofchange rather than victims of change. When intro-ducing changes, managers often are surprised thatthings do not turn out as planned. This is becausethe change process is not carried out properly. Thechange itself is not the problem. When managersare acting as agents of change, their company willbe much more responsive, flexible, and competitive.

JWBT150-Vallabhaneni c01 July 28, 2009 17:25
40 Learning Module 1: General Management, Leadership, and Strategy
A corporation can change by reengineering busi-ness policies, processes, jobs, and procedures; out-sourcing nonstrategic activities; partnering with ma-jor suppliers and customers; implementing totalquality management programs; redesigning the or-ganizational structure to fit the business strategy;renovating physical plants and facilities; installingcomputer-based systems and technologies; under-standing one’s own products, services, markets,and customers and those of competitors; and in-stalling performance measurement methods and re-ward systems.
Handling of Change
Employees at the top of the organization usuallypromote change because they have clear visionand better goals to achieve.
Employees at the bottom of the organization usu-ally resist change the least because they knowhow bad things really are at their level.
Employees at the middle of the organization usu-ally resist change the most because they neitherknow top management goals nor know howbad things really are at the bottom. They arein a confused state since they know neither thetop nor the bottom.
Types of Organizational ChangeOrganization psychologists David Nadler andMichael Tushman developed an instructive typol-ogy of organizational change describing four typesof changes (Kreitner):
Incremental Strategic
Anticipatory Tuning 1 Reorientation 3Reactive Adaptation 2 Re-creation 4
Anticipatory changes are any systematicallyplanned changes intended to take advantage ofexpected situations (e.g., following demographics).Reactive changes are those necessitated by unex-pected environmental events (e.g., responding tocompetitor’s action). Incremental changes involvethe subsystems adjustments needed to keep the or-ganization on its chosen path (e.g., adding a thirdshift in a manufacturing plant). Strategic changesalter the overall shape or direction of the organiza-tion (e.g., switch from building houses to apartmentsby a construction contractor).
The four specific resulting types of organizationalchange from the previous model are tuning, adapta-tion, reorientation, and re-creation.
Tuning is the most common form of organizationalchange covering preventive maintenance and con-tinuous improvement. The major thrust of tuningis to actively anticipate and avoid problems ratherthan passively waiting for things to go wrong beforetaking action. Managers should seek the change, notjust expect the change.
Adaptation, like tuning, involves incrementalchanges. The difference is that the changes are inreaction to external problems, events, or pressures.
The reorientation change is anticipatory andstrategic in scope. It is also called frame bendingbecause the organization is significantly redirectedwhile continuing its original mission.
Re-creation is a type of change that is reactive andstrategic in scope. It is also called frame breakingbecause the new organization is completely differentfrom the past.
Resistance to Organizational ChangeOrganizational change comes in all forms, sizes,shapes, and with various degrees of impacts andconsequences for employees. Among the most com-mon reasons for resistance to change are: surprise,inertia, misunderstanding, emotional side effects,lack of trust, fear of failure, personality conflicts,lack of tact, threat to job status or security, andbreakup of work groups. Management faces thechallenge of foreseeing and neutralizing resistanceto change, as the resistance is both rational andirrational.
Management theorists have offered at least six op-tions to overcome resistance to change: (1) educationand communication, (2) participation and involve-ment, (3) facilitation and support, (4) negotiation andagreement, (5) manipulation and co-optation, and (6)explicit and implicit coercion. Situational appropri-ateness is the key to success.
Manipulation occurs when managers selectivelywithhold or dispense information and consciouslyarrange events to increase the chance that a changewill be successful. Co-optation normally involves to-ken participation, and the impact of their input isnegligible.
Explicit and implicit coercion is involved whenmanagers who cannot or will not invest the timerequired for the other strategies force employees togo along with a change by threatening them with

JWBT150-Vallabhaneni c01 July 28, 2009 17:25
LEARNING OBJECTIVE 1.10: UNDERSTAND THE VARIOUS ISSUES IN ORGANIZATIONAL BEHAVIOR 41
termination, loss of pay raises or promotions, trans-fer, and so forth.
Organizational Development DefinedOrganizational development (OD) is a systematicapproach to planned change programs intended tohelp employees and organizations function more ef-fectively. OD combines the knowledge from variousdisciplines, such as behavioral science, psychology,sociology, education, and management. OD is a pro-cess of fundamental change in an organization’s cul-ture. For OD programs to be effective, not only mustthey be tailored to unique situations, but they alsomust meet the seven common objectives in order todevelop trust. Problem-solving skills, communica-tion, and cooperation are required for success.
Social psychologist Kurt Lewin recommended thatchange agents unfreeze, change, and then refreezesocial systems related to three major phases or com-ponents of OD:
Unfreezing Phase → Change Phase→ Refreezing Phase
Unfreezing involves neutralizing resistance bypreparing employees for change. Change involvesimplementing the change strategy. Refreezing in-volves systematically following up a change pro-gram for permanent results.
Unfreezing PhaseThe objective of the unfreezing phase is to assess thesituation and suggest an appropriate change strat-egy. The scope of work includes making announce-ments, holding meetings, and launching a promo-tional campaign in the organization’s newsletter andon bulletin boards. The goal is to deliver a clear mes-sage to employees about the change. Managementneeds to avoid creating unrealistic expectations suchas miracles.
During the unfreezing phase, management maychoose to diagnose the situation by using severalapproaches, such as: (1) requiring records (person-nel or financial) for signs of excessive absenteeism,cost overruns, budget variances, (2) interviewingemployees with specific questions about their joband the organization, (3) mailing survey question-naires for opinions and suggestions, and (4) observ-ing employees at work since people tend to say onething and do another. After the data are collectedand compiled, it is good to compare the results with
past results to see how things have changed. Thiswould help in mapping a future course of action.
Change PhaseThe objective of the change phase is to implementthe change strategy through enhanced collaborationand cooperation. In this phase of intervention, thewheels of change are set in motion. Intervention heremeans that a systematic attempt will be made to cor-rect an organizational deficiency uncovered throughdiagnosis.
Six popular OD interventions designed to increaseeffectiveness are (1) life and career planning, (2) skilldevelopment, (3) role analysis, (4) team building,(5) survey feedback, and (6) OD grid. The OD gridis based on Blake and Mouton’s Leadership Grid—apopular OD approach.
Refreezing PhaseThe objective of the refreezing phase is to addressunanticipated problems and side effects and to main-tain positive changes. The effectiveness of changestrategy is also evaluated. The scope includes follow-up and monitoring to ensure lasting change.
Organizational Effectiveness DefinedEffectiveness is a measure of whether organiza-tional goals and objectives are accomplished. It is thecombined effect of organizational behavior, culture,change, and development.
Organizational Effectiveness= Organizational Behavior+ Organizational Culture+ Organizational Change+ Organizational Development
The criteria of organizational effectiveness include:� The effectiveness criterion is prescribed by society
in the form of explicit expectations, regulations,and laws, and by stockholders in the form of prof-its, return on investment, and growth.
� Organizational effectiveness has a time dimensionto it (i.e., near future, intermediate future, and dis-tant future) as well as a performance dimension(i.e., productivity, efficiency, and economy).
Organizational Decline DefinedOrganizational decline results from managementcomplacency (usually the primary culprit), unsteadyeconomic growth, resource shortages, competition,

JWBT150-Vallabhaneni c01 July 28, 2009 17:25
42 Learning Module 1: General Management, Leadership, and Strategy
and weak demand for products and services. Thedecline typically involves a reduction in the sizeor scope of the organization. The decline is com-pounded by lack of effectiveness and efficiency.While effectiveness deals with achieving goals andobjectives, efficiency deals with how well inputs(e.g., all resources such as men, materials, machin-ery, money, information, and energy) are utilized toproduce outputs (e.g., products and services).
Organizational Decline= Organizational Ineffectiveness+ Organizational Inefficiency+ Organizational Nonperformance+ Management Complacency
Some ways to prevent organizational decline in-clude taking the following actions:� Organize the company into definable businesses
that have explicit goals.� Concentrate on the toughest competitors and the
most difficult customers.� Define each job so that it is closely tied to a defin-
able business purpose.� Promote individual diversity to take risks and ex-
periment with new ideas.� Strengthen the participative management process.� Emphasize more effective communication and in-
formation flow—downward, upward, and hori-zontal.
❑ Learning Objective 1.11:UNDERSTAND HOW TO MEASUREAND MANAGE BUSINESSPERFORMANCE RESULTSPerformance is the organization’s ability to attain itsgoals and objectives by using resources in an efficientand effective manner. The scope includes productiv-ity, effectiveness, efficiency, and economy, which arecompared and contrasted.
Productivity DefinedProductivity is the organization’s output of goodsand services divided by its inputs. This means pro-ductivity can be improved by either increasing theamount of output using the same level of inputs, orreducing the number of inputs required to producethe desired output.
Two approaches for measuring productivity aretotal factor productivity and partial productivity.
Total factor productivity is the ratio of total out-puts to the inputs from labor, capital, materials, andenergy. Partial productivity is the ratio of total out-puts to a major category of inputs. Productivity mea-surement is used to indicate whether there is a needfor any improvement in the first place. It is often apart of the improvement process itself and is used togauge whether improvement efforts are making anyprogress.
Measurement alone has a dramatic impact on pro-ductivity since the effects of feedback are so power-ful. Measurement helps diagnose productivity needsand can be used to focus improvement resourceson the most needed operations. Monitoring ofperformance, feedback, and regular considerationof performance peaks and valleys as indicated bymeasurement data are powerful stimuli for change.Productivity measurement strategies must be simpleand practical and must be continually reevaluated.
Examples of productivity measurement metricsare:
� Number of customers helped divided by numberof customer service representatives
� Number of parts inspected divided by number ofinspection hours
Components of Productivity MeasurementFour components of productivity measurement ex-ist: (1) inputs, (2) processes, (3) interim outputs, and(4) final outputs from which all measures of produc-tivity are built.
Input represents the amount of resources con-sumed in the production of outputs such as clericaltime, budget, and labor hours. Processes transforminputs to final outputs through interim outputs.Final output represents some unit of productionor results such as number of contracts negoti-ated and amount of profit per completed contract.Both outputs and inputs must be measurable andquantifiable.
Criteria for Productivity ImprovementIn addition to accuracy, four other criteria must beconsidered as part of the continuous process of pro-ductivity improvement:
1. Quality. A measure that assesses only quantityof outputs can lead to reduced productivity inthe long run. Both quality and quantity must bedefined and measured.

JWBT150-Vallabhaneni c01 July 28, 2009 17:25
LEARNING OBJECTIVE 1.11: UNDERSTAND HOW TO MEASURE AND MANAGE BUSINESS PERFORMANCE RESULTS 43
2. Mission and goals. The measure must be relatedto an organization’s mission and strategic goals.Measures directed to products and services thatare not consistent with mission and goals threatenproductivity.
3. Rewards and incentives. Measures must be inte-grated with performance incentives, reward sys-tems, and practices. Measures that have no im-portant contingencies will not work to improveproductivity.
4. Employee involvement. Employees must partici-pate in the definition and construction of produc-tivity measures. When lack of involvement hasnot resulted in commitment and buy-in, resultsfrom the measures are not likely to be receivedfavorably or to have any impact on future pro-ductivity.
Criteria for Measurement of Outputs� Accuracy� Timeliness� Quantity� Customer satisfaction� Completeness� Cost performance
Guidelines for Productivity MeasurementProductivity measurement occurs within a dynamicand complex organization. This means that the or-ganization’s culture, the values and experience ofemployees, and the political context all will havea greater impact on the measurement process. Theideal organization is the one that institutionalizes aproductivity measurement system as a “way of do-ing business.”
The traditional performance and productivitymeasurements such as time schedules, on-time de-livery, and cost savings continue to be valid. How-ever, new concepts such as benchmarking, continu-ous process improvement, concurrent engineering,quality circles, self-managed teams, statistical pro-cess control, and total quality management shouldbe practiced and complemented with the traditionalmeasurements.
Improving ProductivityWhen an organization decides that improving pro-ductivity is important, there are three places to look:technological productivity, worker productivity, andmanagerial productivity. Increased technological
productivity refers to the use of more efficient ma-chines, robots, computers, and other technologiesto increase outputs. Increased worker productivitymeans having workers produce more outputs in thesame time period. This includes employees workingharder, improving work processes, acquiring moreknowledge, more resources, improved task or work-place design, and motivating employees. Increasedmanagerial productivity simply means that man-agers do a better job of running the business. Often,the real reason for productivity problems is due topoor management.
Effectiveness, Efficiency, and EconomyDefinedEffectiveness is the degree to which an organiza-tion achieves a stated goal or objective. Efficiency isthe use of minimal resources—raw materials, money,and people—to provide a desired volume of output.Economy means whether an organization is acquir-ing the appropriate type, quality, and amount of re-sources at an appropriate cost.
Effectiveness and efficiency are related to produc-tivity measurement. Effective production is the pro-cess that produces the desired results. Efficient pro-duction means achieving the desired results witha minimum of inputs. Efficiency and effectivenessmust go hand-in-hand in productive organizations.Organizations can temporarily survive without per-fect efficiency; they usually die if they are ineffective.
Design of Performance MeasurementSystemsPerformance measures should be accurately defined,analyzed, and documented so that all interested par-ties are informed about them. Performance stan-dards should bring meaning to measurements. Em-ployees who are being measured should feel thatstandards and specific performance measures arefair and achievable. Self-measurement may createconfidence and trust and permit fast feedback andcorrection from employees. But it can also lead todistortions, concealment, and delays in reporting.
One of the design objectives should be that per-formance standards must be simple, meaningful,comparable, reproducible, and traceable given sim-ilar business conditions. Care should be taken tocompare items that are alike in terms of units ofmeasurements (pounds, grams, liters, or gallons),

JWBT150-Vallabhaneni c01 July 28, 2009 17:25
44 Learning Module 1: General Management, Leadership, and Strategy
timeframes (hours or days), quantity (volume inunits or tons), and quality (meeting the require-ments).
During the design of performance measurements,the design team should take both human factors andtechnical factors into account. From a human fac-tor viewpoint, ensure that performance measuresare not so loose that they present no challenge or sotight that they cannot be attainable. Ideally, both sub-ordinates and superiors must participate in identify-ing and developing the performance metrics. Froma technical factor viewpoint, employees should begiven proper tools, training, and equipment to dotheir job. Otherwise frustration will result. Aboveall, the performance measures should be based onobjective measurement instead of subjective mea-surement to minimize human bias and suspicion ofthe reported measurements.
Periodically, the performance measurementsshould be reviewed and updated to ensure theircontinued applicability to the situations at hand.Evaluations of performance measures should con-centrate on the significant exceptions or deviations
from the standards. Therefore, exception reporting ispreferred. Significant variances (deviations) requireanalysis and correction of standards or procedures.
The standards should match the objectives of theoperation or function being reviewed. Usually thestandards can be found in standard operating proce-dures, job descriptions, organizational policies anddirectives, product design specifications, operatingbudgets, trade sources, organization’s contracts, ap-plicable laws and regulations, generally acceptedbusiness practices, generally accepted industry stan-dards, generally accepted accounting principles, andgenerally accepted auditing standards.
Self-Assessment Exercise
Online exercises are provided for the learn-ing objectives in this module. Please visitwww.mbaiq.com to complete the online exercisesand to calculate your MBA IQ Score.

JWBT150-Vallabhaneni c02 July 28, 2009 17:24
LEARNING MODULE 2
Operations Management
Learning Objective 2.1: Understand theStrategic Importance of DemandForecasting 46Time-Series Models 46Linear Regression Analysis 47Correlation Analysis 47
Learning Objective 2.2: Understand theProduction Strategies andManufacturing PerformanceMeasures 47
Learning Objective 2.3: Understand theProduction-Related Value Concepts 48Value Analysis, Engineering, and Research 48Value Index 49Value-Stream Mapping 49Value-Based Location Strategy 49Product-by-Value Analysis 49
Learning Objective 2.4: Understand thePhilosophies of Just-In-Time andLean Operations 49Waste 49Variability 50Throughput 50Just-in-Time Strategy 50Lean Operations 52
Learning Objective 2.5: Understand thePrinciples and Techniques ofInventory Management 52Demand 52Inventory Levels 53ABC Analysis 55Cycle Counting 56
Learning Objective 2.6: Understand thePrinciples and Techniques ofSupply-Chain and LogisticsManagement 56Supply Chain 56Logistics Management 57
Learning Objective 2.7: Understand theVarious Planning SystemsApplicable to Manufacturing andDistribution Operations 58
Master Production Schedule 58Material Requirements Planning 58Distribution Requirements Planning 59Enterprise Resource Planning 59Customer Relationship Management 59Capacity Requirements Planning 60Aggregate Production Planning 60
Learning Objective 2.8: Understand theVarious Short-Term SchedulingSystems Used in Production 60Capacity Planning versus Short-Term
Scheduling 61Scheduling Methods 61Loading Jobs 61Job Sequencing 61Level-Material-Use Schedule 62
Learning Objective 2.9: Understand theTheory of Constraints in Operations 62Theory of Constraints 62Drum-Buffer-Rope Scheduling 62Buffer Management 62VAT Analysis 62The Five Focusing Steps 63
Learning Objective 2.10: Understandthe Principles of ProductionEconomics and Application ofDecision Tools 63Make-or-Buy Analysis 63Learning-Curve Analysis 63Supplier’s Breakeven Analysis 63Outsourcing 64Machine Selection 64Plant Selection 64Decision Tools 64
Learning Objective 2.11: Understandthe Principles and Techniques ofEquipment Maintenance and SystemReliability 65Equipment Maintenance 65System Reliability 65
Learning Objective 2.12: Understandthe Production Process Flows andMetrics 66
45

JWBT150-Vallabhaneni c02 July 28, 2009 17:24
46 Learning Module 2: Operations Management
Learning Objective 2.13: Understandthe Technology Deployed inManufacturing and ServiceOperations 67
Flexible Manufacturing Systems 67Process Control Systems 68Point-of-Sale Systems 68Bar-Coding Systems 68
❑ Learning Objective 2.1:UNDERSTAND THE STRATEGICIMPORTANCE OF DEMANDFORECASTINGManufacturing companies generate revenues byproducing and selling their products to customers.Service companies generate revenues by providingtheir services to clients. Since revenues drive ex-penses, profits, and stock prices of companies, pre-dicting revenue levels is a strategic issue for all levelsof management. Revenue forecasts are called de-mand forecasts.
Good forecasts are an essential part of effi-cient manufacturing and service operations as theydeal with predicting future events such as prod-uct/service demand to create revenues. Manage-ment has a choice in that they can wait and seewhat happens to actual demand without forecast-ing the demand (reactive), which is risky, or theycan forecast the demand for both short run andlong run (proactive). Forecasts reduce uncertainty(risk) about future outcomes because managementcan plan ahead.
Timely Demand Forecasts → Timely OperationalPlans
Late Demand Forecasts → Late Operational Plans
Demand forecasting may involve the use of a com-bination of quantitative methods (e.g., time-seriesmodels, regression analysis, and correlation analy-sis) and qualitative methods (e.g., executive opin-ions, Delphi method, sales force estimates, and con-sumer market surveys). The Delphi method usesexpert decision-makers (5 to 10) to estimate the salesforecast without face-to-face meetings.
Demand forecasts are prepared for three time hori-zons: short-range (less than three months to oneyear for planning purchasing, production, budget-ing, and job assignments), medium-range (fromthree months to three years for planning sales, pro-duction, and cash), and long-range (three years ormore for planning new products, new plants, newequipment, new offices, new warehouses, and re-search and development programs).
Demand forecasts drive a manufacturing com-pany’s production plans, material requirementplans, capacity requirement plans, and productionscheduling and serve as inputs to financial, market-ing, and human resource planning. For example, assales demand is projected higher, more employeesneed to be hired.
Time-Series ModelsTime-series models use past data points to projectfuture data points and have four components, suchas trends (upward or downward data movement),seasonality (data pattern that repeats itself period-ically in weeks and months), cycles (data patternsthat occur every several years that tie into the busi-ness cycles), and random variation (no data pat-terns shown as bumps or blips in the data causedby chance and unusual conditions and hence can-not be predicted). Examples of time-series modelsinclude naıve (intuitive) approach, moving average,exponential smoothing, and trend projection.
The naıve approach assumes that demand in thenext period will be equal to demand in the mostrecent period. The moving-average method uses anaverage of the most recent periods of data to forecastthe next period. The exponential smoothing methoduses a weighted-moving-average technique in whichdata points are weighted by an exponential function.The trend projection method fits a trend line to aseries of historical data points and then projects theline into the future.
The following formulas are related to time-seriesmodels:
Moving Average = (Sum of Demand in Previous nperiods)/n
New Forecast Using Exponential Smoothing =(Last Period′s Forecast) + Alpha (Last Period′sActual Demand − Last Period′s Forecast)
where alpha is a weight (smoothing constant) witha value between 0 and 1. The value of alpha can behigh if weighted more for recent data and can be lowif weighted more for past data.
Trend Line Using the Least-Squares Method= y = a + bx

JWBT150-Vallabhaneni c02 July 28, 2009 17:24
LEARNING OBJECTIVE 2.2: UNDERSTAND THE PRODUCTION STRATEGIES AND MANUFACTURING PERFORMANCE MEASURES 47
where y is the intercept (height) and b is the slope(the angle of the line).
Linear Regression AnalysisLinear regression analysis, which is an associativemodel, considers several variables that are related tothe quantity being predicted. The linear regressionmethod is more powerful than the time-series meth-ods that use only historical values for the forecastedvariable. Two types of variables exist: the dependentvariable, which is the forecasted item of interest, andthe independent variable, which is related to the de-pendent variable. The multiple regression methoduses more than one independent variable, whereasthe linear regression method uses only one indepen-dent variable.
Linear regression analysis using the least-squaresmethod is calculated as follows:
y = a + bx
where y is the value of the dependent variable, a isthe y-axis intercept, b is the slope of the regressionline, and x is the independent variable.
Application of Regression Analysis
XYZ Company derived the following cost rela-tionship from a regression analysis of its monthlymanufacturing overhead cost:
C = $80,000 + $12 M
where C is monthly manufacturing overhead costand M is machine hours. The standard error ofestimate of the regression is $6,000. The standardtime required to manufacture a case of the com-pany’s single product is four machine hours. XYZapplies manufacturing overhead to production onthe basis of machine hours, and its normal annualproduction is 50,000 cases.
Question 1: What is the estimated variable man-ufacturing overhead cost for a month in whichscheduled production is 5,000 cases?
Answer 1: In the cost equation C = $80,000 +$12 M, $80,000 is the fixed cost component, and$12 M is the variable cost component. That is,$12 × 5,000 cases × 4 machine hours per case= $240,000.
Question 2: What is the predetermined fixed man-ufacturing overhead rate?
Answer 2: Since $80,000 is the fixed componentper month, we need to multiply this by 12 toobtain one-year fixed cost. The predeterminedoverhead rate per machine hour is ($80,000 ×12)/(50,000 × 4) = $4.80.
Source: Certified Internal Auditor (CIA) Exams from the In-
stitute of Internal Auditors (IIA), Altamonte Springs, Florida,
USA.
Correlation AnalysisCorrelation analysis predicts the cause-and-effectrelationships between two variables, whereas regres-sion methods cannot. Two types of correlation mea-sures exist: (1) coefficient of correlation, which is ameasure of the strength of the relationship betweentwo variables, and (2) coefficient of determination,which is the square of the coefficient of correlation.The coefficient of determination is the percent ofvariation in the dependent variable that is explainedby the regression equation.
❑ Learning Objective 2.2:UNDERSTAND THE PRODUCTIONSTRATEGIES ANDMANUFACTURINGPERFORMANCE MEASURESProduction strategies deal with transforming re-sources (raw materials, labor, energy, and ma-chines) into products and services. Four types ofproduction strategies include process focus, repet-itive focus, product focus, and mass customization.
1. In a process focus, a production facility is orga-nized around processes to facilitate low-volume,high-variety production.
2. In a repetitive focus, a production facility is orga-nized around modules, where modules are partsor components of a product that were previouslyprepared.
3. In a product focus, a production facility is orga-nized around products to facilitate high-volume,low-variety production.
4. In a mass customization, high-volume, high-variety, rapid, and low-cost production is used tomeet constantly changing customer needs. It usesbuild-to-order systems, which means producingto actual customer orders and not to forecasts.

JWBT150-Vallabhaneni c02 July 28, 2009 17:24
48 Learning Module 2: Operations Management
Examples of tools and techniques used in pro-duction strategies include crossover charts, flowdiagrams, time-function (process) mapping, value-stream mapping, process charts, and serviceblueprinting.
A crossover chart can be drawn to show costs at thepossible volumes for more than one process. How-ever, at any given volume, only one process will havethe lowest cost. A crossover point can be determinedwhere the total cost of the processes changes.
A flow diagram is used to analyze movement ofmaterial or people. A process mapping is a flow di-agram with the time element added. A value-streammapping deals with adding value in the flow of ma-terial and information through the entire produc-tion process. A process chart uses symbols to ana-lyze the movement of material or people. In serviceblueprinting, the focus is on the customer and theprovider’s interaction with the customer.
Manufacturing performance measures includeboth financial and nonfinancial measures, wherethe latter include total manufacturing cycle time(MCT), manufacturing cycle efficiency (MCE), andtotal throughput. Management should compare ac-tual performance against the target to identify areasneeding improvement.
The following formulas apply to manufacturingperformance measures:
Total MCT = Value-Added Time+ Non-Value-Added Time
The value-added time is called process time or as-sembly time, and the non-value-added time is thetime spent in inspecting, waiting, and moving thingsaround in the plant. A cycle is a complete set of tasksincluded in an operation or a process. Cycle timeis the number of steps or procedures necessary tocomplete those tasks.
MCE = Total Hours of Value-Added Time inProduction Process/Total MCT in Hours
or
MCE = Value-Added Time/Throughput Time
Eliminating or reducing the non-value-added timeincreases the MCE. As the MCE increases, it de-creases the throughput time.
Total Throughput = Number of Good UnitsProduced/Total MCT
Throughput Time (velocity of production)= Process Time + Inspection Time + Wait Time+ Move Time
Actual Delivery Cycle Time = ThroughputTime + Shipping Time
❑ Learning Objective 2.3:UNDERSTAND THEPRODUCTION-RELATED VALUECONCEPTSProduction-related value concepts include valueanalysis, engineering, and research; value index;value-stream mapping; value-based location strat-egy; and product-by-value analysis.
Value Analysis, Engineering, and ResearchValue analysis (VA) is the organized and systematicstudy of every element of cost in a manufacturedpart, raw material, or service to make certain it ful-fills its function at the lowest possible cost. Value isdefined as function divided by cost. VA assigns aprice to every step of a process and then computesthe benefit-to-cost ratio of that step.
The goal of VA is to make improvements in a prod-uct while the product is being produced and afterdeciding that a new product is a success. VA focuseson the production stage to make it better and eco-nomical, thus improving a product’s value.
VA is related to product or service characteristicssuch as quality, performance, marketability, main-tainability, and reliability. There is a tradeoff in-volved among these characteristics.
Value engineering (VE) can be applied to twoareas: procurement contracts and manufacturedproducts. VE is referred to as function analysis. Theterms VA and VE are used synonymously.
Regarding procurement contracts, VE is the formaltechnique by which contractors may (1) voluntar-ily suggest methods for performing more econom-ically and share in any resulting savings or (2) berequired to establish a program to identify methodsfor performing more economically. VE attempts toeliminate, without impairing essential functions orcharacteristics, anything that increases acquisition,operation, or support costs.
Regarding manufactured products, the goal of VEis to improve a new product’s design and specifica-tions before a product reaches the production stage.

JWBT150-Vallabhaneni c02 July 28, 2009 17:24
LEARNING OBJECTIVE 2.4: UNDERSTAND THE PHILOSOPHIES OF JUST-IN-TIME AND LEAN OPERATIONS 49
It focuses on cost reduction and cost-avoidance tech-niques to improve product value and meet customerrequirements in an optimal way. It reduces the com-plexity of a product with robust design. VE focuseson pre-production design work to improve a prod-uct’s value.
Value research, which is related to VE, focuseson identifying customers’ likes, dislikes, and neu-tral features in a given product or service. The goalis to correct the dislikes and neutral features throughcost reductions and turn them into “likes” features.
Value IndexThe value index is a ratio of relative importance ofa component to a customer to the total cost devotedto that component, both expressed as percentages.The components with a value index of less than 1.0are candidates for value engineering in terms of re-ducing costs. The components with a value indexof more than 1.0 are candidates for value enhance-ments, since they need more investment to improvefeatures important to customers.
Interpretation of Value Index
Value index ratio for a component < 1.0: its costsare higher relative to its importance to cus-tomers.
Value index ratio for a component > 1.0: its rela-tive importance to customers is greater than itscost.
Value-Stream MappingThe goal of value-stream mapping is to under-stand the complexities of process design and re-design stages. It focuses on where value is addedor not added to a product, starting from the suppli-ers and manufacturers (producers) and ending withcustomers. It looks at the production process as wellas the management decisions and information sys-tems that support the production process.
Value-Stream Mapping = Suppliers → Producers→ Customers
Value-Based Location StrategyThe goal of value-based location strategy is to max-imize the value and benefit of location to a company.
Location strategies include expanding an existingfacility, maintaining a current facility, adding a newfacility, closing an existing facility, or moving to an-other location.
Application of Location Strategy
For a manufacturing company, the location strat-egy primarily focuses on minimizing costs.
For a retail company, the location strategy primar-ily focuses on maximizing revenues.
For a distribution company, the location strategyprimarily focuses on maximizing the speed ofdelivery of goods to customers.
Product-by-Value AnalysisProduct-by-value analysis lists products in de-scending order of their individual dollar contribu-tions to the firm. It also lists the total annual dollarcontribution of the product. This type of analysistells managers which products should be eliminatedand which products require further investment in re-search and development and capital equipment. Theproduct-by-value analysis can help management inincreasing cash flows, increasing market penetra-tion, and reducing costs.
❑ Learning Objective 2.4:UNDERSTAND THEPHILOSOPHIES OF JUST-IN-TIMEAND LEAN OPERATIONSOperations management primarily focuses on threethings: (1) eliminating waste by removing non-value-added activities, (2) removing variability inproduct specifications and production processes byremoving problems and waste and adding value ateach step of the production process, and (3) increas-ing throughput by reducing the total manufacturingcycle time (MCT) and using pull systems. There isa relationship between variability and waste in thatthe lower the variability in a product, the lower thewaste in that product.
WasteTaiichi Ohno of Japan pointed out seven wastes(7Ws) in a production system, and he believes thatany activity that does not add value to a customer

JWBT150-Vallabhaneni c02 July 28, 2009 17:24
50 Learning Module 2: Operations Management
is waste (muda in Japanese). His seven categories ofwaste are overproduction (producing early or pro-ducing more than orders), queues (idle time, stor-age time, and waiting time), transportation (movingand handling the same material more than once), in-ventory (keeping stock on hand), motion (unneces-sary movement of material, people, and equipment),overprocessing (unnecessary work performed ona product), and defective product (rework, scrap,product returns, and warranty claims resulting fromdefective products).
Japanese operations managers have identified 5 Ssfor a neat, orderly, and efficient workplace to reducewaste. These five Ss (5Ss) are sort, simplify, shine,standardize, and sustain. U.S. operations managersadded two Ss (2Ss), safety and support, to maintaina lean workplace. Operations managers working in afactory, office, hospital, or retail store can use the 7Ssto eliminate waste, so assets are used for productivepurposes only.
VariabilityA goal of operations management is to deliver a per-fect product to a customer on time and every time.Product variability does not enable a perfect prod-uct. Waste; incomplete design drawings; inaccurateproduct specifications; poor production processes;producing improper quantities, late, or nonconform-ing products; poor management; and unpredictablecustomer demand are factors that contribute to prod-uct variability.
ThroughputThroughput is the time required to manage a cus-tomer order through the production process, fromreceipt to delivery. One measure of throughput istotal MCT, which is the time that an order takes be-tween receiving of raw materials and shipping a fin-ished product. The goal is to drive down total MCTto increase throughput.
A technique for increasing throughput is a pullsystem, which uses signals to request materials andsupplies from upstream to downstream worksta-tions as needed. This is unlike a push system, whichrequests materials and supplies regardless of theirneed. Hence, the pull system, which is a standardtool of just-in-time (JIT), lowers costs, improves pro-duction schedules, enhances customer satisfaction,and increases throughput.
Just-in-Time StrategyJust-in-time (JIT) strategy is based on managementprinciples such as eliminate waste; produce to de-mand and one-at-a-time; think long term; develop,motivate, trust, and respect people; and achieve con-tinuous improvement (kaizen). This is made possi-ble when the focus is “quality at the source,” andthe tools used include statistical process control(SPC) methods, failsafe methods (mistake-proofingand checklists), and problem-solving methods us-ing five whys (5Ws) to determine the root cause of aproblem. Quality at the source means producing per-fect parts every time and all the time. An effectiveJIT strategy encompasses the entire product lifecy-cle from the acquisition of raw materials to deliv-ery of the end product to the final customer. Themajor benefits of JIT strategy are (1) improved pro-ductivity, quality, service, and flexibility and (2) re-duced costs, inventory investment, lead-times, lotsizes, and physical space.
The scope of JIT strategy includes topics suchas JIT production, purchasing, production process-ing, inventory, transportation, partnerships, quality,scheduling, and layout.
JIT ProductionJIT production strategy is to continuously improveproductivity and quality. It is based on the belief that“small could be better,” not “more is better.”
JIT Production versus Traditional Production
The pull systems are the prothesis of JIT produc-tion.
The pull system is based on a variable-flow man-ufacturing principle.
The JIT (pull) production system has a “no con-tingencies” (i.e., no safety stock) mentality.
The push systems are the antithesis of JIT produc-tion.
The push system is based on a fixed-flow manu-facturing principle.
The traditional (push) production system has a“contingency” (i.e., safety stock) mentality.
JIT PurchasingJIT purchasing requires a partnership between asupplier and a customer, which is a major departurefrom traditional purchasing. JIT supplier relations

JWBT150-Vallabhaneni c02 July 28, 2009 17:24
LEARNING OBJECTIVE 2.4: UNDERSTAND THE PHILOSOPHIES OF JUST-IN-TIME AND LEAN OPERATIONS 51
call for long-term partnerships with single-sourcesuppliers who provide certified quality materialswhile continuously reducing costs. The JIT sup-plier’s manufacturing processes must be under sta-tistical process control (SPC) and their capabilityshould be certified by the customer. The SPC chartsserve as the documentation to assure that the pro-cess stayed in control during the time the parts weremade. JIT purchasing is called stockless inventorysince the customer has no inventory to stock as itis used up in production right after it is received.The major goal is to reduce or eliminate work-in-process (WIP) inventory so that all raw materials areconsumed in a timely manner within the productionprocess.
Traditional Purchasing versus JIT Purchasing
Traditional purchasing practices call for infre-quent, large-lot shipments.
JIT purchasing practices call for frequent, small-lot shipments.
Traditional purchasing practices call for inspec-tion, since they focus on continuous checkingby the customer. These practices are reactivedue to their focus on “after the fact.”
JIT purchasing practices call for no inspection,since they focus on continuous improvementby the supplier. These practices are proactivedue to their focus on “before the fact.”
JIT Production ProcessingJIT production processing requires setup reduction,focused factory, group technology, uniform schedul-ing and mixed model scheduling, and the pull sys-tem. The objective here is to produce many varietiesof products in small quantities on short notice. Man-ufacturing flexibility is the hallmark of the JIT pro-duction processing strategy.
JIT InventoryA misconception about JIT is that it is just a programto reduce inventory. Fortunately, JIT does more thanthat. Major components of JIT inventory include re-ducing variability, reducing inventory quantities, re-ducing lot sizes, and reducing setup costs. Havingtoo much inventory on hand hides the level of vari-ability and bad quality in the production process.
JIT TransportationWhile JIT purchasing is the starting point of a JITcycle, JIT transportation is the execution part of theJIT cycle. JIT transportation is the physical linkagebetween the inside and the outside processes. It isa process that starts at a supplier location and endsat a customer location. It requires the analysis of alltransport events and the elimination of non-value-added events. The basic value-added events include:move load to dock at a supplier location, load carrier,move load to customer location, return empty trailerto terminal, unload by the customer, and move loadto assigned customer location.
JIT PartnershipsJIT partnerships are needed between suppliers andpurchasers of raw materials, parts, and componentsto remove waste and to drive down costs for mu-tual benefits. Long-term partnerships are better thanshort-term, so a few suppliers can invest money toimprove quality.
JIT QualityJIT quality is realized as JIT forces down inventorylevels, meaning fewer bad units are produced, whichin turn means fewer units must be reworked, thusimproving quality. As JIT shrinks queues and lead-times, it creates an early warning system for qualityproblems and production errors. As JIT quality is in-creased, there is less need for safety stock (inventorybuffers) to protect against unreliable quality levelsand unpredictable customer demand levels.
JIT SchedulingJIT scheduling improves the ability to meet cus-tomer order due dates, reduces inventory withsmaller lot sizes, and reduces work-in-process. Twotechniques include level schedules and kanban. Alevel schedule means each day’s production quan-tity meets the demand for that day, using fre-quent small batches. A kanban system moves partsthrough production via a pull signal. Kanban usesa card system giving authorization for the next con-tainer of material to be produced.
The following formulas can be used for JITscheduling:
Number of Kanban Containers= (Demand During Production Lead Time+ Safety Stock)/Container Size
JWBT150-Vallabhaneni c02 July 28, 2009 17:24
52 Learning Module 2: Operations Management
Production Lead Time= Wait Time + Material Handling Time+ Processing Time
Demand During Production Lead-Time= Daily Demand × Production Lead-Time
JIT LayoutAn efficient JIT layout reduces waste in the form ofminimizing the movement of materials on a factoryfloor or paper in an office because these movementsdo not add value. The benefits of JIT facility includedistance reduction, increased operational flexibility,employees working closer to each other, and reducedspace and inventory.
Lean OperationsTwo Japanese individuals, Toyoda and Ohno, aregiven credit for the Toyota Production System (TPS)with its three components of continuous improve-ment, respect for people, and standard work prac-tice. Continuous improvement means building anorganizational culture and instilling in its people avalue system stressing that processes can be alwaysimproved. These values start with job recruiting andjob practice and continue with job training. At Toy-ota, employees are recruited, trained, and treated (re-spected) as knowledge workers. They receive cross-training to enrich jobs, have few job classifications,and are empowered to stop machines and processeswhen quality problems exist. Work is specified as tocontent, sequence, timing, and outcome with sim-ple and direct flows of products and services as theymove from one person to another and from one ma-chine to another. Built-in tests are designed to au-tomatically signal problems so that any gaps canbe identified and corrected immediately to makethe production system more reliable, flexible, andadaptable.
Lean operations means identifying customervalue by analyzing all the activities required to pro-duce a product and then optimizing the entire pro-cess to increase value from the customers’ perspec-tive. The highlights of lean operations include un-derstanding what the customer wants and ensuringthat the customer’s input and feedback are obtainedto increase value to that customer. Lean operationsadopt a philosophy of minimizing waste by strivingfor perfection through continuous learning, creativ-ity, and teamwork, which can be equally applied tomanufacturing and service industries.
Both JIT and TPS have an internal focus on jobs,employees, work practices, materials, and training.Lean operations have an external focus on the cus-tomer. Lean operations need both JIT and TPS tech-niques and more.
Pull Systems—Manufacturing and DistributionIn pull systems, work is pulled from the manufactur-ing plant and have the following characteristics: (1)lean manufacturing production schedules are basedon actual customer order demand information,resulting in a build-to-order situation, (2) kanbanmaterial systems order raw materials, parts, andcomponents based on actual customer order demandinformation, and (3) replenishing field warehouse in-ventory decisions are made at the local distributioncenter.
Push Systems—Manufacturing and DistributionIn push systems, work is pulled through the man-ufacturing plant and have the following character-istics: (1) finished goods production schedules arebased on forecasts of customer order information,resulting in a build-to-stock situation, (2) material re-quirements planning (MRP) systems order raw ma-terials, parts, and components based on expectationof customer demand information, and (3) replenish-ing field warehouse inventory decisions are madeat the central distribution center or manufacturingplant.
❑ Learning Objective 2.5:UNDERSTAND THE PRINCIPLESAND TECHNIQUES OFINVENTORY MANAGEMENTManufacturing companies generate revenues byselling their end-products (finished goods) stored asinventory.
DemandFrom an inventory management viewpoint, demandis of two types: independent demand and dependentdemand.
Independent Demand Inventory SystemsIndependent demand inventory systems are basedon the premise that the demand or usage of a par-ticular item is not related to the demand or usage of

JWBT150-Vallabhaneni c02 July 28, 2009 17:24
LEARNING OBJECTIVE 2.5: UNDERSTAND THE PRINCIPLES AND TECHNIQUES OF INVENTORY MANAGEMENT 53
other items. Examples include finished goods; spareparts; material, repair, and operating (MRO) sup-plies; and resale inventories. Independent demandinventory systems are pull systems in that materi-als are pulled from the previous operation as theyare needed to replace materials that have been used(e.g., finished goods are replaced as they are sold).These types of inventory systems answer the ques-tion of when to place the replenishment order andhow much to order at one time. Reorder point mod-els and fixed/variable order quantity models (e.g.,economic order quantity, EOQ) are examples of in-dependent demand inventory systems, which can bereviewed either continuously or periodically.
Four possibilities exist, including the following:
1. Continuous review and fixed order quantity2. Periodic review and fixed order quantity3. Continuous review and variable order quantity4. Periodic review and variable order quantity
Dependent Demand Inventory SystemsDependent demand inventory systems are basedon the premise that the demand or usage of a par-ticular item is dependent on the demand or usage ofother items. Examples include raw materials, work-in-process inventories, and component parts.
A company manages its inventory by using var-ious methods and approaches (e.g., EOQ). Inven-tory consists of raw materials, work in process, andfinished goods. Efficient inventory management isneeded to support sales, which is necessary for prof-its. Benefits such as high turnover rate, low write-offs, and low lost sales can be attributed to efficientinventory management. These benefits in turn con-tribute to a high profit margin, a higher total assetturnover, a higher rate of return on investment, and astrong stock price. Inventory management is a majorconcern for product-based organizations (e.g., man-ufacturing and retail), since 20 to 40 percent of theirtotal assets is inventory and, as such, poor inventorycontrol will hurt the profitability of the organization.
Inventory LevelsInventory levels and accounts receivable levels di-rectly depend on sales levels. Receivables arise af-ter sales have been made, whereas inventory mustbe acquired or produced ahead of sales. Inventorymanagers have the responsibility to maintain inven-tories at levels that balance the benefits of reducingthe level of investment against the costs associated
with lowering inventories. A company’s inventoryis related to the amount of expected sales. The com-pany’s financial forecasting of inventory in the fol-lowing year would be most accurate when applyinga simple linear regression method.
Efficient inventory management focuses on threeareas: (1) investment in inventory, (2) optimal orderquantity, and (3) reorder point.
Investment in InventoryInvestment in inventory depends on the actual levelof inventory carried. The relevant question is howmany units of each inventory item the firm shouldhold in its stock. Two types of stock concepts must beunderstood: (1) working stock and (2) safety stock.The actual level of inventories carried will equal thesum of working stocks and safety stocks.
1. Working stock (cycle stock) is needed to meetnormal, expected production and sales demandlevels. Producing more goods than are currentlyneeded increases the firm’s carrying costs and ex-poses it to the risk of obsolescence if demandshould fall. Remember that demand for salesis uncertain. EOQ establishes the working stockamount.
2. Safety stock is needed to guard against changesin sales rates or delays in production and ship-ping activities, resulting in a stockout situation.Safety stock is additional stock beyond the work-ing stock and satisfies when demand is greaterthan expected. The additional costs of holding thesafety stock must be balanced against the costs ofsales lost due to inventory shortages. Safety stockwill not affect the reorder quantities as it is the in-ventory level at the time of reordering minus theexpected usage while the new goods are in transit.
The goal is to minimize both the cost of holdingsafety stock and the cost of stockouts. EOQ is notrelevant to stockouts. Production bottlenecks lead toa stockout. Factors to be considered in controllingstockouts include time needed for delivery, rate ofinventory usage, and safety stock.
Effective management requires close coordinationand communication among the various functionaldepartments of the organization such as the market-ing, sales, production, purchasing, and finance de-partments. Sales plans need to be converted into pur-chasing and production plans to produce finishedgoods and to acquire raw materials; financing plansare needed to support the inventory buildup.

JWBT150-Vallabhaneni c02 July 28, 2009 17:24
54 Learning Module 2: Operations Management
Since inventories need to be available prior to sales,an increase in production to meet increased sales re-quires an increase in notes payable (a liability ac-count). Since assets (inventories) are increasing, lia-bility (notes payable) must also increase.
Investment in inventory is not complete withoutdiscussing the various costs associated with inven-tories due to their direct relationships. The coststructure affects the amount and type of investmentneeded. Three types of inventory-related costs are:(1) carrying or holding costs, (2) ordering costs, and(3) stockout costs.
1. Carrying or holding costs are the costs associatedwith carrying a given level of inventory and rise indirect proportion to the average inventory carriedor held. The components of carrying costs includethe costs of capital tied up in inventory, opportu-nity cost associated with not being able to use thecapital for other investment, warehouse storageand handling costs, insurance premiums, prop-erty taxes, depreciation, pilferage, damage, andobsolescence cost.
2. Ordering costs are the costs associated with plac-ing an order and are fixed regardless of the aver-age size of inventory. The components of orderingcosts include the cost of placing orders, includ-ing production setup and shipping and handlingcosts. Examples include salaries of the purchasers,paper, postage, telephone, transportation, and re-ceiving costs.
3. Stockout costs are costs of running short of inven-tory and require safety stock as a cushion. How-ever, safety stock increases the carrying costs. Thecomponents of stockout costs include the loss ofsales, the loss of customer goodwill, and problemsor delays in production schedules.
Inventory managers face two decision rules ininventory management, “how-much-to-order” and“when-to-order,” that will result in the lowest pos-sible total inventory cost. The how-much-to-orderdecision rule can be satisfied with the use of anEOQ model. The when-to-order decision rule canbe satisfied with the use of a reorder point.
The how-much-to-order decision rule involves se-lecting an order quantity that draws a compromisebetween (1) keeping smaller inventories and order-ing frequently (results in high ordering costs) and(2) keeping large inventories and ordering infre-quently (results in high holding costs).
Optimal Order QuantityOptimal order quantity deals with deciding howmany units should be ordered or produced at a giventime. Either too much or too little inventory is notgood. An optimum inventory level is designed andis found through the use of the EOQ model becauseit provides the optimal, or least-cost, quantity of in-ventory that should be ordered.
The focus of the EOQ method is on the quantityof goods to order that will minimize the total costof ordering and holding (storing) goods. EOQ is adecision model that focuses on the trade-off betweencarrying costs and ordering costs. It calculates theorder quantity that minimizes total inventory costs.Calculus is used in determining the EOQ.
EOQ is appropriate for managing finished goodsinventories, which have independent demands fromcustomers or from forecasts. Note that the dataneeded to calculate EOQ includes the volume ofproduct sales (demand information), the purchaseprice of the products, the fixed cost of ordering prod-ucts, and carrying (holding) costs. It does not includethe volume of products in inventory, inventory de-livery times, delays in transportation, or quality ofmaterials.
If Q is the order quantity, then the how-much-to-order decision involves finding the value of Q thatwill minimize the sum of holding and ordering costs.
Q = EOQ =√
2D CoCh
where D is annual sales demand in units, Co is cost ofplacing one order, and Ch is cost of holding (carrying)one unit in inventory for the year.
Due to the square-root sign, a given increase insales will result in a less-than-proportionate increasein inventories, and the inventory turnover ratio willthus increase as sales grow.
Annual inventory holding cost is directly related tothe amount of inventory carried. The EOQ will risefollowing an increase in the fixed costs of placingand receiving an order.
If a company’s cost of ordering per order increaseswhile carrying costs per order remain the same, theoptimal order size as specified by the EOQ modelwould increase.
Two major assumptions of EOQ are:
1. The demand for an item is constant. Since theconstant demand assumption is not realistic,managers would have to be satisfied with the

JWBT150-Vallabhaneni c02 July 28, 2009 17:24
LEARNING OBJECTIVE 2.5: UNDERSTAND THE PRINCIPLES AND TECHNIQUES OF INVENTORY MANAGEMENT 55
near-minimum-cost order quantity instead of aminimum-total-cost order quantity.
2. The entire quantity ordered arrives at one pointin time. Again, this may not be realistic be-cause some vendors will deliver partial ship-ments. Managers usually add a judgmental value-based order quantity to the EOQ suggested orderquantity to accommodate unrealistic assumptionsof constant demand rate by the EOQ model.
Specific assumptions of the EOQ model include thefollowing:
� Sales can be forecasted perfectly. This is unrealistic.� Sales are evenly distributed throughout the year.
This is not realistic. What about seasonal or cyclicaldemands?
� Orders are received without delay. This is also un-realistic.
� Fixed costs, carrying costs, and purchase prices areall fixed and independent of the ordering proce-dures. This is not possible either.
EOQ cost characteristics include the following:
� The point at which the total cost curve is mini-mized represents the EOQ, and this in turn deter-mines the optimal average inventory level. Here,total cost is the sum of ordering and carrying costs.
� Some costs rise with larger inventories, whereasother costs decline.
� The average investment in inventories depends onhow frequently orders are placed.
� Ordering costs decline with larger orders and in-ventories due to reduced order frequency.
The relationship between EOQ and material re-quirements planning (MRP) is as follows:
� The EOQ model is focusing on finished goods in-ventories, which have an independent demandfrom customers or from forecasts. The EOQ is a de-terministic inventory model, which assumes thatthe rate of demand for an item is constant. On theother hand, probabilistic inventory models assumethat the rate of demand for an item is fluctuatingand can be described only on probability terms.
� The demand for raw materials and componentsin the MRP model is directly dependent on thedemand for finished goods in the inventory system(i.e., EOQ).
It is good to know how much the recommended or-der quantity would change if the estimated orderingand holding costs had been different. Depending on
whether the total annual cost increased, decreased,or remained the same, we can tell whether the EOQmodel is sensitive or insensitive to variations in thecost estimates.
Reorder PointReorder point is the point at which inventory shouldbe ordered or produced (i.e., when-to-order decisionrule), and at which stock on hand must be replen-ished. It is also the inventory level at which an ordershould be placed. The formula is:
Reorder Point (RP) = Lead-Time (LT)× Usage Rate (UR)
where lead-time is the time lag required for produc-tion and shipping of inventory, and usage rate is theusage quantity per unit of time (demand). Note thatthe time period should be the same in both lead-timeand usage rate (i.e., days, weeks, or months).
The cycle time answers how frequently the orderwill be placed, and it can be calculated as follows: cy-cle time is number of working days in a year dividedby number of orders that will be placed in a year.
A complication in the calculation of the reorderpoint arises when we introduce the concept of goods-in-transit. This situation occurs when a new ordermust be placed before the previous order is received.The formula for a reorder point when goods-in-transit is considered is
Reorder Point for Goods-in-Transit = (Lead-Time× Usage Rate) − (Goods-in-Transit)
ABC AnalysisABC analysis is a method of classifying on-hand in-ventory based on usage and value. It applies thePareto principle (20% critical few and 80% triv-ial many) to inventory. Expensive, frequently used,high-stockout-cost items with long lead-times (ClassA items) are most frequently reviewed. Inexpensiveand infrequently used items (B and C items) arereviewed less frequently. To classify the inventorybased on annual dollar volume, the annual demandof each item is multiplied with its cost per unit.
Class A items (i.e., approximately 20% of stockitems) have a high annual dollar volume repre-senting approximately 80 percent of the total dollarusage.
Class B and C items (i.e., together approximately80% of stock items) have a medium annual dollar

JWBT150-Vallabhaneni c02 July 28, 2009 17:24
56 Learning Module 2: Operations Management
volume for Class B items and a low annual dollarvolume for Class C items, representing together ap-proximately 20 percent of the total dollar usage.
Cycle CountingCycle counting is a continuing reconciliation andaudit of inventory items with inventory records. It isan alternative to the annual physical inventory exer-cise and uses the inventory classifications developedthrough the ABC analysis. With cycle-counting pro-cedures, stock items are counted, records are ver-ified, inaccuracies are documented, and correctiveactions are taken to ensure integrity of the inventorysystem. The frequency of cycle counting depends onthe type of inventory item. The cycle counting policymight be as follows:
Class A stock items may be counted once a month.Class B stock items may be counted once every three
months.Class C stock items may be counted once every six
months.
The number of stock items of each classification tobe counted each working day can be computed asfollows:
Stock quantity for A class divided by the cycle-counting policy days gives the number of itemsto be counted per working day.
Stock quantity for B class divided by the cycle-counting policy days gives the number of itemsto be counted per working day.
Stock quantity for C class divided by the cycle-counting policy days gives the number of itemsto be counted per working day.
Add the number of items to be counted per workingday for A, B, and C classes.
❑ Learning Objective 2.6:UNDERSTAND THE PRINCIPLESAND TECHNIQUES OFSUPPLY-CHAIN AND LOGISTICSMANAGEMENTThe focus of this learning objective is on managingthe supply chain and understanding the functions ofwarehouse and distribution management.
Supply ChainThe supply chain is seen as an equivalent to aninput–transformation–output system. In this con-text, both customer and supplier goodwill are to beviewed as a key asset to an organization. The supplychain becomes a value chain when all of the trans-forming activities performed upon an input providevalue to a customer. The real challenge is to ensurethat value is added at every step of the chain toachieve customer satisfaction. Both purchasers andsuppliers play a large role in the value chain. Thefollowing is an example of a value chain:
Purchasers → Suppliers → Producers→ Distributors → Customers
Managing the supply base includes integration ofsuppliers, involvement of suppliers, supplier reduc-tion strategies, supplier performance, and suppliercertification. The purpose of managing the supplybase is to manage quality, quantity, delivery, service,and price.
Integrating suppliers means reducing or balanc-ing the number of suppliers available so that they be-come part of the buyer/purchaser operation to lowerinventories, to increase response time and quality,and to decrease total cost.
Early involvement of suppliers in the productdesign process reduces cost, improves quality, andshortens product development cycle time. This isachieved through review of product specificationsand production standards by the supplier.
Supplier reduction strategies include decidingwho will be single-sourcing or second-sourcingvendor. Approaches to improving supplier per-formance include improved communication, earlysupplier involvement in the buyer product design,and measuring supplier performance indicators. Im-proved communication is achieved through desig-nating one or two individuals for all communicationthat takes place between the buying and supply-ing firms and conducting supplier conferences andworkshops to share information common to bothparties (cost, design specifications, and profit).
Supplier performance is measured in terms of qual-ity, delivery, service, and cost/price. Quality mea-sures may include incoming defect rate, productvariability, number of customer complaints, use ofstatistical process control, documented process ca-pabilities, and supplier’s quality philosophy. Deliv-ery measures include on-time delivery, percentage

JWBT150-Vallabhaneni c02 July 28, 2009 17:24
LEARNING OBJECTIVE 2.6: UNDERSTAND THE PRINCIPLES AND TECHNIQUES OF SUPPLY-CHAIN AND LOGISTICS MANAGEMENT 57
and availability of product within quoted lead-time,and quantity accuracy. Service measures include in-voice accuracy and length of time required to settleclaims, availability of a supply plan, and availabil-ity of engineering support. Cost/price measures in-clude product cost, price reductions, transportationcost, willingness to participate in price reviews, andminimum buy requirements.
Supplier certification is a process conducted bythe purchasing organization so that shipments godirectly into use, inventories, or production. Thegoal of certification is to reduce or eliminate in-coming inspection of goods coming from a supplierby a purchaser. Certification involves evaluating thesupplier’s quality systems, approving the supplier’sprocesses, and monitoring incoming product qual-ity. The advantages of supplier certification are in-creased product quality, reduced inspection costs,and reduced process variation.
Logistics ManagementThe scope of logistics management includes ship-ping of inventory items between a factory, ware-house, and customer (see figure). Forward logisticsand reverse logistics are also discussed.
Warehouse Customer
Erratic lead times Random demand
Shipping economics
Factory
WarehousesThe functions of warehouse distribution, produc-tion, and purchasing are closely interrelated andconstantly interacting with each other in a manufac-turing firm. The decisions considered during inven-tory distribution strategy are when, what, and howmuch of it to ship to a warehouse; when, what, andhow much of it to produce at the factory, with whatsize workforce; and when, what, and how much ofit to purchase as inputs to the factory warehousesystem.
Warehouses usually stock a very large number ofproducts—the larger the shipment size, the moreproducts are involved, and the greater the problemsof controlling inventories of different products incombination. These are some of the considerationsinvolved in decisions to order shipments to ware-houses. Two basic types of shipments can take place:(1) periodic shipments and (2) trigger shipments.
The trigger system is more responsive to fluctua-tions in sales than the corresponding periodic sys-tem. It has the further advantage that the shipmentsize is predetermined rather than random; hence,problems of overburdening carrier capacity are min-imized. However, the costs of administering the con-tinuous review of inventory position for a triggersystem are usually somewhat higher than under theperiodic system.
In estimating the cost of alternative shipping car-riers, the cost of having valuable inventory tied upwhile the vehicle is in transit should be considered.While this cost will usually not be large, taking itinto account will systematically lower the costs ofusing faster instead of slower carriers. Additionalcost savings associated with fast shipments that maybe overlooked come from the fact that time in tran-sit is one component of the lead-time. Shortening thelead-time allows a reduction in the inventory buffers andhence a decrease in inventory holding costs.
Distribution SystemInventory in a distribution system can be managedthrough the use of independent demand modelssuch as continuous and periodic review models. Theprimary advantage of the distribution models is thatthey allow the various levels in the distribution chainto manage their inventories autonomously. The pri-mary disadvantage of these models is that they ig-nore the other stages in the supply chain, leading tostockouts and back orders. Excess shipping costs canbe incurred since no one is coordinating the move-ment of materials within the system. Also the de-mand for replenishment occurs without any regardfor what is currently being produced or planned tobe produced. Under these situations, the need for anitem incurs extra setup costs, lost productivity, andexcess transportation costs.
Examples of distribution models include the fol-lowing:
� The single-order-point system basically ignoresthe fact that the order takes place in a chain andassumes that each element in the distribution sys-tem is independent of all other components. Thisindependent behavior can cause large swings dueto a phenomenon called “lumpy demand” at thenext level down in the distribution chain. Lumpydemand comes from lack of communication andcoordination between the factory, warehouse(s),distributors, and retailers.

JWBT150-Vallabhaneni c02 July 28, 2009 17:24
58 Learning Module 2: Operations Management
� The double-order-point system considers two lev-els down in the distribution system, hence the“double.” For example, if a distributor is quoteda lead-time from the factory warehouse of twoweeks and it takes the factory warehouse threeweeks to have stock replenished, the reorder pointis set based on the demand for a five-week period.It does not produce lumpy demand, as does thesingle-order-point system. An advantage is that itreduces the risk of stockouts. Increasing the safetystock is its disadvantage.
� In the periodic review system, orders are placedon a predetermined time schedule. The advantageis that the order times can be staggered throughoutthe chain to smooth the demand at each point in thedistribution chain. This reduces peaks and valleyscaused by several customers ordering at the sametime.
� In the sales replacement system, the supplier shipsonly what the customer used or sold during theperiod. The objective is to maintain a stable inven-tory level in the system. This does require hav-ing enough inventory to cover the potential de-mand during the replenishment cycle. In essence,the sales replacement system is a periodic reviewmodel with variable order quantities.
Forward Logistics and Reverse LogisticsForward logistics systems move raw materials andfinished products from upstream suppliers to down-stream customers (e.g., from one supplier to the otherand from one customer to the other). The physi-cal (goods) and non-physical (information) flows areforward directed toward the point of consumption.
Reverse logistics systems move products fromdownstream customers to upstream suppliers forthe purpose of returns, repair, remanufacture, refur-bishing, and/or recycling. The physical (goods) andnon-physical (information) flows are reverse and ini-tiated at the point of consumption. Most manufac-turing companies are not fully set up to handle thereverse logistics issues.
Logistics related practices such as reverse purchas-ing or reverse marketing are discussed, and they arecompared with the traditional practices, as follows:
� In traditional purchasing or marketing, the sup-plier approaches the purchaser (buyer) to sell hismaterials. The supplier establishes prices, terms,and conditions. The buyer takes a reactive, mild,and short-term approach, which does not achieve acompetitive advantage to him in the supply chain.
� In reverse purchasing or reverse marketing, thebuyer approaches the supplier to buy his materi-als. The buyer establishes prices, terms, and condi-tions. The buyer takes a proactive, aggressive, andlong-term approach to achieve a competitive ad-vantage to him in the supply chain (e.g., reducedsupplier inefficiencies, reduced inventory levels,improved demand forecasting accuracy, and in-creased cost savings). Reverse marketing is alsocalled supplier development.
❑ Learning Objective 2.7:UNDERSTAND THE VARIOUSPLANNING SYSTEMS APPLICABLETO MANUFACTURING ANDDISTRIBUTION OPERATIONSPlanning systems applicable to manufacturing anddistribution operations include master productionschedule (MPS), material requirements planning(MRP), distribution requirements planning (DRP),enterprise resource planning (ERP), customer rela-tionship management (CRM), capacity requirementsplanning (CRP), and aggregate production planning(APP).
Master Production ScheduleMaster production schedule (MPS) indicates unitsof finished goods to be produced each time period.The bill of material (BOM) defines the componentsor parts required by each finished product. BOM isa structured components list showing the hierarchi-cal relationship between the finished product andits various components. BOM indicates exactly howmany components are needed to produce the quan-tity of finished goods recommended by the MPS sys-tem. The inputs to MPS are forecast orders and/oractual orders.
Material Requirements PlanningMaterial requirements planning (MRP) systems areused to project inventory stock levels because theydepend on the amount and timing of finished goodsto be produced and then determine the requirementsfor raw materials, parts, components, and subassem-blies at each of the prior stages of finished goodsproduction. Working backward, each end productis sequentially separated into its necessary compo-nents and raw materials (i.e., to project inventory

JWBT150-Vallabhaneni c02 July 28, 2009 17:24
LEARNING OBJECTIVE 2.7: UNDERSTAND THE VARIOUS PLANNING SYSTEMS APPLICABLE TO MANUFACTURING 59
stock levels needed). MRP can also be used for re-source planning (i.e., capacity planning and laborscheduling) and materials planning.
MRP is suitable for managing raw materials, com-ponents, and subassemblies, which have dependentdemands that may be calculated from the forecastsand scheduled production of finished goods. In otherwords, the order for component inventory is placedbased on the demand and production needs of otheritems that use these components.
The benefits of MRP include reduced investmentin inventory, improved workflow, reduced shortageof raw materials and components, and reliable de-livery schedules. Closed-loop MRP system providesinformation to CRP, MPS, and APP.
Inputs and Outputs of MRP Systems
The inputs to MRP are MPS data, BOM data, andthe current inventory data.
The outputs from the MRP system are the plannedorder releases for production and purchasing.
Distribution Requirements PlanningDistribution requirements planning (DRP) uses atime-phased logic of MRP applied to the distribu-tion system. The purpose of DRP is to forecast de-mand by the distribution center to determine MPSneeds. It uses forecasts and known order patternsfrom customers in the distribution chain to developthe demand on the master schedule.
Characteristics of DRP
DRP anticipates future needs throughout the dis-tribution chain and plans deliveries accord-ingly.
The order-point-based distribution system doesnot anticipate future needs. It simply reacts tothe current needs.
DRP pulls inventory through the system fromtop levels to bottom levels, as it is a stock-replenishment plan for all levels of the supplychain.
Enterprise Resource PlanningEnterprise resource planning (ERP) software canhelp organizations in optimizing their value chain,which requires integrating business processes across
organizational boundaries through informationtechnology (IT).
The value chain is computed as follows:
Value Chain = Business Process Reengineering+ Change Management + ERP
Data are entered only once into an ERP systemand allow employees to access a full database ofinformation in order to complete their tasks. The in-formation can also be shared with customers andsuppliers as needed. All data fields in the databasemust be defined consistently and correctly to facil-itate internal employee access and external sharingof data. The ERP system can track business trans-actions from their origin (at the customer) to orderentry through operations and accounting until thetransaction is completed. The objective of ERP sys-tems is to integrate all functions within an organi-zation and to become customer oriented (customercentric). Companies are using the ERP system forincreased business competitiveness, as follows:
ERP = MRP + Accounting + Finance+ Human Resources + Supply Chain + CRM
The advantages of ERP systems include elimina-tion of costly and inflexible legacy systems, improve-ment of work processes, increase in access to data foroperational decision making, and standardization ofIT infrastructure (hardware, software, operating sys-tems, and databases). Some disadvantages of ERPsystems include expense and time in implementa-tion, difficulty in implementing change in the orga-nization, risks in using one vendor, and difficulty inintegrating with other computer systems.
Customer Relationship ManagementA customer relationship management (CRM) sys-tem deals with the customer side of a business, start-ing from customer order entry to customer satisfac-tion. It is designed to survive in the customer-centricenvironment and to establish a one-to-one businessrelationship with customers. Some define CRM asa call center solution. Some view it as sales forceautomation; others see it as direct mail, marketingautomation, or simply a web page. Many companiessee it as a front-end application only, interacting atthe point-of-contact, point-of-purchase, or customersupport. Others believe the secret to CRM success isin the back-end activities, such as data mining, datawarehousing, data distribution, and data sharing. A

JWBT150-Vallabhaneni c02 July 28, 2009 17:24
60 Learning Module 2: Operations Management
properly designed and implemented CRM systemencompasses all of these and much more. It is betterto view the CRM system as a bridge system, not as afront-end system or back-end system.
Capacity Requirements PlanningCapacity requirements planning (CRP) indicatesthroughput (capacity) of a facility (i.e., plant, ware-house, or office) and measures capacity in three timehorizons (i.e., short, intermediate, or long range). Ca-pacity decisions require huge amounts of money, es-pecially in the long range, as it is difficult to modifycapacity in the short-range.
1. Short-range capacity decisions are concernedwith scheduling jobs, employees, and equipment.
2. Intermediate-range capacity decisions are con-cerned with adding equipment, employees, andoperating shifts.
3. Long-range capacity decisions are concernedwith adding facilities and equipment that requirea long lead-time.
Utilization and efficiency are two performancemeasures of a facility’s capacity. Utilization is thepercent of design capacity actually achieved, andefficiency refers to the percent of effective capacityactually achieved. Design capacity is the maximumtheoretical output in a given period under ideal con-ditions. Effective capacity is expected capacity un-der the current operating conditions, which is lowerthan design capacity. Rated capacity is a measureof expected output of a facility, which is expressedin terms of effective capacity and percent efficiency.The following formulas are related to capacity:
Percent Utilization = (Actual Output)/(Design Capacity) × 100
Percent Efficiency = (Actual Output)/(Effective Capacity) × 100
Expected Output = (Effective Capacity)× (Percent Efficiency)
Capacity levels must match demand levels. A poormatch may mean demand exceeds capacity or ca-pacity exceeds demand. When demand exceeds ca-pacity, management can curtail demand by raisingprices, scheduling long lead-times for product de-livery, and discouraging marginally profitable busi-ness. When capacity exceeds demand, managementcan stimulate demand through price reductions oraggressive marketing efforts or even initiate em-ployee layoffs and plant/office closings.
Aggregate Production PlanningAggregate production planning (APP) focuses onan intermediate planning period of 3 to 18 monthsand is concerned with determining the quantity andtiming of production to meet the forecasted demand.
Production (capacity) options may include chang-ing inventory levels; varying workforce size by hir-ing or layoffs; varying production rates throughovertime or idle time; subcontracting; and usingpart-time workers.
Demand options may include influencing de-mand through advertising, promotions, personalselling, and price cuts; back ordering during high-demand periods, which could result in lost sales; andcounterseasonal product and service mixing (e.g.,furnaces and air conditioners and lawnmowers andsnow-blowers).
Mixing options may include chase strategy andlevel strategy. A chase strategy sets production equalto demand. A level strategy maintains a constantproduction (output) rate, or workforce level.
A mixed strategy uses two or more options fromthe production options, demand options, and mixedoptions to achieve the minimum cost goal. Severalmethods exist to perform APP, including graphi-cal method; mathematical approaches, such as thetransportation method of linear programming; man-agement coefficients model based on manager’s ex-perience and performance; linear decision rule tooptimize production rate, workforce size, and totalcosts; and simulation methods to minimize cost us-ing a combination of production rate and workforcesize.
Yield (revenue) management system is a capacitydecision of allocating a company’s scarce resourcesto customers at prices that will maximize profit. Itcharges customers different prices based on theirwillingness to pay. Although the aggregate plans aresimilar to manufacturing and service industries, theyield management system is more applicable to ser-vice industries, such as airlines.
❑ Learning Objective 2.8:UNDERSTAND THE VARIOUSSHORT-TERM SCHEDULINGSYSTEMS USED IN PRODUCTIONEffective job scheduling means faster movement ofgoods and services through a plant, office, or a facil-ity to better utilize assets and capacity and to lowercosts.

JWBT150-Vallabhaneni c02 July 28, 2009 17:24
LEARNING OBJECTIVE 2.8: UNDERSTAND THE VARIOUS SHORT-TERM SCHEDULING SYSTEMS USED IN PRODUCTION 61
Effective production scheduling may requireadding capacity and faster throughput to result inbetter customer service with faster and more de-pendable deliveries of goods and services.
Effective production scheduling means parts orfinished goods are produced on a just-in-time (JIT)basis with low setup times and costs, little work-in-process (WIP) inventory; high machine utilization;meeting due dates promised to customers; and fac-ing time-based competition.
Capacity Planning versus Short-TermSchedulingThe relation between capacity planning and short-term scheduling is shown here:
Capacity Planning → Aggregate ProductionPlanning → Master Production Schedule →Short-Term Scheduling
Capacity planning focuses on the long term, suchas five to ten years, requiring changes in equip-ment and facilities. Aggregate planning focuses onan intermediate term, such as a month or quar-ter, requiring greater facility utilization and subcon-tracting work. The master production schedule fo-cuses on the near short term, such as weeks, wherethe MRP breaks down the aggregate plan. Short-term scheduling focuses on days, hours, and min-utes, where it deals with a work/process center interms of job loading procedures and job sequenc-ing/dispatching rules.
Scheduling MethodsThe goal of scheduling is to allocate and priori-tize demand (forecasts or actual orders) to avail-able capacity. Four types of scheduling methods are(1) forward scheduling, (2) backward scheduling,(3) combination of backward and forward schedul-ing, and (4) scheduling criteria. Regardless of themethod used, machine breakdowns, employee ab-senteeism, product/service quality problems, ma-terial shortages, and weather conditions affect joband work scheduling in meeting customer order duedates.
1. Forward scheduling method starts the work assoon as the job requirements are known from acustomer regardless of the due date, and hencemay not meet the due date, thus building up WIPinventory. Forward scheduling means the first op-eration is scheduled first and the final operationlast.
2. Backward scheduling method begins with thedue date and schedules the final operation firstand the first operation last. Backward schedulingmeans the final operation is scheduled first andthe first operation last.
3. In practice, a combination of forward and back-ward scheduling method is used to meet thepromised due dates to customers.
4. Scheduling criteria methods include minimizingaverage completion time per job, maximizing fa-cility utilization, minimizing WIP inventory byminimizing the number of jobs that are in the sys-tem, and minimizing customer waiting time byminimizing the number of late deliveries.
Loading JobsLoading jobs means assigning jobs to work cen-ters or processing centers. Jobs are loaded using aninput–output control technique with Gantt chartsand the assignment method of linear programming.
The input–output control technique manages theworkflows (i.e., tracks work-added and work-completed). The Gantt chart schedules resources andallocates time. The assignment method loads tasksor jobs to resources (i.e., assigns one job/worker toone machine/project).
Job SequencingJob sequencing specifies the order in which jobsshould be assigned and completed at each work orprocessing center. Priority rules need to be estab-lished for job sequencing or dispatching, as follows:
1. First come, first served (FCFS). The first arrivingjob is processed first.
2. Shortest processing time (SPT). The shortest-time jobs are handled first and completed.
3. Earliest due date (EDD). The job with the earliestdue date is selected first.
4. Longest processing time (LPT). The longest-timejobs are handled first and completed.
5. Critical ratio (CR). The job that should be shippedon schedule should be handled first.
6. Johnson’s rule. A group of jobs are sequenced ontwo machines (i.e., N jobs on two machines). Itminimizes processing time and total idle time.
The CR is an index number computed by dividingthe time remaining by the workdays remaining, asfollows:
CR = (Time Remaining)/(Workdays Remaining)

JWBT150-Vallabhaneni c02 July 28, 2009 17:24
62 Learning Module 2: Operations Management
where time remaining is due date minus today’sdate. The CR is used to establish job priority order,as follows:
If CR for a job is less than 1.0, it means the job is fallingbehind schedule, will be late unless expedited,and should receive first priority.
If CR for a job is exactly 1.0, it means the job is onschedule and should receive second priority.
If CR for a job is more than 1.0, it means the jobis ahead of schedule, has some slack, and shouldreceive third priority.
The CR rule is better than FCFS, SPT, EDD, or LPTrules since it is based on the average job-latenesscriterion, tracks job progress dynamically, and estab-lishes a relative priority among jobs using a commonbasis.
Level-Material-Use ScheduleA level-material-use schedule, which uses frequent,high-quality, small lot sizes, is appropriate for repet-itive production, which requires determining theminimum lot (batch) size first. This schedulingmethod can shorten the large monthly productionruns to weekly, daily, or even hourly cycles, resultingin lower inventory investment, reduced batch size,and increased customer satisfaction through meet-ing the customer’s demand.
❑ Learning Objective 2.9:UNDERSTAND THE THEORY OFCONSTRAINTS IN OPERATIONSA bottleneck is a constraint in a facility, function, de-partment, or resource whose capacity is less than thedemand placed upon it. For example, a bottleneckmachine or work center exists where jobs are pro-cessed at a slower rate than they are demanded. An-other example is where the demand for a company’sproduct exceeds the ability to produce the product.
A bottleneck influences both product profitabilityand product price. The contribution margin per bot-tleneck hour or the value of each bottleneck hourshould be analyzed. This measure is better than thenormal contribution margin per unit. The contribu-tion margin per hour of bottleneck can be used toadjust the product price to better reflect the valueof the product’s use of a bottleneck. Products thatuse a large number of bottleneck hours per unit re-quire more contribution margin than products thatuse few bottleneck hours per unit.
Theory of ConstraintsThe Theory of Constraints (TOC) is an operationsstrategy that attempts to remove the influence ofbottlenecks on a production or service process. Ac-cording to Dr. Eliyahu M. Goldratt, TOC consistsof three separate but interrelated areas: (1) logis-tics, (2) performance measurement, and (3) logi-cal thinking process tools. Logistics include drum-buffer-rope scheduling, buffer management, andVAT analysis. Performance measurement includesthroughput, inventory and operating expense, andthe five focusing steps. Logical thinking processtools are important in identifying the root problems(current reality tree), identifying and expanding win-win solutions (evaporating cloud and future realitytree), and developing implementation plans (prereq-uisite tree and transition tree).
Drum-Buffer-Rope SchedulingDrum-buffer-rope scheduling is the generalizedprocess used to manage resources to maximizethroughput. The drum is the rate or pace of pro-duction set by the system’s constraint. The buffersestablish the protection against uncertainty so thatthe system can maximize throughput. The rope isa communication process from the constraint to thegating operation that checks or limits material re-leased into the system to support the constraint.
Buffer ManagementBuffer management is a process in which all ex-pediting steps in a factory shop are driven bywhat is scheduled to be in the buffers (constraint/bottleneck, shipping, and assembly buffers). By ex-pediting this material into the buffers, the systemhelps avoid idleness at the constraint and missedcustomer due dates. In addition, the causes of itemsmissing from the buffer are identified, and the fre-quency of occurrence is used to prioritize improve-ment activities.
VAT AnalysisVAT analysis is a procedure for determining the gen-eral flow of parts and products from raw materi-als to finished products (the logical product struc-ture). A V logical product structure starts withone or a few raw materials, and the product ex-pands into a number of different products as it flowsthrough divergent points in its routings. The shapeof an A logical product structure is dominated by

JWBT150-Vallabhaneni c02 July 28, 2009 17:24
LEARNING OBJECTIVE 2.10: UNDERSTAND THE PRINCIPLES OF PRODUCTION ECONOMICS AND APPLICATION OF DECISION TOOLS 63
converging points. Many raw materials are fabri-cated and assembled into a few finished products.A T logical product structure consists of numer-ous similar finished products assembled from com-mon assemblies, subassemblies, and parts. Once thegeneral parts flow is determined, the system controlpoints (gating operations, convergent points, diver-gent points, constraints, and shipping points) can beidentified and managed.
The Five Focusing StepsThe five focusing steps is a process to continu-ously improve organizational profit by evaluatingthe production system and the marketing mix to de-termine how to make the most profit using systemconstraints. The steps consist of:
1. Identifying the constraint to the system2. Deciding how to exploit the constraint to the sys-
tem3. Subordinating all nonconstraints to the system4. Elevating the constraint to the system5. Returning to step 1 if the constraint is broken in
any previous step, while not allowing inertia toset in
❑ Learning Objective 2.10:UNDERSTAND THE PRINCIPLESOF PRODUCTION ECONOMICSAND APPLICATION OF DECISIONTOOLSThe scope of production economics deals withmake-or-buy analysis, learning-curve analysis, sup-plier breakeven analysis, outsourcing, machine se-lection, and plant selection.
Make-or-Buy AnalysisIn analyzing make-or-buy decision alternatives, rel-evant costs include direct materials, direct labor,and variable overhead. Allocated fixed overheadshould be ignored because it is going to be in-curred regardless. A company’s fixed costs, whichare part of fixed overhead, will not change, whethera part/component is made or bought, or whether aspecial order is accepted or not. Factors such as prod-uct quality, plant capacity, and demand patterns areconsidered in the make-or-buy decision.
When plant capacity is not fully utilized, it is goodto accept a special order that covers all variable costs,
to ignore allocated fixed costs, and to not considerprofits. This is applicable to short-term decision mak-ing only. When plant capacity is fully utilized, thespecial order has an opportunity cost, and it shouldrecover all variable and fixed costs, including profits.
When buying a part from a vendor, a company isguaranteed only the price charged by the vendor.The buyer has no control, at least in the short term,over product quality, delivery, support, or service.
Learning-Curve AnalysisLearning-curve analysis states that employees getbetter at their tasks as the tasks are repeated overand over again and take less time to complete thosetasks. Applied to the production setting, it takes lesstime to complete each additional production unit.
Management can use learning-curve analysis to es-timate the time required for the remainder of the or-der, after knowing the labor-hours or labor costs re-quired for a portion of a customer’s special-contractproduction order.
The formula to calculate the time required for thenth unit is:
Time Required for nth Unit = T × Ln
where T is unit time or unit cost of the first unit, Lis learning curve rate (i.e., 80%), and n is number oftimes T is doubled.
Supplier’s Breakeven AnalysisSupplier’s breakeven analysis allows a purchaser(buyer) to anticipate a supplier’s (seller) pricingstrategy during procurement negotiations. The in-tent of the buyer is to estimate a supplier’s expectedprofit or loss given a supplier’s fixed and variablecosts. Both the buyer and the breakeven analysis as-sume that variable costs fluctuate in a linear fash-ion with respect to volume, and it ignores semivari-able costs, which include both fixed and variablecosts.
The following formulas can be used in the supplierbreakeven analysis:
Breakeven Point in Units = (Total Fixed Costs)/(Selling Price per Unit − Variable Cost per Unit)
Contribution Margin (CM) per Unit = SellingPrice per Unit − Variable Cost per Unit
Net Income or Profit = (Sales Units ×CM per Unit) − Total Fixed Costs

JWBT150-Vallabhaneni c02 July 28, 2009 17:24
64 Learning Module 2: Operations Management
Net Income or Profit = Total Revenues −Total Variable Costs − Total Fixed Costs
Total Revenue = Sales Units ×Selling Price per Unit
OutsourcingOutsourcing is acquiring non-core products or ser-vices from external sources. Insourcing is keepingcore products or services in-house. Many relatedterms exist: offshoring is moving a business func-tion or process to a foreign country but retainingcontrol of it. Nearshoring is choosing an outsourceprovider located either in the home country or in anearby foreign country. Backsourcing is the returnof a business activity to the original firm.
Examples of outsourced functions or processesinclude information technology; production opera-tions; purchasing; logistics; research and develop-ment; training; human resources; accounting and fi-nancial services; advertising; legal and tax services;and customer service.
Advantages of outsourcing include cost savings,gaining outside expertise, focusing on core com-petencies, improving operations and services, andgaining latest technology from outside. These advan-tages play a role in developing strategies for down-sizing and restructuring.
Disadvantages of outsourcing include loss of con-trol, increased transportation costs, negative impacton employees (loss of morale), creating future com-petition, and trade-off between short-term gains atthe expense of long-term objectives.
A breakeven analysis can be applied when a prod-uct is identified as a possible candidate for out-sourcing by comparing fixed and variable costs forinsource and outsource options. The following for-mula can be used to compute the number of produc-tion units that must be outsourced in order to reacha breakeven point in total costs from insource andoutsource options:
X = (Fin − Fout)/(Vout − Vin)
where X is the number of units that must be out-sourced, Fin is total insource fixed costs, Fout is totaloutsource fixed costs, Vin is total variable cost perunit produced at insource, and Vout is total variablecost per unit produced at outsource.
If X is less than the expected demand in units, thecompany should select the source with the lowervariable cost and higher fixed cost. If X is greater
than the expected demand in units, the companyshould select the source with the lower fixed costand higher variable cost.
Machine SelectionMachine selection deals with replacing an old ma-chine with a new one to stay in operation. Equiva-lent annual costs (EACs) are computed for all newmachines under consideration during the selectionprocess, using annuity factors. EAC is total presentvalue of costs divided by the annuity factor. Basedon the EAC analysis, management purchases the ma-chine with the lowest EAC.
Plant SelectionPlant selection involves selecting one plant fromamong several with different capacities. Usually,large plants will incur larger fixed costs. The plantwith high fixed costs will have a high breakevenpoint (BEP) because it takes more sales to recoverall fixed costs. The reverse is true with small plants.If a plant has 100 percent of its capacity utilized,there is no safety cushion for expected or unex-pected conditions, such as plant downtime, machinebreakdowns, holidays, and other unforeseen events.A plant capacity utilization of 80 to 90 percent isdesirable.
The following formulas can be used in plant selec-tion:
Plant′s BEP in Units = Total Sales Revenues =Total Fixed Costs + Total Variable Costs
Plant′s Capacity Utilization = (SalesDemand in Units)/(Available ProductionCapacity in Units) × 100
A plant with a low BEP and a high capacity utiliza-tion percentage should be selected.
Decision ToolsThe types of decision tools include decision or pay-off tables and decision trees.
Decision TableA decision table is a tabular means of analyzing de-cision alternatives (courses of actions) and states ofnature (outcomes). The alternatives are listed on theleft side, the states of nature are listed across the top,

JWBT150-Vallabhaneni c02 July 28, 2009 17:24
LEARNING OBJECTIVE 2.11: UNDERSTAND THE PRINCIPLES AND TECHNIQUES OF EQUIPMENT MAINTENANCE 65
and the payoffs (i.e., conditional values) are listed inthe body of the decision table. A decision-maker usesthree methods for dealing with uncertainty of out-comes when he cannot even assess probabilities foreach possible outcome. These three methods includemaximax (optimistic and best case), maximin (pes-simistic and worst case), and equally likely (averageand normal case).
1. The maximax method maximizes the maximumoutcome for every alternative.
2. The maximin method maximizes the minimumoutcome for every alternative.
3. The equally likely method maximizes the aver-age outcome of each alternative.
Decision TreeA decision tree is a graphical means of analyzingdecision alternatives and states of nature. The deci-sion tree approach is suitable for multiple sequentialdecisions, where later decisions are based on the out-come of prior ones. It includes decision alternatives,states of nature with their respective probabilities,and payoff amounts for each combination of decisionalternatives and states of nature. The expected mon-etary value (EMV) is computed by working back-ward, that is, by starting at the right of the tree andworking back to decision nodes on the left of thetree. The decision node leading to the state-of-naturenode with the highest EMV will be chosen. Decisiontrees are used in evaluating capacity planning andcapital investment decisions.
Decision Table versus Decision Tree
A decision table does not use probabilities.A decision tree uses probabilities.
❑ Learning Objective 2.11:UNDERSTAND THE PRINCIPLESAND TECHNIQUES OFEQUIPMENT MAINTENANCEAND SYSTEM RELIABILITYProper maintenance of equipment can remove vari-ability, and variability can destroy a process and cre-ate waste. Tactics to improve maintenance includeimplementing preventive maintenance methods andincreasing repair capabilities for the equipment.
Equipment MaintenanceTwo types of maintenance exist: preventive andbreakdown (emergency). Preventive maintenanceinvolves performing routine inspections and servic-ing work and keeping the equipment and facilitiesin good working order without interruption. Break-down maintenance occurs when equipment failsand must be repaired on an emergency or prioritybasis.
Implementing preventive maintenance requires astudy of mean time between failures (MTBF) distri-bution, which follows a normal curve pattern. Main-tenance work is needed when a machine or processexhibits small standard deviations from the mean(average).
Some firms practice total productive maintenance(TPM), similar to total quality management (TQM),to reduce variability through employee involvementand maintenance records. Use of simulation and ex-pert systems also improves maintenance. TPM is thekey to reducing variability and improving reliability.
Preventive and breakdown maintenance costs canbe compared when historical data are available onmaintenance costs, breakdown probabilities, and re-pair times.
A measure related to maintenance is availability,in that proper maintenance of a piece of equipmentincreases its availability for use:
Percent Availability = [(Uptime)/(Uptime + Downtime)] × 100
Increasing equipment repair capabilities requirestrained employees and adequate resources. Repairscan be done in-house by trained and empoweredemployees or offsite by contractors.
System ReliabilitySystem reliability is the probability that a machinepart or product will function properly for a spec-ified time and under stated conditions. Tactics toimprove reliability include improving the perfor-mance of individual components and providing re-dundancy. Reliability assures high utilization of fa-cilities, proper scheduling of equipment, low inven-tory levels, and consistent quality.
A system or piece of equipment consists of partsor components. If any one part or component in asystem fails to perform, the entire system can fail.Hence, the key to improving a system’s reliability is

JWBT150-Vallabhaneni c02 July 28, 2009 17:24
66 Learning Module 2: Operations Management
improving the individual component reliability:
System Reliability = Reliability of Component 1× Reliability of Component 2 × · · · × Reliabilityof Component n
Other measures of reliability include (1) percent offailures, (2) number of failures per operating hour,(3) MTBF, which is the reciprocal of number of fail-ures per operating hour, and (4) dependability.
Percent of Failures = (Number of Failures)/(Number of Units Tested) × 100
Number of Failures per Operating Hour= (Number of Failures)/(Operating Time)
where operating time is total time minus nonoperat-ing time.
MTBF = 1/Number of Failures per Operating Hour
Percent Dependability = [(Time Available)/(Time Available + Time Required)] × 100
Redundancy, in the form of backup units, is builtinto systems to increase their reliability. Backup unitsare put in parallel with normal units to ensure that ifa normal unit fails, the system switches to a backupunit.
System Reliability = (Probability of Normal Unit)+ [(Probability of Backup Unit) × (Probabilityof Needing the Backup Unit)]
where the probability of needing the backup unit is(1 − Probability of Backup Unit).
❑ Learning Objective 2.12:UNDERSTAND THE PRODUCTIONPROCESS FLOWS AND METRICSThree operational process flow measures includeflow time (T), inventory (I), and throughput (R), andthey are interrelated in that defining targets on anytwo of them defines a target for the third:
Inventory (I ) = Throughput (R) × Flow Time (T)
The basic managerial levers for process improve-ment are the following:
� Decrease in flow time� Increase in throughput� Decrease in inventory and waiting time
� Control process variability� Managing process flows and costs
Levers for managing the flow time include decreas-ing the work content of a critical path by shorteningthe length of every critical path, as follows:
1. Reduce the work content of an activity on the crit-ical path:� Eliminate non-value-adding aspects of the ac-
tivity (i.e., work smarter).� Increase the speed at which the activity is done
(i.e., work faster) by acquiring faster equipmentand/or by increasing incentives to work faster.
� Reduce the number of repeat activities (i.e., doit right the first time).
2. Work in parallel by moving some of the workcontent off the critical path:� Move work from a critical path to a noncritical
path (i.e., perform work in parallel rather thanin sequence).
� Move work from a critical path to the “outerloop” (i.e., either preprocessing or postprocess-ing).
3. Modify the product mix:� Change the product mix to produce products
with smaller work content with respect to thespecified activity.
Levers for managing (increasing) throughput of aprocess include the following:
1. Decrease resource idleness by synchronizingflows within the process to reduce starvation andsetting appropriate size of buffers to reduce block-age.
2. Increase the net availability of resources to in-crease effective capacity by:� Improving maintenance policies.� Performing preventive maintenance outside pe-
riods of scheduled availability.� Instituting effective problem-solving measures
that reduce frequency and duration of break-downs.
� Instituting motivational programs and incen-tives to reduce employee absenteeism and in-crease employee morale.
3. Reduce setup waste by reducing the frequency ofsetups and by reducing the time required for asingle setup.
4. Increase theoretical capacity by:� Decreasing unit load on the bottleneck resource
pool (e.g., work faster, work smarter, do itright the first time, change production mix,

JWBT150-Vallabhaneni c02 July 28, 2009 17:24
LEARNING OBJECTIVE 2.13: UNDERSTAND THE TECHNOLOGY DEPLOYED IN MANUFACTURING AND SERVICE OPERATIONS 67
subcontract or outsource, and invest in flexibleresources).
� Increasing the load batch of resources in the bot-tleneck resource pool (i.e., increase the scale ofresource).
� Increasing the number of units in the bottleneckresource pool (i.e., increase scale of process).
� Increasing the scheduled availability of the bot-tleneck resource pool (i.e., work longer).
� Modifying the production mix.
Levers for reducing inventory and waiting timeinclude the following:
1. Reduce cycle inventory (i.e., reduce batch size)by reducing setup or order cost per batch or byreducing forward buying.
2. Reduce safety inventory by:� Reducing demand variability through im-
proved forecasting.� Reducing the replenishment lead-time and its
variability.� Pooling safety inventory for multiple locations
or products through either physical or virtualcentralization of specialization or some combi-nation thereof.
� Exploiting product substitution.� Using common components.� Postponing the product differentiation closer to
the point of demand.3. Manage safety capacity by:
� Increasing safety capacity.� Decreasing variability in arrivals and service
patterns.� Pooling available safety capacity.
4. Synchronize flows by:� Managing capacity to synchronize with de-
mand.� Managing demand to synchronize with avail-
able capacity.� Synchronizing flows within the process.
5. Manage the psychological perception of the cus-tomers to reduce the cost of waiting.
Levers for controlling process variability includethe following:
1. Measure, prioritize, and analyze variability in keyperformance measures over time.
2. Use feedback control to limit abnormal variabilityby:� Setting control limits of acceptable variability in
key performance measures.
� Monitoring actual performance and correctingany abnormal variability.
3. Decrease normal process variability by design-ing for processing (i.e., simplify, standardize, andmistake-proof).
4. Immunize product performance to process vari-ability through robust design.
Levers for managing process flows and costs in-clude the following:
1. Manage flows in a plant through:� Process structure with cellular layout.� Information and material flow using demand
pull system.� Level production with batch size reduction.� Quality at source with defect prevention and
decentralized control.� Supplier management with partnerships and
incentives.� Supply consistency through maintenance of
safety capacity.� Employee involvement and empowerment.
2. Manage flows in a supply chain by:� Reducing information and material flow times
using technology and efficient logistics.� Reducing fixed costs of ordering and quantity
discounts.� Sharing information on customer demand and
product availability.� Coordinating forecasts between affected par-
ties.� Stabilizing prices.
3. Improve processes through:� Continuous improvement and reengineering.� Increased visibility; incentives; plan, do, check,
adjust (PDCA) cycle; and benchmarking.
❑ Learning Objective 2.13:UNDERSTAND THETECHNOLOGY DEPLOYED INMANUFACTURING AND SERVICEOPERATIONSTopics such as flexible manufacturing systems,process control systems, point-of-sale systems, andbar-coding systems are discussed in this learningobjective.
Flexible Manufacturing SystemsFlexible manufacturing systems (FMSs) are com-puter systems using an automated work cell at

JWBT150-Vallabhaneni c02 July 28, 2009 17:24
68 Learning Module 2: Operations Management
each workstation to produce low-volume andhigh-variety products in an economical manner.FMSs bridge the gap between product-focused andprocess-focused production strategies.
In a manufacturing environment, computer-aideddesign (CAD) and computer-aided manufacturing(CAM) approaches are highly integrated (i.e., com-puter integrated manufacturing, CIM) to producea quality product in less time. A CAD system is aninteractive graphics system suitable for the gener-ation of engineering documentation in both two-and three-dimensional geometry, surfaces, text, orother representation. CAD systems provide engi-neering drawings and alternative design possibil-ities, among other things. The major benefit of aCAD system is the productivity gain in compari-son to manual drafting. Real estate, municipalities,engineering, and construction industries are some ofthe major users of CAD systems.
Technologies such as FMS combined with CIMyield several benefits to manufacturers such as re-duced machine changeover time, accurate machinescheduling, improved machine utilization, reducedcosts, and improved throughput.
Computer-Aided Design + Computer-AidedManufacturing = Computer IntegratedManufacturing
Computer Integrated Manufacturing + FlexibleManufacturing Systems = Economicaland Efficient Production Systems
For example, the electronics industry uses acomputer-aided manufacturing (CAM) system todevelop integrated circuits and printed circuit-boardmodules from raw materials and parts. Output fromthe CAD system would be the input for the CAMsystem. These systems may even interface with pro-duction planning and scheduling systems.
Other examples of integrated manufacturing sys-tems involve master production schedule feedinginto a material requirements planning (MRP) sys-tem, where the latter explodes raw materials or partsrequirements into the lowest detail for placing or-ders with suppliers. The master production schedul-ing system also interfaces with the labor-schedulingsystem and shop-floor control system for schedulingpeople and machines.
Process Control SystemsIn process-oriented manufacturing organizationssuch as oil-refinery, food-processing, and chemical
industries, process control systems are heavily usedto control the manufacturing process. The raw ma-terial flow, work-in-process flow, and final productflow are controlled by these application systems. Theexact mixture, content, and timing of the raw ma-terials that go into the manufacturing and mixingprocess are dictated by these systems.
Point-of-Sale SystemsPoint-of-sale (POS) systems are used in the retailindustry to collect sales data through cash registersin the store. In most cases, the sales data are col-lected by in-store processors and then transmittedto a central-host computer via a network. At night,batch processing of sales data is performed to postsales to sales files and to update accounts receiv-able files for customer-billing purposes. At the sametime, sales data are posted to inventory records toadjust inventory levels, which are then used as in-puts to the merchandising order system for placingnew orders with vendors. The sales staff scans theuniversal-product-code (UPC) on the merchandiseto capture product data and automatic price lookupfor each merchandise item to reduce keying time anderrors by sales staff.
Other features include help screens, policylookups, daily-advertising screens, automatic creditapprovals, expert system-based credit authoriza-tions, automatic sales tax by store or zip (postal)code, time clock facilities, and perhaps even sug-gestive selling prompts to the salesperson. This so-phistication brings more problems: greater integrityand security controls are needed to prevent honestmistakes and fraudulent transactions.
Bar-Coding SystemsAutomated solutions are needed to collect data inreal time, at the point of origin, in a way that en-sures the captured data are right the first time. Onesuch solution is the use of automatic identificationsystems, such as bar coding, optical character recog-nition (OCR), voice recognition (VR), and radio fre-quency identification (RFID). Bar codes can be usedin manufacturing environments such as shop floorand receiving, as well as in office and hospital en-vironments such as purchasing, inventory, billing,accounts payable, payroll time-clocking, and track-ing medications in hospitals.
Bar codes are symbols that can be processed elec-tronically to identify numbers, letters, or specialcharacters on a receiving report, invoice, timecard,
JWBT150-Vallabhaneni c02 July 28, 2009 17:24
LEARNING OBJECTIVE 2.13: UNDERSTAND THE TECHNOLOGY DEPLOYED IN MANUFACTURING AND SERVICE OPERATIONS 69
or part. They are used to improve data accuracy andincrease speed of updating the supporting data in allinterfacing systems.
Removing the human element from the data col-lection process greatly improves data accuracy andupdating speed.
Bar-code technology supports the JIT productionphilosophy and continuous improvement (kaizen)program. This is because bar-code technology is pa-perless, which is one of the goals of JIT. Bar codessupport continuous improvement due to increasedaccuracy of data available in the system and es-tablishment of production standards based on suchdata. This also improves quality of decision making.
For example, the use of bar codes on raw mate-rials will reduce the amount of paperwork that is
required to track inventories. Movement of raw ma-terials, subassemblies, and finished products is mon-itored electronically using bar codes. In addition tospeed, accuracy is increased since there is little or nohuman involvement in reading and interpreting thebar-code data. Key entry of data is eliminated.
Self-Assessment Exercise
Online exercises are provided for the learn-ing objectives in this module. Please visitwww.mbaiq.com to complete the online exercisesand to calculate your MBA IQ Score.

JWBT150-Vallabhaneni c02 July 28, 2009 17:24
70

JWBT150-Vallabhaneni c03 July 28, 2009 17:27
LEARNING MODULE 3
Marketing Management
Learning Objective 3.1: Understand theComponents of Marketing Mix 72
Learning Objective 3.2: Understand theExpectancy-Value Model inConsumer Markets 72
Learning Objective 3.3: Understand theBrand Elements and Calculate aBrand Value 72
Learning Objective 3.4: UnderstandCompetitor Analysis 73
Learning Objective 3.5: Understand thePricing Strategies and Methods 73Establishing Prices 74Price Response Analysis 75
Learning Objective 3.6: Understand theMarketing Communications Mix 75
Learning Objective 3.7: Understandthe New-Product DevelopmentProcess 75Stages 76Rating Method 76
Learning Objective 3.8: Compute theCustomer Retention Rate 76Competitive Markets 77Calculating the Customer Retention Rate 77
Learning Objective 3.9: Compute theLifetime Value of a Customer 77Calculating the Cost of a Lost Sale 77Strengthening the Customer Retention Rate 77Calculating the Lifetime Value of a Customer 78
Learning Objective 3.10: Compute theCustomer Conviction in Terms of NetPromoter Score 78
Learning Objective 3.11: Compute theCustomer Loyalty Score 78
Learning Objective 3.12: Compute theNet Marketing Contribution Amount 78
Learning Objective 3.13: Compute theMarketing Profitability Metrics 80
Learning Objective 3.14: Compute theMarket Development Index 80
Learning Objective 3.15: Compute theMarket Share Index 80
Learning Objective 3.16: Compute aProduct’s Lifecycle Cost andEconomic Value to a Customer 81
Learning Objective 3.17: Compute theRelative Performance, Price, andCustomer Value of a Product 81
Learning Objective 3.18: Compute aMarketing Channel Intermediary’sTransaction Value 82Transaction Value 82Channel Cost per Customer Transaction 82
Learning Objective 3.19: Understandthe Relationships Among Price,Profit, and Market Share 83
Learning Objective 3.20: Understand aMarketing Channel’s Performance 83
Learning Objective 3.21: Evaluate theAdvertising’s Effectiveness withCustomer Response Index 83
Learning Objective 3.22: Learn Howto Conduct a Marketing PortfolioAnalysis 85
Learning Objective 3.23: Learn Howto Develop a Marketing Budget 85
Learning Objective 3.24: Understandthe Financial Performance MetricsRelated to Marketing 85
Learning Objective 3.25: Understandthe Nature of Marketing of Services 86Service Characteristics 86Service Quality 86Overcoming the Obstacles in Service Marketing 87
Learning Objective 3.26: Understandthe Strategies in ProductManagement 87Product Definition 87Product Classification 87Product Mix and Product Line 88Packaging and Branding 88
Learning Objective 3.27: Understandthe Stages in a Product Lifecycle 88Product Lifecycle (PLC) Concept 88Product Audit 89
71

JWBT150-Vallabhaneni c03 July 28, 2009 17:27
72 Learning Module 3: Marketing Management
❑ Learning Objective 3.1:UNDERSTAND THECOMPONENTS OFMARKETING MIXMarketing management develops integrated mar-keting programs to communicate and deliver valuefor customers through four major components—product, price, promotion, and place—called themarketing mix, which represents the seller’s viewof the marketing tools available for influencingbuyers.
1. Product includes variables such as product vari-ety, quality, design, features, brand name, pack-aging, sizes, services, warranties, and returns.
2. Price includes variables such as list price, dis-counts, allowances, payment periods, and creditterms.
3. Promotion includes variables such as sales pro-motion, advertising, sales force, public relations,and direct marketing.
4. Place includes variables such as channels, cov-erage, assortments, locations, inventory, andtransport.
A firm can change only a few variables in theshort run, such as price, sales force size, and ad-vertising expenses. A firm can develop new prod-ucts and modify its distribution channels only in thelong run.
A complementary theme with marketing mix isto answer questions that a customer may have usingdimensions such as solution, information, value, andaccess (SIVA):
Solution: How can I solve my problem?Information: Where can I learn more about it?Value: What is my total sacrifice to get this solution?Access: Where can I find it?
❑ Learning Objective 3.2:UNDERSTAND THEEXPECTANCY-VALUE MODELIN CONSUMER MARKETSConsumers go through a rational process before de-ciding to purchase a specific brand product based onconsumer attitudes and beliefs, called expectancy-value model (EVM).
The EVM focuses on a consumer’s positive andnegative values for an attribute about a specific
brand product and on assigning an importance levelto each attribute in order to arrive at an overallperceived value:
Brand A = (Attribute 1 Value × Importance Level)+ (Attribute 2 Value × Importance Level)+ (Attribute 3 Value × Importance Level)+ · · ·
Brand B = (Attribute 1 Value × Importance Level)+ (Attribute 2 Value × Importance Level)+ (Attribute 3 Value × Importance Level)+ · · ·
Brand C = (Attribute 1 Value × Importance Level)+ (Attribute 2 Value × Importance Level)+ (Attribute 3 Value × Importance Level)+ · · ·
The consumer will choose a brand that gives her thehighest perceived value.
One way to build value to a customer is to focus onorder winners and order qualifiers. An order win-ner (i.e., order-getting power) is a criterion that dif-ferentiates the products or services of one firm fromanother, including low prices. An order qualifier isa screening criterion that permits a firm’s product orservice to be considered as a possible candidate forpurchase. Note that these criteria may change overtime, meaning an order winner today may becomean order qualifier tomorrow.
❑ Learning Objective 3.3:UNDERSTAND THE BRANDELEMENTS AND CALCULATEA BRAND VALUEBrand elements identify and differentiate a brand inthe marketplace with consumers. A brand elementthat provides a positive contribution and value toa customer builds positive brand equity and viceversa.
Brand-building elements include memorable,meaningful, and likable, and brand-defensiveelements include transferable, adaptable, and pro-tectable. Brand-building elements bring consumerawareness, which leads to brand equity, whereasbrand-defensive elements deal with leveragingbrand equity in the face of competition and con-straints.
In addition to brand names, logos and slogans leadto building brand equity.

JWBT150-Vallabhaneni c03 July 28, 2009 17:27
LEARNING OBJECTIVE 3.5: UNDERSTAND THE PRICING STRATEGIES AND METHODS 73
Brand equity is measured as follows:
1. With a brand audit done internally and annually2. By collecting data from consumers through
brand-tracking studies
Brand equity is different from brand valuation,where the latter deals with assigning a dollar valueto a brand.
A brand value can be calculated as follows:
Brand Intangible Earnings = Brand Revenues−Operating Expenses − Taxes−Charge for Invested Capital
Net Present Value (NPV) of a Brand Value = BrandIntangible Earnings × Brand Discount Rate
The higher the NPV, the greater the brand valueand vice versa. The NPV of a brand value can becalculated for several years, reflecting the ability ofa brand to generate future earnings.
❑ Learning Objective 3.4:UNDERSTAND COMPETITORANALYSISA company cannot survive in the long run if itdoes not analyze its competitors’ strengths andweaknesses (external analysis) along with its ownstrengths and weaknesses (internal analysis).
Attack action plans, whether offensive or defen-sive, can be developed based on this internal andexternal analysis of strengths and weaknesses.
A company should monitor three variables whenanalyzing its competitors: competitor’s share of mar-ket, competitor’s share of mind, and competitor’sshare of heart.
The share of competitor’s market is computedmathematically based on total target market demandin units and a competitor’s sales in units:
Competitor’s Share of Market = (Competitor’s Salesin Units)/(Total Target Market Demand in Units)
The share of competitor’s mind is assessed basedon a customer-survey question such as, “Name thefirst company that comes to your mind in thisindustry.”
The share of competitor’s heart is assessed basedon a customer-survey question such as, “Name thecompany from which you would prefer to buy theproduct.”
There is a relationship between mind share andheart share and market share and profits:
Gains in Mind Share and Heart Share → Gainsin Market Share and Profits
A company can also improve market share throughbenchmarking with its competitors and other world-class companies.
A company can select its competitors with a com-petitive analysis by dividing them into groups suchas strong versus weak, close versus distant, and goodversus bad.
A company can select its customers to conduct cus-tomer value analysis by dividing them in terms ofwhether a customer is valuable and vulnerable andto decide which ones to retain or lose. A 2 × 2 matrixcan be developed for in-depth analysis:
Customer is. . . Vulnerable Not vulnerable
Valuable Unhappy andprofitable—retain
Loyal and profitable—maintain
Not valuable Not loyal—defector lose
Happy and unprofitable—change customer intovaluable or vulnerable
❑ Learning Objective 3.5:UNDERSTAND THE PRICINGSTRATEGIES AND METHODSCompanies establish prices for their products andservices in a variety of ways: some by owners, someby division and product-line managers, and someby finance managers. Others who influence prices in-clude senior management, marketing and sales man-agement, and production management.
There is no right way of setting prices since thereare multiple factors, including government regula-tion; production, marketing, and other costs; con-sumer psychology; company’s profit and marketshare goals; product demand and supply conditions;consumer’s personal income levels; and competi-tors’ prices and prices of substitutes. Pricing deci-sions are very complex and uncertain, to say theleast.
The pricing continuum is as follows:
Low Price → Floor Price → Ceiling Price → High Price
(No Profit) (No Sales)
Companies may set target profit margins by ap-plying a target return-on-sales percent to the sales
JWBT150-Vallabhaneni c03 July 28, 2009 17:27
74 Learning Module 3: Marketing Management
revenue from their product mix. The target cost is de-termined as follows by subtracting the target profitfrom the target sales price for each product:
Target Cost = Target Sales Price − Target Profit
Some major corporations establish a Pricing Coun-cil made up of pricing leaders from each businessunit that looks for the best pricing practices acrossthe company.
The chief marketing officer (CMO) reporting to thechief executive officer (CEO) should lead the pricinginitiatives, monitor the pricing practices, and controlthe pricing outcomes.
For any organization, there should be a system-atic strategy and structured approach to establish-ing, adapting, and changing prices.
Establishing PricesSix popular methods exist to establish prices, includ-ing markup pricing, target-return pricing, perceived-value pricing, value pricing, going-rate pricing, andauction-type pricing.
1. The markup pricing method, also known as thecost-plus pricing method, is popular, easy to de-termine, and fairer to both buyers and sellers.This method results in similar prices when allfirms in the industry use the same approach, andprice competition is, therefore, minimized. Basi-cally, this method takes all costs of producing aproduct and adds a standard markup for profit asthe desired return on sales.
A manufacturer’s unit cost is computed as fol-lows:
Manufacturer’s Total Unit Cost = (Variable Costper Unit) + (Total Fixed Costs/Expected UnitSales)
Percent Markup on Cost = (Unit Price − TotalUnit Cost)/Total Unit Cost
A standard markup percentage is added to thetotal unit cost (fixed cost per unit plus variablecost per unit), giving the markup price:
A Manufacturer’s Markup Price = (Total UnitCost)/(1 − Percent Markup)
Percent Markup on Price = (Unit Price − TotalUnit Cost)/Unit Price
The interrelationships between price and cost areas follows:
Percent Markup on Price = (Percent Markup onCost)/(1 + Percent Markup on Cost)
Percent Markup on Cost = (Percent Markup onPrice)/(1 − Percent Markup on Price)
Both marketers and accountants determine theselling price of a product as follows:
Percent Markup on Cost = (Desired Profit+ Total Fixed Costs)/Total Variable Costs
Unit Price = Total Unit Cost + Percent Markupon Cost
Wholesalers, dealers, and retailers will add theirown markup to the manufacturer’s markup price,thereby increasing the manufacturer’s markupprice significantly.
2. The target-return pricing method seeks a desiredreturn on invested capital, which is based on aneconomic concept. The formula is:
Target-Return Price = (Total Unit Cost)+ [(Desired Return × Invested Capital)/
Expected Unit Sales]
A breakeven point (BEP) in units can be com-puted and compared to the expected unit sales todetermine how much effort is needed to reach theexpected sales level to make the desired profit.The BEP can be decreased, resulting in less risk tothe company, through lowering fixed and variablecosts.
This method ignores external factors such asprice elasticity and competitors’ prices becauseit is based on internal factors such as costs andprofits.
3. Perceived-value pricing method is based on whatthe customer, not the company, thinks about thevalue of a product. Organizations use advertis-ing and sales force to communicate and enhanceperceived value in buyers’ minds. The goal is todeliver more value to a customer than the com-petitor and to demonstrate this value to prospec-tive buyers. Market research methods such asfocus groups, surveys, judgments, and experi-mentation are used to determine the value of aproduct to customers.
4. Value pricing method purposefully charges a lowprice for a high-quality product with cost savings

JWBT150-Vallabhaneni c03 July 28, 2009 17:27
LEARNING OBJECTIVE 3.7: UNDERSTAND THE NEW-PRODUCT DEVELOPMENT PROCESS 75
realized from reengineering the production pro-cesses and becoming a low-cost producer withoutsacrificing quality. The cost savings are passed onto value-conscious customers through programssuch as everyday low pricing, high–low pricing,and extreme everyday low pricing.
5. Going-rate pricing method focuses on meetingor beating competitors’ prices. Some compa-nies adopt a follow-the-leader strategy, meaningchanging the price when the competitor changesits price, not when the company’s demand orcost structure changes. This method is appropri-ate when costs are difficult to estimate and whencompetition is uncertain.
6. Auction-type pricing method uses the Internet asthe primary medium to transact between buyersand sellers. The items that are auctioned includeexcess inventories and used goods of all kinds.Bids are exchanged between various memberssuch as one seller and many buyers, one buyerand many sellers, and one buyer and many sup-pliers as in procurement of supplies. In general,online auctions are giving greater overall satisfac-tion to buyers and sellers due to a large numberof bidders, greater economic stakes, and less visi-bility in pricing.
Price Response AnalysisPrice response analysis is the study of the effects ofprice decreases and price increases on profits. Priceresponse coefficients are usually collected from mar-ket research studies. Generally, price and sales vol-ume varies inversely. This means that higher pricesshould result in a small number of units sold andvice versa. For example, a price response coefficientof –2.0 means that if price falls by 5 percent, saleswould be expected to increase by 10 percent. Simi-larly, a price response coefficient of + 1.5 means thatif price falls by 6 percent, sales would be expected todecrease by 9 percent.
Marketing management can determine additionalnet income or loss from operations resulting fromprice decrease or increase:
Additional Increase or Decrease in Net Incomefrom Operations = Expected PriceDecrease × Sales Response Coefficient× Current Net Sales × Accounting ContributionMargin Ratio
❑ Learning Objective 3.6:UNDERSTAND THE MARKETINGCOMMUNICATIONS MIXMarketing communications represent the voice ofthe company and its brands in building relation-ships with consumers. Marketing communications,such as advertising and celebrity endorsements, con-tribute to building brand equity through the memoryand image it creates in the consumers’ minds, whichin turn drives sales and profits.
Marketing Communications → Brand Equity
The marketing communications mix consists ofeight major modes of communication, such as ad-vertising, sales promotion, events and experiences,public relations and publicity, direct marketing, in-teractive marketing, word-of-mouth marketing, andpersonal selling.
Brand equity drives sales in many ways throughbrand awareness, brand image, brand responses,and brand relationships. Brand equity is closelyrelated to the number of customers who are de-voted to a brand. Some brands have a higher de-gree of awareness, acceptability, and preference thanothers. Although brand equity is not shown in acompany’s financial statements, similar to humanequity, it is reflected in the acquisition price of acompany as a premium the brand commands inthe market.
Brand dilution occurs when consumers no longerassociate a brand with a specific product. It is closelyrelated to brand extension, and it is a risk. Cobrand-ing and dual branding occur when two or morewell-known brands are combined in a merger andacquisition (M&A) offer. Competitors benefit frombrand dilution because the offering company has aweak position in the market. The more narrow itsfocus, the stronger the brand.
❑ Learning Objective 3.7:UNDERSTAND THENEW-PRODUCT DEVELOPMENTPROCESSCompanies need to grow their revenues in the longrun by developing new products and services andexpanding into new markets because new prod-ucts and services are the lifeblood of successfulfirms.

JWBT150-Vallabhaneni c03 July 28, 2009 17:27
76 Learning Module 3: Marketing Management
Companies are adopting a structured and standardmethod of developing new products to minimizethe risk of low success rates of new products andservices. There is an opportunity cost involved heredue to the alternative uses of funds spent on productfailures and the time spent in unprofitable productdevelopment activities.
Companies are using reverse innovation, incre-mental innovation, and disruptive technologies anddeveloping a unique, superior product to increasethe success rate of new products and services.
Dow Chemical uses a “reverse innovation” ap-proach to improve its odds of success in developingnew products by starting with the customer. The goalis to learn what customers want and need but cannotget from existing products, and then go back to R&Dlab with “invent to order.”
Traditional Innovation Approach → R&D Lab→ Customers
Reverse Innovation Approach → Customers→ R&D Lab
Marketing management needs to develop criteria(i.e., standards/norms) for success that new prod-ucts must meet if they are to be considered pos-sible candidates for launching. Possible areas forstandards development include profits, costs, use ofplant capacity, and market share.
The reasons for a new-product failure are many, in-cluding unmet customer needs, misinterpreted or ig-nored market research results, inadequate marketingintelligence efforts, poor design, wrong price, highdevelopment costs, incorrect positioning of a prod-uct, poor quality, low value, faulty market testing,improper distribution channels, unexpected changesin the market and the economy, unexpected reactionsfrom competitors, poor timing of product introduc-tion, and ineffective advertising.
StagesA new-product development process goes througheight major stages, starting with idea generation,idea screening, concept development and testing,marketing strategy development, business analysis,product development, and market testing, and end-ing with commercialization.
In the idea screening stage, there are two types oferrors that must be avoided. These include:
1. Drop-error, meaning the company rejects a goodidea as a bad one
2. Go-error, meaning the company accepts a badidea as a good one and allows it to move intothe product development and commercializationstages
The purpose of screening is to drop poor or badideas in the early stages when the costs are lowerinstead of waiting until the subsequent stages wherethe costs are higher.
Rating MethodCompanies use a product-idea rating method todetermine a new product’s success rate early, asfollows:
SuccessFactors
RelativeWeight
ProductScore
ProductRating
(a) (b) (c = a × b)ABC
The product ratings are weighted and added toreach an overall rating score, which is then comparedto the minimum score required. A reject or acceptdecision is made.
After a new product’s rating score is accepted, andas the new idea moves through the developmentstages, the company needs to revise its estimate ofthe product’s overall probability of success, usingthe following formula:
Overall Probability of Success = (Probability ofTechnical Completion) × (Probability ofCommercialization Given Technical Completion)× (Probability of Earning Profit GivenCommercialization)
These three probabilities are multiplied, and the re-sult is compared with the target before proceedingwith further development.
❑ Learning Objective 3.8:COMPUTE THE CUSTOMERRETENTION RATEOrganizations often use customer surveys to esti-mate the customer retention rate and customer lifein years with a specific product or brand. Cus-tomer retention and customer satisfaction are re-lated to each other to some extent and mainly

JWBT150-Vallabhaneni c03 July 28, 2009 17:27
LEARNING OBJECTIVE 3.9: COMPUTE THE LIFETIME VALUE OF A CUSTOMER 77
depend on the competitive conditions in themarket.
Competitive MarketsIn less competitive markets, customers are moreeasily retained even with poor levels of customersatisfaction because product substitutes are few orproduct-switching costs are high.
In utility markets (e.g., telephone, water, electricity,gas, and hospital/medical care), where choices arelimited, customers stay even when dissatisfied.
In highly competitive markets for frequent pur-chases (e.g., food stores, gas stations, restaurants,and banks), customers defect quickly when they aredissatisfied. In these markets, higher levels of cus-tomer satisfaction are needed to retain higher per-centages of customers.
In highly competitive markets for infrequent pur-chases (e.g., computers, automobiles, appliances,and electronics), customers defect eventually whenthey are dissatisfied. In these markets, higher levelsof customer satisfaction are needed to retain higherpercentages of customers.
Calculating the Customer Retention RateThe customer retention rate, expressed as a percent-age, is calculated as the percentage of customers sur-veyed who answered the question “How likely areyou to buy this product or brand again on your nextpurchase?” (i.e., intention to repurchase), multipliedby the probability of repurchase, added together toresult in the overall customer retention rate.
Note that each customer may answer the samequestion differently depending on his experiencewith the product and the company that makes theproduct.
The average life expectancy of a customer for aspecific product (i.e., customer life) in years can becomputed given the rate of customer retention usingthe following formula:
Customer Life in N Years = 1/(1 − CR)
where CR is the customer retention rate.The customer retention rate can also be computed
given the customer life in years, as follows:
CR = 1 − (1/N)
where CR is the customer retention rate and N is thecustomer life in years.
❑ Learning Objective 3.9:COMPUTE THE LIFETIME VALUEOF A CUSTOMERA lost customer is expensive because a new customerhas to be attracted to replace the lost customer. Thecost of keeping a current customer satisfied is rela-tively small when compared to the cost of replacingthe lost customer.
Calculating the Cost of a Lost SaleLosing a sale has a minor impact, while losing acustomer has a major impact on the selling company.The cost of a lost sale, expressed as lost gross profitamount, is computed as follows:
Lost Sales Percent = 100 − Repurchase Percent
Estimated Lost Sales = Number of Lost Customers× Lost Sales Percent × Average Annual PurchaseAmount per Customer
Lost Gross Profit Amount = Estimated Lost Sales× Gross Profit Percent
It has been said that it costs five times more to replacea lost customer than to keep a current customer satis-fied. In other words, the higher the rate of customerretention, the longer the average customer life, andthe greater the lifetime value of the customer to acompany.
Strengthening the Customer RetentionRateA company with a high customer turnover rate has ahigh rate of acquisition and a high rate of defection.Establishing high switching costs or creating strongbarriers and delivering high customer service canstrengthen the customer retention rate. Merely re-ducing the defection rate will not improve the reten-tion rate. The most effective method for reducing thecustomer defection rate is listening to the customer.This creates loyalty and customer satisfaction andturns defecting customers into retained customers.Relationship marketing can also create a strong cus-tomer loyalty base.
The first year of acquiring a new customer resultsin a negative cash flow (loss) to a company in settingup the new account, and it may take one year ormore to start seeing a positive cash flow (profit) to acompany.

JWBT150-Vallabhaneni c03 July 28, 2009 17:27
78 Learning Module 3: Marketing Management
Calculating the Lifetime Valueof a CustomerThe lifetime value of a customer is calculated asfollows:
Step 1: Compute the cash flows generated by a cus-tomer for each year for a given period of time inyears.
Step 2: Multiply the cash flows for each year with thenet present values obtained from a table of presentvalue of $1 for each year.
Step 3: Add these present values for each year toresult in a total net present value (NPV) of cashflows. This total amount can be a positive or anegative number, which reflects the worth of thiscustomer to the company in today’s dollars.
The higher the NPV of cash flows, the greater thevalue of the customer to the company.
Another formula used to find the customer’s life-time value is:
Lifetime Value = Number of Years to Become aLoyal Customer × Average Revenue perCustomer × Gross Profit Margin Percent
❑ Learning Objective 3.10:COMPUTE THE CUSTOMERCONVICTION IN TERMS OF NETPROMOTER SCOREA customer’s loyalty to a product or brand dependson that customer’s conviction about that product orbrand. When a customer recommends a product orbrand to others, it is a positive sign of that customer’sconviction and a reflection of its value. When currentcustomers promote a company’s products to poten-tial customers, it leads to sales growth and higherprofits.
A company can sample its customers to determinehow many customers would recommend a specificproduct or brand to others (promoters), how manywould not likely recommend (passive or indifferent),and how many would not recommend for certain(detractors or captive customers).
The net promoter score, which is expressed as apercentage, is computed as:
Net Promoter Score = Percentage of Promoters− Percentage of Detractors
The net promoter score for a company can be com-pared with the same company’s score over a time
period as well as with the other companies that com-pute and publish the same score. The score is a reflec-tion of customer advantage point, which translatesinto sales growth and higher profits.
❑ Learning Objective 3.11:COMPUTE THE CUSTOMERLOYALTY SCORECustomer loyalty depends on three factors: cus-tomer satisfaction, customer retention, and customerrecommendation. Each of these factors affects prof-itability in different ways, some positive and somenegative.
The customer loyalty factor is an accurate reflec-tion of overall customer commitment to the com-pany. A low level of customer loyalty sends a redflag to management for positive actions. A low levelof customer satisfaction may have a high customerretention rate due to high product-switching costs.A low level of customer recommendation yields alow level of customer loyalty.
Customers are surveyed to obtain their input asto their satisfaction, retention, and recommendationrates. The customer satisfaction levels vary fromvery satisfied to very dissatisfied, and everythingin between. A customer satisfaction index (CSI), acustomer retention rate (CR), and a customer rec-ommendation rate (CM) is calculated for each ofthese satisfaction levels.
The overall customer loyalty score (CLS) is calcu-lated as follows:
Step 1: Calculate the loyalty score = CSI × CR × CM.Step 2: Calculate the overall CLS = loyalty score
multiplied by the percent of customers surveyedfalling into each of the customer satisfaction levelsto reach a weighted-average overall CLS.
The higher the CLS, the greater the customer loy-alty to the company. The overall customer loyaltyscore can be used as a benchmark to compare inter-nally and externally.
❑ Learning Objective 3.12:COMPUTE THE NET MARKETINGCONTRIBUTION AMOUNTThe net marketing contribution (NMC) concept tomarketing is as important as the accounting contri-bution margin (ACM) to accounting. The NMC canbe calculated in many ways:
JWBT150-Vallabhaneni c03 July 28, 2009 17:27
LEARNING OBJECTIVE 3.12: COMPUTE THE NET MARKETING CONTRIBUTION AMOUNT 79
� Net profit for a manufacturing corporation is salesrevenues minus cost of goods sold minus operat-ing expenses.
� Gross profit for a manufacturing corporation issales revenues minus cost of goods sold.
� Gross profit for a manufacturing corporation canalso be measured as a percent of sales revenuesusing a percent margin number, where margin is(price per unit – cost per unit)/price per unit.
� Net profit for a manufacturing corporation can alsobe calculated as gross profit minus operating ex-penses.
� ACM is sales revenues minus all production vari-able costs.
Operating expenses can be separated into market-ing expenses and other (nonmarketing) expenses toshow marketing’s contribution to profit, called netmarketing contribution (NMC).
ACM and NMC are different numbers becauseACM focuses on all variable costs related to pro-duction, whereas NMC includes both variable andfixed costs of operating the marketing department.ACM comes before the gross profit line item andNMC comes after the gross profit line item on the in-come statement. The ACM is a higher number thanthe NMC.
NMC makes marketing management accountablefor its part in increasing sales revenues, decreas-ing marketing expenses, and increasing overall netprofit. Marketing expenses can be expressed as a per-cent of sales.
NMC can be calculated in different ways depend-ing on the data available:
NMC = (Sales Revenues × Gross Profit Percent)− Marketing Expenses
NMC = (Sales Volume in units × ACM per unit)− Marketing Expenses
where sales volume in units is total market demandin units multiplied by the percent market share forthe company and ACM per unit is price per unitminus variable production cost per unit.
NMC can be calculated with either a product focusor a customer focus:
NMC with Product Focus = Sales Revenues× Percent Profit Margin − Marketing Expenses
where sales revenues equals market demand in unitstimes market share percent times average sellingprice per unit times net channel discount. The netchannel discount is computed as (1 – CD percent),
where CD is the channel discount given to channelintermediaries for commissions.
NMC with Customer Focus = Sales Revenues× Percent Profit Margin − Marketing Expenses
where sales revenues equals total number of cus-tomers times percent market share of customerstimes average revenue per customer times net chan-nel discount.
The net channel discount is computed as (1 – CDpercent), where CD is the channel discount given tochannel intermediaries for commissions.
NMC can also be calculated based on marketingstrategies:
NMC = Market Demand × Market Share× Average Selling Price × Channel Discount× Percent Profit Margin − Marketing Budget
where market demand strategies are aimed at grow-ing the market demand; market share strategies areaimed at growing the market share; average sellingprice strategies are aimed at increasing the averageselling price; channel discount strategies are aimedat decreasing the channel costs; percent profit mar-gin strategies are aimed at increasing the profit mar-gin; and marketing budget strategies are aimed atdecreasing the marketing budget or increasing themarketing efficiency in using the budget.
NMC can also be calculated for a market segment:
Segment NMC = Segment Market Demand inUnits × Segment Market Share in Percent× Price per Unit × Percent Profit Margin− Segment Marketing Expenses
DV Knowledge Corporation
Net Marketing Contribution Statement
Gross sales
Less: Returns and allowances
Net sales
Less: Variable cost of goods sold
Accounting contribution margin
Less: Fixed costs of goods sold
Gross profit or margin
Less: Marketing expensesFixed expensesVariable expenses (Continued )

JWBT150-Vallabhaneni c03 July 28, 2009 17:27
80 Learning Module 3: Marketing Management
Net marketing contribution
Less: Other operating expensesFixed expensesVariable expenses
Operating income
Notes: Cost of goods sold includes wages, materials, rent, sup-
plies, and utilities to manufacture goods, classified as fixed
or variable. Operating expenses include selling, general, ad-
ministrative, lease, and depreciation expenses, classified as
fixed or variable. Marketing expenses include both fixed and
variable types. Marketing expenses, which are part of operat-
ing expenses, are not shown separately in the formal income
statement. Net marketing contribution (NMC) is gross profit
minus all marketing expenses. Operating income is same as
earnings before interest and taxes (EBIT) or simply net profit
before taxes.
❑ Learning Objective 3.13:COMPUTE THE MARKETINGPROFITABILITY METRICSExamples of marketing profitability metrics includemarketing return on sales (MROS) and market-ing return on investment (MROI). Both MROS andMROI can be calculated in many ways:
� MROS is related to net marketing contribution(NMC) and sales revenues.
� MROS is also related to gross profit and marketingexpenses, both expressed as a percent of sales.
� MROI is related to NMC and marketing expenses.� MROI is also related to MROS and marketing
expenses.
Both MROS and MROI will make marketing man-agement accountable in improving an organization’soverall profit.
The MROS is computed as:
MROS = (NMC/Sales Revenues) × 100
MROS = (Percent Gross Profit)− (Percent Marketing Expenses)
where both gross profit and marketing expenses areexpressed as a percent of sales.
The MROI is computed as:
MROI = (NMC/Marketing Expenses) × 100
MROI = (MROS/Marketing Expenses) × 100
where both MROS and marketing expenses are ex-pressed as a percent of sales.
❑ Learning Objective 3.14:COMPUTE THE MARKETDEVELOPMENT INDEXMarket potential indicates the overall size of the mar-ket demand. Market demand means the maximumnumber of customers that can enter the market withmaximum number of units purchased and the max-imum number of dollars spent. The market demandsets an upper limit on sales volume. Unit sales aremarket demand in units times percent market share.A market development index (MDI) is related tocurrent market demand and market potential.
The MDI is calculated as:
MDI = (Current Market Demand in Units)/(Market Potential in Units) × 100
where
Market Potential = Maximum Buying Customers× Percent Buying Ceiling × Percent RepurchaseRate per Year × Purchase Quantity per Customer
Marketing management can use the MDI to de-velop strategies for market growth in terms of in-creasing its market size and share. An MDI of lessthan 33 percent indicates great potential for growth.An MDI of between 33 and 67 percent indicates needfor increasing benefits to customers and reducingprices to attract them. An MDI of more than 67 per-cent indicates room for growth, which could be dif-ficult to reach due to competitive moves and otherexternal forces (e.g., regulation).
❑ Learning Objective 3.15:COMPUTE THE MARKET SHAREINDEXMarket share index (MSI) will help in achieving thedesired market share for an organization. Actual MSIand potential MSI are calculated and their relation-ships to share development index (SDI) are shownin the following.
The MSI focuses on five elements of a marketingmix: promotion, product, price, place, and service.The MSI will increase as the customer response tothese elements increases and vice versa and is calcu-lated as:
MSI = (Promotion × Product × Price× Place × Service) × 100
Marketing management can use the MSI to de-velop strategies (1) to identify the major causes of

JWBT150-Vallabhaneni c03 July 28, 2009 17:27
LEARNING OBJECTIVE 3.17: COMPUTE THE RELATIVE PERFORMANCE, PRICE, AND CUSTOMER VALUE OF A PRODUCT 81
lost market share opportunities and (2) to determinehow improving poor-performance areas can lead toincreased market share positive changes.
Customers can be surveyed to determine actualresponses and potential responses to the market-ing mix elements so that performance gaps can beidentified and improved. Performance gap is calcu-lated as:
Performance Gap = Actual Responses− Potential Responses
The actual MSI is based on the actual responses andthe potential MSI is based on the potential responsesfrom customers. Actual MSI or potential MSI, bothexpressed as percent, are calculated as:
Actual MSI = Product Awareness × ProductAttractiveness × Price Affordability × ProductAvailability × Service Experience
Potential MSI = Product Awareness × ProductAttractiveness × Price Affordability × ProductAvailability × Service Experience
The share development index (SDI), which indi-cates the level of market share that a company hasachieved, can be computed using actual MSI andpotential MSI as:
SDI = (Actual MSI/Potential MSI) × 100
The ideal goal is to reach an SDI of 100.The market development index (MDI) can be com-
bined with the SDI to reveal growth opportunitiesfor different products, such as low growth or highgrowth. Then, marketing strategies can be devel-oped to concentrate on market development or sharedevelopment or both.
❑ Learning Objective 3.16:COMPUTE A PRODUCT’SLIFECYCLE COST ANDECONOMIC VALUE TO ACUSTOMERA product’s lifecycle cost includes many elements,such as direct price paid by a customer; productacquisition cost in terms of materials and labor;production cost in terms of labor, materials, andoverhead; installation cost in terms of labor andmaterial; delivery cost in terms of freight andshipping cost for labor and materials; ownershipcost in terms of interest and insurance; usage and
maintenance cost in terms of repairs and warranties;and disposal cost in terms of recycling packagingmaterials.
A company should identify all of its product’s life-cycle cost and compare it to its competitor’s prod-uct’s lifecycle cost for each product in the market.The difference between a company’s total cost and itscompetitor’s total cost provides an economic valueto its customer, computed as:
Economic Value to a Customer = CompetitorProduct’s Lifecycle Cost − Company Product’sLifecycle Cost
The goal is to assign a positive economic value toa customer during a product’s lifecycle. To achievethis goal, companies need to reduce all costs for aproduct ranging from product design to product dis-posal using value engineering methods, industrialengineering techniques, and cost reduction and costavoidance approaches.
❑ Learning Objective 3.17:COMPUTE THE RELATIVEPERFORMANCE, PRICE, ANDCUSTOMER VALUE OF APRODUCTMarketing management wishes to evaluate the rela-tive performance of competing products that pro-vide value to customers based on a product’sfeatures and functions but not necessarily based ontotal cost of purchase. This is because performance ofcertain products is based on their features, functions,safety, comfort, and convenience, which are difficultto quantify, unlike total costs.
Companies should determine relative perfor-mance and relative price information for theirproducts and compare them against the compet-ing products. This comparative information canbe obtained from reports published by externaland independent organizations (e.g., ConsumersUnion). Relative performance and relative price arecomputed as:
Relative Performance = (Company’s ProductPerformance Rating)/(Average PerformanceRating from All Reported Companies) × 100
Relative Price = (Company’s Product Price)/(Average Price from All Reported Companies)× 100

JWBT150-Vallabhaneni c03 July 28, 2009 17:27
82 Learning Module 3: Marketing Management
The purpose is to measure whether products areabove or below average in performance and price.The difference between relative performance and rel-ative price yields customer value:
Customer Value = Relative Performance− Relative Price
Customers may decide to purchase a product witha positive customer value and may not purchasea product with a negative customer value, barringother considerations. These customer values shouldbe used as input into the marketing plans for im-provement.
Value is the ratio between what the customer gets(benefits) and what the customer gives (costs). Valueequals benefits divided by costs. Value can also bedefined as the combination of benefits received andcosts paid by the customer. The value/price ratiois value divided by price. The higher this ratio, thebetter for the customer, and the lower this ratio, theworse for the customer.
❑ Learning Objective 3.18:COMPUTE A MARKETINGCHANNEL INTERMEDIARY’STRANSACTION VALUERetailers are among the marketing channel interme-diaries when they sell a manufacturer’s products atthe retail store to retailer customers. The retailer’sgoal is to connect producers with consumers at thestore for a profit.
Transaction ValueTransaction value for the retailer is derived froma combination of factors such as profitable use ofspace allocated to a product, inventory turnover forthe product, and the marketing expenses incurred topromote the product in that space.
Marketing expenses can be classified in terms ofpull and push strategies. In a pull strategy, ad-vertising enables consumers to pull branded prod-ucts from retailers through the marketing channelsystem. In a push strategy, manufacturers pushbranded products to retailers through the marketingchannel system with the help of trade allowances, in-store displays, product promotion costs, sales stafftraining costs, and personal selling efforts.
The retailer’s goal is to maximize the transac-tion value, which is affected by the manufacturer’s
product quality, market demand for the product,product margin, and overall marketing policies.
Manufacturers often carry products in their ware-house and deliver them to the retailer as needed in ajust-in-time (JIT) manner to reduce the retailer’s in-vestment in inventory. This manufacturer’s practiceincreases the transaction value to the retailer. Thispractice also benefits the manufacturer due to accessto a number of consumers who shop at the retailstore.
A marketing channel intermediary’s transactionvalue is computed as:
Transaction Value = Retail Space Value × InventoryTurnover per Year − Marketing Expenses
Retail Space Value = Profit Margin per Square Foot× Total Square Footage Allocated to Hold theInventory at the Store
The higher the transaction value, the greater theprofit to the channel intermediary.
Channel Cost per Customer TransactionEach channel intermediary will produce a differentlevel of sales and incur a different level of costs. Mar-keting management of the selling company will tryto align customers and channels to maximize de-mand at the lowest total cost of selling. All elsebeing equal, marketing management prefers to re-place high-cost channels with low-cost channels.Two channel choices to perform economic analysisinclude manufacturer’s sales agency and company’sown sales force. The goal is to compute the sellingcost per customer transaction for each of the channelchoices at different sales levels. The total selling costsinclude variable costs such as sales commissions andutilities and fixed costs such as rent and salaries. Thelower the cost per customer transaction at a givensales level, the greater the profits to the channel andto the selling company. These costs should not in-clude a product’s purchase price and its inventorycarrying and holding costs.
The channel cost per customer transaction is cal-culated as:
Total Selling Costs = Total Variable Selling Costs+ Total Fixed Selling Costs
Channel Cost Per Customer Transaction = TotalSelling Costs/Total Number of CustomerTransactions
JWBT150-Vallabhaneni c03 July 28, 2009 17:27
LEARNING OBJECTIVE 3.21: EVALUATE THE ADVERTISING’S EFFECTIVENESS WITH CUSTOMER RESPONSE INDEX 83
❑ Learning Objective 3.19:UNDERSTAND THERELATIONSHIPS AMONG PRICE,PROFIT, AND MARKET SHAREThe goal of a pricing strategy should be to increaseprofits, not to increase sales or volume. Loweringthe price can increase sales revenues, but it maynot increase profits because fixed costs stay rela-tively constant. The first question to ask is howmuch market share is needed to maintain the cur-rent level of profits before asking how much tolower or raise the price. Increasing the marketshare is difficult, whereas lowering or raising theprice is relatively easy. Also, competitors closely fol-low a company’s pricing strategy, whether up ordown. The market share needed to maintain thecurrent level of profits, expressed as a percent, iscalculated as:
Market Share Needed = (Desired Gross Profit)/(Market Demand) (Unit Price − Unit cost)
A breakeven market share, expressed as a percent,is a good indicator of judging profit potential andrisk of loss, and is calculated as:
Percent Breakeven Market Share = [(BreakevenVolume in Units)/(Market Demand in Units)]× 100
where
Breakeven Volume in Units = (Total FixedExpenses)/(Accounting Contribution Marginper Unit)
The percent breakeven market share indicates howclose it is to or far it is from a company’s actualmarket share in realizing a greater profit potential orfacing a risk of loss, respectively.
Philip Kotler recommends a useful way to analyzemarket-share movements in terms of four compo-nents: customer penetration, customer loyalty, cus-tomer selectivity, and price elasticity. The marketshare of a company is the product of these four com-ponents. The market share can be increased by in-creasing advertising efforts, increasing price, drop-ping small and unprofitable dealers, and enhancingproduct features—all to increase the profit marginon products.
❑ Learning Objective 3.20:UNDERSTAND A MARKETINGCHANNEL’S PERFORMANCEA marketing channel’s performance is based on threeareas: customer reach, channel operating efficiency,and customer service quality. All three areas mustdo well to reach the desired levels of sales and profitgoals. Similarly, poor performance in any one of thethree areas causes the overall channel to do poorly.
If a channel’s performance is poor, the ability toreach customers is inhibited. If a channel’s opera-tions are inefficient, the cost of serving its customerswill be too high, regardless of how many customersit attracts and its quality of service levels.
If customer service quality is poor, customer sat-isfaction will decrease, and customer retention ratewill also decrease, regardless of higher levels of cus-tomer reach and operating efficiency.
A company may have direct channels and indi-rect channels to serve its customers. Usually, a di-rect marketing channel generates higher margins,but the channel costs and marketing expenses arehigher. E-marketing channels are an example of in-direct channels to reach smaller and hard-to-reachcustomers. For example, online buying can save sig-nificant amounts of money to organizations in pro-curement of products and services. Usually, an indi-rect marketing channel generates lower margins, butthe channel costs and marketing expenses are lower.Marketing management should evaluate whetherdirect or indirect marketing channels are profitable.
Net marketing contribution (NMC) for a direct orindirect marketing channel is calculated as:
NMC for a Direct Channel = [Sales Volumein Units × (End-User Price per Unit× (1 − Channel Discount Percent))] − Costof Goods Sold − Marketing Expenses
NMC for an Indirect Channel = [Sales Volumein Units × (End-User Price per Unit× (1 − Channel Discount Percent))] − Costof Goods Sold − Marketing Expenses
❑ Learning Objective 3.21:EVALUATE THE ADVERTISING’SEFFECTIVENESS WITHCUSTOMER RESPONSE INDEXA strong marketing channel system combined witha well-positioned product providing higher levels of

JWBT150-Vallabhaneni c03 July 28, 2009 17:27
84 Learning Module 3: Marketing Management
customer value cannot achieve full marketing suc-cess without a good marketing communications pro-gram, which includes advertising.
A customer’s value increases when perceived ben-efits are greater than perceived costs. A company’ssales level cannot increase if target customers arelargely unaware of the product and its benefits, costs,and value.
The effectiveness of advertising can be measured ina hierarchical set of customer-response effects, start-ing with exposure (low-level), awareness, compre-hension, intention, and purchase (high-level).
Awareness is the first step in a new customer acqui-sition process. Increasing awareness levels increasecustomer retention rates and average lifetime valueof a customer, which in turn increase customer loy-alty and company profits.
A decision tree diagram is used to facilitate thecalculation of customer response index (CRI), con-sisting of five levels, as follows:
CRI = Percent Exposed × Percent Aware× Percent Comprehend × Percent Intention× Percent Purchase
Marketing management can compute the CRI atthe current level and plan for an improved level bychanging the percentages of one or more of these fivelevels:
Incremental CRI = CRI at the Improved Level− CRI at the Current Level
Gross rating points (GRPs) measure the extent towhich a television advertisement reached the targetmarket and how often the target customers saw theadvertisement. GRPs are a better measure of adver-tising effectiveness than the dollars spent on adver-tising. GRPs are computed as:
GRPs = Percent Reach × Message Frequency
GRPs are the same as the total number of expo-sures (E), which is reach (R) times frequency (F).The weighted number of exposures (WE) is reach(R) times the average frequency (F) times the aver-age impact (I).
Total Number of Exposures = E = R × F
Weighted Number of Exposures = WE = R × F × I
Advertising elasticity is the responsiveness of con-sumers to advertising expenditures. Marketing man-agement estimates the advertising elasticity needed
to maintain current marketing profits, which isNMC. The goal is to determine the increase in salesin relation to an increase in the advertising expense,computed as:
Advertising Elasticity = (Percent Change in Sales)/(Percent Change in Advertising Expense)
Higher advertising elasticities are preferred over thesmaller, and a company can compare these elastic-ities from time to time and among products. The“growth” stage of a product lifecycle yields greatersales gains using advertising than the “introduc-tory,” “mature,” or “decline” stages.
The effects of advertising can be seen in both theshort run and long run, where the latter has a carry-over effect. This means that advertising done in thecurrent sales period will produce results not only inthe current period but also in the subsequent salesperiods, as shown in the following.
Advertising carryover coefficients range from 0 toless than 1, with the average of 0.5, and the coefficientdoubles the following period:
Advertising period 0 1 2 3Carryover effect 0 0.5 0.25 0.125
Total sales impact of the advertising expense canbe calculated as:
Total Sales Effect = (Incremental Sales)/(1 − Carryover Effect)
The advertising effectiveness ratio is actual shareof market percentage divided by share of voice per-centage. The ratio of 100 means an effective level,below 100 means an ineffective level, and above 100means a very effective level.
Advertising response analysis, expressed as acoefficient, indicates how an increase in advertis-ing budget increases the sales volume. For example,an advertising response coefficient of +0.3 means aproposed 50 percent increase in advertising budgetwill increase the sales volume by 15 percent (i.e.,50% × 0.3). The increase in gross profit amount re-sulting from advertising response coefficient is com-puted as:
Increase in Gross Profit = Increase in AdvertisingBudget × Advertising Response Coefficient× Current Net Sales × Gross Profit Percentage
The major objective of the marketing public rela-tions (MPR) function in a firm is to serve the mar-keting department in areas such as launching of new

JWBT150-Vallabhaneni c03 July 28, 2009 17:27
LEARNING OBJECTIVE 3.24: UNDERSTAND THE FINANCIAL PERFORMANCE METRICS RELATED TO MARKETING 85
products, building of customer interest in a productcategory, and repositioning of a mature market. Thereturn on the MPR investment can be calculated asfollows:
Return on MPR Investment = Contribution MarginDue to MPR/MPR Investment or Cost
❑ Learning Objective 3.22:LEARN HOW TO CONDUCTA MARKETING PORTFOLIOANALYSISA portfolio analysis is an evaluation of a businessunit, specific product, or market segment regardingmarket attractiveness and competitive position todecide upon a suitable strategic marketing plan. Thegoal is to increase sales, market share, and profits fora given amount of investment.
Two strategic market plans emerge from a portfolioanalysis—offensive and defensive plans:
1. Offensive plans focus on investing to grow themarket or market share, investing to improve thecompetitive position, and investing to enter newattractive markets or develop new-product mar-kets.
2. Defensive plans focus on investing to protector hold the market share and competitive posi-tion, optimizing the price-volume relationship tomaximize profits position (optimize), managingthe market position for maximum cash flow withlimited resources (monetize), and managing theproduct for maximum short-run cash flow or min-imum losses (harvest/divest).
A company can develop two types of plans(offensive—grow share or defensive—hold share) todetermine the best course of action. Year 1 (Y1) willbe the base year, as follows:
Actual—Y1 Offensive Plan—Y2 Defensive Plan—Y2
Sales Revenues Sales Revenues Sales RevenuesGross Profit Gross Profit Gross ProfitNMC NMC NMCMROS MROS MROSMROI MROI MROI
where
Sales Revenues = Market Demand × Market ShareGross Profit = Sales Revenues × Percent MarginNMC = Gross Profit − Marketing Expenses
MROS = (NMC/Sales Revenues) × 100MROI = (NMC/Marketing Expenses) × 100
❑ Learning Objective 3.23:LEARN HOW TO DEVELOPA MARKETING BUDGETWhether to hold current market share or to growmarket share requires financial resources in the formof a marketing budget, which is based on the strate-gic market plan and the marketing-mix strategy.
Three kinds of marketing budgets exist: percent-of-sales, customer-mix, and bottom-up.
1. The percent-of-sales budget is based on previousyears’ data and experience levels, adjusted higherfor the growth strategy and lower for the harveststrategy. This kind of budget is simple to developbut the accuracy is low.
2. Customer-mix budget includes the cost of acquir-ing new customers and the cost of retaining cur-rent customers. This kind of budget is logical todevelop, but the cost data are difficult to obtain.This budget amount can be expressed as a percentof sales for comparative purposes.The customer-mix budget can be prepared as:
Customer-Mix Budget = (MarketingAdministration Costs) + (Acquisition Cost perCustomer × Number of New Customers)+ (Retention Cost per Customer × Number ofRetained Customers)
3. Bottom-up budget requires specifying each mar-keting task required and determining the amountneeded to accomplish that task. It is good to di-vide the budget into personnel expenses and non-personnel expenses to facilitate comparison be-tween time periods. This budget amount can alsobe expressed as a percent of sales for comparativepurposes.
❑ Learning Objective 3.24:UNDERSTAND THE FINANCIALPERFORMANCE METRICSRELATED TO MARKETINGOrganizations with marketing-orientation andcustomer-focus should look at financial data relatedto customers since they are the major source of cashflows and profits.

JWBT150-Vallabhaneni c03 July 28, 2009 17:27
86 Learning Module 3: Marketing Management
Some examples of financial performance metricsrelated to marketing are shown here:
Financial Performance Metrics Related toMarketing
Customer Volume = Market Demand in TotalNumber of Customers × Percent MarketShare
Customer Margin = Net Revenue per Customer− Cost of Goods Sold per Customer
where net revenue per customer is average rev-enue per customer times channel discount per-cent.
Gross Profit = Customer Volume × CustomerMargin
Net Marketing Contribution (NMC) = GrossProfit − Marketing Expenses
Net Profit = NMC − Non-Marketing OperatingExpenses
Marketing Expenses = Marketing PersonnelExpenses + Marketing Non-PersonnelExpenses
Marketing Return on Sales (MROS) = (NMC/
Sales Revenues) × 100
Marketing Return on Investment (MROI)= (NMC/Marketing Expenses) × 100
Customer Value = Relative Performance− Relative Price
Accounts Receivable Investment = CustomerVolume × Net Revenue per Customer× Percent Days Outstanding
Inventory Investment = Customer Volume× Cost of Goods Sold per Customer× Percent Days of Inventory
❑ Learning Objective 3.25:UNDERSTAND THE NATUREOF MARKETING OF SERVICESThis learning objective discusses service character-istics and service quality along with overcomingobstacles in services marketing.
Service CharacteristicsThe definition of what constitutes a service remainsunclear. Both products and services have the follow-ing common variables that comprise the marketingmix:
� The product or service itself� The price� The distribution system� Promotion� Marketing research
Yet, services possess certain distinguishing char-acteristics and have unique problems that result inmarketing mix decisions that are substantially dif-ferent from those found in communication with themarketing of goods. These characteristics includeintangibility, inseparability, fluctuating demand, ahighly differentiated marketing system, and a clientrelationship:
� Intangibility arises when a service firm is actuallyselling an idea or experience, not a product. It isoften difficult to illustrate, demonstrate, or displaythe service in use. Examples include airline or hotelservice.
� Inseparability arises when a service cannot be sep-arated from the person of the seller. In other words,the service must be created and marketed simulta-neously. An example is an insurance agent who isselling a policy.
� Fluctuating demand occurs when services fluctu-ate either by season (tourism), days (airlines), ortime of day (movie theaters). One example of stim-ulating demand or unused capacity is when down-town hotels (or those that are used predominantlyby business travelers) offer significant discountsfor a weekend stay.
� Highly differentiated marketing systems offerdifferent service approaches for different services.For example, the marketing of banking or finan-cial services requires a different approach than themarketing of computer services or airline services.
� Client relationships exist between the buyer andthe seller, as opposed to a customer relation-ship. Examples include physician–patient andbanker–investor relationships. The buyer followsthe suggestions provided by the seller.
Service QualityPoor service quality and nonperformance are twomajor reasons, and high price is a minor reason for

JWBT150-Vallabhaneni c03 July 28, 2009 17:27
LEARNING OBJECTIVE 3.26: UNDERSTAND THE STRATEGIES IN PRODUCT MANAGEMENT 87
switching to the competition. Service quality is mea-sured against performance, which can be very diffi-cult to ascertain. In general, problems in the deter-mination of good service quality are attributable todifferences in expectations, perceptions, and experi-ences regarding the encounter between the serviceprovider and the service user.
It is easier and cheaper to keep an existing cus-tomer than to find a new one. Product quality canbe measured against accepted standards, which istangible, while service quality is measured againstexpected performance, which is intangible.
Service quality is the gap between expected ser-vice and perceived service. The following is a listof determinants of service quality, which can helpmarketing managers to avoid losing customers:
� Reliability involves dependability and consistencyof performance.
� Responsiveness concerns the willingness or readi-ness of employees to provide service.
� Competence means possession of the necessaryskills and knowledge to perform the service.
� Access involves approachability and ease of con-tact.
� Courtesy involves politeness, respect, considera-tion, and friendliness of contact personnel.
� Communication means keeping customers in-formed in language they can understand. It alsomeans listening to customers.
� Credibility involves trustworthiness, believability,and honesty.
� Security is freedom from danger, risk, or doubt.� Understanding the customer involves making the
effort to understand the customer’s needs.� Tangibles include the physical evidence of the
service.
Overcoming the Obstacles in ServiceMarketingIn view of the size and importance of the serviceeconomy, considerable innovation and ingenuity areneeded to make high-quality services available atconvenient locations for consumers. Actual servicesoffered by service providers often fall behind the op-portunities available due to the following obstacles:a limited view of marketing, a lack of competition, alack of creative management, a concept of “no obso-lescence,” and a lack of innovation in the distributionof services.
❑ Learning Objective 3.26:UNDERSTAND THE STRATEGIESIN PRODUCT MANAGEMENTProduct management strategy is a part of the mar-keting mix (i.e., product, price, place, and promo-tion). Other parts include promotion strategy, distri-bution strategy, and pricing strategy. There are manydecision areas in product management, includingproduct definition, product classification, productmix and product line, and packaging and branding.
Product DefinitionThe way in which the product variable is defined canhave important implications for the survival, prof-itability, and long-run growth of a firm. A productcan be viewed in several ways:
� Tangible product focuses on physical object itself.� Extended product focuses on physical object and
service.� Generic product focuses on essential benefits to be
received from the product.
A classical example of improper definition can befound in railroad passenger service, where it defineditself as being in the railroad business instead ofin the transportation business. A reasonable defi-nition of product is that it is the sum of the phys-ical, psychological, and sociological satisfaction thebuyer derives from purchase, ownership, and con-sumption.
Product ClassificationProduct classification is an analytical device to as-sist in planning marketing strategies and programs.A basic assumption underlying such classificationsis that products with common attributes can be mar-keted in a similar manner. In general, products areclassified according to two basic criteria: (1) end useor market and (2) degree of processing or physicaltransformation required.
Examples of product classification include agricul-tural products, raw materials, industrial goods, andconsumer goods. The market for industrial productshas certain attributes that distinguish it from the con-sumer goods market. For certain products there are alimited number of buyers, known as a vertical mar-ket, which means that it is narrow (customers arerestricted to a few industries) and that it is deep (alarge percentage of the producers in the market use

JWBT150-Vallabhaneni c03 July 28, 2009 17:27
88 Learning Module 3: Marketing Management
the product). Some products, such as office supplies,have a horizontal market, which means that goodsare purchased by all types of firms in many differentindustries.
Product Mix and Product LineThe product mix is the composite of products of-fered for sale by the firm’s product line. It refers to agroup of products that are closely related in terms ofuse, customer groups, price ranges, and channelsof distribution. There are three primary dimensionsof a firm’s product mix, including width, depth, andconsistency.
Width of the product mix refers to the number ofproduct lines the firm handles. Depth of the productmix refers to the average number of products in eachline. Consistency of the product mix refers to thesimilarity of product lines. Product line plans takeinto account consumer evaluation of the company’sproducts (strengths and weaknesses) and objectiveand accurate information on sales, profits, and mar-ket share (actual and anticipated levels).
Packaging and BrandingDistinctive or unique packaging is one method of dif-ferentiating relatively homogeneous products, suchas toothpaste or soap. The design of packagingshould focus on the size of the product, how easyit is to open, how strong the packaging should bein protecting the product, the attractiveness of thepackaging, and costs.
Many companies use branding strategies to in-crease the strength of the product image. Factorsto be considered include: product quality, wherebyproducts do what they do very well; consistent ad-vertising, in which brands tell their story often andwell; and brand personality, where the brand standsfor something unique (e.g., Xerox and Kodak). Agood brand name can evoke feelings of trust, confi-dence, security, and strength.
Marketing management needs to analyze directproduct profitability for each product because han-dling costs among products can vary, thus affectingthe true gross margin/profit of a product. A prod-uct’s handling costs can include receiving costs, stor-age costs, warehouse loading costs, and paperworkcosts from the time it reaches the warehouse untila customer buys it in the retail store. This meansthat some high-volume products with higher han-dling costs are less profitable and deserve less shelf
space in the store than some low-volume productswith lower handling costs. True gross margin is com-puted as:
True Gross Margin = Gross Margin BeforeHandling Costs − Handling Costs
❑ Learning Objective 3.27:UNDERSTAND THE STAGESIN A PRODUCT LIFECYCLEA firm’s product strategy must consider the fact thatproducts have a lifecycle—phases or stages that aproduct will go through in its lifetime. This lifecyclevaries according to industry, product, technology,and market. In general, product growth follows anS-shaped curve, although shown as linear, due toinnovation, diffusion of a new product, and changesin the product and the market.
Product Lifecycle (PLC) ConceptThere are four phases that a typical product goesthrough: (1) introduction, (2) growth, (3) maturation,and (4) decline. Some products skip a phase, such asintroduction or maturity, while some products arerevitalized after decline, thereby not going throughthe S-shaped pattern. Each phase is described in thefollowing (see the figure).
DeclineIntroduction Growth Maturation
Phase 1 2 3 4
Introduction phase (phase 1) incurs high produc-tion and marketing costs. Profits are low or nonexis-tent. This phase is flat due to difficulties of overcom-ing buyer inertia and stimulating trials of the newproduct.
Profits increase and are possibly correlated withsales during the growth stage (phase 2) as the mar-ket begins trying and adopting the product. As theproduct matures (phase 3), profits do not keep pacewith sales because of competition. Penetration ofthe product’s potential buyers is eventually reached,causing the rapid growth to stop and level off. Priceconcessions, increasing product quality, and expand-ing advertising will be planned to maintain marketshare.
At some point, sales will decline (phase 4), andthe seller must decide whether to drop the product,alter the product, seek new uses for the product, seek

JWBT150-Vallabhaneni c03 July 28, 2009 17:27
LEARNING OBJECTIVE 3.27: UNDERSTAND THE STAGES IN A PRODUCT LIFECYCLE 89
new markets, or continue with more of the same.Growth will eventually taper off as new substituteproducts appear in the market. The advice for thedecline phase is not to invest in slow or negativegrowth or unfavorable markets but instead to pullthe cash out.
Due to changing conditions, the marketing mix hasto be changed in line with PLC changes. The PLCconcept can help in forecasting, pricing, advertis-ing, and product plans. The difficult part of the PLCconcept is estimating the exact time periods for thesefour phases in that it is hard to know when one phasebegins and ends. The duration of each phase variesfrom product to product, which diminishes the use-fulness of the PLC concept as a marketing planningtool.
Product AuditThe product audit is a marketing management tech-nique whereby the company’s current product offer-ings are required to ascertain whether each productshould be continued as is, improved, modified, ordiscontinued. The product manager, who is respon-sible for his product, should ensure that the productaudit is performed at regular intervals as a matterof marketing policy. One of the major purposes ofthe product audit is to detect “sick” products forpossible discontinuation. Some critical factors to beconsidered in this area include sales trends, profitcontribution, and product lifecycle stage.
� Sales trends. How have sales moved over time?Why have sales declined?
� Profit contribution. What has been the profit con-tribution of this product to the company?
� Product lifecycle stage. Has the product reached alevel of maturity and saturation in the market? Hasthe product outgrown its usefulness? The prod-uct discontinuation issue is a hard one because itinvolves consideration of its negative impact onemployees, keeping consumers supplied with re-placement parts, disposing of inventory, and pro-viding repair and maintenance services.
One of the objectives of the product audit is to de-termine whether to modify or improve the productor to leave the product as it is (status quo). Modify-ing the product requires changes in product features,design, packaging, promotion, price, and channelsof distribution. Product improvement suggestionsoften come from advertising agencies, consultants,sales staff, consumers, and intermediaries, and in-volve many functions such as engineering, manufac-turing, marketing, and accounting. Market researchis advised when a product improvement is plannedbecause it is not always clear how consumers willreact to improvements or changes.
Self-Assessment Exercise
Online exercises are provided for the learn-ing objectives in this module. Please visitwww.mbaiq.com to complete the online exercisesand to calculate your MBA IQ Score.

JWBT150-Vallabhaneni c03 July 28, 2009 17:27
90

JWBT150-Vallabhaneni c04 July 14, 2009 8:25
LEARNING MODULE 4
Quality and Process Management
Learning Objective 4.1: Understand theBasic Quality Concepts 91
Learning Objective 4.2: Understand theVarious Definitions of Quality 93
Learning Objective 4.3: Calculate theCost of Quality 94
Learning Objective 4.4: Calculate theSix-Sigma Metric 94Design for Six Sigma 95Six-Sigma Players 96
Learning Objective 4.5: Compute theReturn-on-Quality Metric 96
Learning Objective 4.6: Apply QualityTools 96Seven Quality Control Tools 97
Seven Quality Management Tools 97Other Tools 97
Learning Objective 4.7: ApplyStatistical Process ControlTechniques 98Process Variation 98Process Capability 99
Learning Objective 4.8: ComputeTaguchi’s Quality Loss Function 100
Learning Objective 4.9: Understand theRole of Inspection and Quality atSource 100
Learning Objective 4.10: Understandthe Process Management Methodsand Tools 101
❑ Learning Objective 4.1:UNDERSTAND THE BASICQUALITY CONCEPTSQuality planning focuses on developing products,services, systems, processes, policies, and proce-dures needed to meet or exceed customer expec-tations. Quality planning is a part of the JapaneseHoshin planning method where it involves consen-sus at all levels as plans are cascaded throughoutthe organization, resulting in actionable plans andcontinual monitoring and measurement.
Quality assurance focuses on the inputs to a pro-cess or product, rather than the traditional control-ling mode of inspecting and checking products at theend of operations, after errors are made (i.e., qualitycontrol).
Quality control is an evaluation to indicate neededcorrective action, the act of guiding, or the state ofa process in which the variability is attributable to aconstant system of chance causes. It compares andacts on the difference between actual performanceand target performance (goal). Quality control in-cludes the operational techniques and activities usedto fulfill requirements for quality. Often, quality as-
surance and quality control are used interchange-ably, referring to the actions performed to ensure thequality of a product, service, or process, but they aredifferent in meaning in terms of timing.
Quality engineering focuses on combining prod-uct design engineering methods and statistical con-cepts to reduce costs and improve quality byoptimizing product design and manufacturing pro-cesses. For example, Taguchi’s quality loss function(QLF) is connected with quality engineering.
Quality audit is a systematic, independent exam-ination and review to determine whether qualityactivities and related results comply with plannedarrangements and whether these arrangements areimplemented effectively and are suitable to achievethe objectives. Quality planning, quality assurance,and quality engineering focus on the front-end of aprocess, whereas quality control and quality auditfocus on the back-end of a process.
Quality circles refer to a team of employees (6 to12) voluntarily getting together periodically to dis-cuss quality-related problems and issues and to de-vise strategies and plans to take corrective actions.Quality circles should be introduced in an evolu-tionary manner, so employees feel that they can tap
91

JWBT150-Vallabhaneni c04 July 14, 2009 8:25
92 Learning Module 4: Quality and Process Management
their creative potential. Quality circles are a part ofemployee empowerment. Ishikawa is known as the“Father of Quality Circles.”
Quality council is a prerequisite of implementinga total quality management (TQM) program in theorganization. The quality council is similar to an ex-ecutive steering committee.
Quality improvement or continuous improve-ment is an ongoing activity where problems arediagnosed, root causes are identified, solutions aredeveloped, and controls are established to improvequality.
Plan-Do-Check-Adjust (PDCA) cycle is relatedto continuous improvement, where an improve-ment plan is developed (Plan), implemented (Do),monitored and evaluated (Check), and modified orrefined (Adjust). Deming’s PDCA cycle is a coremanagement tool for problem solving and qualityimprovement, which can be used for planning andimplementing quality improvements.
Just-in-time (JIT) philosophy reduces the cost ofquality (COQ) and improves quality. It is related tocontinuous improvement.
Jidoka (a Japanese word) means stopping a pro-duction line or a process step when a defect or prob-lem is discovered so that it will not cause additionalor new problems further down the production line.Jidoka requires employee training and empower-ment to stop the running production line. A pro-duction worker and/or a programmed machine canaccomplish the jidoka goals.
Kaizen is an ongoing process of unending im-provement, that is, establishing and achieving highergoals of improvement all the time. PDCA, JIT, andkaizen are related to quality or continuous improve-ment. Journalist tools such as Five Ws and One Hcan be used to understand a process deeply and toimprove a process continuously. These tools includeWho, What, Where, When, Why, and How. Answersto these six questions help guide the problem solvingand quality improvement process.
Poka-yoke is an approach for mistake-proofing aproduction or service process using automatic de-vices (failsafe methods) to avoid simple human ormachine errors in order to improve quality. It isbased on two aspects: prediction and detection ofa defect or error. It is a simple, creative, and inexpen-sive method to implement and in part achieves zerodefects as suggested by Crosby.
Stakeholder empowerment means involving em-ployees in every step of a production or service pro-cess to solicit their input. It is based on the idea that
employees who are close to the action would bet-ter know the shortcomings of a system, machine, orprocess than those who are not. Quality circles arepart of employee empowerment. Similarly, invitingsuppliers and customers to participate in a productor service design to improve quality and features isalso a part of stakeholder empowerment.
Sequential engineering (traditional engineeringor over the wall engineering) is an approach to prod-uct development process where each stage is car-ried out separately and where the next stage cannotstart until the previous stage is completed. The en-tire process takes time and costs money because thecommunication and coordination flows are only inone direction and all changes and corrections arerelayed back to the beginning of the process or pre-vious stages. The time-to-market for a new prod-uct is longer, expensive, and inefficient with sequen-tial engineering. Concurrent engineering approachis an improvement over the sequential engineeringapproach as the former approach improves timing,communication, and coordination problems encoun-tered in the latter approach.
Concurrent engineering is defined as a system-atic approach to the integrated and overlapping de-sign of products and their related processes, includ-ing design, manufacturing, and support. It requiresthat, from the beginning, all elements of a prod-uct’s lifecycle be evaluated across all design fac-tors to include user requirements, quality, cost, andschedule.
Industrial engineering, also known as manage-ment engineering, ensures the economical, efficient,and effective utilization of an organization’s re-sources in manufacturing and service industries.
Industrial engineers (management engineers) areknown as efficiency experts in manufacturing orservice firms as they deal with the five-M of acompany’s resources: men, machines, materials,methods, and measurements. Specifically, industrialengineers participate in the design of jobs, prod-ucts, and processes; schedule machines for greaterutilization; schedule operators for maximum pro-ductivity; measure material-usage efficiency; mea-sure labor productivity through motion and timestudies; measure energy-usage efficiency; partici-pate in layout design for equipment and facilities;analyze materials handling and warehousing oper-ations for efficiency; analyze work steps to identifyvalue-added and non-value-added activities; reviewproduct specifications for accuracy and improve-ment; and enhance production systems, methods,

JWBT150-Vallabhaneni c04 July 14, 2009 8:25
LEARNING OBJECTIVE 4.2: UNDERSTAND THE VARIOUS DEFINITIONS OF QUALITY 93
and procedures to eliminate waste and duplication.They approach production or service activities withan eye towards continual improvement using inte-grated systems, methods, and procedures.
The International Organization for Standardiza-tion (ISO) 9000 standards address quality systemprocesses but not product performance specifica-tions. In other words, ISO 9000 covers how productsare made but not necessarily how they work. ISO9000 focuses on processes, not on products or peo-ple. It is based on the concept that one will fix theproduct by fixing the process. ISO 9000 is a standardby which to judge the quality of suppliers. It assumesthat suppliers have a sound quality system in placeand are following it. ISO 9000 can be used as a base-line quality system to achieve quality objectives.
Two kinds of ISO 9000 standards exist: prod-uct standards dealing with technical specificationsand quality standards dealing with managementsystems. Four quality measures for ISO 9000 are:(1) leadership, (2) human resource development andmanagement, (3) management of process quality,and (4) customer focus and satisfaction.
Environmental quality engineering means de-signing products and their processes that are en-vironmentally friendly using green manufacturingtechniques, such as design for reuse (recycling), de-sign for disassembly (repair), design for rework, anddesign for remanufacturing (restoration).
Design for recycling is an investment recovery andenvironmental improvement effort to recover rev-enues and reduce costs associated with scrap, sur-plus, obsolete, and waste materials. In design for re-pair, a nonconforming product is fixed so that it willfulfill the intended usage requirements, although itmay not conform to the originally specified require-ments. A repaired product retains its original iden-tity and only those parts that have failed or badlyworn out are replaced or serviced. In design forrework, a nonconforming product is taken back toproduction line to fix it in order to meet the origi-nally specified requirements. In design for remanu-facturing, worn out products are restored to like-newcondition.
Green manufacturing uses a lifecycle design-approach that focuses on incoming materials, man-ufacturing processes, customer use of the product,and product disposal.
Complying with environmental quality standardssuch as ISO 14000 and 14001 is a part of the en-vironmental quality engineering scope. The goal isto reduce the potential legal liabilities and respond
to regulatory requirements (e.g., EPA in the U.S.)addressing human safety and health issues.
The ISO 14000 environmental standards are di-vided into two broad categories: (1) environmentalmanagement systems consisting of environmentalperformance evaluation and environmental audit-ing and (2) lifecycle assessment consisting of en-vironmental labeling and environmental aspects inproduct standards.
The ISO 14001 environmental standard is a frame-work for planning, developing, and implementingenvironmental strategies in an organization. Theframework includes a policy, a planning process,organizational structure, specific objectives and tar-gets, specific implementation programs, communi-cations and training programs, management review,monitoring, and corrective action in terms of envi-ronmental audit.
Total quality management (TQM) is an umbrellaterm and concept that focuses on doing things rightin the first place, whether in producing goods or pro-viding services. TQM encompasses the entire orga-nization both internally from higher-lever employ-ees to lower-level employees and externally fromsuppliers to customers. A TQM strategy or pro-gram includes several elements such as quality con-cepts and tools, continuous improvement (kaizen),PDCA, JIT, stakeholder empowerment, benchmark-ing, ISO, Six-Sigma, statistical process control (SPC),and Taguchi’s quality loss function. Contrary to thepopular belief, quality decreases costs and increasesprofits.
Drivers of quality include customers; suppliers;employees; products; services; organizational cul-ture; organizational policies, procedures, and stan-dards; and total organizational focus and commit-ment.
Big Q, little q is a quality-contrasting term wherebig Q focuses on all business products and processesin the entire company and little q focuses on all orparts of products and processes in one factory orplant.
❑ Learning Objective 4.2:UNDERSTAND THE VARIOUSDEFINITIONS OF QUALITYQuality has many definitions because it is vieweddifferently from many perspectives.
Judgment-based criteria are synonymous with su-periority or excellence, which is abstract, subjective,and difficult to quantify.

JWBT150-Vallabhaneni c04 July 14, 2009 8:25
94 Learning Module 4: Quality and Process Management
Product-based criteria assume that higher levelsor amounts of product characteristics are equivalentto higher quality and that quality has a direct rela-tionship with price.
User-based criteria define that quality is fitnessfor intended use or how well a product performsits intended function. It is basically dictated by userwants and needs.
Value-based criteria focus on the relationship ofusefulness or satisfaction of a product or service toprice. This means a customer can purchase a genericproduct at a lower price if it performs the same wayas the brand-name product.
Manufacturing-based criteria mean conformanceto specifications (e.g., engineering or manufacturing)that are important to customers. Taguchi opposesthe manufacturing-based definition of quality due tobuilt-in defects to be produced at a higher cost.
Customer-driven quality is meeting or exceedingcustomer expectations. This definition is simple andpowerful; hence, most companies use it.
A Japanese professor, Noriaki Kano, suggestedthree classes of customer requirements in under-standing customer’s needs in the marketplace: dis-satisfiers, satisfiers, and delighters. Customers aredissatisfied when the features that they assumed orexpected are not present in a product. Customersare satisfied when the features that they wanted arepresent in a product, although those features are notexpected. Customers are delighted when the fea-tures that they did not assume or expect are presentin a product because the features exceed their expec-tations.
Critical-to-quality (CTQ) is a quality measure-ment technique that dictates a product’s output spec-ifications in terms of a customer’s needs, wants, andexpectations, whether the customer is internal or ex-ternal to an organization. CTQ focuses on customerrequirements, design and test parameters, mistake-proofing, quality robustness, and control charts.
❑ Learning Objective 4.3:CALCULATE THE COSTOF QUALITYThe cost of quality (COQ) means the price of non-conformance to standards, policies, or procedures.COQ is the cost of doing things wrong, which re-sults in poor quality of products or services. COQ isreally the cost of poor quality.
Four categories of COQ are:
1. Prevention costs are associated with reducingthe potential for producing defective products
or rendering poor-quality services in the firstplace. Examples include quality improvementprograms, employee training and education, in-vestment in equipment and facilities, operator in-spection costs, supplier ratings, supplier reviews,supplier certification, product design reviews,pilot projects, prototype tests, vendor surveys,quality-related design costs, purchase-order tech-nical data reviews, and quality department reviewcosts.
2. Appraisal costs are associated with evaluatingproducts, processes, parts, or services. Examplesinclude material testing, product testing, produc-tion line inspection, quality checks, purchasingappraisal costs, qualifications of supplier product,equipment calibration, receiving and shipping in-spection costs, production tests, and product qual-ity audits.
3. Internal failure costs are associated with produc-ing defective products or rendering poor-qualityservices before delivering them to customers.Examples include repair, redesign, reinspection,rework, retesting, sorting, scrap, waste, machinedowntime, employee fatigue, and employee care-lessness.
4. External failure costs are associated with correct-ing defective products or poor-quality services af-ter delivering them to customers. Examples in-clude product returns, product warranty charges,product recalls, liability suits resulting from dam-age to customers, field service staff training costs,lost customer goodwill, and poor reputation toa firm.
A $1.00 investment in a prevention category willreduce many dollars of internal and external failurecosts, which in turn will improve overall product orservice quality many times over.
Quality costs can be reported as an index—the ratioof the current value to a base period value—and ex-pressed as a percentage or as a fraction. The qualitycost index increases the understanding of the under-lying cost data. Some common measurement basesinclude direct labor cost, manufacturing cost, salesdollars, and units of production.
❑ Learning Objective 4.4:CALCULATE THE SIX-SIGMAMETRICSix-Sigma is a statistical concept to describe accu-racy and quality levels in a process, product, or ser-vice, which can lead to a competitive advantage inthe marketplace. The word sigma is associated with

JWBT150-Vallabhaneni c04 July 14, 2009 8:25
LEARNING OBJECTIVE 4.4: CALCULATE THE SIX-SIGMA METRIC 95
a statistical term, standard deviation, which is thedistance from the mean (average).
Six-Sigma is a strategy, discipline, system, pro-gram, and tool to achieve quality improvement con-tinuously, to solve problems, to improve functionsand features of a product or service, to reduce costand time, and to increase customer satisfaction.
Meaning of Different Sigma Levels
� Three-Sigma means 66,800 defects in a millionparts produced.
� Four-Sigma means 6,210 defects in a millionparts produced.
� Five-Sigma means 230 defects in a million partsproduced.
� Six-Sigma means 3.4 defects in a million partsproduced.
� The goal of reaching Six-Sigma from Three-Sigma is a challenging one as it is a nonlinearprocess to reach the goal.
Six-Sigma follows an improvement model calledDMAIC, which stands for define, measure, analyze,improve, and control stage. D defines the project’spurpose, scope, and outputs, M measures the pro-cess and collects data, A analyzes the data to ensurerepeatability and reproducibility, I improves or re-designs the existing process, and C controls the newor modified process for increased performance.
Implementing a Six-Sigma program requires astrong commitment from employees and manage-ment in terms of time, training, and expertise.
Six-Sigma redefines quality performance as de-fects per million opportunities (dpmo) and is cal-culated as:
dpmo = (Defects per Unit)× 1,000,000/Opportunities for Error
whereDefects per Unit = Number of DefectsDiscovered/Number of Units Produced
Tools and Techniques Used in DMAIC Model
Examples of tools and techniques used in the De-fine stage include brainstorming, cause-and-effect diagram, and process mapping.
Examples of tools and techniques used in the Mea-sure stage include cause-and-effect diagramand process mapping.
Examples of tools and techniques used in the An-alyze stage include regression and correlationanalysis and process mapping.
Examples of tools and techniques used in the Im-prove stage include brainstorming, simulation,design of experiments, and process mapping.
Examples of tools and techniques used in theControl stage include mistake-proofing (Poka-yoke), statistical process control, and controlcharts.
Design for Six SigmaDesign for Six-Sigma (DFSS) is a proactive ap-proach in preventing problems from occurring inthe first place and/or in resolving problems afterthey occur. The focus is on functional and qualityimprovement at the early design stage. An approachto DFSS is established in terms of DCOV model,which stands for define, characterize, optimize, andverify.
Tools and Techniques Used in DCOV Model
Examples of tools and techniques used in the De-fine stage include Kano model, quality functiondeployment (QFD), and regression and con-joint analysis.
Examples of tools and techniques used in theCharacterize stage include design of experi-ments and TRIZ (a problem-solving tool).
Examples of tools and techniques used in the Opti-mize stage include design of experiments, sim-ulation, mistake-proofing, and control charts.
Examples of tools and techniques used in the Ver-ify stage include design walkthroughs and re-views and product tests.
DFSS is similar to other design concepts such asdesign for manufacturability (e.g., lean productionand standard parts), design for low cost (e.g., over-head costs, supply-chain costs, and quality costs),design for faster production (e.g., flexible manufac-turing and concurrent engineering), design for fastermarketing (e.g., time-to-market, quality function de-ployment, and voice of the customer), design forsafety and ergonomics (e.g., safe products and hu-man factors), design for a better environment (e.g.,pollution control and recycling), and design for ser-viceability (e.g., post-sales activities such as ease ofrepair and maintenance).

JWBT150-Vallabhaneni c04 July 14, 2009 8:25
96 Learning Module 4: Quality and Process Management
Six-Sigma PlayersSeveral Six-Sigma players exist in the planning andimplementation of the Six-Sigma program in an or-ganization, including White Belts (at the bottom),Green Belts, Yellow Belts, Black Belts, Master BlackBelts, Project Champions, and Senior Champions (atthe top of the Six-Sigma hierarchy). All of these play-ers assume defined roles and responsibilities andneed specific training with varying lengths to makethe Six-Sigma program a success.
White Belts are hourly employees needing basictraining in Six-Sigma goals, tools, and techniques tohelp Green Belts and Black Belts on their projects.
Green Belts are salaried employees who have adual responsibility in implementing Six-Sigma intheir function and carrying out their regular dutiesin that function. They gather and analyze data insupport of a Black Belt project and receive a simpli-fied version of Black Belt training. Yellow Belts areseasoned salaried employees who are familiar withquality improvement processes.
Black Belts are salaried employees who have afull-time responsibility in implementing Six-Sigmaprojects. They require hard skills and receive exten-sive training in statistics and problem-solving anddecision-making tools and techniques, as they trainGreen Belts. Black Belts are very important to Six-Sigma’s success.
Master Black Belts are also salaried employeeswho have a full-time responsibility in implementingSix-Sigma projects. They require soft skills, needsome knowledge in statistics, and need more knowl-edge in problem-solving and decision-making toolsand techniques, as they train Black Belts and GreenBelts.
Senior Champions are sponsors and executivesin a specific business function and manage severalProject Champions at the business unit level, whoin turn manage specific projects. Senior Championsdevelop plans, set priorities, allocate resources, andorganize projects. Project Champions deploy plans,manage projects that cut across the business func-tions, and provide managerial and technical guid-ance to Master Black Belts and Black Belts. All cham-pions require soft skills.
Which Six-Sigma Player Does What?
White Belts help Green Belts and Black Belts.Green Belts help Black Belts.Black Belts help Master Black Belts.
Master Black Belts help Project Champions.Project Champions help Senior Champions.Senior Champions decide what gets done while
Project Champions, Master Black Belts, andBlack Belts decide how to get it done.
❑ Learning Objective 4.5:COMPUTE THE RETURN-ON-QUALITY METRICReturn on quality (ROQ) is similar to return on in-vestment (ROI) in terms of measurement, requiringthe same attention as ROI. Quality improvement ini-tiatives have a direct financial impact, which cannotbe ignored.
ROQ is similar to COQ in terms of measurementexcept that COQ takes an internal perspective suchas costs and defects and ROQ takes an external per-spective such as revenues and customer satisfaction.
Comparison among COQ, ROQ, and CTQ
COQ takes an internal perspective.ROQ takes an external perspective.CTQ takes both internal and external customer
perspectives.
ROQ measures expected revenue gains against ex-pected costs associated with quality improvementinitiatives. ROQ is computed as net present value(NPV) of benefits resulting from quality improve-ment initiatives divided by NPV of costs associatedwith quality improvement initiatives minus 1.0.
Return on quality (ROQ), expressed as a percent-age, is computed as:
ROQ = [(Net Present Value of Quality Benefits)/(Net Present Value of Quality Costs)] − 1.00
The result is multiplied by 100 to get the percentage.All benefits and costs are multiplied with the cor-
responding present value factors to result in NPV ofbenefits and costs respectively.
❑ Learning Objective 4.6:APPLY QUALITY TOOLSSeveral quality tools exist that can be used to an-alyze processes, prioritize problems, report the re-sults, and evaluate the results of a corrective actionplan. Quality tools consist of quality control toolsand quality management tools.

JWBT150-Vallabhaneni c04 July 14, 2009 8:25
LEARNING OBJECTIVE 4.6: APPLY QUALITY TOOLS 97
Seven Quality Control ToolsCheck sheets are used for collecting data in a logicaland systematic manner.
A histogram is a frequency-distribution diagramin which the frequencies of occurrences of the differ-ent variables being plotted are represented by bars.
A scatter diagram is a plot of the values of one vari-able against those of another variable to determinethe relationship between them. These diagrams areused during analysis to understand the cause-and-effect relationship between two variables. Scatter di-agrams are also called correlation diagrams.
A Pareto diagram is a special use of the bar graphin which the bars are arranged in descending orderof magnitude. The purpose of Pareto analysis, usingPareto diagrams, is to identify the major problems ina product or process or, more generally, to identifythe most significant causes for a given effect. Thisallows a developer to prioritize problems and decidewhich problem area to work on first.
A flowcharting tool can be used to document everyphase of a company’s operation, for example, fromorder taking to shipping in a manufacturing com-pany. It will become an effective way to break downa process or pinpoint a problem. Flowcharting canbe done at both the summary level and the detailedlevel serving different user needs.
One form of a cause-and-effect (C&E) diagram isused for process analysis when a series of events orsteps in a process creates a problem and it is notclear which event or step is the major cause of theproblems. Each process or subprocess is examinedfor possible causes; after the causes from each step inthe process are discovered, significant root causes ofthe problem are selected, verified, and corrected. TheC&E diagram is also called a fishbone or Ishikawadiagram, invented as a problem-solving tool.
Stratification helps the C&E diagram because it isa procedure used to describe the systematic sub-division of population or process data to obtain adetailed understanding of the structure of the popu-lation or process. It is not to be confused with a strat-ified sampling method. Stratification can be used tobreak down a problem to discover its root causes andcan establish appropriate corrective actions, calledcountermeasures.
A control chart assesses a process variation. Thecontrol chart displays sequential process measure-ments relative to the overall process average andcontrol limits. The upper and lower control limitsestablish the boundaries of normal variation for theprocess being measured.
Seven Quality Management ToolsAn affinity diagram is a data-reduction tool that or-ganizes a large number of qualitative inputs into asmaller number of major categories. These diagramsare useful in analyzing defect data and other qualityproblems and useful in conjunction with cause-and-effect diagrams or interrelationship digraphs.
A tree diagram can be used to show the relation-ships of a production process by breaking it downfrom few larger steps into many smaller steps. Thegreater the detail of steps, the better simplified theyare. Quality improvement actions can progress fromthe rightmost of the tree to the leftmost.
A process decision program chart is a preventivecontrol tool that prevents problems from occurringin the first place and mitigates the impact of prob-lems that do occur. From this aspect, it is a contin-gency planning tool. The objective of the tool is todetermine the impact of the “failures” or problemson project schedule.
A matrix diagram is developed to analyze thecorrelations between two groups of ideas with theuse of a decision table. This diagram allows oneto systematically analyze correlations. Quality func-tion deployment (QFD) is an extension of the matrixdiagram.
An interrelationship digraph is used to organizedisparate ideas. Arrows are drawn between relatedideas. An idea that has arrows leaving it but noneentering is a root idea. More attention is then given tothe root ideas for system improvement. The digraphis often used in conjunction with affinity diagrams.
Prioritization matrices are used to help decision-makers determine the order of importance of theactivities being considered in a decision. Key issuesand choices are identified for further improvement.These matrices combine the use of a tree diagramand a matrix diagram.
Activity network diagrams are project manage-ment tools to determine which activities must be per-formed, when they must be performed, and in whatsequence. These diagrams are similar to programevaluation and review technique (PERT) and criti-cal path method (CPM), the popular tools in projectmanagement. Unlike PERT and CPM, activity net-work diagrams are simple to construct and requireless training to use.
Other ToolsProcess mapping is flowcharting of a work processin detail, including key measurements.

JWBT150-Vallabhaneni c04 July 14, 2009 8:25
98 Learning Module 4: Quality and Process Management
Design of experiments deals with planning, con-ducting, analyzing, and interpreting controlled teststo evaluate the factors that control the value of aparameter (e.g., design specification tolerance).
Quality function deployment (QFD) is a struc-tured method in which customer requirements aretranslated into appropriate technical requirementsfor each stage of product development and man-ufacturing. Input for the QFD process comes fromlistening to the voice of the customer (VOC). Thehouse of quality (HOQ) is a diagram that clarifiesthe relationship between customer needs and prod-uct features. It helps correlate market or customerrequirements and analysis of competitive productswith higher-level technical and product characteris-tics. The diagram, which makes it possible to bringseveral factors into a single figure, is named for itshouse-shaped appearance but sometimes is referredto as QFD, a sign of the connection between the threeapproaches of VOC, QFD, and HOQ.
❑ Learning Objective 4.7:APPLY STATISTICAL PROCESSCONTROL TECHNIQUESManagement’s goal is to reduce causes of processvariation and to increase process capabilities to meetcustomer expectations.
Process VariationVariation is present in every process as a result ofa combination of four variables: (1) operator vari-ation (due to physical and emotional conditions),(2) equipment variation (due to wear and tear),(3) materials variation (due to thickness, moisturecontent, and old and new materials), and (4) envi-ronmental variation (due to changes in temperature,light, and humidity). Variation is either expected orunexpected, and it results from common causes, spe-cial causes, or structural causes.
Variation affects proper functioning of a processin that process output deviates from the establishedtarget Common causes of variation affect the stan-dard deviation of a process and are caused by fac-tors internal to a process. These causes, which arepresent in all processes, are also called chance (ran-dom) causes. Chance causes are small in magni-tude and are difficult to identify. Examples of com-mon random causes include worker availability,number and complexity of orders, job schedules,
equipment testing, work-center schedules, changesin raw materials, truck schedules, and worker per-formance.
Special causes affect the standard deviation of aprocess and are factors external to a process. Specialcauses, also known as assignable causes, are large inmagnitude and are not so difficult to identify. Theymay or may not be present in a process. Examples ofspecial (assignable) causes include equipment break-downs, operator changes, new raw materials, newproducts, new competition, and new customers.
Structural causes affect the standard deviation ofa process; they are factors both internal and exter-nal to a process. They may or may not be presentin a process; they are a blend of common and spe-cial causes. Examples of structural causes includesudden sales/production volume increase due to anew product or a new customer, seasonal sales, andsudden increase in profits.
A control chart is a statistical tool that distin-guishes between natural (common) and unnatural(special) variations. The control chart method is usedto measure variations in quality. The control chart isa picture of the process over time. It shows whethera process is in a stable state and is used to improvethe process quality.
Natural variation is the result of random causes.Management intervention is required to achievequality improvement or quality system. It has beenstated that 80 to 85 percent of quality problems aredue to management or the quality system and that15 to 20 percent of problems are due to operatorsor workers. Supervisors, operators, and technicianscan correct the unnatural variation. Control chartscan be drawn for variables and attributes.
The control chart method for variables is a meansof visualizing the variations that occur in the centraltendency and dispersion of a set of observations. Itmeasures the quality of a particular characteristic,such as length, time, or temperature.
A variable chart is an excellent technique forachieving quality improvement. True process capa-bility can be achieved only after substantial qualityimprovements have been made. Once true processcapability is obtained, effective specifications can bedetermined. The figure shows the sequence of eventstaking place with the control chart.
Variable chart → Quality improvement→ Process capability→ Specifications

JWBT150-Vallabhaneni c04 July 14, 2009 8:25
LEARNING OBJECTIVE 4.7: APPLY STATISTICAL PROCESS CONTROL TECHNIQUES 99
To improve the process continuously, variable con-trol charts can be used to overcome the limitationsof the attribute control charts. Continuous processimprovement is the highest level of quality con-sciousness. Control charts based on variable data re-duce unit-to-unit variation, even within specificationlimits. Variable data consist of measurements suchas weight, length, width, height, time, and temper-ature. Variable data contain more information thanattribute data. Variable control charts can decreasethe difference between customer needs and processperformance.
The attribute chart refers to those quality charac-teristics that conform to specifications (specs) or donot conform to specifications. It is used where mea-surements are not possible, such as for color, missingparts, scratches, or damage. Quality characteristicsfor a product can be translated into a go/no-go deci-sion, as follows.
Go/No-Go Decision for Product Quality
Go conforms to specifications.No-go does not conform to specifications.
Two types of attribute control charts exist: (1) thechart for nonconforming units and (2) the chart fornonconformities. A nonconforming unit is a prod-uct or service containing at least one nonconformity.A nonconformity is a departure of quality charac-teristic from its intended level that is not meeting aspecification requirement.
Two types of statistical errors in quality can occur,leading to incorrect decisions, as follows: Type I er-ror is called producer’s risk (alpha risk), which is theprobability that a conforming (good quality) productwill be rejected as poor quality product and not soldto customers. This product meets the established ac-ceptable quality level. This results in an incorrect de-cision to reject something when it is acceptable. TypeII error is called consumer’s risk (beta risk), whichis the probability that a nonconforming (poor qual-ity) product will be accepted as good quality productand sold to customers. This results in an incorrect de-cision to accept something when it is unacceptable.Type II error occurs when statistical quality data failsto result in the scrapping or reworking of a defectiveproduct.
Stable and unstable processes are defined as fol-lows. When only chance causes of variation arepresent in a process, the process is considered to
be in a state of statistical control (i.e., the process isstable and predictable). When a process is in con-trol (stable), there is a natural pattern of variation,and only chance causes of variation are present.Small variations in operator performance, equip-ment performance, materials, and environmentalcharacteristics are expected and are considered tobe part of a stable process. Further improvementsin the process can be achieved only by changingthe input factors, that is, operator, equipment, ma-terials, and environment. These changes require ac-tion by management through quality improvementideas.
When an assignable cause of variation is present ina process, it is considered to be out of statistical con-trol (i.e., the process is unstable and unpredictable).When an observed measurement falls outside itscontrol limits, the process is said to be out of con-trol (unstable). This means that an assignable causeof variation is present. The unnatural, unstable vari-ation makes it impossible to predict future variation.The assignable causes must be found and correctedbefore a natural, stable process can continue.
Process CapabilityProcess capability is a production process’s abilityto manufacture a product within the desired expec-tations of customers. The process capability index(PCI), which indicates whether a process is capableof meeting customer expectations, must be equal toor greater than 1.00 to meet customer expectations.A PCI of less than 1.00 means that the process doesnot meet customer expectations.
The PCI is computed in several ways:
PCI = (UL − LL)/(6 × Standard Deviation of a Process)
where UL is upper specification limit and LL islower specification limit. Upper specification limitmeans some data points will be above the central linein a control chart. Lower specification limit meanssome data points will be below the central line in acontrol chart.
Capability ratio (Cp) is specification tolerancewidth divided by the process capability. Specifica-tion tolerance width refers to variability of a param-eter permitted above or below a nominal value. Cpis a widely used PCI.

JWBT150-Vallabhaneni c04 July 14, 2009 8:25
100 Learning Module 4: Quality and Process Management
❑ Learning Objective 4.8:COMPUTE TAGUCHI’S QUALITYLOSS FUNCTIONTaguchi believes that variation in a production pro-cess can be reduced by designing products that per-form in a consistent manner, even under conditionsof varying or adverse use. He emphasizes proactivesteps at the design stage instead of late, reactive stepsat the production stage.
Taguchi believes in pushing a process upstream tofocus on product and process design, which is calledoffline quality control. This is contrary to onlinequality control, where traditional quality control ac-tivities take place in downstream with the focus onfinal inspection procedures, sampling methods, andstatistical process control (SPC) techniques. Offlinequality control methods reduce costs and defects.
Taguchi uses quality engineering and statistical ex-perimental design methods to reduce all process andproduct variations from the target value with thegoal of producing a perfect product.
Taguchi views quality engineering as composedof three elements: system design, parameter design,and tolerance design.
Taguchi developed three related concepts usingstatistical experimental design: quality robustness,quality loss function (QLF), and target-orientedquality. The QLF measures quality in monetary unitsthat reflect both short- and long-term losses.
Quality robustness means products are consis-tently produced despite adverse manufacturing andenvironmental conditions. The goal is to remove theeffects of adverse conditions, which is less expensiveto do, instead of removing the causes, which is moreexpensive to do. It is assumed that small variationsin materials and process do not destroy the overallproduct quality.
A QLF identifies all costs associated with poorquality and shows how these costs increase as theproduct moves away from the target value. Exam-ples of costs included in the QLF are customer dissat-isfaction costs, warranty costs, service costs, internalinspection costs, equipment or product repair costs,scrap costs, and overall costs to society due to badreputation and loss of goodwill. The QLF conceptcan be equally applied to products and services.
Target-oriented quality is a philosophy of contin-uous improvement, where the goal is to bring theproduct exactly on target, instead of falling withinthe tolerance limits, where the latter is too sim-plistic and costly to customers. Traditionally, prod-ucts are manufactured using conformance-oriented
specifications with tolerance limits allowed. Taguchiopposes conformance to specification limits dueto built-in tolerance range, which allows defectiveproducts to be produced. He advocates manufactur-ing a perfect product at the desired specifications,with no tolerance limits and at a relatively low cost.
The QLF is computed as:
L = D2 × C
where L is loss to society, D2 is the distance fromthe target value, and C is cost of the deviation at thespecification limit. The smaller the loss, the more de-sirable the product. However, the farther the productis from the target value, the greater the loss. QLF iszero when a product is produced at the target valueand rises exponentially as the product is producedto meet the tolerance limits.
❑ Learning Objective 4.9:UNDERSTAND THE ROLE OFINSPECTION AND QUALITYAT SOURCEInspection is a means of ensuring that an operationor a process is producing at the expected qualitylevel. The best processes have little variation fromthe standard level. Three basic issues relating to in-spection (audit) are what to inspect, when to inspect,and where to inspect. The audit can take place at sev-eral places and several times:
� At supplier’s plant while the supplier is producinggoods such as raw materials, ingredients, parts, orcomponents
� At company facility upon receipt of goods fromthe supplier
� During the company’s production processes, ei-ther in-house or outside
� Before delivery to the customer
Source inspection means individual employeesare checking their own work with proper trainingand empowerment before they pass their work tothe next employee, who is considered an internalcustomer. Inspectors may be using a checklist, asampling plan, and controls such as failsafe devices(Poka-yoke) for mistake-proofing.
Inspection rules help inspectors to prioritize whereinspection should be performed. The inspectionpriority index is computed as:
Inspection Priority Index = Cost of Inspection/
Cost of Failure

JWBT150-Vallabhaneni c04 July 14, 2009 8:25
LEARNING OBJECTIVE 4.10: UNDERSTAND THE PROCESS MANAGEMENT METHODS AND TOOLS 101
If the index is less than 1.0, that item should be in-spected first; if the index is greater than 1.0, that itemshould be inspected last.
Two other inspection methods include in-processinspection, where all work is inspected at each stageof the production process, and N = 2 technique,where the first and last pieces in a supplier’s ship-ment lot are checked to see whether they meet thespecification. If they do, then the entire shipment lotis accepted. The N = 2 technique is an alternative toacceptance sampling, where a lot is accepted if twoor fewer defects are found and rejected if more thantwo defects are found.
Quality at the source is a defect- or error-prevention technique with greater visibility of imme-diate results and with a decentralized control wherethe first and local action is taking place. The sourcecould be (1) where raw materials, ingredients, parts,and components are inspected as they are received,used, or stored, (2) where purchased parts and com-ponents are fabricated, or (3) where fabricated partsand components are assembled into a finished prod-uct with other items. It is always better to detect thedefects and errors at the beginning rather than atthe end of a process. Quality at the source, whichmeans finding defects or errors and taking immedi-ate corrective action, requires employee training andempowerment.
❑ Learning Objective 4.10:UNDERSTAND THE PROCESSMANAGEMENT METHODSAND TOOLSProcess management methods include businessprocess reengineering (BPR), business process im-provement (BPI), continuous process improvement(CPI), and business process redesign (BPD).
BPR identifies, analyzes, and redesigns an orga-nization’s core business processes with the aim ofachieving dramatic improvements in critical per-formance measures, such as cost, quality, service,and speed. BPR recognizes that an organization’sbusiness processes are usually fragmented into sub-processes and tasks that are carried out by sev-eral specialized functional areas within the organi-zation. Often no one is responsible for the overallperformance of the entire process. Reengineeringmaintains that optimizing the performance of sub-processes can result in some benefits, but cannotyield dramatic improvements if the process itself isfundamentally inefficient and outmoded. For that
reason, reengineering focuses on redesigning theprocess as a whole in order to achieve the great-est possible benefits to the organization and theircustomers. This drive for realizing dramatic im-provements by fundamentally rethinking how theorganization’s work should be done distinguishesreengineering from business process improvementefforts that focus on functional or incrementalimprovement.
BPI tends to be more of an incremental changethat may affect only a single task or segment ofthe organization. The concept of fundamental orradical change is the basis of the major differencebetween BPR and BPI. Quite often BPI initiativeslimit their focus to a single existing organizationalunit. This in itself breaks one of the tenets of BPR,which is that BPR must focus on redesigning a fun-damental business process, not on existing depart-ments or organizational units. While BPR seeks todefine what the processes should be, BPI focusesmore on how to improve an existing process orservice.
CPI focuses on both incremental and dramaticimprovements to provide better product and ser-vice quality but also on the need to be responsiveand efficient in achieving a competitive advantagein the marketplace. Two types of CPI are proac-tive and reactive tools. Examples of reactive toolsinclude check sheets, histograms, scatter diagrams,Pareto diagrams, flowcharts, cause-and-effect dia-grams, and control charts. Examples of proactivetools include the five principles of Kawakita Jiro(KJ): 360-degree view, steppingstone approach, un-expected situations, intuitive capability, and realcases and personal experiences.
BPD focuses on both internal and external cus-tomers to increase sales, cut costs, increase prof-its, and improve service. It dictates what processesshould be redesigned (changed) and in what se-quence. Once a process is redesigned, it must becontinually monitored, reassessed, changed, and im-proved in order to meet changing demands on theorganization
Process management tools include benchmark-ing and best practices, which involves selecting ademonstrated standard of products, services, costs,processes, or practices that represent the very bestperformance in an industry and following themin an organization. It is a standard of compar-ison between two or more organizations. Thereare many types of benchmarking, including inter-nal, competitive, industry, best-in-class, process, andstrategic.

JWBT150-Vallabhaneni c04 July 14, 2009 8:25
102 Learning Module 4: Quality and Process Management
Which Benchmarking Does What?
Internal benchmarking looks downward and in-ward.
Competitive benchmarking looks outward.Industry benchmarking looks for trends. It pro-
vides a short-run solution and a quick fix to aproblem.
Best-in-class benchmarking looks for the best allaround. It provides a quantum jump in im-provement.
Process benchmarking is specific.Strategic benchmarking is broad with big impact.
Self-Assessment Exercise
Online exercises are provided for the learn-ing objectives in this module. Please visitwww.mbaiq.com to complete the online exercisesand to calculate your MBA IQ Score.

JWBT150-Vallabhaneni c05 July 28, 2009 18:30
LEARNING MODULE 5
Human Resources Management
Learning Objective 5.1: Understandthe Human Resources PlanningProcess 103
Learning Objective 5.2: Understand theRelationship between Job Analysisand Job Descriptions 104
Learning Objective 5.3: Understand theRecruitment Methods andAlternatives 105
Learning Objective 5.4: Understand theEmployee Selection Process 106
Learning Objective 5.5: Understand theEmployee Selection Tests and theirCharacteristics 107
Learning Objective 5.6: Understand theEmployment Interview Process 108
Learning Objective 5.7: Understand thePre-Employment Screening Process 108
Learning Objective 5.8: Understand theEmployee Training and DevelopmentProcess 109
Learning Objective 5.9: Understand theManagement Development Process 110
Learning Objective 5.10: Understandthe Organization DevelopmentProcess 111
Learning Objective 5.11: Understandthe Career Planning andDevelopment Process 112
Learning Objective 5.12: Understandthe Employee Performance AppraisalProcess 113
Learning Objective 5.13: Understandthe Employee Relations Issues 114
Learning Objective 5.14: Compute theHuman Capital Metrics 116
❑ Learning Objective 5.1:UNDERSTAND THE HUMANRESOURCES PLANNING PROCESSHuman resources (HR) planning is part of an orga-nization’s strategic planning. The HR planning pro-cess is a systematic approach of matching the inter-nal and external supply of people with job openingsanticipated over a specified period of time. Specifi-cally, it includes three major elements: (1) forecast-ing HR requirements, (2) forecasting HR availabil-ity, and (3) comparing HR requirements with HRavailability.
In forecasting HR requirements, the demand foremployees is matched against the supply of em-ployees. If they are equal, no action is necessary.Several methods exist to forecast the HR require-ments, including zero-based forecasting, bottom-upapproach, simulation models, and relating sales vol-ume to the number of employees needed.
In forecasting HR availability, the number of em-ployees with the required skills and at the required
locations is determined. The needed employees maybe found internally, externally, or a combination. Ifa shortage is forecasted, the needed employee maycome from developing creative recruiting methods,increasing compensation incentives to employees,conducting special training programs, and using dif-ferent selection standards, such as lowering employ-ment requirements in terms of hiring an inexperi-enced employee and providing on-the-job trainingto that employee.
In comparing HR requirements with HR avail-ability, a situation of surplus workers may exist.This surplus can be handled through various re-duction methods such as restricted hiring, reducedwork-hours, encouraging early retirements, manda-tory layoffs, or even downsizing the department orthe company.
Downsizing, also known as restructuring andrightsizing, is a reduction in the number of peo-ple employed. It occurs for several reasons, suchas offshoring; outsourcing; merging with othercompanies; acquiring other companies; closing or
103

JWBT150-Vallabhaneni c05 July 28, 2009 18:30
104 Learning Module 5: Human Resources Management
relocating plants, offices, and warehouses; or restruc-turing the organization to meet or beat competitionand to increase efficiency, productivity, and prof-itability. Excess employees will be laid off, whichis dictated by bumping procedures if the companyis unionized. Bumping procedures are layoff proce-dures based on job seniority where the least senioremployee will be laid off first. Non-union companiesshould document layoff procedures prior to facingdownsizing decisions.
Positive aspects of downsizing include increasedefficiency, productivity, and profitability, and meet-ing competition. Negative aspects of downsizinginclude (1) cost of termination and severance payfor laid-off employees, (2) employees seeking bet-ter job opportunities elsewhere due to low morale,loss of loyalty, and job insecurity, (3) loss of con-trols, culture, institutional memory, and knowledge,(4) difficulty in getting promoted due to few lay-ers of management left, (5) more work is spreadamong few remaining employees, resulting in stress,(6) higher costs to bring back former employees asindependent contractors when sales are increasing,and (7) increased number of discrimination lawsuitsif a disparate treatment is proved in courts due torace, age, and gender violations, unless protected byemployee performance evaluations.
Outplacement is a proactive response on the partof company management to soften the negative im-pact of job displacement where it will provide jobassistance to laid-off employees in finding employ-ment elsewhere. This outplacement service providesa positive feeling to both laid-off and remainingemployees because it indicates that the companydoes in fact care about its employees. Typical out-placement services include career guidance, effectiveresume writing practices, successful interviewingtechniques, self-assessment of current knowledge,skills, and abilities (KSAs), and retooling the KSAsneeded for a new job or career.
❑ Learning Objective 5.2:UNDERSTAND THERELATIONSHIP BETWEEN JOBANALYSIS AND JOBDESCRIPTIONSA job consists of a group of tasks that must be per-formed to achieve defined goals. A position is thecollection of tasks performed and responsibilities as-sumed by one employee. There should be a definiteposition for every employee in an organization.
Job analysis is the systematic process of determin-ing the skills, duties, and knowledge required forperforming a specific job. Timeliness of conductingthe job analysis is critical as new jobs are created andold jobs are redesigned or eliminated.
Job analysis provides a summary of a job’s dutiesand responsibilities; its relationship to other jobs; theknowledge, skills, and abilities (KSAs) required; andworking conditions under which a job is performed.Job facts are gathered, analyzed, and recorded as thejob exists now, not as the job should exist. Industrialengineers and HR analysts often design jobs in termsof determining how a job should exist.
Job analysis is conducted after the job has beendesigned, an employee has been trained to do thework, and when that employee is performing thejob (i.e., working).
Job Design → Employee Training and Working→ Job Analysis
Job design is the process of determining the spe-cific tasks to be performed, the methods used in per-forming these tasks, and how the job relates to otherjobs in an organization. Job design should apply mo-tivational theories for improving employee produc-tivity and satisfaction, which are achieved throughjob simplification, job rotation, job enlargement, andjob enrichment.
Typically, job analysis is performed on four occa-sions: (1) when a job analysis program is initiatedfor the first time in a company, (2) when new jobsare created, (3) when current jobs are changed dueto new technologies, procedures, or systems, and(4) when the nature of a job is changed.
Several methods exist to perform the job analysis,including questionnaires, observations, interviews,employee recordings of daily work activities, and acombination of these methods.
Different types and amounts of information areneeded to conduct a thorough job analysis, includ-ing (1) work activities, such as procedures used onthe job, (2) worker-oriented activities, such as actionsand communications required for the job, (3) workfacilitating tools used, such as machines, equipment,and work aids, (4) job-related information, such asmaterials processed, products made, services ren-dered, and related knowledge required, (5) workperformance levels, such as standards and measure-ments, (6) job context, such as work schedules andworking conditions, and (7) personal requirements,such as experience, education, and training needed.
The output of the job analysis is used as inputto prepare job descriptions and job specifications,

JWBT150-Vallabhaneni c05 July 28, 2009 18:30
LEARNING OBJECTIVE 5.3: UNDERSTAND THE RECRUITMENT METHODS AND ALTERNATIVES 105
where job specifications can be a part of the jobdescription document. The job description docu-ment contains essential functions performed andtasks, duties, and responsibilities required of the job.The job specification document contains the min-imum acceptable qualifications (e.g., skills, educa-tion, and experience) an employee should possessin order to perform a specific job. Normally, both ofthese documents are combined into one documentwith an effective date and expiration date listed toidentify job changes.
Job Analysis → Job Descriptions→ Job Specifications
Job descriptions must be relevant and accurate interms of what employees are expected to do on thejob, how they do the job, and the conditions underwhich the job duties are performed. Both job analysisand job description documents must be shared withthe employee and his supervisor to ensure that theyare clear and understandable to both parties and toensure employee empowerment. This sharing willmake the employee more productive and coopera-tive with others.
Major reasons for conducting job analysis anddeveloping job descriptions and job specificationsinclude (1) providing input into the HR planningprocess, (2) providing input into employee recruit-ment and selection process, (3) planning employeetraining and development programs, (4) conductingemployee performance appraisals, (5) setting em-ployee compensation systems, (6) developing em-ployee health and safety programs, (7) handlingemployee and labor relations in terms of promotion,transfer, or demotion, and (8) supporting the legal-ity of employment practices to defend decisions in-volving terminations, promotions, transfers, and de-motions. These major reasons in turn become majorbenefits to all.
Four job design approaches are as follows:
1. Job simplification focuses on task efficiency byreducing the number of tasks an employee mustdo. Tasks must be designed to be simple, repeti-tive, and standardized. However, this leads to jobdissatisfaction due to boredom, resulting in em-ployee sabotage, absenteeism, and unionization.
2. Job rotation is moving an employee from one jobto another, thereby exposing him to a variety ofjobs and to their complexity.
3. Job enlargement is increasing the number of tasksa worker performs, with all of the tasks completed
at the same level of responsibility. Job enlarge-ment provides job variety and challenge and is aresponse to dissatisfaction found in job simplifi-cation.
4. Job enrichment is change in the content and re-sponsibility level of a job so as to provide greatercontrol and challenge to the worker. Job enrich-ment leads to employee recognition, opportuni-ties for learning and growth, decision-making,motivation, and job satisfaction.
Job Enlargement versus Job Enrichment
Job enlargement adds width to a job.Job enrichment adds depth to a job.
❑ Learning Objective 5.3:UNDERSTAND THERECRUITMENT METHODSAND ALTERNATIVESRecruitment is the process of attracting qualified in-dividuals on a timely basis and in sufficient numbersto fill required jobs, based on job descriptions and jobspecifications.
External factors such as labor market considera-tions (e.g., demand and supply) and legal consid-erations such as nondiscriminatory practices (e.g.,gender, race, and ethnicity) affect an organization’srecruitment efforts. Similarly, internal factors suchas promotion policies (e.g., promotion from within)also affect recruitment efforts.
External recruitment sources include high schoolsand vocational schools, community colleges, tradi-tional colleges and universities, graduate schools,competitor companies, former employees, unem-ployed, military personnel, and self-employedworkers.
External recruitment methods include mediaadvertising, employment agencies, company re-cruiters, job fairs, internships, executive searchfirms, professional associations, unsolicited appli-cants, open houses, event recruiting, and high-techcompetitions using electronic games.
Internal recruitment sources and methods in-clude job posting, job bidding, employee referrals,and employee enlistment.
Online recruitment sources and methods includeInternet/cyber recruiter, virtual job fairs, corpo-rate career web sites, weblogs (blogs), general em-ployment recruiter web sites, contract/contingentworker web sites, and hourly workers’ job web sites.

JWBT150-Vallabhaneni c05 July 28, 2009 18:30
106 Learning Module 5: Human Resources Management
Alternatives to recruitment include outsourcing,contingent/contract workers, employee leasing, andovertime to meet short-term workload fluctuations.
Recruitment for diversity focuses on equal em-ployment legislation, which outlaws discriminationof protected groups in employment based on race,religion, sex, color, national origin, age, disability,and other factors. This requires that recruiters mustbe trained in the use of objective, job-related stan-dards, such as use of employee selection devices thatpredict job performance and success. Two importantconcepts are at work here: disparate treatment andadverse impact. Disparate treatment means that anemployer treats the protected groups less favorablythan others. Adverse impact occurs when womenand minorities (protected groups) are not hired atthe rate of at least 80 percent of the best-achievinggroup, computed as:
Adverse Impact = (Hiring Rate for ProtectedGroup of Applicants)/(Hiring Rate forBest-Achieving Group of Applicants)
where the hiring rate for the protected group of ap-plicants is calculated by dividing the number of theprotected group hired by the total number of quali-fied protected group of applicants available in a pe-riod. Similarly, the hiring rate for the best-achievinggroup of applicants is calculated by dividing thenumber of the best-achieving group hired by thetotal number of qualified best-achieving group ofapplicants available in a period.
Recruiting costs are expensive, especially whenexternal recruiting sources and methods are used.Recruiting cost per hire can be computed as:
Recruiting Cost per Hire = (Total Recruiting Costs)/(Total Number of Recruits Hired)
Recruiting Cost per External Source Employee =(Total Recruiting Costs for External Sources)/(TotalNumber of Recruits Hired from External Sources)
❑ Learning Objective 5.4:UNDERSTAND THE EMPLOYEESELECTION PROCESSEmployee selection is the process of choosing thebest individual from a group of applicants who arewell suited for a specific job.
Several factors affect the employee selection pro-cess, such as (1) competing with other organization’sHR functions in terms of compensation package andsafety and health conditions in a company, (2) meet-
ing legal and regulatory requirements in terms ofnot discriminating against gender, race, and ethnic-ity, (3) speed of decision making in terms of fillingthe job quickly, (4) the type of job that is being filled(e.g., clerk versus senior manager), (5) the type of or-ganization recruiting (e.g., private, government, ornot-for-profit), and (6) the length of the probationaryperiod (e.g., 60 to 90 days).
Applicant pool is the number of qualified appli-cants recruited for a particular job. The expansionand contraction of the labor market affects the sizeof the applicant pool (i.e., a low unemployment rateleads to a small size and a high unemployment rateleads to a large size).
Selection ratio is the number of individuals hiredfor a particular job compared to the total numberof individuals in the applicant pool. This ratio iscomputed as:
Selection Ratio = (Number of Individuals Hired)/(Number of Individuals in the Applicant Pool)
The validity of the selection process can impact theselection ratio.
The goal is to have several qualified applicantsavailable. The selection ratio should be interpretedas follows:
A selection ratio of 1.00 means that there was onlyone qualified applicant available for one open job.
A selection ratio of 0.10 means that there were 10qualified applicants available for one open job.
A selection ratio of less than 1.00 means more choicesare available to make an effective selection deci-sion.
Other metrics related to the employee selectionprocess include acceptance rate and yield rate:
Acceptance Rate = [(Number of ApplicantsAccepted a Job Offer)/(Total Number ofApplicants with a Job Offer Made)] × 100
A low acceptance rate increases recruiting costs andvice versa.
Yield Rate = [(Number of Job ApplicantsMoved to Next Stage of Selection Processfrom Recruiting Source and Method)/(Total Number of Job Applicants fromRecruiting Source and Method)] × 100
The yield rate reveals the effectiveness of a recruitingsource and method.

JWBT150-Vallabhaneni c05 July 28, 2009 18:30
LEARNING OBJECTIVE 5.5: UNDERSTAND THE EMPLOYEE SELECTION TESTS AND THEIR CHARACTERISTICS 107
❑ Learning Objective 5.5:UNDERSTAND THE EMPLOYEESELECTION TESTS AND THEIRCHARACTERISTICSTraditional employee selection tools, such as prelim-inary interview (i.e., telephone or videotaped), em-ployment application, and/or the applicant resume,are not foolproof due to their shortcomings.
Additional selection tests are needed to supple-ment traditional selection tools in order to determinehow employees fit the job and the organization’s cul-ture. These additional tests (pre-employment tests)rate aptitude, personality, abilities (i.e., a can-do atti-tude), and motivation levels (a will-do attitude), andthey have been found to be reliable and accuratepredictors of on-the-job performance.
Pre-employment tests can expose employers tolegal liabilities in terms of a lawsuit from rejectedapplicants claiming that the test was unrelated tothe job or that the test was unfairly discriminatedagainst a protected group. A negligent-hiring law-suit can also be filed by rejected applicants claimingthat they are the victims of a company’s misbehavioror incompetence.
Hiring costs can be costly, especially when there isa judgment error associated with it. There are twotypes of hiring errors: (1) No-Hire error exists whenrejecting a qualified job candidate and (2) Yes-Hireerror exists when accepting an unqualified or lessqualified job candidate. Properly designed, devel-oped, and validated tests administered by compe-tent and reputable professionals can minimize suchhiring errors.
Important characteristics of properly designedselection tests include standardization, objectivity,norms, reliability, and validity. Standardization isthe uniformity of the procedures and conditionsrelated to administering tests. Objectivity occurswhen everyone taking a test obtains the same re-sults. A norm is a standard frame of reference forcomparing an applicant’s performance with that ofothers. Reliability is the extent to which a selectiontest provides consistent results. Validity is the extentto which a test measures what it claims to do, whichshould be job related.
Three approaches to validating selection tests areas follows:
1. The criterion-related validity approach com-pares the scores on selection tests to some aspectsof job performance measures, such as quality and
quantity of work, turnover, and absenteeism. Aclose relationship means that the test is valid.
2. The content validity approach is a sensible andstraightforward method and requires thoroughjob analysis and well-documented job descrip-tions since the approach is not based on statisticalconcepts. The approach can be either performingcertain job-related tasks or completing a paper-and-pencil test that measures relevant job knowl-edge. For example, a data entry operator is givena test to enter data into a computer.
3. The construct validity approach determineswhether a test measures certain traits (e.g., cre-ative or aggressive) relating to the job analysis.This approach needs to be supplemented withother approaches because it is not a primary vali-dating method by itself.
Six types of employment tests include cog-nitive aptitude tests, psychomotor-abilities tests,job-knowledge tests, work-sample tests, vocationalinterest tests, and personality tests. These testsmeasure differences in an individual’s characteris-tics related to job performance. Cognitive aptitudetests determine general reasoning ability, memory,vocabulary, verbal fluency, and numerical ability.Psychomotor-abilities tests measure strength, coor-dination, and dexterity. Job-knowledge tests mea-sure specific knowledge items required of a job, de-rived from job analysis. Work-sample tests focus ondoing some specific tasks (e.g., use of spreadsheets)required of the job and these tests are valid and ac-ceptable to applicants. Vocational interest tests in-dicate the occupation a person is most interested inand the one likely to provide satisfaction. Personal-ity tests are self-reported measures of traits, temper-aments, or dispositions.
Four unique forms of employment testing methodsinclude genetic testing, graphoanalysis, polygraphtesting, and online testing. Genetic testing identifiespredisposition to inherited diseases, such as cancer,heart disease, neurological disorders, and congenitaldiseases. Graphoanalysis is the use of handwritinganalysis. The polygraph test (lie detector test) con-firms or refutes the essential information containedin the job application. Online testing is using theInternet to test various job-related skills required bythe job applicants, and these tests are convenient,affordable, and fast.
An assessment center is a selection approachthat requires candidates to perform activities sim-ilar to those found in an actual job of a manager.

JWBT150-Vallabhaneni c05 July 28, 2009 18:30
108 Learning Module 5: Human Resources Management
Potential managerial employees are first interviewedand later evaluated in real work situations. It is ajob-simulated environment with in-basket exercises(an alternative to paper-and-pencil test), manage-ment games, leaderless discussion groups, or mockinterviews. The assessment centers focus on priori-tizing (organizing), delegating, and decision-makingskills:
Assessment Center Approach = Interview+ Evaluation
Assessment Center Focus = Organizing Skills+ Delegating Skills + Problem-Solving andDecision-Making Skills
The assessment center approach is reliable and valid,and the in-basket exercise is a good predictor of man-agement performance.
❑ Learning Objective 5.6:UNDERSTAND THEEMPLOYMENT INTERVIEWPROCESSThe employment interview is a goal-oriented con-versation between the interviewer and the applicantto exchange meaningful information related to a job.Historically, interviews have been poor predictorsfor making employee selection decisions, but theyare getting better due to sophisticated design andapplication.
The employment interview occurs after the prelim-inary interview, after the application was reviewed,and after scoring satisfactorily on selection tests.The focus of the employment interview is to as-sess whether an individual is willing to work andcan adapt to the organization culture and workethics.
The first step in the employment interview processis interview planning in terms of time and location.The interviewer then prepares a job profile basedon the job description to use as a checklist in theinterview.
The next step is to decide on the content of the inter-view, including work experience, academic prepara-tion, interpersonal skills (getting along with others),personal qualities (e.g., appearance, vocabulary, andpoise), and organizational fit with the firm’s cultureor values:
Employment Interview = InterviewPlanning + Interview Content
Three types of interviews exist: structured, un-structured, and behavioral. In the structured in-terview, the same series of job-related questionsare asked of all the applicants to ensure consis-tency. These series of questions focus on situations,job-knowledge, job-sample simulation, and workerrequirements. In the unstructured interview, open-ended questions are asked. The use of structured in-terviews increases reliability and accuracy by reduc-ing subjectivity and inconsistency of unstructuredinterviews. The behavioral interview is a struc-tured interview where applicants are asked to relateactual incidents from their past experiences rele-vant to the target job. The behavioral interviews areequally applicable to both lower-level and higher-level jobs because past behavior is the best predictorof future behavior. A positive feature about behav-ioral interviewing is the ability to use the results asa tiebreaker, and a negative feature is that some ap-plicants can deliberately misrepresent themselves.
Interviewing methods include one-on-one inter-view, group interview, panel interview, multiple in-terviews, stress interview, and realistic job preview(RJP). The focus of RJP is to convey both positive andnegative aspects of job information to the applicantin an unbiased manner, which in turn reduces an ap-plicant’s unrealistic expectations about the job andthe employer.
Potential interviewing problems that should beavoided include using inappropriate questions,making premature judgments, interviewer domina-tion, permitting non-job-related information to bediscussed, interviewer’s contrast (halo) effect, lackof interviewer’s training, and nonverbal communi-cation (body language) between the interviewer andthe interviewee.
❑ Learning Objective 5.7:UNDERSTAND THEPRE-EMPLOYMENT SCREENINGPROCESSThe pre-employment screening process starts aftera job candidate completes an employment applica-tion, submits a resume, takes the required selectiontests, and undergoes an employment interview. Atthis point, the candidate is being considered for thejob and requires further work prior to hiring.
Two types of pre-employment screening includebackground investigations and reference checks,where the latter supplements the former.

JWBT150-Vallabhaneni c05 July 28, 2009 18:30
LEARNING OBJECTIVE 5.8: UNDERSTAND THE EMPLOYEE TRAINING AND DEVELOPMENT PROCESS 109
The focus of the background investigation is todetermine the accuracy of information submitted orto determine whether the required information wasnot submitted. Background investigations involvecollecting data from various sources, such as previ-ous employers, business associates, credit bureaus,government agencies, academic institutions, and theapplicant’s mode of living and the nature of charac-ter. Some sensitive jobs require fingerprinting andsecurity clearances.
Reference checks from outsiders verify theaccuracy of information provided by the applicant.A problem with reference checks is that they do nottell the whole truth about an applicant. Anotherproblem is that previous employers are reluctantto reveal information about the applicant due toprivacy reasons.
HR management needs to be concerned aboutthree legal liabilities when hiring, which provide ad-ditional justification for conducting a thorough back-ground investigation of the job applicant:
1. Negligent hiring is the liability of the current em-ployer when he fails to conduct a reasonable in-vestigation of a job applicant’s background andthen hires a potentially dangerous person whocan damage company property and/or harm em-ployees and others. The definition of reasonableinvestigation depends on the nature of the job andrequires due diligence in conducting backgroundinvestigations. The hiring organization must beable to foresee the harm resulting from a danger-ous employee being hired.
2. Negligent referral is the liability of the formeremployer when he fails to warn the potential em-ployer about a severe problem with a past em-ployee.
3. Negligent retention is the liability of the currentemployer if he keeps an employee on the pay-roll whose records indicate strong potential forwrongdoing and fails to take necessary steps todefuse a possibly violent situation.
Negligent Hiring versus Negligent Referralversus Negligent Retention
Negligent hiring is a legal liability for the currentemployer.
Negligent referral is a legal liability for the formeremployer.
Negligent retention results from negligent hiring.
❑ Learning Objective 5.8:UNDERSTAND THE EMPLOYEETRAINING AND DEVELOPMENTPROCESSThe goal of training and development (T&D) is to im-prove employee competencies and to increase orga-nizational performance continuously. Competenciesare a broad range of knowledge, skills, and abilities(KSAs), traits, and behaviors that could be labeledas hard skills and soft skills.
Training provides learners with the KSAs neededto perform their current jobs. Development involveslearning and education that goes beyond the currentjob and prepares for the future job(s).
Employee Training versus EmployeeDevelopment
Employee training focuses on achieving short-term goals.
Employee development focuses on achievinglong-term goals.
Significant benefits accrue to both employees andemployers when an employee’s personal growthstrategies are aligned with corporate strategies.These benefits include greater employee satisfaction,which in turn increases customer satisfaction; im-proved employee morale; higher employee reten-tion; and lower employee turnover. To achieve thesebenefits, many firms are becoming learning orga-nizations by recognizing the importance of continu-ous improvement and continuous learning to delivercontinuous performance. The learning organizationshould turn every learner into a teacher and everyteacher into a learner to sustain knowledge levels inthe organization.
Several factors that can impact and are impacted byT&D include top management support (budget andactive role), commitment from specialists and gener-alists (i.e., line versus staff), technological advances(e.g., the Internet and computer), organization com-plexity (i.e., flat versus tall organization structure),and learning styles (e.g., just-in-time training). Forexample, a company that hires marginally qualifiedemployees needs to plan for extensive T&D pro-grams. Similarly, companies with competitive paysystems or comprehensive healthcare benefit pack-ages and progressive safety programs attract com-petent employees requiring less T&D work.

JWBT150-Vallabhaneni c05 July 28, 2009 18:30
110 Learning Module 5: Human Resources Management
The T&D process consists of a series of steps, in-cluding determining specific T&D needs, establish-ing specific T&D objectives, selecting specific T&Dlearning methods, identifying specific T&D deliverysystems, implementing T&D programs, and evalu-ating T&D programs.
Determining specific T&D needs focuses on orga-nizational analysis using corporate mission, goals,and plans and HR plans; task analysis using job de-scriptions; and individual analysis to strengthen theemployees’ KSAs.
Establishing specific T&D objectives starts withdefining the purpose and developing specific learn-ing objectives to achieve organizational goals.
Selecting specific T&D learning methods in-cludes instructor-led courses, case study, behaviormodeling, role-playing, business games, in-baskettraining, on-the-job training (OJT), job rotation, in-ternships, and apprenticeship training
Identifying specific T&D delivery systems in-cludes corporate universities, colleges and uni-versities, community colleges, distance learning,videoconferencing, vestibule systems, video media,e-learning for online instruction, virtual reality, andsimulators.
Implementing T&D programs is difficult, as it re-quires the cooperation of both managers and em-ployees. Managers must try to implement the T&Dprograms on an incremental basis, meaning show-ing success rates in one area and extending them intoother areas of the company. Employees resist train-ing because it implies a change. Employee feedbackand record-keeping are vital to correct and improveany gaps in the program.
Evaluating T&D programs is even more difficultbecause it is a soft issue to measure objectively. Var-ious methods exist for evaluation, including (1) so-liciting the training participants’ opinions and sug-gestions, (2) designing pre-test and post-test controlgroup studies, (3) requesting a 360-degree feedbackfrom managers, employees, trainers, and colleagues,(4) assessing whether stated training objectives havebeen achieved and that they have resulted in an im-proved job performance, (5) calculating the returnon training (ROT) investment, and (6) benchmark-ing with other companies regarding training costsand ratio of training staff to total employees in adepartment, division, or company.
Return on training (ROT), expressed as a percent-age, is computed as:
ROT = [(Net Present Value of Training Benefits)/(Net Present Value of Training Costs)] − 1.00
The result is multiplied by 100 to get the percentage.All benefits and costs are multiplied with the cor-
responding present value factors to result in NPV ofbenefits and costs respectively.
Orientation is of two types: employee orientationand executive orientation. Employee orientation isthe initial T&D effort for new employees to informthem about the organization (i.e., policies, proce-dures, and rules), the job (i.e., how his jobs fits intothe organizational structure and goals), the work en-vironment (i.e., rewards, career management, em-ployee development, and teamwork), and the workculture (i.e., dress code and ethics). Executive orien-tation focuses on learning an organization’s struc-ture, mission, products and services, competition,culture, and organizational politics to bring the ex-ecutive up to speed for early contributions. This re-quires senior management’s commitment to makethe executive orientation program work. All orien-tation efforts can establish positive working relation-ships between the employee and the employer.
Various special training programs are identifiedfor supervisors, managers, and employees to avoidpotential risks and legal liabilities. These programsinclude (1) diversity training to handle protectedgroups such as women and minorities properly,(2) ethics training, dealing with fair play, respectinglaws and rules, rewarding ethical behavior, punish-ing unethical behavior, and ways to prevent and de-tect fraud, (3) telecommuter training, dealing withemployees working from home where the super-visor’s focus is changed from task-based manage-ment to results-based management, (4) customerservice training, requiring communication and lis-tening skills to handle customers with care, (5) con-flict resolution training where conflicts may occurbetween employees and between customers and em-ployees, (6) teamwork training to teach employ-ees how to work in groups for better performance,(7) empowerment training, dealing with problem-solving and decision-making skills, taking responsi-bility for results, and not abusing the empowermentprivilege, and (8) anger-management training to pre-vent workplace violence.
❑ Learning Objective 5.9:UNDERSTAND THEMANAGEMENT DEVELOPMENTPROCESSManagement development (MD) is a broad termencompassing elements such as upgrading the KSAs

JWBT150-Vallabhaneni c05 July 28, 2009 18:30
LEARNING OBJECTIVE 5.10: UNDERSTAND THE ORGANIZATION DEVELOPMENT PROCESS 111
required for a manager or a professional to applythem either in the current job or in a future job.
The managerial talent is a complex group consist-ing of first-line supervisors, middle-level managers,and higher-level executives and as such requires adifferent type of MD programs to cater to the needsof each level in the management hierarchy. For ex-ample, as the level goes up in the hierarchy, thereshould be a strong focus on soft skills and generalbusiness knowledge, less focus on hard skills andvice versa.
The MD programs can be conducted either insideor outside the company. The reasons for conductingthe program outside the company are that it bringsnew viewpoints, different perspectives, and broadexposure to outside experts. The reasons for con-ducting the program inside the company are thatcustomized courses can be developed in less timeand at a reduced cost, the course content is con-trolled, teamwork is facilitated, and the companyculture is known.
Five related concepts in the MD program includementoring, reverse mentoring, coaching, job rota-tion, and delegation, all with the similar purpose oflearning and growing personally and professionallywith the advice and experience of others.
Mentoring is advising, coaching, and nurturinga protege to enhance his career development. Thementor can be anywhere in the same organization asthe protege or may work in another organization oranother industry. The mentor or the sponsor couldbe the same or different gender as the protege. Some-times, a protege may have more than one mentor tolearn the unwritten rules to make it to the top.
Implications of Mentoring
Mentoring can break the glass-ceiling obstacle fac-ing women and minorities.
Research has shown that women who havewomen mentors have done well in enhancingtheir careers.
Research has shown that African-Americanwomen who have one mentor are more likelyto get promoted.
Research has shown that African-Americanwomen who have more than one mentor aremost likely to get promoted.
Reverse mentoring is where older employees learnfrom younger ones because the latter group has somespecial skills that the former group does not have.
This approach will keep the older employees moreproductive with special skills and thus more usefulto the company.
Coaching is the responsibility of the immediatesupervisor, who provides assistance much like amentor. Coaching is more direct than mentoring.
Although mentoring and coaching concepts soundgood in theory, there are some practical problems inselecting and pairing the right mentor and the rightprotege, the amount of attention given by the mentorto the protege, the temperament of both parties, andthe personality conflicts between the two parties.
Job rotation is a T&D method, which can also beused as a part of the MD program, where new orcurrent employees move from one job to anotherin order to broaden their work experience and toincrease their KSAs.
Delegation is a higher-level management rightto transfer authority and responsibility to lower-level management, where the latter group devel-ops managerial skills such as problem solving anddecision making and learns how to take responsi-bility and accountability for achieving results. Asa part of the MD program, delegation involves de-veloping and empowering lower-level management.Although managers are encouraged to delegate, theyoften find it difficult to do so.
❑ Learning Objective 5.10:UNDERSTAND THEORGANIZATION DEVELOPMENTPROCESSOrganization development (OD) seeks big changein the corporate culture either at the organizationlevel or at the division level. OD requires change inthe organizational structures, systems, and processesto achieve the desired goals.
T&D Efforts versus OD Efforts
T&D efforts are small in size and scope (e.g.,change in an employee’s skillsets).
OD efforts are large in size and scope (e.g., changein the corporate culture or employee’s workbehavior).
Examples of OD intervention techniques includesurvey feedback, quality circles, team building, andsensitivity training. These techniques together canachieve the OD goals.

JWBT150-Vallabhaneni c05 July 28, 2009 18:30
112 Learning Module 5: Human Resources Management
Survey feedback requires collection of data fromquestionnaires, interviews, productivity records,and employee turnover and absenteeism data. Thisfeedback data helps in diagnosing the problem ar-eas, developing action plans to increase employeeproductivity and company profits, and improvingoverall working relationships.
Quality circles consist of groups of voluntary em-ployees who meet with their supervisors regularlyto discuss problems, investigate root causes, rec-ommend solutions, and take corrective actions. Thegroup as a whole must be familiar with problem-solving and decision-making processes and tools tobe effective. Both financial and nonfinancial rewardsmust be available to this group to keep them moti-vated and productive.
Team building can boost employee morale, in-crease employee retention, and increase companyprofits. The team-building concept uses self-directedteams consisting of a small group of employees re-sponsible for an entire work process or part of it.Together, they improve their operation or product,plan and control their workload, and resolve day-to-day problems on their own. They may even get in-volved in solving vendor quality and safety-relatedproblems.
Sensitivity training (T-group training) is designedto help individuals learn how others perceive theirbehavior. Sensitivity training is different from thetraditional mode of training (i.e., learning a pre-determined set of concepts) in that there is noagenda, no rules, no authority, no power positions,and no leaders. Individuals are gathered and starttalking about work-related and common issues theyface in an unstructured environment, where thetrainer is just a facilitator. The T-group training in-creases interpersonal skills of the participants and in-creases self-awareness and sensitivity to the behav-ior of others. A drawback of the sensitivity trainingprogram is that it focuses on changing individuals,instead of changing the work environment in whichthey work.
❑ Learning Objective 5.11:UNDERSTAND THE CAREERPLANNING AND DEVELOPMENTPROCESSKey elements of career planning and developmentinclude career, individual career planning, organiza-tional career planning, succession planning, careerpath, career development, and career security.
A career is a general course that an individualchooses to pursue throughout his working life. Itis a sequence of work-related positions an individ-ual has occupied during his lifetime, whether withone organization or more than one.
Individual career planning is an ongoing processin which a person establishes personal goals andidentifies the means to achieve them.
Organizational career planning is the plannedsuccession of jobs mapped out by an organization’smanagement to develop its employees in order totake on increased responsibilities. The organizationidentifies career paths and developmental programsto meet the challenges of increased responsibilities.Individual career plans and organizational careerplans must be synchronized for maximum benefitto both the employee and the employer.
Succession planning is the process of ensuringthat qualified individuals are ready to assume keymanagerial positions once these positions are avail-able to fill. The need for succession planning arisesdue to untimely deaths, resignations, terminations,or retirements of higher-level senior managers. Suc-cession planning should reach lower levels of man-agement in addition to higher levels of manage-ment due to delayering of management hierarchy,implying the importance of lower levels of man-agement for continued business operations. In thissense, the succession plan should accommodate thedevelopment of lower level management talent forreadiness.
A career path is the line of progression throughwhich a person makes job changes within a com-pany or moves from company to company and fromposition to position in order to gain greater knowl-edge and experience. Usually, career paths focus onupward mobility, which is not guaranteed becauseof business uncertainties. Alternative career pathsinclude network (vertical jobs with horizontal op-portunities), lateral (learning new skills in otherfunctions), dual-career (a technical specialist willstay as a specialist without becoming a manager),and downward mobility (i.e., demotion if moneyis not a problem). Some may opt to be free agents,being their own boss.
Career development is a formal approach to en-sure that employees with the proper qualificationsand experiences are available when needed. Careerdevelopment programs ensure the availability ofhighly motivated and committed employees.
Individual career planning must start with a self-assessment of interests and match them against
JWBT150-Vallabhaneni c05 July 28, 2009 18:30
LEARNING OBJECTIVE 5.12: UNDERSTAND THE EMPLOYEE PERFORMANCE APPRAISAL PROCESS 113
the job requirements because self-assessment is theprocess of learning about oneself. Tools are avail-able to facilitate the self-assessment exercise, includ-ing identifying personal strengths (assets) and weak-nesses (liabilities) through a balance sheet approach,taking a personal survey of likes and dislikes, andtaking a professional self-assessment of KSAs toenrich a person’s professional career in terms ofpursuing college/advanced education or acquiringprofessional certifications.
An individual must focus on adding value to hiscareer by increasing his toolbox with continual per-sonal and professional development programs tomeet the needs defined by the marketplace.
Ideally speaking, the employee must drive his ca-reer plans (i.e., objectives and actions) and careerdevelopment programs (courses and milestones) be-cause he knows best or he should know what hewants and how to achieve them. The employee, ofcourse, can seek the advice and assistance of his im-mediate supervisor and work together in developingcareer paths and development programs.
Self-Assessment → Self-Development
Organizational career planning must focus on in-creasing the talent pool of qualified men and womenwho can take on increased opportunities in the fu-ture. When an employee believes that his employeris interested in his career planning, he is likely toremain with the company (loyal) and become moti-vated and productive. The output of the career plansis used to determine the employee’s training and de-velopment (T&D) needs.
There can be several inputs to an employee’s ca-reer development plan, including the employee’sown career plan and development list, employee–supervisor mutually identified and agreed-on careerpath and development guidelines, employee job de-scription document to determine the necessary edu-cation, skills, and experience required to do the job,and employee performance appraisal report describ-ing the employee’s strengths and weaknesses docu-mented by the supervisor.
Specific career development programs includeattending colleges and universities for specificcourses or degree programs, educational workshopsof short duration, trade seminars and conferences,in-house or outside training courses, or earning pro-fessional certifications with continuing educationrequirements.
The individual employee career plans and devel-opment programs should complement and supple-
ment the organizational career plans and develop-ment programs to enhance their value to the indi-vidual employee and to the organization.
It is human nature to desire career/job security.Career security can be obtained by developing mar-ketable KSAs that help ensure continued employ-ment within a range of careers either inside or out-side of a company.
❑ Learning Objective 5.12:UNDERSTAND THE EMPLOYEEPERFORMANCE APPRAISALPROCESSSimilar to corporations wanting to grow in salesand market share to increase profits and stakeholdervalue, employees need to grow personally and pro-fessionally to reach their career goals and make apositive contribution to the company they work forand to reach the company’s goals. Goal congruenceis at play here.
Although neither employees nor supervisors liketo give or receive performance appraisal evaluationsfor delicate reasons, it is a very important part of em-ployee career growth plans, can be used in justifyingemployee termination and promotion decisions, andcan help in identifying employee training and devel-opment needs.
Characteristics of an effective appraisal systeminclude job-related criteria, performance expecta-tions, standardization, trained appraisers, continu-ous open communications, periodic performance re-views, and due process to appeal appraisal results.
Results from the employee performance appraisalprocess can be put to several good uses, such as in-put into human resource planning, recruitment andselection, training and development, career plan-ning and development, compensation programs,employee relations, and assessment of employeepotential in the company.
Two external factors affecting the employee per-formance appraisal system are: (1) government leg-islation requiring nondiscriminatory practices tofollow and (2) labor unions preferring seniorityas the basis for promotions instead of perfor-mance. A major internal factor that affects the per-formance appraisal is the organization’s culture,where nontrusting culture does not encourage highperformance.
The employee performance appraisal process is di-vided into a series of steps, including identifying

JWBT150-Vallabhaneni c05 July 28, 2009 18:30
114 Learning Module 5: Human Resources Management
specific performance appraisal goals, establishingperformance criteria and communicating them toemployees (e.g., traits, behaviors, competencies, goalachievement, and improvement potential), exam-ining employees’ work performed, appraising em-ployees’ performance, and discussing appraisal re-sults with employees.
Individuals responsible for conducting the em-ployee performance appraisal include self-appraisal,immediate supervisor, senior managers, subordi-nates, peers and team members, and internal andexternal customers, called a 360-degree feedbackevaluation method. The biggest risk with 360-degreefeedback is confidentiality, whether the evaluation isdone internally or externally.
A 720-degree review focuses on the big picture atthe company level for all of its employees, not at theindividual employee level. The review is all aboutsenior managers and their performance. The partici-pants in the review include senior managers, subor-dinates, customers, and investors. This is because se-nior managers deal more with external parties suchas customers and investors.
Performance appraisal methods include 360-degree feedback, 720-degree review, rating scalesmethod, critical incident method, essay method,work standard method, ranking method, forceddistribution method, behaviorally anchored ratingscales (BARS) method, and results-based system.
Problems associated with the performance ap-praisal process include appraiser discomfort, lackof objectivity, halo/horn error, leniency/strictnesseffect, central tendency error, recent behavior bias,personal bias (stereotyping), manipulating the eval-uation, and employee anxiety.
Halo Error versus Horn Error
Halo error occurs when a manager projects onepositive performance feature or incident ontothe rest, resulting in a higher rating.
Horn error occurs when a manager projects onenegative performance feature or incident ontothe rest, resulting in a lower rating.
❑ Learning Objective 5.13:UNDERSTAND THE EMPLOYEERELATIONS ISSUESEmployees constantly move in and out of anorganization—some for good reasons and others for
not-so-good reasons. Examples of employee move-ments internal to the organization include pro-motion (upward), transfer (lateral), and demotion(downward). Examples of employee movements ex-ternal to the organization include resignation, termi-nation (discharge), layoff, and retirement. Demotioncan be an alternative to termination.
There is an unwritten (implied) employment con-tract created when an employee agrees to work foran employer with no end date for employment,called the employment-at-will doctrine. In otherwords, these at-will employees depend on the good-will of their employers for continued employmentdue to lack of an explicit contract. This means, em-ployees can be terminated at the will of the employer,and employees can leave the employer at the will ofthe employee. Most non-union employees fall underthe employment-at-will employee category.
For example, union members, who have a collec-tive bargaining agreement, and teachers, who have acontract, are not at-will employees. Employees withan implicit employment contract and who report anillegal act, like whistleblowers, are not subject to theemployment-at-will doctrine because they are pro-tected under the provisions of the U.S. Sarbanes-Oxley Act of 2002.
Employment applications, employee handbooks,policy manuals, and other employee-related docu-ments should not contain or imply words such as jobsecurity or permanent employment because a dis-charged employee can use these documents againstan employer in a lawsuit of wrongful discharge.Other protective measures that an employer cantake include employee’s signed acknowledgment ofthe at-will disclaimer, developing clearly written jobdescriptions, conducting regular employee perfor-mance appraisals, and giving frequent verbal per-formance feedback to employees.
An employer can invoke a penalty against an em-ployee who was subject to disciplinary action andconsequently discharged with the reason that theemployee failed to meet certain established employ-ment standards.
To handle disciplinary actions properly, organiza-tions should follow a structured approach in termsof defining specific steps. These steps include set-ting organizational goals, establishing employmentrules, communicating the rules to employees, ob-serving employee actual performance, comparingactual performance with rules, and taking appro-priate disciplinary actions. These steps are neededto avoid legal and financial risks.
JWBT150-Vallabhaneni c05 July 28, 2009 18:30
LEARNING OBJECTIVE 5.13: UNDERSTAND THE EMPLOYEE RELATIONS ISSUES 115
Three important approaches are available to han-dle disciplinary actions: hot-stove rule (i.e., advancewarning), progressive disciplinary action (mini-mum penalty), and disciplinary action withoutpunishment (i.e., time off with pay). The progres-sive disciplinary action approach is designed to im-pose a minimum penalty appropriate to the offenseand requires the employer to follow specific steps insequence:
Oral Warning → Written Warning → Suspension → Termination(Least Severe) (Most Severe)
Many organizations are rethinking their approachto disciplinary actions, deciding to abandon warn-ings (oral and written) and suspensions (unpaid timeoff) and going strictly with disciplinary action with-out punishment (i.e., time off with pay). This rethink-ing is attributed to avoiding or reducing legal andfinancial risks.
Employers must be consistent in their disciplinaryactions against employees from the beginning to theend; that is, actions cannot be too lenient in the be-ginning and too strict at the end. Consistent actionmeans a long-term employee might receive merelya suspension notice, whereas a short-term employeemight be terminated for the same serious violation.
Grievance procedures under a collective bargain-ing agreement (union organization) are handleddifferently than in a non-union organization. Agrievance is an employee’s dissatisfaction or feel-ing of injustice relating to his job (e.g., getting fired).Arbitrators, mediators, and union stewards are in-volved in union organizations to solve grievanceproblems. Non-union organizations are encouragedto develop and implement formal grievance pro-cedures so that an employee can make complaintswithout fear of reprisal.
Firing costs are expensive, especially when thereis a judgment error associated with it. There are twotypes of firing errors: (1) Yes-Fire error exists whenthe employer decides to fire when the employee doesnot deserve firing. (2) No-Fire error exists when theemployer does not fire when the employee deservesfiring.
The U.S. Office of Personnel Management (OPM)developed alternative dispute resolution (ADR)guidelines to help employers and employees avoidgoing to courts because the court system is costly,uncertain, and untimely. The ADR is a procedurewhereby the employee and the employer agreeahead of time that any problems will be addressed
by agreed-upon means, as follows:
Alternative Dispute Resolution = Arbitrator orMediator or Ombudsperson
An arbitrator is an impartial third party who en-ters into a dispute case between a labor union andcompany management for a binding resolution. Heacts as judge and jury.
A mediator is a neutral third party who enters intoa dispute case between a labor union and companymanagement when a bargaining impasse has oc-curred. He acts like a facilitator and informal coachto ensure that bargaining discussions are fair andeffective. Mediation is a voluntary process.
An ombudsperson is a complaint officer in a com-pany who has access to top management and whohears employee complaints, investigates, and recom-mends appropriate action.
Arbitrators and mediators are involved in han-dling disputes in private-sector organizations withlabor unions and in public-sector organizations. Useof an ombudsperson is seen more in private-sector,non-union organizations.
Termination is the most severe penalty, requiringcareful consideration on the part of the employer.Termination of nonmanagerial and nonprofessionalemployees is handled differently from the ter-mination of higher-level executives and middle-level/lower-level managers and professionals.
For example, termination procedures for nonman-agerial and nonprofessional employees (e.g., truckdrivers and waiters) are dictated by whether theseemployees belong to a union.
Usually, executive jobs are protected under a con-tract, if there is one. They have no formal appealrights because the termination could be due tovalid business reasons (e.g., economic downturn, re-organization and downsizing, and decline in per-formance and productivity). However, executivesinvolved in illegal activities such as managementfraud, insider trading, or a sexual harassment suitcan be terminated. Terminated executives can becostly to replace and can make negative statementsabout the company to the press in order to damageits reputation.
Middle-level and lower-level managers and pro-fessionals are most vulnerable to termination, unlessthey belong to a union, because their employmentdepends on the will and whim of their immediatesupervisor.
Resignations occur on a voluntary basis by theemployee or are forced by the employer. When an

JWBT150-Vallabhaneni c05 July 28, 2009 18:30
116 Learning Module 5: Human Resources Management
employee resigns on a voluntary basis, the employermust determine the reasons for leaving through theuse of an exit interview (before an employee departs)and post-exit questionnaire (after an employee hasdeparted).
Exit interviews, which are face-to-face meetings,can identify the reasons for leaving, which can beused to change the HR planning process, modifytraining and development programs, and addressother areas needing improvement. A major problemwith the face-to-face exit interview is that the depart-ing employee may not tell the interviewer the realreasons for leaving due to their sensitivity.
Post-exit questionnaires are sent to former em-ployees several weeks after they leave the companyto determine the real reasons they left, which cannegate problems with exit interviews. The departedemployee may respond freely to the questionnairebecause he is not in front of the interviewer.
The best way to manage employee relations is toconduct a periodic attitude survey of current em-ployees to determine their feelings, issues, and con-cerns related to their jobs and to seek their ideas forimprovement. The scope of the survey can includenature of the work, supervisor relations, work envi-ronment (tools and materials), flexibility in the workschedules, opportunities for job advancement, train-ing and development opportunities, pay and bene-fits, and workplace safety and security concerns. Theresults from the survey can benefit the employer incorrecting the identified gaps on a proactive basis be-fore problems get out of hand. If uncorrected, theycan result in employees leaving the company.
The Nature of Employee Feedback
Employee attitude surveys are proactive in natureand timely.
Exit interviews and post-exit questionnaires arereactionary in nature and untimely.
All of the above focus on the same thing exceptfor differences in timing and results.
❑ Learning Objective 5.14:COMPUTE THE HUMAN CAPITALMETRICSHuman capital metrics provides an objective evalua-tion of the efficient and effective utilization of finan-cial and human resources allocated for managing theHR function in an organization.
Several human capital metrics are available fromthe Saratoga Review:
Examples of Human Capital Metrics
Revenue per Employee = Total Revenues/TotalNumber Fulltime Equivalent Employees (FTEs)
Labor Cost Revenue Percent = (RegularCompensation Costs + Benefits Costs)/TotalRevenues
Labor Cost Expense Percent = (EmployeeCompensation Costs + BenefitsCosts Excluding Payments for Time NotWorked)/Total Operating Costs
Profit per Full-time Employee = (TotalRevenues − Total Operating Costs)/TotalNumber FTEs
HR Headcount Ratio = Total Headcount/DirectHR Headcount
HR Spend per Employee = TotalHR Budget/Total Number FTEs
Number of Qualified Candidates per Requisition= Qualified Applications/Total NumberApproved Requisitions
Time to Fill = Total Days to Fill/TotalNumber of Hires
Rehire Percent = Number of Rehires/TotalNumber of External Hires
Learning & Development (L&D) Hours perEmployee = Total Number L&D Hours/TotalNumber FTEs
HR Outsourcing Costs per Employee Served =Direct HR Outsourcing Costs/Total Headcount
Average Time to Promotion = Total NumberMonths to Promotion/Total NumberPromotions
First Year of Service Turnover Rate = TotalTurnover with One Year of Service/TotalHeadcount with One Year of Service
Internal Management Hiring Source = NumberInternal Management Hires/Total ManagementRequisitions Filled
Percent of Management with No Direct Reports= Management Headcount with No DirectReports/Total Management Headcount

JWBT150-Vallabhaneni c05 July 28, 2009 18:30
LEARNING OBJECTIVE 5.14: COMPUTE THE HUMAN CAPITAL METRICS 117
Key Position Pipeline Utilization = Key PositionsFilled by Succession Planning Candidates/Total Number Key Positions Filled
One or More Candidate Succession PlanningDepth = Total Number Key Roles with Oneor More Unique Successors/Total NumberKey Roles
Executive Stability Ratio = Executive Headcountwith Greater Than Three Years of Service/Total Executive Headcount
Source: U.S. Saratoga Review: Monthly Benchmarking and Hu-
man Capital Newsletters, PricewaterhouseCoopers, July 2006
to September 2008 (www.pwc.com).
Self-Assessment Exercise
Online exercises are provided for the learn-ing objectives in this module. Please visitwww.mbaiq.com to complete the online exercisesand to calculate your MBA IQ Score.

JWBT150-Vallabhaneni c05 July 28, 2009 18:30
118

JWBT150-Vallabhaneni c06 July 28, 2009 17:41
LEARNING MODULE 6
Accounting
Learning Objective 6.1: Understandthe Basic Concepts of FinancialAccounting 120Business Entity Concept 120Cost Concept 120Matching Concept 120Other Concepts 120Accounting Principles 121Qualities of Accounting Information 121
Learning Objective 6.2: Understandthe Purpose of the AccountingCycle 121Cash-Basis versus Accrual-Basis 122Steps in the Accounting Cycle 122
Learning Objective 6.3: Understandthe Types and Contents of FinancialStatements 122Types of Financial Statements 122Contents of Financial Statements 123Balance Sheet 125
Learning Objective 6.4: Understandthe Intermediate Concepts ofFinancial Accounting 128Bonds and Notes 128Leases 129Pensions 130
Learning Objective 6.5: Understandthe Advanced Concepts of FinancialAccounting 132Business Combinations 132Consolidated Financial Statements 132Partnerships 132Foreign Currency Transactions 132
Learning Objective 6.6: LearnHow to Analyze FinancialStatements 133Income Statement 133Balance Sheet 134Statement of Retained Earnings 134Statement of Cash Flows 135Common Size Analysis 136Trend Analysis 136Comparative Ratios 136
Single Ratios 136Limitations of Financial Statement Ratios 139
Learning Objective 6.7: UnderstandVarious Cost Concepts and CostBehaviors 140Absorption and Variable Costs 140Cost Behavior 143
Learning Objective 6.8: Understandthe Principles and Techniques ofOperating Budgets 143Benefits of Operating Budgets 144Different Dimensions in Operating Budgets 144How Operating Budgets are Prepared 144Operating Budgeting Techniques 145Advantages of Operating Budgets 146Limitations of Operating Budgeting Techniques 146
Learning Objective 6.9: Understandthe Application of TransferPricing 146Methods for Determining Transfer Prices 147Criteria Affecting Transfer Pricing Methods 147International Transfer Pricing 147
Learning Objective 6.10: Understandthe Application ofCost-Volume-Profit Analysis 148Equation Method 148CM Method 148Graphic Method 148CVP Assumptions and Their Limitations 148Ways to Lower the Breakeven Point 149Sensitivity Analysis in CVP 149Changes in Variable and Fixed Costs 149Contribution Margin and Gross Margin 149Profit-Volume Chart 149Effect of Sales Mix on BEP 150
Learning Objective 6.11: Understandthe Meaning and Application ofRelevant Costs 150Application of Relevant Cost Concept 150
Learning Objective 6.12: UnderstandVarious Costing Systems for Productsand Services 151Target Costing 151
119

JWBT150-Vallabhaneni c06 July 28, 2009 17:41
120 Learning Module 6: Accounting
Traditional Costing 151Activity-Based Costing 151Standard Costing 151
Learning Objective 6.13: Understandthe Meaning and Application ofResponsibility Accounting 152
❑ Learning Objective 6.1:UNDERSTAND THE BASICCONCEPTS OF FINANCIALACCOUNTINGFinancial accounting is the language of business.All business transactions will eventually end up infinancial statements. Accounting principles are usedto classify, record, post, summarize, and report busi-ness transactions between various parties involved.Accountants apply their professional standards toanalyze business transactions, prepare estimations,and report business events. The business transac-tions data accumulated in the chart of accounts areused to prepare the financial statements of an orga-nization.
The scope of basic concepts in financial accountingincludes accounting concepts, accounting principles,and quality of accounting information. The scope ofaccounting concepts includes business entity, cost,matching, and others (i.e., materiality, accountingperiod, and revenue recognition).
Business Entity ConceptThe individual business unit is the business entity forwhich economic data are needed. This entity couldbe an automobile dealer, a department store, or a gro-cery store. The business entity must be identified sothat the accountant can determine which economicdata should be analyzed, recorded, and summarizedin reports.
The business entity concept is important becauseit limits the economic data in the accounting sys-tem to data related directly to the activities of thebusiness. In other words, the business is viewed asan entity separate from its owners, creditors, or otherstakeholders. For example, the accountant for a busi-ness with one owner (a proprietorship) would recordthe activities of the business only, not the personalactivities, property, or debts of the owner. The busi-ness entity concept can be related to the economicentity assumption, which states that economic ac-tivity can be identified with a particular unit of ac-countability; going-concern assumption, where the
accountant assumes, unless there is evidence to thecontrary, that the reporting entity will have a life longenough to fulfill its objectives and commitments; andmonetary unit assumption, where it provides thatall transactions and events can be measured in termsof a common denominator—the dollar.
Cost ConceptThe historical cost concept is the basis for enteringthe exchange price or cost of an asset into accountingrecords. Using the cost concept involves two otherimportant accounting concepts: (1) objectivity and(2) the unit of measure. The objectivity concept re-quires that accounting records and reports be basedupon objective evidence. In exchanges between abuyer and a seller, both try to get the best price. Onlythe final agreed-upon amount is objective enough foraccounting purposes. If the amounts at which prop-erties were recorded were constantly being revisedupward and downward based on offers, appraisals,and opinions, accounting reports would soon be-come unstable and unreliable. The unit-of-measureconcept requires that economic data be recorded indollars. Money is a common unit of measurementfor reporting uniform financial data and reports.
Matching ConceptThe matching concept, which is based on accrual ac-counting, refers to the matching of expenses and rev-enues (hence net income) for an accounting period.Under the accrual basis, revenues are reported inthe income statement in which they are earned. Sim-ilarly, expenses are reported in the same period as therevenues to which they relate. Under the cash basisof accounting, revenues and expenses are reportedin the income statement in the period in which cashis received or paid.
Other ConceptsThe materiality concept implies that errors, whichcould occur during journalizing and posting trans-actions, should be significant enough to affect the

JWBT150-Vallabhaneni c06 July 28, 2009 17:41
LEARNING OBJECTIVE 6.2: UNDERSTAND THE PURPOSE OF THE ACCOUNTING CYCLE 121
decision-making process. All material errors shouldbe discovered and corrected. The accounting periodconcept breaks the economic life of a business intotime periods and requires that accounting reports beprepared at periodic intervals. The revenue recogni-tion concept, which is based on accrual accounting,refers to the recognition of revenues in the period inwhich they are earned.
Accounting PrinciplesIf the management of a company could recordand report financial data as it saw fit, comparisonsamong companies would be difficult, if not impos-sible. Thus, financial accountants follow generallyaccepted accounting principles (GAAP) in prepar-ing reports. These reports allow investors and otherstakeholders to compare one company to another.GAAP are developed from research, accepted ac-counting practices, and pronouncements of authori-tative bodies.
Qualities of Accounting InformationThe accounting function collects the raw data frombusiness transactions and converts them into infor-mation useful to the decision maker. In this regard,the accounting information should contain two qual-itative characteristics: (1) primary and (2) secondaryqualities.
Primary QualitiesThe two primary qualities that distinguish useful ac-counting information are relevance and reliability. Ifeither of these qualities is missing, accounting in-formation will not be useful. Relevance means theinformation must have a bearing on a particular deci-sion situation. Relevant accounting information pos-sesses at least two characteristics: timeliness and pre-dictive value or feedback value. Timeliness meansaccounting information must be provided in timeto influence a particular decision. Predictive valuemeans accounting information can be used to pre-dict the future and timing of cash flows. Feedbackvalue means the accounting function must providedecision-makers with information that allows themto assess the progress or economic worth of an in-vestment.
To be considered reliable, accounting informationmust possess three qualities: verifiability, represen-tational faithfulness, and neutrality. Information is
considered verifiable if several individuals, workingindependently, would arrive at similar conclusionsusing the same data. Representational faithfulnessmeans accounting information must report what ac-tually happened. Neutrality means accounting in-formation must be free of bias or distortion.
Secondary Qualities“Secondary qualities” does not mean that these char-acteristics are of lesser importance than the primaryqualities. If a secondary characteristic is missing,the accounting information is not necessarily use-less. The secondary qualities of useful informationare comparability and consistency. Comparabilitymeans the accounting reports generated for one firmmay be easily and usefully compared with the ac-counting reports generated for other firms. If thetwo firms use totally different accounting methods, itwould be very difficult to make a useful comparisonof their data and information. Consistency meansthat a firm systematically uses the same accountingmethods and procedures from one accounting pe-riod to the next accounting period.
In addition to the primary and secondary qual-ities, the accounting information must be under-standable to economic decision-makers. “Earningsmanagement” strategy can destroy the primary andsecondary qualities of accounting information.
❑ Learning Objective 6.2:UNDERSTAND THE PURPOSEOF THE ACCOUNTING CYCLEFinancial accounting provides accounting informa-tion for use by those outside and inside the organi-zation. This information is used by current investorsand potential investors to determine future benefitsthey will receive if they hold or acquire ownershipin a business. Creditors and lenders use this infor-mation to assess the creditworthiness of an organi-zation. Other users of this information include em-ployees, unions, customers, the general public, andgovernmental units.
Transactions, in accounting, are the result of theexchange of goods and/or services. Two factors al-low the recording of a transaction—evidence andmeasurement. An exchange is an observable eventand, therefore, provides evidence of business activ-ity. This exchange takes place at a set price and,thus, provides an objective measure of the economic

JWBT150-Vallabhaneni c06 July 28, 2009 17:41
122 Learning Module 6: Accounting
activity. The accounting cycle is one of four businesscycles; the other three are sales, finance, and produc-tion.
With the traditional accounting model, a double-entry system of recordkeeping is used. The funda-mental equation used with this system is:
Assets = Liabilities + Owners’ Equity
All transactions are analyzed and then recordedbased on their effect on assets, liabilities, and own-ers’ equity. The increases and decreases in these ac-counts are recorded as debits or credits. In recordingthese transactions, the total amount of debits mustequal the total amount of credits. The requirementthat debits and credits must be equal gives rise tothe double-entry method of recordkeeping. In ac-count form, the rules of debits and credits includethe following:
Debits Credits
Increase assets Decrease assetsDecrease liabilities Increase liabilitiesDecrease owners’ equity Increase owners’ equityIncrease owners’ drawing Decrease owners’ drawingDecrease revenues Increase revenuesIncrease expenses Decrease expenses
Cash-Basis versus Accrual-BasisThe two approaches of accounting are cash-basis ac-counting and accrual-basis accounting. With cash-basis of accounting, revenues are recognized whencash is received, and expenses are recognized whencash is paid out. The primary advantages of cash-basis accounting are the increased reliability due tothe fact that transactions are not recorded until com-plete and the simplicity due to the fact that fewerestimates and judgments are required.
For most businesses, the cash-basis of accountingfor a period requires recognition and measurementof noncash resources and obligations. Cash-basis ac-counting is not in accordance with GAAP.
With the accrual-basis of accounting, revenues arerecognized when sales are made or services are per-formed, and expenses are recognized as incurred.Revenues and expenses are recognized in the pe-riod in which they occur rather than when cash isreceived or paid out.
The attempt to record the financial effect of trans-actions that have cash consequences in the periodsin which those transactions occur rather than in theperiods in which cash is received or paid pertains toaccrual accounting.
Steps in the Accounting CycleThe accounting cycle records the effect of economictransactions on the assets, liabilities, and owners’equity of an organization. The accounting cycleinvolves eight steps: (1) analysis of transactions,(2) journalizing of transactions, (3) posting to theledger, (4) trial balance and working papers, (5) ad-justing journal entries, (6) closing journal entries,(7) preparing financial statements, and (8) reversingjournal entries.
❑ Learning Objective 6.3:UNDERSTAND THE TYPES ANDCONTENTS OF FINANCIALSTATEMENTSEvery business manager at one time or another willget involved in analyzing his company’s financialstatements or other firms’. These analyses will re-veal trends and patterns, which will provide period-to-period comparisons as well as with other firms inthe industry.
Types of Financial StatementsThe following is the sequence of preparing four dif-ferent types of financial statements:
1. Income statement. After preparing the adjustingjournal entries and posting them to the workingpapers, an income statement can be prepared us-ing the income statement numbers from the work-ing papers.
2. Statement of Retained Earnings and Statementof Stockholders’ Equity. After preparing theclosing journal entries and posting them to theworking papers, the only accounts with balancesshould be the asset, liability, and owners’ equityaccounts. At this time, a Statement of RetainedEarnings or Statement of Stockholders’ Equityshould be prepared. This statement summarizesthe transactions affecting the owners’ capital ac-count balance or retained earning. Such a state-ment shows the beginning capital account, plusnet income or less net loss, less owners’ with-drawals or dividends. The ending capital accountis then carried forward to the balance sheet, whichhelps to relate income statement information tobalance sheet information.
3. Balance sheet. The balance sheet is divided intoassets, liabilities, and stockholders’ equity and

JWBT150-Vallabhaneni c06 July 28, 2009 17:41
LEARNING OBJECTIVE 6.3: UNDERSTAND THE TYPES AND CONTENTS OF FINANCIAL STATEMENTS 123
reflects the balances in these accounts at the endof the year.
4. Statement of Cash Flows. A Statement of CashFlows is prepared either in conjunction with thebalance sheet or separately. It directly or indirectlyreflects an entity’s cash receipts classified by ma-jor sources and its cash payments classified bymajor uses during a period, including cash flowinformation about its operating, financing, andinvesting activities.
Contents of Financial StatementsThe full set of four financial statements discussedin this section is based on the concept of financialcapital maintenance. For a period, the full set shouldshow the following:
Income StatementThe income statement, also known as the Statementof Income, Statement of Earnings, or Statement ofOperations, summarizes the results of an entity’seconomic activities or performance for a period oftime (i.e., an accounting period). It also measures afirm’s profitability over a specific period. Manage-ment of the enterprise is concerned with the incomestatement since it is curious to find out how effi-ciently or effectively resources are used and howinvestors and creditors view the income statement.
A simplified format of income statement is shownhere, as it may not contain all the components.
DV Knowledge Corporation
Income Statement
Gross sales
Less: Returns and allowancesNet salesLess: Cost of goods sold
Fixed costsVariable costs
Gross profit or margin
Less: operating expensesFixed expensesVariable expenses
Operating income (EBIT)
Less: Interest expensesNet income before taxesLess: Taxes
Net income after taxesLess: Cash dividends to preferred stockholders
Net income (loss)
Earnings per share (EPS) to common stockholders
Notes: Total revenues can include revenues from gross sales
of products and services, dividend revenues, and rental rev-
enues. Cost of goods sold includes wages, materials, rent,
supplies, and utilities to manufacture goods. Operating ex-
penses include selling, general, administrative, lease, and de-
preciation expenses, classified as fixed or variable. Operating
income is same as earnings before interest and taxes (EBIT).
Net income or loss is posted to retained earnings account on
the balance sheet. Net income is earnings available to com-
mon stockholders. EPS is calculated as net income divided by
the number of common shares outstanding.
Major components and items required to be pre-sented in the income statement include: income fromcontinuing operations, results from discontinued op-erations, extraordinary items, accounting changes,net income, and earnings per share.
Income from Continuing Operations Sales or rev-enues are charges to customers for the goods and/orservices provided during the period. Both gross andnet sales/revenues should be presented by showingdiscounts, allowances, and returns.
Cost of goods sold is the cost of inventory itemssold during the period for a manufacturing or retailcompany.
Operating expenses are primary recurring costsassociated with business operations to generate salesor revenues. They do not include cost of goodssold but include selling expenses (e.g., salespersonsalaries, commissions, advertising) and general andadministrative expenses (e.g., salaries, office sup-plies, telephone, postage, utilities, accounting andlegal services). An expense is to be recognized when-ever economic benefits have been consumed.
Gains and losses stem from the peripheral trans-actions of the enterprise. Examples are write-downsof inventories and receivables, effects of a strike, andforeign currency exchange gains and losses.
Losses result from peripheral or incidental transac-tions, whereas expenses result from ongoing majoror central operations of the entity. Expense accountsare costs related to revenue, whereas loss accountsare not related to revenue.

JWBT150-Vallabhaneni c06 July 28, 2009 17:41
124 Learning Module 6: Accounting
Other revenues and expenses are revenues and ex-penses not related to the operations of the enterprise.Examples include gains and losses on the disposalof equipment, interest revenues and expenses, anddividend revenues. A material gain on the sale of afully depreciated asset should be classified on the in-come statement as part of other revenues and gains.Since the sale of an asset is not an operating item, itshould be classified as other revenues and gains.
Income tax expense relates to continuing opera-tions.
Results from Discontinued Operations It contains twocomponents. The first component, income (loss)from operations, is disclosed for the current yearonly if the decision to discontinue operations is madeafter the beginning of the fiscal year for which thefinancial statements are being prepared. The secondcomponent, gain (loss) on the disposal, contains in-come (loss) from operations during the phaseout pe-riod and gain (loss) from disposal of segment as-sets. Discontinued operations are presented afterincome from continuing operations and before ex-traordinary income on the income statement. Thedisposal of a line of business is normal and any lossshould be treated as an ordinary loss.
Extraordinary Items Two criteria must be met toclassify an event or transaction as an extraordinaryitem: unusual nature (high degree of abnormality,clearly unrelated to, or only incidentally related to)and infrequency of occurrence (not reasonably ex-pected to recur in the foreseeable future).
Accounting Changes A change in accounting prin-ciples (including methods of applying them) resultsfrom adoption of GAAP different from the ones pre-viously used for reporting purposes. The effect onnet income of adopting the new accounting principleshould be disclosed as a separate item following ex-traordinary items in the income statement. Changesin accounting estimates (lives of fixed assets, ad-justments of the costs) are not considered errors orextraordinary items; instead, they are considered asprior-period adjustments.
Net Income Obviously, net income is derived bysubtracting “results from discontinued operations,”“extraordinary items,” and “cumulative effect ofchanges in accounting principles” from “incomefrom continuing operations.”
Earnings per share Earnings per share (EPS) isa compact indicator of a company’s financial
performance. It is used to evaluate a firm’s stockprice, in assessing the firm’s future earnings poten-tial, and in determining the ability to pay dividends.EPS is calculated as net income minus preferred dividendsdivided by the weighted-average of common shares out-standing. EPS must be disclosed on the face of theincome statement. EPS may be disclosed parentheti-cally when only a one-per-share amount is involved.
EPS is required to be reported for the followingitems:
� Income from continuing operations� Income before extraordinary items and cumulative
effect of changes in accounting principles� Cumulative effect of changes in accounting princi-
ples� Net income� Results from (gain/loss on) discontinued opera-
tions (optional)� Gain or loss on extraordinary items (optional)
The following are limitations of income statements:
� Items that cannot be quantified with any degreeof reliability were not included in determiningincome (i.e., economic income versus accountingincome).
� Income numbers are often affected by the account-ing methods employed (e.g., depreciation).
� Increases in income may result from a nonoperat-ing or nonrecurring event that is not sustainableover a period of time (e.g., one-time tax forgive-ness, exchange of preferred stock).
The following are limitations of accrual-based ac-counting for earnings:
� Information about the liquidity and potential cashflows of an organization is absent.
� The income statement does not reflect earnings incurrent dollars.
� Estimates and judgments must be used in prepar-ing the income statement.
Statement of Retained Earnings and Statementof Stockholders’ EquityThe Statement of Retained Earnings is a reconcil-iation of the balance of the retained earnings ac-count from the beginning to the end of the year. Thisstatement tells the reader how much money manage-ment is plowing back into the business. Prior-periodadjustments, including correction of errors (net oftaxes), are charged or credited to the opening bal-ance of retained earnings.

JWBT150-Vallabhaneni c06 July 28, 2009 17:41
LEARNING OBJECTIVE 6.3: UNDERSTAND THE TYPES AND CONTENTS OF FINANCIAL STATEMENTS 125
Net income is added and dividends declared aresubtracted to arrive at the ending balance of retainedearnings. This statement may report two separateamounts: retained earnings free (unrestricted) andretained earnings appropriated (restricted).
A simplified format of retained earnings statementis shown here, as it may not contain all the compo-nents.
DV Knowledge Corporation
Statement of Retained Earnings
Retained earnings balance at the beginning ofthe period
Prior period adjustments, net of taxes (+/−)Correction of an error, net of taxes (+/−)Net income (loss) for the period (+/−)Cash dividends declared (−)Retained earnings balance at the end of the
period (=)
Notes: Retained earnings are increased by revenues, de-
creased by expenses, and decreased by dividends; they can be
restricted or unrestricted. Cash dividends declared includes
dividends on preferred stock and common stock.
The Statement of Stockholders’ Equity showsinvestments by and distributions to owners as itreflects an entity’s capital transactions during aperiod—the extent to which and in what ways the eq-uity of the entity increased or decreased from trans-actions with investors as owners.
A simplified format of stockholders’ equity state-ment is shown here, as it may not contain all thecomponents.
DV Knowledge Corporation
Statement of Stockholders’ Equity
Preferred stock at par (+)Common stock at par (+)Treasury stock (−)Paid-in-capital (+)Property and stock dividends (−)Retained earnings (+/−)Total stockholders’ equity (=)
Notes: Paid-in-capital is in excess of par. Stockholders’ equity
is increased by sale of preferred and common stock, decreased
by purchase of treasury stock, and decreased by property and
stock dividends.
Balance SheetThe Statement of Financial Position (balance sheet)presents assets, liabilities, and shareholders’ equity.The balance sheet provides a basis for assessing theliquidity and financial flexibility of an entity, com-puting rates of return on investments, and evaluat-ing the capital structure of an entity. It reflects the fi-nancial status (health) of an enterprise in conformitywith GAAP. The balance sheet reports the aggregate(and cumulative) effect of transactions at a point intime, whereas the Statement of Income, Statement ofRetained Earnings, and the Statement of Cash Flowsreport the effect of transactions over a period of time.The balance sheet is based on historical cost, the ex-change price principle, or the acquisition price.
A simplified format of balance sheet is shown here,as it may not contain all the components.
DV Knowledge Corporation
Balance Sheet
AssetsLiabilities and Stockholders’Equity
Current assets Current liabilitiesCash (1) Accounts payable (20)Marketable securities (2) Taxes payable (21)Net accounts receivable (3) Notes payable (22)Notes receivable (4) Interest payable (23)Inventories (5) Accruals (24)Prepaid expenses (6)
Total current assets (7)Total current liabilities (25 =
20 + 21 + 22 + 23 + 24)
Gross non-current assets Long-term liabilitiesVehicles and leases (8) Bonds/loans/notes (26)Land and buildings (9)Machinery and
equipment (10)Furniture and fixtures
(11)Total gross non-current
assets (12)Less: Accumulated
depreciation (13)Net non-current assets
(14 = 12 – 13)
Intangible assets (15)Total assets (16 = 7 +
14 + 15)
Mortgage payable (27)Total long-term liabilities
(28 = 26 + 27)Total liabilities (29 = 25 + 28)Stockholders’ equity
Preferred stock at par (30)Common stock at par (31)Treasury stock (32)Paid-in capital (33)Property and stock
dividends (34)Retained earnings (35)
Total stockholders’ equity (36)
Total liabilities andstockholders’ equity (37)
Notes: Total assets must be equal to total liabilities and stock-
holders’ equity. Net accounts receivable is gross accounts
receivable minus allowance for doubtful accounts. Inven-
tories include raw materials, work-in-process, and finished
goods. Total current assets are 7 = 1 + 2 + 3 + 4 + 5 + 6.
(Continued )

JWBT150-Vallabhaneni c06 July 28, 2009 17:41
126 Learning Module 6: Accounting
Non-current assets are fixed or long-term assets. The book
value of a fixed asset is historical cost minus accumulated
depreciation. Total gross non-current assets are 12 = 8 + 9 +10 + 11. Intangible assets include patents, copyrights, trade-
marks, and franchises. Paid-in capital is excess of par on com-
mon and preferred stock. Retained earnings are coming from
the income statement, thus providing a link between the bal-
ance sheet and the income statement. Total stockholders’ eq-
uity is 36 = 30 + 31 + 32 + 33 + 34 + 35. Total liabilities and
stockholders’ equity is 37 = 29 + 36.
Assets Assets are classified as “current” if they arereasonably expected to be converted into cash, sold,or consumed either in one year or in the operatingcycle, whichever is longer.
Current assets include cash, short-term invest-ments, receivables, inventories, and prepaid ex-penses. The key criterion to include in current assetsis the length of the operating cycle. When the cycleis less than one year, the one-year concept is used.When the cycle is very long, the usefulness of theconcept of current assets diminishes.
Noncurrent assets include long-term investments;property, plant, and equipment; and intangible as-sets.
Other assets include accounts that do not fit in theabove asset categories. Examples include long-termprepaid expenses, deferred taxes, bond issue costs,noncurrent receivables, and restricted cash.
Liabilities Liabilities are classified as “current” ifthey are expected to be liquidated through the useof current assets or the creation of other current lia-bilities. Liabilities are presented in the balance sheetin the order of payment. It is grouped into three cat-egories: current, noncurrent, and other.
Current liabilities include: obligations arisingfrom the acquisition of goods and services enteringthe operating cycle, collections of money in advancefor the future delivery of goods or performance ofservices, and other obligations maturing within thecurrent operating cycle to be met through the use ofcurrent assets.
Noncurrent liabilities include: obligations arisingthrough the acquisition of assets, obligations arisingout of the normal course of operations, and contin-gent liabilities involving uncertainty as to possiblelosses.
Other liabilities include: deferred charges, non-current receivables, intangible assets, deferred in-come taxes, or deferred investment tax credits.
Classification of Shareholders’ Equity Shareholders’equity arises from the ownership relation and is thesource of enterprise distribution to the owners. Eq-uity is increased by owners’ investments and com-prehensive income and is reduced by distributionsto the owners.
Shareholders’ equity is the interest of the stock-holders in the assets of an enterprise. It shows thecumulative net results of past transactions. Spe-cific components include capital stock (e.g., com-mon stock and preferred stock), additional paid-incapital, donated capital, retained earnings, treasurystock, dividends, and adjustments of equity.
Limitations of Balance SheetsThe following are limitations of the balance sheet:
� It does not reflect current values. Items arerecorded at a mixture of historical cost and currentvalues. Historical cost used to record assets and lia-bilities does not always reflect current value. Mon-etary assets such as cash, short-term investments,and receivables closely approximate current val-ues. Similarly, current liabilities closely approxi-mate current value and should be shown on thebalance sheet at face value.
� Fixed assets are reported at cost less deprecia-tion, depletion, or amortization. Inventories andmarketable equity securities are exceptions to his-torical cost, where they are allowed to be re-ported at lower of cost or market. Similarly, certainlong-term investments, which is another excep-tion, are reported under the equity method. Long-term liabilities are recorded at the discounted valueof future payments.
� Judgments and estimates are used to determine thecarrying value or book value of many of the assets.Examples include determining the collectability ofreceivables, salability of inventory, and useful lifeof fixed (long-term) assets. Estimations are not nec-essarily bad except there is no accounting guidanceavailable.
� Appreciation of assets is not recorded except whenrealized through an arm’s-length transaction.
� Internally generated goodwill, customer base,managerial skills and talent, reputation, technicalinnovation, human resources, and secret processesand formulas are not recorded in the balance sheet.Only assets obtained in a market transaction arerecorded.
� It ignores the time value of its elements. Mostitems are stated at face value regardless of the

JWBT150-Vallabhaneni c06 July 28, 2009 17:41
LEARNING OBJECTIVE 6.3: UNDERSTAND THE TYPES AND CONTENTS OF FINANCIAL STATEMENTS 127
timing of the cash flows that they will generate.Exceptions are certain long-term receivables andpayables, which are discounted.
� It omits off-balance-sheet items (mostly liabilities)such as sales of receivables with recourse, leases,throughput arrangements, and take-or-pay con-tracts.
Statement of Cash FlowsThe Statement of Cash Flows (SCF) requires threeclassifications:
1. Operating activities include all transactions thatare not investing and financing activities. It in-cludes delivering or producing goods for sale andproviding services to customers. It involves casheffects of transactions that enter into the determi-nation of net income for the period.
2. Investing activities show the acquisition and dis-position of long-term productive assets or secu-rities that are not considered cash equivalents. Italso includes the lending of money and collectionof loans.
3. Financing activities include obtaining resourcesfrom and returning resources to the owners. Italso includes resources obtained from creditorsand repaying the amount borrowed.
A simplified format of cash flows statement isshown here, as it may not contain all the compo-nents.
DV Knowledge Corporation
Statement of Cash Flows
Cash flows from operating activities
Net income after taxes +Depreciation, amortization, or depletion +Decrease in accounts receivable +Decrease in inventories +Increase in accounts payable +Decrease in accruals −
Total net cash flows from operatingactivities (1) =
Cash flows from investment activities
Increase in gross fixed assets −Proceeds from sale of fixed assets +
Total net cash flows from investmentactivities (2) =
Cash flows from financing activities
Decrease in notes payable −Increase in long-term debt +Proceeds from sale of common stock +
Cash dividends paid −Total net cash flows from financing
activities (3) =Net increase or decrease in cash (4 = 1 + 2 + 3)
Add: Cash at the beginning of the yearCash at the end of the year
Notes: Cash at the end of the year must be equal to the cash
account in the balance sheet. Retained earnings are excluded
here because they were already included in the net income
after taxes and cash dividends paid. Operating cash flows af-
fect current assets and current liabilities, investing cash flows
affect long-term assets, and financing cash flows affect long-
term liabilities and stockholder’s equity on the balance sheet.
The following tables present examples of the SCFclassifications in terms of cash inflows and cashoutflows:
Cash Inflows
Operating Investing Financing
Cash receiptsexceed cashexpenditures
Receipts from saleof goods orservices
Returns on loans(interest)
Returns on equitysecurities(dividends)
Principalcollectionsfrom loans
Sale of long-termdebt or equitysecurities
Sale of property,plant, andequipment
Proceeds fromissuing equitysecurities
Proceeds fromissuing short-termor long-term debt(e.g., bonds andnotes)
Cash Outflows
Operating Investing Financing
Cash expendituresexceed cashreceipts
Payments forinventory
Payments toemployees
Payments oftaxes
Payments ofinterest
Payments tosuppliers
Loans made toothers
Purchase oflong-term debt orequity securities
Purchase ofproperty, plant,and equipment
Payment ofdividends
Repurchase ofentity’s capitalstock (e.g.,treasury stock)
Repayment of debtprincipal

JWBT150-Vallabhaneni c06 July 28, 2009 17:41
128 Learning Module 6: Accounting
Noncash exchange gains and losses recognized onthe income statement should be reported as a sepa-rate item when reconciling net income and operatingactivities.
Specifically, the SCF should help investors andcreditors assess:
� Ability to generate future positive cash flows� Ability to meet obligations and pay dividends� Reasons for differences between income and cash
receipts and cash payments� Both cash and noncash aspects of entities’ invest-
ing and financing transactions
Noncash Investing and Financing ActivitiesCash may not be required in all cases to acquire assetsor to pay off debts; instead, a debt or stock might beinvolved. Under these conditions, a separate sched-ule is needed to show the noncash investing andfinancing activities.
A simplified format of noncash flows schedule isshown here, as it may not contain all the components.
DV Knowledge Corporation
Schedule of Noncash Investing and FinancingActivities
Acquisition of building by issuing commonstock
+
Acquisition of land by issuing notes payable +Payment of note payable by issuing
common stock+
Total noncash investing and financingactivities
=
❑ Learning Objective 6.4:UNDERSTAND THEINTERMEDIATE CONCEPTSOF FINANCIAL ACCOUNTINGThe scope of intermediate concepts in financial ac-counting includes bonds, notes, leases, pensions, in-tangible assets, and research and development.
Bonds and NotesBonds result from a single agreement. However,a bond is divided into various subunits. Notesand bonds have similar characteristics. These in-clude a written agreement stating the amount of the
principal to be paid, the interest rate, when the inter-est and principal are to be paid, and the restrictivecovenants.
The stated interest rate on a note or bond oftendiffers from the market interest rate at the time of is-suance. When this occurs, the present value of theinterest and principal payments will differ fromthe maturity, or face value. Possible scenarios includethe following:
� When the market rate exceeds the stated rate, theinstrument is sold at a discount, meaning that thecash proceeds are less than the face value.
� When the stated rate exceeds the market rate, theinstrument is sold at a premium, meaning that thecash proceeds are more than the face value.
� When the market and stated rates are the same atthe time of issuance, no discount or premium existsand the instrument will be sold at its face value.
The proper valuation is the present value of thefuture payments using the market rate of interest,either stated or implied in the transaction, at the datethe debt was incurred.
Nominal rate, stated rate, or coupon rate are allnames for the interest rate stated on a bond. The pe-riodic interest payments on a bond are determinedby this rate. However, the price at which the bondsare sold determines the actual interest expense in-curred on the bond issue. The actual rate of interestincurred is called the effective rate, the yield rate, orthe market rate and is determined by the investmentmarket.
When a bond sells at par value or face amount, theeffective interest rate and the stated rate are equal.When a bond sells at a discount (below par), theeffective rate is greater than the stated rate. When abond sells at a premium (above par), the stated rateis greater than the effective rate of the bond; then thebond will sell at a discount. If the prevailing marketrate of interest is less than the stated rate, then thebond will sell at a premium.
When a note is issued solely for cash, the present valueof the note is the cash proceeds. The present value ofthe note minus its face amount is the amount of thediscount or premium. The interest expense on sucha note is the stated or coupon interest plus or minusthe amortization of any discount or premium.
When a note is issued in a noncash transaction and nointerest rate is stated, and if the stated interest rate isunreasonable or if the stated face amount of the noteis materially different from the current cash salesprice for similar items or from the market value of

JWBT150-Vallabhaneni c06 July 28, 2009 17:41
LEARNING OBJECTIVE 6.4: UNDERSTAND THE INTERMEDIATE CONCEPTS OF FINANCIAL ACCOUNTING 129
the note at the date of the transaction, then the noteissued and the property, goods, or services receivedshould be recorded at the fair value of the property,goods, or services. If the fair value of the noncashitem cannot be determined, then the market value ofthe note should be used.
A discount or premium is recognized when there isa difference between the face amount of the note andits fair value. This discount or premium should beamortized over the life of the note. If neither the fairvalue of the noncash item nor the market value ofthe note is determinable, then the present value of thenote should be determined by discounting all futurepayments on the note using an imputed interest rate.
Short-term obligations that are expected to be re-financed on a long-term basis may be classified aslong-term liabilities on the balance sheet. The re-quirements for classification as long-term are as fol-lows: management intends to refinance the obliga-tions on a long-term basis and demonstrates theability to obtain the refinancing.
Bondholders have a prior claim to the earningsand assets of the issuing organization. They rankahead of preferred and common stockholders. Inter-est must first be paid to bondholders before div-idends can be distributed to stockholders. Bond-holders have a prior claim on assets in the case ofdissolution or bankruptcy.
LeasesA lease agreement involves at least two parties(lessor, lessee) and an asset. The lessor, who owns theasset, agrees to allow the lessee to use it for a spec-ified period of time for rent payments. The key pointin leases is the transfer of risk of ownership. If the trans-action effectively transfers ownership to the lessee,then it should be treated as a sale even though thetransaction takes the form of a lease. Here, the sub-stance, not the form, dictates the accounting treat-ment. Two types of leases exist: capital and operatinglease.
Suggested disclosures for the lessee include thefollowing:
For Capital Leases� The gross amount of assets recorded� Future minimum lease payments in the aggregate� Total of minimum sublease rentals to be received� Total contingent rentals actually incurred for each
period� Depreciation
For Operating Leases� Future minimum lease payments in the aggregate� Total of minimum rentals that will be received un-
der noncancelable subleases� Rental expenses separated into minimum rentals,
contingent rentals, and sublease rentals
Suggested disclosures for the lessor include the fol-lowing:
For Sales-Type and Direct Financing Leases� Components of the net investment in leases in-
cluding future minimum lease payments, unguar-anteed residual values, initial direct costs for directfinancing leases, and unearned interest revenue
� Future minimum lease payments� Total contingent rentals included in income
For Operating Leases� The cost and carrying amount of property leased� Minimum rentals on noncancelable leases in the
aggregate� Total contingent rentals included in income
A lessor has four types of choices in classifying alease:
1. Sales-type leases2. Direct financing leases3. Operating leases4. Participation by third parties
Leases involving Real EstateLeases involving real estate can be divided into fourcategories: (1) leases involving land only, (2) leasesinvolving land and buildings, (3) leases involvingequipment as well as real estate, and (4) leases in-volving only part of a building.
Sale-Leaseback TransactionsSale-leaseback transactions involve the sale of prop-erty by the owner and a lease of the property backto the seller. The seller-lessee must account for thelease as a capital lease or an operating lease.
Accounting and Reporting for Leveraged LeasesFrom the standpoint of the lessee, leveraged leasesshall be classified and accounted for in the samemanner as nonleveraged leases. The balance of thissection deals with leveraged leases from the stand-point of the lessor.

JWBT150-Vallabhaneni c06 July 28, 2009 17:41
130 Learning Module 6: Accounting
Leveraged lease is defined as one having all of thefollowing characteristics:� Direct financing and sales-type leases are not in-
cluded.� It involves at least three parties: a lessee, a long-
term creditor, and a lessor (commonly called theequity participant).
� The financing provided by the long-term creditoris nonrecourse as to the general credit of the lessor.The amount of the financing is sufficient to providethe lessor with substantial leverage in the tran-saction.
� The lessor’s net investment declines during theearly years once the investment has been com-pleted and rises during the later years of the leasebefore its final elimination. Such decrease and in-crease in the net investment balance may occurmore than once.
PensionsThe principal focus in pensions is the present valueof the pension obligation, the fair value of plan as-sets, and the disclosure of the makeup of net pensioncosts and of the projected benefit obligation. The crit-ical accounting issues are the amount to be expensedon the income statement and the amount to be ac-crued on the balance sheet.
Employer commitment to employees takes theform of contributions to an independent trustee. Thetrustee then invests the contributions in various planassets such as Treasury bills and bonds, certificates ofdeposit, annuities, marketable securities, corporatebonds, and stock. The plan assets generate interestand/or appreciate in asset value. The return on theplan assets provides the trustee the money to pay thebenefits to which the employees are entitled. Thesebenefits are defined by the terms of the pension planusing a plan’s benefit formula. The formula is usedto determine the pension cost for each year. The for-mula takes into account factors such as employeecompensation, service length, age, and other factorsto determine pension costs.
Pension expense is determined by adding upfive components, which affect the pension expenseamount as follows:
Component Effect
1. Service cost Increases2. Interest cost Increases3. Actual return on plan assets Generally decreases4. Prior service cost Generally decreases5. Net total of other components
(gain or loss)5 = 1 + 2 + 3 + 4
Increases or decreases
Intangible AssetsTypically intangible assets lack physical existenceand have a high degree of uncertainty regardingtheir future benefits. These assets have value becauseof the business advantages of exclusive rights andprivileges they provide. The two sources of intangi-ble assets are:
1. Exclusive privileges granted by authority of thegovernment or legal contract, which includespatents, copyrights, trademarks, franchises, andorganization costs (e.g., legal fees) for incorporat-ing a new business.
2. Superior entrepreneurial capacity or managementknow-how and customer loyalty, that is, good-will.
Intangible assets are initially recorded at cost.Therefore, the costs of intangible assets, except forgoodwill, are relatively easy to determine. These as-sets must be amortized over their expected usefullife but not to exceed 40 years. An organization mustuse straight-line amortization, unless it can provethat another method is more appropriate. The amor-tization of intangible assets over their useful lives isjustified by the going-concern assumption.
Summary of Amortization Periods
� Copyrights not to exceed 40 years� Trademarks not to exceed 40 years� Patents not to exceed 17 years� Organization costs not to exceed 40 years� Goodwill not to exceed 40 years
Some intangible assets, since they cannot be sep-arated from the business as a whole, are not specif-ically identifiable. Goodwill is a prime example ofthis type of intangible.
Goodwill arises when an organization’s value as awhole exceeds the fair market value of its net assets.This typically occurs when an organization gener-ates more income than other organizations with thesame assets and capital structure. Superior manage-ment, a superior reputation, or valuable customerlists are examples of factors that may contribute tothese excess earnings.
Product R&D CostsThe scope of research and development (R&D)deals with manufacturing a product and develop-ing software.
Accounting standards require R&D costs to be ex-pensed as incurred except for intangible or fixed
JWBT150-Vallabhaneni c06 July 28, 2009 17:41
LEARNING OBJECTIVE 6.4: UNDERSTAND THE INTERMEDIATE CONCEPTS OF FINANCIAL ACCOUNTING 131
assets purchased from others having alternativefuture uses. Thus, the cost of patents and R&Dequipment purchased from third parties may bedeferred, capitalized, and amortized over the as-sets’ useful life. However, internally developed R&Dmay not be deferred and therefore should be ex-pensed. R&D done under contract for others is notrequired to be expensed. The costs incurred would bematched with revenue using the completed-contractor percentage-of-completion method. The key ac-counting concept is: expense R&D costs as incurredand disclose total R&D expenses per period on faceof income statement or notes.
R&D activities included in the standard are labora-tory research to discover new knowledge, formula-tion, and design of product alternatives (e.g., testingand modifications); preproduction prototypes andmodels (e.g., tools, dies, and pilot plants); and en-gineering activity until product is ready for manu-facture.
R&D activities excluded from the standard are(1) engineering during an early phase of commer-cial production, (2) quality control for commercialproduction, (3) troubleshooting during commercialproduction breakdowns, (4) routine, ongoing ef-forts to improve products, (5) adaptation of exist-ing capability for a specific customer, (6) seasonaldesign changes to products, (7) routine design oftools and dies, (8) design, construction, and startupof equipment except that used solely for R&D,and (9) legal work for patents or litigation. Item9 is capitalized, whereas the other eight items areexpensed.
Elements of R&D costs include: materials, equip-ment, and facilities, salaries, wages, and relatedcosts, intangibles purchased from others, which aretreated as materials, R&D services performed by oth-ers, and a reasonable allocation of indirect costs, ex-cluding general and administrative costs not clearlyrelated to R&D.
Software Developed for Sale or LeaseThe costs incurred internally to create softwareshould be expensed as R&D costs until technolog-ical feasibility is established. Thereafter, all costsshould be capitalized and reported at the lower ofunamortized cost or net realizable value. Capitaliza-tion should cease when the software is available forgeneral release to customers.
The annual amortization of capitalized computersoftware costs will be the greater of the ratio of cur-rent revenues to anticipated total revenues or the
straight-line amortization, which is based on the es-timated economic life. Once the software is availablefor general release to customers, the inventory costsshould include costs for duplicating software and forphysically packaging the product. The cost of main-tenance and customer support should be charged toexpense in the period incurred.
Software Developed for Internal UseSoftware must meet two criteria to be accountedfor as internally developed software. First, the soft-ware’s specifications must be designed or modifiedto meet the reporting entity’s internal needs, includ-ing costs to customize purchased software. Second,during the period in which the software is beingdeveloped, there can be no plan or intent to mar-ket the software externally, although developmentof the software can be jointly funded by severalentities, each of which plan to use the softwareinternally.
In order to justify capitalization of related costs,it is necessary for management to conclude that itis probable that the project will be completed andthat the software will be used as intended. Absentthat level of expectation, costs must be expensed cur-rently as R&D costs are required to be. Entities thathistorically were engaged in both research and de-velopment of software for internal use and for saleto others would have to carefully identify costs withone or the other activity, since the former would besubject to capitalization, while the latter might be ex-pensed as R&D costs until technological feasibilitywas demonstrated.
Under terms of the standard, cost capitalizationcommences when an entity has completed the con-ceptual formulation, design, and testing of possibleproject alternatives, including the process of vendorselection for purchased software, if any. These early-phase costs (i.e., preliminary project stage costs) aresimilar to R&D costs and must be expensed as in-curred.
Costs incurred subsequent to the preliminaryproject stage and that meet the criteria underGAAP as long-lived assets can be capitalized andamortized over the asset’s expected economic life.Capitalization of costs will begin when both of twoconditions are met. First, management having therelevant authority approves and commits to fundingthe project and believes that it is probable that it willbe completed and that the resulting software will beused as intended. Second, the conceptual formula-tion, design, and testing of possible software project

JWBT150-Vallabhaneni c06 July 28, 2009 17:41
132 Learning Module 6: Accounting
alternatives (i.e., the preliminary project stage) havebeen completed.
❑ Learning Objective 6.5:UNDERSTAND THE ADVANCEDCONCEPTS OF FINANCIALACCOUNTINGThe scope of advanced concepts in financial account-ing includes business combination, consolidatedfinancial statements, partnerships, and foreign cur-rency transactions.
Business CombinationsA business combination occurs when an entity ac-quires net assets that constitute a business or ac-quires equity interests of one or more other enti-ties and obtains control over that entity or entities.Business combinations may be friendly or hostiletakeovers. Purchase accounting is the only accept-able accounting method for all business combina-tions; the pooling-of-interest method is not.
Consolidated Financial StatementsThe purpose of consolidated financial statementsis to present for a single accounting entity the com-bined resources, obligations, and operating resultsof a group of related corporations such as parentand subsidiaries. Only subsidiaries not actually con-trolled should be exempted from consolidation. Usu-ally, an investor’s direct or indirect ownership ofmore than 50 percent of an investee’s outstandingcommon sock has been required to evidence the con-trolling interest underlying a parent–subsidiary re-lationship. Actual control is more important thanthe controlling interest in situations such as liquida-tion or reorganization (bankruptcy) of a subsidiaryor control of a foreign subsidiary by a foreign gov-ernment. GAAP require the use of the cost method ofaccounting for investments in unconsolidated sub-sidiaries because the subsidiaries generally are nei-ther controlled nor significantly influenced by theparent company.
Assets, liabilities, revenues, and expenses of theparent company and its subsidiaries are totaled;intercompany transactions and balances are elimi-nated; and the final consolidated amounts are re-ported in the consolidated balance sheet, incomestatement, Statement of Stockholders’ Equity, State-ment of Retained Earnings, and Statement of CashFlows.
PartnershipsA partnership is an association of two or more peo-ple to carry on as co-owners of a business for profit.Competent parties agree to place their money, prop-erty, or labor in a business and to divide the profitsand losses. Each person is personally liable for thedebts of the partnership. Express partnership agree-ments may be oral or written.
Partnerships are not subject to the income tax. Thepartnership net profit or loss is allocated to eachpartner according to the partnership’s profit-sharingagreement. Each partner reports these items on hisown tax return. Several separately reported items(e.g., capital gains, charitable contributions) retaintheir character when passed through to the partners.
If a firm is insolvent and a court of equity is respon-sible for the distribution of the partnership assets,the assets are distributed in accordance with a ruleknown as marshalling of assets. The firm’s credi-tors may seek payment out of the firm’s assets andthen the individual partner assets. The firm’s cred-itors must exhaust the firm’s assets before recourseto the partners’ individual assets. The descending or-der of asset distribution of a limited partnership is asfollows:
1. To secured creditors other than partners2. To unsecured creditors other than partners3. To limited partners in respect of their profits4. To limited partners in respect of their capital con-
tributions5. To general partners in respect of any loans to the
partnership6. To general partners in respect of their profits7. To general partners in respect of their capital con-
tributions
The asset distribution hierarchy of a limited part-nership is shown in the figure.
Creditors
Limited partners
• Secured• Unsecured
General partners
• Profits• Capital contributions
• Loans• Profits• Capital contributions
First priority
Contributions
Last priority
Foreign Currency TransactionsThe buying and selling of foreign currency trans-actions result in variations in the exchange rate

JWBT150-Vallabhaneni c06 July 28, 2009 17:41
LEARNING OBJECTIVE 6.6: LEARN HOW TO ANALYZE FINANCIAL STATEMENTS 133
between the currencies of two countries. The sell-ing spot rate is charged by the bank for current salesof the foreign currency. The bank’s buying spot ratefor the currency is less than the selling spot rate; thespread between the selling and buying spot ratesrepresents gross profit to a trader in foreign cur-rency. Factors influencing fluctuations in exchangerates include a nation’s balance of payments surplusor deficit, differing global rates of inflation, money-market variations such as interest rates, capital in-vestment levels, and monetary policies and actionsof central banks.
A multinational corporation (MNC) headquar-tered in the United States engages in sales, pur-chases, and loans with foreign companies as wellas with its own branches, divisions, investees, andsubsidiaries in other countries. If the transactionswith foreign companies are denominated in terms ofthe U.S. dollar, no accounting problems arise for theU.S.-based MNC. If the transactions are negotiatedand settled in terms of the foreign companies’ localcurrency unit, then the U.S. company must accountfor the transaction denominated in foreign currencyin terms of U.S. dollars. This foreign currency trans-lation is accomplished by applying the appropriateexchange rate between the foreign currency and theU.S. dollar.
In addition to spot rates, forward rates apply toforeign currency transactions to be completed ona future date. Forward rates apply to forward ex-change contracts, which are agreements to exchangecurrencies of different countries on a specified fu-ture date at the forward rate in effect when thecontract was made. Forward rates may be larger orsmaller than spot rates for a foreign currency, de-pending on the foreign currency dealer’s expecta-tions regarding fluctuations in exchange rates for thecurrency.
Increases in the selling spot rate for a foreign cur-rency required by a U.S.-based MNC to settle a liabil-ity denominated in that currency generate transac-tion losses to the company because more dollars arerequired to obtain the foreign currency. Conversely,decreases in the selling spot rate produce transac-tion gains to the company because fewer U.S. dol-lars are required to obtain the foreign currency. Incontrast, increases in the buying spot rate for a for-eign currency to be received by a U.S.-based MNC insettlement of a receivable denominated in that cur-rency generate transaction gains to the company; de-creases in the buying spot rate produce transactionlosses.
❑ Learning Objective 6.6:LEARN HOW TO ANALYZEFINANCIAL STATEMENTSFinancial statement analysis requires a comparisonof the firm’s performance with that of other firmsin the same industry, comparison with its own pre-vious performance, and/or both. Three major par-ties who analyze financial statements from their ownperspectives are: (1) managers of the firm, to gaugeperformance, (2) potential investors, who want to in-vest in the firm by purchasing stocks and bonds, and(3) creditors and lenders (e.g., bankers), who analyzedata in financial statements to assess the financialstrength of the firm and its ability to pay interestand principal for the money they lent to the firm.Investors use data in financial statements to form ex-pectations about future earnings and dividends andabout the riskiness of these expected values. The realvalue of financial statements is in their predictive powerabout the firm’s future earnings potential and dividendspayment strength.
Who Looks for What?
� Investors look for earnings and dividends, andthis is reflected in security values. Therefore,cash flows are the major basis for securityvalues.
� Creditors look for asset strength and the abilityto pay off debt.
� Financial statements report accounting profits.� High accounting profits generally mean high
cash flows and the ability to pay high dividendsand make debt payments.
A company’s annual report presents four basicfinancial statements: a Statement of Income (incomestatement), a Statement of Financial Position (bal-ance sheet), a Statement of Retained Earnings, anda Statement of Cash Flows. The income statementsummarizes the firm’s revenues and expenses overan accounting period.
Income StatementThe income statement presents the results of oper-ations for a given time period. Net sales are shownat the top; after which various costs, including in-come taxes, are subtracted to obtain the net incomeavailable to common stockholders. A report on earn-ings and dividends per share is given at the bottom of

JWBT150-Vallabhaneni c06 July 28, 2009 17:41
134 Learning Module 6: Accounting
the statement. A sample income statement is shownhere.
DV Knowledge Corporation
Income Statement
Gross sales
Less: Returns and allowancesNet salesLess: Cost of goods sold
Fixed costsVariable costs
Gross profit or margin
Less: operating expensesFixed expensesVariable expenses
Operating income (EBIT)
Less: Interest expensesNet income before taxesLess: TaxesNet income after taxesLess: Cash dividends to preferred stockholders
Net income (loss)
Earnings per share (EPS) to commonstockholders
Notes: Total revenues can include revenues from gross sales
of products and services, dividend revenues, and rental rev-
enues. Cost of goods sold includes wages, materials, rent,
supplies, and utilities to manufacture goods. Operating ex-
penses include selling, general, administrative, lease, and de-
preciation expenses, classified as fixed or variable. Operating
income is same as earnings before interest and taxes (EBIT).
Net income or loss is posted to retained earnings account on
the balance sheet. Net income is earnings available to com-
mon stockholders. EPS is calculated as net income divided by
the number of common shares outstanding.
Balance SheetThe balance sheet is a statement of the firm’s finan-cial position at a specific point in time. The firm’sassets are shown on the left-hand side of the balancesheet while liabilities and equity (the claims againstthese assets) are shown on the right-hand side. Theassets are listed in the order of their liquidity or thelength of time it takes to convert assets into cash.The liabilities are listed in the order in which theymust be paid. A sample balance sheet is shown here.
DV Knowledge Corporation
Balance Sheet
AssetsLiabilities and Stockholders’Equity
Current assets Current liabilitiesCash (1) Accounts payable (20)Marketable securities (2) Taxes payable (21)Net accounts receivable
(3)Notes payable (22)Interest payable (23)
Notes receivable (4) Accruals (24)Inventories (5)Prepaid expenses (6)
Total current assets (7)
Gross non-current assetsVehicles and leases (8)Land and buildings (9)Machinery andequipment (10)Furniture and fixtures
(11)Total gross non-current
assets (12)Less: Accumulated
depreciation (13)Net non-current assets
(14 = 12 – 13)
Intangible assets (15)Total assets (16 = 7 +
14 + 15)
Total current liabilities (25 =20 + 21 + 22 + 23 + 24)
Long-term liabilitiesBonds/loans/notes (26)Mortgage payable (27)
Total long-term liabilities(28 = 26 + 27)
Total liabilities (29 = 25 + 28)Stockholders’ equity
Preferred stock at par (30)Common stock at par (31)
Treasury stock (32)Paid-in capital (33)Property and stock
dividends (34)Retained earnings (35)
Total stockholders’ equity (36)
Total liabilities andstockholders’ equity (37)
Notes: Total assets must be equal to total liabilities and stock-
holders’ equity. Net accounts receivable is gross accounts re-
ceivable minus allowance for doubtful accounts. Inventories
include raw materials, work-in-process, and finished goods.
Total current assets are 7 = 1 + 2 + 3 + 4 + 5 + 6. Non-
current assets are fixed or long-term assets. The book value
of a fixed asset is historical cost minus accumulated depre-
ciation. Total gross non-current assets are 12 = 8 + 9 +10 + 11. Intangible assets include patents, copyrights, trade-
marks, and franchises. Paid-in capital is excess of par on com-
mon and preferred stock. Retained earnings are coming from
the income statement, thus providing a link between the bal-
ance sheet and the income statement. Total stockholders’ eq-
uity is 36 = 30 + 31 + 32 + 33 + 34 + 35. Total liabilities and
stockholders’ equity is 37 = 29 + 36.
Statement of Retained EarningsThe Statement of Retained Earnings shows howmuch of the firm’s earnings were not paid outin dividends. Retained earnings represent a claimagainst assets, not assets per se. Retained earningsdo not represent cash and are not “available” for thepayment of dividends or anything else. A positive

JWBT150-Vallabhaneni c06 July 28, 2009 17:41
LEARNING OBJECTIVE 6.6: LEARN HOW TO ANALYZE FINANCIAL STATEMENTS 135
retained earnings means that the firm has earnedan income, but its dividends have been less thanits reported income. Due to differences between ac-crual and cash accounting practices, a firm may earnmoney, which shows an increase in the retained earn-ings, but still could be short of cash. A sample State-ment of Retained Earnings is shown here.
DV Knowledge Corporation
Statement of Retained Earnings
Retained earnings balance at the beginning of theperiod
Prior period adjustments, net of taxes (+/−)Correction of an error, net of taxes (+/−)Net income (loss) for the period (+/−)Cash dividends declared (−)Retained earnings balance at the end of the period
(=)
Notes: Retained earnings are increased by revenues, de-
creased by expenses, and decreased by dividends; they can be
restricted or unrestricted. Cash dividends declared includes
dividends on preferred stock and common stock.
Statement of Cash FlowsThe Statement of Cash Flows reports the impact ofa firm’s operating, investing, and financing activitieson cash flows over an accounting period. This state-ment shows how the firm’s operations have affectedits cash flows and presents the relationships amongcash flows from operating, investing, and financingactivities of the firm. It presents net income, depre-ciation, and operating, investing, and financing ac-tivities. A sample Statement of Cash and NoncashFlows is shown here.
DV Knowledge Corporation
Statement of Cash Flows
Cash flows from operating activities
Net income after taxes +Depreciation, amortization, or depletion +Decrease in accounts receivable +Decrease in inventories +Increase in accounts payable +
Decrease in accruals −Total net cash flows from operating
activities (1) =
Cash flows from investment activitiesIncrease in gross fixed assets −Proceeds from sale of fixed assets +Total net cash flows from investment
activities (2) =
Cash flows from financing activitiesDecrease in notes payable −Increase in long-term debt +Proceeds from sale of common stock +Cash dividends paid −Total net cash flows from financing
activities (3) =
Net increase or decrease in cash (4=1+2+3)Add: Cash at the beginning of the yearCash at the end of the year
Notes: Cash at the end of the year must be equal to the cash
account in the balance sheet. Retained earnings are excluded
here because they were already included in the net income
after taxes and cash dividends paid. Operating cash flows af-
fect current assets and current liabilities, investing cash flows
affect long-term assets, and financing cash flows affect long-
term liabilities and stockholder’s equity on the balance sheet.
DV Knowledge Corporation
Schedule of Noncash Investing and FinancingActivities
Acquisition of building by issuing commonstock +
Acquisition of land by issuing notes payable +Payment of note payable by issuing
common stock +Total noncash investing and financing
activities =
Four types of measures that are used to analyzea company’s financial statements and its financialposition are common size analysis, trend analysis,comparative ratios, and single ratios.

JWBT150-Vallabhaneni c06 July 28, 2009 17:41
136 Learning Module 6: Accounting
Common Size AnalysisCommon size analysis expresses items in percent-ages, which can be compared with similar items ofother firms or with those of the same firm over time.For example, common size balance sheet line items(both assets and liabilities) are expressed as a per-centage of total assets (e.g., receivables as X percentof total assets). Similarly, common size income state-ment line items are expressed as a percentage of totalsales (e.g., cost of goods sold as X percent of totalsales).
Variations of common size analysis include verti-cal analysis and horizontal analysis. Vertical analy-sis expresses all items on a financial statement as apercentage of some base figure, such as total assets ortotal sales. Comparing these relationships betweencompeting organizations helps to isolate strengthsand areas of concern.
In horizontal analysis, the financial statementsfor two years are shown together with additionalcolumns showing dollar differences and percent-age changes. Thus, the direction, absolute amount,and relative amount of change in account balancescan be calculated. Trends that are difficult to isolatethrough examining the financial statements of indi-vidual years or comparing with competitors can beidentified.
Trend AnalysisTrend analysis shows trends in ratios, which givesinsight whether the financial situation of a firm is im-proving, declining, or stable. It shows a graph of ra-tios over time, which can be compared with a firm’sown performance as well as that of its industry.
Comparative RatiosComparative ratios show key financial ratios, suchas current ratio and net sales to inventory, by in-dustry, such as beverages and bakery products.These ratios represent average financial ratios forall firms within an industry category. Many ratiodata-supplying organizations are available and eachone designs ratios for its own purpose, such as smallfirms or large firms. Also, the focus of these ratiosis different too, such as creditor’s viewpoint or in-vestor’s viewpoint. Another characteristic of the ra-tio data-supplying organization is that each has itsown definitions of the ratios and their components.A caution is required when interpreting these ratiosdue to these differences.
Another type of comparative analysis is compar-ing the financial statements for the current year withthose of the most recent year. Also, by comparingsummaries of financial statements for the last five toten years, an individual can identify trends in oper-ations, capital structure, and the composition of as-sets. This comparative analysis provides insight intothe normal or expected account balances or ratios,information about the direction of changes in ratiosand account balances, and insight into the variabilityor fluctuation in an organization’s assets or opera-tions.
Single RatiosSingle ratios or simple ratios show logical relation-ships among certain accounts or items in financialstatements, expressed as fractions. These ratios aregrouped into five categories: liquidity ratios, assetmanagement ratios, debt management ratios, prof-itability ratios, and market value ratios.
Liquidity RatiosLiquidity ratios measure an organization’s debt-paying ability, especially in the short term. Theseratios indicate an organization’s capacity to meetmaturing current liabilities and its ability to gen-erate cash to pay these liabilities. Examples includecurrent ratio and quick ratio.
� Current ratio (working capital ratio): current assetsdivided by current liabilities. Current ratio indicatesan organization’s ability to pay its current liabil-ities with its current assets and, therefore, showsthe strength of its working capital position. A highcurrent ratio indicates a strong liquidity and viceversa. While a high current ratio is good, it couldalso mean excessive cash, which is not good.
Both short-term and long-term creditors are in-terested in the current ratio because a firm unableto meet its short-term obligations may be forcedinto bankruptcy. Many bond indentures requirethe borrower to maintain at least a certain mini-mum current ratio.
� Quick ratio (acid-test ratio): quick assets divided bycurrent liabilities. Quick assets are cash, marketablesecurities, and net receivables. This ratio is par-ticularly important to short-term creditors sinceit relates cash and immediate cash inflows to im-mediate cash outflows. Purchases of inventory on

JWBT150-Vallabhaneni c06 July 28, 2009 17:41
LEARNING OBJECTIVE 6.6: LEARN HOW TO ANALYZE FINANCIAL STATEMENTS 137
account would make the quick ratio decrease sinceit does not include inventory. Current liabilities in-crease, not current assets. Quick assets are currentassets minus inventory.
Asset Management RatiosAsset management ratios or activity ratios measurethe liquidity of certain assets and relate informationon how efficiently assets are being utilized. Exam-ples include inventory turnover ratio, days sales out-standing ratio, fixed assets turnover ratio, and totalassets turnover ratio.
� Inventory turnover ratio: sales divided by average in-ventory or cost of goods sold divided by average inven-tory. The inventory turnover indicates how quicklyinventory is sold. Typically, a high turnover indi-cates that an organization is performing well. Thisratio can be used in determining whether thereis obsolete inventory or whether pricing prob-lems exist. The use of different inventory valuationmethods (LIFO, FIFO, etc.) can affect the turnoverratio. It is also called inventory utilization ratio.As the obsolete inventory increases, the inventoryturnover decreases.
� Days sales outstanding ratio: receivables divided byaverage sales per day. Days sales outstanding (DSO)ratio indicates the average length of time that afirm must wait to receive cash after making a sale.It measures the number of days sales are tied up inreceivables. If the calculated ratio for a company is45 days, its sales terms are 30 days, and the indus-try average ratio is 35 days, it indicates that cus-tomers, on the average, are not paying their billson time. In the absence of a change in the creditpolicy about sales terms, the higher the company’sactual ratio, the greater the need to speed up thecollection efforts. A decrease in the DSO ratio is anindication of effective collection efforts.
Another related ratio is accounts receivableturnover ratio, which is net credit sales dividedby average net trade receivables outstanding. Theaverage receivables outstanding can be calculatedby using the beginning and ending balance of thetrade receivables. This ratio provides informationon the quality of an organization’s receivables andhow successful it is in collecting outstanding re-ceivables. A fast turnover lends credibility to thecurrent ratio and acid-test ratio.
� Fixed asset turnover ratio: net sales divided by netfixed assets. Fixed asset turnover ratio shows how
effectively the firm uses its fixed assets such asplant, equipment, machinery, and buildings. Acaution should be noted here that inflation erodesthe historical cost base of old assets thus reportinga higher turnover. This inflation problem makesit hard to compare fixed asset turnover betweenold and new fixed assets. Assets reported on cur-rent value basis would eliminate the inflation prob-lem. Fixed asset turnover is also called fixed assetsutilization ratio and is similar to the inventoryutilization ratio. A high fixed asset turnover ratiomay mean either that a firm was efficient in usingits fixed assets or that the firm is undercapitalizedand could not afford to buy enough fixed assets.
� Total assets turnover ratio: net sales divided by aver-age total assets. The total assets turnover indicateshow efficiently an organization utilizes its capitalinvested in assets. A high turnover ratio indicatesthat an organization is effectively using its assetsto generate sales. This ratio relates the volume ofa business (i.e., sales, revenue) to the size of itstotal asset investment. In order to improve this ra-tio, management needs to increase sales, disposeof some assets, or a combination of both.
Debt Management RatiosDebt management ratios or coverage ratios are usedin predicting the long-run solvency of organizations.Bondholders are interested in these ratios, becausethey provide some indication of the measure ofprotection available to bondholders. For those in-terested in investing in an organization’s commonstock, these ratios indicate some of the risk since theaddition of debt increases the uncertainty of the re-turn on common stock. Examples include debt-to-total-assets ratio, times-interest-earned ratio, fixedcharge coverage ratio, and cash flow coverage ratio.
� Debt ratio: total debt divided by total assets. Debtratio impacts an organization’s ability to obtainadditional financing. It is important to creditorsbecause it indicates an organization’s ability towithstand losses without impairing the creditor’sinterest. A creditor prefers a low ratio since itmeans there is more cushion available to credi-tors if the organization becomes insolvent. How-ever, the owner(s) prefer high debt ratio to mag-nify earnings due to leverage or to minimize lossof control if new stock is issued instead of takingon more debt. Total debt includes both current lia-bilities and long-term debt.

JWBT150-Vallabhaneni c06 July 28, 2009 17:41
138 Learning Module 6: Accounting
The capitalization of a lease by a lessee will re-sult in an increase in the debt-to-equity ratio. If afirm purchases a new machine by borrowing therequired funds from a bank as a short-term loan,the direct impact of this transaction will be to de-crease the current ratio and increase the debt ratio.
� Times-interest-earned ratio: earnings before interestand taxes divided by interest charges. Times-interest-earned ratio provides an indication of whether anorganization can meet its required interest pay-ments when they become due and not go bankrupt.This ratio also provides a rough measure of cashflow from operations and cash outflow as intereston debt. This information is important to credi-tors, since a low or negative ratio suggests thatan organization could default on required interestpayments. This ratio measures the extent to whichoperating income can decline before the firm is un-able to meet its annual interest costs. The ability topay current interest is not affected by taxes sinceinterest expense is tax deductible. In other words,the interest expense is paid out of income beforetaxes are calculated.
� Fixed charge coverage ratio: earnings before inter-est and taxes plus lease payments divided by interestcharges plus lease payments. Fixed charge coverageratio is similar to times-interest-earned ratio ex-cept that the former ratio includes long-term leaseobligations. When a company’s ratio is less thanthe industry average, the company may have dif-ficulty in increasing its debt.
� Cash flow coverage ratio: earnings before interestand taxes plus lease payments plus depreciation dividedby interest charges plus lease payments plus preferredstock dividends (before tax) plus debt repayment (be-fore tax). The cash flow coverage ratio shows themargin by which the firm’s operating cash flowscover its financial obligations. This ratio consid-ers principal repayment of debt, dividends on pre-ferred stock, lease payments, and interest charges.The reason for putting the dividends on preferredstock and debt repayment amounts on before thetax basis is due to their nontaxdeductibility, mean-ing that they are paid out of the income beforetaxes are paid.
Profitability RatiosProfitability ratios are the ultimate test of manage-ment’s effectiveness. They indicate how well an or-ganization operated during a year. They are a cul-mination of many policies and decisions made bymanagement during the current year as well as
previous years. Typically these ratios are calculatedusing sales or total assets. Profitability ratios showthe combined effect of liquidity, asset management,and debt management performance on operating re-sults. Examples include profit margin on sales ratio,basic earning power ratio, return on total assets ratio,return on common equity ratio, earnings per shareratio, and payout ratio.
� Profit margin on sales ratio: net income available tocommon stockholders divided by sales. Profit marginon sales ratio indicates the proportion of the salesdollar that remains after deducting expenses. Here,the net income after taxes is divided by sales to givethe profit per dollar of sales.
� Basic earning power ratio: earnings before interestand taxes divided by total assets. Basic earning powerratio shows the raw earning power of the firm’sassets before the influence of taxes and impact ofthe financial leverage. It indicates the ability ofthe firm’s assets to generate operating income. Alow “total asset turnover” and low “profit marginon sales” gives a low “basic earning power ratio.”Return on investment (ROI) may be calculated bymultiplying total asset turnover by profit margin.
� Return on total assets ratio: net income available tocommon stockholders divided by total assets. Returnon total assets (ROA) ratio measures the return ontotal assets after interest and taxes are paid. The netincome used in the equation is the net income aftertaxes. A low ratio indicates a low “basic earningpower ratio” and a high use of debt.
Another way of looking at the ROA ratio is bybreaking it down into subcomponents as shownbelow: net income divided by net sales (i.e., profitmargin on sales) as one component and net salesdivided by total average assets (i.e., total assetturnover) as another component. This breakdownhelps in pinpointing problems and opportunitiesfor improvement.
� Return on common equity ratio: net income avail-able to common stockholders divided by common equity.Return on common equity (ROE) measures the rateof return on common stockholders’ investments.The net income used in the equation is the netincome after taxes, and common equity is the av-erage stockholders’ equity. A low ratio comparedto the industry indicates high use of debt. This ra-tio reflects the return earned by an organization oneach dollar of owners’ equity invested.
� Earnings per share ratio: net income minus currentyear preferred dividends divided by weighted-average

JWBT150-Vallabhaneni c06 July 28, 2009 17:41
LEARNING OBJECTIVE 6.6: LEARN HOW TO ANALYZE FINANCIAL STATEMENTS 139
number of shares outstanding. Earnings per share(EPS) ratio is probably the most widely used ratiofor evaluating an organization’s operating ability.The complexity of the calculation of EPS is deter-mined by a corporation’s capital structure.
An organization with no outstanding convert-ible securities, warrants, or options has a simplecapital structure. An organization has a complexstructure if it has such items outstanding. The in-vestor should be careful not to concentrate on thisnumber to the exclusion of the organization as awhole. One danger in concentrating on this num-ber is that EPS can easily be increased by purchas-ing treasury stock that reduces the outstandingshares.
� Payout ratio: cash dividends divided by net incomeor dividends per share divided by earnings per share.Payout ratio indicates the ability to meet dividendobligations from net income earned. There is a rela-tionship between the payout ratio and the need forobtaining external capital. The higher the payoutratio, the smaller the addition to retained earnings,and hence, the greater the requirements for exter-nal capital. This says that dividend policy affectsexternal capital requirements. If d is the dividendpayout ratio, (1 – d) is called the earnings retentionrate.
Depending on their tax status, certain investorsare attracted to the stock of organizations that payout a large percentage of their earnings, and othersare attracted to organizations that retain and rein-vest a large percentage of their earnings. Growthorganizations typically reinvest a large percentageof their earnings; therefore, they have low payoutratios.
Market Value RatiosMarket value ratios relate the firm’s stock price toits earnings and book value per share. It shows thecombined effects of liquidity ratios, asset manage-ment ratios, debt management ratios, and profitabil-ity ratios. The viewpoint is from outside in, thatis, from an investors’ view about the company’s fi-nancial performance—past and future. Examples in-clude price/earnings ratio, book value per share, andmarket/book ratio.
� Price/earnings ratio: price per share divided by earn-ings per share. Price/earnings (P/E) ratio showshow much investors are willing to pay per dollarof reported profits. Financial analysts, stock mar-ket analysts, and investors in general use this value
to determine whether a stock is overpriced or un-derpriced. Different analysts have differing viewsas to the proper P/E ratio for a certain stock orthe future earnings prospects of the firm. Severalfactors such as relative risk, trends in earnings,stability of earnings, and the market’s perceptionof the growth potential of the stock affect theP/E ratio.
� Book value per share: common equity divided byshares outstanding. Book value per share ratio isused as an intermediate step in calculating the mar-ket/book ratio. Book value per share ratio is usedin evaluating an organization’s net worth and anychanges in it from year to year. If an organizationwere liquidated based on the amounts reported onthe balance sheet, the book value per share wouldindicate the amount that each share of stock wouldreceive. If the asset amounts on the balance sheetdo not approximate fair market value, then the ra-tio loses much of its relevance.
� Market/book ratio: market price per share divided bybook value per share. Market/book ratio reveals howinvestors think about the company. Market/bookratio is related to ROE ratio in that high ratio ofROE gives high market/book ratio and vice versa.In other words, companies with higher ROE selltheir stock at higher multiples of book value. Sim-ilarly, companies with high rates of return on theirassets can have market values in excess of theirbook values. A low rate of return on assets giveslow market/book value ratio.
Limitations of Financial Statement RatiosBecause ratios are simple to compute, convenient,and precise, they are attractive, and a high degreeof importance is attached to them. Since these ratiosare only as good as the data on which they are based,the following limitations exist:� The use of ratio analysis could be limiting for
large, multidivisional firms due to their size andcomplexity—two conditions that mask the results.However, they might be useful to small firms.
� Typically, financial statements are not adjusted forprice-level changes. Inflation or deflation can havea large effect on the financial data.
� Since transactions are accounted for on a cost basis,unrealized gains and losses on different asset bal-ances are not reflected in the financial statements.
� Income ratios tend to lose credibility in cases wherea significant number of estimated items exist, suchas amortization and depreciation.

JWBT150-Vallabhaneni c06 July 28, 2009 17:41
140 Learning Module 6: Accounting
� Seasonal factors affect and distort ratio analysis,which can be minimized by using average figuresin calculations.
� Be aware of “window dressing” and “earningsmanagement” techniques used by firms to makethem look financially better than they really are.Management may manipulate financial statementsto impress credit analysts and stock market in-vestors (i.e., management fraud).
� Certain off-balance-sheet items do not show up onthe financial statements. For example, leased assetsdo not appear on the balance sheet, and the leaseliability may not be shown as a debt. Therefore,leasing can improve both the asset turnover andthe debt ratios.
� Attaining comparability among organizations in agiven industry is an extremely difficult problem,since different organizations apply different ac-counting procedures. These different accountingprocedures require identification of the basic dif-ferences in accounting from organization to orga-nization and adjustment of the balances to achievecomparability.
� Do not take the ratios on their face value since a“good” ratio does not mean that the company is astrong one; nor does a “bad” ratio mean that thecompany is a weak one. This implies that ratiosshould be evaluated and interpreted with judg-ment and experience and considering the firm’scharacteristics and the industry’s uniqueness.
❑ Learning Objective 6.7:UNDERSTAND VARIOUS COSTCONCEPTS AND COSTBEHAVIORSThe scope of cost concepts includes a discussion ofabsorption and variable costs and other varieties ofcost concepts. Cost behavior in terms of how costschange with volume is also presented. An under-standing of these cost concepts and cost behaviorpatterns can help organizations establish an opti-mum cost structure, consisting of the amounts andproportions of variable costs and fixed costs as partof total costs.
Absorption and Variable CostsThe cost of goods sold, which is larger than all of theother expenses combined in a product cost, can be
determined under either the absorption costing orvariable costing method.
Under absorption costing, all manufacturing costsare included in finished goods and remain there asan inventory asset until the goods are sold. Man-agement could misinterpret increases or decreasesin income from operations, due to mere changes ininventory levels to be the result of business events,such as changes in sales volume, prices, or costs.Absorption costing is necessary in determining his-torical costs for financial reporting to external usersand for tax reporting.
Variable costing may be more useful to manage-ment in making decisions. In variable costing (di-rect costing), the cost of goods manufactured is com-posed only of variable manufacturing costs—coststhat increase or decrease as the volume of productionrises or falls. These costs are the direct materials, di-rect labor, and only those factory overhead costs thatvary with the rate of production. The remaining fac-tory overhead costs, which are fixed or nonvariablecosts, are generally related to the productive capac-ity of the manufacturing plant and are not affectedby changes in the quantity of product manufactured.Thus the fixed factory overhead does not become apart of the cost of goods manufactured but is treatedas an expense of the period (period cost) in which itis incurred.
The income from operations under variable cost-ing can differ from the income from operations un-der absorption costing. This difference results fromchanges in the quantity of the finished goods inven-tory, which are caused by differences in the levels ofsales and production.
The following decision rules apply:
� If units sold are less than units produced, then vari-able costing income is less than absorption costingincome.
� If units sold are greater then units produced, thenvariable costing income is greater than the absorp-tion costing income.
Many accountants believe that the variable cost-ing method should be used for evaluating operatingperformance because absorption costing encouragesmanagement to produce inventory. This is becauseproducing inventory absorbs fixed costs and causesincome from operations to appear higher. In the longrun, building inventory without the promise of fu-ture sales may lead to higher costs such as handling,storage, financing, and obsolescence costs.

JWBT150-Vallabhaneni c06 July 28, 2009 17:41
LEARNING OBJECTIVE 6.7: UNDERSTAND VARIOUS COST CONCEPTS AND COST BEHAVIORS 141
Management’s Use of Absorption and VariableCosting MethodsManagement’s use of variable costing and ab-sorption costing includes controlling costs, pricingproducts, planning production, analyzing marketsegments (sales territory and product profitabil-ity analysis), and analyzing contribution margin.Preparing comparative reports under both conceptsprovides useful insights.
Other Varieties of Cost ConceptsThe following list provides a brief description aboutcost concepts other than absorption or variable costs:
Actual costs. The amounts determined on the basisof cost incurred for making a product or deliver-ing a service to customers.
Average cost. The total cost divided by the activity,that is, number of units.
Budgeted costs. Costs that were predetermined formanagerial planning and controlling purposes.
Common costs. Costs of facilities and servicesshared by several functional departments. Theseare costs incurred for the benefit of more than onecost objective.
Conversion costs. A combination of direct laborcosts, indirect material costs, and factory over-head. Assembly workers’ wages in a factory arean example of conversion costs since their time ischarged to direct labor.
Current costs. Costs that represent fair market valueat current date.
Direct costs. Costs that can be directly identifiedwith or traced to a specific product, service, oractivity (e.g., direct labor and direct materials). Ina manufacturing operation, direct material costswould include wood in a furniture factory sinceit is a basic raw material of furniture. Direct la-bor costs are wages paid to workers. Examplesinclude insurance on the corporate headquartersbuilding since it is not a cost of production, depre-ciation on salespersons’ automobiles, salary of asales manager, commissions paid to sales person-nel, and advertising and rent expenses.
Expired cost. This is the portion of cost that is ex-pensed. An expired cost is a period cost, and it iseither an expense or loss.
Fixed costs. Costs that remain constant in total, butchange per unit, over a relevant range of produc-tion or sales volume (e.g., rent, depreciation). It isa unit cost that decreases with an increase in activ-ity. A fixed cost is constant in total but varies per
unit in direct proportion to changes in total activ-ity or volume. It is a cost that remains unchangedin total for a given period despite fluctuations involume or activity. A fixed cost remains constantin total for a given period despite variations inactivity as long as the production is within therelevant range. A fixed cost may change in totalbetween different periods or when production isoutside the relevant range. Therefore, unit fixedcost decreases as output increases at a given rele-vant range.
Full costs. A combination of direct costs and a fairshare of the indirect costs for a cost objective. Fullcosts refer to a unit of finished product. They con-sist of prime costs and overhead. It is the entiresacrifice related to a cost objective.
Historical costs. Costs that were incurred at the timeof occurrence of a business transaction. They rep-resent what costs were.
Indirect costs. Costs that cannot be identified withor traced to a specific product, activity, or depart-ment (e.g., salaries, taxes, utilities, machine re-pairs). An example is a factory manager’s salary.Another term for indirect costs is factory over-head. It consists of all costs other than direct laborand direct materials associated with the manufac-turing process.
Joint costs. Costs of manufactured goods of rela-tively significant sales values that are simultane-ously produced by a process.
Long-run costs. Costs that vary as plant capacitychanges over a long period of time.
Marginal cost. The cost to make an additional unitor the last unit. It is the incremental or variablecosts of producing an additional or extra unit.
Mixed costs. Costs that fluctuate with volume, butnot in direct proportion to production or sales.Mixed costs (semivariable or semifixed costs)have elements of both fixed and variable costs(e.g., supervision and inspection). A salesperson’scompensation is an example of mixed costs sincesalary is fixed and commissions are variable.
Period costs. Costs that can be associated with thepassage of time, not the production of goods.Period costs are always expensed to the same pe-riod in which they are incurred, not to a particu-lar product. Period costs are not identifiable witha product and are not inventoried. Only productcosts are included in manufacturing overhead. Pe-riod costs are those costs deducted as expensesduring the current period without having beenpreviously classified as costs of inventory.

JWBT150-Vallabhaneni c06 July 28, 2009 17:41
142 Learning Module 6: Accounting
Prime costs. A combination of direct labor and directmaterial costs. Overhead is not a part of it. Primecosts refer to a unit of finished product. They canbe identified with and physically traceable to acost objective.
Product costs. Costs that can be associated with pro-duction of certain goods or services. Product costsare those that are properly assigned to inventorywhen incurred. Inventoriable costs are those costsincurred to produce the inventory and stay withthe inventory as an asset until they are sold. Prod-uct costs are expensed (as cost of goods sold) inthe period the product is sold. Examples includeproperty taxes on a factory in a manufacturingcompany, direct materials, direct labor, and fac-tory overhead. Product costs include direct labor,direct material, and plant manufacturing over-head.
Short-run costs. Costs that vary as output varies fora short period or for a given production capacity.
Standard costs. Predetermined or engineered coststhat should be attained under normal condi-tions of operations. They represent what costsshould be.
Step cost. A step cost is constant over small rangesof volume (output) but increases in discrete stepsas volume increases. A supervisor of the secondshift is an example of a step cost. If the range ofthe step cost is narrow, it is equal to variable cost.If the range of the step cost is wide, then it is equalto fixed cost.
Sunk cost. A past cost that has already been incurred(e.g., installed factory machinery and equipment)or committed to be incurred. It is not relevant tomost future costs and decisions since it cannotbe changed by any decision made now or in thefuture. It is irreversible. It cannot be affected bythe choices made.
Unexpired cost. The portion of cost that remains asassets and continues to generate future benefits.
Variable costs. Costs that fluctuate in total, but re-main constant per unit, as the volume of produc-tion or sales changes. A variable cost is constantper unit produced but varies in total in direct pro-portion to changes in total activity or volume. Thecost of cable fabricator wages should be consid-ered variable because they change in total in di-rect proportion to the number of similar cablesfabricated. General and administrative and otherindirect costs can be either fixed or variable. Ingeneral, variable costs vary directly with volumeor activity. For example, if indirect materials vary
directly with volume, then indirect materials canbe classified as variable costs.
Avoidable costs. Costs that will not be incurred orcosts that may be saved if an ongoing activityis discontinued, changed, or deleted, such as ina make-or-buy decision. These costs are relevantcosts.
Unavoidable costs. Opposite of avoidable costs—costs that are irrelevant; they are sunk costs.
Controllable costs. Costs that can be definitely in-fluenced by a given manager within a given timespan. Examples include office supplies purchasedby an office manager. In the long run, all costsare controllable. In the short run, costs are con-trollable too, but they are controlled at differentmanagement levels. The higher the managementlevel, the greater the possibility of control.
Noncontrollable costs. Opposite of the control-lable costs—costs that are unaffected by a man-ager’s decision (e.g., plant rent expense by a plantforeman).
Out-of-pocket costs. Costs that require the con-sumption of current economic resources (e.g.,taxes, insurance). It is the current or near-futureexpenditure that will require a cash outlay to exe-cute a decision.
Embodied cost. It measures sacrifices in termsof their origins, reflecting what was originallygiven up to acquire and convert the object beingcosted.
Displaced costs. These measure sacrifices in termsof their ultimate effects upon the group makingthe sacrifice, reflecting the opportunity lost by, orthe adverse consequences resulting from, the sac-rifice in question. They are also called opportunitycosts.
Discretionary costs. Costs that arise from periodicbudgeting decisions and which have no stronginput/output relationship.
Opportunity cost. The maximum net benefit thatis forgone by the choice of one course of actionover another course of action. It is the economicsacrifice attributable to a given decision. It is theloss associated with choosing the alternative thatdoes not maximize the benefit.
Incremental costs. The increase in total sacrificeidentifiable with the specific object, or group ofobjects, being costed, recognizing that fixed andotherwise joint sacrifices may be increased little,if at all, because of what was done to or for thespecific object being costed. These are also calleddifferential costs.

JWBT150-Vallabhaneni c06 July 28, 2009 17:41
LEARNING OBJECTIVE 6.8: UNDERSTAND THE PRINCIPLES AND TECHNIQUES OF OPERATING BUDGETS 143
Differential costs. The difference in total costs be-tween alternatives.
Replacement cost. The cost that would have to beincurred to replace an asset.
Implicit costs. Implicit costs are imputed costs andused in the analysis of opportunity costs.
Imputed costs. Costs that can be associated withan economic event when no exchange transactionhas occurred (e.g., the rent for a building when acompany “rents to itself” a building).
Committed costs. Two types: (1) manageable and (2)unmanageable. Manageable committed costs aresacrifices influenced to an important degree bymanagers’ decisions and actions, but these influ-ences have already had most of their effect, settingin motion the chain of events that largely deter-mine the sacrifice in question. Most fixed costsare committed costs. Unmanageable committedcosts are sacrifices largely influenced by factors orforces outside managers’ control and already setin motion to such an extent that influences havehad most of their effect.
Uncommitted costs. Two types: (1) manageableand (2) unmanageable. Manageable uncommit-ted costs are sacrifices influenced to an importantdegree by managers’ decisions and actions withplenty of time for these influences to have their ef-fect. Unmanageable uncommitted costs are sacri-fices largely influenced by factors or forces outsidemanagers’ control with plenty of time for these in-fluences to have their effect.
Rework costs. Costs incurred to turn an unaccept-able product into an acceptable product and sellit as a normal finished good.
Engineered costs. Costs resulting from a measuredrelationship between inputs and outputs.
Cost BehaviorCosts have a behavior pattern. For example, costsvary with volumes of production, sales, or servicelevels, with the application of the amount of re-sources, and with the timeframe used. Knowingthe cost-behavior information helps in developingbudgets, interpreting variances from standards, andmaking critical decisions. The manager who can pre-dict costs and their behavior is a step ahead in plan-ning, budgeting, controlling, product pricing, non-routine decisions (i.e., make-or-buy, keep or drop),and separating cost into its components (i.e., fixed,variable, and mixed costs). In order to make more
accurate cost predictions, the manager needs supe-rior cost estimates at his disposal.
Techniques to separate costs into variable and fixedcomponents include statistics using regression anal-ysis, scatter graphs, and least squares methods; thehigh-low method; spreadsheet analysis; sensitivityanalysis; and managerial judgment.
Approaches to estimate costs include the follow-ing:
1. The industrial engineering method analyzes re-lationships between inputs and outputs in physi-cal terms.
2. The conference method incorporates analysis andopinions gathered from various departments ofthe firm.
3. The account analysis method classifies cost ac-counts in the ledger as variable, fixed, or mixedcosts.
4. Quantitative analysis method uses time-seriesdata based on past cost relationships and regres-sion analysis.
The first three methods require less historical datathan do most quantitative analyses. Therefore, costestimations for a new product will begin with one ormore of the first three methods. Quantitative analy-sis may be adopted later, after experience is gained.These cost estimation approaches, which are not mu-tually exclusive, differ in the cost of conducting theanalysis, the assumptions they make, and the evi-dence they yield about the accuracy of the estimatedcost function.
❑ Learning Objective 6.8:UNDERSTAND THE PRINCIPLESAND TECHNIQUES OFOPERATING BUDGETSA budgeting system includes both expected resultsand historical or actual results. A budgeting systembuilds on historical, or actual, results and expands toinclude consideration of future, or expected, results.A budgeting system guides the manager into thefuture:
Budget System → Forward LookingHistorical Cost System → Backward Looking
A budget is a quantitative expression of a plan ofaction. It will aid in the coordination of various activ-ities or functions throughout the organization. The

JWBT150-Vallabhaneni c06 July 28, 2009 17:41
144 Learning Module 6: Accounting
master budget by definition summarizes the objec-tives of all subunits of an organization. The masterbudget helps in coordinating activities, implement-ing plans, authorizing actions, and evaluating per-formance.
The master budget captures the financial impact ofall the firm’s other budgets and plans. Although themaster budget itself is not a strategic plan, it helpsmanagers to implement the strategic plans. The mas-ter budget focuses on both operating decisions andfinancing decisions. Operating decisions concentrateon the acquisition and use of scarce resources.
Financing decisions center on how to get the fundsto acquire resources.
Benefits of Operating BudgetsThe following are benefits to be derived from bud-gets:
� Budgets are planning tools. Budgets force man-agers to look into the future and make them pre-pare to meet uncertainties and changing businessconditions.
� Budgets provide a starting point for discussingbusiness strategies. In turn, these strategies di-rect long-term and short-term planning. Therefore,strategic plans and budgets are interrelated andaffect one another.
� Budgeted performance is better than historicaldata for judging or evaluating employee perfor-mance. This is because employees know what isexpected of their performance. A major drawbackof using historical data is that inefficiencies andbad decisions may be buried in past actions.
� Budgets can be a valuable vehicle for communica-tion with interested parties. Budgets help coordi-nate activities of various functions within the or-ganization to achieve overall goals and objectives.
� Budgets are control systems. Budgets help to con-trol waste of resources and to search out weak-nesses in the organizational structure.
� A budget should be implemented so as to gainacceptance by employees. This requires buy-inby employees, senior management support, andlower-level management involvement.
� A budget should be set tight, but attainable andflexible. A budget should be thought of as a meansto an end, not the end in itself.
� A budget should not prevent a manager from tak-ing prudent action. Nonetheless, he should not dis-regard the budget entirely.
Different Dimensions in OperatingBudgetsThe time period for budgets varies from one year tofive or more years. The common budget period is oneyear and broken down by quarters and months. Fourtypes of budgets emerge from the time-coverage-and-update point of view:
1. Short-term budgets (operating budgets) have atimeframe of one to two years.
2. Long-term budgets (strategic budgets) have atimeframe of three to five or more years.
3. Static budgets are the original budgeted num-bers, which are not changed. The timeframe doesnot change.
4. Continuous budgets are also called rolling bud-gets, where a 12-month forecast is always avail-able by adding a month in the future as themonth just ended is dropped. The timeframekeeps changing in the continuous budgets.
Budgets should be viewed positively, not neg-atively. Although budget preparation is mechan-ical, its administration and interpretation requirepatience, education, and people skills. Budgets are apositive device designed to help managers chooseand accomplish objectives. However, budgets arenot a substitute for bad management or pooraccounting system.
How Operating Budgets are PreparedThe master budget (static budget) is developed af-ter the goals, strategies, and long-range plans of theorganization have been determined. It summarizesthe goals of the subunits or segments of an orga-nization. This information summarizes, in a finan-cial form, expectations regarding future income, cashflows, financial position, and supporting plans. Thefunctions of the master budget include planning,coordinating activities, communicating, evaluatingperformance, implementing plans, motivating, andauthorizing actions. It contains the operatingbudget.
A detailed budget is prepared for the coming fis-cal year along with some less-detailed amounts forthe following years. Budgets may be developedwith the top-down or the bottom-up approach.With the top-down approach, upper managementdetermines what it expects from subordinate man-agers. Subordinate managers may then negotiatewith upper management concerning the items they

JWBT150-Vallabhaneni c06 July 28, 2009 17:41
LEARNING OBJECTIVE 6.8: UNDERSTAND THE PRINCIPLES AND TECHNIQUES OF OPERATING BUDGETS 145
feel are unreasonable. With the bottom-up approach,lower-level managers propose what they expectto accomplish and the required resources. Uppermanagement then makes suggestions and revisions.Budgets may be used for long-range planning,but the typical planning-and-control budget periodis one year. This annual budget may be brokendown into months or quarters and continuouslyupdated.
The following are various types of budgets:
� Budgeted balance sheet. This budget reflects theexpected balance sheet at the end of the budget pe-riod. The budgeted balance sheet is determined bycombining the estimate of the balance sheet at thebeginning of the budget period with the estimatedresults of operations for the period obtained fromthe budgeted income statements and estimatingchanges in assets and liabilities. These changes inassets and liabilities result from management’s de-cisions regarding capital investment in long-termassets, investment in working capital, and financ-ing decisions.
� Budgeted income statement or operating budget.This budget reflects the income expected for thebudget period.
� Budgets for other expenses. These budgets maybe broken down according to expense category de-pending on the relative importance of the types ofexpenses (i.e., selling, administrative, research anddevelopment, etc.).
� Cash budget. The cash budget summarizes cashreceipts and disbursements and indicates financ-ing requirements. This budget is important inassuring an organization’s solvency, maximiz-ing returns from cash balances, and determiningwhether the organization is generating enoughcash for current and future operations.
� Cash disbursements budget. This budget is de-pendent on the pattern of payments for expenses.Cash disbursements do not typically match costsin a period, since expenses are typically paid laterthan they are incurred.
� Cash receipts budget. The collection of sales de-pends on an organization’s credit policies and itscustomer base. Most organizations must obtaincash to pay current bills while waiting for paymentfrom customers. This cash represents an opportu-nity cost to the organization.
� Labor budget. This budget may be broken downby type of worker required in hours or number ofworkers.
� Production cost budget. This budget may be bro-ken down by product or plant.
� Production budget. This budget may be brokendown by product or plant. Production must meetcurrent sales demand and maintain sufficient in-ventory levels for expected activity levels duringthe budget period and on into the next period. Thisbudget is reviewed with production managers todetermine if the budget is realistic. If the budget isnot attainable, management may revise the salesforecast or try to increase capacity. If productioncapacity will exceed requirements, other uses ofthe idle capacity may be considered.
� Purchases budget. This budget is typically brokendown by raw materials and parts. An organiza-tion’s inventory policy determines its level of pur-chases.
� Sales budget. This budget may be broken downby product, territory, plant, or other segment ofinterest.
Operating Budgeting TechniquesBudgets are a necessary component of financial de-cision making because they help provide an efficientallocation of resources. A budget is a profit planningand a resource-controlling tool. It is a quantitative ex-pression of management’s intentions and plans forthe coming year(s) to meet their goals and objectiveswithin resource constraints. Budgets are prepared atthe beginning of each year. Departmental or func-tional budgets are summarized and compared withrevenue forecasts and revised as necessary.
Five budgeting techniques are available:
1. Incremental budgeting (adds a percentage orfixed amount to the previous budget)
2. Flexible budgeting (reflects variation in activitylevels)
3. Zero-based budgeting (uses “decision packages”to specify objectives and workloads)
4. Program planning budgeting (presents budgetchoices more explicitly in terms of objectives)
5. Performance budgeting (links performance levelswith specific budget amounts)
Incremental budgeting is a traditional approachto budgeting focusing on incremental changes in de-tailed categories of revenues and expenses, calledline items, to represent sales, salaries, travel, sup-plies, and so forth. The incremental approach to bud-geting does not take variation in volume or change

JWBT150-Vallabhaneni c06 July 28, 2009 17:41
146 Learning Module 6: Accounting
in activity levels into account. It operates on the prin-ciple of management by exception.
Flexible budgeting (variable or dynamic budget-ing) is a budget that is adjusted for changes in theunit level of the cost or revenue. It is also called avariable budget. The flexible budget is based on theknowledge of how revenues and costs should be-have over a range of activity. Thus, it is appropriatefor any relevant level of activity. The master budgetis not adjusted after it is developed, regardless ofchanges in volume, cost, or other conditions duringthe budget period.
Zero-based budgeting, especially in the publicsector, attempts to analyze the incremental changein a program’s output at different levels of fund-ing. For each program, a “decision package” wouldspecify objectives and measures of efficiency, ef-fectiveness, and workload for alternative levels offunding.
Planning, programming, and budgeting systems(PPBSs) attempt to further advance budgeting tech-niques, especially in the public sector, by present-ing budget choices more explicit in terms of publicobjectives. With PPBS budgets, the cost and effec-tiveness of programs would be evaluated in a multi-year framework and alternative approaches wouldbe considered.
Performance budgeting, again focusing on thepublic sector, links performance measures directly toagency missions and program objectives. Under theperformance budgeting model, budgets would bedeveloped based on unit costs and service expecta-tions followed by analysis of actual work performedcompared with budget estimates.
Advantages of Operating BudgetsBudgets are commonly used in both large and smallorganizations. No matter what the size of the orga-nization, typically the benefits of budgeting exceedthe costs. The advantages of budgets are that they:
� Compel planning. Management must have targets,and budgets reflect expected performance. Bud-gets affect strategies that are the relatively gen-eral and permanent plans of an organization thatchange as conditions and/or objectives change.Budgets can give direction to operations, point outproblems, and give meaning to results.
� Provide performance criteria. The budget allows em-ployees to know what is expected of them. Com-paring actual results to budgeted amounts instead
of past performance provides more useful infor-mation. Comparison with past performance maybe hampered by past inefficiencies or changes intechnology, personnel, products, or general eco-nomic conditions.
� Promote communication and coordination. Coordina-tion deals with the interests of the organization asa whole, meshing and balancing the factors of pro-duction and other departments and functions sothat objectives can be achieved. Budgets aid coor-dination because they require well-laid plans andisolate any problems.
Limitations of Operating BudgetingTechniquesThe following are peculiarities and limitations ofbudgets:
� Be aware that budgeted items are a mixture of fixedand variable cost components. Accordingly, mixedcosts cannot be used for linear projection.
� Be aware that budgeted items include some di-rect costs and some allocated costs. Direct costsare more useful for decision making than allocatedcosts. Responsibility accounting favors direct andcontrollable costs, not allocated and uncontrollablecosts.
� The nature of volume levels needs to be under-stood. Most budgets are based on a single levelof volume (point estimates, whereas multiple vol-ume levels (range estimates) would be better fordecision making.
� The kinds of assumptions made during the bud-get development process need to be known. Un-derstand the budget preparer’s state of mind: op-timistic, most likely, or pessimistic outcomes. Eachof these outcomes would bring a different type ofrealism to the budget numbers.
� The variances from budgets need to be analyzedvery carefully. Performance reports show the vari-ations between the actual and the budgets—an el-ement of control. Corrective action requires de-termination of underlying causes of variation.Variances could be favorable or unfavorable.
❑ Learning Objective 6.9:UNDERSTAND THE APPLICATIONOF TRANSFER PRICINGTransfer pricing involves inter- or intracompanytransfers, whether domestic or international. A

JWBT150-Vallabhaneni c06 July 28, 2009 17:41
LEARNING OBJECTIVE 6.9: UNDERSTAND THE APPLICATION OF TRANSFER PRICING 147
transfer price is the price one unit of a corporationcharges for a product or service supplied to anotherunit of the same corporation. The units involvedcould be either domestic or international, and theproducts involved could be intermediate productsor semifinished goods.
The following are reasons for establishing trans-fer pricing in either domestic or international oper-ations:
� Performance evaluation of decentralized opera-tions
� Overall minimization of taxes to a corporation� Minimization of custom duties and tariffs� Minimization of risks associated with movements
in foreign currency exchange rates� Circumventing restrictions on profit remittance to
the corporate headquarters� Motivation of business unit managers
Methods for Determining Transfer PricesThree methods are available for determining trans-fer prices: market based, cost based, and negotiationbased. The choice of transfer pricing method affectsthe operating income of individual units.
1. Market-based transfer prices. The price appear-ing in a trade journal or other independent (out-side) sources establishes the transfer price of aproduct or service. Difficulty in obtaining mar-ket price forces corporations to resort to cost-based transfer prices. This method is widespreadin use.
2. Cost-based transfer prices. The costs used couldbe either actual costs or standard costs and in-clude variable manufacturing costs or absorption(full) costs. Use of full cost-based prices leads tosuboptimal decisions in the short run for the com-pany as a whole. This method is also widespreadin use. Standard costs are used more widely thanactual costs to motivate the seller to produce effi-ciently. If transfer prices are based on actual costs,sellers can pass along costs of inefficiency to thebuyers.
3. Negotiation-based transfer prices. These are thenegotiated prices between units of a corporationand may not have any relation to either marketor cost data. Unit autonomy is preserved. Draw-backs include time-consuming and drawn-out ne-gotiations, which may not lead to goal congru-ence. Weak bargaining units may lose out to thestrong.
Criteria Affecting Transfer PricingMethodsThe criteria of goal congruence, managerial effort,and unit autonomy affect the choice of transfer-pricing methods.
Goal congruence exists when individual goals,group goals, and senior management goals coincide.Under these conditions, each unit manager acts inhis own best interest, and the resulting decision isin the long-term best interest of the company as awhole. A transfer price method should lead to goalcongruence.
A sustained high level of managerial effort canlead to achievement of goals. A transfer pricemethod promotes management effort if sellers aremotivated to hold down costs and buyers are moti-vated to use the purchased inputs efficiently.
Senior management should allow a high level ofunit autonomy in decision making in a decentral-ized organization. This means that a transfer pricemethod should preserve autonomy if unit managersare free to make their own decisions and are notforced to buy or sell products at a price that is unac-ceptable to them.
Dual pricing uses two separate transfer-pricingmethods to price each inter-unit transaction. Thisis because seldom does a single transfer price meetthe criteria of goal congruence, managerial effort,and unit autonomy. An example of dual pricingis when the selling unit receives a full-cost-plus-markup-based price and the buying unit pays themarket price for the internally transferred products.
The dual pricing method reduces the goal-congruence problems associated with a pure cost-plus-based transfer-pricing method. Some of thedrawbacks of dual pricing include:� The manager of the supplying unit may not have
sufficient incentives to control costs.� It does not provide clear signals to unit managers
about the level of decentralization senior managersare seeking.
� It tends to insulate managers from the frictionsof the marketplace, that is, knowledge of units’buying and selling market forces.
International Transfer PricingThe multinational corporation (MNC) must dealwith transfer pricing and international taxation, and,therefore, a knowledge of international laws relatedto these areas is important. A transfer is a substitutefor a market price and is recorded by the seller as

JWBT150-Vallabhaneni c06 July 28, 2009 17:41
148 Learning Module 6: Accounting
revenue and by the buyer as cost of goods sold. Thetransfer-pricing system should motivate unit man-agers not to make undesirable decisions at the ex-pense of the corporation as a whole. The ideal man-ager would act in the best interests of the companyas a whole, even at the expense of the reported prof-its of his own unit. For this to happen, the managermust be rewarded when he chooses companywidegoal congruence over his unit performance.
❑ Learning Objective 6.10:UNDERSTAND THE APPLICATIONOF COST-VOLUME-PROFITANALYSISCost-volume-profit (CVP) analysis helps managerswho are making decisions about short-term dura-tion and for specific cases where revenue and costbehaviors are linear and where volume is assumedto be the only cost and revenue driver. CVP is anapproximation tool and a low-cost tool.
CVP analysis is a straightforward, simple-to-apply,widely used management tool. CVP analysis an-swers questions such as, How will costs and rev-enues be affected if sales units are up or down by xpercent? What if price is decreased or increased byx percent? A decision model can be built using CVPrelationships for choosing among courses of action.CVP analysis tells management what will happen to fi-nancial results if a specific level of production or salesvolume fluctuates or if costs change.
An example of a decision model is the breakevenpoint (BEP), which shows the interrelationships ofchanges in costs, volume, and profits. It is the pointof volume where total revenues and total costs areequal. No profit is gained or loss incurred at the BEP.
Three methods available for calculating the BEPinclude equation method, contribution margin (CM)method, and graphic method. An increase in the BEPis a red flag for management to analyze all its CVPrelationships more closely.
Equation MethodThe equation method is more general and thus iseasier to apply with multiple products, with multi-ple costs and revenue drivers, and with changes inthe cost structure. At breakeven point, the operatingincome is zero. The formula is:
(Unit Sales Price × Number of Units) − (UnitVariable Cost × Number of Units) − Fixed Costs= Operating Income
or
Sales − Variable Costs− Fixed Costs = Operating Income
CM MethodContribution-margin (CM) is equal to sales minusall variable costs. BEP is calculated as follows:
BEP = Fixed Costs/Unit Contribution Margin
A desired target operating income can be added tothe fixed costs to give a new BEP that tells how manyunits must be sold to generate enough CM to covertotal fixed costs plus target operating income.
The BEP tells how many units of product mustbe sold to generate enough contribution margin tocover total fixed costs. The CM method is valid onlyfor a single product and a single cost driver. TheCM method is a restatement of the equation methodin a different form. Either method can be used tocalculate the BEP.
Graphic MethodA CVP chart results when units are plotted on the x-axis and dollars on the y-axis. The breakeven point iswhere the total-sales line and total-cost line intersect.The total sales line begins at the origin because ifvolume is zero, sales revenue will be zero too.
CVP Assumptions and Their LimitationsCVP relationships hold true for only a limited rangeof production or sales volume levels. This meansthat these relationships would not hold if volumefell below or rose above a certain level.
The following are assumptions:
� The behavior of total revenues and total costs islinear over the relevant range of volume.
� Selling prices, total fixed costs, efficiency, and pro-ductivity are constant.
� All costs can be divided neatly into fixed and vari-able components. Variable cost per unit remainsconstant.
� A greater sales mix will be maintained as total vol-ume changes.
� Volume is the only driver of costs.� The production volume equals sales volume, or
changes in beginning and ending inventory levelsare zero.

JWBT150-Vallabhaneni c06 July 28, 2009 17:41
LEARNING OBJECTIVE 6.10: UNDERSTAND THE APPLICATION OF COST-VOLUME-PROFIT ANALYSIS 149
There are many limitations to these CVP assump-tions. Volume is only one of the factors affecting costbehavior. Other factors include unit prices of inputs,efficiency, changes in production technology, civilwars, employee strikes, laws, and regulations. Prof-its are affected by changes in factors besides volume. ACVP chart must be analyzed together with all as-sumptions and their limitations.
Ways to Lower the Breakeven PointThe following strategies should help in lowering theBEP, which means fewer units need to be sold, whichin turn contributes more to profits (the strategies arenot order ranked):
� Reducing the overall fixed costs� Increasing the CM per unit of product through in-
crease in sales prices� Increasing the CM per unit of product through de-
creases in unit variable costs� Increasing the CM per unit through increase in
sales prices and decreasing unit variable coststogether
� Selecting a hiring freeze for new employees� Limiting merit increase for senior executives� Cutting the annual percentage salary rate increase
for all salaried employees� Reducing overtime pay for all employees to reduce
labor costs� Reducing the number of employees on payroll� Improving employee productivity levels� Increasing machine utilization rates
Sensitivity Analysis in CVPA CVP model developed in a dynamic environmentdetermined that the estimated parameters used mayvary between limits. Subsequent testing of the modelwith respect to all possible values of the estimatedparameters is termed a sensitivity analysis.
Sensitivity analysis is a management tool that willanswer questions such as, What will operating in-come be if volume changes from the original predic-tion? What will operating income be if variable costsper unit decrease or increase by x percent? If salesdrop, how far can they fall below budget before theBEP is reached? This last question can be answeredby the margin-of-safety tool. The margin of safetyis a tool of sensitivity analysis and is the excess ofbudgeted sales over the breakeven volume.
Sensitivity analysis is a what-if technique aimedat asking how a result will be changed if the original
predicted data are not achieved or if an underlyingassumption changes. It is a measure of changes inoutputs resulting from changes in inputs. It revealsthe impact of changes in one or more input variableson the output or results.
Changes in Variable and Fixed CostsOrganizations often face a trade-off between fixedand variable costs. Fixed costs can be substituted forvariable costs and vice versa. This is because variablecosts and fixed costs are subject to various degreesof control at different volumes—boom or slack. Forexample, when a firm invests in automated machin-ery to offset increase in labor rates, its fixed costsincrease, but unit variable costs decrease.
Contribution Margin and Gross MarginContribution margin (CM) is the excess of sales overall variable costs, including variable manufactur-ing, marketing, and administrative categories. Grossmargin (GM), also called gross profit, is the excessof sales over the cost of the goods sold. Both CM andGM would be different for a manufacturing com-pany. They will be equal only when fixed manufac-turing costs included in cost of goods sold are thesame as the variable nonmanufacturing costs, whichis a highly unlikely event.
CM versus GM
� Variable manufacturing, marketing, and admin-istrative costs are subtracted from sales to getCM, but not GM.
� Fixed manufacturing overhead is subtractedfrom sales to get GM, but not CM.
� Both the CM and GM can be expressed as totals,as an amount per unit, or as percentages of salesin the form of ratios.
Profit-Volume ChartThe profit-volume (PV) chart is preferable to theCVP chart because it is simpler to understand. ThePV chart shows a quick, condensed comparison ofhow alternatives on pricing, variable costs, or fixedcosts affect operating income as volume changes.The operating income is drawn on the y-axis and thex-axis represents volume (units or dollars).
Due to operating leverage, profits increase duringhigh volume because more of the costs are fixed and

JWBT150-Vallabhaneni c06 July 28, 2009 17:41
150 Learning Module 6: Accounting
do not increase with volume. Profits decrease duringlow volume because fixed costs cannot be avoideddespite the lower volume.
Effect of Sales Mix on BEPSales mix is the relative combination of quantitiesof products that constitute total sales. A change insales mix will cause actual profits to differ from bud-geted profits. It is the combination of low-margin orhigh-margin products that causes the shift in profits,despite achievement of targeted sales volume.
There will be a different BEP for each differentsales mix. A higher proportion of sales in high con-tribution margin products will reduce the BEP. Alower proportion of sales in small contribution mar-gin products will increase the BEP. Shifting market-ing efforts to high contribution margin products canincrease the operating income and profits.
Management is interested in the effect of variousproduction and sales strategies on the operating in-come, not so much on BEP. Both the operating in-come and BEP are dependent on the assumptionsmade (i.e., if the assumptions change, the operatingincome and the BEP will also change).
❑ Learning Objective 6.11:UNDERSTAND THE MEANINGAND APPLICATION OF RELEVANTCOSTSThe relevant revenues and costs focus on the dif-ference between each alternative. Managers mustconsider the effects of alternative decisions on theirbusinesses. We discuss differential analysis, whichreports the effects of alternative decisions on totalrevenues and costs. Planning for future operationsinvolves decision making. For some decisions, rev-enue and cost data from the accounting records maybe useful. However, the revenue and cost data for usein evaluating courses of future operations or choos-ing among competing alternatives are often notavailable in the accounting records and must be es-timated. These estimates include relevant revenuesand costs. The relevant revenues and costs focus onthe differences between each alternative. Costs thathave been incurred in the past are not relevant to thedecision. These costs are called sunk costs.
Differential revenue is the amount of increaseor decrease in revenue expected from a course ofaction as compared with an alternative. To illus-trate, assume that certain equipment is being used to
manufacture calculators, which are expected to gen-erate revenue of $150,000. If the equipment could beused to make digital clocks, which would generaterevenue of $175,000, the differential revenue frommaking and selling digital clocks is $25,000.
Differential cost is the amount of increase or de-crease in cost that is expected from a course of actionas compared with an alternative. For example, if anincrease in advertising expenditures from $100,000to $150,000 is being considered, the differential costof the action is $50,000.
Differential income or loss is the difference be-tween the differential revenue and the differentialcosts. Differential income indicates that a particulardecision is expected to be profitable, while a differ-ential loss indicates the opposite.
Differential analysis focuses on the effect of al-ternative courses of action on the relevant revenuesand costs. For example, if a manager must decidebetween two alternatives, differential analysiswould involve comparing the differential revenuesof the two alternatives with the differential costs.
Differential analysis can be used in analyzing thefollowing alternatives:
� Leasing or selling equipment� Discontinuing an unprofitable segment� Manufacturing or purchasing a needed part
(make-or-buy analysis)� Replacing usable fixed assets� Processing further or selling an intermediate
product� Accepting additional business at a special price
Application of Relevant Cost ConceptWhen deciding whether to accept a special orderfrom a customer, the best thing to do is to com-pare the total revenue to be derived from this orderwith the total relevant costs incurred for this order.The key terms are incremental relevant costs and in-cremental relevant revenues. The relevant costs arethose that vary with the decision.
The long-term fixed costs should be excluded fromthe analysis since they will be incurred regardless ofwhether the order is accepted. Direct labor, directmaterials, variable manufacturing overhead, andvariable selling and administrative costs are relevantbecause they will not be incurred if the special orderis not accepted. Incremental fixed costs would be rel-evant in short-term decision making under certainsituations.

JWBT150-Vallabhaneni c06 July 28, 2009 17:41
LEARNING OBJECTIVE 6.12: UNDERSTAND VARIOUS COSTING SYSTEMS FOR PRODUCTS AND SERVICES 151
❑ Learning Objective 6.12:UNDERSTAND VARIOUSCOSTING SYSTEMS FORPRODUCTS AND SERVICESOne of the goals of cost accounting is to provideinformation for management planning and controland determination of product or service costs. Thisis achieved through the accumulation of costs bydepartment and/or by product. Although the termi-nology differs between manufacturing and serviceindustries, the principles of cost accounting are thesame.
Product cost control systems can be viewed interms of target costing and traditional costing aproduct.
Target CostingTarget costing is a new way of controlling a prod-uct’s cost. A target cost is the allowable amount ofcost that can be incurred on a given product and stillearn the required profit margin. It is a market-drivencost in which cost targets are set by considering cus-tomer requirements and competitive environment.Cost targets are achieved by focusing and improv-ing both process design and product design. Marketresearch indicates the target price customers are will-ing to pay:
Target Price − Profit Margin = Target Cost
The need for target costing arises due to sophisti-cated customers demanding better-quality productswith more features and functions at an affordableprice. This is made real by aggressive competitorswho are willing to take risks and provide a productat target price with the hope of achieving efficienciesin cost management and production operations.
Target costing is not exactly the same as designto cost or design for manufacturability, which areissues for engineering and manufacturing manage-ment respectively. Target costing integrates strate-gic business planning with cost/profit planning. Toachieve this integration, a target-costing system re-quires cross-functional teams to take ownership andresponsibility for costs. These teams consist of rep-resentatives from finance/accounting, marketing,engineering, manufacturing, and other functions.
Traditional CostingTraditional costing systems use a cost-plus ap-proach, where production costs are first estimated,
then a profit margin is added to it to obtain a prod-uct price that the market is going to pay for it. If theprice is too high, cost reductions are initiated. It is acost-driven approach where customer requirementsand competitive environment are not considered:
Traditional Production Cost + Profit Margin= Traditional Product Price
The cost to manufacture a product is necessary forexternal reporting (e.g., inventory valuation and costof goods sold determination) and internal manage-ment decisions (e.g., price determination, productmix decisions, and sensitivity analysis).
Two methods to accumulate product costs includejob order costing system and process (operations)costing system. Both methods help management inplanning and control of business operations. A joborder cost system provides a separate record for thecost of each quantity of product that passes throughthe factory. A job order cost system is best suitedto industries that manufacture custom goods to fillspecial orders from customers or that produce a highvariety of products for stock (job shops). Under aprocess cost system, costs are accumulated for eachof the departments or processes within the factory. Aprocess cost system is best suited for manufacturersof units of products that are not distinguishable fromeach other during a continuous production process(e.g., oil refineries and food processing).
Activity-Based CostingActivity-based costing (ABC) is a management sys-tem that focuses on activities as the fundamentalcost objects and uses the costs of these activitiesas building blocks for compiling the costs of othercost objects. ABC helps management in controllingcosts through its focus on cost drivers. ABC canprovide more accurate product cost data by usingmultiple cost drivers that more accurately reflect thecauses of costs. Inaccurate product cost informationcan lead to cross-subsidization of products. This re-sults in systematic undercosting of products due tolower overhead rate. These cost drivers can be non-volume-based as well as volume-based drivers.
Standard CostingStandard costs are predetermined costs or estimatedcosts requiring a startup investment to developthem. Ongoing costs for maintenance of standards

JWBT150-Vallabhaneni c06 July 28, 2009 17:41
152 Learning Module 6: Accounting
can be lower than for an actual-cost system. Stan-dard costs should be attainable and are expressedon a per-unit basis. Without standard costs, there isno flexible budgeting system since the latter is de-veloped at different volumes of production usingstandard costs per unit.
Standard costs, flexible budgets, and standards areequally applicable to manufacturing and nonmanu-facturing firms. Standard costs and flexible budgetsare interrelated. A flexible budget is a budget thatis adjusted for changes in the unit level of the costdriver or revenue driver. In a standard cost system,the concept of flexible budget is key to the analysisof variances.
A powerful benefit of standard costing is its feed-back mechanism, where actual costs are comparedwith standard costs, resulting in variances. This feed-back helps explore better ways of adhering to stan-dards, of modifying standards, and of accomplishingproduction goals. Standard costs can be developedfor material, labor, and overhead. One drawback ofa standard cost system is that actual direct materialcosts and actual direct labor costs cannot be tracedto individual products.
Types of standards include perfection (idealor theoretical) standards and currently attainablestandards. Types of variances include price, effi-ciency, direct materials, direct labor, and overheadvariances.
❑ Learning Objective 6.13:UNDERSTAND THE MEANINGAND APPLICATION OFRESPONSIBILITY ACCOUNTINGManagers are responsible and accountable for theirdecisions and actions in planning and controllingthe resources of the organization. Resources includephysical, human, and financial resources. Resourcesare used to achieve the organization’s goals andobjectives. Budgets help to quantify the resourcesrequired to achieve goals.
The concept of responsibility accounting emergedsince a few senior managers at the top cannot runall parts of a business effectively. To improve per-formance, the organization is divided into centers,product lines, divisions, and units so that a lower-level manager is responsible for a specific center,product line, division, or unit.
Each manager is in charge of a responsibility cen-ter and is accountable for a specified set of activitiesand operations within a segment of the organiza-tion. The degree of responsibility varies directly withthe level of the manager. Responsibility accountingis a system that measures the plans and actions ofeach responsibility center. Four types of responsibil-ity centers include cost, revenue, profit, and invest-ment center.
In a cost center, a manager is accountable for costsonly (e.g., a manufacturing plant). In a revenue cen-ter, a manager is accountable for revenues only (e.g.,a product manager or brand manager). In a profitcenter, a manager is accountable for revenues andcosts (e.g., a division). In an investment center, amanager is accountable for investment (e.g., a divi-sion’s revenues and costs).
A major advantage of the responsibility account-ing approach is that costs can be traced to either theindividual who has the best knowledge about thereasons for cost increase or the activity that causedthe cost increase. A major disadvantage is its behav-ioral implications for managers whose performanceis to be evaluated.
A manager should be held accountable for the coststhat he has control over. Controllability is the degreeof influence that a specific manager has over costs,revenues, and investment. A controllable cost is anycost that is subject to the influence of a given man-ager of a given responsibility center for a given timespan. Controllable costs should be separated fromuncontrollable costs in a manager’s performancereport.
In responsibility accounting, feedback is crucial.When budgets are compared with actual results,variances occur. The key is to use variance infor-mation to raise questions and seek answers fromthe right party. Variance information should not beabused—in other words, it should not be used to fixthe blame on others. Variances invoke questions as towhy and how, not who.
Self-Assessment Exercise
Online exercises are provided for the learn-ing objectives in this module. Please visitwww.mbaiq.com to complete the online exercisesand to calculate your MBA IQ Score.

JWBT150-Vallabhaneni c07 July 28, 2009 18:33
LEARNING MODULE 7
Finance
Learning Objective 7.1: Understand theNeed for Financial Plans andControls 154Financial Plans 154Cash Budget 154Financial Control 156
Learning Objective 7.2: Understandthe Principles and Techniques ofCash Management 157Cash Presentation 157Cash Items Excluded 157Controls Over Cash 157Management of Cash 158Advantages of Holding Adequate Cash and
Near-Cash Assets 158Cash Management Efficiency Techniques 159
Learning Objective 7.3: Understandthe Techniques of ManagingCurrent Assets 160Cash Conversion Cycle Model 160Approaches to Shorten the Cash Conversion
Cycle 161Working Capital Asset Investment Policies 161Working Capital Financing Policies 161Management of Marketable Securities 161Criteria for Selecting Marketable
Securities 162Risks in Marketable Securities 162
Learning Objective 7.4: Understandthe Various Types of Debt and Equityin a Capital Structure 163Types of Debt 163Short-Term Debt 163Use of Security in Short-Term Financing 165Long-Term Debt 165Factors Influencing Long-Term Financing
Decisions 167Types of Equity 167
Learning Objective 7.5: Understandthe Techniques for Evaluating theCost of Capital 169Cost of Debt 169Cost of Preferred Stock 169Cost of Retained Earnings 170Cost of Common Stock 170
Weighted-Average and Marginal Cost of CapitalConcepts 171
Issues in Cost of Capital 171Learning Objective 7.6: Understand
the Principles and Techniques ofCapital Budgeting 171Methods to Rank Investment Projects 172Postaudit of Capital Projects 176Project Cash Flows 176Project Risk Assessment 177Techniques for Measuring Standalone Risk 177Techniques for Measuring Market/Beta Risk 178Project Risks and Capital Budgeting 178Capital Rationing 178International Capital Budgeting 178
Learning Objective 7.7: Understandthe Various Types and Risks ofFinancial Instruments 179Forward Contracts 179Futures Contracts 179Currency Options 179Currency Swaps 180Hidden Financial Reporting Risk 181Financial Engineering 181
Learning Objective 7.8: Understand theVarious Types of Valuation Models 182Inventory Asset Valuation 182Financial Asset Valuation 182Business Valuation 183
Learning Objective 7.9: Understandthe Nature of Business Mergersand Acquisitions 185Types of Mergers 185Merger Tactics 185Merger Analysis 186
Learning Objective 7.10: Understandthe Implications of DividendPolicies, Stock Splits, StockDividends, and Stock Repurchases 187Dividend Policy in Theory 187Dividend Policy in Practice 188Dividend Payment Procedures 189Stock Splits, Stock Dividends,
and Stock Repurchases 189
153

JWBT150-Vallabhaneni c07 July 28, 2009 18:33
154 Learning Module 7: Finance
❑ Learning Objective 7.1:UNDERSTAND THE NEEDFOR FINANCIAL PLANSAND CONTROLSThe scope of financial plans consists of cash plan-ning (i.e., developing pro forma cash budgets) andprofit planning (i.e., preparing pro forma financialdocuments such as income statement and balancesheet) for internal (management) and external pur-poses (creditors and lenders).
Financial PlansFinancial planning takes place in two time horizons:long-term (2 to 10 years) and short-term (1 to 2 years).Factors such as business operating risks, businessand economic cycles, and product lifecycles deter-mine the planning horizon in that high risk and/orshort cycles require shorter planning horizons andvice versa.
Long-term financial plans have a strategic focus,supporting the organization’s goals and objectives.Short-term financial plans have an operating focus,supporting the long-term financial plans.
The inputs to long-term financial plans includecapital structure (i.e., the percentage of debt and eq-uity); financing sources (i.e., the amount of bondsand stocks); acquisition of plant, property, andequipment (fixed assets); marketing actions; researchand development actions; repayment of debt andreacquisition of stock; and disposal of plants, prod-uct lines, and lines of business. The outputs includea series of annual budgets, with contingencies fac-tored into them, that are highly linked to the orga-nization’s strategic plans and highly connected withall the managers and executives in the organization.
The inputs to short-term financial plans includesales forecasts, production plans, fixed assets acqui-sition plans, current period balance sheet, and fi-nancing plans. The outputs include cash budget andpro forma financial statements (i.e., income state-ment and balance sheet).
Cash BudgetThe cash budget describes cash inflows (cash re-ceipts) and outflows (cash disbursements) in a spe-cific time period, such as one year, one quarter, orone month. Components of cash receipts includecash sales, collections of accounts receivable, andnon-sale-related cash (e.g., interest and dividends re-ceived; cash from the sale of equipment, stocks, andbonds; and lease payments). However, credit card
sales and sales on account are not a part of cash re-ceipts because they have a time lag and become a partof accounts receivable. Debit card sales are part ofcash receipts because cash is immediately depositedinto the cash account. Components of cash disburse-ments include cash purchases; payments of accountspayable; rent, lease, interest, cash dividends, andloan principal; wages and salaries; fixed-asset pur-chases; and repurchases or retirement of stock.
Net Cash Flow = Cash Receipts − CashDisbursements
Ending Cash Balance = Net Cash Flow+ Beginning Cash Balance
Financing and Investment Needs = Ending CashBalance − Minimum Cash Balance Required
Shortage of cash exists when the ending cash bal-ance is less than the minimum cash balance. Financ-ing is needed through notes payable. Surplus of cashexists when the ending cash balance is greater thanthe minimum cash balance. Investment is neededthrough marketable securities.
Sources of cash (inflows) include decrease in as-sets, increase in liabilities, net income after taxes, saleof stock and other assets, and noncash charges (e.g.,depreciation, amortization, and depletion amounts).
Uses of cash (outflows) include increase in assets,decrease in liabilities, net loss, dividends paid, andrepurchase or retirement of stock.
A sample pro forma cash budget is shown here.
DV Knowledge Corporation
Pro Forma Cash Budget
Item Period 1 Period 2Cash receiptsLess: Cash disbursements
Net cash flowAdd: Beginning cash balanceEnding cash balanceLess: Minimum cash balance required
Cash shortageCash surplus
Notes: Cash shortage requires external/internal financing
and cash surplus requires external/internal investment.
A pro forma income statement is prepared usingthe percent-of-sales method in that variable costsand expenses are expressed as a percentage of salesand fixed costs and expenses are expressed as fullamounts. A sample pro forma income statement isshown here.
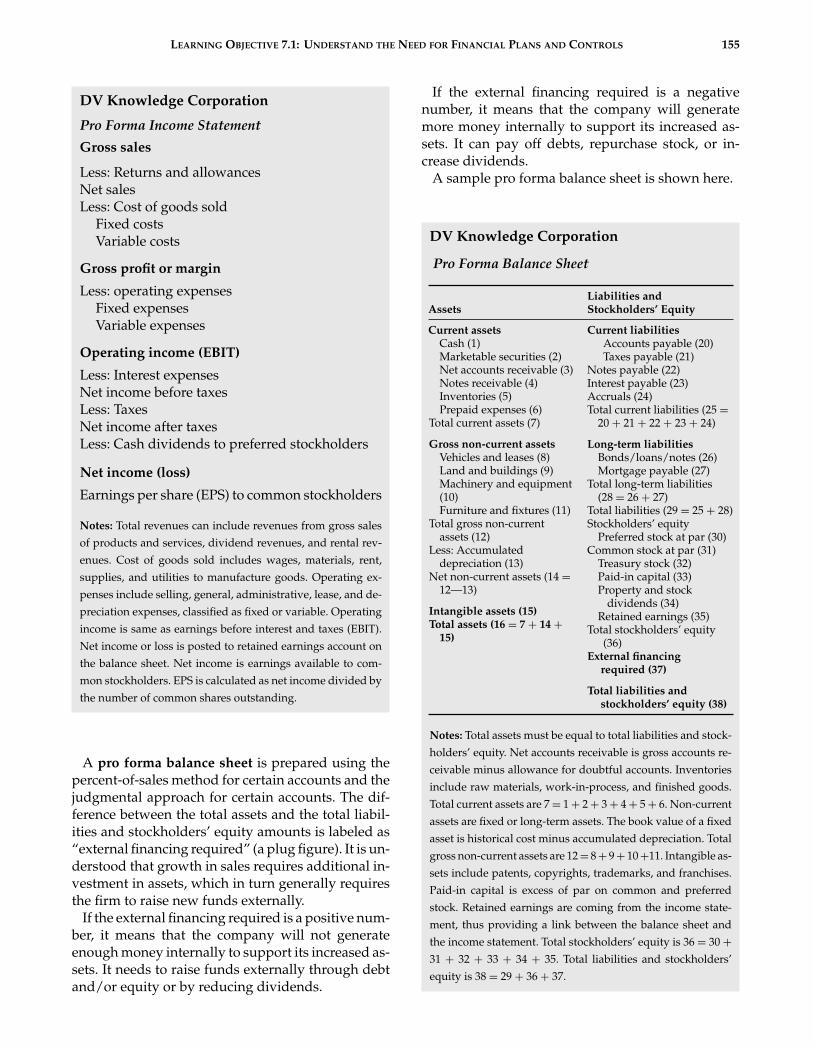
JWBT150-Vallabhaneni c07 July 28, 2009 18:33
LEARNING OBJECTIVE 7.1: UNDERSTAND THE NEED FOR FINANCIAL PLANS AND CONTROLS 155
DV Knowledge Corporation
Pro Forma Income Statement
Gross sales
Less: Returns and allowancesNet salesLess: Cost of goods sold
Fixed costsVariable costs
Gross profit or margin
Less: operating expensesFixed expensesVariable expenses
Operating income (EBIT)
Less: Interest expensesNet income before taxesLess: TaxesNet income after taxesLess: Cash dividends to preferred stockholders
Net income (loss)
Earnings per share (EPS) to common stockholders
Notes: Total revenues can include revenues from gross sales
of products and services, dividend revenues, and rental rev-
enues. Cost of goods sold includes wages, materials, rent,
supplies, and utilities to manufacture goods. Operating ex-
penses include selling, general, administrative, lease, and de-
preciation expenses, classified as fixed or variable. Operating
income is same as earnings before interest and taxes (EBIT).
Net income or loss is posted to retained earnings account on
the balance sheet. Net income is earnings available to com-
mon stockholders. EPS is calculated as net income divided by
the number of common shares outstanding.
A pro forma balance sheet is prepared using thepercent-of-sales method for certain accounts and thejudgmental approach for certain accounts. The dif-ference between the total assets and the total liabil-ities and stockholders’ equity amounts is labeled as“external financing required” (a plug figure). It is un-derstood that growth in sales requires additional in-vestment in assets, which in turn generally requiresthe firm to raise new funds externally.
If the external financing required is a positive num-ber, it means that the company will not generateenough money internally to support its increased as-sets. It needs to raise funds externally through debtand/or equity or by reducing dividends.
If the external financing required is a negativenumber, it means that the company will generatemore money internally to support its increased as-sets. It can pay off debts, repurchase stock, or in-crease dividends.
A sample pro forma balance sheet is shown here.
DV Knowledge Corporation
Pro Forma Balance Sheet
AssetsLiabilities andStockholders’ Equity
Current assets Current liabilitiesCash (1)Marketable securities (2)Net accounts receivable (3)Notes receivable (4)Inventories (5)Prepaid expenses (6)
Total current assets (7)
Gross non-current assetsVehicles and leases (8)Land and buildings (9)Machinery and equipment(10)Furniture and fixtures (11)
Total gross non-currentassets (12)
Less: Accumulateddepreciation (13)
Net non-current assets (14 =12—13)
Intangible assets (15)Total assets (16 = 7 + 14 +
15)
Accounts payable (20)Taxes payable (21)
Notes payable (22)Interest payable (23)Accruals (24)Total current liabilities (25 =
20 + 21 + 22 + 23 + 24)
Long-term liabilitiesBonds/loans/notes (26)Mortgage payable (27)
Total long-term liabilities(28 = 26 + 27)
Total liabilities (29 = 25 + 28)Stockholders’ equity
Preferred stock at par (30)Common stock at par (31)
Treasury stock (32)Paid-in capital (33)Property and stock
dividends (34)Retained earnings (35)
Total stockholders’ equity(36)
External financingrequired (37)
Total liabilities andstockholders’ equity (38)
Notes: Total assets must be equal to total liabilities and stock-
holders’ equity. Net accounts receivable is gross accounts re-
ceivable minus allowance for doubtful accounts. Inventories
include raw materials, work-in-process, and finished goods.
Total current assets are 7 = 1 + 2 + 3 + 4 + 5 + 6. Non-current
assets are fixed or long-term assets. The book value of a fixed
asset is historical cost minus accumulated depreciation. Total
gross non-current assets are 12 = 8 + 9 + 10 +11. Intangible as-
sets include patents, copyrights, trademarks, and franchises.
Paid-in capital is excess of par on common and preferred
stock. Retained earnings are coming from the income state-
ment, thus providing a link between the balance sheet and
the income statement. Total stockholders’ equity is 36 = 30 +31 + 32 + 33 + 34 + 35. Total liabilities and stockholders’
equity is 38 = 29 + 36 + 37.

JWBT150-Vallabhaneni c07 July 28, 2009 18:33
156 Learning Module 7: Finance
Financial ControlThe scope of financial control includes determiningoperating breakeven analysis, operating leverage, fi-nancial breakeven analysis, financial leverage, andtotal leverage. It is important to look at the relation-ship between sales volume and profitability underdifferent operating conditions. These relationshipsprovide information to plan for changes in the firm’slevel of operations, financing needs, and profitabil-ity. A good control system is essential to ensure thatplans are executed properly and to facilitate a timelymodification of plans if the assumptions on whichthe initial plans were based turn out to be differentthan expected.
Operating breakeven analysis is a method of de-termining the point at which sales will just cover op-erating costs—that is, the point at which the firm’soperations will break even. It also shows the magni-tude of the firm’s operating profits or losses if salesexceed or fall below that point.
The operating breakeven point (BEP) in units anddollars can be found by setting the total revenuesequal to the total operating costs so that operatingincome or net operating income (NOI) is zero. Inequation form, NOI = 0 if
Sales Revenues = Total Operating Costs = TotalVariable Costs + Total Fixed Costs
Operating BEP in Units = (Total Fixed Costs)/(Sales Price per Unit − Variable Cost per Unit)
where sales price per unit minus variable cost perunit equals contribution margin per unit.
Operating BEP in Dollars = (Total Fixed Costs)/(Gross Profit Margin)
where gross profit margin is [(1 – (V/P)], where V isvariable cost per unit and P is sales price per unit.
Operating leverage can be defined in terms ofthe way a given change in sales volume affects netoperating income (NOI) or earnings before interestand taxes (EBIT). The degree of operating leverage(DOL) is defined as the percentage change in NOI orEBIT associated with a given percentage change insales. If a high percentage of a firm’s total operatingcosts are fixed, the firm is said to have a high DOL,meaning that a relatively small change in sales willresult in a large change in operating income.
DOL = (Percentage Change in NOI or EBIT)/(Percentage Change in Sales)
Financial breakeven analysis is a method of de-termining the NOI or EBIT that covers all of the fi-nancing costs and that produces earnings per share(EPS) equal to zero. Financing costs, which are fixedin nature, include interest payments to bondholdersand dividend payments to preferred stockholders.
Financial BEP in Dollars = I + (Dps/1 − T)
where I is interest payments on debt, Dps is amountof dividends paid to preferred stockholders, and Tis the marginal tax rate.
Financial leverage starts after the operating lever-age ends, further magnifying the impact of changingsales volume on earnings per share. The degree of fi-nancial leverage (DFL) is defined as the percentagechange in EPS that results from a given percentagechange in EBIT. This means that a company with ahigher DFL is considered to have greater financialrisk than a company with a lower DFL.
DFL = (Percentage Change in EPS)/(PercentageChange in EBIT)
where EPS is net income divided by the number ofcommon shares outstanding.
Operating leverage, which is a first-stage leverage,considers how changing sales volume impacts op-erating income, thus affecting the operating sectionof the income statement. Financial leverage, whichis a second-stage leverage, considers how changingoperating income impacts earnings per share, thusaffecting the financing section of the income state-ment.
Total leverage combines the effects of operatingleverage and financial leverage. The degree of totalleverage (DTL) is defined as the joint effect of oper-ating and financial leverage on earnings per share.DTL can help management evaluate alternative ex-pansion plans regarding the level of operations (e.g.,plant automation) and how those operations are fi-nanced (e.g., purchasing new equipment for automa-tion with debt).
DTL = (Percentage Change in EPS)/(Percentage Change in Sales)
or
DTL = DOL × DFL
Note that DTL, DOL, and DFL are expressed asnumber of times, such as 2.4×.

JWBT150-Vallabhaneni c07 July 28, 2009 18:33
LEARNING OBJECTIVE 7.2: UNDERSTAND THE PRINCIPLES AND TECHNIQUES OF CASH MANAGEMENT 157
❑ Learning Objective 7.2:UNDERSTAND THE PRINCIPLESAND TECHNIQUES OF CASHMANAGEMENTCash is a very liquid asset and susceptible to fraudu-lent activities. Controls over cash are very importantto protect this financial asset.
Cash PresentationTo be presented as cash on the balance sheet, it mustbe available to meet current obligations. Cash in-cludes such items as coins, currency, checks, bankdrafts, checks from customers, and money orders.Cash in savings accounts and cash in certificates ofdeposit (CDs) maturing within one year can be in-cluded as current assets, preferably under the cap-tion of “short-term investments,” but not as cash.Petty cash and other imprest cash accounts can beincluded in other cash accounts.
Current assets are those assets expected to be con-verted into cash, sold, or consumed within one yearor within the operating cycle, whichever is longer.Current assets are properly presented in the balancesheet in the order of their liquidity. Some of the morecommon current assets are cash, marketable secu-rities, accounts receivable, inventories, and prepaiditems.
Cash Items ExcludedThe portion of an entity’s cash account consistingof a compensating balance must be segregated andshown as a noncurrent asset if the related borrow-ings are noncurrent liabilities. If the borrowings arecurrent liabilities, it is acceptable to show the com-pensating balance as a separately captioned currentasset.
Certain cash items are not presented in the gen-eral cash section of the balance sheet. These includecompensating balances, other restricted cash, andexclusions from cash.
Cash requires a good system of internal control,since it is so liquid and easy to conceal and trans-port. Segregation of duties is an important part ofthe system of internal control for cash. No one personshould both record a transaction and have custodyof the asset. Without proper segregation, it is easierfor an employee to engage in lapping. Lapping is atype of fraud in which an employee misappropriates
receipts from customers and covers the shortages inthese customers’ accounts with receipts from sub-sequent customers. Therefore, the shortage is nevereliminated but is transferred to other accounts. Lap-ping schemes do not require the employee to divertfunds for his personal use. The funds can be divertedfor other business expenses.
Kiting is a scheme in which a depositor with ac-counts in two or more banks takes advantage of thetime required for checks to clear in order to obtainunauthorized credit. The scheme would be nonexis-tent if depositors were not allowed to draw againstuncollected funds. The use of uncollected funds doesnot always indicate a kite; such use can be autho-rized by an officer of the bank. Kiting schemes canbe as simple as cashing checks a few days beforepayday, then depositing the funds to cover checkspreviously written. Or, they can be as complex asa systematic buildup of uncollected deposits, pyra-miding for the “big hit.” Kiting can be eliminated orreduced through electronic funds transfer systems.Kiting can be detected when reviewing accounts todetermine whether a customer or employee is draw-ing a check against an account in which he has de-posited another check that has not yet cleared.
Float is an amount of money represented by items(both check and noncheck) outstanding and in theprocess of collection. The amount of float incurredis determined by two factors: the dollar volume ofchecks cleared and the speed with which the checksare cleared. The relationship between float and thesetwo factors can be expressed as:
Float = Dollar Volume × Collection Speed
The cost of float pertains to the potential for earn-ing income from nonearning assets, as representedby items in the process of collection. This cost of floatis an opportunity cost—the firm could have fully in-vested and earned income had the funds been avail-able for investment and not incurred float.
In a financial futures hedging transaction, a firmtakes a futures position that is opposite to its existingeconomic, or cash position. By taking the oppositeposition in the financial futures market, the firm canprotect itself against adverse interest rate fluctua-tions by locking in a given yield or interest rate.
Controls Over CashCash is a precious resource in any organization. Cashis required to pay employee wages and salaries, buyraw materials and parts to produce finished goods,

JWBT150-Vallabhaneni c07 July 28, 2009 18:33
158 Learning Module 7: Finance
pay off debt, and pay dividends, among other things.Cash is received from customers for the sale of goodsand the rendering of services. Customer paymentscome into the organization in various forms, such aschecks, bank drafts, wire transfers, money orders,charge cards, and lockboxes. The cash manager’sprimary job is to ensure that all customer paymentsfunnel into the company’s checking accounts as fastas possible with greater accuracy. Payments receivedat lockboxes located at regional banks flow into cashconcentration accounts, preferably on the same dayof deposit.
The cash manager should focus on reducing theelapsed time from customer payment date to theday funds are available for use in the company’sbank account. This elapsed time is called the “float.”
A major objective of the cash manager is to ac-celerate the cash inflow and slow the cash outflowwithout damaging the company’s reputation in theindustry. To do this, the cash manager needs to findways to accelerate cash flows into the company thatin turn reduce investment in working capital. Simi-larly, the cash manager needs to find ways to slowthe outflow of cash by increasing the time for pay-ments to clear the bank. Another major objective isnot to allow funds to sit idle without earning interest.
The cash manager needs to focus on the followingseven major areas for effective cash management:(1) cash account balances, (2) purchases, (3) payables,(4) manufacturing, (5) sales, (6) receivables, and(7) manual lockbox systems.
Electronic techniques to control cash include elec-tronic lockbox systems, electronic funds transfer(EFT), and electronic data interchange (EDI) systems.
Management of CashOn one hand, adequate cash serves as protectionagainst a weak economy and can be used to pay offdebts and to acquire companies. On the other hand,too much cash makes a firm vulnerable to corporateraiding or takeovers.
Cash = Currency + Bank Demand Deposits+ Near-Cash Marketable Securities
Near-Cash Marketable Securities = U.S.
Treasury Bills + Bank Certificates of Deposit
Effective cash management is important to all orga-nizations, whether profit-oriented or not. The scopeof cash management encompasses cash gathering(collection) and disbursement techniques and in-
vestment of cash. Since cash is a “nonearning” assetuntil it is put to use, the goal of cash management isto reduce cash holdings to the minimum necessaryto conduct normal business.
There are four reasons for holding cash by organi-zations: transaction balance, compensating balance,precautionary balance, and speculative balance.
1. Transaction balance. Payments and collectionsare handled through the cash account. These rou-tine transactions are necessary in business opera-tions.
2. Compensating balance. A bank requires the cus-tomer to leave a minimum balance on deposit tohelp offset the costs of providing the banking ser-vices. It is compensation paid to banks for pro-viding loans and services. Some loan agreementsalso require compensating balances.
3. Precautionary balance. Firms hold some cashin reserve to accommodate for random, unfore-seen fluctuations in cash inflows and outflows.These are similar to the “safety stocks” used ininventories.
4. Speculative balance. Cash may be held to enablethe firm to take advantage of any bargain pur-chases that might arise. Similar to precautionarybalances, firms could rely on reserve borrowingcapacity and on marketable securities rather thanon cash for speculative purposes.
A total desired cash balance for a firm is not sim-ply the addition of cash in transaction, compensat-ing, precautionary, and speculative balances. This isbecause the same money often serves more than onepurpose. For example, precautionary and specula-tive balances can also be used to satisfy compensat-ing balance requirements. A firm needs to considerthese four factors when establishing its target cashposition.
Advantages of Holding Adequate Cashand Near-Cash AssetsIn addition to the motives for transaction, com-pensating, precautionary, and speculative balances,firms do have other advantages for holding adequatecash and near-cash assets. These advantages include:
� Taking trade discounts. Suppliers offer customerstrade discounts—a discount for prompt paymentof bills. Cash is needed to take advantage of tradediscounts. Cost of not taking trade discounts couldbe high.

JWBT150-Vallabhaneni c07 July 28, 2009 18:33
LEARNING OBJECTIVE 7.2: UNDERSTAND THE PRINCIPLES AND TECHNIQUES OF CASH MANAGEMENT 159
� Keeping current ratios and acid-test ratios in linewith those of other firms in the industry requiresadequate holdings of cash. Higher ratios give astrong credit rating. A strong credit rating enablesthe firm both to purchase goods and services fromsuppliers and to provide favorable terms and tomaintain an ample line of credit with the bank. Aweak credit rating does the opposite.
� Holding an ample supply of cash could help toacquire another firm, to handle contingencies suchas a labor strike, to attack competitors’ marketingcampaigns, and to take advantage of special offersby suppliers.
Cash Management Efficiency TechniquesA cash budget, showing cash inflows and outflowsand cash status, is the starting point in the cash man-agement system. The techniques used to increase theefficiency of management include cash flow synchro-nization, use of float, speeding collections, slowingdisbursements, and transfer mechanisms.
Cash Flow SynchronizationBy coinciding cash inflows with cash outflows, theneed for transaction balances will be low. The bene-fits would be reduced cash balances, decreased bankloan needs, reduced interest expenses, and increasedprofits.
Use of FloatTwo kinds of float exist: disbursement float and col-lection float. The difference is net float. Disburse-ment float arises when one makes a payment by acheck and is defined as the amount of checks that onehas written but that are still being processed and thushave not yet been deducted from one’s checking ac-count balances by the bank. Collection float ariseswhen one receives a check for payment and is de-fined as the amount of checks that one has receivedbut that are in the collection process. It takes time todeposit the check, for the bank to process it, and tocredit one’s account for the amount collected.
Net Float = Disbursement Float − Collection Float
Net Float = One′s Checkbook Balance − Bank′sBook Balance
A positive net float is better than a negative netfloat because the positive net float collects checkswritten to a firm faster than clearing checks written
to others. The net float is a function of the ability tospeed up collections on checks received and to slowdown collections on checks written. The key is toput the funds received to work faster and to stretchpayments longer.
Speeding CollectionsFunds are available to the receiving firm only af-ter the check-clearing process has been satisfacto-rily completed. There is a time delay between a firmprocessing its incoming checks and its making useof them. Three parties are involved in the check-clearing process: the payer, payee, and the U.S. Fed-eral Reserve System (requires a maximum of twodays to clear the check). The length of time requiredfor checks to clear is a function of the distance be-tween the payer’s and the payee’s banks. The greaterthe distance, the longer the delay due to mail. If thepayer’s and the payee’s bank are the same, there isless delay than otherwise.
Slowing DisbursementsThree techniques are available to slow down dis-bursements. These include delaying payments, writ-ing checks on banks in different locations, and us-ing drafts. Delaying payments has negative conse-quences, such as a bad credit rating. A firm canbe sued by a customer for writing checks on banksin distant locations (e.g., playing West Coast banksagainst eastern banks in the United States). Speedingthe collection process and slowing down disburse-ments have the same objective. Both keep cash onhand for longer periods.
Use of draft seems normal. A check is payable ondemand; a draft is not. A draft must be transmitted tothe issuer, who approves it and then deposits fundsto cover it, after which it can be collected.
Money Transfer MechanismsA transfer mechanism is a system for moving fundsamong accounts at different banks. Three typesof transfer mechanisms are (1) depository transferchecks, (2) wire transfers, and (3) electronic deposi-tory transfer checks:
1. A depository transfer check (DTC) is restrictedfor deposit into a particular account at a partic-ular bank. A DTC is payable only to the bank ofdeposit for credit to the firm’s specific account.DTCs provide a means of moving money from
JWBT150-Vallabhaneni c07 July 28, 2009 18:33
160 Learning Module 7: Finance
local depository banks to regional concentrationbanks and to the firm’s primary bank.
2. Wire transfer. A wire transfer is the electronictransfer of funds via a telecommunications net-work that makes funds collected at one bank im-mediately available from another bank. The wiretransfer eliminates transit float and reduces therequired level of transaction and precautionarycash balances.
3. The electronic depository transfer check (EDTC)is a combination of a wire transfer and a DTC.EDTC provides one-day availability in checkclearing-time because it avoids the use of the mail.EDTC is a paperless transaction. EDTC is alsocalled automated clearinghouse (ACH), whichis a telecommunication network that provides anelectronic means of sending data from one finan-cial institution to another. Magnetic tape files areprocessed by the ACH and direct computer-to-computer links are also available.
❑ Learning Objective 7.3:UNDERSTAND THE TECHNIQUESOF MANAGING CURRENT ASSETSEffective management of current assets requires aworking capital policy, which refers to the firm’spolicies regarding the desired level for each cate-gory of current assets and how current assets will befinanced. The components of current assets in theorder of liquidity are:
� Cash (most liquid and easy to conceal and trans-port)
� Marketable securities� Accounts receivable� Prepaid expenses� Inventories (least liquid and can be damaged,
spoiled, or stolen)
Current assets fluctuate with sales and representa large portion (usually greater than 40%) of totalassets. Working capital management is important forboth large and small firms alike.
Working Capital versus Net Working Capital
� Working capital means current assets (also grossworking capital).
� Net working capital is current assets minus cur-rent liabilities.
� Working capital management involves the ad-ministration of current assets and current liabil-ities.
For financing current assets, most small firms relyon trade credit and short-term bank loans, both ofwhich affect working capital by increasing currentliabilities. Accounts payable represents “free” tradecredit when discounts are taken. This is similar toan interest-free loan. However, current liabilities areused to finance current assets and in part representcurrent maturities of long-term debt. Large firmsusually rely on long-term capital markets such asstocks. The components of current liabilities areshown here with their associated costs:
� Accounts payable (free trade credit)� Accrued wages� Accrued taxes� Notes payable (not free)� Current maturities of long-term debt
The relationship between sales and the need to in-vest in current assets is direct:
� As sales increase, accounts receivable increases, in-ventory increases, and cash needs increase.
� Any increase in an account on the left-hand side ofthe balance sheet (e.g., assets) must be matched byan increase on the right-hand side of the balancesheet (e.g., liabilities).
This involves matching maturities of assets and li-abilities. That is, current assets are financed withcurrent liabilities and fixed assets are financed withlong-term debt or stock. This is to reduce interestrate risk.
Cash Conversion Cycle ModelThe cash conversion model defines the length oftime from the payment for the purchase of raw ma-terials to the collection of accounts receivable gener-ated by the sale of the final product. It is an importantmodel since it focuses on the conversion of materialsand labor to cash.
Cash Conversion Cycle = Inventory ConversionPeriod (1) + Receivables Conversion Period (2)−Payables Deferral Period (3)
where (1) inventory conversion period is thelength of time required to convert raw materialsinto finished goods and then to sell these goods;

JWBT150-Vallabhaneni c07 July 28, 2009 18:33
LEARNING OBJECTIVE 7.3: UNDERSTAND THE TECHNIQUES OF MANAGING CURRENT ASSETS 161
(2) receivables conversion period is the length oftime required to convert the firm’s receivables intocash; and (3) payables deferral period is the averagelength of time between the purchase of raw materialsand labor and the payment of cash for them.
The cash conversion cycle begins the day a billfor labor and/or supplies is paid and runs to theday receivables are collected. The cycle measures thelength of time the firm has funds tied up in workingcapital. The shorter the cash conversion cycle, thesmaller the need for external financing and thus thelower the cost of such financing. This would resultin increase in profits.
Approaches to Shorten the CashConversion CycleThe following list provides approaches to shortenthe cash conversion cycle:
� Reduce the inventory conversion period by pro-cessing and selling goods more quickly.
� Reduce the receivables conversion period or dayssales outstanding by speeding up collections.
� Lengthen the payables deferral period by slowingdown payments.
Working Capital Asset Investment PoliciesAppropriate working capital asset investment poli-cies are needed to support various levels of sales.Three such policies are:
1. Relaxed (liberal) working capital policy. Salesare stimulated by the use of a credit policy thatprovides liberal financing to customers, which re-sults in a high level of accounts receivable. Thisis a policy that maximizes the current assets. Ac-counts receivable will increase as the credit salesincrease for a relaxed policy, and the opposite istrue for the restricted policy.
2. Moderate working capital policy. This is a policythat falls between liberal and tight working capitalpolicy.
3. Restricted (tight) working capital policy. This isa policy that minimizes current assets. A tight pol-icy lowers the receivables for any given level ofsales or even the risk of a decline in sales. Thispolicy provides the highest expected return oninvestment and entails the greatest risk. The firmwould hold minimal levels of safety stocks forcash and inventories.
Working Capital Financing PoliciesA good working capital financing policy is neededto handle seasonal or cyclical business fluctuationsand a strong or weak economy. When the economyis strong, working capital is built up and inventoriesand receivables go up. When the economy is weak,the working capital goes down, along with invento-ries and receivables. Current assets are divided intopermanent and temporary, and the manner in whichthese assets are financed constitutes the firm’s work-ing capital financing policy.
A firm’s working capital asset investment policy, in-cluding the cash conversion cycle, is always establishedin conjunction with the firm’s working capital financingpolicy. Three financing policies are available to man-age working capital: maturity matching, aggressiveapproach, and conservative approach.
The maturity matching or “self-liquidating” ap-proach requires that asset maturities are matchedwith liability maturities. This means permanent as-sets are financed with long-term capital to reducerisk. Each loan would be paid off with the cash flowsgenerated by the assets financed by the loan, soloans would be self-liquidating. Uncertainty aboutthe lives of assets prevents exact matching in an expost sense.
The three working capital financing policies dis-cussed above differ in the relative amount of short-term debt financing each uses, as shown in the figure.
Aggressivepolicy
Conservativepolicy
Maturitymatching policy
Uses greatestamount of short-
term debt
Falls in between—uses just right
amount of short-term debt
Uses leastamount of short-
term debt
Management of Marketable SecuritiesTwo basic reasons for holding marketable securities(e.g., U.S. Treasury bills, commercial paper, and cer-tificates of deposit) are: (1) they are used as a tempo-rary investment and (2) they serve as a substitute forcash balances. Temporary investment occurs whenthe firm must finance seasonal or cyclical operations;when the firm must meet some known financial re-quirements such as new plant construction program,a bond about to mature, or quarterly tax payments;and when the proceeds from stocks and bonds areused to pay for operating assets.

JWBT150-Vallabhaneni c07 July 28, 2009 18:33
162 Learning Module 7: Finance
Actually, it is a choice between taking out short-term loans or holding marketable securities. Thereis a trade-off between risks and return. Similar tocash management policy, a firm’s marketable secu-rity policy should be an integral part of its overallworking capital policy. The policy may be conser-vative, aggressive, or a moderate working capitalfinancing policy.
If the firm has a conservative working capital fi-nancing policy, its long-term capital will exceed itspermanent assets and it will hold marketable securi-ties when inventories and receivables are low. This isa less risky one. There is no liquidity problem sincethe firm has no short-term debt. However, the firmincurs higher interest rates when borrowing than thereturn it receives from marketable securities. It is ev-ident that a less risky strategy costs more.
If the firm has a moderate working capital financ-ing policy, the firm will match permanent assetswith long-term financing and meet most seasonalincreases in inventories and receivables with short-term loans. The firm also carries marketable securi-ties at certain times. With this policy, asset maturitiesare matched with those of liabilities. No risk exists,at least theoretically.
If the firm has an aggressive working capital fi-nancing policy, it will never carry any securities andwill borrow heavily to meet peak needs. This is theriskiest, and it will face difficulties in borrowing newfunds or repaying the loan, due to its low current ra-tio. The expected rate of return on both total assetsand equity will be higher.
Criteria for Selecting MarketableSecuritiesThe selection criteria for a marketable security port-folio include default risk, taxability, and relativeyields. Several choices are available for the financialmanager in selecting a marketable securities portfo-lio, and they all differ in risk and return. Most fi-nancial managers are averse to risk and unwilling tosacrifice safety for higher rates of return. The highera security’s risk, the higher its expected and requiredreturn and vice versa. A trade-off exists between riskand return.
Large corporations tend to make direct purchasesof U.S. Treasury bills, commercial paper, certificatesof deposit, and Eurodollar time deposits. Small cor-porations are more likely to use money market mu-tual funds as near-cash reserves (because they can bequickly and easily converted to cash). Interest rates
on money market mutual funds are lower and netreturns are higher than is the case with the Treasurybills.
Risks in Marketable SecuritiesLet us review the four different types of risk (i.e.,default risk, interest rate risk, purchasing power risk,and liquidity risk) facing the financial manager inmanaging the portfolio of marketable securities:
1. Default risk. The risk that a borrower will be un-able to make interest payments or to repay theprincipal amount upon maturity is known as de-fault risk. For example, the default risk for se-curities issued by the U.S. Treasury is negligible,whereas securities issued by a corporation andothers have some degree of default risk. The higherthe earning power of a firm, the lower its default riskand vice versa.
2. Interest rate risk. The risk to which investors areexposed due to rising interest rates is known asinterest rate risk. It is the interest rate fluctuationsthat cause interest rate risk. Even U.S. Treasurybonds are subject to interest rate risk. Bond pricesvary with changes in interest rates. Long-term bondshave more interest rate risk. Short-term bonds have lessinterest rate risk.
3. Purchasing power risk. The risk that inflation willreduce the purchasing power of a given sum ofmoney is known as purchasing power risk. Pur-chasing power risk is lower on assets whose re-turns tend to rise during inflation. Purchasingpower risk is higher on assets whose returns arefixed during inflation. So it is the variability ofreturns during inflation that determines the pur-chasing power risk. Real estate, short-term debt,and common stocks are better hedges against inflation.Bonds and other long-term fixed-income securities arenot the best hedges against inflation.
4. Liquidity (marketability) risk. The risk that secu-rities cannot be sold at close to the quoted marketprice on short notice is known as liquidity risk. Forexample, securities issued by the U.S. Treasuryand larger corporations have little liquidity risk,whereas securities issued by small and unknowncompanies are subject to liquidity risk. Illiquidityof a firm is the situation where the firm’s maturingobligations are greater than the cash immediatelyavailable to pay. An asset that can be sold quickly forclose to its quoted price is highly liquid. An asset thatcannot be sold quickly and is sold at a reduced price isnot highly liquid.

JWBT150-Vallabhaneni c07 July 28, 2009 18:33
LEARNING OBJECTIVE 7.4: UNDERSTAND THE VARIOUS TYPES OF DEBT AND EQUITY IN A CAPITAL STRUCTURE 163
❑ Learning Objective 7.4:UNDERSTAND THE VARIOUSTYPES OF DEBT AND EQUITY IN ACAPITAL STRUCTUREThe capital structure of a firm consists of amountsand proportions of debt and equity as part of totalcapital.
Types of DebtDebt is of two types: (1) short-term debt and (2) long-term debt. Debt maturities affect both risk and ex-pected returns. For example:
� Short-term debt is riskier than long-term debt ifthe debt cannot paid off when due.
� Short-term debt is less expensive than long-termdebt.
� Short-term debt can be obtained faster than long-term debt.
� Short-term debt is more flexible than long-termdebt.
There is a trade-off between risk and profits in us-ing short-term debt.
Short-Term DebtBy definition, short-term debt (credit) is any lia-bility originally scheduled for payment within oneyear. The four major sources of short-term credit are:(1) accruals, (2) accounts payable, (3) bank loans, and(4) commercial paper. The order of short-term creditsources is shown here from both cost and importanceviewpoints:
In the Order of Importance In the Order of Cost
A. Trade credit (mostimportant)
A. Trade credit (free, nointerest paid)
B. Bank loans B. AccrualsC. Commercial paper C. Commercial paperD. Accruals (least important) D. Bank loans (not free,
interest paid)
(A) Trade CreditTrade credit is granted by the suppliers of goodsas a sales-promotion device. All firms, regardless oftheir size, depend on accounts payable or trade creditas a source of short-term financing. Small firms dorely more heavily on trade credit than larger firmsdue to the former’s inability to raise money fromother sources. Trade credit, a major part of currentliability, is an interfirm debt arising from credit sales
and recorded as an account receivable by the sellerand as an account payable by the buyer. Trade creditis a spontaneous source of financing arising from thenormal course of business operations.
When payment terms are extended, the amountin accounts payable is expanded to provide an ad-ditional source of financing. Therefore, lengtheningthe credit period generates additional financing.
Payment terms vary and usually call for net 30,meaning that it must pay for goods 30 days afterthe invoice date. Other terms include 1/10, net 30,which means that a 1% discount is given if paymentis made within 10 days of the invoice date, but the fullinvoice amount is due and payable within 30 days ifthe discount is not taken. The finance manager hasa choice of taking or not taking the discount, and heneeds to calculate the cost of not taking discounts onpurchases. The equation is:
Percentage Cost of Not Taking Discount
= Discount Percent100 % − Discount %
× 360A − B
where A = days credit is outstanding and B = dis-count period.
A firm’s policy with regard to taking or not takingtrade discounts can have a significant effect on itsfinancial statements. A dichotomy exists in termsof taking discounts or not taking discounts. Carefulanalysis needs to be performed showing relevantcosts and its effects on net income:
Decision Conditions in Discounts:
1. If the company does not take discounts (i.e., usesmaximum trade credit), its interest expense willbe zero (i.e., no borrowing is necessary), but itwill have an expense equivalent to lost discounts.
2. If the company does take discounts (i.e., borrowsmoney from bank), it will incur interest expenseon the loan, but it will avoid the cost of dis-counts lost. The company gives up some of thetrade credit, and it has to raise money from othersources such as bank credit, common stock, orlong-term bonds.
Decision Rules in Discounts:
1. If the discount amount lost exceeds the interestexpense, the “take-discounts” policy would resultin a higher net income and eventually a higherstock price.
2. If the interest expense exceeds the discountamount lost, the “do-not-take-discounts” policywould result in a higher net income and eventu-ally a higher stock price.

JWBT150-Vallabhaneni c07 July 28, 2009 18:33
164 Learning Module 7: Finance
(B) Bank LoansBank loans appear on firms’ balance sheets underthe notes payable account category. A promissorynote is signed by the borrower (customer) specify-ing the amount borrowed, the percentage interestrate, the repayment schedule, any collateral, and anyother terms and conditions. Banks require a compen-sating balance in the form of a minimum checkingaccount balance equal to a specified percentage (i.e.,10 to 20%) of the face amount of the loan. A compen-sating balance raises the effective interest rate on theloan.
Examples of Bank Loan Features:� Promissory note� Compensating balance� Line of credit� Revolving credit agreement
Banks also give a line of credit to a borrower, and itworks like a credit card limit. A line of credit can bebased on either formal or informal understanding.It includes the maximum amount of credit the bankwill extend to the borrower. A revolving credit agree-ment, which is similar to a line of credit, is a formalline of credit often used by large firms. The bank hasa legal obligation to honor a revolving credit agree-ment while no legal obligation exists under the lineof credit.
The cost of a bank loan (i.e., interest rate) variesdepending on economic conditions and U.S. FederalReserve (Fed) money supply policy. Generally, in-terest rates are higher for riskier borrowers and forsmaller loans due to fixed costs of servicing the loan.If a firm is financially strong, it can borrow at theprime rate, which has traditionally been the lowestrate banks charge. If a firm is financially weak, thebank will charge higher than prime rate to compen-sate for the risk involved.
Interest rates on bank loans are quoted in threeways: (1) simple interest, (2) discount interest, and (3)add-on interest. Each method is briefly discussed:
1. Simple (regular) interest. In a simple interestloan, the borrower receives the face value of theloan and then repays the principal and interest atmaturity. Effective Rate = Interest/Amount Re-ceived. If a loan period is one year or more, thenominal (stated) rate equals the effective rate. If aloan period is less than one year, the effective rateis higher than the nominal (stated) rate.
2. Discount interest. In a discount interest loan,the borrower receives less than the face value of
the loan since the bank deducts the interest inadvance. Effective Rate = Interest/Amount Re-ceived. Because of discounting, the effective rateis always higher than a simple interest loan re-gardless of the loan period. However, the discountinterest imposes less of a penalty on a shorter-termthan on a longer-term loan because the interest ispaid closer to the average date of use of the funds(half the life of the loan).
3. Add-on interest. Small installment loans employthe add-on interest method. The interest is calcu-lated based on the nominal rate and then addedto the amount received to obtain the loan’s facevalue. Effective Rate = Interest/0.5 (Amount Re-ceived). The effective rate can be almost doublethe stated rate since the average amount actuallyoutstanding is less than the original amount ofthe loan.
The situation is different when compensating bal-ances are introduced to the simple interest methodand discount interest method. In general, compen-sating balances tend to raise the effective interestrate on a loan because some money is tied up ina checking account (i.e., cannot be used). There aretwo exceptions: (1) if the firm can use transactionbalances as compensating balances, the effective in-terest rate will be less than otherwise and (2) if thefirm can earn interest on its bank deposits, includingthe compensating balance, the effective interest ratewill be decreased.
(C) Commercial PaperCommercial paper represents short-term, unsecuredpromissory notes of large, strong firms and is highlyliquid in nature. The interest rate charged on com-mercial paper is somewhat below the prime rate, andits maturity ranges from two to six months. Eventhough compensating balances are not required forcommercial paper, its effective interest rate is higherdue to the loan commitment fees involved.
Firms issuing commercial paper are required bycommercial paper dealers to have unused revolvingcredit agreements to back up their outstanding com-mercial paper. A commitment fee is charged on theunused credit line.
The commercial paper market is impersonal, un-like bank loans. However, the commercial papermarket is flexible and provides a wide range of creditsources generally available to financially strongfirms with low credit risks.

JWBT150-Vallabhaneni c07 July 28, 2009 18:33
LEARNING OBJECTIVE 7.4: UNDERSTAND THE VARIOUS TYPES OF DEBT AND EQUITY IN A CAPITAL STRUCTURE 165
(D) AccrualsAccruals are short-term liabilities arising fromwages owed to employees and taxes owed to gov-ernment. These accruals increase automatically as afirm’s operations expand, and hence little control ex-ists over their levels. No explicit interest is paid onfunds raised through accruals.
Use of Security in Short-Term FinancingThe security agreement of the U.S. Uniform Com-mercial Code (UCC) provides guidelines for estab-lishing loan security. Secured loans are expensivedue to recordkeeping costs. Financially weak com-panies are required to put up some type of collateralto protect the lender, while financially strong compa-nies generally are not, even though they are encour-aged to do so. The most commonly used collateralfor short-term credit is accounts receivable and in-ventories as described here:
Collateral for Collateral forShort-Term Loans Long-Term Loans
Examples of collateral usedfor short-term loans includeaccounts receivable,inventories, stocks, andbonds.
Examples of collateral forsecured long-term loansinclude land, building,equipment, stocks, andbonds.
� Accounts receivable financing. Accounts receiv-able (A/R) financing involves either the pledgingof receivables or the selling of receivables (i.e., fac-toring) to obtain a short-term loan. Either com-mercial banks or industrial finance companies areusually involved in pledging and factoring, and alegally binding agent is established between theborrower and the lender.
� Inventory financing. Inventory financing involvesthe use of inventory as a security to obtain ashort-term loan. Three methods exist: (1) inventoryblanket liens, (2) trust receipts, and (3) warehousereceipts.
Long-Term DebtLong-term debt is often called funded debt, a termused to define the replacement of short-term debtwith securities of longer maturity (e.g., stocks andbonds). Many types of long-term debt instrumentsare available including term loans, bonds, securednotes, unsecured notes, marketable debt, and non-marketable debt.
Term LoansA term loan is a contract under which a borroweragrees to make a series of payments (interest andprincipal) at specific times to the lender. Most termloans are amortized, which means they are paid offin equal installments over the life of the loan, rang-ing from 3 to 15 years. Amortization protects thelender against inadequate loan provisions made bythe borrower.
Since the agreement is between the lender and theborrower, documentation requirements are lower,the speed and future flexibility are greater, and thecost is lower compared to a public offering involvedin a stock or bond issue. The interest rate on a termloan can either be fixed or variable, and lenders willbe reluctant to make long-term, fixed-rate loans.
BondsA bond is a long-term contract (seven to ten yearsor more) under which a borrower agrees to makepayments (interest and principal) on specific datesto the holder of the bond. The interest rates paid onbonds can be fixed or variable (floating-rate bonds)and are generally fixed.
Some debts have specific contractual requirementsto meet. The effective cost of the debt is high, andmany restrictions are placed in the debt contracts,which limit a firm’s future flexibility. In order to pro-tect the rights of the bondholders and the issuingfirm, a legal document called indenture is created,and it includes restrictive covenants. A trustee, usu-ally a bank, is assigned to represent the bondholdersand to enforce the terms of the indenture and to en-sure compliance with restrictive covenants.
Most bonds contain a call provision that gives theissuing firm the right to call the bonds before ma-turity for redemption. The bondholder is paid anamount greater than par value (call premium) for thebond when it is called. The call premium is set equalto one year’s interest if the bond is called during thefirst year, and the premium declines at a constantrate of I/N each year thereafter, where I equals an-nual interest and N equals original maturity in years.
Another example of specific debt contract featuresis sinking fund requirements. A sinking fund is aprovision that requires annual payment designed toamortize a bond or preferred stock issue. It retiresa portion of the bond issue each year. It can also beviewed as buying back a certain percentage of theissue each year. Annual payments are a cash drainon the firm, and nonpayment could cause default or

JWBT150-Vallabhaneni c07 July 28, 2009 18:33
166 Learning Module 7: Finance
force the company into bankruptcy. The firm maydeposit money with a trustee who will retire thebonds when they mature.
The sinking fund retirement is handled either bycalling in for redemption (at par) a certain percentageof the bonds each year or by buying the requiredamount of bonds on the open market. A sinking fundcall requires no call premium, whereas a refundingoperation does. A sinking fund requires that a smallpercentage of the issue is callable in any one year.
The refunding operation works as follows: whena firm sold bonds or preferred stock at high interestrates, and if the issue is callable, the firm could sell anew issue at low interest rates. Then the firm couldretire the expensive old issue. This refunding oper-ation reduces interest costs and preferred dividendexpenses.
Relationships between Bond Prices andInterest Rates
� There is an inverse relationship between bondprices and interest rates.
� If interest rates increase, the firm will buy bondsin the open market at a discount.
� If interest rates decrease, the firm will call thebonds.
Examples of various types of long-term bonds aredescribed next.
Mortgage bonds. Under a mortgage bond, the cor-poration pledges certain fixed assets as securityfor the bond. Mortgage bonds can be of twotypes: (1) senior (first) mortgage bonds and (2) ju-nior (second) mortgage bonds. Second mortgagebondholders are paid only after the first mortgagebondholders have been paid off in full. All mort-gage bonds are written subject to an indenture.Details regarding the nature of secured assets arecontained in the mortgage instrument. From theviewpoint of the investor, mortgage bonds pro-vide lower risk, and junk bonds provide greaterrisk.
Bond rating criteria include:� Debt ratio� Times-interest-earned ratio� Current ratio� Fixed charge coverage ratio� Mortgage or other provisions� Sinking fund requirements
Debentures. A debenture is an unsecured bond.Consequently, it provides no lien against specificproperty as security for the obligation. Debentureholders come under “general creditors.” Finan-cially strong companies do not need to put upproperty as security when they issue debentures.Debentures can be subordinate or not. In the eventof liquidation, reorganization, or bankruptcy, sub-ordinate debt has claims on assets only after seniordebt has been paid off. Subordinate debenturesmay be subordinated either to designated notespayable or to all other debt.
Convertible bonds. Convertible bonds are securitiesthat are convertible into shares of common stock,at a fixed price, at the option of the bondholder.Convertible bonds have a lower coupon rate thannonconvertible debt and have a chance for capitalgains.
Warrants. Warrants are options, which permit theholder to buy stock for a stated price, thereby pro-viding a capital gain if the price of the stock rises.Bonds that are issued with warrants, like convert-ible bonds, carry lower coupon rates than straightbonds.
Income bonds. As the name implies, income bondspay interest only when interest is earned. Thesebonds are safer to a company but riskier to aninvestor than “regular” bonds.
Putable bonds. Putable bonds may be turned in andexchanged for cash at the holder’s option. The putoption can be exercised only if the issuer is beingacquired or is increasing its outstanding debt orother specified action.
Treasury bonds. A Treasury bond will have the low-est risk and low opportunity for return to an in-vestor. Compare the Treasury bond to a junk bond,which has the highest risk and high opportunityfor return.
Indexed bonds. Countries faced with high inflationrates issue indexed bonds, also known as purchas-ing power bonds. The interest paid is based onan inflation index (e.g., consumer price index) sothat the interest paid rises automatically when theinflation rate rises. This bond protects the bond-holder against inflation.
Floating-rate bonds. The interest rate on floating-rate bonds fluctuates with shifts in the generallevel of interest rates. The interest rate on thesebonds is adjusted periodically, and it benefits theinvestor and the lender. Corporations also benefitfrom not having to commit themselves to payinga high rate of interest for the entire life of the loan.
JWBT150-Vallabhaneni c07 July 28, 2009 18:33
LEARNING OBJECTIVE 7.4: UNDERSTAND THE VARIOUS TYPES OF DEBT AND EQUITY IN A CAPITAL STRUCTURE 167
Zero coupon bonds. Capital appreciation is the ma-jor attraction in zero coupon bonds rather than in-terest income. Therefore, zero coupon bonds payno interest and are offered at a discount belowtheir par values. Both private and public organi-zations are offering zero coupon bonds to raisemoney. Zero coupon bonds are also called origi-nal issue discount bonds.
Junk bonds. Junk bonds are high-risk, high-yieldbonds issued to finance a leveraged buyout, amerger, or a troubled company. In junk bonddeals, the debt ratio is high, so bondholders shareas much risk as stockholders would. Since inter-est expense on bonds is tax deductible, it increasesafter-tax cash flows of the bond issuer.
The reason for the availability of so many differ-ent types of long-term securities is that differentinvestors have different risk/return trade-off pref-erences. Different securities are issued to accom-modate different tastes of investors and at differ-ent points in time. Short-term U.S. Treasury bills arerisk-free and low-return (which act as a referencepoint), while warrants are high-risk and high-returnsecurities.
Factors Influencing Long-Term FinancingDecisionsLong-term financing decisions require a great deal ofplanning since a firm commits itself for many yearsto come. The long-term nature combined with un-certainty makes long-term financing risky, requiringcareful consideration of all factors involved. Exam-ples of important factors include:
Target capital structure. A firm should compare itsactual capital structure to its target structure andkeep it in balance over a longer period of time. Ex-act matching of capital structure is not economi-cally feasible on a yearly financing basis due to in-creased flotation costs involved. It has been shownthat small fluctuations about the optimal capitalstructure have little effect either on a firm’s cost ofdebt and equity or on its overall cost of capital.
Maturity matching. The maturity-matching conceptproposes matching the maturity of the liabilities(debt) with the maturity of the assets being fi-nanced. This factor has a major influence on thetype of debt securities used.
Interest rate levels. Consideration of both absoluteand relative interest rate levels is crucial in makinglong-term financing decisions. The issuance of a
long-term debt with a call provision is one exam-ple where the interest rate fluctuates. The callabil-ity of a bond permits the firm to refund the issueshould interest rates drop. Companies base theirfinancing decisions on expectations about futureinterest rates.
The firm’s current and forecasted financial con-ditions. The firm’s financial condition, earningsforecasts, status of research and development pro-grams, and introduction of new products all havea major role in what type of long-term security isissued. For example, the following decision rulesapply:� If management forecasts higher earnings, the
firm could use debt now rather than issuingcommon stock. After earnings have risen andpushed up the stock price, the firm should issuecommon stock to restore the capital structure toits target level.
� If a firm is financially weak, but forecasts bet-ter earnings, permanent financing should be de-layed until conditions have improved.
� If a firm is financially strong now but forecastspoor earnings, it should use long-term financingnow rather than waiting.
� Restrictions on the current ratio, debt ratio,times-interest-earned ratio and fixed chargecoverage ratio can also restrict a firm’s ability touse different types of financing at a given time.Also, secured long-term debt will be less costlythan unsecured debt. Firms with large amountsof fixed assets (with a ready resale value) arelikely to use a relatively large amount of debt.
Types of EquityWhen management decides to acquire new assets, ithas the option of financing these assets with eitherequity, debt, or a combination. The following is agood financial management policy:
� Long-term assets should be financed with long-term capital.
� Short-term assets should be financed with short-term capital.
The definition of common equity is the sum ofthe firm’s common stock, additional paid-in capital,preferred stock, and retained earnings. Common eq-uity is the common stockholders’ total investmentin the firm. The sources of long-term capital includecommon stocks, preferred stocks, debt (e.g., loans,bonds, and notes), leases, and option securities.

JWBT150-Vallabhaneni c07 July 28, 2009 18:33
168 Learning Module 7: Finance
Common StockThe common stockholders are the owners of a corpo-ration. Common stock is the amount of stock man-agement has actually issued (sold) at par value. Parvalue is the nominal or face value of a stock andis the minimum amount for which new shares canbe issued. The component “additional paid-in cap-ital” represents the difference between the stock’spar value and what new stockholders paid whenthey bought newly issued shares. Retained earningsare the money that belongs to the stockholders andthat they could have received in the form of divi-dends. Retained earnings are also the money thatwas plowed back into the firm for reinvestment.
Book Value of the Firm = Common Stock+ Paid-in Capital + Retained Earnings= Common Equity
Book Value per Share = Book Value of the Firm÷ Common Shares Outstanding
It should be interesting to note that par value, bookvalue, and market value will never be equal due toconflicting relationships.
Most firms have one type of common stock,whereas others have multiple types of stock calledclassified stock. Usually, newer firms issue classifiedstock to raise funds from outside sources. For exam-ple, Class A stock may be sold to the public with adividend payment and without voting rights. ClassB stock may be kept by the founder of the firm to gaincontrol with full voting rights. A restriction might beplaced on Class B stock not to pay dividends untilthe firm reaches a predesignated retained earningslevel.
Legal Rights of Common Stockholders Since commonstockholders are the owners of a firm, they have thefollowing rights: the right to elect the firm’s direc-tors and the right to remove the management of thefirm if they decide a management team is not effec-tive. Stockholders can transfer their right to vote toa second party by means of an instrument known asa proxy. A proxy fight is a situation where outsidersplan to take control of the business by requesting thestockholders transfer their rights to outsiders in or-der to remove the current management and to bringin a new management team.
Common stockholders have preemptive rights topurchase any additional shares sold by the firm. Pre-emptive rights protect the power of control of current
stockholders and protect stockholders against a di-lution of stock value. Selling common stock at a pricebelow the market value would dilute its price. Thiswould transfer wealth from present stockholders tonew stockholders. Preemptive rights prevent suchtransfer.
Put and Call Options A put option is the right to sellstock at a given price within a certain period. A calloption is the right to purchase stock at a given pricewithin a certain period. Selling a put option couldforce the company to purchase additional stock ifthe option is exercised. The holder of a put optionfor a particular common stock would make a profitif the option is exercised during the option term afterthe stock price has declined below the put price. Awarrant option gives the holder a right to purchasestock from the issuer at a given price.
Preferred StockPreferred stock is issued to raise long-term capitalfor many reasons. When neither common stock norlong-term debt can be issued on reasonable terms,during adverse business conditions, a firm can issuepreferred stock with warrants when the commonstock is depressed. To bolster the equity componentof a firm’s capital structure, a firm can issue con-vertible preferred stock in connection with mergersand acquisitions. A firm can also issue a floating-ratepreferred stock to stabilize the market price.
Preferred stock is the stock whose dividend ratefluctuates with changes in the general level of inter-est rates. Thus stock is good for liquidity portfolios(e.g., marketable securities). It is an effective way toobtain new capital at a low cost due to its floatingdividend rates, stable market price, and tax exemp-tion for dividends received.
Preferred stock is a hybrid stock, meaning that it issimilar to bonds in some respects (e.g., redeemablefeature) and similar to common stock in others (e.g.,convertibility feature and voting rights). Therefore,preferred stock can be classified either as bonds orcommon stock.
Preferred stock is usually reported in the equitysection of the balance sheet under “preferred stock”or “preferred equity.” Accountants and financial an-alysts treat the preferred stock differently. Accoun-tants treat preferred stock as equity, and financialanalysts treat it as equity or debt, depending on whobenefits from the analysis being made.

JWBT150-Vallabhaneni c07 July 28, 2009 18:33
LEARNING OBJECTIVE 7.5: UNDERSTAND THE TECHNIQUES FOR EVALUATING THE COST OF CAPITAL 169
Major Provisions of Preferred Stocks Major provisionsinclude priority to assets and earnings, par value,cumulative dividends, convertibility into commonstock, voting rights, participation in sharing thefirm’s earnings, sinking fund requirements, matu-rity date, and call provisions.
Priorities Preferred stock has an advantage in that ithas a higher-priority claim over assets and earningsthan common stock but a lower priority than debtholders.
Cumulative Dividends All preferred dividends in ar-rears must be paid before common dividends can bepaid. This is a protection feature for preferred stockto receive a preferred position and to avoid pay-ing huge common stock dividends at the expense ofpaying stipulated annual dividends to the preferredstockholders.
Sinking Fund Most newly issued preferred stockshave sinking fund requirements that call for the pur-chase and retirement of a given percentage (e.g., 2 to3%) of the preferred stock each year.
Call Provision A call provision gives the issuing cor-poration the right to call in the preferred stock forredemption. A call premium may be attached wherea company has to pay more than par value when itcalls the preferred stock.
Pros and Cons of Preferred Stock from Issuer and InvestorViewpoints From an issuer’s viewpoint, the advan-tages of financing with preferred stock are: fixed fi-nancial cost, no danger of bankruptcy if earningsare too low to meet fixed charges, and avoidance ofsharing control of the firm with new investors.
From an issuer’s viewpoint, the disadvantage of fi-nancing with preferred stock is a higher after-tax costof capital than debt due to nondeductibility of pre-ferred dividends. The lower a company’s tax bracket,the more likely it is to issue preferred stock.
From an investor’s viewpoint, the advantages offinancing with preferred stock include steadier andmore assured income than common stock, prefer-ence over common stock in the case of liquida-tion, and tax exemption for preferred dividendsreceived.
From an investor’s viewpoint, the disadvantagesof financing with preferred stock are: no legally en-forceable right to dividends, even if a company earns
a profit, and, for individual investors, after-tax bondyields could be higher than those on preferred stock,even though the preferred stock is riskier.
❑ Learning Objective 7.5:UNDERSTAND THE TECHNIQUESFOR EVALUATING THE COST OFCAPITALSimilar to any other resources (e.g., materials, per-sonnel, and machinery), capital has a cost. The rateof return on a security to an investor is the same asthe cost of capital to a firm, which is a required returnon its investments. Any increase in total assets of afirm’s balance sheet must be financed by an increasein one or more capital components (i.e., debt, pre-ferred stock, retained earnings, and common stock).The cost of capital must reflect the average cost ofthe various sources of long-term funds used, that is,one or more of the capital components used.
Cost of DebtThe cost of debt is calculated as Kd (1–T), whereKd is the interest rate on debt and T is the firm’smarginal tax rate. The government pays part of thecost of debt (equal to tax rate) because interest isdeductible for tax purposes. The value of the firm’sstock depends on after-tax cash flows. Here we areinterested in acquiring a new debt (marginal costof debt) to finance a new asset, and past financingis a sunk cost and is irrelevant for cost-of-capitalcalculation purposes.
The key point is to compare the rate of return withafter-tax flows. After-tax cost of debt is less thanbefore-tax cost due to tax savings resulting from aninterest expense deduction that reduces the net costof debt.
Cost of Preferred StockThe cost of preferred stock (Kp) is the preferred div-idend (Dp) divided by the net issuing price (Pn) orthe price the firm receives after deducting flotationcosts. This is Kp = Dp/Pn. Since preferred dividendsare not tax deductible for the issuer, there are no taxsavings, unlike interest expense on debt, which isdeductible.

JWBT150-Vallabhaneni c07 July 28, 2009 18:33
170 Learning Module 7: Finance
Cost of Retained EarningsIf management decides to retain earnings, then thereis an opportunity cost involved: that is, stockhold-ers could have received the earnings as dividendsand invested this money somewhere else. Becauseof this opportunity cost, the firm should earn on itsretained earnings at least as much as the stockhold-ers themselves could earn in alternative investmentsof comparable risk.
Who Requires What?
� The costs of debt are based on the returns in-vestors and creditors require on debt.
� The costs of preferred stock are based on thereturns investors require on preferred stock.
� The costs of retained earnings are based on thereturns stockholders require on equity capital.
When a stock is in equilibrium, its required rate ofreturn (Ks) should be equal to its expected rate ofreturn (Kes):
Ks = Krf = Rp or Kes = (D1/Po) + g
where Krf is the risk-free rate, Rp = risk premium,D1/Po is the stock’s dividend yield, and g is thestock’s expected growth rate.
Three methods are commonly used to calculate thecost of retained earnings: (1) the capital asset pricingmodel (CAPM) approach, (2) the bond-yield-plus-risk-premium approach, and (3) the discounted cashflow (DCF) approach.
CAPM ApproachCAPM provides a basis for determining the in-vestor’s expected rate of return from investing incommon stock. The equation is:
Ks = Krf + (Km − Krf) bi
where Krf is the risk-free rate (e.g., U.S. Treasurybond or bill rate), (Km – Krf ) is equal to the riskpremium, Km is the expected rate of return on themarket or on “average” stock, and bi is the stock’sbeta coefficient (an index of the stock’s risk).
Drawbacks of the CAPM approach include: astockholder may be concerned with total risk ratherthan with market risk only. Beta coefficient may notmeasure the firm’s true investment risk. This ap-proach will understate the correct value of the re-quired rate of return on the stock, Ks, and it is dif-
ficult to obtain correct estimates of the inputs to themodel to make it operational. Examples include: de-ciding whether to use long-term or short-term Trea-sury bonds for risk-free rate, difficulty in estimatingthe beta coefficient that investors expect the firm tohave in the future, and difficulty in estimating themarket risk premium.
Bond-Yield-Plus-Risk-Premium ApproachThis method provides a ballpark estimate of the costof equity, not a precise number, since it uses ad hoc,subjective, and judgmental estimates.
Ks = Bond Rate + Risk Premium
A firm’s cost on common equity is found by addinga risk premium (say 2 to 4%) based on judgment tothe interest rate on the firm’s own long-term debt.
Discounted Cash Flow ApproachThe DCF approach is also called the dividend-yield-plus-growth rate approach, and is calculated as:
Ks = Kes = D1/Po + Expected Growth (g)
Investors expected to receive a dividend yield(D1/Po) plus a capital gain (g) for a total expectedreturn of Kes. At equilibrium, this expected returnwould be equal to the required return (Ks): Ks = Kes.
Cost of Common StockThe cost of common stock (Ke) is higher thanthe cost of retained earnings (Ks) due to flotationcosts involved in selling new common stock. Theequation is
Ke = D1Po(1 − F )
+ g
where D1 is the dividends, Po is the stock price, F isthe percentage flotation cost incurred in selling thenew stock, and Po (1 – F) is the net price per sharereceived by the firm.
The Effects of Cost of Common Stock
� The firm must earn more than the cost of com-mon stock (Ke) due to flotation cost.
� When a firm earns more than Ke, the price of thestock will rise.
� When a firm earns exactly Ke, earnings pershare will not fall, expected dividend can be

JWBT150-Vallabhaneni c07 July 28, 2009 18:33
LEARNING OBJECTIVE 7.6: UNDERSTAND THE PRINCIPLES AND TECHNIQUES OF CAPITAL BUDGETING 171
maintained, and consequently the price pershare will not decline.
� When a firm earns less than Ke, then earnings,dividends, and growth will fall below expecta-tions, causing the price of the stock to decline.
Weighted-Average and Marginal Cost ofCapital ConceptsAn optimal (target) capital structure is a mix of debt,preferred stock, and common stock that maximizesa firm’s stock price. The goal of the finance managershould be to raise new capital in a manner that willkeep the actual capital structure on target over time.The firm’s weighted-average cost of capital (WACC)is calculated based on the target proportions of cap-ital and the cost of the capital components.
WACC = WdKd (1 − T) + WpKp + WsKs
where Wd, Wp, and Ws are the weights used for debt,preferred stock, and common stock, respectively. Tis the marginal tax rate.
The weights could be based on either book valuesor market values and the latter is preferred over theformer. If a firm’s book value weights are close to itsmarket value weight, book weights can be used.
As the firm tries to raise more money, the cost ofeach dollar will at some point rise. The marginal costconcept can be applied here: The marginal cost of anyitem is the cost of another unit of that item, whether theitem is labor or production. The marginal cost of capital(MCC) is the cost of the last dollar of new capital that thefirm raises, and the MCC rises as more and more capital israised during a given period. The MCC schedule showshow the weighted-average cost of capital changes asmore and more new capital is raised during a givenyear.
The breakpoint (BP) is the dollar value of newcapital that can be raised before an increase in thefirm’s weighted-average cost of capital occurs. TheBP is computed as:
BP = Total Amount of Lower-Cost of Capitalof Given Type ÷ Fraction of This Type ofCapital in the Capital Structure
Issues in Cost of CapitalThere are three major issues in the cost of capital:
1. Depreciation-generated funds. Depreciation is asource of capital and its cash flows can be ei-ther reinvested or returned to investors. The cost
of depreciation-generated funds is equal to theweighted-average cost of capital in which capitalcomes from retained earnings and low-cost debt.
2. Privately owned and small business firms. Thesame principles of cost of capital estimation canbe applied to both privately held and publiclyowned firms. Input data are difficult to obtain forprivately owned firms since their stock is not pub-licly traded.
3. Measurement problems. It is difficult to esti-mate the cost of equity, obtain input data for theCAPM approach, estimate stock growth rate, andassign different risk-adjusted discount rates tocapital budgeting projects of differing degrees ofriskiness.
Capital budgeting and cost of capital estimatesdeal with ex ante (estimated) data rather than ex post(historical) data. Because of this, we can be wrongabout the MCC schedule. Consequently, a projectthat formerly looked good could turn out to be abad one. Despite these issues, the cost of capital es-timates used in this section are reasonably accurate.By solving these issues, refinements can be made.
❑ Learning Objective 7.6:UNDERSTAND THE PRINCIPLESAND TECHNIQUES OF CAPITALBUDGETINGCapital budgeting decisions deal with the long-termfuture of a firm’s course of action. Capital budgetingis the process of analyzing investment projects anddeciding whether they should be included in thecapital budget, which in turn outlines the plannedexpenditures on fixed assets such as buildings, plant,machinery, equipment, warehouses, and offices.
Short-term working capital decisions focus on in-creasing current assets. Long-term investment (capi-tal budgeting) decisions focus on increasing noncur-rent (fixed) assets.
A firm needs to develop capital budget plans sev-eral years in advance to synchronize the timing offunds availability with the timing of fixed asset ac-quisitions. Capital budgeting projects are initiatedand selected by company management to be inline with the strategic business plan (e.g., mergersand acquisitions and introduction of new products).Generally, the larger the required investment, themore detailed the analysis, and the higher the levelof management approval required to authorize theexpenditure.

JWBT150-Vallabhaneni c07 July 28, 2009 18:33
172 Learning Module 7: Finance
The process of capital budgeting is similar to se-curities valuation (i.e., stocks and bonds) in that thevalue of the firm increases when the asset’s presentvalue exceeds its cost. A link between capital budget-ing and stock values exists in that the more effectivethe firm’s capital budgeting procedures, the higherthe price of its stock. From an economics point ofview, an optimal capital budget is determined bythe point where the marginal cost of capital is equalto the marginal rate of return on investment.
There are two types of errors in capital budget-ing project decisions that must be avoided. Theseinclude:
Accept or Reject Error in Capital BudgetingProject Decisions
1. An accept-error, meaning a project is acceptedwhen it should not
2. A reject-error, meaning a project is rejectedwhen it should not
Methods to Rank Investment ProjectsTen methods are used to rank investment projectsand to decide whether projects should be acceptedfor inclusion in the capital budget. They are (1) pay-back method (regular and discounted), (2) account-ing rate of return method, (3) net present valuemethod, (4) benefit–cost ratio or profitability in-dex method, (5) savings investment ratio method,(6) benefit investment ratio method, (7) regular in-ternal rate of return method, (8) modified internalrate of return method, (9) cost–benefit analysis, and(10) cost-effectiveness analysis.
1. Payback MethodTwo methods exist: regular and discounted. Theregular payback period is net investment dividedby average annual after-tax operating cash inflows.It is the expected number of years required to re-cover the original investment in a capital budget-ing project. The procedure calls for accumulating theproject’s net cash flows until the cumulative total be-comes positive. The shorter the payback period, thegreater the acceptance of the project and the greaterthe project’s liquidity. Risk can be minimized by se-lecting the investment alternative with the shortestpayback period. Initial investment money can be re-couped quickly.
Regular Payback Period = Net Investment/Average Annual After-Tax OperatingCash Inflows
A variation of the regular payback method is thediscounted payback period, where the expectedcash flows are discounted by the project’s cost ofcapital or the required rate of return for the project.A comparison between regular payback and dis-counted payback is as follows:
� A regular payback period is the number of years re-quired to recover the investment from the project’snet cash flows. It does not take account of the costof capital. The cost of debt and equity used to fi-nance the project is not reflected in the cash flows.It assumes constant annual operating cash inflows.
� A discounted payback period is the number ofyears required to recover the investment from dis-counted cash flows. It does take into account thecost of capital. It shows the breakeven years aftercovering debt and equity costs.
� Both methods are deficient in that they do not con-sider the time value of money.
� Both methods ignore cash flows after the paybackperiod.
� Neither method measures full profitability of aproject.
It is possible for the regular payback and the dis-counted payback methods to produce conflictingranking of projects. The payback method is oftenused as a rough measure of both the liquidity andthe riskiness of a project since longer-term cash flowsare riskier than near-term cash flows. This methodis used as a screening device to weed out projectswith high and marginal payback periods. A shorterpayback period is preferred. The payback methodcan be used to reduce the uncertainty surrounding acapital budgeting decision and is often used in con-junction with net present value and internal rate ofreturn methods.
2. Accounting Rate of Return MethodThe accounting rate of return (ARR) method isbased on accounting data and is computed as the av-erage annual profits after taxes divided by the initialcash outlay in the project. This ARR is then comparedto the required rate of return to determine whethera particular project should be accepted or rejected.Strengths of the ARR method include that it is sim-ple and that accounting data are readily available.Drawbacks of the ARR method include that it doesnot consider the project’s cash flows, it measures theaverage rate of return over the asset’s entire life, andit ignores the time value of money. The formula for

JWBT150-Vallabhaneni c07 July 28, 2009 18:33
LEARNING OBJECTIVE 7.6: UNDERSTAND THE PRINCIPLES AND TECHNIQUES OF CAPITAL BUDGETING 173
this method is:
ARR = Average Annual Profit After Taxes/InitialCash Outlay
3. Net Present Value MethodA simple method to accommodate the uncertaintyinherent in estimating future cash flows is to ad-just the minimum desired rate of return. Discountedcash flow (DCF) techniques, which consider the timevalue of money, were developed to compensate forthe weakness of the payback method. Two examplesof DCF techniques include (1) the net present value(NPV) method and (2) the internal rate of return(IRR) method.
NPV is equal to the present value of future netcash flows, discounted at the marginal cost of capital.The approach calls for finding the present value ofcash inflows and cash outflows, discounted at theproject’s cost of capital, and adding these discountedcash flows to give the project’s NPV. The rationalefor the NPV method is that the value of a firm is thesum of the values of its parts.
NPV = (After-Tax Cash Flows)× (Present Value of Annuity) − (Initial Investment)
or
NPV = Present Value of Benefits− Present Value of Costs
NPV decision rules include the following:
� If the NPV is positive, the project should be ac-cepted since the wealth of current stockholderswould increase.
� If the NPV is negative, the project should be re-jected since the wealth of current stockholderswould reduce.
� If the NPV is zero, the project should be acceptedeven though the wealth of current stockholders isunchanged (the firm’s investment base increasesbut the value of its stock remains constant).
� If two projects are mutually exclusive, the one withthe higher positive NPV should be chosen.
� If two projects are independent, there is no conflictin selection. Capital rationing is the only limitingfactor.
� If money is available, invest in all projects in whichthe NPV is greater than zero.
� If a project’s return exceeds the company’s cost ofcapital, select the combination of projects that willfully utilize the budget and maximize the sum ofthe net present values.
4. Benefit–Cost Ratio or Profitability Index (PI)MethodA variation of the NPV approach is the benefit–costratio (BCR) or benefit–cost index. The BCR is thepresent value of benefits (i.e., cash inflows) dividedby the present value of the cost (i.e., cash outflows).
BCR = PV of BenefitsPV of Costs
The BCR is a relative measure of an alternative’svalue. It provides a measure of the benefits obtainedper dollar spent. The higher the BCR, the larger thereturn. NPV, on the other hand, is an absolute mea-sure. In situations where funds are limited, the BCRprovides decision-makers with an additional pieceof information. In selecting among alternatives, theBCR shows which alternatives provide the largestreturn relative to costs. As with the use of NPV, non-quantifiable benefits may show that an alternativewith a lower BCR may be the most advantageousalternative to the company.
Other names given to the BCR include NPV index,profitability index (PI), or present value (PV) index,which is computed as the present value of after-taxcash inflows divided by present value of the initialinvestment (cash outflows). When the profitabilityindex or benefit–cost ratio is 1.0, the NPV is zero.The goal is to require that the profitability indexor benefit–cost ratio be more than 1.0 so that NPVwill be higher than zero. The PI method is used torank competing projects in the order of their attrac-tiveness when they have different dollar amounts tocompare.
As long as the PI is 1.0 or greater, the project isacceptable. For any given project, the NPV methodand the PI method give the same accept/reject an-swer. When choosing between mutually exclusiveprojects, the NPV method is preferred because theproject’s benefits are expressed in absolute terms. Incontrast, the PI method expresses in relative terms.The formula for the PI method is:
PI = PV of Cash Inflows/PV of Cash Outflows
What Is an Equivalent Uniform Annual Cost?
When the economic lives of alternative invest-ments differ and are shorter than the minimumrequirement time period, equivalent uniform an-nual cost (EUAC) allows the alternatives to be

JWBT150-Vallabhaneni c07 July 28, 2009 18:33
174 Learning Module 7: Finance
compared on a common basis of time. Assumingthat alternatives are equal in their ability to fulfillstated objectives, this approach avoids the distor-tion that would otherwise occur. The EUAC isnot appropriate if factors such as technology areinvolved, the alternatives are not equal in theirability to meet requirements, or the requirementwill cease prior to the economic life of one of thealternatives.
EUAC converts each option into an equivalenthypothetical alternative with uniform recurringcosts. For example, the yearly costs of system Aexceed those of system B, but it functions with-out major replacements for five years as opposedto system B’s three-year economic life. It can bereasonably assumed that the cash flow patternsof each can be repeated; the costs of both alterna-tives can be extended to a common denominatorpoint of 15 years. The NPV of an alternative iscalculated and then divided by the sum of thediscount factors for its economic life to yield theEUAC.
5. Savings Investment Ratio MethodCalculating a savings investment ratio (SIR) allowsorganizations to compare the profit (savings) poten-tial of alternatives and helps to answer the question:Do the recurring savings of the proposed invest-ment, compared to the status quo, justify the costs?The ratio is derived by computing the present value(PV) of the savings produced by the investment rel-ative to the costs of the status quo in each year ofthe analysis. The discounted savings are totaled anddivided by the PV of the investment costs. If costsextend over more than one year, these too shouldbe discounted and summed. The resulting ratio in-dicates the savings resulting from an alternative tothe status quo proportionate to the investment re-quired to implement the alternative. An SIR of 1.0 orgreater indicates that the NPV of the savings attainedby the new investment are equal to or greater thanthe NPV of the costs incurred to implement the newinvestment. SIRs can be used to compare multipleinvestment opportunities, but scale (total costs andsavings) must then be considered. When computingSIRs, total annual maintenance and operations costsare not discounted, only the difference between theannual costs of the two alternatives. The formula forSIR is:
SIR = PV of Savings/PV of Costs
6. Benefit Investment Ratio MethodComparing the benefit investment ratios (BIRs) ofinvestments may be helpful in situations where thefinancial analysis scores of alternatives rank closelyand an additional viewpoint is desired. Dividing theNPV of benefits by the NPV of costs derives the BIR.The NPV method and the BIR method will alwaysindicate the same accept/reject decision for inde-pendent projects but can reflect different rankings ofalternatives. The formula for this ratio is:
BIR = NPV of Benefits/NPV of Costs
7. Regular Internal Rate of Return (IRR) MethodIn the regular IRR method, the discount rate thatequates the present value of future cash inflows tothe investment’s cost is found. In other words, theIRR method is defined as the discount rate at whicha project’s NPV equals zero.
IRR = PV of Cash Inflows = PV of Cash Outflows
Similarities between the NPV and IRR methodsinclude the following:
� Both NPV and IRR methods consider the timevalue of money.
� Both methods use the same basic mathematicalequation for solving the project’s problems.
Differences between NPV and IRR methods in-clude the following:
� In the NPV method, the discount rate is specified,and the NPV is found.
� In the IRR method, the NPV is specified to equalzero, and the value of IRR that forces this equalityis determined.
� The NPV method assumes reinvestment of projectcash flows at the cost of capital.
� The IRR method assumes reinvestment of projectcash flows at the internal rate of return.
When a project’s IRR is greater than its marginalcost of capital, it increases the value of the firm’sstock since a surplus remains after paying for thecapital. Similarly, when a project’s IRR is less thanits marginal cost of capital, it decreases the value ofthe firm’s stock since the project reduces the profitsof the existing stockholders.
Two kinds of projects exist: (1) normal and (2)nonnormal. A normal project is one that has oneor more cash outflows followed by a series ofcash inflows. No difficulties are encountered when

JWBT150-Vallabhaneni c07 July 28, 2009 18:33
LEARNING OBJECTIVE 7.6: UNDERSTAND THE PRINCIPLES AND TECHNIQUES OF CAPITAL BUDGETING 175
evaluated by the IRR method. However, a nonnor-mal project (i.e., a project that calls for a large cashoutflow either sometime during or at the end of itslife) can give unique difficulties when evaluated bythe IRR method.
The payback method, NPV method, and IRRmethod all show an investment breakeven point forthe project in an accounting sense, which wouldbe useful in evaluating capital projects. The IRRmethod, NPV method, and NPV index consider riskonly indirectly through the selection of a discountrate used in the present value computations.
Which Method Is Best: Payback, NPV, or IRR? Anycapital budgeting method should meet the follow-ing three criteria in order to produce consistent andcorrect investment decisions:
1. The method must consider all cash flows through-out the entire life of a project. The payback methoddoes not meet this property while the NPV andIRR methods do.
2. The method must consider the time value ofmoney. A dollar received today is more valuablethan a dollar received tomorrow. The paybackmethod does not meet this property while the IRRand NPV methods do.
3. The method must choose the project that maxi-mizes the firm’s stock price when faced with se-lecting from a set of mutually exclusive projects.The payback method and the IRR methods do notmeet this property while the NPV method meetsthis property all the time.
The NPV method is better for evaluating mutuallyexclusive projects. However, when two projects areindependent, both the NPV and the IRR criteria al-ways lead to the same accept/reject decision.
The critical issue in resolving the NPV/IRR con-flicts between mutually exclusive projects is the dif-ferent reinvestment rate assumptions made. Thereinvestment rate is the opportunity cost rate atwhich a firm can invest differential early year’s cashflows generated from NPV or IRR methods.
The following are assumptions in NPV and IRRmethods:
� NPV assumptions. The cash flows generated by aproject can be reinvested at the cost of capital. TheNPV method discounts cash flows at the cost ofcapital.
� IRR assumptions. The cash flows generated by aproject can be reinvested at the IRR. The IRRmethod discounts cash flows at the project’s IRR.
It has been demonstrated that the best assumptionis that projects’ cash flows are reinvested at the costof capital. Therefore, the NPV method is better.
8. Modified Internal Rate of Return(MIRR) MethodAcademics prefer the NPV method, whereas busi-ness executives favor the IRR method. The reasonbusiness executives prefer the IRR method is thatthey find IRR “more natural” to analyze investmentsin terms of percentage rates of return rather than dol-lars of NPV.
The regular IRR method can be modified to makeit a better indicator of relative profitability and hencebetter for use in capital budgeting. The MIRR is thediscount rate at which the present value of a project’scost is equal to the present value of its terminal value.The terminal value is the sum of the future valuesof the cash inflows, compounded at the firm’s costof capital. In other words, the MIRR is the discountrate that forces the present value of the costs to equalthe present value of the terminal value.
The MIRR method is better than the regular IRRmethod because MIRR assumes that cash flows fromall projects are reinvested at the firm’s cost of capital,whereas the regular IRR method assumes that thecash flows from each project are reinvested at theproject’s own IRR. Therefore, the MIRR method is abetter indicator of a project’s true profitability.
9. Cost–Benefit AnalysisCost–benefit analysis (CBA) or benefit–cost anal-ysis (BCA) is used for many purposes, such as aplanning tool, a decision-making criterion, and ameans to evaluate investments. CBA has four ma-jor elements that should be factored in for consid-eration: (1) total business and system costs withthe IT investment in a new system, (2) total busi-ness costs without the IT investment in a newsystem, (3) tangible benefits, and (4) intangiblebenefits.
There are many advantages to performing a CBAthat reach far beyond its ability to facilitate ulti-mate decision-making processes. A comprehensiveCBA will include a documented path that clearly re-veals the rationale behind a decision. When a CBAis performed correctly, all assumptions, theories,

JWBT150-Vallabhaneni c07 July 28, 2009 18:33
176 Learning Module 7: Finance
methods, and procedures are labeled and can be eas-ily extracted from the decision or traced to the deci-sion itself. This allows for the modification or clarifi-cation of any of the individual elements throughoutthe life of the project.
The CBA itself is structured as a systematic andorganized collection of facts underlying a decisionbeing made about a particular set of alternatives.It ensures that there is standardization and ob-jectivity in the decision-making process. The CBAis a particularly accommodating tool when eval-uating seemingly noncomparable alternatives orsolutions.
10. Cost-Effectiveness AnalysisCost-effectiveness analysis (CEA) is appropriate tothe public sector or wherever it is unnecessary or im-practical to consider the dollar value of the benefitsprovided by the alternatives under consideration. Aproject or program is cost effective if, on the basisof lifecycle cost analysis of competing alternatives, itis determined to have the lowest costs expressed inpresent value terms for a given amount of benefits.CEA is appropriate whenever (1) each alternativehas the same annual benefits expressed in monetaryterms or (2) each alternative has the same annual ef-fects, but dollar values cannot be assigned to theirbenefits.
CEA does not imply choosing the policy with thesmallest dollar price tag. CEA chooses the policythat achieves the policy goal with the smallest lossin social wellbeing. The smallest welfare loss mightnot be associated with the smallest dollar cost.
A CEA is basically a CBA without the benefits. Itentails estimating all lifecycle costs and discountingthe annual costs by the appropriate rate to yield theNPV of each alternative. Like the CBA, it should in-clude the rationale for all assumptions and expectedkey results that can be monitored.
CEA is also useful for comparing alternatives withidentical costs but different benefits, although thissituation may also require assignment of weighingfactors. An example might be the replacement oflegacy systems where the alternatives all meet theprimary requirements of providing specific func-tions, but each have different secondary benefits thatcannot be separated from the basic product or ser-vice. Where all benefits cannot be expressed in dol-lars, a full listing of such benefits, along with anyunits of measurement that can be ascertained, shouldaccompany the CEA.
Postaudit of Capital ProjectsA postaudit is a comparison of the actual and ex-pected results (both costs and savings) for a givencapital project and explanation of variances, if any.A postaudit is a good learning exercise and is prac-ticed by most successful organizations. The lessonslearned from the postaudit can be used to fine-tuneforecasts of costs and benefits and to improve busi-ness operations.
The postaudit is a complicated process to reviewsince factors such as demand uncertainty and un-expected deviations from plans occur, which are be-yond the control of most managers in the firm. Actualsavings may not materialize as expected due to un-expected costs. Despite these problems, it is a goodapproach to conduct a postaudit of capital projectsas long as the blame is on the process, not on thepeople involved.
Project Cash FlowsIt is important to note that capital budgeting de-cisions must be based on annual cash flows, notaccounting income, and that only incremental cashflows are relevant to the accept/reject decision. Cashflows and accounting income can be different due todepreciation expense, which is a noncash expense.Since we are interested in net cash flows, it is ob-tained by adding depreciation expense to the netincome after taxes.
Incremental cash flows represent the changes inthe firm’s total cash flows that occur as a direct resultof accepting or rejecting the project. It is the net cashflow that can be traceable to an investment project.
Four special problems occur in determining incre-mental cash flows:
1. Sunk costs are not incremental costs, and theyshould not be included in the project analysis. Asunk cost is an outlay that has already been com-mitted or has already occurred and hence is notaffected by the accept/reject decision under con-sideration. Only incremental cash flows should becompared with the incremental investment.
2. Opportunity costs are the cash flows that can begenerated from assets the firm already owns pro-vided they are not used for the project in ques-tion. It is the return on the best alternative useof an asset that is forgone due to funds investedin a particular project. Opportunity costs are notincremental costs.

JWBT150-Vallabhaneni c07 July 28, 2009 18:33
LEARNING OBJECTIVE 7.6: UNDERSTAND THE PRINCIPLES AND TECHNIQUES OF CAPITAL BUDGETING 177
3. Externalities are the indirect effects of a projecton cash flows in other parts of the firm. Revenuesproduced from the effects of externalities shouldnot be treated as incremental income.
4. Shipping and installation costs incurred on anew fixed asset (e.g., equipment) should be addedto the invoice price of the fixed asset. The depreci-ation base for calculating the depreciation expenseis the total invoice price including shipping andinstallation costs. Therefore, shipping and instal-lation costs should not be treated as incrementalcash flows since they would be double-counted.
Project Risk AssessmentRisk analysis is important to capital budgeting de-cisions. Three separate and distinct types of projectrisk are: (1) the project’s own standalone risk, (2) cor-porate risk (within-firm risk), and (3) market risk(beta risk).
1. A project’s standalone risk is measured by thevariability of the project’s expected returns.
2. A project’s corporate risk is measured by theproject’s impact on the firm’s earnings variability.It does not consider the effects of stockholders’diversification.
3. A project’s market (beta) risk is measured by theproject’s effect on the firm’s beta coefficient.
Market risk cannot be eliminated by diversifica-tion. If the project has highly uncertain returns andif those are highly correlated with those of the firm’sother assets and also with most other assets in theeconomy, the project will have a high degree of alltypes of risk. A company whose beta value has de-creased due to a change in its marketing strategywould apply a lower discount rate to expected cashflows of potential projects.
Market risk is important because of its direct ef-fect on a firm’s stock prices. It has been found thatboth market risk and capital risk affect stock prices.Corporate risk for weak firms increases significantlycompared to strong firms. This is because weak firmswould have difficulty in borrowing money at rea-sonable interest rates, which in turn would decreaseprofits. The decrease in profits would be reflected inthe stock price.
Risk to a company is affected by both project vari-ability and how project returns correlate with thoseof the company’s prevailing business. Overall com-pany risk will be lowest when a project’s returnsexhibit low variability and negative correlation.
Techniques for MeasuringStandalone RiskHere we are interested in determining the uncer-tainty inherent in the project’s cash flows. Three tech-niques are available for assessing a project’s stan-dalone risk: sensitivity analysis, scenario analysis,and Monte Carlo simulation.
1. Sensitivity analysis can provide useful insightsinto the riskiness of a project. It is a technique thatindicates exactly how much the NPV will changein response to a given change in an input variable,other things held constant. For example, if each in-put variable can be changed by several percentagepoints above and below the expected value, thena new NPV can be calculated for each of those val-ues. Finally, the set of NPVs can be plotted againstthe variable that was changed. The slope of thelines in the graphs shows how sensitive NPV isto changes in each of the inputs; the steeper theslope, the more sensitive the NPV is to a changein the variable.
2. Scenario analysis is a risk analysis technique thatconsiders both the sensitivity of NPV to changesin key variables and the range of likely variablevalues. NPV under bad conditions (i.e., low sales,high variable cost per unit) and good conditions(i.e., high sales and low variable cost per unit)are calculated and compared to the expected (i.e.,base case) NPV. The following are the highlightsof these relationships:
Bad Condition → Worst-Case Scenario →(all input variables are set at their worstforecasted values)
Good Condition → Best-Case Scenario →(all input variables are set at their bestforecasted values)
Base Case Condition → Most Likely Scenario →(all input variables are set at their most likelyvalues)
The results of the scenario analysis are used todetermine the expected NPV, the standard devia-tion of NPV, and the coefficient of variation. Eventhough scenario analysis provides useful infor-mation about a project’s standalone risk, it is lim-ited in that it considers only a few discrete NPVoutcomes for the project. In reality, there are aninfinite number of outcomes.
3. Monte Carlo simulation ties together sensitivi-ties and input variable probability distributions.Probability distributions of each uncertain cash

JWBT150-Vallabhaneni c07 July 28, 2009 18:33
178 Learning Module 7: Finance
flow variable are specified. The computer choosesat random a value for each uncertain variablebased on the variable’s specified probabilitydistributions. The model then determines the netcash flows for each year, which in turn are usedto determine the project’s NPV in the first run.Since this is a simulation technique, this modelis repeated many times to yield a probabilitydistribution.
The primary advantage of simulation is that itshows a range of possible outcomes along with theirattached probabilities. The scenario analysis showsonly a few point estimates of the NPV. Both the stan-dard deviation of the NPV and the coefficient of vari-ation are calculated, providing additional informa-tion in assessing the riskiness of a project.
It is difficult to obtain valid estimates of probabilitydistributions and correlations among the variables.From both scenario analysis and simulation analysis,no clear-cut decision rule emerges. Both techniquesignore the effects of the project as well as the investordiversification—which is the major drawback.
Techniques for MeasuringMarket/Beta RiskBeta risk is that part of a project’s risk that can-not be eliminated by diversification. It is measuredby the project’s beta coefficient. Two methods areavailable to estimate the betas of individual projects:(1) the pure play method and (2) the accounting betamethod.
In the pure play method, the company tries to findseveral single-product firms in the same line of busi-ness as the project being evaluated, and it then ap-plies these betas to determine the cost of capital forits own project. A major drawback of the pure playmethod is that the approach can be applied only formajor assets such as whole divisions, not for indi-vidual projects. Therefore, it is difficult to find com-parable business firms of the size in question.
The accounting beta method fills the gap of thepure play method in finding single-product, publiclytraded firms by applying against a large sample offirms. The project’s beta is determined by regressingthe returns of a particular company’s stock againstreturns on a stock market index. Betas determined byusing accounting data rather than stock market dataare called accounting betas. In practice, accountingbetas are normally calculated for divisions or otherlarge units, not for single assets, and divisional betasare then imputed to the asset.
Project Risks and Capital BudgetingCapital budgeting can affect a firm’s market risk,its corporate risk, or both. It is difficult to developa good measure of project risk due to difficulty inquantifying either risk.
Two methods for incorporating project risk into thecapital budgeting decision process include (1) thecertainty equivalent approach and (2) the risk-adjusted discount rate approach.
Under the certainty equivalent approach, the ex-pected cash flows are adjusted to reflect projectrisk. All unknown cash flows will have low cer-tainty equivalent values. This approach is diffi-cult to implement in practice despite its theoreticalappeal.
Under the risk-adjusted discount rate approach,differential project risk is dealt with by changing thediscount rate. Risk adjustments are subjective andtake the following decision paths:
� Average-risk projects are discounted at the firm’saverage cost of capital.
� Above-average-risk projects are discounted at ahigher cost of capital.
� Below-average-risk projects are discounted at arate below the firm’s average.
Capital RationingThe amount of funds available to a firm is limitedeven though acceptable capital budget projects aremany. A firm will approve an independent projectif its NPV is positive. It selects the project with thehighest NPV when faced with mutually exclusiveprojects. Management cannot or would not want toraise whatever funds are required to finance all of theacceptable projects. When the capital budget must belimited, this situation is called capital rationing.
Capital rationing is a constraint placed on the totalsize of the firm’s capital investment. A drawback ofcapital rationing is that it is not maximizing a firm’sstock value since it deliberately forgoes profitableprojects. Because of this negative effect, only a fewfirms ration their capital.
International Capital BudgetingThe techniques presented in this section for domesticcapital budgeting are equally applicable to the inter-national capital budgeting process. However, threetypes of risks exist in the international area: (1) cashflow risk, that is, cash flow estimation is much moredifficult, (2) exchange rate risk, that is, exchange rate

JWBT150-Vallabhaneni c07 July 28, 2009 18:33
LEARNING OBJECTIVE 7.7: UNDERSTAND THE VARIOUS TYPES AND RISKS OF FINANCIAL INSTRUMENTS 179
fluctuations add to the riskiness of the foreign invest-ment, and (3) sovereignty risk, that is, the possibilityof deliberate foreign government acts that reduce oreliminate cash flows.
In terms of cash flows, the relevant cash flows arethe dollar cash flows that the subsidiary can turnover to the parent. Since the foreign currency cashflows turned over to the parent must be convertedto U.S. dollar values by translating them at expectedfuture exchange rates, an exchange rate premiumshould be added to the domestic cost of capital.This is done to reflect the exchange rate risk inher-ent in the investment. Hedging can minimize theexchange rate risk, which adds to the cost of theproject.
Sovereignty risk includes the possibility of expro-priation or nationalization without adequate com-pensation and the possibility of unanticipated re-strictions of cash flows to the parent company, suchas tighter controls on repatriation of dividends orhigher taxes. Generally, sovereignty risk premiumsare not added to the cost of capital to adjust forsovereignty risk. Companies can take steps to re-duce the potential loss from expropriation in threemajor ways: (1) by financing the subsidiary with lo-cal sources of capital, (2) by structuring operationsso that the subsidiary has value only as a part of theintegrated corporate system, and (3) by obtaininginsurance against economic losses from expropria-tions. When the insurance is taken, its cost should beadded to the project’s cost.
❑ Learning Objective 7.7:UNDERSTAND THE VARIOUSTYPES AND RISKS OF FINANCIALINSTRUMENTSFinancial instruments (currency and credit deriva-tives) are used by large and small businesses in everyindustry to hedge against financial risk.
One means to hedge currency exposure and riskis through the currency market, which includes for-ward contracts, futures contracts, currency options,and currency swaps.
Forward ContractsIn the forward exchange market, one buys a forwardcontract for the exchange of one currency for anotherat a specific future date and at a specific exchangeratio. This differs from the spot market, where cur-
rencies are traded for immediate delivery. A forwardcontract provides assurance of being able to convertinto a desired currency at a price set in advance.A foreign currency sells at a forward discount if itsforward price is less than its spot price. If the for-ward price exceeds the spot price, it is said to sellat a forward premium. Forward contracts providea “two-sided” hedge against currency movements.Forward contracts are settled only at expiration, andthey can be issued in any size.
Futures ContractsA futures contract is a standardized agreement thatcalls for delivery of a currency at some specified fu-ture date. These contracts are formed with the clear-inghouse, not directly between the two parties. Fu-tures contracts provide a “two-sided” hedge againstcurrency movements.
Each day, the futures contract is marked-to-market,meaning it is valued at the closing price. Price move-ments affect the buyer and seller in opposite ways.Every day there is a winner and a loser, depend-ing on the direction of price movement. The losermust come up with more margin (a small deposit),while the winner can draw off excess margin. Futurecontracts come only in multiples of standard-sizecontracts.
Currency OptionsAn option is a contract that gives its holder the rightto buy or sell an asset at some predetermined pricewithin a specified period of time. Pure options (fi-nancial options) are created by outsiders (invest-ment banking firms) rather than by the firm itself;they are bought and sold by investors or speculators.The leverage involved makes it possible for specu-lators to make more money with just a few dollars.Also, investors with sizable portfolios can sell op-tions against their stocks and earn the value of theoptions (minus brokerage commissions) even if thestocks’ prices remain constant. Option contracts en-able the hedging of “one-sided” risk. Only adversecurrency movements are hedged, either with a calloption to buy the foreign currency or with a put op-tion to sell it.
Both the value of the underlying stock and thestriking price of the option are very important indetermining whether an option is in-the-money orout-of-the-money. If an option has value on its ex-piration date, it is considered to be in-the-money;

JWBT150-Vallabhaneni c07 July 28, 2009 18:33
180 Learning Module 7: Finance
otherwise, it is worthless and considered out-of-the-money. Therefore, the stock price and the strikingprice are important for determining the market valueof an option. In fact, options are called derivative se-curities because their values are dependent on, orderived from, the value of the underlying asset andthe striking price. In addition to the stock’s marketprice and the striking price, the value of an optionalso depends on the option’s time to maturity, thelevel of strike price, the risk-free rate, and the vari-ability of the underlying stock’s price. The higherthe strike price, the lower the call option price. Thehigher the stock’s market price in relation to thestrike price, the higher will be the call option price.The longer the option period, the higher the optionprice and the larger its premium. The exercise valueof an option is the maximum of current price of thestock minus the strike price. The price of an option isthe cost of stock minus the present value of the port-folio. The Black-Scholes model is used to estimatethe value of a call option.
Warrants are options issued by a company thatgive the holder the right to buy a stated number ofshares of the company’s stock at a specified price.Warrants are distributed along with debt, and theyare used to induce investors (as a sweetener) to buya firm’s long-term debt at a lower interest rate thanotherwise would be required.
Real options are used for investment in real assetsand their value is determined as:
Project Discounted Cash Flow Value =(Cash Flows)/(1 + Risk-Free Cash Flow)
Currency SwapsA swap exchanges a floating-rate obligation for afixed-rate one or vice versa. There are two typesof swaps: currency swaps and interest-rate swaps.With the currency swaps, two parties exchange in-terest obligations on debt denominated in differentcurrencies. At maturity the principal amounts areexchanged, usually at an exchange rate agreed uponin advance. With an interest-rate swap, interest-payment obligations are exchanged between twoparties, but they are denominated in the same cur-rency. There is not an actual exchange of principal.If one party defaults, there is no loss of principal perse. However, there is the opportunity cost associatedwith currency movements after the swap’s initiation.These movements affect both interest and principalpayments. In this respect, currency swaps are more
risky than interest-rate swaps, where the exposure isonly to interest. Currency swaps are combined withinterest-rate swaps; there is an exchange of fixed-ratefor floating-rate payments where the two paymentsare in different currencies. Financing hedges providea means to hedge on a longer-term basis, as do cur-rency swaps.
The swap can be longer term in nature (15 yearsor more) than either the forward or futures contract(5 years). Swaps are like a series of forward con-tracts corresponding to the future settlement datesat which difference checks are paid. However, a com-parable forward market does not exist nor do lengthyfutures or options contracts.
The most common swap is the floating/fixed-rateexchange. The exchange itself is on a net settlementbasis. That is, the party that owes more interest thanit receives in the swap pays the difference. A basisswap is another popular swap where two floating-rate obligations are exchanged.
Various options exist for swap transactions, whichare known as swaptions. One is to enter a swap at afuture date. The terms of the swap are set at the timeof the option, and they give the holder the right, butnot the obligation, to take a swap position.
The scope of credit derivatives includes total re-turn swaps and credit swaps:
� Total return swaps. Credit derivatives unbundledefault risk from the other features of a loan. Theoriginal lender no longer needs to bear the risk; itcan be transferred to others for a price. The partywho wishes to transfer is known as the protectionbuyer. The protection seller assumes the credit riskand receives a premium for providing this insur-ance. The premium is based on the probability andlikely severity of default.
The protection buyer is assumed to hold a riskydebt instrument and agrees to pay out its total re-turn to the protection seller. This return consistsof the stream of interest payments together withthe change in the instrument’s market value. Theprotection seller agrees to pay some reference rateand perhaps a negative or positive spread fromthis rate.
� Credit swaps. A credit swap, also known as a de-fault swap, is similar in concept to the total-returnswap, but different in the details. The protectionbuyer pays a specific premium to the protectionseller, insurance against a risky debt instrumentdeteriorating in quality. The annuity premium ispaid each period until the earlier of the maturity
JWBT150-Vallabhaneni c07 July 28, 2009 18:33
LEARNING OBJECTIVE 7.7: UNDERSTAND THE VARIOUS TYPES AND RISKS OF FINANCIAL INSTRUMENTS 181
of the credit swap agreement or a specific creditevent occurring, usually default. If the credit eventoccurs, the protection seller pays the protectionbuyer a contingent amount. This often takes theform of physical settlement, where the protectionbuyer puts the defaulted obligation to the protec-tion seller at its face value. The economic cash flowis the difference between the face value of the in-strument and its market value. Thus, the protec-tion buyer receives payment only when a specificcredit event occurs; otherwise the cash flow fromthe protection seller is zero. The periodic premiumpaid is called the credit swap spread. This cost ofprotection depends on the credit rating of the com-pany, risk mitigation, and likely recovery shoulddefault occur.
Other credit derivatives include spread-adjustednotes, credit options, and credit-sensitive notes:
� Spread-adjusted notes involve resets based on thespread of a particular grade of security over Trea-sury securities. An index is specified, and quarterlyand semiannual resets occur, where one counter-party must pay the other depending on whetherthe quality yield spread widens or narrows. Usu-ally the spread is collared with a floor and cap.
� Credit options involve puts and calls based ona basket of corporate fixed-income securities. Thestrike price often is a specified amount over Trea-sury securities.
� With credit-sensitive notes, the coupon ratechanges with the credit rating of the companyinvolved. If the company is downgraded, the in-vestor receives more interest income; if upgraded,there is less interest income.
Hidden Financial Reporting RiskOff-balance-sheet accounting practices includehiding debt with the equity method, hiding debtwith lease accounting, hiding debt with pension ac-counting, and hiding debt with special-purpose en-tities. In all these cases, debt is underreported, whichcreates a financial reporting risk. Investors and cred-itors charge a premium for financial reporting risk.Consequently, the cost of capital goes up, and stockprices and bond prices go down.
The equity method hides liabilities because it netsthe assets and liabilities of the investee. Since assetsare greater than liabilities, this net amount goes onthe left-hand side of the balance sheet. This type ofaccounting practice hides all of the investee’s debts.
Use of operating lease accounting “gains” the man-agers an understatement of their firm’s financialstructure by 10 to 15 percentage points. Footnotesto financial statements can help investors, creditors,and analysts to unravel the truth.
Huge amounts of money are involved in pensionaccounting. Pension expenses include the servicecost plus the interest on the projected benefit obli-gation minus the expected return on plan assetsplus the amortization of various unrecognized items,such as the unrecognized prior service cost. The onlyitem found on the balance sheet is the prepaid pen-sion asset or the accrual pension cost, which in turnequals the pension assets minus the projected bene-fit obligation minus various unrecognized items. Thenetting of the projected benefit obligations and thepension assets is incorrect; consequently, investors,creditors, and analysts must “unnet” them to gaina better understanding of the truth. Another area ofconcern is the assumptions about interest rates andthe need to assess their appropriateness.
Special-purpose entity debt includes securitiza-tions and synthetic leases. Securitizations take apool of homogeneous assets and turn them into se-curities. The idea is to borrow money from investors,who in turn are repaid by the cash generated by theasset pool. This process includes mortgages, creditcard receivables, transportation equipment, energycontracts, water utilities, and trade accounts receiv-able. Securitizations are big business and representa financial risk since these amounts are not shownin the balance sheet. Synthetic leases constitute atechnique by which firms can assert that they havecapital leases for tax purposes but operating leasesfor financial reporting purposes. They form a wayfor companies to decrease income taxes without ad-mitting any debt on their balance sheets.
Financial EngineeringThe scope of financial engineering involves creatingnew financial instruments (derivative securities) orcombining exiting derivatives to accomplish specifichedging goals (e.g., reduce financial risk). A deriva-tive security is a financial asset that represents aclaim to another financial asset (e.g., a stock optiongives the owner the right to buy or sell stock). Finan-cial risk may result from changes in interest rates,exchange rates, and commodity prices.
Tools for managing financial risk include hedgingwith forward contracts, hedging with futures con-tracts, hedging with currency option contracts, and

JWBT150-Vallabhaneni c07 July 28, 2009 18:33
182 Learning Module 7: Finance
hedging with currency swap contracts. These toolsallow a firm to reduce or even eliminate its exposureto financial risks. Hedging avoids a firm’s expensiveand troublesome disruptions that result from short-run and temporary price fluctuations. It gives a firmthe ability to react and adapt to changing financialmarket conditions.
Financial engineering can also be applied to insur-ance and reinsurance areas using captive insuranceand alternate risk transfer (ART) methods, as part ofa company’s risk management and risk mitigationstrategy. In the captive insurance method, a par-ent company establishes a subsidiary (called captiveinsurance company) to finance its retained losses.The type of risk that a captive subsidiary can under-write for the parent includes property damage, prod-uct liability, professional indemnity, employee ben-efits, employer liability, and motor and medical aidexpenses.
The ART method, which is an alternative to tra-ditional insurance and reinsurance coverage, pro-vides risk-bearing companies with coverage andprotection they need through convergence of insur-ance and financial markets. The scope of ART meth-ods include risk securitization, catastrophe bonds,dual-trigger or multiple-trigger insurance, finan-cial reinsurance, industry loss warranties, weatherderivatives, intellectual property insurance, andenterprise-wide risk insurance coverage.
❑ Learning Objective 7.8:UNDERSTAND THE VARIOUSTYPES OF VALUATION MODELSThe scope of valuation includes physically invento-riable assets, financial assets (e.g., bonds, commonstock, and preferred stock), and business valuation(cash flows).
Inventory Asset ValuationGenerally, historical cost is used to value invento-ries and cost of goods sold. In certain circumstances,though, departure from cost is justified. Some othermethods of costing inventory include the following:
� Net realizable value. Damaged, obsolete, or shop-worn goods should never be carried at an amountgreater than net realizable value. Net realizablevalue is equal to the estimated selling price of anitem minus all costs to complete and dispose of theitem.
� Lower of cost or market. If the value of inventorydeclines below its historical cost, then the inven-tory should be written down to reflect this loss. Adeparture from the historical cost principle is re-quired when the future utility of the item is not asgreat as its original cost. When the purchase priceof an item falls, it is assumed that its selling pricehas fallen or will fall. The loss of the future utility ofthe item should be charged against the revenues ofthe period in which it occurred. “Market” in thiscontext generally means the replacement cost ofthe item.
However, market cost is limited by a floor and ceil-ing cost. Market cannot exceed net realizable value,which is the estimated selling price minus the cost ofcompletion and disposal (ceiling). Market cannot beless than net realizable value minus a normal profitmargin (floor). Lower of cost or market can be ap-plied to each inventory item, each inventory class,or total inventory.
Financial Asset ValuationPolicy decisions that are most likely to affect thevalue of the firm include: investment in a projectwith large net present value, sale of a risky operat-ing division that will now increase the credit ratingof the entire company, and use of more highly lever-aged capital structure that results in a lower cost ofcapital.
Establishing or predicting the value of a firm is animportant task of the financial manager since maxi-mizing the value of his firm is a major goal. Here thefocus is on maximizing shareholders’ wealth. Similarto capital budgeting decisions, the financial managercan use discounted cash flow (DCF) techniques to es-tablish the worth of any assets (e.g., stocks, bonds,real estate, and equipment) whose value is derivedfrom future cash flows. The key concept of DCF isthat it takes time value of money into account. Thefinancial asset valuation for a firm is a combination ofbond valuation, common stock valuation, and preferredstock valuation.
Bond ValuationA bond valuation model shows the mathematicalrelationships between a bond’s market price and theset of variables that determine the price. For exam-ple, bond prices and interest rates are inversely re-lated. Corporate bonds are traded in the over-the-counter market.

JWBT150-Vallabhaneni c07 July 28, 2009 18:33
LEARNING OBJECTIVE 7.8: UNDERSTAND THE VARIOUS TYPES OF VALUATION MODELS 183
Treasuries raise money by issuing bonds and offer-ing common equity. A bond that has just been issuedis known as a new issue. Newly issued bonds aresold close to par value. A bond that has been on themarket for a while is called a seasoned issue andis classified as an outstanding bond. The prices ofoutstanding bonds vary from par value. A bond’smarket price is determined primarily by its couponinterest payments. The coupon interest payment isset at a level that will cause the market price of thebond to equal its par value.
A bond represents an annuity (i.e., interest pay-ments) plus a lump sum (i.e., repayment of the parvalue), and its value is found as the present value ofthis payment stream. The equation to find a bond’svalue is:
Value of Bond = I (Present Value of Annuity)+M (Present Value of Lump Sum)
where I is dollars of interest paid each year (i.e.,Coupon Interest Rate × Par Value = Coupon InterestPayment) and M is par (maturity) value.
Both the present value of the annuity and the lump-sum amount are discounted at an appropriate rateof interest (Kd) on the bond for a number of years (n)until the bond matures. The value of n declines eachyear after the bond is issued.
A graph can be drawn to show the values of a bondin relation to interest rate changes. Note that regard-less of what the future interest rates are, the bond’smarket value will always approach its par value asit nears the maturity date except in bankruptcy. Ifthe firm went bankrupt, the value of the bond mightdrop to zero.
Common Stock ValuationInvestors buy common stock for two main reasons:(1) to receive dividends and (2) to enjoy capital gain.Dividends are paid to stockholders at management’sdiscretion since there is no legal obligation to paydividends. Usually stockholders have an expecta-tion to receive dividends even though in reality theymay not. If the stock is sold at a price above its pur-chase price, the investor will receive a capital gain.Similarly, if the stock is sold at a price below its pur-chase price, the investor will suffer capital losses.
The value of a common stock is calculated at thepresent value of the expected future cash flow stream(i.e., expected dividends, original investment, andcapital gain or loss). Different aspects of these cashflow streams is the determination of the amount
of cash flow and the riskiness of the amounts andknowing what alternative actions affect stock prices.
Preferred Stock ValuationPreferred stock is a hybrid stock—it has elementsof both bonds and common stock. Most preferredstocks entitle their owners to regular fixed dividendpayments. The value of preferred stock can be foundas follows:
Vps = Dps/Kps
where Vps is the value of the preferred stock, Dps isthe preferred dividend, and Kps is the required rateof return on preferred stock.
Business ValuationBusiness valuation is valuing the worth of a busi-ness entity, whether in whole or part. The value of abusiness is derived from its ability to generate cashflows consistently period after period over the longterm. Business valuation can be performed at vari-ous milestones, such as new product introduction;mergers, acquisitions, divestitures, recapitalization,and stock repurchases; capital expenditures and im-provements; joint venture agreements; and ongoingreview of performance of business unit operations.
There are 11 models to help management in mak-ing sound decisions during valuation of a businessopportunity. These models, in the order of impor-tance and usefulness, are (1) book value model,(2) liquidation value model, (3) replacement costmodel, (4) discounted abnormal earnings model,(5) price multiples model, (6) financial analysismodel, (7) economic-value-added model, (8) market-value-added model, (9) economic profit model, (10)net present value model, and (11) discounted cashflow model.
1. Book value model. The book value (net worth,net assets, or stockholders’ equity) of a company’sstock represents the total assets of the companyless its liabilities. The book value per share has norelation to market value per share, as book valuesare based on historical cost of assets, not on thecurrent value at which they could be sold. Bookvalues are not meaningful because they are dis-torted by inflation factors and different account-ing assumptions used in valuing assets. One useof book value is to provide a floor value, with thetrue value of the company being some amount

JWBT150-Vallabhaneni c07 July 28, 2009 18:33
184 Learning Module 7: Finance
higher. Sales prices of companies are usually ex-pressed as multiples of book values within eachindustry.
2. Liquidation value model. Liquidation value of afirm is total assets minus all liabilities and pre-ferred stock minus all liquidation costs incurred.Liquidation value may be a more realistic mea-sure of a firm than its book value in that liquida-tion price reflects the current market value of theassets and liabilities if the firm is in a growing,profitable industry. Depending on the power ofnegotiations, the liquidation prices may be set atfire-sale levels.
3. Replacement cost model. The replacement costmodel is based on the estimated cost to replacea company’s assets, which include both tangible(plant, equipment) and intangible assets (patents,copyrights). Only tangible assets are replaceable,not the intangible ones. Because of this, the re-placement cost is lower than the market value ofthe company; sometimes it could be higher thanthe market value.
4. Discounted abnormal earnings model. If a firmcan earn only a normal rate of return on its bookvalue, then investors will pay no more than thebook value. Abnormal earnings are equal to totalearnings minus normal earnings. The estimatedvalue of a firm’s equity is the sum of the currentbook values plus the discounted future abnormalearnings.
5. Price multiples model. The value of a firm isbased on price multiples of comparable firmsin the industry. This model requires calculationof the desired price multiples and then apply-ing the multiple to the firm being valued. Exam-ples of price multiples include price-to-earnings(P/E) ratio, price-to-book ratio, price-to-sales ra-tio, price-to-cash-flow ratio, and market-to-bookratio.
6. Financial analysis model. Financial analysis in-cludes ratio analysis and cash flow analysis. Inratio analysis, the analyst can compare ratios for afirm over several years, compare ratios for the firmand other firms in the industry, and compare ra-tios to some benchmark data. While ratio analysisfocuses on analyzing a firm’s income statement orits balance sheet, the cash flow analysis will focuson operating, investing, and financing policies ofa firm by reviewing its Statement of Cash Flows.Cash flow analysis also provides an indication ofthe quality of the information in the firm’s incomestatement and balance sheet.
7. Economic-value-added (EVA) model. EVA is op-erating profit minus a charge for the opportunitycost of capital. An advantage of the EVA methodis its integration of revenues and costs of short-term decisions into the long-term capital budget-ing process. A disadvantage of EVA is that it fo-cuses only on a single period and that it does notconsider risk. The EVA model can be combinedwith the market-value-added model to addressthis disadvantage. The formula for calculatingthe EVA is: Operating Profit – (Weighted-AverageCost of Capital × Capital Invested).
8. Market-value-added (MVA) model. MVA is thedifference between the market value of a com-pany’s debt and equity and the amount of capitalinvested since its origin. The MVA measures theamount by which stock market capitalization in-creases in a period. Market capitalization is simplythe number of shares outstanding multiplied byshare price. MVA is calculated as follows: PresentValue of Debt + Market Value of Equity − CapitalInvested.
9. Economic profit model. According to the eco-nomic profit model, the value of a company equalsthe amount of capital invested plus a premiumequal to the present value of the cash flows createdeach year. Economic profit measures the value cre-ated in a company in a single period, and it iscalculated as follows: Invested Capital × (Returnon Invested Capital – Weighted-Average Cost ofCapital).
10. Net present value model. Basically, the netpresent value (NPV) model compares the bene-fits of a proposed project or firm with the costs,including financing costs, and approves thoseprojects or firms whose benefits exceed costs. TheNPV model incorporates the time value of moneyand the riskiness of cash flows, which are the vi-tal elements of a valuation model. The approach isto calculate the NPV of each alternative and thenselect the alternative with the highest NPV. NPVis calculated as follows: present value of all cashinflows minus present value of all cash outflows.
11. Discounted cash flow model. The total value ofa firm is the value of its debt plus the valueof its equity. The discounted cash flow (DCF)model goes beyond the NPV model and usesfree cash flows. The DCF model focuses on dis-counting cash flows from operations after invest-ment in working capital, less capital expenditures.The model does not consider interest expensesand cash dividends. The calculation involves the
JWBT150-Vallabhaneni c07 July 28, 2009 18:33
LEARNING OBJECTIVE 7.9: UNDERSTAND THE NATURE OF BUSINESS MERGERS AND ACQUISITIONS 185
generation of detailed, multiple-year forecasts ofcash flows available to all providers of capital(debt and equity). The forecasts are then dis-counted at the weighted-average cost of capitalto arrive at an estimated present value of the firm.The value of debt is subtracted from the total valueof firm to arrive at the value of equity.
❑ Learning Objective 7.9:UNDERSTAND THE NATUREOF BUSINESS MERGERS ANDACQUISITIONSA merger is defined as the combination of two firmsto form a single firm. A merger can be a friendlymerger or a hostile merger. In a friendly merger, theterms and conditions of a merger are approved bythe management of both companies, while in a hos-tile merger, the target firm’s management resists ac-quisition. It has been pointed out that many mergerstoday are designed more for the benefit of managersof the firm than for that of stockholders—who arereally the owners of the firm.
Five motives are given to account for the high levelof U.S. merger activity: (1) synergy, (2) tax consider-ations, (3) purchase of assets below their replace-ment cost, (4) diversification, and (5) maintainingcontrol.
1. Synergy is seen as the whole is greater than thesum of the parts (i.e., 2 + 2 = 5). It is the ba-sic rationale for any operating merger. Synergisticeffects can arise from four sources: (a) operatingeconomies of scale in production or distribution,(b) financial economies, which include a higherprice/earnings ratio, a lower cost of debt, or agreater debt capacity, (c) differential managementefficiency (one firm’s management is seen as inef-ficient), and (d) increased market power resultingfrom reduced competition.
2. Tax considerations include using tax status to thefirm’s advantage and using excess cash in merg-ers. Using excess cash to acquire another firm hasno immediate tax consequences for either the ac-quiring firm or its stockholders.
3. When the replacement value of a firm’s assetsis considerably higher than its market value, thefirm becomes an acquisition candidate. Purchaseprice will be less than the replacement value ofthe assets.
4. Diversification was thought to be a stabilizingfactor on a firm’s earnings and thus reduces risk.
There is a controversy about this practice. Sta-bilization of earnings is beneficial to a firm’s em-ployees, suppliers, and customers, but its value tostockholders and debt holders is not clear. This isbecause investors can diversify their risk on theirown; a merger is not the answer.
5. Maintaining control is a major motivation andbased on human psychology. The managers ofthe acquired companies generally lose their jobsor lose their autonomy. Therefore, managers whoown less than 51 percent of the stock in their firmslook to mergers that will lessen the chances oftheir firm being taken over. Defensive merger tac-tics are practiced by using much higher debt toacquire other firms so that it will be hard for anypotential acquirer to digest.
Types of MergersEconomists classify mergers into five groups:
1. A horizontal merger occurs when one firm com-bines with another in its same line of business. Itcan occur between a producer and another pro-ducer in the same industry. This kind of mergerprovides the greatest synergistic operating bene-fits and is the target of investigation by the U.S.Department of Justice. It is most likely to be at-tacked as a restraint of trade.
2. A vertical merger occurs between a firm and oneof its suppliers or customers. It can occur betweena producer and its supplier.
3. A congeneric merger is a merger of firms in thesame general industry, but for which no customeror supplier relationship exists.
4. A conglomerate merger occurs when unrelatedenterprises combine.
5. A beachhead merger takes on a new risk and op-portunity entering a new industry.
Merger TacticsManagement uses the following terms and tacticsduring the merger and acquisition (M&A) processeither to delay the process or to deny the offer,especially if it is a hostile one. (In M&A, one firm istargeting to buy another firm either in part or wholewith an offer to start the process.)
� A friendly merger involves amicable terms thatare approved by the management and board ofboth firms.

JWBT150-Vallabhaneni c07 July 28, 2009 18:33
186 Learning Module 7: Finance
� A tender offer occurs when one firm is buyingthe stock of another firm by going directly to thestockholders in an effort to bypass the target firm’smanagement.
� In a hostile merger, the target firm’s managementopposes the proposed M&A offer and uses vari-ous defensive tactics. Examples of defensive tacticsinclude greenmail, poison pill, poison put, sharkrepellent, scorched earth (crown jewel), whiteknight, and pac-man defense.
� Greenmail involves acquiring the common stockcurrently owned by the prospective combinor ata price greater than the combinor’s cost, with thestock thus acquired placed in the treasury or retiredstock status.
� A poison pill is an action that can damage atarget firm if it is acquired by a hostile firm. Itmay require an amendment of the “articles ofincorporation or bylaws” to make it more diffi-cult to obtain stockholders’ approval for a hostiletakeover.
� A poison put is a variation of the poison pill as itforces a firm to buy its securities back at some setprice.
� Shark repellent is any tactic (e.g., a poison pill) de-signed to discourage hostile or unwanted mergeroffers. It may involve acquiring common stock inexchange for treasury stock or incurring long-termdebt in exchange for common stock.
� Target firms either sell or threaten to sell their majorassets (crown jewels) when faced with a hostiletakeover threat. This tactic often involves a lockup,which is called a scorched earth strategy. It canalso involve disposal of assets either by sale or byspinoff to stockholders.
� A target firm facing an unfriendly merger of-fer might arrange to be acquired by a different,friendly firm, called the white knight.
� When white knights or others are granted excep-tional merger terms or otherwise well compen-sated, it is referred to as whitemail.
� A pac-man defense is a threat to undertake a hos-tile takeover of the prospective combinor.
� A lockup is an option granted to a friendly suitor(e.g., a white knight) giving it the right to purchasestock or some of the major assets (e.g., crown jew-els) of a target firm at a fixed price in the event ofan unfriendly takeover.
� A golden parachute is a large payment incentiveto senior management of a firm if it is acquiredin a hostile takeover. This payment is based on acontract.
Merger AnalysisThe acquirer is the firm that obtains control of theother firm—the acquiree. Whatever type of mergeris used, the underlying theory of merger analysis iscapital budgeting techniques. The objective is to de-termine whether the present value of the cash flowsexpected to result from the merger exceeds the pricethat must be paid for the target company. The acquir-ing firm performs the capital budgeting analysis.
A merger can be either an operating merger or afinancial merger or a combination of both. An oper-ating merger is a merger in which operations of thefirms involved are integrated in the hope of achiev-ing synergistic benefits. Accurate estimates of futurecash flows, although difficult to obtain, will be re-quired.
Analytical Techniques Used in Mergers:
� Investment analysis (capital budgeting)� Sensitivity (what-if) analysis� Scenario analysis� Simulation analysis� Due diligence reviews
A financial merger is one in which the mergedcompanies will be operated independently and fromwhich no significant operating economies are ex-pected. The postmerger cash flows are simply thesum of the expected cash flows of the two compa-nies if they had continued to operate independently.
A value of the target firm should be assessed in or-der to determine an educated price. Both cash flowsand a discount rate are essential in valuing the targetfirm. Cash flows can be developed using a set of proforma income statements for a number of years (sayfive years). These net cash flows are discounted atthe overall cost of capital, if both debt and equity areused to finance the merger. If only equity is used,then the cost of equity should be used. The pricepaid to acquire the target firm is a summation of thediscount net cash flows at the appropriate cost ofcapital.
Other types of merger and acquisition activitiesinclude the following:
� Spinoff is when a company sells one of its operat-ing divisions to its existing shareholders, and theshareholders receive new stock representing sepa-rate ownership rights in the division.
� Divestiture is when a large U.S. company sets upa new corporation based on the assets from one of

JWBT150-Vallabhaneni c07 July 28, 2009 18:33
LEARNING OBJECTIVE 7.10: UNDERSTAND THE IMPLICATIONS OF DIVIDEND POLICIES 187
its divisions. The stock of the new corporation istitled to the stockholders of the original firm.
� Often, a leveraged buyout (LBO) is an alterna-tive to a merger. There is controversy whetherLBOs are a good or a bad idea for a company orthe economy as a whole. Some argue that LBOsmight destabilize the economy because of the dis-ruptive forces involved in the deal. Others arguethat LBOs can stimulate lethargic or complacentmanagement. The existence of potential bargains,situations in which companies were using insuf-ficient leverage, and the development of the so-called “junk bond market” all facilitated the use ofleverage in takeovers.
� A holding company is a company that ownsstock in another company and exercises control.The holding company is called the parent com-pany and the controlled companies are called sub-sidiaries or operating companies. A holding com-pany is taxed on profits, cannot issue tax-freebonds, and is subject to normal government regu-lations.
� A formation of a joint venture or the acquisition ofan asset or a group of assets that does not constitutea business are not business combinations, as perthe accounting standards.
❑ Learning Objective 7.10:UNDERSTAND THEIMPLICATIONS OF DIVIDENDPOLICIES, STOCK SPLITS,STOCK DIVIDENDS, ANDSTOCK REPURCHASESDividend policy involves the decision whether topay out earnings or retain them for reinvestment ina firm. If the firm pays out more cash dividends,it will tend to increase the price of the stock. Theresult is that not much money is available for rein-vestment, the expected future growth rate will belowered, and this will depress the price of the stock.Thus, changing the dividend has two opposingeffects. The optimal dividend policy for a firm strikes thatbalance between current dividends and future growth thatmaximizes the price of the stock.
Dividend Policy in TheoryFour theories exist for dividend policy:
1. The dividend irrelevance theory. A dividend pol-icy is irrelevant when it has no effect on either
the price of a firm’s stock or its cost of capital.Modigliani and Miller (MM), who are proponentsof the dividend irrelevance theory, argued thatthe value of the firm is determined only by itsbasic power and its business risk. Stated differ-ently, the value of the firm depends only on theincome produced by its assets, not on how thisincome is split between dividends and retainedearnings.
MM argued that (a) financial leverage has noeffect on the cost of capital, (b) the distribution ofincome between dividends and retained earningshas no effect on the firm’s cost of equity, and (c) afirm’s capital budgeting policy is independent ofits dividend policy. Clearly these assumptions donot hold true in the real world.
2. The “bird-in-hand” theory. Gordon and Linter(GL) counteracted MM’s theory that dividendpolicy does not affect investors’ required rate ofreturn on equity. GL said that investors shouldvalue a dollar of expected dividends more highlythan a dollar of expected capital gains becausedividend yield is less risky than stock growth.MM disagreed and argued that the required rateof return on equity is independent of the dividendpolicy and implies that investors are indifferentbetween dividends and capital gains. In MM’sview, most investors plan to reinvest their divi-dends in the stock market. MM argued that theriskiness of the firm’s cash flows to investors inthe long-run is determined only by the riskinessof its investors’ operating cash flows and not byits dividend-payout policy.
GL argued that a dividend “in the hand” is lessrisky than a possible capital gain “in the bush,” soinvestors require a larger total return if that returnhas a larger capital gains component than divi-dend yield. GL argued that more than 1 percentof additional stock growth is required to offset a1 percent reduction in dividend yield.
Empirical test results to determine the true re-lationship between dividend yield and requiredreturn have been unclear in that either of the twotheories could be correct or incorrect. The capitalasset pricing model (CAPM)-based empirical testresults were inconclusive about which dividendtheory is correct.
The CAPM studies hypothesized that requiredreturns are a function of both market risk, as mea-sured by beta, and dividend yield. The issue is stillunresolved in that nobody can tell how dividendpolicy affects stock prices and capital costs.

JWBT150-Vallabhaneni c07 July 28, 2009 18:33
188 Learning Module 7: Finance
3. The information content theory. MM and oth-ers state that a larger-than-expected dividendincrease is taken by investors as a signal thatthe firm’s management forecasts improved fu-ture earnings reflected in a stock price increase,whereas a dividend reduction signals a forecastof poor earnings reflected in a stock price decline.The strong price changes indicate that importantinformation is contained in dividend amounts.This theory is known as the information con-tent or signaling hypothesis. MM claims thatinvestors’ reactions to changes in dividend pay-ments do not show that investors prefer dividendsto retained earnings.
4. The clientele effect theory. A firm attracts certaintypes of investors—clientele who like the firm’sparticular dividend policy. MM concluded thatthose investors who desired current cash incomewould own shares in high-dividend-payout firms,whereas those who did not need current cashincome would invest in low-payout firms. Thismeans (a) retired individuals prefer current cashincome to future capital gains and (b) youngerindividuals prefer future capital gains to currentcash income.
It is advised that firms should follow a specific, sta-ble dividend policy to prevent the investor switch-ing effect. This switching is costly because of broker-age cost, capital gains taxes, and a possible shortageof investors.
Dividend Policy in PracticeThe four specific practices that prevail today include:
1. Residual Dividend PolicyThe residual dividend policy states that investorsprefer to have the firm retain and reinvest earningsrather than pay them out in dividends if the rate of re-turn the firm can earn on reinvested earnings exceedsthe rate investors on average can themselves obtainon other investments of comparable risk. It impliesthat dividends should be paid only out of leftoverearnings and are influenced by investment oppor-tunities and by the availability of funds with whichto finance new investments. A firm will pay divi-dends only if earnings exceed the amount needed tosupport an optimal capital budget.
The cost of retained earnings is an opportunitycost, which reflects rates of return available to eq-
uity investors. If a firm’s stockholders can buy otherstocks of comparable risk and obtain a 15 percentdividend-plus-capital-gains yield, then 15 percent isthe firm’s cost of retained earnings.
Strict adherence to the residual dividend policywould result in dividend variability due to invest-ment opportunities and fluctuating earnings. Someinvestors prefer steady and stable dividends.
Ways to reduce dividend variability include de-laying some investment projects, departing from thetarget capital structure during a particular year, issu-ing new common stock, and using retained earningsfor dividends.
2. Constant DividendsIn order to adjust for inflation, some firms adopteda “stable growth rate” dividend payment policy. Acertain amount of growth rate for dividends is es-tablished, and the dividends are increased by thisamount each year. This policy provides investorswith a stable, real income as long as the firm’s earn-ings are growing at about the same rate.
There are two sound reasons for paying a stable,predictable dividend rather than following the resid-ual dividend policy:
1. A fluctuating dividend policy would lead togreater uncertainty, which lowers stock price. Astable dividend policy would do the opposite.
2. Those stockholders depending on current divi-dend cash income would be put to trouble andexpense if they had to sell part of their shares toobtain cash if the company cut the dividend.
3. Constant Payout RatioSome firms make it a practice to pay out a constantpercentage of earnings as dividends. Since earningsfluctuate, the dollar amount of dividends will varyusing a constant percentage.
4. Regular Dividend Plus ExtrasSome firms follow paying low, regular dividendsplus a year-end extra in a good year. This would bethe best choice for firms experiencing volatile earn-ings and cash flows. This is a compromise betweena stable dividend based on stable growth rate and aconstant payout rate. Such a policy gives firms flexi-bility; yet investors can count on receiving at least aminimum dividend.

JWBT150-Vallabhaneni c07 July 28, 2009 18:33
LEARNING OBJECTIVE 7.10: UNDERSTAND THE IMPLICATIONS OF DIVIDEND POLICIES 189
Dividend Payment ProceduresThere are four dates that are important when payingdividends to stockholders for their investment: (1)declaration date, (2) holder-of-record date, (3) ex-dividend date, and (4) payment date.
The declaration date is the date on which afirm’s directors issue a statement declaring a divi-dend. For accounting purposes, the declared divi-dend becomes an actual liability (i.e., current liabil-ity) on the declaration date, and retained earningswould be reduced by the amount of current liabilityestablished.
If the company lists the stockholder as an owneron the holder-of-record date, then the stockholderreceives the dividend. Ex-dividend date is the dateon which the right to the current dividend no longeraccompanies a stock. The ex-dividend date is usu-ally four working days prior to the holder-of-recorddate. Payment date is the date on which a firm ac-tually mails dividend checks. Payment date is afterthe holder-of-record date.
Stock Splits, Stock Dividends,and Stock RepurchasesStock splits and stock dividends are related to thefirm’s cash dividend policy. A stock split is an actiontaken by a firm to increase the number of sharesoutstanding and to decrease the price of the stockwhen the current stock price is close to or abovethe optimal price range. Stock splits can be of anysize (e.g., two-for-one, three-for-one). On the otherhand, reverse splits reduce the shares outstandingand increase the stock price. It is done when thecurrent stock price is below the optimal range.
When a stock price is within the optimal range, theprice/earnings (P/E) ratio, and hence the value ofthe firm, will be maximized.
Stock dividends are similar to stock splits withoutoffsetting the financial position of the current stock-holders. The effect of a stock dividend is an increasein the total number of shares and a decrease in earn-ings, dividends, and price per share.
Stock repurchase is a transaction in which a firmbuys back shares of its own stock. It is also calledtreasury stock. The effects of treasury stock are todecrease shares outstanding, to increase earnings pershare, and to increase market price of the stock.
The firm engages in stock repurchases when it hassurplus cash and when its capital structure is tooheavily weighted with equity. The firm sells debtand uses the proceeds to buy back its stock. When afirm buys back its stock, it is providing capital gainto the stockholder on the stock price appreciationinstead of cash dividends.
Some of the characteristics of treasury stock in-clude: it cannot receive assets upon liquidation, itcannot exercise preemptive rights, it reduces a firm’scapitalization amount, it is not an asset, it has no vot-ing rights, it is not eligible for dividends, it is not torecord profits from its trading, and it may be sold toobtain funds.
Self-Assessment Exercise
Online exercises are provided for the learning ob-jectives in this module. Please visit www.mbaiq.com to complete the online exercises and to cal-culate your MBA IQ Score.

JWBT150-Vallabhaneni c07 July 28, 2009 18:33
190

JWBT150-Vallabhaneni c08 July 29, 2009 10:50
LEARNING MODULE 8
Information Technology
Learning Objective 8.1: UnderstandHow to Plan and Manage theInformation Technology Function 192IT Strategies 192Elements of the Strategic IT Planning Framework 192IT Strategic Planning 193Strategic Initiatives 193IT Planning Process 194Assessing IT Plans 196
Learning Objective 8.2: UnderstandHow Business Application Systemsare Developed and Maintained 196Initiation Phase 196Development/Acquisition Phase 197Implementation Phase 197Operations/Maintenance Phase 197Disposal Phase 197Security Considerations in SDLC 198
Learning Objective 8.3: UnderstandHow Business Application Systemsare Operated and Improved 198Data Origination, Preparation, and Input 199Data Processing 199Data Output 200Documentation 200Data Integrity 200
Learning Objective 8.4: Understand theNeed for Contingency Plans toEnsure the Continuity of BusinessOperations 201Step 1: Develop Contingency Planning Process 201Step 2: Conduct Business Impact Analysis 201Step 3: Identify Preventive Controls 201Step 4: Develop Recovery Strategies 202Step 5: Develop Contingency Plan 206Step 6: Plan Testing, Training, and Exercises 206Step 7: Plan Maintenance 207
Learning Objective 8.5: UnderstandHow Information TechnologyOperations Are Managed 207Data Control (Input and Output) Procedures 208Production Control (Program Execution)
Procedures 208
Job Scheduling Practices 208Production Job Turnover Procedures 208Console Operations 209System Backups 209Preventive Maintenance 210System Logs 210Help-Desk Function 210
Learning Objective 8.6: Understand theTechnology Behind ComputerNetwork Management 211Computer Network Types 211Connectivity Hardware 214Network Management 216Network Changes 216Network Interoperability 217Network Architecture 217
Learning Objective 8.7: UnderstandHow to Manage the InformationTechnology Security Function 217Information Security Strategic Planning 217General Security Plans 218System Security Plans 218Security Concepts in Planning 218Basic Computer Security Practices 219Security Goals and Objectives 219Interdependence 220Security Controls and Safeguards 221
Learning Objective 8.8: UnderstandHow Databases are Designed andManaged 223Database Design Approaches 224Data Warehouse 227Data Marts 227Data Mining 227Information Engineering 228
Learning Objective 8.9: UnderstandHow Electronic Commerce isFacilitated and Managed 228The Internet 228Common Internet Services 229Internet Protocols 229Internet Security-Related Problems 229Intranet 230
191

JWBT150-Vallabhaneni c08 July 29, 2009 10:50
192 Learning Module 8: Information Technology
Extranet 230Web Management Issues 230Electronic Commerce 230E-Mail Security Issues 231EDI Security Issues 231
Information Transactions Security Issues 231Financial Transactions Security Issues 231E-Commerce Software 232E-Commerce Infrastructure 232
❑ Learning Objective 8.1:UNDERSTAND HOW TO PLANAND MANAGE THEINFORMATION TECHNOLOGYFUNCTIONThe IT function in an organization should betreated as an asset, not as an expense. IT planningcan be strategic (long-term), tactical (mid-term), andoperational (short-term) in nature. The IT strategicplan is a stable document, whereas the operationalplan is not. The IT strategic plan deals with assess-ment of internal and external environments. Thescope of the IT tactical plan includes budget plans,application system development and maintenanceplans, and technical support plans. The scope of theIT operational plan includes project descriptions,resource estimates, and implementation schedules.An important measure of success for any IT projectis whether the project has achieved its estimatedbenefits.
IT StrategiesThe IT function is no longer a backroom operation.Strategic information systems management is now acritical, integrated part of any general managementframework. Strategic information systems manage-ment typically involves defining a mission based oncustomer segments and needs, establishing core pro-cesses that accomplish the mission, understandingthe key decisions that guide mission delivery pro-cesses, supporting those decisions with the right in-formation available to the right people at the righttime, and using technology to collect, process, anddisseminate information in ways that improve thedelivery of products, goods, and services to cus-tomers.
One of the goals of IT management is to reduce cy-cle time, improve quality, reduce costs, and increaseproductivity.
Although there are many critical success factors,three factors can summarize all of them: people,process, and tools. People and process need to berelated to each other to improve quality and increase
productivity. A process is a sequence of steps oroperations used to accomplish a certain goal. Peo-ple perform operations. For example, all processesneed to be identified for improvement, methodolo-gies need to be changed where needed, and appli-cations of tools need to be evaluated. In all theseactivities, people are an integral part.
Other examples of common critical success fac-tors include top-management support, long-termcommitment, high-quality staffing, “business-is-the-driver strategy,” substantial customer input, co-ordination between organizations, appropriate useof technology, good up-front planning, and the abil-ity to change corporate culture.
Elements of the Strategic IT PlanningFrameworkThe strategic information systems planning frame-work is generally designed so that it can be appliedto any kind of IT acquisition. The rigor with which anorganization applies the framework and the amountof detail generated when applying the frameworkdepend in large part on the complexity of the sys-tem to be acquired. Also, high technical risks and theapplication of relatively immature technologies re-quire more detailed analyses and risk management,even though the process to be followed and the fac-tors to be considered are the same as for less riskyacquisitions.
The framework involves a structured, orderly pro-cess of obtaining and analyzing key information be-fore initiating system acquisition. The framework ismade up of eight steps:
1. Identifying the mission and the strategy (e.g.,organizational mission, operational concept, andoperational requirements)
2. Identifying the functions to be performed in car-rying out that mission (e.g., functions and sub-functions)
3. Identifying information needed to perform thosefunctions (e.g., information architecture)
4. Identifying data needed to perform those func-tions (e.g., data architecture)
5. Identifying application architecture needed toprovide that information

JWBT150-Vallabhaneni c08 July 29, 2009 10:50
LEARNING OBJECTIVE 8.1: UNDERSTAND HOW TO PLAN AND MANAGE THE INFORMATION TECHNOLOGY FUNCTION 193
6. Specifying a logical system definition (e.g., re-lationships between the functional, information,data, and application architectures and criteria foranalyzing various alternative hardware, software,communications, security, and data managementarchitectures)
7. Exploring alternative architectures (involveshardware, software, communications, security,and data management considerations)
8. Selecting a target architecture (e.g., managers,users, operators, maintainers, and designers)
Since the process is iterative, any major change inmission or requirements during any of the steps mayrequire restarting the process from the top to ensurethat the acquired system will meet user needs and bedeveloped within budget and on schedule. Further,each step in the process builds on the previous step.
IT Strategic PlanningMost organizations use IT to manage, manipulate,and disseminate information, as information is oneof the resources of an organization. Strategic plan-ning can help organizations achieve these goals.Strategic planning is the process of deciding organi-zational direction. Managers apply analytical tech-niques, creativity, and sound judgment to anticipatethe requirements of the future. When properly ex-ecuted, IT strategic planning helps an organizationto efficiently and effectively carry out its mission.By recognizing the value of strategic thinking anddeveloping the resulting strategic plans, managerscan better position their organization to meet tomor-row’s challenges. Strategic planning is a key tool formoving from where one is to where one wants to be.
An IT strategic plan supports an organizationalstrategic plan. It describes how an organization willmanage information and other resources to supportthe manufacture of products and the delivery of ser-vices to its customer base. An IT strategic plan shouldbe a part of the organization strategic plan. Due totheir long-term nature, strategic plans are not up-dated frequently. External or internal changes withinan organization are often the catalyst for organiza-tion strategic planning.
The seven key components of an IT strategic planare: (1) a mission statement that defines the organi-zation’s purpose, (2) a vision to support the mission,(3) goals to achieve the vision and mission, (4) an en-vironmental analysis to identify internal strengthsand weaknesses and external challenges and op-
portunities (i.e., strengths, weaknesses, opportuni-ties, and threats (SWOT) analysis), (5) strategies tomeet the vision and goals, (6) a risk assessment thatcontrasts the impacts of change versus those of nochange, and (7) critical success factors that highlightkey elements for achieving organization goals.
For strategic planning to succeed, managers mustcommit to and participate in the planning process,nurture strategic thinking, communicate with allparties affected by the plan, gain staff and customer/client support for the plan, and develop operationalplans to guide the implementation of the strategicvision.
Approaches to the Development of IT StrategicPlans:� Enterprise models� Work process redesign� Business reengineering� IT planning models
A successful IT plan factors in other functionaldepartments’ planning, presents a cohesive infor-mation architecture that promotes appropriate datasharing, and seeks IT solutions where appropriate,but not as a cure for every problem.
Strategic planning allows senior management totake a proactive role in anticipating organiza-tional direction and communicating that directionthroughout the organization. It provides senior man-agement with a foundation for decision makingbased on an organization-wide plan rather thanmany individual initiatives.
Strategic InitiativesThe essence of strategy is innovation, so competitiveadvantage often occurs when an organization tries astrategy that no one has tried before. Eight strategicinitiatives to obtain a competitive advantage are asfollows:
1. Reduce costs. A company can gain advantageif it can sell more units at a lower price whileproviding quality and maintaining or increas-ing its profit margin. Examples include onlinetracking of packets (UPS and FedEx), web-basedfrequently asked questions (FAQs), and onlineretailing (e-tailing).
2. Raise barriers to entrants. A company can gainadvantage if it deters potential entrants into themarket, enjoying less competition and biggermarket share. Examples include Amazon.com’s

JWBT150-Vallabhaneni c08 July 29, 2009 10:50
194 Learning Module 8: Information Technology
“one-click” purchases and Microsoft’s copyright-ing and patenting software.
3. Establish high switching costs. A company cangain advantage if it creates high switching costs,making it economically infeasible for customersto buy from competitors. Examples includeMicrosoft’s Office suite and SAP’s ERP software.
4. Create new products or services. A company cangain advantage if it offers a unique product orservice. Examples include Lotus’s 1-2-3 software,Amazon.com’s one-click service, and FedEx’sonline package tracking.
5. Differentiate products or services. A companycan gain advantage if it can attract customers byconvincing them its product differs from the com-petition’s product. Examples include Internet-based electronic commerce.
6. Enhance products or services. A company cangain advantage if its product or service is betterthan anyone else’s. Examples include stock bro-kerage companies offering online stock transac-tion services.
7. Establish alliances. Companies from different in-dustries can help each other gain advantage byoffering combined packages of goods or servicesat special prices. Examples include airline compa-nies partnering with hotels and car rental compa-nies providing vacation packages.
8. Lock in suppliers or buyers. A company can gainadvantage if it can lock in either suppliers or buy-ers, making it economically impractical for suppli-ers or buyers to deal with competitors. Anotherway to lock in customers is creating a standardin the field. Examples include Wal-Mart’s part-nership with its suppliers, Microsoft’s InternetExplorer, and ERP software vendors in terms ofproviding training and software updates to theircustomers.
IT Planning ProcessThe planning cycle is an iterative process, and itsresults are dynamic. Resources are required to de-velop, implement, and maintain the plan. When suc-cessfully executed, these efforts yield substantial andtangible benefits.
The IT planning process links organization strate-gic planning and IT strategic planning, uses in-formation to maximize an organization’s useful-ness, preserves information integrity, availability,and confidentiality, encourages IT to meet antici-pated needs, reflect budget constraints, and formthe basis for budget requests, examines the ultimate
impact of information resources on operationsthrough work process redesign, and moves from tra-ditional procedure-based and rule-based planning tomission-driven and broad-based strategic thinking.
Four types of planning exist: strategic planning, tacti-cal planning, operational planning, and information sys-tems planning. Strategic planning defines the mis-sion, goals, and objectives of the organization. It alsoidentifies the major IT activities to be undertakento accomplish the desired direction. Tactical plan-ning identifies, schedules, manages, and controls thetasks necessary to accomplish individual IT activi-ties. It involves planning of projects, procurement,and staffing. Operational planning integrates tacti-cal plans and supportive activities and describes theshort-term tasks that must be accomplished in orderto achieve the desired results. Information systemsplanning provides a phased, structured approachto systematically define, develop, and implement allaspects of an organization’s near- and long-term in-formation needs. More is said about these plans later.
Planning is the formulation of future courses ofaction. Being the primary management function,planning provides purpose and direction to the or-ganization. The planning horizon consists of threetypes: strategic (long-term), tactical (intermediate),and operational (short-term). Plans and forecasts areinterrelated, since the latter is used in the former.Forecasts are predictive in nature, whereas plans aregoal-oriented.
IT Strategic PlanThe IT strategic plan sets the broad direction andgoals for managing information within the organi-zation and supporting the delivery of services tocustomers. It produces a high-level strategy for pur-suing the organization’s information needs.
Members of the strategic planning team shouldinclude high-level management staff and represen-tatives of the functional departments and divisions.The participants in the strategic planning processshould have direct access to the decision-makers ofthe organization.
Strategic plans evaluate how well individual ITplans fit together to meet the overall needs of the or-ganization. Strategic plans examine current areas ofIT applications, identify opportunities for improve-ment in the organization, monitor costs associatedwith technology and services, help organizationsavoid a crisis-oriented approach to the managementof technologies, reflect current and future needs, re-flect budget constraints, form the basis for budget

JWBT150-Vallabhaneni c08 July 29, 2009 10:50
LEARNING OBJECTIVE 8.1: UNDERSTAND HOW TO PLAN AND MANAGE THE INFORMATION TECHNOLOGY FUNCTION 195
requests, and serve as the foundation for tactical andoperational planning.
IT Tactical PlanTactical planning is the identification, scheduling,management, and control of tasks necessary to ac-complish the individual activities identified in thestrategic plan. It involves planning of projects, pro-curement, and staffing. The IT tactical plan is con-cerned with the management of one IT activity,which may be scheduled over a period longer thanone year.
IT Operational PlanOperational planning integrates individual tacticalIT plans and drives the day-to-day supportive ac-tivities of the line operations. An IT operational plantypically covers a period of one year or less and iden-tifies, defines, schedules, and provides for control ofall activities that support the organization’s strategicand tactical plans. The operational plan integratestactical plans for individual activities.
An IT operational plan describes how an orga-nization will implement the strategic plan. Usually,this plan answers the following questions: How dowe get there?, When will it be done?, Who will doit?, and How much will it cost?
How Long Is What?� Strategic planning may cover five years or longer
(i.e., long-range planning).� Tactical planning may cover one year or longer
(i.e., mid-range planning).� Operational planning may cover one year (i.e.,
short-range planning).� IS planning may cover a few months to a few years.
The plan identifies logical steps (e.g., Gantt chart)for achieving the IT strategic visions. It may presentan implementation schedule, identify key mile-stones, define project initiatives, and include re-source (funding and personnel) estimates. The IT op-erational plan should identify dependencies amongIT strategies and present a logical sequence of projectinitiatives to assure smooth implementation.
Project initiatives should describe key tasks that anorganization must undertake in order to achieve itsvision. The following are examples of project initia-tives that may be found in an IT operational plan:
� Define how IT architecture will be achievedthrough the use of technology.
� Conduct a thorough analysis of the organization’sinformation requirements to determine the infor-mation architecture and how to effectively supportthis architecture through technology.
� Develop a cohesive organization-wide acquisitionstrategy for obtaining IS resources to support theorganization’s near-term needs and to prepare forthe future.
The components of an operational plan include in-formation plans, security plans, acquisition plans,and training plans. Information plans may docu-ment the information architecture, define how anorganization plans to use information throughoutits lifecycle, and discuss the protection and use of in-formation within the organization. Typically, theseplans address data collection techniques, privacy,standardization, distribution, and disposition.
Security plans should be developed for an orga-nization or an individual system. These plans doc-ument the controls and safeguards for maintaininginformation integrity and for preventing maliciousor accidental use, destruction, or modification ofinformation resources within the organization. Co-ordinated acquisition plans present a consolidateddescription of the major IT resources that an organi-zation plans to acquire over a designated period oftime. Training plans document the types of trainingthe IT staff will require to effectively perform theirduties.
Information Systems PlanInformation systems planning is a three-phasedprocess. The definition phase (phase 1) defines themajor business activities (processes) and informa-tion groups (data classes) required by an organi-zation and produces a high-level blueprint of theorganization’s information needs (i.e., the informa-tion architecture). The architecture developmentphase (phase 2) develops separate but closely re-lated views of the organization’s information re-quirements in the form of the data, application,and geographic architectures, each of which furtherdefines the information requirements of the orga-nization. During this phase, a prioritized slate ofprojects necessary to accomplish the identified im-provements is also developed. The implementationphase (phase 3) involves the development of de-tailed plans to implement the project slate developedin phase 2.
Once these plans are completed, the actual devel-opment of databases and applications may begin

JWBT150-Vallabhaneni c08 July 29, 2009 10:50
196 Learning Module 8: Information Technology
based on the information requirements identified inphases 1 and 2.
Assessing IT PlansTheoretically, an organization’s execution of ITstrategic and operational plans moves it closer toits vision of the future. However, this may not al-ways be true. An organization should periodicallyassess its progress during the execution of the plansto determine whether it is truly moving toward itsvision. Based on the progress to date, the organiza-tion may decide either that its vision and directionare still accurate or that it needs a midcourse correc-tion. Organizations need a mechanism for evaluatingthe success and usefulness of IT plans.
An organization should develop criteria for eval-uating the execution of its IT plans. These criteriamay differ for each stage of the planning cycle. Forexample, an organization can develop performancestandards to be used as quantifiable measures dur-ing the implementation effort. These performancestandards can be used to measure the success or fail-ure of a program. Performance standards should bereviewed annually to decide whether the implemen-tation schedule is realistic and to identify problemareas that may recur. These results can be used asinput to future evaluation efforts.
Regardless of the mechanism or criteria selected,an organization should carefully review the execu-tion of plans. The feedback obtained from the reviewwill provide the organization with valuable insightsthat can be applied to other planning efforts suchas human resources. For example, an organization’shuman resource plan can influence the size of an ITstaff and the training budget. To be successful, eachplanning group must consider the planning effortsof the other groups. Functional strategic plans thatdo not consider other planning efforts are of limitedvalue.
❑ Learning Objective 8.2:UNDERSTAND HOW BUSINESSAPPLICATION SYSTEMS AREDEVELOPED AND MAINTAINEDA computer system refers to a collection of pro-cesses, hardware, and software that perform a spe-cific function. This includes applications, networks,or support systems. A system development life-cycle (SDLC) model, which is a structured and
standard approach to develop or acquire computersystems, is presented in five phases.
The SDLC is the overall process of developing,implementing, and retiring information systemsthrough a multistep process from initiation, anal-ysis, design, implementation, and maintenance todisposal. There are many different SDLC models andmethodologies, but each generally consists of a se-ries of defined steps or phases (NIST SP 800-100 C3.)
Various SDLC methodologies have been devel-oped to guide the processes involved, and somemethods work better than others for specific types ofprojects. Regardless of the type of lifecycle used byan organization, information security features andbusiness controls must be integrated into the SDLCto ensure appropriate protection of the informationthat the system is intended to transmit, process, andstore. Security is most useful and cost-effective whensuch integration begins with a system developmentor integration project initiation and is continuedthroughout SDLC through system disposal.
The SDLC framework can consist of five phases toensure the selection, acquisition, and use of appro-priate and cost-effective security controls:
1. Initiation phase2. Development/acquisition phase3. Implementation phase4. Operations/maintenance phase5. Disposal phase
Initiation PhaseAll IT projects have a starting point, what is com-monly referred to as the initiation phase. Duringthe initiation phase, the organization establishes theneed for a particular system and documents itspurpose. The information to be processed, trans-mitted, or stored is typically evaluated, as well aswho requires access to such information and how(in high-level terms). In addition, it is often deter-mined whether the project will be an independentinformation system or a component of an already-defined system. A preliminary risk assessment istypically conducted in this phase, and initial securityplanning documents are initiated (system securityplan).
Once these tasks have been completed and a needhas been recognized for a new or enhanced IT prod-uct or service, several processes must take place be-fore the project is approved to include clearly defin-ing project goals and defining high-level information

JWBT150-Vallabhaneni c08 July 29, 2009 10:50
LEARNING OBJECTIVE 8.2: UNDERSTAND HOW BUSINESS APPLICATION SYSTEMS ARE DEVELOPED AND MAINTAINED 197
security requirements. Typically, during this phase,the organization defines high-level information se-curity policy requirements as well as the enterprisesecurity system architecture.
Development/Acquisition PhaseDuring the development/acquisition phase, the sys-tem is designed, purchased, programmed, devel-oped, or otherwise constructed. This phase oftenconsists of other defined cycles, such as the systemdevelopment cycle or the acquisition cycle.
During the first part of the development/acquisition phase, the organization should simulta-neously define the system’s security and functionalrequirements. These requirements can be expressedas technical features (e.g., access control), assurances(e.g., background checks for system developers), oroperational practices (e.g., awareness and training).During the last part of this phase, the organizationshould perform developmental testing of the tech-nical and security features/functions to ensure theyperform as intended prior to launching the imple-mentation and integration phase.
Implementation PhaseIn the implementation phase, the organization con-figures and enables system security features, teststhe functionality of these features, installs or im-plements the system, and finally obtains a formalauthorization to operate the system. Design reviewsand system tests should be performed before placingthe system into operation to ensure that it meets allrequired security specifications. In addition, if newcontrols are added to the application or the supportsystem, additional acceptance tests of those new con-trols must be performed. This approach ensures thatnew controls meet security specifications and do notconflict with or invalidate existing controls. The re-sults of the design reviews and system tests shouldbe fully documented, updated as new reviews ortests are performed, and maintained in the officialorganization records.
Operations/Maintenance PhaseAn effective security program demands comprehen-sive and continuous understanding of program andsystem weaknesses. In the operation and mainte-nance phase, systems and products are in place andoperating enhancements and/or modifications tothe system are developed and tested, and hardware
and/or software is added or replaced. During thisphase, the organization should continuously mon-itor performance of the system to ensure that it isconsistent with preestablished user and security re-quirements, and needed system modifications areincorporated.
For configuration management (CM) and control,it is important to document the proposed or ac-tual changes in the security plan of the system. In-formation systems are typically in a constant stateof evolution with upgrades to hardware, software,and firmware and possible modifications to the sur-rounding environment where the system resides.Documenting information system changes and as-sessing the potential impact of these changes on thesecurity of a system is an essential part of continu-ous monitoring and key to avoiding a lapse in thesystem security accreditation.
Monitoring security controls helps to identify po-tential security-related problems in the informationsystem that are not identified during the security im-pact analysis, which is conducted as part of the CMand control process.
Disposal PhaseThe disposal phase of the system lifecycle refers tothe process of preserving (if applicable) and discard-ing system information, hardware, and software.This step is extremely important because duringthis phase, information, hardware, and software aremoved to another system, archived, discarded, ordestroyed. If performed improperly, the disposalphase can result in the authorized disclosure ofsensitive data. When archiving information, orga-nizations should consider the need and methods forfuture retrieval. While electronic information is rela-tively easy to store and retrieve, problems can ariseif the technology used to create the records becomesunavailable as a result of obsolescence or incompat-ibility with new technologies. Additionally, the or-ganization should consider what measures must betaken for future use of data that has been encrypted,such as taking appropriate steps to ensure the securelong-term storage of cryptographic keys. It is equallyimportant to consider legal requirements for recordsretention when disposing of information systems.
The removal of information from a storagemedium, such as a hard disk or tape, is called san-itization. There are four categories of media san-itization: disposal, clearing, purging, and destruc-tion. Because different kinds of sanitization provide

JWBT150-Vallabhaneni c08 July 29, 2009 10:50
198 Learning Module 8: Information Technology
different levels of information protection, organiza-tions should use information security requirementsas a guide for selecting the sanitization method thatbest suits their needs.
1. Disposal is the act of discarding media (i.e., givingup control) in a manner short of destruction.
2. Clearing is the overwriting of classified informa-tion on magnetic media such that the media maybe reused.
3. Purging is the orderly review of storage and re-moval of inactive or obsolete data files by era-sure, by overwriting of storage, or by resettingregisters.
4. Destruction is the result of actions taken to en-sure that media cannot be reused as originallyintended and that information is virtually impos-sible or prohibitively expensive to recover.
Security Considerations in SDLCLike other aspects of application systems (e.g., fea-tures, functions, and business controls), security ismost effective and efficient if planned and managedthroughout a computer system’s lifecycle, from ini-tial planning through design, implementation, andoperation. Many security-related events and analy-ses occur during a system’s life.
Planning is used to help ensure that security isaddressed in a comprehensive manner throughouta system’s lifecycle. Computer security and controlmanagement is a part of computer systems man-agement. The benefit of having a distinct computersecurity plan is to ensure that computer securityis not overlooked. A typical plan briefly describesthe important security considerations for the sys-tem and provides references to more detailed doc-uments, such as system security plans, contingencyplans, training programs, accreditation statements,incident handling plans, or audit results. This en-ables the plan to be used as a management tool with-out requiring repetition of existing documents.
Although a computer security plan can be devel-oped for a system at any point in the lifecycle, therecommended approach is to draw up the plan at thebeginning of the computer system lifecycle. It haslong been a tenet of the computer community thatit costs ten times more to add a feature in a systemafter it has been designed than to include the featureat the initial design phase. The principal reason forimplementing security during a system’s develop-ment is that it is more difficult to implement it later
(as is usually reflected in the higher costs of doingso). It also tends to disrupt ongoing operations.
Security also needs to be incorporated into thelater phases of the computer system lifecycle to helpensure that security keeps up with changes in thesystem’s environment, technology, procedures, andpersonnel. It also ensures that security is consideredin system upgrades, including the purchase of newcomponents or the design of new modules. Addingnew security controls to a system after a securitybreach, mishap, or audit can lead to haphazard se-curity that can be more expensive and less effectivethan security that is already integrated into the sys-tem. It can also significantly degrade system perfor-mance. It is important to keep the computer securityplan up-to-date.
Lifecycle management also helps documentsecurity-relevant decisions in addition to helping en-sure management that security is fully consideredin all phases. This documentation benefits systemmanagement officials as well as oversight and inde-pendent audit groups. System management person-nel use documentation as a self-check and reminderof why decisions were made so that the impact ofchanges in the environment can be more easily as-sessed. Oversight and independent audit groups usethe documentation in their reviews to verify thatsystem management has done an adequate job andto highlight areas where security may have beenoverlooked. This includes examining whether thedocumentation accurately reflects how the system isactually being operated.
❑ Learning Objective 8.3:UNDERSTAND HOW BUSINESSAPPLICATION SYSTEMS AREOPERATED AND IMPROVEDApplication-oriented information systems encom-pass all areas of business and nonbusiness comput-erized systems. Each application system is designedto perform specific functions, similar to a manualsystem, with clearly defined input, processing, andoutput activities.
Examples of Operational Application Systems:� General ledger� Insurance claims processing� Accounts payable� Demand deposits� Payroll

JWBT150-Vallabhaneni c08 July 29, 2009 10:50
LEARNING OBJECTIVE 8.3: UNDERSTAND HOW BUSINESS APPLICATION SYSTEMS ARE OPERATED AND IMPROVED 199
� Welfare payments� Order entry� Tax administration� Sales forecasting� License administration� Manufacturing scheduling� Accounts receivable
Most application systems are not fully developedall at one time. Rather, they evolve during the courseof time. The fact that controls are built into the appli-cation systems during software development doesnot guarantee that they will function properly oncethe system is operational. Therefore, to ensure a sus-tained and effective functioning of controls, eachapplication system that is operational requires pe-riodic review, testing, and evaluation of automatedand manual internal controls.
Application systems attain operational status afterthey are either developed in-house or acquired fromvendors and then installed into the production area.Application system controls are primarily concernedwith data being originated, prepared, entered, pro-cessed, stored, accessed, transmitted, secured, con-trolled, and used. Application systems are usuallyclassified as specific to each industry, such as bank-ing and manufacturing, or across industry, such asgeneral ledger and payroll.
To be effective, one of the major purposes of appli-cation systems should be to provide accurate, timely,and relevant data and information to support man-agement decision making at all levels. This will leadto accomplishment of the organization’s goals andobjectives.
Each operational application system goes througha series of steps to accept data as input and pro-duce reports as output to ensure integrity of bothinput and output. These steps include (1) data orig-ination, preparation, and input, (2) data processing,and (3) data output. Documentation is needed to op-erate the system.
Data Origination, Preparation, and InputThere are several approaches to data preparation anddata entry into the application system. In some cases,data are captured on a paper (source) document likea sales order or purchase order. The source docu-ments are batched into small groups and enteredinto the system either by functional users or centraldata entry operators through the use of terminals. Inother cases, there is no externally generated source
document since the customer calls in and places anorder with the organization.
Regardless of the method used to capture data, theentered data are edited and validated for preventingor detecting errors and omissions. Therefore, accesscontrols and data editing and validation controls areimportant to ensure that quality data are entered intothe application system.
Program-based controls are embedded in onlinedata entry programs in the form of data editing andvalidation routines. These routines will ensure dataintegrity. The sequence of events followed by thecomputer center in a typical batch data entry andbatch updating or online data entry and batch up-dating environment would include:
� Batching records of transactions or source docu-ments
� Converting (keying) transactions or documents tomachine-readable form
� Validating input transactions� Updating the master file with new transactions� Generating hardcopy reports
Data ProcessingProcessing controls should satisfy the followingobjectives: all transactions are authorized prior toprocessing, all approved transactions are enteredquickly in their entirety and accepted by the sys-tem, and all transactions are accurately and quicklyprocessed. Understanding the nature of computerprocessing is critical. Although there are some com-mon controls, controls will be different betweenbatch and online processing. Similar to data input,data editing and validation controls are importantduring computer processing. Therefore, more use ofprogram-based processing controls is needed to en-sure data integrity and security.
The process of carrying forward control totalsfrom one run to another is known as run-to-runbalancing. Run-to-run control totals are programprocessing-based controls. Examples could be thenumber of records in a file and amount totals for cer-tain data fields. The objective is to maintain the accu-racy and completeness of data as they pass throughcomputer programs and processing operations (i.e.,processing control). It is good to automate the batchreport balancing and reconciliation procedures andreturn this function to functional user departments.Functional user control of the report-balancingactivity increases the chances of correcting the source

JWBT150-Vallabhaneni c08 July 29, 2009 10:50
200 Learning Module 8: Information Technology
of out-of-balance conditions. This is due to inti-mate knowledge the users have about the nature oftransactions and their interrelationships. Computeroperators should not perform run-to-run balancingprocedures.
Some data processing rules include the following:
� If an error occurs when processing a transaction,processing should be continued with that transac-tion, and all errors and rejected transactions shouldbe listed in a report or displayed on a computerterminal.
� When updating a batched file and if end-of-filecondition is reached on the master file before end-of-file on the transaction file, then the applicationprogram should post the remaining transactions tothe master file.
Data OutputThere are many output devices in use. Some exam-ples are terminals, printers, plotters, microfilm, mi-crofiche, and voice response units. System outputdocuments are photographed onto a roll of film andstored on microfilm, microfiche, and optical disk.Audio response systems help customers to inquireabout a bank balance, get the time and tempera-ture readings, and obtain a telephone number from adirectory. Usually, system outputs are in the form ofhardcopy reports. Trends indicate that paper will bereplaced by online viewing of reports on a terminal.
Balancing, distribution, and retention of systemoutputs are of major concern to management andthe auditor alike since they affect the quality andtimeliness of data and usefulness of the system.
DocumentationSystem documentation is a key element of sys-tem operations. Without correct and complete doc-umentation, new users cannot be trained properly,programmers cannot maintain the system correctly,users of the system cannot make any meaningfulreferences to system functions and features, neithermanagement nor anyone else can understand systemfunctions and features, and reviewers of the systems(e.g., auditors) cannot make objective evaluation ofsystem functions and controls.
Application system documentation is classifiedinto six categories: system, program, computer op-erations, help desk, network control, and user. Thisclassification is based on the major user of the
documentation. For example, help desk documen-tation is used by help desk staff.
Data IntegrityData and information are not synonymous. Data area collection of facts and figures, and they are raw. In-formation is derived from data in response to a par-ticular need, and it is processed. Integrity is binaryin nature: it exists or it does not. Information qualityhas a parallel meaning to data integrity. Informationquality means meeting system user requirements.Quality is a matter of characteristics.
The perception of quality depends on the purposefor which information is to be used. For informationto be useful, it should be available where, when, andin the form required with costs equal to or less thanbenefits to be derived from it.
Data have a certain degree of quality, and the userhas some expectations of quality. If data qualityequals or exceeds the expectations of quality, datahave integrity; otherwise, they do not. Other factorsof data quality, in addition to completeness, accu-racy, and timeliness, are relevance and validity. Rel-evance is a measure of the appropriateness of thedata item in relation to the user’s problem or need.Validity is a notion of external reference or corre-spondence. Data may be valid but not relevant ormay have low validity but still be relevant.
Data integrity is the heart of any application system.Data integrity controls ensure the reliability and us-ability of data and information in making manage-ment decisions. The higher the integrity of controls,the greater the credibility and reliability of the ap-plication system. Here, data integrity refers to fivecontrol attributes: completeness, accuracy, autho-rization, consistency, and timeliness.
Which Control Does What?
� A directive control will ensure that people fol-low data integrity rules consistently.
� A preventive control will stop a data integrityviolation from happening.
� A detective control will recognize a data in-tegrity violation.
� A corrective control will fix or repair the dam-age done by a data integrity violation.
� A recovery control will help in recovering orrestoring from a disaster caused by a data in-tegrity violation.

JWBT150-Vallabhaneni c08 July 29, 2009 10:50
LEARNING OBJECTIVE 8.4: UNDERSTAND THE NEED FOR CONTINGENCY PLANS 201
❑ Learning Objective 8.4:UNDERSTAND THE NEED FORCONTINGENCY PLANS TOENSURE THE CONTINUITY OFBUSINESS OPERATIONSIT contingency planning is one modular piece ofa larger contingency and continuity of operationsplanning program that encompasses IT, businessprocesses, risk management, financial management,crisis communications, safety and security of per-sonnel and property, and continuity of operations.Each piece is operative in its own right, but inconcert they create synergy that efficiently andeffectively protects the entire organization (NISTSP 800-34).
Contingency planning for information systems isa required process for developing general supportsystems and major applications with appropriatebackup methods and procedures for implementingdata recovery and reconstitution against IT risks.Risks to information systems may be natural, techno-logical, or human in nature. Contingency planningconsists of a process for recovery and documentationof procedures for conducting recovery.
A seven-step methodology for developing an ITcontingency process and plan is shown below. Plan-ning, implementing, and testing the contingencystrategy are addressed by six of the seven steps; doc-umenting the plan and establishing procedures andpersonnel organization to implement the strategy isthe final step.
Step 1: Develop contingency planning process.Step 2: Conduct business impact analysis.Step 3: Identify preventive controls.Step 4: Develop recovery strategies.Step 5: Develop contingency plan.Step 6: Plan testing, training, and exercises.Step 7: Plan maintenance.
The capability to recover and reconstitute datashould be integral to the information system designconcept during the initiation phase. Recovery strate-gies should be built into the general support systemsor major applications architecture during the devel-opment phase. The contingency processes shouldbe tested and maintained during the implementa-tion phase; contingency plans should be exercisedand maintained during the operations/maintenancephase. When the information system has reachedthe disposal phase, the legacy system should remain
intact and operational as a contingency to the re-placed information system.
Step 1: Develop Contingency PlanningProcessWhen developing an IT contingency plan, the firststep is to establish a contingency planning policywithin the organization. This policy may exist atthe department, agency, and/or program level ofthe organization. The statement should define theorganization’s overall contingency objectives; iden-tify leadership, roles and responsibilities, resourcerequirements, and test, training, and exercise sched-ules; and develop maintenance schedules and deter-mine the minimum required backup frequency.
Step 2: Conduct Business Impact AnalysisA business impact analysis (BIA) is a critical stepto understanding the information systems compo-nents, interdependencies, and potential downtimeimpacts. Contingency plan strategy and proceduresshould be designed in consideration of the results ofthe BIA.
A BIA is conducted by identifying the system’scritical resources. Each critical resource is then fur-ther examined to determine how long functionalityof the resource could be withheld from the informa-tion system before an unacceptable impact is expe-rienced.
The impact may be something that materializesover time or may be tracked across related resourcesand dependent systems (e.g., cascading dominoeffect). The time identified is called a maximumallowable outage (MAO). Based on the potentialimpacts, the amount of time the information systemcan be without the critical resource then providesa resource recovery priority around which an or-ganization can plan recovery activities. The balanc-ing point between the MAO and the cost to recoverestablishes the information system’s recovery timeobjective (RTO). Recovery strategies must be cre-ated to meet the RTO.
The strategy must also address recovering infor-mation system critical components within a priority,as established by their individual RTOs.
Step 3: Identify Preventive ControlsIn some cases, implementing preventive con-trols might mitigate outage impacts identified bythe BIA. Preventive controls are measures that

JWBT150-Vallabhaneni c08 July 29, 2009 10:50
202 Learning Module 8: Information Technology
deter and/or reduce impacts to the system. Whencost-effective, preventing an impact is desired overimplementing recovery strategies (and thereforerisking data loss and impact to the organization).Preventive controls should be documented in thecontingency plan, and personnel associated withthe system should be trained on how and whento use the controls. These controls should be main-tained in good condition to ensure their effectivenessin an emergency. Preventive measures are specificto individual components and the environment inwhich the components operate. Common controlsinclude:
� Uninterruptible power supply� Fire-suppression systems� Gasoline or diesel-powered generators� Air-conditioning systems with excess capacity to
permit failure of certain components� Heat-resistant and waterproof containers for
backup media and vital non-electronic records� Frequent scheduled data backups
Step 4: Develop Recovery StrategiesWhen a disruption occurs despite the preventivemeasures implemented, a recovery strategy must bein place to recover and restore data and system oper-ations within the RTO period. The recovery strategyis designed from a combination of methods, whichtogether address the full spectrum of informationsystem risks. Several options may be evaluated dur-ing the development phase; the most cost-effective,based on potential impact, should be selected andintegrated into the information system architectureand operating procedures.
Recovery strategies provide a means to restoreIT operations quickly and effectively following aservice disruption. The strategies should addressdisruption impacts and allowable outage times iden-tified in the BIA. Several alternatives should beconsidered when developing the strategy, includingcost, allowable outage time, security, and integrationwith larger, organization-level contingency plans.
The selected recovery strategy should address thepotential impacts identified in the BIA and shouldbe integrated into the system architecture duringthe design and implementation phases of the sys-tem lifecycle. The strategy should include a combi-nation of methods that complement one another toprovide recovery capability over the full spectrumof incidents. A wide variety of recovery approaches
may be considered; the appropriate choice dependson the incident, type of system, and its operationalrequirements. Specific recovery methods should beconsidered and may include commercial contractswith cold-, warm-, or hot-site vendors, mobile sites,mirrored sites, reciprocal agreements with internalor external organizations, and service-level agree-ments (SLAs) with the equipment vendors. In addi-tion, technologies such as Redundant Arrays of Inde-pendent Disks (RAID), automatic failover, uninter-ruptible power supply, and mirrored systems shouldbe considered when developing a system recoverystrategy.
Systems and Data BackupSystems and data must be backed up regularly;therefore, all IT contingency plans should include amethod and frequency for conducting data backups.The frequency of backup methods—daily or weekly,incremental or full—should be selected based on sys-tem criticality when new information is introduced.The backup method selected should be based on sys-tem and data availability and integrity requirements(as defined in the BIA). Data that are backed up mayneed to be stored offsite and rotated frequently, de-pending on the criticality of the system.
Backup MethodsPolicies should specify the frequency of backups(e.g., daily or weekly, incremental or full), basedon data criticality and the frequency with whichnew information is introduced. Data backup poli-cies should designate the location of stored data, file-naming conventions, media rotation frequency, andmethod for transporting data offsite. Data may bebacked up on magnetic disk, tape, or optical disks(such as compact disks). The specific method cho-sen for conducting backups should be based on sys-tem and data availability and integrity requirements.These methods include electronic vaulting and mir-rored disks (using direct-access storage devices orRAID).
It is good business practice to store backed-up dataoffsite. Commercial data storage facilities are spe-cially designed to archive media and protect datafrom threatening elements. When using offsite stor-age, data is backed up at the organization’s facil-ity and then labeled, packed, and transported tothe storage facility. If data are required for recoveryor testing purposes, the organization contacts the
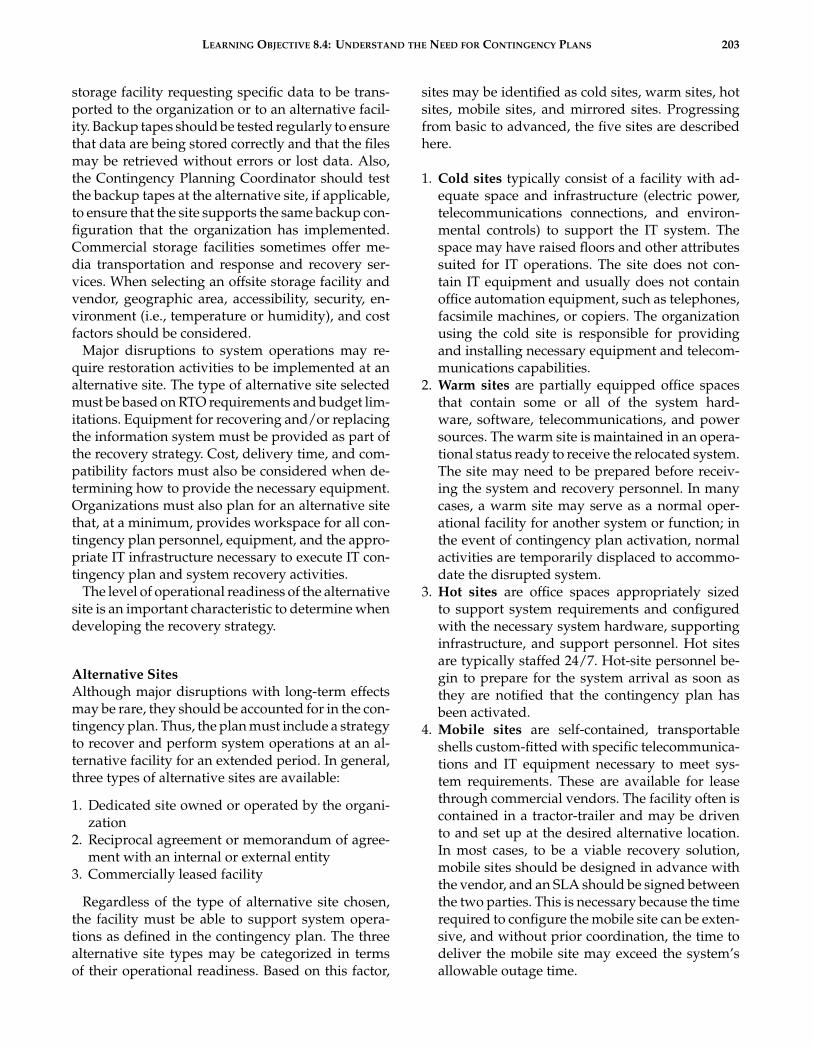
JWBT150-Vallabhaneni c08 July 29, 2009 10:50
LEARNING OBJECTIVE 8.4: UNDERSTAND THE NEED FOR CONTINGENCY PLANS 203
storage facility requesting specific data to be trans-ported to the organization or to an alternative facil-ity. Backup tapes should be tested regularly to ensurethat data are being stored correctly and that the filesmay be retrieved without errors or lost data. Also,the Contingency Planning Coordinator should testthe backup tapes at the alternative site, if applicable,to ensure that the site supports the same backup con-figuration that the organization has implemented.Commercial storage facilities sometimes offer me-dia transportation and response and recovery ser-vices. When selecting an offsite storage facility andvendor, geographic area, accessibility, security, en-vironment (i.e., temperature or humidity), and costfactors should be considered.
Major disruptions to system operations may re-quire restoration activities to be implemented at analternative site. The type of alternative site selectedmust be based on RTO requirements and budget lim-itations. Equipment for recovering and/or replacingthe information system must be provided as part ofthe recovery strategy. Cost, delivery time, and com-patibility factors must also be considered when de-termining how to provide the necessary equipment.Organizations must also plan for an alternative sitethat, at a minimum, provides workspace for all con-tingency plan personnel, equipment, and the appro-priate IT infrastructure necessary to execute IT con-tingency plan and system recovery activities.
The level of operational readiness of the alternativesite is an important characteristic to determine whendeveloping the recovery strategy.
Alternative SitesAlthough major disruptions with long-term effectsmay be rare, they should be accounted for in the con-tingency plan. Thus, the plan must include a strategyto recover and perform system operations at an al-ternative facility for an extended period. In general,three types of alternative sites are available:
1. Dedicated site owned or operated by the organi-zation
2. Reciprocal agreement or memorandum of agree-ment with an internal or external entity
3. Commercially leased facility
Regardless of the type of alternative site chosen,the facility must be able to support system opera-tions as defined in the contingency plan. The threealternative site types may be categorized in termsof their operational readiness. Based on this factor,
sites may be identified as cold sites, warm sites, hotsites, mobile sites, and mirrored sites. Progressingfrom basic to advanced, the five sites are describedhere.
1. Cold sites typically consist of a facility with ad-equate space and infrastructure (electric power,telecommunications connections, and environ-mental controls) to support the IT system. Thespace may have raised floors and other attributessuited for IT operations. The site does not con-tain IT equipment and usually does not containoffice automation equipment, such as telephones,facsimile machines, or copiers. The organizationusing the cold site is responsible for providingand installing necessary equipment and telecom-munications capabilities.
2. Warm sites are partially equipped office spacesthat contain some or all of the system hard-ware, software, telecommunications, and powersources. The warm site is maintained in an opera-tional status ready to receive the relocated system.The site may need to be prepared before receiv-ing the system and recovery personnel. In manycases, a warm site may serve as a normal oper-ational facility for another system or function; inthe event of contingency plan activation, normalactivities are temporarily displaced to accommo-date the disrupted system.
3. Hot sites are office spaces appropriately sizedto support system requirements and configuredwith the necessary system hardware, supportinginfrastructure, and support personnel. Hot sitesare typically staffed 24/7. Hot-site personnel be-gin to prepare for the system arrival as soon asthey are notified that the contingency plan hasbeen activated.
4. Mobile sites are self-contained, transportableshells custom-fitted with specific telecommunica-tions and IT equipment necessary to meet sys-tem requirements. These are available for leasethrough commercial vendors. The facility often iscontained in a tractor-trailer and may be drivento and set up at the desired alternative location.In most cases, to be a viable recovery solution,mobile sites should be designed in advance withthe vendor, and an SLA should be signed betweenthe two parties. This is necessary because the timerequired to configure the mobile site can be exten-sive, and without prior coordination, the time todeliver the mobile site may exceed the system’sallowable outage time.

JWBT150-Vallabhaneni c08 July 29, 2009 10:50
204 Learning Module 8: Information Technology
5. Mirrored sites are fully redundant facilities withfull, real-time information mirroring. Mirroredsites are identical to the primary site in all tech-nical respects. These sites provide the highestdegree of availability because the data are pro-cessed and stored at the primary and alternativesite simultaneously. These sites typically are de-signed, built, operated, and maintained by theorganization.
There are obvious cost and ready-time differencesamong the five options. The mirrored site is the mostexpensive choice, but it ensures virtually 100 per-cent availability. Cold sites are the least expensive tomaintain; however, it may require substantial timeto acquire and install necessary equipment. Partiallyequipped sites, such as warm sites, fall in the mid-dle of the spectrum. In many cases, mobile sites maybe delivered to the desired location within 24 hours.However, the time necessary for installation can in-crease this response time. The selection of fixed-sitelocations should account for the time and mode oftransportation necessary to move personnel there.In addition, the fixed site should be in a geographicarea that is unlikely to be negatively affected by thesame disaster event (e.g., weather-related impactsor power grid failure) as the organization’s primarysite. Sites should be analyzed further by the orga-nization based on specific requirements defined inthe BIA. As sites are evaluated, the ContingencyPlanning Coordinator should ensure that the sys-tem’s security, management, operational, and tech-nical controls are compatible with the prospectivesite. Such controls may include firewalls and physi-cal access controls, data remanence controls, and se-curity clearance level of the site and staff supportingthe site.
These alternative sites may be owned and oper-ated by the organization (internal recovery), or com-mercial sites may be available under contract. Ifcontracting for the site with a commercial vendor,adequate testing time, workspace, security require-ments, hardware requirements, telecommunicationsrequirements, support services, and recovery days(how long the organization can occupy the spaceduring the recovery period) must be negotiated andclearly stated in the contract. Customers should beaware that multiple organizations may contract witha vendor for the same alternative site; as a result, thesite may be unable to accommodate all of the cus-tomers if a disaster affects enough of them simulta-neously. The vendor’s policy on how this situation
should be addressed and how priority status is de-termined should be negotiated.
Two or more organizations with similar or identi-cal IT configurations and backup technologies mayenter a formal agreement to serve as alternative sitesfor each other or enter into a joint contract for analternative site. This type of site is set up via a recip-rocal agreement or memorandum of understand-ing (MOU). A reciprocal agreement should be en-tered into carefully because each site must be ableto support the other, in addition to its own work-load, in the event of a disaster. This type of agree-ment requires the recovery sequence for the applica-tions from both organizations to be prioritized froma joint perspective, favorable to both parties. Test-ing should be conducted at the partnering sites toevaluate the extra processing thresholds, compat-ible system and backup configurations, sufficienttelecommunications connections, compatible secu-rity measures, and the sensitivity of data that mightbe accessible by other privileged users, in additionto functionality of the recovery strategy.
An MOU, memorandum of agreement (MOA), ora service-level agreement (SLA) for an alternativesite should be developed specific to the organiza-tion’s needs and the partner organization’s capabili-ties. The legal department of each party must reviewand approve the agreement. In general, the agree-ment should address, at a minimum, each of thefollowing elements:
� Contract/agreement duration� Cost/fee structure for disaster declaration and
occupancy (daily usage), administration, mainte-nance, testing, annual cost/fee increases, trans-portation support cost (receipt and return of offsitedata/supplies, as applicable), cost/expense allo-cation (as applicable), and billing and paymentschedules
� Disaster declaration (i.e., circumstances constitut-ing a disaster, notification procedures)
� Site/facility priority access and/or use� Site availability� Site guarantee� Other clients subscribing to same resources and
site, and total number of site subscribers, as appli-cable
� Contract/agreement change or modificationprocess
� Contract/agreement termination conditions� Process to negotiate extension of service� Guarantee of compatibility

JWBT150-Vallabhaneni c08 July 29, 2009 10:50
LEARNING OBJECTIVE 8.4: UNDERSTAND THE NEED FOR CONTINGENCY PLANS 205
� IT system requirements (including data and tele-communication requirements) for hardware, soft-ware, and any special system needs (hardware andsoftware)
� Change management and notification require-ments, including hardware, software, and infra-structure
� Security requirements, including special securityneeds
� Staff support provided/not provided� Facility services provided/not provided (e.g., use
of onsite office equipment and cafeteria)� Testing, including scheduling, availability, test
time duration, and additional testing, if required� Records management (onsite and offsite), includ-
ing electronic media and hardcopy� Service-level management (performance measures
and management of quality of IT services pro-vided)
� Workspace requirements (e.g., chairs, desks, tele-phone, and PCs)
� Supplies provided/not provided (e.g., officesupplies)
� Additional costs not covered elsewhere� Other contractual issues, as applicable� Other technical requirements, as applicable
Equipment ReplacementIf the IT system is damaged or destroyed or the pri-mary site is unavailable, necessary hardware andsoftware will need to be activated or procuredquickly and delivered to the alternative location.Three basic strategies exist to prepare for equipmentreplacement. (When selecting the most appropriatestrategy, note that the availability of transportationmay be limited or temporarily halted in the event ofa catastrophic disaster.)
1. Vendor agreements. As the contingency plan isdeveloped, SLAs with hardware, software, andsupport vendors may be made for emergencymaintenance service. The SLA should specify howquickly the vendor must respond after being no-tified. The agreement should also give the or-ganization priority status for the shipment ofreplacement equipment over equipment beingpurchased for normal operations. SLAs shouldfurther discuss what priority status the organi-zation will receive in the event of a catastrophicdisaster involving multiple vendor clients. Insuch cases, organizations with health- and safety-
dependent processes will often receive the highestpriority for shipment. The details of these negoti-ations should be documented in the SLA, whichshould be maintained with the contingency plan.
2. Equipment inventory. Required equipment maybe purchased in advance and stored at a secureoffsite location, such as an alternative site whererecovery operations will take place (warm or mo-bile site) or at another location where they will bestored and then shipped to the alternative site.This solution has certain drawbacks, however.An organization must commit financial resourcesto purchase this equipment in advance, and theequipment could become obsolete or unsuitablefor use over time because system technologies andrequirements change.
3. Existing compatible equipment. Equipment cur-rently housed and used by the contracted hot siteor by another organization within the agency maybe used by the organization. Agreements madewith hot sites and reciprocal internal sites stipu-late that similar and compatible equipment will beavailable for contingency use by the organization.
When evaluating the choices, the ContingencyPlanning Coordinator should consider that purchas-ing equipment when needed is cost-effective butcan add significant overhead time to recovery whilewaiting for shipment and setup; conversely, storingunused equipment is costly but allows recovery op-erations to begin more quickly. Based on impactsdiscovered through the BIA, consideration shouldbe given to the possibility of a widespread disasterrequiring mass equipment replacement and trans-portation delays that would extend the recovery pe-riod. Regardless of the strategy selected, detailedlists of equipment needs and specifications shouldbe maintained within the contingency plan.
The recovery strategy requires personnel to imple-ment the procedures and test operability. Generally, amember of the organization’s senior leadership is se-lected to activate the plan and lead overall recoveryoperations. Appropriate teams of personnel (at leasttwo people to ensure there is a primary and alterna-tive available to execute procedures) are identifiedto be responsible for specific aspects of the plan.
Personnel should be chosen to staff the teams basedon their normal responsibilities, system knowledge,and availability to recover the system on an on-callbasis. A line of succession should be defined to en-sure that someone can assume the role of senior lead-ership if the plan leader is unable to respond.

JWBT150-Vallabhaneni c08 July 29, 2009 10:50
206 Learning Module 8: Information Technology
Having selected choices for each component of therecovery strategy, the final consideration should begiven to cost. The recovery strategy must meet crit-icality, availability, and RTO requirements while re-maining within budget. Less obvious costs—such asshipping, awareness programs, tests and exercises,travel, labor hours, and contracted services—mustalso be incorporated into the evaluation.
Step 5: Develop Contingency PlanProcedures for executing the recovery strategy areoutlined in the contingency plan. The plan mustbe written in a format that will provide the users(recovery team leadership and members) with thecontext in which the plan is to be implemented andthe direct procedures, based on role, to execute.
The procedures are documented in the notifica-tion/activation phase, recovery phase, and recon-stitution phase components of the plan. The sup-porting information and appendices componentsprovide supplemental information necessary to un-derstand the context in which the plan is to be usedand give additional information that may be neces-sary to execute procedures (e.g., emergency contactinformation and the BIA).
Step 6: Plan Testing, Training,and ExercisesOrganizations should maintain their IT plans so thatthey will be prepared to manage and recover fromadverse events that could disrupt their operations.Computer contingency and computer-security inci-dent response plans, which are part of an organiza-tion’s IT planning framework, are examples of plansthat address recovery from adverse events (NISTSP 800-84).
It is recommended that organizations should de-velop test, training, and exercise (TT&E) programsthat combine training, exercise, and testing activi-ties. These activities are closely related but offer dif-ferent ways of identifying problems with IT plansand procedures. The TT&E program should includea TT&E plan, policy, event methodology, and pro-cedures. It should address resource and budget re-quirements and provide a schedule for conduct-ing types of TT&E events. The TT&E plan shoulddocument the projected schedule of activities to beperformed within the TT&E program. TT&E eventsshould be conducted periodically, following organi-
zational changes, updates to an IT plan, or the is-suance of new TT&E guidance. TT&E events shouldbe conducted as needed, and organizations shouldevaluate the required frequency of their events anddocument the frequency of each event in a TT&Eschedule. The TT&E program should include severaltypes of events to ensure the availability of a widerange of methods for validating various planningelements in the context of cyber-attacks or incidents.
A TT&E program contributes to the effectivemaintenance of all IT plans through the followingactivities.
TestsThese are evaluation tools that use quantifiable met-rics to validate the operability of a system or sys-tem components in an operational environment asspecified in an IT plan. Tests could include activitiessuch as checking whether call tree cascades can beexecuted within prescribed time limits or removingpower from a system or system component. Quan-tifiable metrics can be collected when these activitiesare performed. The organization should develop atest plan to identify the systems or components tobe tested and the overall test objectives. Test resultscould indicate problems in personnel training or inIT plans and procedures, and systems/componentsmalfunctioning or becoming inoperable. Tests oftenfocus on recovery and backup operations; however,testing can be conducted to accomplish other goals,depending on the specific IT plans.
Plan testing should include:
� Notification procedures� System recovery on an alternative platform from
backup media� System performance using alternative equipment� Coordination among recovery teams� Restoration of normal operations� Internal and external connectivity
TrainingThis includes advising personnel of their roles andresponsibilities within a particular IT plan, such asdecision making, and teaching them skills related tothose roles and responsibilities. These training activ-ities prepare staff members for participation in exer-cises, tests, and actual emergency situations relatedto the IT plan. Staff members are trained on theirroles and responsibilities before an exercise or testevent. Discussions at these training events enable

JWBT150-Vallabhaneni c08 July 29, 2009 10:50
LEARNING OBJECTIVE 8.5: UNDERSTAND HOW INFORMATION TECHNOLOGY OPERATIONS ARE MANAGED 207
staff members to demonstrate their understandingof the subject matter.
Personnel training should include:
� Purpose of the plan� Cross-team coordination and communication� Reporting procedures� Security requirements� Team-specific processes� Individual responsibilities
ExercisesExercises are simulations of an emergency designedto validate the viability of one or more aspects of anIT plan. Exercises help to identify gaps and incon-sistencies within IT plans and procedures, as wellas cases where personnel need additional trainingor when training needs to be changed. In an exer-cise, personnel with roles and responsibilities in aparticular IT plan meet to validate the content of aplan through discussion of their roles and their re-sponses to emergency situations. The responses maybe executed in a simulated operational environmentor through other means of validating responses thatdo not involve using the actual operational envi-ronment for deployment of personnel. Exercises arescenario driven; for example, an exercise might beconcerned with a power failure in one of the orga-nization’s data centers or a fire that causes certainsystems to be damaged.
Two types of exercises are tabletop and functional:
1. Tabletop exercises are discussion-based exercisesenabling personnel to meet in a classroom settingor in breakout groups to discuss their roles dur-ing an emergency and their responses to a partic-ular emergency situation. A facilitator presents ascenario and asks the exercise participants ques-tions related to the scenario. The questions initi-ate discussion among the participants of roles, re-sponsibilities, coordination, and decision making.A tabletop exercise is discussion based only anddoes not involve deploying equipment or otherresources.
2. Functional exercises allow personnel to validatetheir operational readiness for emergencies in asimulated operational environment. Functionalexercises are designed to exercise the roles andresponsibilities of specific team members, proce-dures, and assets involved in one or more func-tional aspects of an IT plan, such as communica-tions, emergency notifications, or IT equipment
setup. Functional exercises vary in complexityand scope and range from validation of specificaspects of a plan to full-scale exercises that ad-dress all plan elements. Functional exercises allowstaff members to execute their roles and respon-sibilities as they would in an actual emergencysituation but in a simulated manner.
Step 7: Plan MaintenanceThe IT contingency plan must always be maintainedin a ready state for use immediately upon notifi-cation. Periodic reviews of the plan must be con-ducted for currency of key personnel and vendorinformation, system components and dependencies,the recovery strategy, vital records, and operationalrequirements. While some changes may be obvious(e.g., personnel turnover or vendor changes), otherswill require analysis. The BIA should be reviewedperiodically and updated with new information toidentify new contingency requirements and priori-ties. Changes made to the plan are noted in a recordof changes, dated, and signed or initialed by the per-son making the change. The revised plan (or plansections) is circulated to those with plan responsibil-ities. Because of the impact that plan changes mayhave on interdependent business processes or infor-mation systems, the changes must be clearly com-municated and properly annotated in the beginningof the document.
❑ Learning Objective 8.5:UNDERSTAND HOWINFORMATION TECHNOLOGYOPERATIONS ARE MANAGEDThe scope of IT operations includes computer op-erating environment, computer operations, changeand problem management, service-level manage-ment, and separation of duties. The goals of the IT(data center) operations management should be to:
� Stabilize the production environment and limitnegative impact (e.g., system outages, errors, back-outs, and downtime) due to changes or problems.
� Maintain the integrity and security of all programmodules, hardware devices, and network compo-nents within the production environment.
� Prioritize those changes that are critical to businessfunction versus those changes that can be deferred.

JWBT150-Vallabhaneni c08 July 29, 2009 10:50
208 Learning Module 8: Information Technology
� Coordinate all problems and changes in a con-trolled and coordinated manner.
� Promote a proactive mode of computer operationsinstead of a reactive one.
The scope of computer operating environment in-cludes data control procedures, production controlprocedures, job scheduling practices, and produc-tion job turnover procedures.
Data Control (Input and Output)ProceduresThe data control or production control function is thefirst line of defense in the computer center againstpossible delays, errors, omissions, and irregularities.This is due to the fact that many front-end activitiessuch as data entry, job setup, and job scheduling areperformed prior to executing production jobs for ap-plication systems. The things that data/productioncontrol staff do and how well they do them willhave a great impact on subsequent activities such ascomputer operations, backup and recovery, storagemedia management, help-desk, and report delivery.Consequently, there are many potential risks andexposures in the data control/production controlwork area.
Production Control (Program Execution)ProceduresProduction control activities include scheduling ofjobs and controlling production job turnover proce-dures, among other things. Some typical activities ofa computer operator include execution of productionjobs and programs; monitoring of system resourcesincluding computer consoles, hardware preventivemaintenance, and operational changes; backing upof program and data files; mounting/unmounting oftapes, cartridges, and disks; recording of operationalproblems; monitoring of physical security and envi-ronmental controls; and housekeeping activities andlogging of system activities.
Job Scheduling PracticesThe operations manager has a difficult task in balanc-ing between a certain amount of scheduling work todo and a certain amount of resources with which todo it. Consequently, work must be prioritized basedon user business needs. In this regard, the most im-portant considerations are peripheral devices (e.g.,
tape or disk drives) required, job execution time, andmemory required. The least important considerationis how the operator interacts with the user. Most pro-duction jobs will have a predecessor and successorjob to be run.
Usually, when a new application system is be-ing developed, runtimes and other resource require-ments (e.g., disk and memory space) are estimatedfor each job by the system development group. Op-erations management then determines how best toaccommodate these requirements in light of otherjob needs.
Production Job Turnover ProceduresProduction problems stem from hardware failures(10%), systems software failures (20%), and applica-tions software failures (70%).
Applications software failures are usually the re-sult of problems originating in or unaddressed bythe applications software development and mainte-nance work area. The most prevalent causes of thosefailures are:
� Incomplete software testing by programmers andfunctional end users for new application systemsdevelopment work
� Inappropriate software regression testing by pro-grammers for existing application systems main-tenance work
� Inappropriate changes made in common programmodules such as copy and macros
� Unreliable paper records and manual proceduresin the user and IT departments
� Lack of production/operation acceptance testingby computer operations staff
� Lack of or inadequate quality assurance review byproduction scheduling and control staff
� Overall poor-quality job turnover procedures� Inexperienced programmers, production control
analysts, and computer operators
Some ways to reduce or eliminate the businessrisk are to automate the production turnover pro-cess and to focus on software configuration man-agement. Online approvals and automatic transferof programs from test to production via qualityassurance (QA) libraries or from test to produc-tion directly will dominate the automation process.A QA library is a staging library where final qual-ity reviews and production setup procedures takeplace. Software configuration management helps in

JWBT150-Vallabhaneni c08 July 29, 2009 10:50
LEARNING OBJECTIVE 8.5: UNDERSTAND HOW INFORMATION TECHNOLOGY OPERATIONS ARE MANAGED 209
identifying the locations and the number of com-puter machines and in determining the networksthat need to be propagated with new or changedsoftware (see the figure).
Test library Production libraryQA library
Development
Maintenance
Testing
IS operations reviews
Training
IS support group reviews
Production setupprocedures
Official programs
Official data
Processing of daily business transactions
•
•
•
•
•
•
•
•
• •
The scope of computer operations includes con-sole operations, system backups, preventive mainte-nance, system logs, and help-desk function, whichconstitute a major responsibility of a computeroperator.
Console OperationsAn important task for the computer operator is op-erating the system console. The operating systemsends questions and messages to the operator fora response. It is estimated that 90 percent or moreof these messages are trivial in nature and do notrequire the operator’s attention. Yet, they consumevaluable operator time and cause frustration to theoperator due to their speed in presentation. Soft-ware is available to automate console operationsand to suppress trivial messages so that the op-erator responds only to important questions andmessages.
Computer operators should have access to systemconsole and operator manuals, not program docu-mentation. They should not perform run-to-run bal-ancing procedures. The console log should containoperator commands, operator messages, and systemabends, not data entry errors.
System BackupsHardware failures, disk crashes, power outages, soft-ware failures, and other disruptions are normal incomputer center operation. Periodic system backupswould provide the ability to recover and restart froma failure or disaster and prevent the destruction ofinformation. System backups include backing up of op-erational application programs, data files, databases, sys-tems software products, system development programs,utility programs, and others.
Timely system backups help in reconstructing anydamaged files (recovery) and resuming computerprogram execution (restart). For example, online
and real-time systems and database systems requireduplicate backup arrangements and extensivebackup and recovery and restart procedures.
For online systems, restart procedures identifytransactions that were lost when the online processfailed. Another related backup mechanism is check-points, which allow program restarts. Checkpointswould be most effective for batch (sequential pro-cessing) online data entry and batch update pro-cessing and multiprogramming and least effectivefor online real-time systems due to their instant ac-cess and updates. Checkpoints are needed to recoverfrom hardware failures and are usually applicable tosequential files, direct (random) access files, and tapeor disk files (see the figure).
Online and database systems
Batch systems
Require stringent backup procedures
Have short backup intervals
More damage can be done quickly due to errors
Highly technical and complex
•
•
••
Require normal procedures
Have long backup intervals
Less damage due to errors
Less technical and simple
•
•
•
•
A prerequisite to the performance of timely systembackups is the availability of accurate and up-to-date operations documentation (run books), whichincludes runtime instructions, backup schedules,and recovery/restart procedures for each applica-tion system in the production environment. Thedecision regarding how often to back up a file isdependent on cost of backup versus expected costof failure, capability of recreating the file without abackup, and time needed to create a copy.
System backup alternatives include full-volumebackups and incremental backups.
Full-volume backups, which are common, involvecompressing the image copy of an entire magneticdisk volume to a tape/cartridge. This is also knownas the brute-force approach since it takes copies ofall files regardless of the need or file changes. It takesless time to back up and is less error-prone but re-quires more magnetic media to store and more man-ual intervention.
This method is most applicable to database pro-grams and data files due to the logical relationshipsbetween data. System recovery is achieved by restor-ing the database and reapplying transactions fromthe journal or log. Journals and logs are records of

JWBT150-Vallabhaneni c08 July 29, 2009 10:50
210 Learning Module 8: Information Technology
all the transactions that have been processed againsta database. The log contains before-and-after im-ages of transactions for all changes. In the eventof a failure, the database is restored, and all thechanges that have occurred up to the point of fail-ure are reapplied to the database. Some databasesare so large that record-level backup is performedwhenever a change to the logical database recordoccurs.
Incremental backups, a new approach, focus onlyon backing up datasets that have changed since thelast full backup. The need for continuous, uninter-rupted online system availability leaves a reducedtime-window for full backups, which in turn justi-fies the use of incremental backups.
Usually, tape files are backed up using a three-generation (son, father, and grandfather) concept,where each generation represents a time period (e.g.,seven or five operating days). Disk files are savedfor five or seven generations. Each generation canhave multiple copies and be rotated between on-site and offsite. Tape files are a major obstacle tounattended computer center operation due to theirlabor-intensive nature.
Preventive MaintenanceThe regular practice of preventive maintenance ofcomputer equipment and other system componentswill provide the assurance of continuity of comput-ing services to end users. Here, computer equipmentincludes CPU, printers, terminals, and disk/tapedrives; other system components include physi-cal channels, control units, cables, air-conditioningunits, uninterrupted power supply machines, andother mechanical/electrical devices.
The operations manager first needs to analyze thefailure rates for each piece of computer equipmentand system component parts. After knowing the fail-ure rates, the manager should determine the impactof failing equipment or a component on the comple-tion of the application system production job sched-ule. Component failure rates and impact analysiswill allow the manager to shift the processing sched-ules either manually or automatically to balance theworkload. Mean time between failures should be de-termined for each piece of computer equipment andthe system components.
The output of component failure rates and impactanalysis can be used to establish system availabil-ity objectives and service levels between hardware
vendors and computer operations management.Some examples of system availability objectivesinclude:
� The CPU should be available for 99 percent of allscheduled production time.
� Disk/tape drives should be available for 98 percentof scheduled time.
� Terminals and printers should be available 95 per-cent of the time.
A preventive maintenance log would help the op-erations manager and the hardware vendor in track-ing problems. The log can be maintained by com-puter operators or supervisors.
System LogsAnother important task performed by computer op-erations staff is logging and monitoring various sys-tems activities. A transaction log is a processing con-trol, provides an audit trail, and is good for onlinesystems. It is useful for file reconstruction and errortracing if errors occur in updating online files.
Help-Desk FunctionIn order to provide quality and timely support andservice to end users, many computer centers are es-tablishing an end-user support function. This in-cludes an information center, help-desk, 24-hourhotline services, telephone voice response system,and automated problem and change managementsystems.
A help-desk function can implement telephonehotline services so that end users can call in withtheir problems and ask pertinent questions. Theseproblems could be related to problems as diverse asprinter/terminal operations, operating system mal-functions, telecommunications software incompati-bilities, or applications software glitches. The help-desk person will try to solve a problem; if he cannot,he will hopefully route the problem to the right per-son. Problem logging, routing, and escalation pro-cedures are needed to resolve problems in a timelyand proper manner.
Recent innovations such as voice response systemscould supplement the help desk function in termsof directing the end user to the appropriate person.Other developments include the implementation ofexpert systems that aid the help-desk staff in termsof problem diagnosis and resolution.
JWBT150-Vallabhaneni c08 July 29, 2009 10:50
LEARNING OBJECTIVE 8.6: UNDERSTAND THE TECHNOLOGY BEHIND COMPUTER NETWORK MANAGEMENT 211
Installation of a change and problem manage-ment system or service is another end-user ser-vice and support tool where problems and changesare logged, tracked, reported, resolved, and imple-mented.
Often, incorrectly implemented changes causeproblems. There should be a cross-reference betweena change and a problem caused by a change. Tosome extent, integrity, liability, and availability ofcomputer systems depend on the way the problemsand changes are managed, controlled, and secured.Problem management is critical to online process-ing due to high visibility of problems to end users.Changes can be classified into standard change re-quests, mandatory change requests, and emergencychange requests so that priorities can be establishedand resources can be allocated accordingly.
Service-level management is a better way for com-puter center management to improve quality of com-puting services to system users. Computer centermanagement must define a set of user service lev-els or service objectives that describe applicationsystems, volume of transactions, processing win-dows, online system response times, and batch jobturnaround times. Without defined service levels tomonitor against actual performance determined inthe resource utilization function, a computer sys-tem’s capacity limit is difficult to identify. Withoutservice levels, the computer center management willconsider that the capacity of a computer is near itslimits when the users begin to complain about com-puter performance.
By monitoring performance against service levels,the computer center management can identify ap-proaching problems in meeting service objectives. Inorder to achieve these goals, computer center man-agement needs to develop service-level objectivesfor internal use.
It is important to remember that these service-levelagreements are not static. They require adjustmentsand refinements periodically, such as at least once ayear or preferably at the time of renegotiation of theagreement with customers (users).
The objective of separation of duties is to en-sure that no one person has complete control over atransaction throughout its initiation, authorization,recording, processing, and reporting. The rationaleis to minimize the incompatible functions, whichare not conducive to good internal control structure,and to prevent and detect irregular activities such asfraud.
❑ Learning Objective 8.6:UNDERSTAND THETECHNOLOGY BEHINDCOMPUTER NETWORKMANAGEMENTComputers operating on different vendor hardwareand software platforms at various locations are con-nected through networks to facilitate data transfersand voice communications. Examples of connectiv-ity hardware include protocol converters, gateways,backbones, bridges, routers, brouters, repeaters, con-centrators, switches, and network interface cards.These complex networks need to be managed dueto their constant changes to ensure interoperability,flexibility, integrity, and reliability.
Computer Network TypesThere are at least nine types of computer networksavailable today:
1. Local-area networks. Local-area networks(LANs) connect computers with other comput-ers, peripherals (e.g., printers), and workstationsthat are fairly close in proximity. It is a type ofnetwork that is used to support interconnectionswithin a building or set of buildings (e.g., acampus).
Wireless LANs provide a hand-held spread-spectrum workstation for temporary situations orout-of-office environments. These LANs transferfiles, provide electronic mail, and offer other dataservices. Each wireless LAN unit contains a radiotransceiver, processor, and memory. Interferenceis possible even with wireless LANs. Transmis-sion is affected by thick concrete walls and metalfixtures but is not affected by office partitions andnormal wooden walls. A risk in wireless LAN isthat anyone with the appropriate receiver devicecan capture the signal transmitted from one unitto another.
2. Metropolitan-area networks. Metropolitan-areanetworks (MANs) link an organization’s factoryor office buildings within a small geographic areasuch as a town or a city. MANs cover a distanceup to 50 km (30 miles) and fill the technical oroperational gap between WANs and LANs.
3. Wide-area networks. A wide-area network(WAN) is a network that interconnects systemslocated in a large geographic area, such as a city,

JWBT150-Vallabhaneni c08 July 29, 2009 10:50
212 Learning Module 8: Information Technology
a continent, or several continents. A complex net-work can consist of WANs that span continents orgeographic regions within continents and connectsmaller, more localized LANs or MANs. WANsprovide system users with access to any con-nected computer for fast interchange of informa-tion among the users of the network.
WANs connect intelligent terminals, worksta-tions, personal computers, minicomputers, main-frame computers, LANs, and MANs. They usepublic telecommunication facilities to accomplishthis connection. For example, a WAN data-linkinterconnection can be used to connect two ormore physical LANs in different geographic lo-cations. Devices that are available for network in-terconnection include bridges, repeaters, routers,switches, front-end processors, communicationcontrollers, and protocol converters.
Connections among LANs, MANs, and WANs
A LAN can be connected to a WAN. A WAN canbe used as an intermediary to interconnect twoseparate LANs. A WAN can be used to geograph-ically disperse subnetworks, some of which can beLANs and others MANs. LANs can be intercon-nected directly or through higher-level MANs orWANs. MANs can be used to interconnect groupsof LANs.
4. Virtual private networks. A virtual private net-work (VPN) is a private network composed ofcomputers owned by a single organization thatshare information with each other in that orga-nization (e.g., LAN or WAN). However, a publicnetwork is a large collection of organizations orcomputers that exchange information with eachother (e.g., a public telephone system and the In-ternet).
A VPN blurs the line between a private andpublic network. With a VPN, a secure, private net-work can be created over a public network suchas the Internet. A VPN can be created using soft-ware, hardware, or a combination of the two thatprovides a secure link between peers over a pub-lic network. Control techniques such as encryp-tion, packet tunneling, and firewalls are used ina VPN. Tunneling encapsulates a packet withina packet to accommodate incompatible protocols.The packet within the packet could be either of thesame protocol or of a completely different one.
The private network is called “virtual” becauseit uses temporary connections that have no realphysical presence, but consist of packets routedover various computers on the Internet on anad hoc basis. Secure virtual connections are cre-ated between two computers, a computer and anetwork, or two networks. A VPN does not phys-ically exist.
5. Value-added networks. Value-added network(VAN) vendors operate in a secondary networkmarket. They lease communication facilities fromprimary common carriers. They add equipmentsuch as multiplexors and computers and providetime-sharing, routing, and information exchangeservices. A packet-switched network is an exam-ple of a VAN.
Value-added carriers lease channels from othercommon carriers and then provide additional ser-vices to customers, using these leased channels.They operate a public data network, where theequipment breaks up the user’s data into packets,routes the packets over its network between onelocation and another, and reassembles them intotheir original form on the other end. Value-addednetworks take advantage of economies of scale.Usually, they share a wider bandwidth, whichgives faster response time. Some examples of ser-vices provided by VANs include bulletin boardservices, Internet, electronic data interchange, anddial-in services.
Differences among WANs, LANs, MANs,and VANs
WANs, used across geographic locations, are usu-ally static in nature in that changes to themmean that maintenance crews have to go out andclimb telephone poles, reroute lines, install newmodems, and the like. But LAN topologies, usedacross and within buildings, are reconfigured inreal time (i.e., lines go up and down more easily,gateways to host computers are installed often,system users change frequently, and departmentsreroute cables frequently).
The dynamic nature of LANs require the pres-ence and use of high-level protocol analyzers,problem diagnostic tools, testing instruments,and network monitoring software to recognizepotential problems before they become failures.This approach eliminates or reduces the need for
JWBT150-Vallabhaneni c08 July 29, 2009 10:50
LEARNING OBJECTIVE 8.6: UNDERSTAND THE TECHNOLOGY BEHIND COMPUTER NETWORK MANAGEMENT 213
trial-and-error practice. For WANs, there is not yetmuch testing equipment available in the way ofcontrol logic, recovery, or repairs.
MANs are aimed at consolidating business op-erations spread out in a town or city. MANs fillthe gap between LANs and WANs.
VANs provide networking and computing ser-vices between user organization computers andthird-party service organizations (e.g., EDI).
6. Virtual networks. Long-distance telephone car-riers are offering virtual network (VN) services,controlled by software, as a good intermediatestep between private networks and dialup access.The benefits of VN are that it allows carriers toroute more traffic over existing facilities, offer vol-ume discounts, support ISDN, and control remoteaccess.
7. Multicorporate networks. Certain kinds of or-ganizations operating in specific industries, suchas banks and airlines, have developed their ownnetworks to tie computers in multiple separateorganizations. Examples include SITA networkfor passing messages between airline comput-ers around the world and SWIFT network fortransferring electronic funds between banks. TheSWIFT system uses a message-switching net-work. Transactions can be entered into the systemregardless of whether the recipient bank’s termi-nals are busy.
8. Integrated services digital networks. An inte-grated services digital network (ISDN) may bedefined as an end-to-end digital network that pro-vides customer services using existing subscriberloops. It allows integrated access to voice and dataservices including video and other types of ser-vices by using circuit- and/or packet-switchingservices.
The main feature of ISDN is the provisionof a wide range of service capabilities with thepromise of great potential in future applications.ISDN is intended to provide easier access both toknowledge and to distributed processing, includ-ing better customer service applications. ISDNoperates in a multivendor environment.
9. Voice communication networks. Voice-over-Internet Protocol (VoIP)—the transmission ofvoice over packet-switched IP networks—is oneof the most important emerging trends in telecom-munications. As with many new technologies,VoIP introduces both security risks and oppor-
tunities. Lower cost and greater flexibility areamong the promises of VoIP for the enterprise,but the technology presents security administra-tors with significant security challenges. Admin-istrators may mistakenly assume that some dig-itized voice travels in packets; they can simplyplug VoIP components into their already-securenetworks and remain secure. Unfortunately, theprocess is not that simple.
VoIP systems take a wide variety of forms, in-cluding traditional telephone handsets, conferenc-ing units, and mobile units. In addition to end-userequipment, VoIP systems include a variety of othercomponents, including call processors/call man-agers, gateways, routers, firewalls, and protocols.Most of these components have counterparts usedin data networks, but the performance demands ofVoIP mean that ordinary network software and hard-ware must be supplemented with special VoIP com-ponents. Not only does VoIP require higher perfor-mance than most data systems; critical services suchas Emergency 911 (E-911) must be accommodated.One of the main sources of confusion for those newto VoIP is the (natural) assumption that because dig-itized voice travels in packets just like other data,existing network architectures and tools can be usedwithout change. Unfortunately, VoIP adds a numberof complications to existing network technology, andthese problems are magnified by security consider-ations.
Quality of service (QoS) is fundamental to the op-eration of a VoIP network that meets users’ qual-ity expectations. Unfortunately, the implementationof various security measures can cause a markeddeterioration in QoS. These complications rangefrom firewalls delaying or blocking call setups toencryption-produced latency and delay variation(jitter). Because of the time-critical nature of VoIPand its low tolerance for disruption and packet loss,many security measures implemented in traditionaldata networks are simply not applicable to VoIP intheir current form. Current VoIP systems use either aproprietary protocol or one of two standards, H.323or the Session Initiation Protocol (SIP). Although SIPseems to be gaining in popularity, neither of theseprotocols has become dominant in the market yet,so it often makes sense to incorporate componentsthat can support both. An extension of SIP, the SIPfor Instant Messaging and Presence Leverage Ex-tensions (SIMPLE) standards, is being incorporatedinto products that support instant messaging. In

JWBT150-Vallabhaneni c08 July 29, 2009 10:50
214 Learning Module 8: Information Technology
addition to H.323 and SIP, there are two other stan-dards, Media Gateway Control Protocol (MGCP)and Megaco/H.248, which may be used in large de-ployments for gateway decomposition. These stan-dards may be used to ensure message handling withmedia gateways, or they can be easily used to im-plement terminals without any intelligence, similarto today’s phones connected to a private branch ex-change (PBX) system, utilizing a stimulus protocol.Until a truly dominant standard emerges, organiza-tions moving to VoIP should consider gateways andother network elements that support both H.323 andSIP. Such a strategy helps to ensure a stable and ro-bust VoIP network in the years to come, no matterwhich protocol prevails.
Firewalls are a staple of security in today’s IP net-works. Whether protecting a LAN or WAN, encap-sulating a demilitarized zone (DMZ) or just protect-ing a single computer, a firewall is usually the firstline of defense against would-be attackers. Firewallswork by blocking traffic deemed to be invasive, in-trusive, or just plain malicious from flowing throughthem. Acceptable traffic is determined by a set ofrules programmed into the firewall by the networkadministrator. The introduction of firewalls to theVoIP network complicates several aspects of VoIP,most notably dynamic port trafficking and call-setupprocedures.
Network address translation (NAT) is a powerfultool that can be used to provide security and enableseveral endpoints within a LAN to share the sameIP address. The benefits of NATs come at a price. Forone thing, an attempt to make a call into the networkbecomes very complex when a NAT is introduced.The situation is analogous to a phone network whereseveral phones have the same phone number (e.g., ahouse with multiple phones on one line). There arealso several issues associated with the transmissionof voice data across the NAT, including an incom-patibility with IPsec protocol.
Firewalls, gateways, and other such devices canalso help keep intruders from compromising a net-work. However, firewalls are no defense against aninternal hacker. Another layer of defense is neces-sary at the protocol level to protect the data. In VoIP,as in data networks, this can be accomplished by en-crypting the packets at the IP level using IPsec orat the transport level with secure remote transportprotocol (RTP). However, several factors, includingthe expansion of packet size, ciphering latency, anda lack of QoS urgency in the cryptographic engineitself can cause an excessive amount of latency in the
VoIP packet delivery. This leads to degraded voicequality, again highlighting the trade-off between se-curity and voice quality, and emphasizing a need forspeed.
Designing, deploying, and securely operating aVoIP network is a complex effort that requires care-ful preparation. The integration of a VoIP system intoan already-congested or overburdened data networkcould be problematic for an organization’s technol-ogy infrastructure. An organization must investigatecarefully how its network is laid out and which so-lution best fits its needs.
Connectivity HardwareNetworks are connected through various hardwaredevices such as protocol converters, gateways, back-bones, bridges, routers, brouters, repeaters, concen-trators, switches, and network interface cards.
Protocol ConvertersProtocol converters are devices that change one typeof coded data to another type of coded data for com-puter processing. Conversion facilities allow an ap-plication system conforming to one network archi-tecture to communicate with an application systemconforming to some other network architecture.
GatewaysGateways are used to interconnect dissimilar net-work architectures from competing computer net-work manufacturers. They are also used to connectLANs to host computers.
The integration of WANs, MANs, VANs, LANs,and private branch exchange (PBX) to the back-bone network is becoming an absolute requirement.Modern networks can be interconnected throughgateways. Typically, gateways are located betweenthe backbone network and other subnetworks (e.g.,WANs and LANs).
A gateway, a hardware device, is an example of aprotocol converter and performs three major func-tions: message format conversion, address transla-tion, and protocol conversion.
A gateway translates the address and documentcontent to conform to the standards of the receiv-ing environment. In other words, gateways act astranslators between networks using incompatibletransport protocols. A gateway is used to intercon-nect networks that may have different architectures.

JWBT150-Vallabhaneni c08 July 29, 2009 10:50
LEARNING OBJECTIVE 8.6: UNDERSTAND THE TECHNOLOGY BEHIND COMPUTER NETWORK MANAGEMENT 215
Gateways offer the greatest flexibility in networkinterconnections. The gateway’s job is to receive amessage and translate it into a form that the nextmessage-handling service can understand. The gate-way can be a potential bottleneck, considering thenumber of stations to handle and the amount oftraffic going through the gateway. To overcome per-formance limitations, an organization might needmore than one gateway, which in turn complicatesthe station software. There are trade-offs associatedwith gateways. On extended LANs and networks,they can introduce substantial packet-queuing de-lays, which could be longer than in either a bridgeor router. This is due to traffic passing up one pro-tocol stack and out another. Simple checksums arecalculated at each gateway to ensure data integrity.
BackboneA backbone network is a central network to whichother networks connect. Users are not attached di-rectly to the backbone network; they are connectedto the access networks, which in turn connect to thebackbone. A backbone network provides connectionbetween LANs and WANs. Dumb terminals can beattached directly to the backbone through terminalservers.
The backbone network is a high-speed connec-tion within a network that connects shorter, usuallyslower circuits. It is also used in reference to a systemthat acts as a hub for activity, but that is no longercommon.
Bridges and RoutersBridges and routers are lower-level network inter-connection devices. Typically network interconnec-tion strategies will involve some combination ofbridges and routers. The decision about when to usea bridge and when to use a router is a difficult one.
A bridge is a device that connects similar or dis-similar LANs together to form an extended LAN.It can also connect LANs and WANs. Bridges areprotocol-independent devices and are designed tostore and then forward frames destined for anotherLAN. Bridges are transparent to the end-stations thatare connecting through the bridge. Bridges can re-duce total traffic on the extended LAN by filteringunnecessary traffic from the overall network.
Routers offer a complex form of interconnectivity.The router keeps a record of node addresses andcurrent network status. Routers are known to the
end-stations as they are device dependent. LANsconnect personal computers, terminals, printers, andplotters within a limited geographic area. An ex-tended LAN is achieved through the use of bridgesand routers. In other words, the capabilities of asingle LAN are extended by connecting LANs atdistant locations.
Routers convert between different data-link pro-tocols and resegment transport-level protocol dataunits (PDUs) as necessary to accomplish this. ThesePDUs are reassembled by the destination end-pointtransport protocol entity.
There are several routing protocols in common use.Routers must have more detailed knowledge thanbridges about the protocols that are used to carrymessages through internetwork. The following is acomparison between bridges and routers:
� Bridges are generally considered to be fasterthan routers since the processing they perform issimpler.
� Routers are limited to particular routing protocols,whereas bridges may be transparent to most rout-ing protocols.
� Bridging protocols are semiautomatic. Routers areautomatic and depend on routing tables, whichtypically must be maintained.
� Bridge protocols limit the size of any extendedLAN network, whereas routers do not.
� Routers are used to connect LANs and WANs.
BroutersBrouters are routers that can also bridge; they routeone or more protocols and bridge all other net-work traffic. Routing bridges are those capable ofmaintaining the protocol transparency of a standardbridge while also making intelligent path selections,just like a router. Brouters merge the capabilities ofbridges and routers into a single, multifunctionaldevice.
Brouters = Bridges + Routers
RepeatersRepeaters offer the simplest form of interconnectiv-ity. They merely generate or repeat data packets orelectrical signals between cable segments. Repeatersperform data insertion and reception functions. Theyreceive a message and then retransmit it, regenerat-ing the signal at its original strength. In their purestform, repeaters physically extend a network. Theyalso provide a level of fault tolerance by isolating

JWBT150-Vallabhaneni c08 July 29, 2009 10:50
216 Learning Module 8: Information Technology
networks electrically, so problems on one cable seg-ment do not affect other segments. However, re-peaters exert stress on a network’s bandwidth due todifficulty in isolating network traffic. Repeaters areindependent of protocols and media.
ConcentratorsThe major function of concentrators is to gather to-gether several lines in one central location. Concen-trators are the foundation of a fiber distributed datainterface (FDDI) network and are attached directlyto the FDDI dual ring. Concentrators provide highlyfault-tolerant connections to the FDDI rings.
The concentrator allows stations to be inserted andremoved with minimal effect on the operation of thering. One of the functions of the concentrator is toensure ports (stations) are automatically bypassedin response to a detected fault connection or a higherror rate or when a user powers down the station.This bypass function of the concentrator enhancesthe reliability of the FDDI ring.
SwitchesBridges and repeaters share the same physical trans-mission medium to interconnect or extend a LAN.Switches and hardware devices are designed for theopposite purpose to that of bridges and repeaters.Switches, in the form of routers, interconnect whenthe systems forming one workgroup are physicallyseparated from the systems forming other work-groups. Switches do not extend LANs as bridgesand repeaters do. Switches are primarily used toimplement multiple parallel transmission-mediumsegments to which different groups of workstationscan be connected and to provide full network band-width to multiple groups of systems.
In a switched network, connections are estab-lished by closing switches through dialing. Ethernetswitches establish a data link in which a circuit or achannel is connected to an Ethernet network.
Network Interface CardsNetwork interface cards (NICs) are circuit boardsused to transmit and receive commands and mes-sages between a PC and a LAN. When the networkinterface card fails, workstations and file serversalso fail. Network adapters establish a connectionto other computers or peripherals, such as a printerin the network. Network adapters function similarlyto NICs.
Network management, changes, interoperability,and architecture are discussed next.
Network ManagementNetwork management deals with six categories:
1. Network architecture specifies network manage-ment functions that are essential building ele-ments for a network management system froman architectural point of view.
2. Configuration management is concerned with ini-tializing a network and gracefully shutting downpart of or entire network.
3. Fault management encompasses fault detection,isolation, and the correction of abnormal opera-tions.
4. Security management supports the application ofsecurity policies.
5. Performance management allows evaluation ofthe behavior of resources in the open system andof the effectiveness of communication activities.
6. Accounting management enables charges to beestablished for the use of resources in the opensystem and costs to be identified for the use ofthose resources.
Network ChangesNetwork changes are many and common in anycomputer center. Unauthorized, incomplete, or in-correct network changes can have an adverse effecton a computer center’s security, integrity, and oper-ations. Adequate and timely procedures are neededto define clearly who should do what, when, andhow. The following are some examples of networkchanges:� Adding, changing, or deleting a user’s access to
computer systems and data files (e.g., applica-tion systems, databases, electronic mail, utility pro-grams)
� Adding, changing, or removing a VDU/CRT ter-minal, printer, or PC connection or its location
� Adding, changing, or removing network data linesand circuits
� Adding, changing, or removing a modem (dial-in) connection to inter- and intraorganizationcomputers
� Adding a person to use the voice-mail and voice-answering telephone system
� Adding, changing, or removing other related net-work devices, connections (e.g., gateways, LANs,WANs, MANs, and VANs), and their definitions

JWBT150-Vallabhaneni c08 July 29, 2009 10:50
LEARNING OBJECTIVE 8.7: UNDERSTAND HOW TO MANAGE THE INFORMATION TECHNOLOGY SECURITY FUNCTION 217
A network change request can come from manysources, either on paper or via phone or other me-dia. Regardless of request media, basic informa-tion such as user name, user/terminal/controllerID, hardware device model/serial number and loca-tion, modem type (external/internal), network portnumber, logical address of the hardware device,control unit address, request date, and date ser-vice needed are required for effective and timelyservice.
If the current paper-based network change requestmechanism is slow and ineffective, a computer-based approach should be considered. The changerequest can be entered electronically by the re-quester, can be routed to various personnel who pro-cess the request, and can be updated by the personwho completed it. The status (e.g., closed, open, de-ferred, pending, and waiting) can be inquired by therequester or other interested parties.
Network InteroperabilityMany organizations’ computing environment to-day consists of hardware, systems software, appli-cations software, printers, protocols, and terminalsacquired from different vendors with different plat-forms. Problems abound in terms of computers’ abil-ity to talk to each other. Data cannot be extractedfrom these systems easily and quickly, so manage-ment can get a consolidated view of the business op-erations and performance. Decisions are made with-out complete information, and available informationis normally out-of-date.
The question is how to integrate data from a vastarray of dissimilar systems of mainframe, midrange,mini-, and microcomputers acquired from differentvendors. Interoperability of systems is becominga prerequisite to operate and manage in local andglobal markets and to handle competition. A ma-jor stumbling point in the struggle toward inter-operability today is the lack of global distributednaming standards and directory services that wouldhelp users find services in geographically dispersednetworks.
The ideal goal for network management in provid-ing network interoperability is to:
� Minimize the costs of handling data.� Minimize the learning curve in accessing new data.� Increase data integrity.� Increase system reliability.
Network ArchitectureNetwork architecture is a plan describing the designof software, firmware, and hardware componentsthat make up a data communication system. Thefunctions performed by software or firmware are di-vided into independent layers. Each layer isolatesthe layers above it from the complexities below. Thenetwork architecture also defines protocols, rules,standards, and message formats to which differenthardware and software vendors must conform inorder to satisfy given customer data communicationneeds and objectives.
❑ Learning Objective 8.7:UNDERSTAND HOW TO MANAGETHE INFORMATIONTECHNOLOGY SECURITYFUNCTIONSimilar to protecting physical assets, good securityis important to protecting intangible assets suchas IT assets. Information security strategic plan-ning is a part of IT strategic planning, which inturn becomes a part of the organization’s strategicplanning.
Information Security Strategic PlanningEach organization should define the information se-curity strategy for its information security program,as follows:
� Clear and comprehensive mission, vision, goals,and objectives and how they relate to organizationmission
� High-level plan for achieving information securitygoals and objectives, including short- and midtermobjectives and performance targets, specific foreach goal and objective, to be used throughout thelife of this plan to manage progress toward suc-cessfully fulfilling the identified objectives
� Performance measures to continuously monitoraccomplishment of identified goals and objectivesand their progress toward stated targets
Regardless of how the information security strat-egy is documented, its contents should be alignedwith the overall organization strategic planning ac-tivities. The document should be revisited when a

JWBT150-Vallabhaneni c08 July 29, 2009 10:50
218 Learning Module 8: Information Technology
major change in the organization information secu-rity environment occurs, including:
� Change in applicable legislation, regulations, ordirectives
� Change in organization mission priorities� Emerging information security issues, such as
changes in threat and vulnerability environmentor the introduction of new technologies
General Security PlansSimilar to other functions, the IT security functionshould have appropriate plans to manage that func-tion properly. The essential elements of a securitymanagement function include the following: a re-sponsible individual (a security manager), a secu-rity policy, a mission (function) statement, long-term strategies, a compliance program, and a liaisonwith internal groups. The security objectives mustbe achievable.
A security manager or director should be selectedas the IT security program manager. The programshould be staffed with able personnel and linked tothe other IT functions. The security program requiresa stable base in terms of staffing, funding, and othersupport.
A security policy provides the foundation for theIT security program and is the means for document-ing and promulgating important decisions about ITsecurity. The security function should publish stan-dards, procedures, regulations, and guidelines thatimplement and expand on policy.
A published mission and function statementgrounds the IT security program into the organi-zation’s unique operating environment. The state-ment should clearly establish the function of the ITsecurity program, define responsibilities for the ITsecurity program and other related programs andentities, and provide the basis for evaluating the ef-fectiveness of the IT security program. The securitymission statement should be linked to the IT func-tion as well as the organization’s mission statement.
Long-term strategies should be developed to in-corporate security into the next generation of infor-mation technology. Since the IT field moves rapidly,planning for future operating environments isessential.
A compliance program enables the organization toassess conformance with organization-specific poli-cies and requirements.
Liaisons should be established with internalgroups such as personnel, physical security, safety,quality assurance, internal audit, and legal. Theserelationships must be more than just sharing infor-mation; these internal groups must influence eachother to ensure that security is considered in the or-ganization plan for information technology.
System Security PlansThe purposes of system security plans are to pro-vide an overview of the security requirements of thesystem, describe the controls in place or plannedfor meeting those requirements, and delineate re-sponsibilities and expected behavior of all individ-uals who access the computer system. “Expect theunexpected” is an example of the lessons learnedconcept.
Security Concepts in PlanningTwo security concepts in planning deal with estab-lishing a defense-in-depth strategy and avoiding sin-gle points of failure.
Establishing a Defense-in-Depth StrategySecuring data/information and computer systemsagainst the full spectrum of threats requires the useof multiple overlapping protection approaches ad-dressing the people, technology, and operational as-pects of IT. This is due to the highly interactive natureof the various systems and networks and to the factthat any single system cannot be adequately securedunless all interconnecting systems are also secured.
By using multiple overlapping protection ap-proaches, the failure or circumvention of any indi-vidual protection approach will not leave the systemunprotected. Through user training and awareness,well-crafted policies and procedures, and redun-dancy of protection mechanisms, layered protec-tions enable effective protection of IT assets for thepurpose of achieving its objectives. The concept oflayered protections is called security-in-depth ordefense-in-depth strategy, and it has a synergisticeffect.
Avoiding Single Points of FailureA single point of failure is a security risk due to con-centration of risk in one place, system, and process,or with one person. Compensating controls, backup

JWBT150-Vallabhaneni c08 July 29, 2009 10:50
LEARNING OBJECTIVE 8.7: UNDERSTAND HOW TO MANAGE THE INFORMATION TECHNOLOGY SECURITY FUNCTION 219
personnel, alternative facilities, fallback procedures,and/or redundancy features are required to ensurethat damage or loss resulting from a single point offailure is minimized.
Basic Computer Security PracticesIn practice, certain basic actions are necessary for allorganizations. These include:
� Develop computer security policies and proce-dures. Computer security policies and proceduresare needed to define the overall framework for im-plementing and sustaining an efficient and cost-effective computer security program at the over-all organization level. The policy establishes linesof authority, roles and responsibilities, and basicprinciples and requirements that define the com-puter security program. The procedures containimplementation and compliance instructions andmanagement processes.
� Institute computer security planning. Computersecurity planning must provide a consistent ap-proach for determining short- and long-rangemanagement objectives, developing security en-hancement proposals, mapping proposals to bud-get requests, and ensuring the implementation ofcost-effective measures.
� Institute a sensitivity identification process. Thisprocess determines the sensitivity of computer sys-tems and when data classification and declassifi-cation procedures must be implemented.
� Define and implement a risk analysis program.This program ensures the performance of risk anal-ysis on the computer system. It is important tocontinually identify and analyze potential threatsto the computing and telecommunications envi-ronments and take action to reduce risk exposureto acceptable levels.
� Establish a protective measure baseline. A com-bination of technical, personnel, administrative,environmental, and telecommunications protec-tive measures must be considered. These can betranslated into preventive, detective, and correc-tive controls as well as management, technical, andoperational controls.
� Ensure the conduct of certifications and/oraccreditation. Computer security certificationsand/or accreditation are a management controlfor ensuring that installed security safeguards areadequate.
� Oversee a multilayer compliance assurancemechanism. Management and compliance re-views should be conducted periodically to sustainoptimal security levels.
� Develop an incident response and reportingmechanism. Organizations should develop appro-priate responses to security incidents and providefeedback information to senior management onsignificant incidents. This reporting also supportsthe tracking of organization-wide trends.
� Ensure continuous awareness, training, and ed-ucation. Continuous awareness, training, and ed-ucation are necessary to elevate and sustain man-agement and personnel awareness and to providespecific guidance for personnel who design, im-plement, use, or maintain computer systems.
� Ensure contingency planning. Contingency, dis-aster recovery, and continuity of operations plansprovide continued processing capability whenother safeguards have failed to maintain systemreliability or availability. Such plans should be inplace and tested periodically.
� Ensure personnel screening. Personnel who par-ticipate in managing, using, designing, develop-ing, operating, or maintaining computer systemsshould be appropriately screened. The level ofscreening should be commensurate with the lossor harm that could be caused by these individuals.
� Develop appropriate security requirements. Incontracts for hardware, software, and computer-related services, organizations must ensure thatappropriate security requirements and specifica-tions are included in the statement of work (SOW)documents and that security requirements andspecifications are implemented properly before thesystem goes live.
Security Goals and ObjectivesThe fundamental purpose for IT security is to pro-vide value by enabling an organization to meetall mission/business objectives while ensuring thatsystem implementations demonstrate due care con-sideration of risks to the organization and its cus-tomers. This purpose is achieved by accomplishingthe five security goals, properties, objectives, or re-quirements:
1. Integrity. Integrity (of system and data) is com-monly an organization’s most important secu-rity objective after availability. Integrity deals
JWBT150-Vallabhaneni c08 July 29, 2009 10:50
220 Learning Module 8: Information Technology
with both the system and data. It is the securitygoal that generates the requirement or protectionagainst either intentional or accidental harmfulacts. Integrity has two facets: (a) data integrity(the property that data have not been altered inan unauthorized manner while in storage, dur-ing processing, or while in transit) and (b) systemintegrity (the quality that a system has when itperforms its intended function in an unimpairedmanner, free from unauthorized manipulation).Examples of integrity services include authoriza-tion, access control enforcement, proof of whole-ness, intrusion detection and containment, andrestore to secure state.
2. Confidentiality. Confidentiality (of data and sys-tem information) is the requirement that privateand confidential information not be disclosed tounauthorized individuals. Confidentiality protec-tion applies to data in storage, during processing,and while in transit. Examples of confidentialityservices include authorization, access control en-forcement, and transaction privacy.
3. Availability. Availability is frequently an orga-nization’s foremost security objective. It is a re-quirement intended to ensure that systems workpromptly and service is not denied to authorizedusers. This objective protects against (a) inten-tional or accidental attempts to either performunauthorized deletion of data or otherwise causea denial of service or data and (b) attempts to usethe system or data for unauthorized purposes. Ex-amples of availability services include authoriza-tion, access control enforcement, proof of whole-ness, intrusion detection and containment, andrestore to secure state.
4. Accountability. Accountability (at the individ-ual level) is the requirement that actions ofan entity may be traced uniquely to that en-tity. This directly supports nonrepudiation, de-terrence, fault isolation, intrusion detection andprevention, and after-action recovery and legal ac-tion. Examples of accountability services includenonrepudiation, access control enforcement, andaudit.
5. Assurance. Assurance is the basis for confidencethat security measures, both technical and op-erational, work as intended to protect the sys-tem and the information it processes. The fifthgoal of assurance is taken care of when the otherfour goals are satisfactory. The other four securitygoals (integrity, availability, confidentiality, and
accountability) have been adequately met by aspecific implementation when (a) required func-tionality is present and correctly implemented,(b) there is sufficient protection against uninten-tional errors by users or software, and (c) thereis sufficient resistance to intentional penetrationor bypass. Assurance is essential; without it theother objectives are not met. However, assuranceis a continuum; the amount of assurance neededvaries between systems. Examples of assuranceservices include authentication, audit, access con-trol enforcement, proof of wholeness, intrusiondetection and containment, and restore to securestate.
InterdependenceThe five security goals and objectives are interde-pendent. Achieving one objective without consider-ation of the others is seldom possible.
Integrity is dependent on confidentiality, in that ifconfidentiality of certain information is lost (e.g., thesuperuser password), then integrity mechanisms arelikely to be bypassed.
Confidentiality is dependent on integrity, in that ifthe integrity of the system is lost, then there is nolonger a reasonable expectation that the confiden-tiality mechanisms are still valid.
Availability and accountability are dependent onconfidentiality and integrity, in that (1) if confi-dentiality is lost from certain information (e.g., su-peruser password), the mechanisms implementingthese objectives are easily bypassable and (2) if sys-tem integrity is lost, then confidence in the validityof the mechanisms implementing these objectives isalso lost.
All of the above four objectives are interdependentwith assurance. When designing a system, a designarchitect or engineer establishes an assurance levelas a target. This target is achieved by both definingand meeting the functionality requirements in eachof the other four objectives and doing so with suffi-cient quality. Assurance highlights the fact that for asystem to be secure, it must not only provide the in-tended functionality, but also ensure that undesiredactions do not occur.
In addition to the above five goals and objectives,information security objectives include safety andreliability. For example, safety (defect-free) is re-quired within avionic and transportation controlsystems. In addition to integrity, medical systems

JWBT150-Vallabhaneni c08 July 29, 2009 10:50
LEARNING OBJECTIVE 8.7: UNDERSTAND HOW TO MANAGE THE INFORMATION TECHNOLOGY SECURITY FUNCTION 221
require greater reliability to ensure their correctoperation.
Security Controls and SafeguardsThe following is a list of security controls and safe-guards to ensure proper security:
� Rules of behavior. The rules of behavior are aform of security control that should clearly delin-eate responsibilities and expected behavior of allindividuals with access to the system. The rulesshould state the consequences of inconsistent be-havior or noncompliance and be made availableto every user prior to receiving authorization forsystem access. It is required that the rules containa signature page for each user to acknowledge re-ceipt, indicating that they have read, understand,and agree to abide by the rules of behavior. Elec-tronic signatures are acceptable for use in acknowl-edging the rules of behavior. The following is anexample of rules of behavior:� Delineate responsibilities, expected use of sys-
tem, and behavior of all users.� Describe appropriate limits on interconnections.� Define service provisions and restoration priori-
ties.� Be clear on consequences of behavior not consis-
tent with rules.� Cover the following topics:
� Work at home.� Dial-in access.� Connection to the Internet.� Use of copyrighted work.� Unofficial use of organization equipment.� Assignment and limitations of system privi-
leges and individual accountability (i.e., pass-word usage and searching databases and di-vulging information).
� Virus scanners. Virus scanners are a popularmeans of checking for virus infections. These pro-grams test for the presence of viruses in executableprogram files.
� Check-summing software. Check summing pre-sumes that program files should not change be-tween updates. They work by generating a mathe-matical value based on the contents of a particularfile. When the integrity of the file is to be verified, achecksum is generated on the current file and com-pared with the previously generated value. If thetwo values are equal, the integrity of the file is ver-
ified. Program check summing can detect viruses,Trojan horses, accidental changes to files causedby hardware failures, and other changes to files.However, they may be subject to covert replace-ment by a system intruder. Digital signatures canalso be used.
� Password checkers. Password checkers or crack-ers check passwords against a dictionary (regu-lar or specialized) and also check whether pass-words are common permutations of the user ID.Examples of special dictionary entries could bethe names of regional sports teams and stars; com-mon permutations could be the user ID spelledbackwards.
� Integrity checkers. Integrity verification programscan be used by such applications to look for evi-dence of data tampering, errors, and omissions.Techniques include consistency and reasonable-ness checks and validation during data entry andprocessing. These techniques can check data ele-ments, as input or as processed, against expectedvalues or ranges of values; analyze transactionsfor proper flow, sequencing, and authorization; orexamine data elements for expected relationships.These programs comprise a very important set ofprocesses because they can be used to convincepeople that, if they do what they should not do,accidentally or intentionally, they will be caught.Many of these programs rely on logging of indi-vidual user activities.
� Intrusion detectors. Intrusion detectors analyzethe system audit trail, especially logons, networkconnections, operating system calls, and variouscommand parameters, for activity that could rep-resent unauthorized activity. Intrusion detectionrefers to the process of identifying attempts to pen-etrate a system and gain unauthorized access. In-trusions can be detected in real time, by examiningaudit records as they are created (or through theuse of other kinds of warning flags/notices) or af-ter the fact (e.g., by examining audit records in abatch process).
Real-time intrusion detection is primarily aimedat outsiders attempting to gain unauthorized ac-cess to the system. It may also be used to detectchanges in the system’s performance indicative of,for example, a virus or worm attack. After-the-factidentification may indicate that unauthorized ac-cess was attempted or was successful. Attentioncan then be given to damage assessment or re-viewing controls that were attacked.

JWBT150-Vallabhaneni c08 July 29, 2009 10:50
222 Learning Module 8: Information Technology
� Software metering product. A computer system-user can be an employee, a contractor, a computersystem, and a computer. System-users are definedto the software metering product, and the productcontrols and monitors who is using the system anddetermines whether the user is authorized to usethe system. Unauthorized users will be denied ac-cess to the system. Multiuser application systemsallow several workstations to access and alter thesame data files at the same time through the use oflogical record/file locks. These locks synchronizemultiuser access. System/data owners are best todetermine the sensitivity of an application systemand its data.
� System analyzers. System performance-monitor-ing analyzers analyze system performance logsin real time to look for availability prob-lems, including active attacks such as Internetworm and system and network slowdowns andcrashes.
� Configuration management. From a security pointof view, configuration management provides as-surance that the system in operation is the correctversion (configuration) of the system and that anychanges to be made are reviewed for security im-plications. Configuration management can be usedto help ensure that changes take place in an iden-tifiable and controlled environment and that theydo not unintentionally harm any of the system’sproperties, including its security. Some organiza-tions, particularly those with very large systems,use a configuration control board for configurationmanagement.
Changes to the system can have security implica-tions because they may introduce or remove vul-nerabilities and because significant changes mayrequire updating the contingency plan, risk analy-sis, or accreditation.
� Security audit. A common approach for measur-ing the security posture of an organization is aformal security audit. Audits ensure that policiesand controls already implemented are operatingcorrectly and effectively. Audits can include staticanalysis of policies, procedures, and safeguards aswell as active probing of the system’s external andinternal security mechanisms. The results of an au-dit identify the strengths and weaknesses of thesecurity of the system and provide a list of noteddeficits for resolution, typically ranked by degreeof severity. Because the security posture of a sys-tem evolves over time, audits are most effectivewhen done on a recurring basis.
While periodic formal audits are useful, theyare not a replacement for day-to-day manage-ment of the security status of a system. Enablingsystem logs and reviewing their contents man-ually or through automated report summariescan sometimes be the best means of uncover-ing unauthorized behavior and detecting securityproblems.
� System logs. A periodic review of system-generated logs can detect security problems, in-cluding attempts to exceed access authority or gainsystem access during unusual hours.
� Checklists. Checklists can also be used to verifythat changes to the system have been reviewedfrom a security point of view. A common audit ex-amines the system’s configuration to see whethermajor changes (such as connecting to the Inter-net) have occurred that have not yet been analyzedfrom a security point of view.
� Penetration testing. Penetration testing can usemany methods to attempt a system break-in. Inaddition to using active automated tools, pene-tration testing can be done manually. The mostuseful type of penetration testing is to use meth-ods that might really be used against the system.For hosts on the Internet, this would certainly in-clude automated tools. For many systems, lax pro-cedures or a lack of internal controls on applicationsystems are common vulnerabilities that penetra-tion testing can target. While penetration testingis a very powerful technique, it should preferablybe conducted with the knowledge and consent ofIT management as well as the organization’s se-nior management. Unknown penetration attemptscan cause a lot of stress among IT operations staffand may create unnecessary disturbances to sys-tem users. Penetration testing is conducted usingred-team and blue-team approaches. Another ap-proach is using a “social engineering” technique,which includes getting system users or IT admin-istrators to divulge information about systems, in-cluding their passwords.� Red-team testing is done without the knowledge
and consent of IT management and the organi-zation’s senior management. A red team takesan adversarial approach to assessing securityposture.
� Blue-team testing is done with the knowledgeand consent of IT management and the organi-zation’s senior management. A blue team doesnot take an adversarial approach to assessing se-curity posture.

JWBT150-Vallabhaneni c08 July 29, 2009 10:50
LEARNING OBJECTIVE 8.8: UNDERSTAND HOW DATABASES ARE DESIGNED AND MANAGED 223
❑ Learning Objective 8.8:UNDERSTAND HOW DATABASESARE DESIGNED AND MANAGEDA database contains facts and figures on varioustypes of information such as sales, costs, and per-sonnel. These files are collectively called the firm’sdatabase. A database is a collection of related dataabout an organization, intended for sharing amongmultiple users. A database management system(DBMS) is comprised of software, hardware, andprocedures. The DBMS acts as a software controllerenabling different application systems to access alarge number of distinct data records stored ondirect-access storage devices (e.g., disk).
The DBMS should be compatible with the operat-ing system environment as it handles complex datastructures. Unauthorized access to data elements isa major concern in a database system due to con-centration of data. The DBMS helps in providing theuser interface with the application system throughincreased accessibility and flexibility by means ofdata views.
Some advantages (objectives) of a DBMS are:
� Provides minimum data redundancy, resulting indata consistency.
� Provides data independence from application pro-grams, except during computer processing.
� Provides consistent and quality information fordecision-making purposes.
� Provides adequate security and integrity controls.� Facilitates uniform development and maintenance
of application systems.� Ensures that all applicable standards (e.g., doc-
umentation, data naming, data formats) are ob-served in the representation of the data.
� Provides shared access to data.� Improves program maintenance due to separation
of data from programs.� Provides a single storage location for each data
item.� Separates file management tasks from application
programs.� Programs access data according to predefined sub-
schema.� Provides built-in backup and recovery procedures.
Some disadvantages of a DBMS are:
� Can be expensive to acquire, operate, and main-tain.
� Requires additional main memory.
� Requires additional disk storage.� Requires knowledgeable and technically skilled
staff (database administrator).� Results in additional system overhead, thereby
slowing down the system response time.� Needs additional CPU processing time.� Requires sophisticated and efficient security mech-
anisms.� Difficult to enforce security protection policies.
Redundancy of data is sometimes necessary whenhigh system performance and high data availabilityare required. The trade-off here is the cost of col-lecting and maintaining the redundant data and thesystem overhead it requires to process the data. An-other concern is synchronization of data updates interms of timing and sequence. Ideally, the synchro-nization should be done at the system level, ratherthan the application level.
A DBMS understands the structure of the dataand provides a language for defining and manip-ulating stored data. The primary functions of theDBMS are to store data and to provide operations onthe database. The operations usually include creat-ing, deleting, updating, and searching of data. It isgenerally known that most DBMS products requireextensive file backup-and-recovery procedures andrequire more processing time.
Some essential features supported by most DBMSsare:
� Persistence. Persistence is the property whereinthe state of the database survives the execution ofa process in order to be reused later in anotherprocess.
� Data sharing. Data sharing is the property thatpermits simultaneous use of the database by mul-tiple users. A DBMS that permits sharing mustprovide some concurrency control (locking) mech-anism that prevents users from executing inconsis-tent actions on the database.
� Recovery. Recovery refers to the capability of theDBMS to return its data to a consistent and coher-ent state after a hardware or software failure.
� Database language. The database language per-mits external access to the DBMS. The databaselanguage may include the Data Definition Lan-guage (DDL), the Data Manipulation Language(DML), the Data Control Language (DCL), and anad-hoc query language. The DDL is used to definethe database schema and subschema. The DML isused to examine and manipulate contents of thedatabase. The DCL is used to specify parameters

JWBT150-Vallabhaneni c08 July 29, 2009 10:50
224 Learning Module 8: Information Technology
needed to define the internal organization of thedatabase, such as indices and buffer size. Ad-hocquery language is provided for interactive specifi-cation of queries.
� Security and integrity. Security and authoriza-tion control, integrity checking, utility programs,backup/archiving, versioning, and view defini-tion are other features of most DBMSs. Integritychecking involves two types: semantic and ref-erential. Semantic integrity refers to the declara-tion of semantic and structural integrity rules (e.g.,typing constraints, values of domain constraints,uniqueness constraints) and the enforcement ofthese rules. Semantic integrity rules may be auto-matically enforced at program runtime or at com-pile time or may be performed only when a mes-sage is sent. Referential integrity means that norecord may contain a reference to the primary keyof a nonexisting record. Cascading of deletes, oneof the features of referential integrity checking, oc-curs when a record is deleted and all other refer-enced records are automatically deleted.
Database Design ApproachesFirst, user requirements are specified to the concep-tual model, which represents “user views” of thedatabase. When the conceptual model is presentedto the DBMS, it becomes a logical model, externalmodel, or schema/subschema. The type of DBMS isnot a factor in designing a conceptual model, but thedesign of a logical model is dependent on the typeof DBMS to be used. This means that the conceptualmodel is, or should be, independent of a DBMS.
Second, the logical model is converted to a physi-cal model in terms of physical storage media such asmagnetic disk, tape, cartridge, or drum. The phys-ical model, which is also called an internal model,considers the type of access methods needed, thetype of indexing techniques required, and the datadistribution methods available.
Schema versus Subschema
� A logical view of an entire database is called aschema. Schemas may be external, conceptual,or internal. A synonym for schema is view.
� A subschema is a part of a schema. In otherwords, a schema is made up of one or moresubschemas.
� A logical data model presents a view of data.
Logical database design is the process of determin-ing an information system structure that is indepen-dent of software or hardware considerations. It pro-duces logical data structures consisting of a numberof entities connected by one-to-one or one-to-manyrelationships, subject to appropriate integrity check-ing. The objective is to improve the effectiveness ofan information system by maximizing the accuracy,consistency, integrity, security, and completeness ofthe database.
Physical database design is the implementation ofa logical design in a particular computer system en-vironment. It deals with retrieval and update work-loads for the system and the parameters required(i.e., average time required for random/sequentialaccess to a track, length of a track, and disk cylindersizes) for the hardware environment. The objective isto improve the performance of the information sys-tem by minimizing the data entry time, data retrievaltime, data update time, data query time, and storagespace and costs.
For large, logically complex databases, physical de-sign is an extremely difficult task. Typically, an enor-mous number of alternatives must be explored insearching for a good physical design. Often, optimalor near-optimal designs cannot be discovered, result-ing in the creation of inefficient and costly databases.Following are the action steps required in a physicaldatabase design (see the figure):
� Analyze workload complexity and characteristics.� Translate the relationships specified in the logical
data structures into physical records and hard-ware devices, and determine their relationships.This includes consideration of symbolic and di-rect pointers. Symbolic pointers contain the logicalidentifier of the other. Direct pointers contain thephysical address of the other. Both pointers cancoexist.
� Fine-tune the design by determining the ini-tial record loading factors, record segmentations,record and file indexes, primary and secondary ac-cess methods, file block sizes, and secondary mem-ory management for overflow handling.
Userneeds
Conceptual modelor user views
Logical/externalmodel
Physical/internalmodel
Prior to developing a full-scale database, a proto-type may be undertaken to finalize user/technicalrequirements of the application system. Later, the

JWBT150-Vallabhaneni c08 July 29, 2009 10:50
LEARNING OBJECTIVE 8.8: UNDERSTAND HOW DATABASES ARE DESIGNED AND MANAGED 225
prototype can be merged into the normal system de-sign phase for security, controls, recovery, and per-formance considerations.
Another way of looking at the database models isfrom the design focus and features of the databaseitself, described as follows:
Physical Data Model Logical Data Model
Concerned with physicalstorage of data (internalschema)
Concerned withuser-oriented data views(external schema)
Concerned with the entitiesfor which data arecollected
Concerned with entities forwhich data are collected
Describes how the data arearranged in the definedstorage media (e.g., disk)from program andprogrammer viewpoints
Describes how the data canbe viewed by thedesignated end user
Physical in nature in thesense that it describes theway data are physicallylocated in the database
Conceptual in nature(conceptual schema) in thesense that it describes theoverall logical view of thedatabase
A data model describes relationships between thedata elements and is used as a tool to representthe conceptual organization of data. A relationshipwithin a data model can be one-to-one (e.g., be-tween patient and bed in a hospital environment—atany given time, one bed is assigned to one pa-tient), one-to-many (e.g., between hospital room andpatients—one hospital room accommodates morethan one patient), and many-to-many (e.g., betweenpatient and surgeon—one surgeon may attend tomany patients and a patient may be attended bymore than one surgeon). A data model can be con-sidered as consisting of three components:
1. Data structure—the basic building blocks de-scribing the way data are organized
2. Operators—the set of functions that can be usedto act on the data structures
3. Integrity rules—the valid states in which the datastored in the database may exist
The primary purpose of any data model is to pro-vide a formal means of representing information anda formal means of manipulating the representation.A good data model can help describe and model theapplication effectively. A DBMS uses one or more ofsix data models as described below.
1. Relational Data ModelThe relational data model (e.g., DB2) consists ofcolumns, equal to data fields in a conventional file,and rows, equal to data records in a conventional file,represented in a table. Data are stored in tables withkeys or indexes outside the program. For example,in a hospital environment, a patient table may con-sist of columns (patient number, name, and address)and the values in the column (patient number, 1234;patient name, John Jones; patient address, 100 MainStreet, Any Town, USA) are represented in rows.
The columns of the table are called attributes, andthe rows are called tuples. A set of actual values anattribute may take is drawn from a domain. The pri-mary key to the patient table is patient number. Thefollowing is a description of properties of a relationaldata model:
� All key values are defined.� Duplicate rows do not exist.� Column order is not significant.� Row order is not significant.
Some major advantages of a relational model are itssimplicity in use and true data independence fromdata storage structures and access methods. Somemajor disadvantages are low system performanceand operational efficiency compared to other datamodels.
2. Hierarchical Data ModelFrom a comparison point of view, the hierarchicaldata model (e.g., IMS) can be related to a familytree concept, where the parent can have no children,one child, or more than one child. Similarly, a treeis composed of a number of branches or nodes. Anumber of trees or data records form a database. Ev-ery branch has a number of leaves or data fields.Hence, a hierarchical tree structure consists of nodesand branches. The highest node is called a root(parent—level 1), and its every occurrence beginsa logical database record. The dependent nodes areat the lower levels (children—levels 2, 3, . . .).
The following is a description of the properties ofa hierarchical data model:
� A model always starts with a root node.� A parent node must have at least one dependent
node.� Every node except the root must be accessed
through its parent node.

JWBT150-Vallabhaneni c08 July 29, 2009 10:50
226 Learning Module 8: Information Technology
� Except at level 1, the root node, the dependent nodecan be added horizontally as well as vertically withno limitation.
� There can be a number of occurrences of each nodeat each level.
� Every node occurring at level 2 must be connectedwith one and only one node occurring at level 1and is repeated down.
Some major advantages of a hierarchical datamodel are its proven performance, simplicity, easeof use, and reduction of data dependency. Some ma-jor disadvantages are that addition and deletion ofparent/child nodes can become complex and thatdeletion of the parent results in the deletion of thechildren.
3. Network Data ModelThe network data model (e.g., IDMS/R) is depictedusing blocks and arrows. A block represents a recordtype or an entity. Each record type in turn is com-posed of zero, one, or more data elements/fields orattributes. An arrow linking two blocks shows therelationship between two record types. A networkdatabase consists of a number of areas. An area con-tains records, which in turn contain data elements orfields. A set, which is a grouping of records, may re-side in an area or span a number of areas. Each areacan have its own unique physical attributes. Areascan be operated independently of, or in conjunctionwith, other areas.
The following is a description of the properties ofa network data model:
� A set is composed of related records.� There is only a single “owner” in a set.� There may be zero, one, or many members in a set.
Some major advantages of a network data modelare its proven performance and the accommodationof many-to-many relationships that occur quite fre-quently in real life. Some major disadvantages are itscomplexity in programming and loss of data inde-pendence during database reorganization and whensets are removed.
4. Inverted File Data ModelIn the inverted file data model (e.g., ADABAS), eachentity is represented by a file. Each record in the filerepresents an occurrence of the entity. Each attributebecomes a data field or element in the file. Data fieldsare inverted to allow efficient access to individual
files. To accomplish this, an index file is created con-taining all the values taken by the inverted field andpointers to all records in the file.
Some major advantages of the inverted file datamodel are its simplicity, data independence, and easeof adding new files and fields. A major disadvan-tage is difficulty in synchronizing changes betweendatabase records/fields and index file.
5. Object Data ModelThe object data model is developed by combiningthe special nature of object-oriented programminglanguages (e.g., Lisp, C++) with DBMS. Objects,classes, and inheritance form the basis for the struc-tural aspects of the object data model. Objects are ba-sic entities that have data structures and operations.Every object has an object ID that is a unique system-provided identifier. Classes describe generic objecttypes. All objects are members of a class. Classesare related through inheritance. Classes can be re-lated to each other by superclass or subclass rela-tionships, similar to the entity-relationship-attributemodel, to form class hierarchies. Class definitions arethe mechanism for specifying the database schemafor an application. For example, the class PERSONhas an attribute SPOUSE whose data type is alsoPERSON.
Object DBMS also supports data sharing, pro-vides concurrency controls and system recovery,and handles cooperative transaction processing anddata versioning. Engineering applications such ascomputer-aided design systems, office informa-tion systems, and artificial intelligence (knowledge-based) systems require the use of cooperative trans-action processing and data versioning techniques.
Version management is a facility for tracking andrecording changes made to data over time throughthe history of design changes. The version manage-ment system tracks version successors and prede-cessors. When objects constituting a portion of thedesign are retrieved, the system must ensure thatversions of these objects are consistent and compati-ble. System development efficiency and handling ofcomplex data structures are some advantages of theobject data model. Some disadvantages include newtechnology and new risks, which require trainingand learning curves.
6. Distributed Data ModelThe distributed database model can be thought ofas having many network nodes and access paths

JWBT150-Vallabhaneni c08 July 29, 2009 10:50
LEARNING OBJECTIVE 8.8: UNDERSTAND HOW DATABASES ARE DESIGNED AND MANAGED 227
between the central and local computers and withinlocal computer sites. Database security becomesa major issue in a truly distributed environment,where data are distributed and there are many ac-cess paths to the data from far-flung locations.
Data in a distributed database reside in morethan one physical database in the network. Loca-tion transparency, in which the user does not needto know where data are stored, is one of the majorgoals of a distributed database data model. Similarly,programmers do not have to rewrite applicationsand can move data from one location to another, de-pending on need.
Data WarehouseThe purpose of a data warehouse is information re-trieval and data analysis. It stores precomputed, his-torical, descriptive, and numerical data. It is the pro-cess of extracting and transferring operational datainto informational data and loading it into a centraldata store or warehouse. Once loaded, users can ac-cess the warehouse through query and analysis tools.The data warehouse can be housed on a computerdifferent from the production computer.
A data warehouse is a storage facility where datafrom heterogeneous databases are brought togetherso that users can make queries against the warehouseinstead of against several databases. The warehouseis like a big database. Redundant and inconsistentdata are removed from the databases, and subsets ofdata are selected from the databases prior to placingthem in a data warehouse. Usually, summary data,correlated data, or otherwise massaged data are con-tained in the data warehouse.
Data integrity and security issues are equally ap-plicable to warehouses as they are to databases. Oneissue is: What happens to the warehouse when theindividual databases are updated?
Data modeling is an essential task for buildinga data warehouse along with access methods, in-dex strategies, and query language. For example, ifthe data model is relational, then a structured querylanguage (SQL)-based language is used. If the datamodel is object oriented, an object-based languagemay be appropriate.
Metadata management is another critical technol-ogy for data warehousing. Metadata will include themapping between the data sources (databases) andthe warehouse. Another issue is whether the ware-house can be centralized or distributed.
Database versus Data Warehouse
� A database contains raw data.� A data warehouse contains massaged (cleaned
up) data.� Users query many points with heterogeneous
databases.� Users query only a single point with a data ware-
house.
Data MartsA data mart is a subset of a data warehouse. It bringsthe data from transaction processing systems (TPSs)to functional departments (i.e., finance, manufactur-ing, and human resources) or business units or divi-sions. Data marts are scaled-down data warehouses,where targeted business information is placed intothe hands of more decision-makers.
Data Mart versus Data Warehouse
� A data mart provides detailed data for a specificfunction of a business.
� A data warehouse provides summary data forthe entire business.
Data MiningData mining can be applied to databases as well asto data warehouses. A warehouse structures the datain such a way as to facilitate query processing. Datamining is a set of automated tools that convert thedata in the warehouse into some useful information.It selects and reports information deemed significantfrom a data warehouse or database.
Data mining is the process of posing a series ofqueries to extract information from the databases. Adata warehouse itself does not attempt to extract in-formation from the data contained in the warehouse.One needs a data mining tool to do this.
There are several types of data mining applica-tions, including data classifications, data sequenc-ing, data dependencies, and deviation analysis. Datarecords can be grouped into clusters or classes so thatpatterns in the data can be found. Data sequencingcan be determined from the data. Data dependen-cies such as relationships or associations betweenthe data items can be detected. Deviation analy-sis can be performed on data. Fuzzy logic, neural

JWBT150-Vallabhaneni c08 July 29, 2009 10:50
228 Learning Module 8: Information Technology
networks, and set theory are some techniques usedin data mining tools.
Data mining techniques can also be used in in-trusion detection, fraud detection, and auditing thedatabases. One may apply data mining tools to de-tect abnormal patterns in data, which can provideclues to fraud. A security problem can be createdwhen a user poses queries and infers sensitive hy-potheses. That is, the inference problem occurs via adata mining tool. A data mining tool can be appliedto see whether sensitive information can be deducedfrom the unclassified information legitimately ob-tained. If so, then there is an inference problem. Aninference controller can be built to detect the motivesof the users and prevent the inference problem fromoccurring. The inference controller can be placed be-tween the data mining tool and the database. Sincedata mining tools are computationally intensive,parallel-processing computers are used to carry outdata mining activities.
Examples of application of data mining include:market segmentation, where it identifies the com-mon characteristics of customers who buy the sameproducts; customer defection, where it predictswhich customers are likely to leave the company;fraud detection, where it identifies which transac-tions are most likely to be fraudulent; direct mar-keting, where it identifies which prospects are thetarget for mailing; market basket analysis, where itidentifies what products or services are commonlypurchased together; and trend analysis, where it re-veals the difference between a typical customer thismonth versus last month.
Uses of Data Mining
� Data mining is a user tool to select informationfrom a data warehouse.
� Data mining is an auditing tool to detect fraud,intrusions, and security problems in a datawarehouse.
Information EngineeringInformation engineering (IE) has many pur-poses, including organizational planning, businessre-engineering, business application development,information systems planning, and system re-engineering (www.wikipedia.org).
IE was first developed to provide data analysisand database design techniques that could be used
by database administrators and by systems analy-sis to develop database designs and systems basedupon an understanding of the operational process-ing needs of organizations. Later, IE was used inrapid application development (RAD), business pro-cess re-engineering (BPR), computer-aided softwareengineering (CASE) tools, and object oriented designand development methodologies.
Seven stages of IE include information strategyplanning, summary business area analysis, detailedbusiness area analysis, business system design, tech-nical design, construction, and transition.
Techniques used during an IE project include en-tity analysis, functional analysis and process depen-dency, process logic analysis, entity type lifecycleanalysis, matrix cross-checking, normalization, clus-ter analysis, and data flow and data analysis.
❑ Learning Objective 8.9:UNDERSTAND HOW ELECTRONICCOMMERCE IS FACILITATED ANDMANAGEDElectronic commerce is facilitated on the World WideWeb (WWW, or simply Web). The Web infrastructureconsists of hardware, software, services, networks,protocols, policies, and procedures. It is described interms of the Internet, intranet, and extranet. Webmanagement issues in terms of security, privacy,and service bottlenecks are presented. The scope ofe-commerce is discussed, including electronic datainterchange (EDI) and electronic funds transfer(EFT) systems.
The InternetThe Internet is a worldwide “network of networks”that uses the Transmission Control Protocol/Internet Protocol (TCP/IP) suite for communica-tions.
Connection to the Internet is accomplished in threedifferent ways: (1) a user may obtain an account on ahost connected to the Internet and access the Internetservices through that host; (2) through a commercialonline service provider, a user may connect a PC orworkstation directly to the Internet with that PC orworkstation becoming an Internet host with its ownInternet address; and (3) an organization may con-nect its own network to the Internet and become anetwork on the Internet, referred to as an Internetsubnet. Routers and modems are used in the con-nection to the Internet.

JWBT150-Vallabhaneni c08 July 29, 2009 10:50
LEARNING OBJECTIVE 8.9: UNDERSTAND HOW ELECTRONIC COMMERCE IS FACILITATED AND MANAGED 229
Internet hosts are one of two types: (1) clienthosts, generally a Windows PC, which accesses onlyservices on the Internet provided by other hosts;or (2) server hosts, generally Unix PCs or work-stations, which provide services on the Internet toother hosts but may also access services from otherhosts.
Pull Technology versus Push Technology
Pull technology or client pull is a style of net-work communication where the initial requestfor data originates from the client and thenis responded to by the server. Pull requestsform the foundation of network computing,where many clients request data from central-ized servers. Pull technology is used exten-sively on the Internet for hypertext transferprotocol (HTTP) page requests from websites.Most web feeds, such as really simple syndi-cation (RSS) feeds and other streaming mediasites, are technically pulled by the client or re-ceiver (www.wikipedia.org).
Push technology or server push describes a styleof Internet-based communication where thepublisher or central server initiates a request fora given transaction. Examples of push technol-ogy applications include e-mail, synchronousconferencing, market data distribution (stocktickers), online chat/messaging systems (Web-chat), online betting and gaming, sport results,monitoring consoles, and sensor network mon-itoring (www.wikipedia.org).
Common Internet ServicesThere are a number of services associated withTCP/IP and the Internet. The most commonly usedservice is electronic mail, implemented by the Sim-ple Mail Transfer Protocol (SMTP), terminal em-ulation for remote terminal access (Telnet), andFile Transfer Protocol (FTP). Beyond that, there area number of services and protocols used for re-mote printing, remote login, remote file and disksharing, management of distributed databases, andinformation-based services. Although TCP/IP canbe used equally well in a LAN or WAN environ-ment, a common use is for file and printer sharingat the LAN level and for electronic mail and remoteterminal access at both the LAN and WAN levels.
Gopher and Mosaic are increasingly popular; bothpresent problems to firewall designers.
Internet ProtocolsTCP/IP is more correctly a suite of protocols in-cluding TCP and IP, UDP (User Datagram Protocol),ICMP (Internet Control Message Protocols), and sev-eral others. The TCP/IP protocol suite, which is afour-layer model, does not conform exactly to theopen systems interconnection’s seven-layer model.
IPThe IP layer receives packets delivered by lower-level layers, (e.g., an Ethernet device driver) andpasses the packets up to the higher-level TCP orUDP layers. Conversely, IP transmits packets thathave been received from the TCP or UDP layersto the lower-level layer. IP packets are unreliabledatagrams in that IP does nothing to ensure thatIP packets are delivered in sequential order or arenot damaged by errors. IP does contain an optionknown as IP Source Routing, which can be used tospecify a direct route to a destination and return pathback to the origination. However, this option can beused by intruders to trick systems into permittingconnections from systems that otherwise would notbe permitted to connect. Thus, since a number ofservices trust and rely on the authenticity of the IPsource address, this is problematic and can lead tobreak-ins and intruder activity.
TCPIf IP packets contain encapsulated TCP packets, IPsoftware will pass them up to the TCP software layer.TCP sequentially orders the packets, performs errorcorrection, and implements virtual circuits or realconnections between hosts. The TCP packets con-tain sequence numbers and acknowledgments of re-ceived packets so that a packet received out of or-der can be reordered, and damaged packets can beretransmitted.
Internet Security-Related ProblemsSome of the problems with Internet security are aresult of inherent vulnerabilities in the services (andthe protocols that the services implement), while oth-ers are a result of host configuration and access con-trols that are poorly implemented or overly complexto administer.

JWBT150-Vallabhaneni c08 July 29, 2009 10:50
230 Learning Module 8: Information Technology
Security problems include installation of snifferprograms to monitor network traffic for user-namesand static passwords typed in by users; use of weak,static, or reusable passwords; ease of spying andspoofing, where an attacker’s host can masqueradeas a trusted host or client; and poor configuration ofhost systems, which can result in intruders gainingaccess. A solution is to install an Internet firewall,which is a device that sits between the user orga-nization network and the outside Internet. It limitsaccess into and out of the user network based on theuser organization’s access policy. A firewall can beset up to allow access only from specific hosts andnetworks or to prevent access from specific hosts. Inaddition, one can give different levels of access tovarious hosts; a preferred host may have full access,whereas a secondary host may have access to onlycertain portions of the user host’s directory structure.
IntranetAn intranet is simply Internet technology put to useon a private network. Intranet is an internal net-work within an organization to facilitate employeecommunications and information sharing. Organi-zations are posting information to their internal websites and using web browsers as a common collabo-rative tool. An example of an intranet application is acustomer database accessible via the Web. Sales staffcould use this database to contact customers aboutnew product offerings and send them quotes. Otherapplications include internal phone books, proce-dures manual, training manual, and purchase req-uisition forms.
A virtual private network (VPN) can allow em-ployees to connect to the intranet securely, so thereare no fears of sensitive information leaving the net-work unprotected. The Internet alone cannot removethis fear.
ExtranetWhereas the scope of an intranet is limited to acustomer organization, the scope of an extranet in-cludes vendor or customer organizations that dobusiness with the suppler organization. Extranetsare intranet-based networks restricted to select audi-ences such as vendors, clients, and other interestedparties outside the organization. In other words,intranets talk to extranets through Internet-basedtechnology.
Security and performance concerns are differentfor an extranet than for a web site or network-based intranet. Authentication and privacy are crit-ical on an extranet so that information is protectedfrom unauthorized users. Performance in terms ofresponse time must be good for customers and sup-pliers. Secured intranet and extranet access applica-tions require the use of a VPN.
Web Management IssuesManaging the Web is not easy since no one owns it ona global basis in terms of access, security, hardware,software, privacy, and control. The Web is managedat the local level as there is no centralized governingbody. Service bottlenecks occur due to overloadedrouters, slow modems, and the use of twisted pairs ofcopper wires. Suggested solutions include: upgrad-ing the backbone links by installing bigger, faster“pipes,” improving routers with increased hardwarecapacity and efficient software to provide quick ac-cess to addresses, prioritizing traffic going throughthe backbone, and installing digital subscriber line(DSL) and cable modems to speed Internet access.
Regarding privacy, many Internet sites use cookiesto gather information about users who visit their websites. A cookie is a text file that an Internet companyplaces on the hard disk of a computer system. Thesetext files keep track of visits to the site and the actionsusers take. This tracking can be disabled with specialsoftware.
Regarding security, cryptography, firewalls, en-cryption, and digital signatures can be used to pro-tect web resources from unauthorized access.
Electronic CommerceElectronic commerce (e-commerce) is defined as aplace where buyers and sellers are connected usingcomputers and networks (the Internet) to buy andsell goods and services. The term electronic busi-ness (e-business) is much broader than e-commercebecause the former includes distribution of infor-mation and customer support, which are lacking inthe latter. In other words, e-commerce is a subset ofe-business.
E-commerce is a web-enabled value chain with theInternet as the enabling technology. Business appli-cations are located on web servers for wide accessto employees and selective access to customers andsuppliers.

JWBT150-Vallabhaneni c08 July 29, 2009 10:50
LEARNING OBJECTIVE 8.9: UNDERSTAND HOW ELECTRONIC COMMERCE IS FACILITATED AND MANAGED 231
E-commerce can be grouped into three models:business to consumer (B2C), business to business(B2B), and government to citizen (G2C). Onlinestores selling goods directly to consumers is an ex-ample of the B2C model. EDI is a critical componentof the sales process for many online retailers. B2Be-commerce involves “Internet-enabling” of existingrelationships between two companies in exchanginggoods and services. EDI is the underlying technol-ogy enabling online catalogs and continuous stock-replenishment programs. For example, in the G2Cmodel, the U.S. federal government uses the Inter-net to reach its citizens for a variety of information-dissemination purposes and transactions (e.g.,Internal Revenue Service, U.S. Postal Service, andSocial Security Administration). A value chain is cre-ated in e-commerce between demand planning, sup-ply planning, and demand fulfillment. The demandplanning consists of analyzing buying patterns anddeveloping customer demand forecasts. The sup-ply planning consists of supply allocation, inventoryplanning, distribution planning, procurement plan-ning, and transportation planning. The demand ful-fillment consists of order capturing, customer verifi-cation, order promising, backlog management, andorder fulfillment.
An important application of e-commerce is in elec-tronic procurement through reverse auctions, where(1) an industrial buyer invites bids from multiplesuppliers (sellers) to find the lowest price and (2) aconsumer names his price for a hotel room, airlineticket, or mortgage interest rate to get the lowestprice. In both examples, sellers compete with eachother and the buyer benefits from the low price.
For the purposes of exploring relevant securityissues, one can divide e-commerce into four basicclasses: (1) e-mail, (2) EDI, (3) information transac-tions, and (4) financial transactions.
E-Commerce Security Issues = E-Mail SecurityIssues + EDI Security Issues + InformationTransaction Security Issues + FinancialTransaction Security Issues
E-Mail Security IssuesThe use of Internet e-mail to carry business-criticalcommunications is growing exponentially. Whilee-mail provides a low-cost means of communicationwith customers, suppliers, and partners, a numberof security issues are related to the use of e-mail. The
security issues include: Internet e-mail addresses areeasily spoofed. It is nearly impossible to be certainwho created and sent an e-mail message based onthe address alone. Internet e-mail messages can beeasily modified. Standard SMTP mail provides no in-tegrity checking, there are a number of points wherethe contents of an e-mail message can be read byunintended recipients, and there is usually no guar-antee of delivery with Internet e-mail. While somemail systems support return receipts, when such re-ceipts work at all they often only signify that theuser’s server (not necessarily the user) has receivedthe message. These weaknesses make it importantfor organizations to issue policies defining accept-able use of e-mail for business purposes.
EDI Security IssuesTraditional EDI systems allow preestablished trad-ing partners to electronically exchange business datathrough value-added networks (VANs). The Inter-net can provide the connectivity needed to supportEDI at substantial cost savings over VAN. However,the Internet does not provide the security services(integrity, confidentiality, and nonrepudiation) re-quired for business EDI. Similar to e-mail over theInternet, EDI transactions are vulnerable to modi-fication, disclosure, or interruption when sent overthe Internet. The use of cryptography to provide therequired security services has changed this; conse-quently, many companies and government agenciesare moving to Internet-based EDI.
Information Transactions Security IssuesProviding information (e.g., stock quotes, news) is amajor and costly element of commerce. Using the In-ternet to provide these services is substantially lessexpensive than fax, telephone, or postal mail ser-vices. Integrity and availability of the informationprovided are key security concerns that require se-curity controls and policy.
Financial Transactions Security IssuesComputer networks have been used to process finan-cial transactions such as checks, debit cards, creditcards, and electronic funds transfer (EFT). Similarto EDI over VANs, the connectivity options havebeen limited, and the leased lines are expensive. TheInternet provides an opportunity for cost savingsin electronic financial transactions. The use of the

JWBT150-Vallabhaneni c08 July 29, 2009 10:50
232 Learning Module 8: Information Technology
Internet to carry these types of transactions re-places the physical presentation or exchange of cash,checks, or debit/credit cards with the electronicequivalent. Each of these forms of transactions in-volves the use of cryptography to provide for in-tegrity, confidentiality, authentication, and nonrepu-diation. For example, a standard known as SecureElectronic Transactions (SET) is used for process-ing credit card transactions over public networks.Use of SET involves three-way transactions betweenthe buyer, the seller, and a financial institution (abank).
E-Commerce SoftwareE-commerce software should support the followingfive tasks:
1. Catalog management. Catalog management soft-ware combines different product data formatsinto a standard format for uniform viewing, ag-gregating, and integrating catalog data into a cen-tral repository for easy access, retrieval, and up-dating of pricing and availability changes.
2. Product configuration. Customers need helpwhen an item they are purchasing has many com-ponents and options. Buyers use the new web-based product configuration software to build theproduct they need online with little or no helpfrom salespeople.
3. Shopping cart facilities. Today many e-commerce sites use an electronic shopping cartto track the items selected for purchase, allowingshoppers to view what is in their cart, add newitems to it, or remove items from it.
4. E-commerce transaction processing. E-commercetransaction processing software takes data fromthe shopping cart and calculates volume dis-counts, sales tax, and shipping costs to arrive atthe total cost.
5. Web-site traffic data analysis. Web-site trafficdata analysis software captures visitor informa-tion, including who is visiting the web site, whatsearch engine and key words they used to find thesite, how long their web browser viewed the site,the date and time of each visit, and which pageswere displayed. These data are placed into a we-blog file for future analysis to improve the website’s performance.
E-Commerce InfrastructureKey technology infrastructure for e-commerce ap-plications includes web server hardware, server
operating system, server software, e-commerce soft-ware, VPN, VAN, and the Internet, intranet, or ex-tranet. Strategies for successful e-commerce includedeveloping an effective web site that creates an at-tractive presence and that meets the needs of itsvisitors (customers), contracting out with web-sitehosting service providers or storefront brokers,building traffic into the web site through meta tag,which is a special HyperText Markup Language(HTML) tag that contains keywords about the website, and analyzing web-site traffic to identify whichsearch engines are effective for your business.
Electronic data interchange (EDI) systems pro-vide computer-to-computer communication. EDIsystems are becoming a normal way of ex-changing or transmitting documents, transactions,records, quantitative and financial information, andcomputer-related messages from one computer toanother. Some examples of transactions and docu-ments involved are purchase orders, invoices, ship-ping notices, receiving advice, acknowledgments,and payments. When payment is involved, the EDIsystem can be referred to as an Electronic FundsTransfer (EFT) system.
EDI is replacing manual data entry with electronicdata entry. The objective of EDI is to eliminate man-ual data entry work and to eliminate or reduce papermailing and processing delays between two tradingparties, for example, buyer and seller or manufac-turer and supplier.
Traditional paper-driven systems such as order en-try, purchase order, billing, and accounts payablesystems are changing significantly with the intro-duction of EDI-based systems. Some problems withtraditional paper-driven application systems are lowaccuracy, increased mailing and processing times,and high labor and processing costs.
Basically, the transmission of information betweentwo parties can take place in three ways. The firstis direct, the second is via a third-party serviceprovider, and the third is in the form of computertapes and disks.
EDI SystemEssentially, the EDI system works as follows:
1. The buyer identifies the item to be purchased.Data are entered into the purchasing applicationsystem. Translation software creates an EDI pur-chase order, which is sent electronically to thesupplier. The same order is sent to the buyer’saccounts payable and goods-receiving system.

JWBT150-Vallabhaneni c08 July 29, 2009 10:50
LEARNING OBJECTIVE 8.9: UNDERSTAND HOW ELECTRONIC COMMERCE IS FACILITATED AND MANAGED 233
2. A functional acknowledgment, indicating re-ceipt of the order, is automatically generated andelectronically transmitted to the buyer.
3. The supplier’s computer sends the order infor-mation to his shipping and invoicing systems.
4. Upon receipt by the buyer of the ship notice, thedata are electronically entered into the receivingsystem file.
5. The receipt notice is electronically transmitted tothe accounts payable application system.
6. The ship notice is electronically transmitted tothe invoicing application system.
7. An invoice is electronically generated by the sup-plier and transmitted to the buyer. The same in-formation is sent to the supplier’s accounts re-ceivable system.
8. The invoice is received by the buyer’s computerand is translated into the buyer’s format. Theinvoice, receiving notice, and purchase order areelectronically matched and reconciled.
9. The buyer electronically transmits payment tothe supplier’s bank through its own bank. Anelectronic remittance advice is transmitted to thesupplier.
10. Upon receipt of the remittance and notice of pay-ment, the data are transmitted to the accountsreceivable system, and the buyer account is up-dated. The buyer is given credit for payment.
Components of an EDI SystemThe components of an EDI system are standards, soft-ware, and networks. EDI standards consist of format-ting standards and communication standards. For-matting standards deal with the type, sequence, andcontent of an electronic document. Communicationstandards cover baud rate, protocols, electronic en-velopes, and message-transmission times. Standardsprovide a set of common rules, in terms of syntax andformatting, for the development of electronic com-munications.
In terms of software, a translation program isneeded to translate company-specific data to EDIstandard format for transmission. A reverse transla-tion is performed when data arrive at the organiza-tion from external sources.
In terms of networks, there are two approachesin common use. In a direct network, the computersof the trading partners are linked directly, usuallythrough dialup modems. A direct network is effec-tive for a limited number of trading partners. As thenumber of trading partners increases, it is difficultto maintain open lines for all trading partners. The
second choice is to use a third-party network (i.e., aVAN) that acts as an intermediary between tradingpartners. A VAN maintains a mailbox for both thesender and the receiver.
The VAN receives purchase orders from the sender(buyer), sorts them by seller, and places each seller’spurchase orders in its own mailbox. At a later time,the seller can dial into the VAN and retrieve its mailin the form of electronic purchase orders. This ap-proach allows each trading partner to create onlyone electronic transmission to the VAN rather thanhaving to create a separate electronic transmissionfor each trading partner.
Benefits of EDIA major benefit is being able to load data, withoutrekeying, from various formats and placing themwhere they are needed in a different format for fur-ther processing. Besides savings due to reductions indocument mailing and processing costs, decreases indata entry personnel costs, and reductions in inven-tory stock levels, organizations are realizing othersignificant benefits.
These added benefits include improved opera-tional efficiency in warehousing, shipping, purchas-ing, and receiving areas; increased sales; increasedcustomer responsiveness; increased ability to com-pete; and quick access to better information in atimely manner. The users of EDI include organi-zations in the trucking, retail, shipping, grocery,health-care, pharmaceutical, and automotive indus-tries, government, and others.
Electronic Funds TransferAn electronic funds transfer (EFT) system transfersmoney and other information electronically fromone institution to another. A byproduct of this ser-vice is the reduction of mountains of paper and timedelays, thereby gaining cost efficiencies. For exam-ple, banks can transfer money from an account inone bank to another account in another bank, andthe federal government can deposit benefits directlyinto recipients’ bank accounts.
A new trend in the EFT system is the transmittalof tax information electronically to tax authorities ata central processor. Information such as the amount,tax due, and employer identification number wouldbe provided to the central processor. Some advan-tages of this approach include fewer errors, lowercosts, more timely deposits, and increased elimina-tion of float associated with delays in moving funds.

JWBT150-Vallabhaneni c08 July 29, 2009 10:50
234 Learning Module 8: Information Technology
Some U.S. state governments distribute public-aidbenefits electronically. Benefit recipients who use thissystem are given magnetic cards with their pho-tographs, which they insert in special electronic de-vices at the participating check-cashing centers orbanks. The cards access computer records to tell theagents the amounts of benefits due.
Other applications include payment of unemploy-ment insurance benefits. Claimants can call the gov-ernment agency and enter their Social Security num-ber and personal identification number (PIN). Af-ter successfully answering certification questions,claimants are informed that they are to receive theirbenefits. Participants then gain access to their weeklypayments with a plastic card and a PIN throughautomated teller machines (ATMs) or point-of-sale
(POS) terminals. Those who already have a bank ac-count are given the option to directly deposit theirbenefits, and those who prefer to receive state-issuedchecks may continue to do so. This is a clear exampleof integration of such diverse technologies as POS,EFT, and ATMs.
Self-Assessment Exercise
Online exercises are provided for the learning ob-jectives in this module. Please visit www.mbaiq.com to complete the online exercises and to cal-culate your MBA IQ Score.

JWBT150-Vallabhaneni c09 July 15, 2009 14:40
LEARNING MODULE 9
Corporate Control, Law, Ethics,and Governance
Learning Objective 9.1: Understand theNature and Types of CorporateControl Systems 236Control Characteristics 236Control Design 236Control Placement 236Control Costs and Benefits 237Control Implementation 237Controls Classification 237Control Requirements 241Control Assessment 241Control Responsibilities 241
Learning Objective 9.2: Understand theNature and Types of Corporate Risks 241Risk Management Methodology 242Risk Management Tools 243Managing Corporate Risks 246
Learning Objective 9.3: Understand theScope and Nature of Business Law,Policy, and Ethics, Including SocialResponsibility 247Contract Defined 247Antitrust Laws 248Environmental Laws 250Consumer Product Safety Laws 250Food and Drug Administration Laws 250Investment Securities Laws 250Intellectual Property Laws 250Employment Laws 251Bankruptcy Laws 251Compliance Management 251Business Policy 252Business Ethics 253Corporate Social Responsibility 253The Pyramid of Corporate Social Responsibility 255
Learning Objective 9.4: Understand theVarious Issues in CorporateGovernance 256Components of Corporate Governance 256Corporate Governance Standards 256Roles of the Board of Directors 257Roles of CEOs and Senior Executives 258Need for Board Independence 259Insider Trading Scandals 259Improving Corporate Governance 260
Learning Objective 9.5: Understand theNature and Types of CorporateAudits 260Construction/Contract Audit 260Quality Audit 261Due-Diligence Audit 261Security Audit 262Safety Audit 262Privacy Audit 262Performance Audit 262Operational Audit 263
Learning Objective 9.6: Understandthe Nature and Types of CorporateFraud 263Types of Fraud 263Degree of Fraud 264Red Flags for Fraud 264Symptoms of Management Fraud 264Symptoms of Employee Fraud 265Management Representations versus Risk 265Review of Accounting Estimates 266
Learning Objective 9.7: Understand theIssues in Corporate Law RegardingAgency Problems and Costs 266
235

JWBT150-Vallabhaneni c09 July 15, 2009 14:40
236 Learning Module 9: Corporate Control, Law, Ethics, and Governance
❑ Learning Objective 9.1:UNDERSTAND THE NATURE ANDTYPES OF CORPORATE CONTROLSYSTEMSFour critical elements supporting corporate man-agement infrastructure are control systems, laws,ethics, and governance mechanisms. When one ofthese elements is broken, the other three elementsare also broken because they are all tightly inter-twined and closely connected. The infrastructurechain is as strong as its weakest link. The goal isto create a control-rich, law-abiding, fraud-free,ethics-full, and governance-compliant environmentthat is as strong as possible. This requires taking fullresponsibility and owning complete accountabilityfor both actions and inactions, which are thecornerstones of corporate management.
Control CharacteristicsControl is any positive and negative actions taken bymanagement that would result in accomplishmentof the organization’s goals, objectives, and mission.Controls are described in the form of policies, pro-cedures, standards, and rules (i.e., do’s and don’ts).Controls should not lead to compulsion or becomea constraint on employees. Controls should be nat-ural and should be embedded in the organizationalfunctions, systems, and operations. More so, controlsshould be accepted by the employees using or af-fected by them. Use and implementation of controlsshould be inviting, not inhibiting. Controls shouldbe seen as beneficial from the employee’s personaland professional viewpoints. Ideally, controls shouldfacilitate the achievement of employees’ and organi-zational goals and objectives (i.e., ensure the goal-congruence principle). In other words, any controlthat does not promote achieving the goals and ob-jectives should not be implemented. Controls shouldbe effective and efficient. Controls should not costmore than the benefits derived. Controls prevent orreduce the adverse effects of risks. Moreover, con-trolling is the result of proper planning, organizing,and directing activities—all are major functions ofmanagement. This means that controls ensure thattargeted plans are achieved.
Controls work in an additive way, meaning thattheir combined effect is far greater than the sum ofeach individual effect. Two examples follow:
Example 1: Business control A is effective 90 percentof the time, and business control B is effective 90
percent of the time. What is the combined effectof control A and B?
Answer 1: The combined effect is 99 percent. In com-bination, both controls are ineffective only 1 per-cent of the time (i.e., 0.1 × 0.1 × 100 = 1%). Thismeans the combined controls are effective 99 per-cent of the time (i.e., 100% – 1%).
Example 2: Security control A misses 30 percentof attacks, and security control B also misses 30percent of attacks. What percentage of attackswill be caught when both controls are workingtogether?
Answer 2: The combined effect is 91 percent. Incombination, both controls should only miss9 percent of attacks (i.e., 0.3 × 0.3 × 100 = 9%).This means 91 percent of attacks should be caught(i.e., 100% – 9%).
Control DesignThe complexity of an entity and the nature andscope of activities affect its control activities. Com-plex organizations with diverse activities may facemore difficult control issues than simple organiza-tions with less varied activities. An entity with de-centralized operations and an emphasis on local au-tonomy and innovation presents different controlcircumstances than a highly centralized one. A ma-jor factor that can affect controls negatively is sit-uations such as downsizing, outsourcing, and busi-ness slowdown, resulting in loss of revenues, profits,and employees, in that controls are either relaxedor turned off. Management can override controlsbecause they do not see the need for controls un-der these situations, when in fact more controls areneeded to counterbalance the adverse effects of thesesituations. Other factors that influence an entity’scomplexity and, therefore, the nature of its controlsinclude location and geographic dispersion, the ex-tensiveness and sophistication of operations, and in-formation processing methods. All these factors af-fect an entity’s control activities, which need to bedesigned accordingly to contribute to the achieve-ment of the entity’s objectives. Simply stated, thenature and amount of controls needed depends onthe level of risk. High-risk business situations re-quire stronger controls and vice versa. Controls thatare designed but not implemented are of no use.
Control PlacementControls should be placed where control-relatedactivities are taking place and where risks are the

JWBT150-Vallabhaneni c09 July 15, 2009 14:40
LEARNING OBJECTIVE 9.1: UNDERSTAND THE NATURE AND TYPES OF CORPORATE CONTROL SYSTEMS 237
greatest. Examples of control activities includemanagement approvals, authorizations, verifica-tions, reconciliations, reviews of operating budgetsand performance, security of assets, mergers andacquisitions, and segregation of duties.
Control Costs and BenefitsA cost–benefit analysis is advised during the pro-cess of designing each type of control into businessfunctions and systems. Ideally, costs should neverexceed the benefits to be derived from installingcontrols. However, costs should not always be thesole determining factor because it may be difficult orimpractical to quantify benefits such as timeliness,improved quality and relevance of data and infor-mation, and improved customer service and systemresponse time. Sometimes, controls are simplyneeded to comply with government regulation with-out any measurable benefit.
When controls are properly planned, designed, de-veloped, tested, implemented, and followed, theyshould meet as many as possible of the followingattributes: practical, reliable, simple, complete, op-erational, usable, appropriate, cost-effective, timely,meaningful, reasonable, and consistent.
Control ImplementationCosts of controls vary with their implementationtime and the complexity of the system or operation.Control implementation time is important to realizebenefits from installing appropriate controls. For ex-ample, it costs significantly more to correct a designproblem in the implementation phase of an appli-cation system under development than it does toaddress it in the early planning and design phases.
There are trade-offs among costs, controls, and con-venience factors as they affect a system’s usability,maintainability, auditability, controllability, and se-curability. For example:
� High-risk systems and complex systems and oper-ations require more controls and cost more.
� Excessive use of tight-security features and con-trol functions can be costly and may complicateprocedures, degrade system performance, and im-pair system functionality, which could ultimatelyinhibit the system’s usability.
� System users prefer as few integrity and securitycontrols as possible—only those needed to makethe system really usable.
� The greater the maintainability of the system, theeasier it is for a programmer to modify it. Similarly,the greater the maintainability of the system, theless expensive it is to operate in the long run.
Controls ClassificationControls are classified in several ways because con-trols work in different locations and functions, at dif-ferent times with different results, and all achievingdifferent objectives set by various managers.
Classifying Controls by Their NatureOne way of classifying controls is by their nature,such as management controls, technical controls, andoperational controls.
Management controls, in the broadest sense, in-clude the plan of organization, methods, and pro-cedures adopted by management to ensure that itsgoals and objectives are met (i.e., ensure the goal-congruence principle). Management controls, alsoknown as internal controls, include accounting andadministrative controls. Internal control is a processwithin an organization designed to provide reason-able assurance regarding the achievement of thesefive primary objectives: (1) reliability and integrityof information, (2) compliance with policies, plans,procedures, laws, regulations, and contracts, (3) safe-guarding of assets, (4) economical and efficient useof resources, and (5) accomplishment of establishedobjectives and goals for operations and programs.Internal controls include procedural checks and bal-ances that safeguard assets and ensure data integrity.The internal control system is intertwined with anentity’s operating activities and exists for funda-mental business reasons. Internal controls are mosteffective when they are built into the entity’s infras-tructure and are part of the essence of the enterprise.They should be “built in” rather than “built on.”Building in controls can directly affect an entity’sability to reach its goals and supports businesses’quality initiatives. The quest for quality is directlylinked to how businesses are run.
As discussed in Learning Module 1, “General Man-agement, Leadership, and Strategy,” managementcontrols are divided into feed-forward, concurrent,and feedback.
Management control systems must be integratedwith ongoing management practices and, whereappropriate and effective, with other managementinitiatives, such as productivity improvement, qual-ity improvement, business process improvement,

JWBT150-Vallabhaneni c09 July 15, 2009 14:40
238 Learning Module 9: Corporate Control, Law, Ethics, and Governance
reengineering, and performance measures and stan-dards. Examples of management practices includeperiodic staff meetings, quarterly management re-views, budget planning and execution, and varianceanalysis.
Management control systems must be effective andefficient—balancing the costs of control mechanismsand processes with the benefits the systems are in-tended to provide or control. They should identifywho is accountable and provide accountability forall activities.
Traditional management controls include the pro-cess for planning, organizing, directing, and control-ling the entity’s operations. They include the man-agement control systems for measuring, reporting,and monitoring operations. Specifically, they includeautomated and manual systems, policies and proce-dures, rules of behavior, individual roles and respon-sibilities, and other ongoing management activitiesthat help ensure risks are managed and controlled.Internal auditing is an important part of manage-ment control.
Several contemporary management controls haveevolved over the years, including economic-value-added, market-value-added, activity-based costing,open-book management, and the balanced scorecardsystem.
Technical controls focus on engineering specifica-tions for manufacturing a product or security con-trols over computer systems. The controls can pro-vide automated protection for unauthorized accessor misuse, facilitate detection of security violations,and support security requirements for applicationsystems and data. The topical areas to review includeidentification and authentication mechanisms, logi-cal access controls, and audit trails. Technical con-trols are hardware and software controls used toprovide automated protection to the IT system orapplications. They operate within the technical sys-tem and applications.
Operational controls are the day-to-day proce-dures and mechanisms used to control operationalactivities, such as scheduling, shipping, and billing,to ensure that they are carried out effectively and ef-ficiently. They also address computer security meth-ods focusing on mechanisms primarily implementedand executed by people as opposed to computer sys-tems. These controls are put in place to improve thesecurity of a particular computer system or group ofsystems. They often require technical or specializedexpertise and often rely on management controls andtechnical controls.
Classifying Controls by Time DimensionAnother way of classifying controls is by time di-mension, using three different dimensions of timing:precontrol, concurrent control, and postcontrol.
Precontrol (e.g., policy) anticipates problems andis proactive in nature. Concurrent control is exer-cised through supervision and monitoring and isongoing. Postcontrol identifies deviations from stan-dards or budgets and calls for corrective action andis similar to feedback control. Precontrol and feed-forward controls are interrelated since they deal withfuture-directed actions. Forecasting, budgeting, andreal-time computer systems are examples of feed-forward controls. Precontrol is the most preferredaction; the least preferred action is postcontrol. Thedifference is when a corrective action is taken—thesooner the better. The following is a comparisonbetween controls by nature and controls by time:
Feed-forward control PrecontrolConcurrent control Concurrent controlFeedback control Postcontrol
Classifying Controls by Their LocationAnother way of classifying controls is by their loca-tion, such as centralized control and decentralizedcontrol.
Centralized control means control is located atthe headquarters from which senior managementworks. Centralized control, another name for bu-reaucratic control, involves monitoring and influ-encing employee behavior through extensive use ofrules, policies, hierarchy of authority, written docu-mentation, reward systems, and other formal mech-anisms. Many traditional companies use top-downbudgeting, which means that the budgeted amountsfor the coming year are literally imposed by seniormanagers on middle and lower-level managers.
Decentralized control is located at the field (e.g.,local factory, office, warehouse, and department)where operating and division management works.Decentralized control relies on cultural values, tra-ditions, shared beliefs, and trust to foster compli-ance with organizational goals. Managers operateon the assumption that employees are trustworthyand willing to perform effectively without extensiverules and standards and with little or no supervi-sion. The movement toward employee empower-ment, participation, and learning means that manyorganizations are adopting bottom-up budgeting, aprocess in which middle and lower-level managers

JWBT150-Vallabhaneni c09 July 15, 2009 14:40
LEARNING OBJECTIVE 9.1: UNDERSTAND THE NATURE AND TYPES OF CORPORATE CONTROL SYSTEMS 239
anticipate their departments’ resource needs andpass them up to senior managers for approval.
Classifying Controls by Their MeasuringStrengthAnother way of classifying controls is by theirmeasuring strength, such as hard controls and softcontrols.
Hard controls are formal, tangible, and easier tomeasure and evaluate. Examples of hard controls in-clude budgets, dual controls, written approvals, rec-onciliations, authorization levels, verifications, andsegregation of duties. Tools to evaluate hard controlsinclude flowcharts, system narratives, testing, andcounting.
Soft controls are informal, intangible, subjective,and difficult to measure and evaluate. Examplesof soft controls include an organization’s ethicalclimate, integrity, values, culture, and vision; peo-ple’s behaviors, attitudes, and commitment to com-petence; tone at the top; management philosophy;management’s operating style, level of understand-ing, and commitment; and communication. Tools toevaluate soft controls include self-assessments, ques-tionnaires, interviews, and workshops.
Generally speaking, senior managers most oftenuse soft skills and soft controls to achieve their ob-jectives; middle and lower-level managers most of-ten use hard skills and hard controls. Soft skillsinclude written/oral and listening communicationskills, and people skills such as interpersonal, moti-vation, implementation, teamwork, negotiation, andleadership skills. Hard skills include analytical,technical, mathematical, problem-solving, decision-making, and functional skills.
However, managers at all levels in the hierar-chy deal with soft issues (e.g., handling employeelow-morale issues, employee high-job-turnover is-sues, employee disciplinary actions, and labor uniongrievance issues) and hard issues (e.g., handlingtough competitors, increasing revenues, decreasingcosts, increasing profits, increasing market share,and increasing stock price of a company).
Classifying Controls by Their Action, Objective,or FunctionAnother way of classifying controls is by their action,objective, or function, such as directive controls, pre-ventive controls, detective controls, corrective con-trols, recovery controls, manual controls, and com-puter controls.
Directive controls are actions, policies, proce-dures, directives, standards, circulars, regulations,or guidelines that cause or encourage a desirableevent to occur. By their broad nature set by man-agement, directive controls affect the entire businessunit, function, system, or operation, and have far-reaching and long-lasting effects.
A specific example of a directive control is requir-ing all accountants and auditors to be certified. An-other specific example of directive control is pro-viding management with assurance of achieving thespecified minimum gross margins on sales.
Preventive controls are actions taken to deter un-desirable events from occurring. Examples includesegregation of duties, use of checklists, use of sys-tems development methodology, competent staff,use of passwords, authorization procedures, anddocumentation. Segregation of duties means dutiesare divided among different people to reduce therisk of errors, fraud, or inappropriate actions. Forexample, it includes dividing the responsibilities forauthorizing transactions, recording them, and han-dling the related asset. A manager authorizing creditsales would not be responsible for maintaining ac-counts receivable records or handling cash receipts.Similarly, salespersons would not have the ability tomodify product price files or commission rates. Itcalls for a separation of the functional responsibil-ities of custodianship, record keeping, operations,and authorization.
In general, sound prevention is better than detec-tion and correction. However, prevention is not al-ways possible or cost effective. Prevention, althoughexpensive sometimes, is the primary control func-tion. It is good to implement a dual-control conceptin that two-person control, two physical keys, or twoencryption keys are better than one-person controlor one key.
Detective controls are actions taken to detect un-desirable events that have occurred. The installa-tion of detective controls is necessary to providefeedback on the effectiveness of directive and/orpreventive controls or whether standards or guide-lines have been met. Examples include reviewsand comparisons, bank reconciliations, accountreconciliations, and physical counts. They detectcomputer attacks, crime, fraud, errors, omissions,and irregularities and identify aspects of systemquality, control, and security features that needmanagement’s attention. Detective controls includeboth manual and automated tools and techniquesand measure the effectiveness of preventive steps.

JWBT150-Vallabhaneni c09 July 15, 2009 14:40
240 Learning Module 9: Corporate Control, Law, Ethics, and Governance
Usually, general-purpose detection and correction isbetter than special-purpose detection and correctiondue to its cost effectiveness and broad usage.
Corrective controls are actions taken to correct un-desirable events that have occurred. They fix bothdetected and reported errors. Examples include cor-rection procedures, documentation, and control andexception reports. Corrective controls provide infor-mation, procedures, and instructions for correctingdetected attacks, errors, omissions, and irregulari-ties. They may simply identify the areas where cor-rective action is required, may actually facilitate thecorrective action, and include both manual and au-tomated tools and techniques.
Recovery controls are actions taken to ensurethe continuity of business operations and computersystems. They facilitate application system backup,restoration, recovery, and restart after any attacksor interruption in information processing. They pro-mote an orderly environment in which all requiredresources are readily available to ensure a reasonablysmooth recovery from disaster. This permits contin-uation of a specific activity or of the entire operationof the organization.
Manual controls include budgets, forecasts, poli-cies, and procedures; reporting; and physical con-trols over equipment, inventories, securities, cash,and other assets, which are periodically counted andcompared with amounts shown on control records.
Computer controls include general controls andapplication controls. General controls include datacenter operations controls, system software controls,access security controls, and application system de-velopment and maintenance controls. Applicationcontrols are designed to control application process-ing, helping to ensure the completeness and accuracyof transaction processing, authorization, and valid-ity. Many application controls depend on computer-ized edit checks. These edit checks consist of format,existence, reasonableness, and other checks on thedata, which are built into each application duringits development. When these checks are designedproperly, they can help provide control over the databeing entered into the computer system. Computercontrols are performed to check accuracy, complete-ness, and authorization of transactions.
Classifying Controls by How They InteractAnother way of classifying controls is how theyinteract with each other. This includes combina-tion controls, complementary controls, compensat-ing controls, contradictory controls, and risk avoid-ance controls.
Rarely would a single control suffice to meet con-trol objectives. Rather, a combination of controls isneeded to make up a whole and to provide a magni-fying effect. For example, supervisory reviews andapprovals are combined with the organization’s poli-cies, procedures, and standards.
An example of a combination of controls is a sit-uation where fire-resistant materials are used in thecomputer center (a preventive control) to preventa fire, while smoke and fire detectors are used todetect smoke and fire (a detective control), and fireextinguishers are used to put out the fire (a correc-tive control). Here a single preventive control wouldnot be sufficient. All three controls are needed to beeffective.
Complementary controls (hand-in-hand controls)have an important place in both the manual andthe automated control environment. Complemen-tary controls are different from compensating con-trols where in the latter category weak controls inone area or function are balanced by strong controlsin other areas or functions and vice versa. A functionor an area need not be weak to use complementarycontrols.
Complementary controls can enhance the effec-tiveness of two or more controls when applied toa business function, computer system, or operation.Examples of complementary controls include accessprofiles, user IDs, and passwords, where these con-trols together can provide a moderate level of ac-cess control mechanism. These individual controlsare effective as standalone and are maximized whencombined or integrated with each other. These indi-vidual controls have an additive nature to producea synergistic effect. These complementary controlsshould fit with each other in order to obtain maxi-mum benefit.
The purpose of compensating controls is to bal-ance weak controls in one area with strong controlsin another related area and vice versa. If actions ofindividuals or systems were not recorded before, im-plementing a log now to record such actions is an ex-ample of compensating control. Another dimensionis that automated controls compensate for the weak-nesses in or lack of manual controls. For example, ifmanual controls over program changes were weak,automated software management is a compensatingcontrol.
Contradictory controls are those controls that actagainst each other. Such controls should be elimi-nated or reassessed because they confuse employeesand are counterproductive. An example is one policyencouraging employees to do telecommuting work

JWBT150-Vallabhaneni c09 July 15, 2009 14:40
LEARNING OBJECTIVE 9.2: UNDERSTAND THE NATURE AND TYPES OF CORPORATE RISKS 241
(one control) and another policy restricting employ-ees from carrying software home from work (contra-dictory control).
The rationale behind the risk avoidance control isthat the management view of a resource has to beisolated from the implementation of that resource.Resources are entities within a system or networkof systems that require management. Resources caninclude physical entities (e.g., printers, libraries, androuters) or logical entities (e.g., users, groups). Thegoal of risk avoidance controls is to separate two en-tities from each other so that they are safe and secureand that potential risk from their being together isavoided. Examples include separating assets fromthreats to avoid potential risk, separating computerequipment from radio receivers to avoid the spreadof electromagnetic signals for possible interceptionby outsiders, separating production libraries fromtest libraries to avoid possible contamination of pro-gram code and corruption of data, separating sys-tem development procedures from data entry pro-cedures, and separating system components fromeach other.
Control RequirementsThe auditor needs to understand the control re-quirements of a business function operation beforeassessing control strengths and weaknesses. Inother words, there should be a basis or baseline inplace (i.e., standards, guidelines, and benchmarks)prior to control measurement and assessment. Inthe absence of a baseline of standards, auditor’sfindings, conclusions, and recommendations will bequestioned and will not be accepted by the auditee.Usually the basis is:
� Technical standards� Operations standards� Administrative standards� Industry standards
Control AssessmentDuring an assessment of control strengths and weak-nesses, the auditor might run into situations wherea business function, system, or manual/automatedprocedure is overcontrolled or undercontrolled. Thismeans that there may be too many controls in onearea and not enough controls in other areas. Also,there may be duplication or overlapping of controlsbetween two or more areas. Under these conditions,the auditor should recommend to eliminate some
functional user controls, some information systemcontrols, some manual controls, some automatedcontrols, or a combination of them. The same maybe true of situations where a system or operationis oversecured or undersecured and where an ap-plication system is overdesigned or underdesigned.This assessment requires differentiating between rel-evant and irrelevant information, considering com-pensating controls, considering interrelationships ofcontrols, and judging materiality and significance ofaudit findings taken separately and as a whole.
Control ResponsibilitiesWho is responsible for establishing and ensuringan adequate and effective internal control environ-ment within the organization? It is the companymanagement, the audit committee, and the boardof directors—not the auditors (internal or exter-nal). Here “company management” refers to seniormanagement, operating management, and depart-ment/division management, who are responsiblefor ensuring the adequacy of disclosures in the finan-cial statements of a publicly held company. Auditorsare responsible for ensuring an adequate and effec-tive system of internal control in the organization.Simply put, management establishes controls, andauditors evaluate such controls. External parties alsoinfluence controls indirectly (e.g., customers, suppli-ers, legislators, regulators, financial analysts, bondraters, and news media).
❑ Learning Objective 9.2:UNDERSTAND THE NATUREAND TYPES OF CORPORATE RISKSRisk is the possibility of something adverse happen-ing to an organization. Risk management is the pro-cess of assessing risk, taking steps to reduce risk to anacceptable level, and maintaining that level of risk.Risk management encompasses three processes: riskassessment, risk mitigation, and risk evaluation.
Risk Management = Risk Assessment+ Risk Mitigation + Risk Evaluation
Risk assessment includes identification and evalu-ation of risks and risk impacts and recommendationof risk-reducing measures. Risk mitigation refersto prioritizing, implementing, and maintaining theappropriate risk-reducing measures recommendedfrom the risk assessment process. Risk evaluationis a continual process for implementing a successful
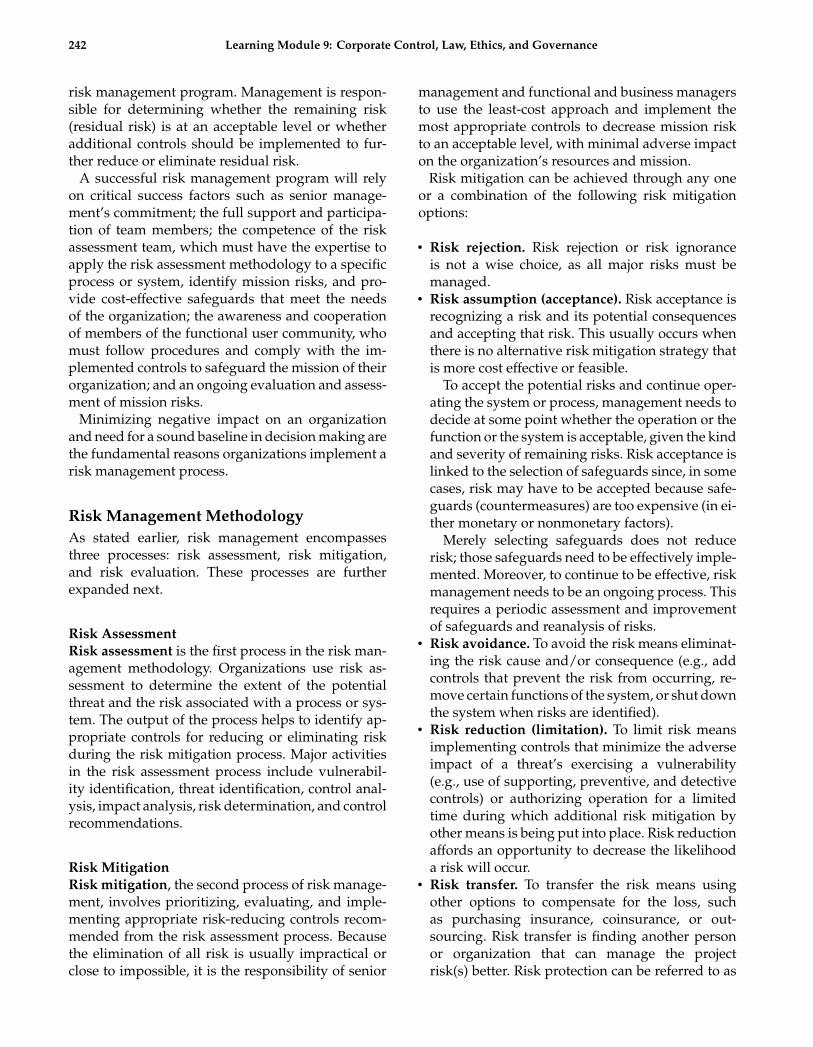
JWBT150-Vallabhaneni c09 July 15, 2009 14:40
242 Learning Module 9: Corporate Control, Law, Ethics, and Governance
risk management program. Management is respon-sible for determining whether the remaining risk(residual risk) is at an acceptable level or whetheradditional controls should be implemented to fur-ther reduce or eliminate residual risk.
A successful risk management program will relyon critical success factors such as senior manage-ment’s commitment; the full support and participa-tion of team members; the competence of the riskassessment team, which must have the expertise toapply the risk assessment methodology to a specificprocess or system, identify mission risks, and pro-vide cost-effective safeguards that meet the needsof the organization; the awareness and cooperationof members of the functional user community, whomust follow procedures and comply with the im-plemented controls to safeguard the mission of theirorganization; and an ongoing evaluation and assess-ment of mission risks.
Minimizing negative impact on an organizationand need for a sound baseline in decision making arethe fundamental reasons organizations implement arisk management process.
Risk Management MethodologyAs stated earlier, risk management encompassesthree processes: risk assessment, risk mitigation,and risk evaluation. These processes are furtherexpanded next.
Risk AssessmentRisk assessment is the first process in the risk man-agement methodology. Organizations use risk as-sessment to determine the extent of the potentialthreat and the risk associated with a process or sys-tem. The output of the process helps to identify ap-propriate controls for reducing or eliminating riskduring the risk mitigation process. Major activitiesin the risk assessment process include vulnerabil-ity identification, threat identification, control anal-ysis, impact analysis, risk determination, and controlrecommendations.
Risk MitigationRisk mitigation, the second process of risk manage-ment, involves prioritizing, evaluating, and imple-menting appropriate risk-reducing controls recom-mended from the risk assessment process. Becausethe elimination of all risk is usually impractical orclose to impossible, it is the responsibility of senior
management and functional and business managersto use the least-cost approach and implement themost appropriate controls to decrease mission riskto an acceptable level, with minimal adverse impacton the organization’s resources and mission.
Risk mitigation can be achieved through any oneor a combination of the following risk mitigationoptions:
� Risk rejection. Risk rejection or risk ignoranceis not a wise choice, as all major risks must bemanaged.
� Risk assumption (acceptance). Risk acceptance isrecognizing a risk and its potential consequencesand accepting that risk. This usually occurs whenthere is no alternative risk mitigation strategy thatis more cost effective or feasible.
To accept the potential risks and continue oper-ating the system or process, management needs todecide at some point whether the operation or thefunction or the system is acceptable, given the kindand severity of remaining risks. Risk acceptance islinked to the selection of safeguards since, in somecases, risk may have to be accepted because safe-guards (countermeasures) are too expensive (in ei-ther monetary or nonmonetary factors).
Merely selecting safeguards does not reducerisk; those safeguards need to be effectively imple-mented. Moreover, to continue to be effective, riskmanagement needs to be an ongoing process. Thisrequires a periodic assessment and improvementof safeguards and reanalysis of risks.
� Risk avoidance. To avoid the risk means eliminat-ing the risk cause and/or consequence (e.g., addcontrols that prevent the risk from occurring, re-move certain functions of the system, or shut downthe system when risks are identified).
� Risk reduction (limitation). To limit risk meansimplementing controls that minimize the adverseimpact of a threat’s exercising a vulnerability(e.g., use of supporting, preventive, and detectivecontrols) or authorizing operation for a limitedtime during which additional risk mitigation byother means is being put into place. Risk reductionaffords an opportunity to decrease the likelihooda risk will occur.
� Risk transfer. To transfer the risk means usingother options to compensate for the loss, suchas purchasing insurance, coinsurance, or out-sourcing. Risk transfer is finding another personor organization that can manage the projectrisk(s) better. Risk protection can be referred to as

JWBT150-Vallabhaneni c09 July 15, 2009 14:40
LEARNING OBJECTIVE 9.2: UNDERSTAND THE NATURE AND TYPES OF CORPORATE RISKS 243
“insurance” against certain events. Risk protectioninvolves doing something to allow the project tofall back on additional or alternative resourcesshould the scheduled resource(s) fail.
� Risk contingency. This means to define the neces-sary alternative steps needed if an identified riskevent should occur.
� Risk compliance. It is necessary to comply withall the applicable laws and regulations in a timelyand proper manner in order to reduce compliancerisk.
� Residual risk. Organizations can analyze theextent of the risk reduction generated by new orenhanced controls in terms of the reduced threatlikelihood or impact. The risk remaining after theimplementation of new or enhanced controls isresidual risk. Practically no system or process isrisk free, and not all implemented controls caneliminate the risk they are intended to address orreduce the risk level to zero.
Implementation of new or enhanced controls canmitigate residual risk by:� Eliminating some of the system’s vulnerabilities
(flaws and weaknesses), thereby reducing thenumber of possible threat-source/vulnerabilitypairs
� Adding a targeted control to reduce the capacityand motivation of a threat-source (e.g., if techni-cal controls are expensive, then consider admin-istrative and physical controls)
� Reducing the magnitude of the adverse impact(e.g., limiting the extent of a vulnerability ormodifying the nature of the relationship betweenthe IT system and the organization’s mission)If residual risk has not been reduced to an ac-
ceptable level, the risk management cycle must berepeated to identify a way of lowering the residualrisk to an acceptable level.
Risk EvaluationRisk evaluation, the third and final process of riskmanagement, is a continual evaluation process sincechange is a constant thing in most organizations.Possible changes include: new businesses are ac-quired, new products are introduced, new servicesare provided, networks are updated and expanded,network components are added or removed, appli-cations software is replaced or updated with newerversions, personnel changes are made, and securitypolicies are updated. These changes mean that newrisks will surface and risks previously mitigated may
again become a concern. Thus, the risk evaluationprocess is ongoing and evolving.
Risk Management ToolsMeasuring risk can be difficult, and in practice avariety of approaches are used, ranging from sim-ply adjusting costs up or benefits down or adjustingrisk levels, dollar amounts, and probabilities to theuse of statistical modeling and Monte Carlo sim-ulation. A few of the more commonly used toolsand techniques include business impact analysis;cost–benefit analysis; strengths, weaknesses, oppor-tunities, and threats (SWOT) analysis (situation anal-ysis); sensitivity analysis; gap analysis; option analy-sis; economic analysis; expected value analysis; andsubjective scoring. It is a good business practice tocombine quantitative methods with qualitative tech-niques to obtain broad perspectives.
Business Impact AnalysisA business impact analysis (BIA) is a critical stepin understanding the impact of various threats,exposures, and risks facing an organization. Thisanalysis can be applied to any business function,operation, or mission. The results of the BIA are thenintegrated into business strategies, plans, policies,and procedures.
Example of BIA Application
An example of BIA application includes deter-mining objective risk resulting from fire incidentsfor two warehouses of a major corporation. Eachwarehouse has the same area (one million squarefeet), and each warehouse has a total of 100 minorand major fire incidents per year. The CorporateRisk Management department estimated thenumber of fire incidents during the next year asfollows:
Fire incidents for Warehouse 1 can range from95 to 105, based on the most likely estimate.
Fire incidents for Warehouse 2 can range from80 to 120, based on the most likely estimate.
What is the degree of risk for each warehouse?Which warehouse has the higher degree of risk?
Degree of Risk for Warehouse 1= (105 − 95)/100 = 10%
Degree of Risk for Warehouse 2= (120 − 80)/100 = 40% (Continued )

JWBT150-Vallabhaneni c09 July 15, 2009 14:40
244 Learning Module 9: Corporate Control, Law, Ethics, and Governance
The degree of risk for Warehouse 2 is four timesthat for Warehouse 1, even though the chances offire incidents are the same for both warehouses.
Cost–Benefit AnalysisTo allocate resources and implement cost-effectivesecurity controls, organizations, after identifying allpossible controls and evaluating their feasibility andeffectiveness, should conduct a cost–benefit analy-sis for each proposed control to determine whichcontrols are required and appropriate for their cir-cumstances.
The cost–benefit analysis can be qualitative andquantitative. Its purpose is to demonstrate that thecosts of implementing the controls can be justified bythe reduction in the level of risk. A cost–benefit anal-ysis for proposed new controls or enhanced controlencompasses the following:
� Determining the impact of implementing the newor enhanced controls.
� Determining the impact of not implementing thenew or enhanced controls.
� Estimating the costs of the implementation. Thesemay include hardware and software purchases; re-duced operational effectiveness if system perfor-mance or functionality is reduced for increasedsecurity; cost of implementing additional poli-cies and procedures; cost of hiring additional per-sonnel to implement proposed policies, proce-dures, or services; and training and maintenancecosts.
� Assessing the implementation costs and benefitsagainst system and data criticality to determinethe importance to the organization of implement-ing the new controls, given their costs and relativeimpact.
The organization will need to assess the benefitsof the controls in terms of maintaining an acceptablemission posture for the organization. Just as thereis a cost of implementing a needed control, there isa cost of not implementing it. By relating the resultof not implementing the control to the mission, theorganization can determine whether it is feasible toforgo its control implementation.
SWOT AnalysisThe scope of situation or SWOT analysis includesan assessment of an organization’s key strengths (S),
weaknesses (W), opportunities (O), and threats (T).It considers several factors, such as the firm itself,the organization’s industry, the competitive position,functional areas of the firm, and management of thefirm.
Sensitivity AnalysisSensitivity analysis includes scenario (what-if)planning and simulation studies. Sensitivity analysisindicates how much change in outputs will occur inresponse to a given change in inputs. As applied toinvestments, it indicates how much an investment’sreturn (or net present value, NPV) will change inresponse to a given change in an independent in-put variable, with all other factors held constant.This technique can be used on one variable at a timeor on a group of variables (sometime referred to asscenario analysis). Typically, investment returns aremore sensitive to changes in some variables than tochanges in others.
Gap AnalysisGap analysis determines the difference betweenthe actual outcome and the expected outcome.The gap can be reduced, though not eliminated,through strategies, contingency plans, and specificaction steps after identifying the root causes ofthe gap.
Option AnalysisOption (choice) analysis is more a framework forcritical thinking than a model, requiring analysts toask whether all options for managing uncertaintyhave been considered. Option analysis may be sub-divided into sequential decision analysis and irre-versible investment theory.
Economic AnalysisThe scope of economic analysis includes breakevenanalysis, capital budgeting analysis (e.g., paybackperiod, net present value (NPV), internal rate of re-turn (IRR), and profitability index), and financialratio analysis such as return on investment (ROI),return on quality (ROQ), return on assets (ROA), re-turn on training (ROT), and return on sales (ROS).These deal with quantitative data in terms of dollarsand ratios.

JWBT150-Vallabhaneni c09 July 15, 2009 14:40
LEARNING OBJECTIVE 9.2: UNDERSTAND THE NATURE AND TYPES OF CORPORATE RISKS 245
Expected Value AnalysisExpected value analysis involves the assignment ofprobability estimates to alternative outcomes andsumming the products of the various outcomes. Forexample, the price of crude oil per barrel today is$10.80 and there is a 25 percent probability of theprice rising to $11.50 in the next year, a 25 percentchance it will fall to $10.50, and a 50 percent chance ofa slight increase to $11.00. The expected value (EV) ofthe future price of one barrel of crude oil would be:
EV = 0.25 × $11.50 + 0.25 × $10.50 + 0.50 × $11.00= $11.00
Subjective ScoringSubjective scoring involves assigning weights to re-sponses to questions addressing areas that mightintroduce elements of risk. The resulting risk scoremay be just one component of an overall subjectiveproject or investment evaluation. Evaluation criteriaare individually weighted to reflect their concept ofinherent risk. Identified risk factors should be lim-ited to a few points for manageability and under-standability and for meaningful interpretation of theresults.
Quantitative MethodsOrganizations should use both quantitative andqualitative methods to obtain a comprehensive pic-ture of risks. Examples of quantitative methods in-clude five specific approaches:
1. Exposure factor. This risk metric provides a per-centage measure of potential loss—up to 100 per-cent of the value of the asset.
2. Single-loss exposure value. Single-loss exposurevalue is computed by multiplying the asset valuewith the exposure factor. This risk metric presentsthe expected monetary cost of a threat event.For example, an earthquake may destroy criticalinformation technology and communications re-sources, thereby preventing an organization frombilling its clients for perhaps a week—until re-placement resources can be established—eventhough the necessary information may remainintact.
Financial losses from a single event could bedevastating. Alternatively, the threat of opera-tional errors costing individually from hundreds
to a few thousands of dollars—none devastat-ing or even individually significant—may occurmany times a year with a significant total annualcost and loss of operational efficiency.
3. Annualized rate of occurrence. Threats may oc-cur with great frequency, rarely, or anywherein between. Seemingly minor operational threatsmay occur many times every year, adding upto substantial loss, while potentially devastat-ing threats, such as a 100-year flood, a fire, ora hacker who destroys critical files, may occuronly rarely. Annualizing threat frequency allowsthe economic consequences of threat events tobe addressed in a sound fiscal manner, muchas actuarial data enable insurance companies toprovide valuable and profitable services to theirclients.
4. Probability of loss. Probability of loss is thechance or likelihood of expected monetary lossattributable to a threat event. For example, lossdue to operational error may extend from a 1/10chance of losing $10 million annually to a 1/100chance of losing $1 billion annually, provided theright combinations of conditions are met. Notethat there is little utility in developing the proba-bility of threat events for anything but relativelyrare occurrences. The annualized probable mone-tary loss can be useful in budgeting.
5. Annualized loss expectancy. The simplest ex-pression of annualized loss expectancy is derivedby multiplying the annualized rate of occurrence(i.e., threat frequency) with the single-loss expo-sure value. For example, given an annual rate ofoccurrence of 1/10 and a single-loss exposure of$10 million, the expected loss annually is 1/10 ×$10 million = $1 million. This value is central inthe cost–benefit analysis of risk mitigation and inensuring proportionality in resources allocated toprotection of assets.
Qualitative MethodsExamples of qualitative methods include judgmentand intuitive (gut feel) approach, checklists, self-assessments, focus groups, interviews, surveys, andDelphi technique. In the Delphi technique, subjectmatter experts (SMEs) present their own view ofrisks independently and anonymously, which arethen centrally compiled. The process is repeated un-til consensus is obtained. The Delphi technique is amethod used to avoid groupthink, as SMEs do notmeet face-to-face to make decisions.

JWBT150-Vallabhaneni c09 July 15, 2009 14:40
246 Learning Module 9: Corporate Control, Law, Ethics, and Governance
Managing Corporate RisksThe following five plans and controls should be im-plemented to manage corporate risks on an ongoingbasis:
1. Manage existing safeguards and controls. The day-to-day management of existing safeguards andcontrols ranges from the robust access controlfor information assets, to enforcement of systemsdevelopment standards, and to awareness andmanagement of the physical environment andassociated risks. Many other essential areas ofsafeguard and control must be administeredand practiced daily. These include, but are notlimited to, personnel procedures, change control,information valuation and classification, andcontingency planning.
2. Periodically assess risks. In order to determinewhether all necessary and prudent safeguardsand controls are in place and efficiently adminis-tered, associated risks must be assessed periodic-ally, preferably with quantitative risk assessment.An insecure information technology environmentmay appear on the surface to be securely adminis-tered, but quantitative risk assessment can revealsafeguard or control inadequacies. Effective appli-cation of the results of that assessment, throughrisk mitigation and associated cost–benefit analy-sis, can lead to the assurance of efficient safeguardor control of organization assets and improvedbottom-line performance.
3. Mitigate risks by implementing and efficiently admin-istering safeguards and controls. It is important toremedy situations where risk assessment showsthat safeguards or controls are not in place or arenot effectively administered.
4. Do risk assessment and strategic planning. Quanti-tative risk assessment, applied in the considera-tion of alternative strategic plans, can reveal un-acceptable risks in an otherwise-sound businesscase. Failure to assess the risks associated withalternative strategic plans can result in the imple-mentation of plans at significant monetary loss.That loss is a consequence of being unaware of, orinadequately considering, risks.
5. Implement a enterprise risk management (ERM)program. Traditionally, corporate risk manage-ment focused on a partial portfolio of risks (siloapproach), specifically on financial and hazardrisks. The scope was narrow, ignoring all the otherrisks impacting the organization. It did not exploitthe “natural hedges” and “portfolio effects” in the
collective. It tended to treat risk as a downsidephenomenon.
Now ERM focuses on the total portfolio ofrisks, including financial, hazard, strategic, andoperational risks. The scope of ERM is muchbroader than the traditional view with the objec-tive of creating, protecting, and enhancing share-holder value. The ERM treats risk as both anupside and downside phenomenon since it inte-grates all risks.
Five alternative risk-transfer tools, other thantraditional insurance, are (1) captives, (2) finan-cial insurance, (3) multiline/multiyear insurance,(4) multiple-trigger policies, and (5) securitization.Multiple-trigger policies and securitization tools aremore commonly used.
1. Captives are where a noninsurance firm for thepurpose of accepting the risk of the parent firmowns an insurer. Captives combine risk transferand risk retention.
2. Financial insurance contracts are based onspreading risk over time, as opposed to acrossa pool of similar exposures. These contracts usu-ally involve a sharing of the investment returnsbetween the insurer and the insured.
3. Multiline/multiyear insurance contracts com-bine a broad array of risks (multiline) into a con-tract with a policy period that extends over mul-tiple years (multiyear). For example, a pure riskmay be combined with a financial risk.
4. Multiple-trigger policies reflect the source of therisk, which is not as important as the impact of therisk on a firm’s earnings. A pure risk is combinedwith a financial risk. The policy is triggered, andpayment is made, only upon the occurrence of anadverse event.
5. Securitization involves the creation of securitiessuch as bonds, or derivatives contracts, options,swaps, and futures, which have a payout or pricemovement that is linked to an insurance risk. Ex-amples include catastrophe options, earthquakebonds, catastrophe bonds, and catastrophe equityputs.
Scorecards, action plans, and monitoring are partof the ERM approach. Scorecards include metrics, atimeframe for managing the risk, and a link to share-holder value. Action plans include identifying a riskchampion and determining milestones. Monitoringincludes progress reviews and review for validity ofmetrics.

JWBT150-Vallabhaneni c09 July 15, 2009 14:40
LEARNING OBJECTIVE 9.3: UNDERSTAND THE SCOPE AND NATURE OF BUSINESS LAW, POLICY, AND ETHICS 247
❑ Learning Objective 9.3:UNDERSTAND THE SCOPE ANDNATURE OF BUSINESS LAW,POLICY, AND ETHICS,INCLUDING SOCIALRESPONSIBILITYBusiness laws are presented in terms of contractlaw, antitrust laws, environmental laws, consumerproduct safety laws, food and drug administra-tion laws, investment securities laws, intellectualproperty laws, employment laws, and bankruptcylaws. Business law is related to business policy andethics, which in turn are related to social responsi-bility.
Contract DefinedU.S. contracts are governed by state common law. Acontract is a binding agreement that the courts willenforce. It is a promise or a set of promises for thebreach of which the law gives a remedy, or the per-formance of which the law in some way recognizesa duty. A promise manifests or demonstrates the in-tention to act or to refrain from acting in a specifiedmanner.
Those promises that meet all of the essential re-quirements of a binding contract are contractual andwill be enforced. All other promises are not con-tractual, and usually no legal remedy is availablefor a breach of, or a failure to properly perform,these promises. The remedies provided for breach ofcontract include compensatory damages, equitableremedies, reliance damage, and restitution. Thus, apromise may be contractual (and therefore binding)or noncontractual. In other words, all contracts arepromises, but not all promises are contracts.
Requirements of a ContractThe four basic requirements of a contract are (1)mutual assent, (2) consideration, (3) legality of ob-ject and subject matter, and (4) capacity (competentparties).
1. Mutual assent. The parties to a contract mustmanifest by words or conduct that they haveagreed to enter into a contract. The usual methodof showing mutual assent is by offer and accep-tance. An offer is a proposal or expression by oneperson that he is willing to do something for cer-tain terms. A contract does not exist until the offer
is formally accepted, either verbally or in writtenform. The offer and acceptance have to match. Ifthey match, there is an agreement leading up toa contract. If they do not, it is more like a nego-tiation, to which someone responds with a coun-teroffer rather than an acceptance, which contin-ues until both parties reach an agreement or a“meeting of the minds.”
2. Consideration. Each party to a contract must in-tentionally exchange a legal benefit or incur a legaldetriment as an inducement to the other party tomake a return exchange. Consideration is a formof “mutual obligation.” In the business world,mutual promises in a contract of sale, whetherexpress or implied, are generally sufficient con-sideration.
3. Legality of object and subject matter. The pur-pose of a contract must not be criminal, tortious, orotherwise against public policy. If the purpose isillegal, the resulting contract is null and void. Theperformance of a party in regard to the contractmust not be an unlawful act if the agreement is tobe enforceable. However, if the primary purposeof a contract is legal, but some terms containedwithin the agreement are not, then the contractmay or may not itself be illegal, depending onthe seriousness of the illegal terms and the de-gree to which the legal and illegal terms can beseparated.
4. Capacity (competent parties). The parties to acontract must have contractual capacity. Certainpersons, such as adjudicated incompetents, haveno legal capacity to contract, while others, suchas minors, incompetent persons, and intoxicatedpersons, have limited capacity to contract. All oth-ers have full contractual capacity. The parties canbe principals or qualified agents. The parties can-not engage in any fraudulent activities. The useof force or coercion to reach an agreement is notacceptable in signing a contract because both par-ties must enter into the agreement of their ownfree will. Both parties must indicate a willingnessto enter into the agreement and be bound by itsterms.
In addition, though in a limited number of in-stances a contract must be evidenced in writing to beenforceable, in most cases an oral contract is bind-ing and enforceable. Moreover, there must be an ab-sence of invalidating conduct, such as duress, undueinfluence, misrepresentation, or mistake. A promisemeeting all of these requirements is contractual and

JWBT150-Vallabhaneni c09 July 15, 2009 14:40
248 Learning Module 9: Corporate Control, Law, Ethics, and Governance
legally binding. However, if any requirement is un-met, the promise is noncontractual.
Classification of ContractsContracts can be classified according to various char-acteristics, such as method of formation, content, andlegal effect. The standard classifications are (1) ex-press or implied contracts; (2) bilateral or unilateralcontracts; (3) valid, void, voidable, or unenforceablecontracts; and (4) executed or executory contracts.These classifications are not mutually exclusive. Forexample, a contract may be express, bilateral, valid,executory, and informal.
1. Express and implied contracts. A contract formedby conduct is an implied or, more precisely, animplied-in-fact contract. In contrast, a contract inwhich the parties manifest assent in words is anexpress contract. Both are contracts, equally en-forceable. The difference between them is merelythe manner in which the parties manifest theirassent.
2. Bilateral and unilateral contracts. When eachparty is both a promisor (a person making apromise) and a promisee (the person to whoma promise is made), the contract is a bilateral one.A unilateral contract is one where only one of theparties makes a promise.
3. Valid, void, voidable, and unenforceable con-tracts. A valid contract is one that meets all ofthe requirements of a binding contract. It is an en-forceable promise or an agreement. A void con-tract is an agreement that does not meet all ofthe requirements of a binding contract. It has nolegal effect and it is merely a promise or agree-ment. An example is an agreement entered by aperson whom the courts have declared incom-petent. A contract that is neither void nor void-able may nonetheless be unenforceable. An un-enforceable contract is one for the breach ofwhich the law provides no remedy. After thestatutory time period has passed, a contract is re-ferred to as unenforceable, rather than void orvoidable.
4. Executed and executory contracts. A contract thathas been fully carried out and completed by all ofthe parties to it is an executed contract. By com-parison, the term “executory” applies to contractsthat are still partially or entirely unperformed byone or more of the parties.
Other Types of ContractsTwo other types of contracts that occur in commonare the doctrine of promissory estoppel and quasi-contracts.
1. Doctrine of promissory estoppel. In certain cir-cumstances, the courts enforce noncontractualpromises under the doctrine of promissory estop-pel in order to avoid injustice. A noncontrac-tual promise is enforceable when it is made un-der circumstances that should lead the promisorreasonably to expect that the promisee, in re-liance on the promise, would be induced by it totake definite and substantial action or to forbear,and the promisee does take such action or doesforbear.
2. Quasi-contracts. A quasi (meaning “as if”) con-tract is not a contract at all. A quasi-contract isbased neither on an express nor on an implied-in-fact contract. Rather, a quasi-contract is a con-tract implied in law, which is an obligation im-posed by law to avoid injustice. Infrequently,quasi-contracts are used to provide a remedywhen the parties enter into a void contract, anunenforceable contract, or a voidable contractthat is voided. In such a case, the law of quasi-contracts will determine what recovery is permit-ted for any performance rendered by the partiesunder the invalid, unenforceable, or invalidatedagreements.
Antitrust LawsThe goals of antitrust laws are to ensure freeand fair competition in the marketplace; pro-hibit anticompetitive practices such as price fix-ing, deceptive pricing, price discrimination, andpromotional pricing; and prevent unreasonableconcentration of economic power that can weakencompetition. Examples of federal laws in this cate-gory include: the Sherman Antitrust Act, the Clay-ton Act, the Federal Trade Commission Act, theRobinson-Patman Act, the Wheeler-Lea Act, and theCeller Antimerger Act.
These federal statutes when combined with statelegislation intend to promote and preserve compe-tition in a free enterprise system and to preventmonopoly power. The coverage of these acts extendsto interstate commerce among the several states,but not intrastate activity. All states have antitruststatutes applicable to intrastate activity.

JWBT150-Vallabhaneni c09 July 15, 2009 14:40
LEARNING OBJECTIVE 9.3: UNDERSTAND THE SCOPE AND NATURE OF BUSINESS LAW, POLICY, AND ETHICS 249
Sherman Antitrust ActThe Sherman Act of 1880 is the primary tool ofantitrust enforcement. The Act declares any com-bination, contract, or conspiracy in restraint of trademade among the states or with foreign countries il-legal. The Act also makes it illegal to monopolize,attempt to monopolize, or conspire to monopolizeany portion of interstate commerce or any portion oftrade with foreign nations. However, the ShermanAct does not state exactly what types of action areprohibited.
Clayton ActThe Clayton Act of 1914 was designed to strengthenand clarify the provisions of the Sherman Act. Itdefines specifically what constitutes monopolisticor restrictive practices, whereas the Sherman Actdoes not.
The Clayton Act makes price discrimination ille-gal unless it can be justified because of differencesin costs. It prohibits the use of exclusive or tyingcontracts when their use “substantially lessens com-petition or tends to create a monopoly.” Exclusiveor tying contracts are contracts in which the selleragrees to sell a product to a buyer on the condi-tion that the buyer will not purchase products fromthe seller’s competitors. It also makes intercorporatestockholdings illegal if they tend to greatly reducecompetition or to create a monopoly. In addition, theClayton Act makes interlocking directorates (hav-ing the same individual on two or more boards ofdirectors) illegal if the corporations are competitiveand if at least one of the corporations is of a certainminimum size.
The goal of the Clayton Act is to curb anticompet-itive practices in their incipiency. Under the ClaytonAct, simply showing a probable, rather than actual,anticompetitive effect would be enough cause for aviolation of the Act. This means the Clayton Act ismore sensitive to anticompetitive practices than theSherman Act.
The scope of the Clayton Act in mergers includesboth asset and stock acquisitions. The Act now cov-ers both mergers between actual competitors andvertical and conglomerate mergers having the req-uisite anticompetitive effect.
Federal Trade Commission ActLike the Clayton Act, the Federal Trade CommissionAct was designed to prevent abuses and to sustain
competition. The Federal Trade Commission Act de-clares as unlawful “unfair methods of competitionin commerce.”
The Act also established the Federal Trade Com-mission (FTC) in 1914 and gave it the power and theresources to investigate unfair competitive practices.The FTC Act authorizes the FTC to issue “cease-and-desist” orders prohibiting “unfair methods of com-petition” and “unfair or deceptive acts or practices.”These orders provide injunctive relief by preventingor restraining unlawful conduct. One of the goals of theFTC is to enforce antitrust laws and to protect consumers.
The FTC has a dual role in prohibiting unfair meth-ods of competition and anticompetitive practices.The FTC Act supplements the Sherman and the ClaytonActs. The FTC protects consumers who are injuredby practices such as deceptive advertising or label-ing without regard to any effect on competitors.
Although not explicitly empowered to do so, theFTC frequently enforces the Sherman Act indirectlyand enjoins conduct beyond the reach of either theSherman or Clayton acts.
Robinson-Patman ActThe U.S. Congress passed the Robinson-Patman Actin 1936 to protect small competitors by amendingthe Clayton Act. It is often called the chain storeact. The Robinson-Patman Act amends the price dis-crimination section of the Clayton Act. It was aimedat protecting independent retailers and wholesalersfrom “unfair discriminations” by large chain storesand mass distributors, which were supposedly ob-taining large and unjustified price discounts becauseof their purchasing power and bargaining position.
Both the Department of Justice and the FTC canproceed against violators of the Robinson-PatmanAct. The Robinson-Patman Act prohibits pricediscrimination (where a seller charges one buyermore than another for the same product). It makesit unlawful for sellers to grant concessions tobuyers unless concessions are granted to all buyerson terms that are proportionally equal. The Actreaches the quantity discount, a major form of pricediscrimination.
The Act applies only to sales, not to leases,agency/consignment arrangements, licenses, or re-fusals to deal (selling to one firm while refusingto deal with another). The scope of the Robinson-Patman Act applies to tangible personal property(commodities) and in the sale of services or intangi-bles such as advertising.

JWBT150-Vallabhaneni c09 July 15, 2009 14:40
250 Learning Module 9: Corporate Control, Law, Ethics, and Governance
Wheeler-Lea ActIn 1938, the Wheeler-Lea Act was passed as anamendment to the FTC Act. The Wheeler-Lea Actmakes “unfair or deceptive acts or practices” in in-terstate commerce illegal; thus, it was designed toprotect consumers rather than competitors. Now, theFTC has the authority to prohibit false and mislead-ing advertising and product misrepresentation.
Celler Antimerger ActThe Celler Antimerger Act of 1950 also amended theClayton Act by making it illegal for a corporation toacquire the assets, as well as the stock, of a com-peting corporation if the effect is to greatly reducecompetition or to tend to create a monopoly.
Environmental LawsThe U.S. Environmental Protection Agency (EPA)protects and enhances the environment today andfor future generations to the fullest extent possibleunder the laws enacted by the U.S. Congress. Theagency’s mission is to control and abate pollution inthe areas of air, water, solid waste, pesticides, radi-ation, and toxic substances. Its mandate is to mountan integrated, coordinated attack on environmentalpollution in cooperation with state and local govern-ments. Examples of laws in this category include theNational Environmental Policy Act, the Clean AirAct, and the Clean Water Act.
Consumer Product Safety LawsThe Consumer Product Safety Commission enforcesthe Consumer Product Safety Act, which coverssafety of any consumer product not addressed byother regulatory agencies.
Product liability is a liability of manufacturers anddistributors for defective products that cause injuryand death to consumers, resulting from the use ofunsafe products. It focuses on negligence and strictliability. If a person knows a product is defective anduses it anyway (assumption of risk), there is no strictliability. Two types of negligence exist: contributorynegligence (negligence of a plaintiff) and compara-tive negligence (sharing of fault between the plain-tiff and the defendant). Compensatory damage is oftwo types: special damages (i.e., paying for out-of-pocket costs) and general damages (paying for painand suffering, and loss of a limb). Punitive dam-ages are awarded only for gross negligence due to
conduct that is reckless and wanton. Different ju-risdictions handle these negligences and damagesdifferently.
The Magnuson-Moss Warranty Act is the U.S.federal law that governs consumer product war-ranties. The Act requires manufacturers and sellersof consumer products to provide consumers withdetailed information about warranty coverage. Inaddition, it affects both the rights of consumersand the obligations of warrantors under writtenwarranties.
Food and Drug Administration LawsThe Food and Drug Administration (FDA) agencyenforces laws and develops regulations to preventdistribution and sale of adulterated foods, drugs,cosmetics, and hazardous consumer products. Themanufacturer is usually liable for dangerous and un-safe products.
Investment Securities LawsThe primary purpose of federal securities regulationis to prevent fraudulent practices in the sale of in-vestment securities and thereby to foster public con-fidence in the securities market. Two statutes includethe Securities Act of 1933, which focuses on the is-suance of original securities (primary transactions)and the Securities Exchange Act of 1934, whichdeals with trading in already-issued securities (sec-ondary transactions). These secondary transactionsgreatly exceed in volume and value the original of-ferings. The 1933 Act mainly focuses on informationprovided to investors to prohibit misrepresentationand deceit, whereas the 1934 Act primarily focuseson disclosure requirements and regulates tender of-fers and proxy solicitations.
Intellectual Property LawsIntellectual property (IP) is a type of intangible per-sonal property that includes trade secrets, trade sym-bols, copyrights, and patents. These interests are pro-tected from infringement or unauthorized use byothers. Such protection is essential to the conductof personal or corporate business. Examples of lawsin this category include the Uniform Trade SecretsAct, the Economic Espionage Act, the Federal Trade-mark Act (the Lanham Act), the Federal CopyrightAct, and the Patent Act.

JWBT150-Vallabhaneni c09 July 15, 2009 14:40
LEARNING OBJECTIVE 9.3: UNDERSTAND THE SCOPE AND NATURE OF BUSINESS LAW, POLICY, AND ETHICS 251
Employment LawsThree categories of government regulation of the em-ployment relationship are labor laws, employmentdiscrimination laws, and employee protection laws.
Labor laws are aimed at protecting both laborunions and employers with defined unfair practices.Examples of unfair union practices include forcingan employee to join the union, refusing to bargain ingood faith, picketing an employer to require recogni-tion of an uncertified union, discriminating against anonunion employee, causing an employer to pay forwork not performed (called featherbedding), andcharging excessive or discriminatory membershipdues. Examples of unfair employer practices includeinterfering with the right to unionize (called yellow-dog contracts), refusing to bargain in good faith,discriminating against union members, dominatingthe union, and discriminating against an employeewho has filed charges or testified against the em-ployer. Examples of laws in this category includethe Norris-La Guardia Act, National Labor Rela-tions Act (a pro-union act), Labor-Management Re-lations Act (Taft-Hartley Act, a pro-employer act),and Labor-Management Reporting and DisclosureAct (Landrum-Griffin Act to eliminate corruption inlabor unions).
Employment discrimination laws prohibit dis-crimination in employment on the basis of race, sex,religion, national origin, age, and disability. Exam-ples of laws in this category include the Civil RightsAct, Equal Pay Act, Age Discrimination in Employ-ment Act, Rehabilitation Act, and Americans withDisabilities Act.
Employee protection laws are intended to providea limited right not to be unfairly dismissed from thejob, a right to a safe and healthy workplace, compen-sation for injuries sustained in the workplace, andfinancial security upon retirement or loss of employ-ment. Examples of laws in this category include Em-ployee Termination at Will, Occupational Safety andHealth Act (OSHA), Privacy Laws, Workers’ Com-pensation Laws, Social Security and UnemploymentInsurance Act, Fair Labor Standards Act, WorkerAdjustment and Retraining Notification Act (WARNAct), and Family and Medical Leave Act.
Bankruptcy LawsThe U.S. bankruptcy law is governed by federal law,which describes the procedures used by debtors andcreditors when debtors cannot meet their financial
obligations to creditors. The purpose of the law is tolegally relieve debtors of the burdens of being unableto pay debts, while protecting the rights of creditorsto any nonexempt assets that the debtor might have.A debtor can keep exempt assets, but not nonexemptassets. The debtor must pay child-support moneyand taxes because they are not dischargeable. Severalbankruptcy procedures exist, including one in whichthe debtor can ask the court to approve a paymentplan that may include payment of a lesser amountthan is owed.
Compliance ManagementVarious governmental authorities at local, state, andfederal levels pass various laws, rules, and regula-tions to control the conduct of business organizationsfor the good of the society and to collect tax revenuesfor proper functioning of government to provideservices to citizens and businesses. Corporate man-agement can get a reasonable assurance about com-pliance with laws, rules, and regulations throughaudits. Government has the right to fine and punishbusiness organizations for failing to comply with therequired laws, rules, and regulations.
Compliance ProcessThe compliance program requires a three-step pro-cess, as follows.
Step 1: Understand Relevant Laws, Rules, and Regu-lations Auditors may obtain an understanding oflaws, rules, and regulations through review of rel-evant documents and inquiry of attorneys. Gener-ally, more audits of compliance with laws and reg-ulations take place in the public sector than in theprivate sector. For example, understanding relevantlaws and regulations can be important to planninga performance audit because government programsare usually created by law and are subject to morespecific rules and regulations than the private sector.What is to be done, who is to do it, the goals and ob-jectives to be achieved, the population to be served,and how much can be spent on what, are usuallyset forth in laws and regulations. Thus, understand-ing the laws establishing a program can be essentialto understanding the program itself. Obtaining thatunderstanding may also be a necessary step in iden-tifying laws and regulations that are significant toaudit objectives.

JWBT150-Vallabhaneni c09 July 15, 2009 14:40
252 Learning Module 9: Corporate Control, Law, Ethics, and Governance
Step 2: Test Compliance with Laws, Rules, and Regula-tions Auditors should design the audit to providea reasonable assurance about compliance with laws,rules, and regulations that are significant to audit ob-jectives. This requires determining whether laws andregulations are significant to the audit objectives and,if they are, assessing the risk that significant illegalacts could occur. Based on that risk assessment, theauditors design and perform procedures to providereasonable assurance of detecting significant illegalacts.
Step 3: Develop Action Plans to Comply with Laws,Rules, and Regulations Based on the audit report,management should develop action plans show-ing the timetables and resources required to con-form with the missed laws, rules, and regulations. Achecklist describing who should do what and whenwould help management in implementing the actionplans.
Management and auditors should look for the fol-lowing red flags as signs of noncompliance:
� Poor records or documentation� Complex transactions� Activities that are dominated and controlled by a
single person or small group� Unreasonable explanations to inquiries by audi-
tors� Auditee annoyance at reasonable questions by
auditors� Employees’ refusal to give others custody of
records� Employees’ refusal to take vacations and/or accept
promotions� Extravagant lifestyle of employees� A pattern of certain contractors bidding against
each other or, conversely, certain contractors notbidding against each other
� Use of materials on commercial contracts that wereintended for use on government contracts
� A high default rate on government-backed loans
Management and auditors should understand thefollowing terms for the proper meaning of compli-ance:
� Noncompliance is a failure to follow requirementsor a violation of prohibitions, contained in laws,rules, regulations, contracts, governmental grants,or organization’s policies and procedures.
� Illegal acts are a type of noncompliance; specif-ically, they are violations of laws, rules, or regu-
lations. They are failures to follow requirementsof laws or implementing regulations, includingintentional and unintentional noncompliance andcriminal acts.
� Criminal acts are illegal acts for which incarcera-tion, as well as other penalties, is available if theorganization obtains a guilty verdict.
� Civil acts are illegal acts for which penalties thatdo not include incarceration are available for astatutory violation. Penalties may include mone-tary payments and corrective actions.
� Fraud is the obtaining of something of value, il-legally, through willful misrepresentation. Thus,fraud is a type of illegal act.
� Abuse occurs when the conduct of an activ-ity or function falls short of expectations forprudent behavior. Abuse is distinguished fromnoncompliance in that abusive conditions maynot directly violate laws or regulations. Abusiveactivities may be within the letter of the laws andregulations but violate either their spirit or themore general standards of impartial and ethicalbehavior.
� Errors are unintentional noncompliance with ap-plicable laws and regulations and/or misstate-ments or omissions of amounts or disclosures infinancial statements.
� Irregularities are intentional noncompliance withapplicable laws and regulations and/or misstate-ments or omissions of amounts or disclosures infinancial statements.
Compliance Costs and BenefitsCorporate management says it costs a significantamount of resources to comply with the often con-fusing and duplicating laws, rules, and regulationsin terms of recordkeeping and monitoring activities.Management does not readily see a direct and pos-itive benefit from compliance. On the other hand,regulators say these laws, rules, and regulationsare developed with a purpose for the benefit ofthe entire society. Regulators say that the cost ofcompliance should be treated as a cost of doingbusiness. This is a never-ending debate, but in theend the government wins due to its constitutionalpower.
Business PolicyBusiness objectives are derived from a company’svision and mission statements (ends). Business

JWBT150-Vallabhaneni c09 July 15, 2009 14:40
LEARNING OBJECTIVE 9.3: UNDERSTAND THE SCOPE AND NATURE OF BUSINESS LAW, POLICY, AND ETHICS 253
strategy is designed to achieve those objectives(means). Business policy, along with budgets, isa part of strategy execution and implementationin that the policy supports the strategy. Businesspolicies can be established either at high level (e.g.,ethical behavior and pollution control) or low level(e.g., policy of requiring signed contracts prior toacquisition of assets or start of projects and policyon employee compensation, benefits, and training).Similar to business strategy, business policy canbe both proactive (intended and deliberate) andreactive (adaptive). Moreover, business strategyprecedes business policy, whereas business ethicssucceeds business policy. Also, note that businessethics precedes social responsibility.
Business Strategy → Business Policy→ Business Ethics→ Social Responsibility
Business EthicsEthics can be defined broadly as the study of whatis right or good for people. It attempts to deter-mine what people ought to do or what goals theyshould pursue. Business ethics, as a branch of ap-plied ethics, is the study and determination of whatis right and good in business settings and includesthe moral issues that arise from business practices,institutions, and decision making. Unlike legal anal-yses, analyses of ethics have no central authority,such as courts or legislatures, upon which to rely;nor do they follow clear-cut, universal standards.Nonetheless, despite these inherent limitations, it isstill possible to make meaningful ethical judgments.
Examples of key ethical principles include thefollowing:
� The Golden Rule. The Golden Rule means puttingoneself in others’ shoes. It includes not knowinglydoing harm to others.
� The means–ends cycle. The means–end cyclestates that when ends are of overriding impor-tance, unscrupulous means may be used to reachthe ends.
� The might-equals-right principle. The might-equals-right principle states that justice is de-fined as the interest of the stronger, meaning thatstronger people have an upper hand over weakerpeople.
� The professional principle. The professional prin-ciple states that a true professional will do things
in such a way that he can explain them before acommittee of peer professionals.
� Goal-congruence principle. The goal-congruenceprinciple states that actions, wills, and needs ofemployees should be subordinated to the greatergood of the organization they work for. An em-ployee should ask himself whether his goals areconsistent with the organization’s goals. This prin-ciple is similar to (1) the utilitarian ethic, meaningthe greatest good should be done for the greatestnumber and (2) the organization ethic, meaningthat employees do things for the good of the orga-nization.
� Prudent-person concept. The prudent person,who is not infallible or perfect, has the ability togovern and discipline himself by the use of rea-son, does not neglect his duty, and applies hisknowledge, skills, and sound judgment in theuse of the organization’s resources. The prudent-person concept is related to the goal-congruenceprinciple.
Corporate Social ResponsibilityWe would like to present Archie Carroll’s (1979)four-part definition of corporate social respon-sibility (CSR) that focuses on the types of socialresponsibilities it might be argued that businesshas. Carroll’s definition helps us to understand thecomponent parts that make up CSR:
The social responsibility of business encompasses theeconomic, legal, ethical, and discretionary (philanthropic)expectations that society has of organizations at a givenpoint in time.
Carroll’s four-part definition attempts to place eco-nomic and legal expectations of business in contextby relating them to more socially oriented concerns.These social concerns include ethical responsibili-ties and philanthropic (voluntary/discretionary) re-sponsibilities.
Economic ResponsibilitiesFirst, there are business’s economic responsibilities.It may seem odd to call an economic responsibilitya social responsibility, but in effect this is what itis. First and foremost, the U.S. social system callsfor business to be an economic institution. That is,it should be an institution whose orientation is toproduce goods and services that society wants andto sell them at fair prices—prices that society thinksrepresent the true values of the goods and services

JWBT150-Vallabhaneni c09 July 15, 2009 14:40
254 Learning Module 9: Corporate Control, Law, Ethics, and Governance
delivered and that provide business with profits ad-equate to ensure its perpetuation and growth andto reward its investors. While thinking about its eco-nomic responsibilities, business employs many man-agement concepts that are directed toward financialeffectiveness—attention to revenues, costs, strategicdecision making, and the host of business conceptsfocused on maximizing the long-term financial per-formance of the organization.
Legal ResponsibilitiesSecond, there are business’s legal responsibilities.Just as society has sanctioned our economic systemby permitting business to assume the productiverole mentioned earlier, as a partial fulfillment of thesocial contract, it has also laid down the groundrules—the laws—under which business is expectedto operate. Legal responsibilities reflect society’sview of codified ethics in the sense that theyembody basic notions of fair practices as establishedby our lawmakers. It is business’s responsibilityto society to comply with these laws. If businessdoes not agree with laws that have been passed orare about to be passed, our society has provideda mechanism by which dissenters can be heardthrough the political process. In the past 30 years,our society has witnessed a proliferation of laws andregulations striving to control business behavior.
As important as legal responsibilities are, legal re-sponsibilities do not cover the full range of behaviorsexpected of business by society. The law is inade-quate for at least three reasons. First, the law cannotpossibly address all the topics, areas, or issues thatbusiness may face. New topics continually emerge,such as Internet-based business (e-commerce) andgenetically engineered foods. Second, the law oftenlags behind more recent concepts of what is con-sidered appropriate behavior. For example, as tech-nology permits more exact measurements of envi-ronmental contamination, laws based on measuresmade by obsolete equipment become outdated butnot frequently changed. Third, laws are made bylawmakers and may reflect the personal interestsand political motivations of legislators rather thanappropriate ethical justifications. A wise sage oncesaid: “Never go to see how sausages or laws aremade.” It might not be a pretty picture.
Ethical ResponsibilitiesThird, because laws are important but not adequate,ethical responsibilities embrace those activities and
practices that are expected or prohibited by soci-etal members even though they are not codified intolaw. Ethical responsibilities embody the full scopeof norms, standards, and expectations that reflect abelief of what consumers, employees, shareholders,and the community regard as fair, just, and in keep-ing with the respect for or protection of stakeholders’moral rights (Carroll 1979).
In one sense, changes in ethics or values precedethe establishment of laws because they become thedriving forces behind the initial creation of laws andregulations. For example, the civil rights, environ-mental, and consumer movements reflected basicalterations in societal values and thus may be seenas ethical bellwethers foreshadowing and leadingto later legislation. In another sense, ethical respon-sibilities may be seen as embracing and reflectingnewly emerging values and norms that society ex-pects business to meet, even though they may re-flect a higher standard of performance than that cur-rently required by law. Ethical responsibilities in thissense are often ill-defined or continually under pub-lic scrutiny and debate as to their legitimacy andthus are frequently difficult for business to agree on.Regardless, business is expected to be responsive tonewly emerging concepts of what constitutes ethicalpractices.
Superimposed on these ethical expectations ema-nating from societal and stakeholder groups are theimplied levels of ethical performance suggested by aconsideration of the great ethical principles of moralphilosophy, such as justice, rights, and utilitarianism(Carroll 1979).
For the moment, let us think of ethical responsibil-ities as encompassing those areas in which societyexpects certain levels of moral or principled perfor-mance that have not yet been articulated or codifiedinto law.
Philanthropic ResponsibilitiesFourth, there are business’s voluntary/discretionaryor philanthropic responsibilities. These are viewedas responsibilities because they reflect current ex-pectations of business by the public. These activitiesare voluntary, guided only by business’s desire toengage in social activities that are not mandated,not required by law, and not generally expected ofbusiness in an ethical sense. Nevertheless, the pub-lic has an expectation that business will engage inphilanthropy, and thus this category has becomea part of the social contract between business and

JWBT150-Vallabhaneni c09 July 15, 2009 14:40
LEARNING OBJECTIVE 9.3: UNDERSTAND THE SCOPE AND NATURE OF BUSINESS LAW, POLICY, AND ETHICS 255
society. Such activities might include corporate giv-ing, product and service donations, volunteerism,partnerships with local government and other orga-nizations, and any other kind of voluntary involve-ment of the organization and its employees with thecommunity or other stakeholders.
The distinction between ethical responsibilitiesand philanthropic responsibilities is that the lattertypically are not expected in a moral or an ethicalsense. Communities desire and expect business tocontribute its money, facilities, and employee timeto humanitarian programs or purposes, but they donot regard firms as unethical if they do not providethese services at the desired levels. Therefore, theseresponsibilities are more discretionary, or voluntary,on business’s part, although the societal expectationthat they be provided is always present. This cate-gory of responsibilities is often referred to as good“corporate citizenship.”
In essence, then, our definition forms a four-partconceptualization of corporate social responsibilitythat encompasses the economic, legal, ethical, andphilanthropic expectations placed on organizationsby society at a given point in time. The implicationis that business has accountability for these areas ofresponsibility and performance. This four-part def-inition provides us with categories within which toplace the various expectations that society has ofbusiness. With each of these categories consideredas indispensable facets of the total social responsi-bility of business, we have a conceptual model thatmore completely describes the kinds of expectationsthat society expects of business. One advantage ofthis model is that it can accommodate those whohave argued against CSR by characterizing an eco-nomic emphasis as separate from a social empha-sis. This model offers these two facets along withothers that collectively make up corporate socialresponsibility.
The Pyramid of Corporate SocialResponsibilityA helpful way of graphically depicting the four-part definition is envisioning a pyramid composedof four layers. The pyramid portrays the four com-ponents of CSR, beginning with the basic buildingblock of economic performance (making a profit) atthe base. At the same time, business is expected toobey the law because the law is society’s codifica-tion of acceptable and unacceptable behavior. Next
is business’s responsibility to be ethical. At its mostbasic level, this is the obligation to do what is right,just, and fair and to avoid or minimize harm tostakeholders (employees, consumers, the environ-ment, and others). Finally, business is expected tobe a good corporate citizen—to fulfill its voluntary/discretionary or philanthropic responsibility to con-tribute financial and human resources to the com-munity and to improve the quality of life.
Pyramid Layers of Corporate SocialResponsibility
A socially responsible firm should strive to:
� Be a good corporate citizen (top).� Be ethical.� Obey the law.� Make a profit (base).
The most critical tensions, of course, are those be-tween economic and legal, economic and ethical,and economic and philanthropic. The traditional-ist might see this as a conflict between a firm’s“concern for profits” and its “concern for society,”but it is suggested here that this is an oversimpli-fication. A CSR or stakeholder perspective wouldrecognize these tensions as organizational realitiesbut would focus on the total pyramid as a uni-fied whole and on how the firm might engage indecisions, actions, policies, and practices that si-multaneously fulfill all its component parts. Thispyramid should not be interpreted to mean thatbusiness is expected to fulfill its social responsibili-ties in some sequential fashion, starting at the base.Rather, business is expected to fulfill all its responsi-bilities simultaneously.
In summary, the total social responsibility ofbusiness entails the concurrent fulfillment of thefirm’s economic, legal, ethical, and philanthropicresponsibilities. In equation form, this might beexpressed as:
Total Corporate Social Responsibility= Economic Responsibilities+ Legal Responsibilities+ Ethical Responsibilities+ Philanthropic Responsibilities

JWBT150-Vallabhaneni c09 July 15, 2009 14:40
256 Learning Module 9: Corporate Control, Law, Ethics, and Governance
❑ Learning Objective 9.4:UNDERSTAND THE VARIOUSISSUES IN CORPORATEGOVERNANCEThe issue of corporate governance is a direct out-growth of the question of legitimacy. For business tobe legitimate and to maintain its legitimacy in theeyes of the public, its governance must correspondto the will of the people.
Corporate governance refers to the method bywhich a firm is being governed, directed, admin-istered, or controlled and to the goals for which it isbeing governed. Corporate governance is concernedwith the relative roles, rights, and accountability ofsuch stakeholder groups as owners, boards of direc-tors, managers, employees, and others who assert tobe stakeholders.
Components of Corporate GovernanceTo appreciate fully the legitimacy and corporate gov-ernance issues, it is important to understand the ma-jor groups that make up the corporate form of busi-ness organization because it is only by so doing thatone can appreciate how the system has failed to workaccording to its intended design.
The four major groups needed in setting thestage are (1) shareholders (owners or stakeholders),(2) board of directors, (3) managers, and (4) employ-ees. Overarching these groups is the charter issuedby the state, giving the corporation the right to existand stipulating the basic terms of its existence.
Under U.S. corporate law, shareholders are theowners of a corporation. As owners, they shouldhave ultimate control over the corporation. This con-trol is manifested primarily in the right to select theboard of directors of the company. Generally, thenumber of shares of stock owned determines the de-gree of each shareholder’s right.
Because large organizations may have hundredsof thousands of shareholders, they elect a smallergroup, known as the board of directors, to gov-ern and oversee the management of the business.The board is responsible for ascertaining that themanager puts the interests of the owners (i.e., share-holders) first. The third major group in the authorityhierarchy is management—the group of individu-als hired by the board to run the company andmanage it on a daily basis. Along with the board,top management establishes overall policy. Middle-
and lower-level managers carry out this policy andconduct the daily supervision of the operative em-ployees. Employees are those hired by the com-pany to perform the actual operational work. Man-agers are employees too, but in this discussion weuse the term “employees” to refer to nonmanagerialemployees.
Corporate Governance StandardsThe Business Roundtable supports the followingeight guiding principles as part of good corporategovernance practices (Business Roundtable 2005,pp. 2–3):
1. The paramount duty of the board of directors ofa public corporation is to select a chief executiveofficer (CEO) and to oversee the CEO and seniormanagement in the competent and ethical opera-tion of the corporation on a day-to-day basis.
2. It is the responsibility of management to operatethe corporation in an effective and ethical mannerto produce value for shareholders. Senior man-agement is expected to know how the corporationearns its income and what risks the corporationis undertaking in the course of carrying out itsbusiness. The CEO and board of directors shouldset the “tone at the top” that establishes a cultureof legal compliance and integrity. Managementand directors should never put personal interestsahead of or in conflict with the interests of thecorporation.
3. It is the responsibility of management, under theoversight of the audit committee and the board,to produce financial statements that fairly presentthe financial condition and results of operationsof the corporation and to make the timely disclo-sures investors need to assess the financial andbusiness soundness and risks of the corporation.
4. It is the responsibility of the board, through its au-dit committee, to engage an independent account-ing firm to audit the financial statements preparedby management, issue an opinion that those state-ments are fairly stated in accordance with gener-ally accepted accounting principles (GAAP), andoversee the corporation’s relationship with theoutside auditor.
5. It is the responsibility of the board, through itscorporate governance committee, to play a lead-ership role in shaping the corporate governance ofthe corporation. The corporate governance com-mittee also should select and recommend to the

JWBT150-Vallabhaneni c09 July 15, 2009 14:40
LEARNING OBJECTIVE 9.4: UNDERSTAND THE VARIOUS ISSUES IN CORPORATE GOVERNANCE 257
board qualified director candidates for election bythe corporation’s shareholders.
6. It is the responsibility of the board, through itscompensation committee, to adopt and overseethe implementation of compensation policies, es-tablish goals for performance-based compensa-tion, and determine the compensation of the CEOand senior management.
7. It is the responsibility of the board to respondappropriately to shareholders’ concerns.
8. It is the responsibility of the corporation todeal with its employees, customers, suppliers,and other constituencies in a fair and equitablemanner.
These eight responsibilities and others are criticalto the functioning of the modern public corporationand the integrity of the public markets. No law orregulation alone can be a substitute for the voluntaryadherence to these principles by corporate directorsand management.
The Business Roundtable continues to believe thatcorporate governance should be enhanced throughconscientious and forward-looking action by a busi-ness community that focuses on generating long-term shareholder value with the highest degree ofintegrity.
The principles discussed here are intended to as-sist corporate management and boards of directorsin their individual efforts to implement best prac-tices of corporate governance, as well as to serve asguideposts for the public dialogue on evolving gov-ernance standards.
Roles of the Board of DirectorsAn effective system of corporate governance pro-vides the framework within which the board andmanagement address their respective responsibili-ties (Business Roundtable 2005, pp. 7–10):
� The business of a corporation is managed underthe direction of the corporation’s board. The boarddelegates to the CEO—and through the CEO toother senior management—the authority and re-sponsibility for managing the everyday affairs ofthe corporation. Directors monitor managementon behalf of the corporation’s shareholders.
� Making decisions regarding the selection, compen-sation, and evaluation of a well-qualified and eth-ical CEO is the single most important function ofthe board. The board also appoints or approvesother members of the senior management team.
� Directors bring to the corporation a range ofexperience, knowledge, and judgment. Directorsshould not represent the interests of particular con-stituencies.
� Effective directors maintain an attitude of con-structive skepticism; they ask incisive, probingquestions and require accurate, honest answers;they act with integrity and diligence; and theydemonstrate a commitment to the corporation, itsbusiness plans, and long-term shareholder value.
� In performing its oversight function, the boardis entitled to rely on the advice, reports, andopinions of management, corporate counsel,auditors, and expert advisors. The board shouldassess the qualifications of those it relies on andhold managers and advisors accountable. Theboard should ask questions and obtain answersabout the processes used by managers and thecorporation’s advisors to reach their decisions andrecommendations, as well as about the substanceof the advice and reports received by the board.When appropriate, the board and its committeesshould seek independent advice.
� Given the board’s oversight role, shareholdersand other constituencies can reasonably expectthat directors will exercise vigorous and diligentoversight of a corporation’s affairs. However, theyshould not expect the board to micromanage thecorporation’s business by performing or duplicat-ing the tasks of the CEO and senior managementteam.
� The board’s oversight function carries with it anumber of specific responsibilities in addition tothat of selecting and overseeing the CEO. Theseresponsibilities include:� Planning for management development and succes-
sion. The board should oversee the corporation’splans for developing senior management per-sonnel and plan for CEO and senior manage-ment succession. When appropriate, the boardshould replace the CEO or other members ofsenior management.
� Understanding, reviewing, and monitoring the im-plementation of the corporation’s strategic plans.The board has responsibility for overseeing andunderstanding the corporation’s strategic plansfrom their inception through their developmentand execution by management. Once the boardreviews a strategic plan, it should regularly mon-itor implementation of the plan to determinewhether it is being implemented effectively andwhether changes are needed. The board also

JWBT150-Vallabhaneni c09 July 15, 2009 14:40
258 Learning Module 9: Corporate Control, Law, Ethics, and Governance
should ensure that the corporation’s incentivecompensation program is aligned with the cor-poration’s strategic plan.
� Understanding and approving annual operatingplans and budgets. The board is responsible forunderstanding, approving, and overseeing thecorporation’s annual operating plans and for re-viewing the annual budgets presented by man-agement. The board should monitor implemen-tation of the annual plans to assess whether theyare being implemented effectively and withinthe limits of approved budgets.
� Focusing on the integrity and clarity of the corpo-ration’s financial statements and financial reporting.The board, assisted by its audit committee,should be satisfied that the financial statementsand other disclosures prepared by managementaccurately present the corporation’s financialcondition and results of operations to sharehold-ers and that they do so in an understandablemanner. To achieve accuracy and clarity, theboard, through its audit committee, should havean understanding of the corporation’s financialstatements, including why the accountingprinciples critical to the corporation’s businesswere chosen, what key judgments and estimateswere made by management, and how the choiceof principles and the making of these judgmentsand estimates affect the reported financialresults of the corporation.
� Advising management on significant issues facingthe corporation. Directors can offer managementa wealth of experience and a wide range ofperspectives. They provide advice and counselto management in formal board and com-mittee meetings, and they are available forinformal consultation with the CEO and seniormanagement.
� Reviewing and approving significant corporate ac-tions. As required by state corporate law, theboard reviews and approves specific corporateactions, such as the election of executive officers,the declaration of dividends, and (as appropri-ate) the implementation of major transactions.The board and senior management should havea clear understanding of what level or types ofdecisions require specific board approval.
� Reviewing management’s plans for business re-siliency. As part of its oversight function, theboard should designate senior management whowill be responsible for business resiliency. Theboard should periodically review management’s
plans to address this issue. Business resiliencycan include such items as business risk as-sessment and management, business continu-ity, physical and cyber-security, and emergencycommunications.
� Nominating directors and committee members andoverseeing effective corporate governance. It is theresponsibility of the board, through its corpo-rate governance committee, to nominate direc-tors and committee members and oversee thecomposition, independence, structure, practices,and evaluation of the board and its committees.
� Overseeing legal and ethical compliance. The boardshould set a tone at the top that establishes thecorporation’s commitment to integrity and legalcompliance. The board should oversee the cor-poration’s compliance program relating to legaland ethical conduct. In this regard, the boardshould be knowledgeable about the corpora-tion’s compliance program and should be sat-isfied that the program is effective in prevent-ing and deterring violations. The board shouldpay particular attention to conflicts of interest,including related-party transactions.
Roles of CEOs and Senior ExecutivesThe Business Roundtable defines the following spe-cific roles and responsibilities for the CEO andother senior executives (Business Roundtable 2005,pp. 10–12):
� It is the responsibility of the CEO and senior man-agement (senior executives), under the CEO’s di-rection, to operate the corporation in an effectiveand ethical manner. As part of its operational re-sponsibility, senior management is charged withthe following tasks:� Operating the corporation. The CEO and senior
management run the corporation’s day-to-daybusiness operations. With a thorough under-standing of how the corporation operates andearns its income, they carry out the corporation’sstrategic objectives within the annual operatingplans and budgets, which are reviewed and ap-proved by the board. In making decisions aboutthe corporation’s business operations, the CEOconsiders the long-term interests of the corpo-ration and its shareholders and necessarily re-lies on the input and advice of others, includ-ing senior management and outside advisors.The CEO keeps the board apprised of significant
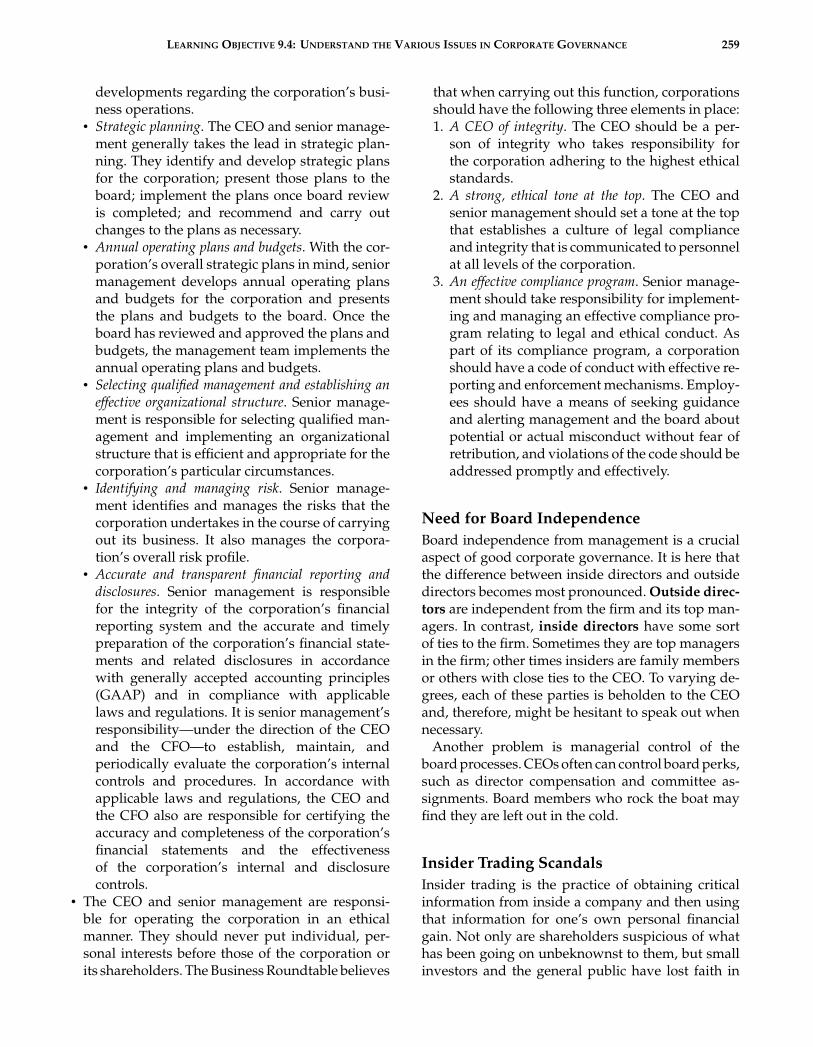
JWBT150-Vallabhaneni c09 July 15, 2009 14:40
LEARNING OBJECTIVE 9.4: UNDERSTAND THE VARIOUS ISSUES IN CORPORATE GOVERNANCE 259
developments regarding the corporation’s busi-ness operations.
� Strategic planning. The CEO and senior manage-ment generally takes the lead in strategic plan-ning. They identify and develop strategic plansfor the corporation; present those plans to theboard; implement the plans once board reviewis completed; and recommend and carry outchanges to the plans as necessary.
� Annual operating plans and budgets. With the cor-poration’s overall strategic plans in mind, seniormanagement develops annual operating plansand budgets for the corporation and presentsthe plans and budgets to the board. Once theboard has reviewed and approved the plans andbudgets, the management team implements theannual operating plans and budgets.
� Selecting qualified management and establishing aneffective organizational structure. Senior manage-ment is responsible for selecting qualified man-agement and implementing an organizationalstructure that is efficient and appropriate for thecorporation’s particular circumstances.
� Identifying and managing risk. Senior manage-ment identifies and manages the risks that thecorporation undertakes in the course of carryingout its business. It also manages the corpora-tion’s overall risk profile.
� Accurate and transparent financial reporting anddisclosures. Senior management is responsiblefor the integrity of the corporation’s financialreporting system and the accurate and timelypreparation of the corporation’s financial state-ments and related disclosures in accordancewith generally accepted accounting principles(GAAP) and in compliance with applicablelaws and regulations. It is senior management’sresponsibility—under the direction of the CEOand the CFO—to establish, maintain, andperiodically evaluate the corporation’s internalcontrols and procedures. In accordance withapplicable laws and regulations, the CEO andthe CFO also are responsible for certifying theaccuracy and completeness of the corporation’sfinancial statements and the effectivenessof the corporation’s internal and disclosurecontrols.
� The CEO and senior management are responsi-ble for operating the corporation in an ethicalmanner. They should never put individual, per-sonal interests before those of the corporation orits shareholders. The Business Roundtable believes
that when carrying out this function, corporationsshould have the following three elements in place:1. A CEO of integrity. The CEO should be a per-
son of integrity who takes responsibility forthe corporation adhering to the highest ethicalstandards.
2. A strong, ethical tone at the top. The CEO andsenior management should set a tone at the topthat establishes a culture of legal complianceand integrity that is communicated to personnelat all levels of the corporation.
3. An effective compliance program. Senior manage-ment should take responsibility for implement-ing and managing an effective compliance pro-gram relating to legal and ethical conduct. Aspart of its compliance program, a corporationshould have a code of conduct with effective re-porting and enforcement mechanisms. Employ-ees should have a means of seeking guidanceand alerting management and the board aboutpotential or actual misconduct without fear ofretribution, and violations of the code should beaddressed promptly and effectively.
Need for Board IndependenceBoard independence from management is a crucialaspect of good corporate governance. It is here thatthe difference between inside directors and outsidedirectors becomes most pronounced. Outside direc-tors are independent from the firm and its top man-agers. In contrast, inside directors have some sortof ties to the firm. Sometimes they are top managersin the firm; other times insiders are family membersor others with close ties to the CEO. To varying de-grees, each of these parties is beholden to the CEOand, therefore, might be hesitant to speak out whennecessary.
Another problem is managerial control of theboard processes. CEOs often can control board perks,such as director compensation and committee as-signments. Board members who rock the boat mayfind they are left out in the cold.
Insider Trading ScandalsInsider trading is the practice of obtaining criticalinformation from inside a company and then usingthat information for one’s own personal financialgain. Not only are shareholders suspicious of whathas been going on unbeknownst to them, but smallinvestors and the general public have lost faith in

JWBT150-Vallabhaneni c09 July 15, 2009 14:40
260 Learning Module 9: Corporate Control, Law, Ethics, and Governance
what they had thought was the stable-and-secure fi-nancial industry. When companies disclose mean-ingful information to shareholders and securitiesprofessionals, they must now do so publicly so thatsmall investors can enjoy a more level playing field.
Improving Corporate GovernanceEfforts to improve corporate governance may beclassified into two major categories. First, changescould be made in the composition, structure,and functioning of boards of directors. Second,shareholders—on their own initiative or on the ini-tiative of management or the board—could assumea more active role in governance.
❑ Learning Objective 9.5:UNDERSTAND THE NATURE ANDTYPES OF CORPORATE AUDITSAuditing is a systematic process of objectively ob-taining and evaluating evidence in reaching auditconclusions and reflecting them in the audit reports.The output of the audit work is reports, which areused by management (internal) and investors andcreditors (external) stakeholders.
Types of audits include financial audits, oper-ational audits, and information technology (IT)audits. The scope of financial audit examines thereliability and integrity of accounting records, finan-cial records, and operational records to express aprofessional opinion on the financial condition of afirm. The scope of operational (management) au-dit is concerned with the economical and efficientuse of an organization’s resources and the accom-plishment of goals and objectives. The scope of ITaudits includes the review of controls in computersystems and operations to comply with internal con-trol policies and procedures and its effectiveness insafeguarding an organization’s technology assets.
Audit work is conducted by two types of individu-als: external auditors primarily performing financialand IT audits, and internal auditors primarily per-forming operational and IT audits.
External auditors play an important role in capi-tal markets. Financial statements audited by exter-nal auditors permit the flow of capital to compa-nies in the form of both equity and credit. Externalauditors owe a duty of due professional care whenperforming their work since they are accountableprimarily to the stakeholders and secondarily to the
company. Full disclosure of accurate and clear finan-cial information should be the goal of external au-ditors to protect shareholders, investors, and cred-itors (i.e., stakeholders). External auditors need toestablish credibility, honesty, ethical values, and in-tegrity in delivering high-quality financial report-ing useful for healthy functioning of the capitalmarket system. External auditors should use pro-fessional skepticism when dealing with corporatemanagement assertions and representations. Exter-nal auditors should act as gatekeepers in preventingand/or detecting client organization managementwrongdoings.
Internal auditors play an important role in theorganization they work for by adding value to theorganization. Internal auditors help the organizationin achieving its goals and objectives by reviewingbusiness functions and operations for efficiency andeffectiveness. Internal auditors owe a duty of dueprofessional care when performing their work sincethey are accountable primarily to the company andsecondarily to its shareholders. Internal auditorsshould use professional skepticism when dealingwith corporate management assertions and repre-sentations. Internal auditors should act as gate-keepers in preventing and/or detecting organizationmanagement wrongdoings.
Regardless of the types of audits and the typesof auditors, all audit work is done in a systematicprocess of planning, collecting evidence, evaluatingevidence, and reporting the audit results—the auditprocess.
Other varieties of audit work include constructionaudit, quality audit, due diligence audit, security au-dit, safety audit, privacy audit, performance audit,and operational audit.
Construction/Contract AuditMany opportunities exist in construction auditingin terms of cost recovery in such areas as fraud,kickbacks, overcharges, and conflicts of interest.Early participation of the auditor is required in bid-ding procedures, cost estimates, contractual terms,contractors’ accounting (billing) systems, cost con-trol, and project control procedures. There should bea provision in the contract for overall project reviews,billing reviews, progress reviews, and cost recoveryaudits.
Construction audits generally fall into one of threecategories: (1) fixed price (lump sum), (2) cost plus,and (3) unit price. Under the fixed-price contract,

JWBT150-Vallabhaneni c09 July 15, 2009 14:40
LEARNING OBJECTIVE 9.5: UNDERSTAND THE NATURE AND TYPES OF CORPORATE AUDITS 261
contractors agree to work for a fixed amount. Theauditor should review escalation clauses, progresspayments, incentive provisions, adjustments for ex-cess labor and materials costs, and change orders.Risks in a fixed-price contract include: inadequate in-surance and bond coverage; charges for equipmentand materials that are not received; overhead costitems included as additional charges; inadequate in-spection relative to specifications; and extra costs,changes, and revisions that are already part of theoriginal contract.
Under the cost-plus contract, the contractor is re-imbursed for costs plus a fixed fee (which is encour-aged) or costs plus a fee based on percentage of costs(which is discouraged). Some cost-plus contractsprovide for maximum costs and sharing of any sav-ings generated. Risks in cost-plus contracts include:overhead cost items also billed directly; duplicationof costs between headquarters and field offices; poor-quality work practices; poor physical protection ofmaterials and equipment; excessive costs incurreddue to idle rented equipment; excessive manning ofproject; and uncontrolled overtime costs.
Unit-price contracts are useful when largeamounts of similar work are required from the con-tractor (e.g., clearing land by the acre and surveil-lance of a building). A price is agreed on for eachunit of work. Risks in the unit-price contract include:excessive progress payment; improper or inaccuratereporting of units completed; unauthorized escala-tion adjustments; and inaccurate field records.
Quality AuditQuality audit engagements can take place in twoareas: quality audit of a company’s products andservices and quality audit of an individual businessfunction.
Quality Audit of a Company’s Productsor ServicesMost organizations view quality of a product or ser-vice as a competitive weapon. Quality can increaserevenues and sales, decrease costs, and increaseprofits.
The audit scope of the quality function includes re-view of the charter, organization chart, quality poli-cies and procedures, quality control tools, qualitycosts (cost of quality), quality management tools,quality standards, applicable laws and regulations,and Six-Sigma metrics.
The auditor needs to understand:� How quality management tools (affinity diagrams,
tree diagrams, process decision program charts,matrix diagrams, interrelationship digraphs, pri-oritization matrices, and activity network dia-grams) are used, including their frequency andapplicability
� How Six-Sigma metrics are implemented orplanned to be implemented
� How quality control tools (check sheets, his-tograms, scatter diagrams, Pareto diagrams,flowcharts, cause-and-effect diagrams, and controlcharts) are used, including their frequency and ap-plicability
� How quality costs (preventive, appraisal, inter-nal failures, and external failures) are accumulatedand reported to management and their reasonable-ness with the industry norms and company targets
� How service-quality characteristics (intangibility,inseparability, heterogeneity, and perishability) aremeasured and reported
Quality Audit of an Individual BusinessFunctionMany business functions or departments have in-stalled total quality management (TQM) approachesto improve their operations. The department man-agement should perform a self-assessment to ensurecompliance with TQM principles and practices.
Due-Diligence AuditDue-diligence audits provide a safety valve to man-agement that is planning to acquire, manage, or con-solidate with other businesses. Joint ventures and en-vironmental audits are also subject to due-diligenceaudits. These audits are the minimum managerialrequirements to ensure that all applicable laws andregulations are met and that risks and exposures areminimized. For example, due-diligence audits are arisk management tool for banks, land buyers, andlending agencies when a buyer is purchasing landor accepting it as a gift. Here the buyer wants tominimize the potential legal liability resulting fromland acquisition.
Due-diligence audits are team-based effortsinvolving internal auditors, external auditors,lawyers, engineers, IT staff, and other specialists.Three phases in this audit include informationgathering (phase 1), information analysis (phase 2),and information reporting (phase 3). Informationgathering involves collecting information through

JWBT150-Vallabhaneni c09 July 15, 2009 14:40
262 Learning Module 9: Corporate Control, Law, Ethics, and Governance
document reviews, interviews, and meetings. In-formation analysis may include analytical reviews,including ratio analysis, regression analysis, andother quantitative techniques. Information report-ing includes writing a balanced report based on factswith an executive summary. In addition to writingreports, oral reports can be used for immediateresponse and clarification of issues and findings.
Security AuditThe scope of security audits, which can be unan-nounced audits, includes logical security, physicalsecurity, and computer storage medium. Logical se-curity focuses on determining whether a person at-tempting access should be allowed into a computersystem and what the user can do once on the sys-tem. Specific controls in logical security review in-clude authentication controls such as compositionand change of passwords and user identificationcodes (IDs), encryption methods and routines, andrestricting transactions to particular terminals andemployees. Terminal-related controls include time-out limits and displaying the last time and date auser ID was used.
The scope of physical security audits can include areview of physical access to storerooms, cash vaults,research laboratories, plants and factories, computercenters, preventive maintenance procedures, andenvironmental controls. Physical access controls in-clude limiting unauthorized access using electroniccards and biometric access devices (voice recog-nition, electronic signature verification), fire pre-vention techniques, electric power supply, and air-conditioning for humidity control.
The scope of computer storage media audits in-cludes review of rotation of computer files to andfrom offsite storage, electronic vaulting at remotelocations, environmental controls offsite as well asonsite, and adequacy of storage media capacity forfuture computing needs.
Safety AuditThe scope of safety audit includes review of safetypolicies and procedures and accident statistics andinvestigations. The auditor needs to make sure thatcorrective actions for safety problems are proper andtimely and that all applicable labor laws are com-plied with.
The auditor would need to coordinate safety au-dit activities with other functions, such as qual-
ity, health, security, and industrial engineering. Pos-sible areas of coordination include sharing workplans and schedules, conducting periodic meet-ings, exchanging reports, developing work statistics,providing control training, and participating in in-vestigations and corrective actions.
Privacy AuditPrivacy is the right to limit access to information re-garding oneself. The term privacy refers to the socialbalance between an individual’s right to keep infor-mation confidential and the societal benefit derivedfrom sharing information and how this balance iscodified to give individuals the means to control per-sonal information. The term confidentiality refers todisclosure of information only to authorized indi-viduals and entities.
Privacy means that the rights of the accused (sus-pect) cannot be violated during the investigation.The accused can use protective orders if his privacyrights are ignored or handled improperly. If accusedpersons can prove that evidence brought againstthem would do more harm to them than good, thecourts will favor the accused in suppressing suchevidence from being presented.
The organization can protect itself from privacyand confidentiality problems by developing a policystatement and by showing the amount of damagedone by the accused.
� A policy statement is a prerequisite to handling pri-vacy issues properly and legally. An incomplete orunclear policy could result in legal action againstthe organization by employees (suspects) whenthey find out that their privacy rights are violated.
� The organization must show that the perpetratoractually broke into a computer system, violatedits proprietary rights to the system, and show theextent of damage caused. Organizations shouldhave controls such as passwords, encryption, ac-cess controls, hidden files, and warning banners toestablish proprietary rights to a computer system.A policy statement should define this area.
Performance AuditAny operation or function, whether it is produc-tion or service, needs to be measured in terms of itsperformance. To measure performance, performancestandards, which are tied to the primary objectivesof the operation or function, must be developed andmonitored. In addition, each performance standard

JWBT150-Vallabhaneni c09 July 15, 2009 14:40
LEARNING OBJECTIVE 9.6: UNDERSTAND THE NATURE AND TYPES OF CORPORATE FRAUD 263
must be expressed in terms of efficiency and effec-tiveness criteria. If too many performance standardsor indicators exist, employees may not be able tohandle them properly, which can lead to waste of re-sources. Therefore, both management and employ-ees should focus on a few meaningful key perfor-mance indicators (KPIs).
The auditor needs to be aware that some em-ployees may falsify the KPIs to survive and thatperformance results may be distorted to receivelarger bonuses and promotions. Therefore, the au-ditor should compare the KPIs with the industrynorms as well as with the same company data fromperiod to period. Also, the auditor should be carefulin analyzing both KPIs that look too good as well asKPIs that do not meet standards.
Operational AuditThe economic events and business transactions ofan entity are usually classified into several operat-ing cycles to manage the audit effectively and effi-ciently. The scope of operational audit work includesa review of business transactions affecting revenue,expenditure, production (conversion), treasury(financing/investing), and financial reporting (ex-ternal) cycles.
❑ Learning Objective 9.6:UNDERSTAND THE NATURE ANDTYPES OF CORPORATE FRAUDThe legal definition of fraud by most statutes is asfollows. Fraud is a generic term that embraces allthe multifarious means that human ingenuity candevise that are resorted to by one individual to getan advantage over another by false representations.It includes all surprise, trick, cunning, and unfairways by which another is cheated. Fraud is a termof law, applied to certain facts as a conclusion fromthem, but is not in itself a fact. It has been definedas any cunning deception or artifice used to cheat ordeceive another.
To cheat and defraud means to use every kind oftrick and deception, from false representation andintimidation to suppression and concealment of anyfact and information, by which a party is induced topart with property for less than its value or to givemore than it is worth for the property of another.“Fraud” and “bad faith” are synonymous when ap-plied to the conduct of public offenders.
Three Elements of Fraud:
1. Intent to defraud2. Commission of a fraudulent act3. Accomplishment of the fraud
Types of FraudThere are many types of fraud, limited only by theingenuity of the perpetrators. Fraud can be classifiedin a number of ways from a discovery point of view.The reason for this classification is that different ap-proaches and procedures are required to discovereach type of fraud and to control each type’s occur-rence.
Howard Davia and his coauthors (1992) presentfour types of fraud: (1) theft of assets, (2) fraud byfrequency, (3) fraud by conspiracy, and (4) varietiesof fraud.
Theft of AssetsTheft of assets is classified into three categories.
1. Theft of assets that appears openly on the booksas distinct accounting entries (fraud open on thebooks is the least difficult to discover).
Fraud open on the books includes criminal actsthat involve discrete entries in the accountingrecords. Here the term discrete entry means thatthe fraud involves the entire transaction; if thattransaction is selected by an auditor for examina-tion, this type of fraud offers the best chance fordiscovery (e.g., a fraudulent duplicate paymentthat stands by it).
2. Theft of assets appears on the books but is hid-den as a part of other larger, otherwise-legitimateaccounting entries (fraud hidden on the books).
Fraud hidden on the books involves acts offraud that are included in accounting entries thatappear on the books, but are not discrete entries.That is, the amount of the fraud is always buriedin a larger, legitimate accounting entry, never ap-pearing as a discrete amount (e.g., kickbacks).
3. Theft of assets not on the books and that nevercould be detected by an examination of “booked”accounting transactions (fraud off the books is themost difficult to discover).
In fraud off the books, the amount of the fraudis neither a discrete accounting entry nor a hid-den part of an accounting entry. It is the loss ofa valuable asset for the victim. Examples includediverting vending-machine sales money and con-version of payments on accounts receivable thathave been written off.

JWBT150-Vallabhaneni c09 July 15, 2009 14:40
264 Learning Module 9: Corporate Control, Law, Ethics, and Governance
Fraud by FrequencyAnother way of classifying fraud is by its fre-quency of occurrence: nonrepeating or repeating. Innonrepeating fraud, a fraudulent act, even thoughrepeated many times, is singular in nature in that itmust be triggered by the perpetrator each time (e.g.,a weekly payroll check requires a timecard everyweek in order to generate the fraudulent paycheck).
In repeating fraud, a defrauding act may occurmany times; however, it needs to be initiated onlyonce. It then keeps running until it is stopped. Itcould possibly recur in perpetuity (e.g., a salariedpayroll check that does not require input each timein order to generate the paycheck. It continues untila stop order is issued).
Fraud by ConspiracyFraud can be classified as that involving conspiracy,that which does not involve conspiracy, and that in-volving partial (pseudo-) conspiracy. Here the wordconspiracy is synonymous with collusion. It hasbeen proven that most frauds involve conspiracy, ei-ther bona fide or pseudo. In the bona fide conspiracy,all parties involved are fully aware of the fraudulentintent; in the pseudoconspiracy, one or more of theparties to the fraud is innocent of fraudulent intent.
Varieties of FraudThe varieties of fraud can be grouped in two cate-gories: (1) “specialized” fraud, which is unique topeople working in certain kinds of business opera-tions, and (2) “garden-variety” fraud, which anyoneis likely to encounter in general business operations.
Examples of specialized fraud include: embezzle-ment of assets entrusted by depositors to financialinstitutions such as banks, savings and loans, creditunions, and pension funds (called custodial fraud),and false insurance claims for life, health, auto, andproperty coverage.
Examples of garden-variety fraud include kick-backs, defective pricing, unbalanced contracts orpurchase orders, reopening completed contracts, du-plicate payments, double payments, shell payments,and defective delivery.
Degree of FraudThe degree of fraud can be linked to the environmentof an organization:� High-fraud environment is linked to low manage-
ment integrity, poor control environment, loose ac-countability, and high pressure for results.
� Low-fraud environment is linked to a cultureof honesty, management openness, employee-assistance programs, and implementing totalquality management (TQM) principles.
Red Flags for FraudRed flags do not signal that a fraud has occurred butrather that the opportunity for a fraud exists. Someexamples of red flags are:� Concealed assets� Missing or destroyed records and documents� Split purchases� Excessive “voids” or “refunds”� Rapid turnover of financial managers and execu-
tives
Symptoms of Management FraudAccording to Jack Bologna (1993), corporate fraudcan be generated internally (perpetrated by direc-tors, officers, employees, or agents of a corporationfor or against it or against others) and externally(perpetrated by others—suppliers, vendors, cus-tomers, hackers) against the corporation. Bolognaincludes management fraud as a part of corporatefraud as the intentional overstatement of corporateor division profits. It is inspired, perpetrated, orinduced by managers who seek to benefit in termsof promotions, job stability, larger bonuses, andstatus symbols.
Management fraud tends to involve a number ofpeople with conspiracy in mind. It occurs becausesenior managers, due to their position of power, cir-cumvent internal controls. According to Bologna, themajor symptoms of management fraud are the inten-tional understatement of losses and liabilities andoverstatement of assets or profits. For example:� Profits can be manipulated by overstating rev-
enues or understating costs.� Revenues can be overstated by recording ficti-
tious sales, recording unfinalized sales, recordingconsignments as sales, or recording shipments tostorage facilities as sales.
� Costs can be manipulated by deferring them to thenext accounting period or understating them in thecurrent period. This is accomplished by such ploysas overstating ending inventories of raw materials,work-in-process, and finished goods, or understat-ing purchases of raw materials.
In almost every case of management fraud, signs(red flags) of the fraud exist for some time before the

JWBT150-Vallabhaneni c09 July 15, 2009 14:40
LEARNING OBJECTIVE 9.6: UNDERSTAND THE NATURE AND TYPES OF CORPORATE FRAUD 265
fraud itself is detected or disclosed by a third party.These signs include:
� Knowledge that the company is having financialdifficulties, such as frequent cash flow shortages,declining sales and profits, and loss of marketshare.
� Apparent management incompetence, such aspoor planning, organization, communication, andcontrols; poor motivation and delegation; man-agement indecision and confusion about corpo-rate mission, goals, and strategies; managementignorance of conditions in the industry and in thegeneral economy.
� Autocratic management, low trust of employees,poor promotion opportunities, high turnover ofemployees, poorly defined business ethics.
� Accounting-related transaction-based red flags:� Cash flow is diminishing.� Sales and income are diminishing.� Payables and receivables are increasing.� Unusual or second endorsements on checks.� Inventory and cost of sales are increasing.� Income and expense items are continually reclas-
sified.� Suspense items are either not reconciled at all or
reconciled in an untimely manner.� Suspense items are written off without explana-
tion.� Accounts receivable write-offs are increasing.� Journal entries are heavily adjusted at year-end.� Old outstanding checks.� Heavy customer complaints.
Accounting Fraud by Higher-Level Managers:� Early booking of sales� Expense deferrals� Inventory overstatement� Expense account padding
Symptoms of Employee FraudEmbezzlement is a major type of employee fraud.The crime of embezzlement consists of the fraudu-lent misappropriation of the property of an employerby an employee to whom the possession of thatproperty has been entrusted. Here is the differencebetween embezzlement and larceny: embezzlementoccurs when the embezzler gains initial possessionof property lawfully but subsequently misappropri-ates it. Larceny is committed when property is takenwithout the owner’s consent.
Common embezzlement techniques include theseschemes:
� Cash disbursement embezzlement involves thecreation of fake documents or false expense entriesusing phony invoices, timecards, and receipts.
� Cash receipts fraud involves the lapping of cash oraccounts receivable. Here the embezzler borrowsfrom today’s receipts and replaces them with to-morrow’s receipts. Other examples are skimming,where the proceeds of cash sales are interceptedbefore any entry is made of their receipts andgranting fake credits for discounts, refunds, re-bates, returns, and allowances, possibly throughcollusion with a customer.
� Theft of property involves assets such as tools, sup-plies, equipment, finished goods, raw materials,and intellectual property such as software, data,and proprietary information.
Corruption is another common type of employeefraud. Vendors, suppliers, service providers, or con-tractors often corrupt the employees of an organiza-tion on both a small-scale level (e.g., gifts and freetickets of nominal value) and a large-scale level (e.g.,commissions, payoffs, free trips, free airline ticketsand hotel accommodations).
Accounting Fraud by Lower-Level Employees:� Check kiting� Lapping of receivables� Phony vendor invoices� Phony benefit payment claims� Expense account padding
Management Representations versus RiskThe auditor needs to assess the risk of managementmisrepresentations and to consider the effects ofsuch risks in establishing an overall audit strategyand the scope of the audit. Examples of situations(red flags) that could lead to risk of managementrepresentations include the following:
� Frequent disputes about aggressive application ofgenerally accepted accounting principles.
� Excessive emphasis on meeting targets uponwhich management compensation program isbased.
� Responses to audit inquiries are evasive.� Employees lack necessary knowledge and expe-
rience, yet develop various estimates includingaccounting.

JWBT150-Vallabhaneni c09 July 15, 2009 14:40
266 Learning Module 9: Corporate Control, Law, Ethics, and Governance
� Supervisors of employees generating estimates ap-pear careless or inexperienced in reviewing andapproving the estimates.
� A history of unreliable or unreasonable estimateshas developed.
� Crisis conditions exist constantly in operating andaccounting areas of the organization.
� Frequent and excessive back orders, shortages ofmaterials and products, delays, or lack of docu-mentation of major transactions arise.
� Access to computer-based application systems ini-tiating or controlling the movement of assets is notrestricted.
� High levels of transaction processing errors areobserved.
� Unusual delays occur in providing operatingresults and accounting reports.
Review of Accounting EstimatesMany assumptions go into accounting estimates.The auditor should understand these assumptionsand should evaluate to determine whether theassumptions are subjective and are susceptible tomisstatements and bias.
The auditor should show professional skepticismduring the review and evaluation of the reason-ableness of accounting estimates. These estimatescontain both subjective and objective factors. Profes-sional skepticism is important with respect to subjec-tive factors where personal bias could be significant.
Examples of accounting estimates include: uncol-lectible receivables; allowance for loan losses;revenues to be earned on contracts; subscriptionincome; losses on sales contracts; professional mem-bership or union dues income; valuation of financialsecurities; trading versus investment securityclassifications; compensation in stock option plansand deferred plans; probability of loss; obsoleteinventory; net realizable value of inventories; lossesin purchase commitments; property and causalityinsurance accruals; loss reserves; warranty claims;and taxes on real estate and personal property.
In addition to review, the auditor should test man-agement’s process of developing accounting esti-mates or develop an independent estimation. Theauditor can compare prior estimates with subse-quent results to assess the reliability of the processused to develop estimates. The auditor should alsoreview whether the accounting estimates are consis-tent with the operational plans and programs of theentity.
❑ Learning Objective 9.7:UNDERSTAND THE ISSUES INCORPORATE LAW REGARDINGAGENCY PROBLEMS AND COSTSThe major condition embedded in the structure ofmodern corporations that has contributed to thecorporate governance problem has been the sepa-ration of ownership from control. In the precor-porate period, owners were typically the managersthemselves. Thus, the system worked the way it wasintended; the owners also controlled the business.Even when firms grew larger and managers werehired, the owners often were on the scene to holdthe management group accountable.
As the public corporation grew and stock own-ership became widely dispersed, a separation ofownership from control became the prevalent con-dition. The dispersion of ownership into hundredsof thousands or millions of shares meant that essen-tially no one or no one group owned enough sharesto exercise control. This being the case, the mosteffective control that owners could exercise was theelection of the board of directors to serve as theirrepresentative and watch over management. Theshareholders were owners in a technical sense, butmost of them perceived themselves to be investorsrather than owners.
Other factors that added to management’s powerwere the corporate laws and traditions that gavethe management group control over the proxyprocess—the method by which the shareholderselected boards of directors. Over time, it was notdifficult for management groups to create boardsof directors of likeminded executives who wouldsimply collect their fees and defer to managementon whatever it wanted. The result of this processwas that power, authority, and control began to flowupward from management rather than downwardfrom the shareholders (owners). Agency problemsdeveloped when the interests of the shareholderswere not aligned with the interests of the manager,and the manager (who is simply a hired agent withthe responsibility of representing the owner’s bestinterest) began to pursue self-interest instead.
Market forces and agency costs aim to pre-vent or minimize agency problems. Examples ofmarket forces include large shareholders and threatof takeover, where large institutional shareholdersput pressure on company management to performusing their voting rights and where a constant threatof a takeover motivates company management to

JWBT150-Vallabhaneni c09 July 15, 2009 14:40
LEARNING OBJECTIVE 9.7: UNDERSTAND THE ISSUES IN CORPORATE LAW REGARDING AGENCY PROBLEMS AND COSTS 267
act in the best interest of the corporation owners. Ex-amples of agency costs include cost of managementcompensation in terms of incentive plans (stock op-tions), performance plans (performance shares), andcash bonuses, and costs imposed by lenders (cred-itors and bankers) in the form of constraints puton the borrower’s actions to protect their invest-ment (e.g., minimum liquidity levels, merger and ac-quisition activities, executive salaries, and dividendpayments).
Not many individuals want board director posi-tions. Concerned about increasing legal hassles em-anating from stockholder, customer, and employeelawsuits, people are quitting director positions orrefusing to accept them in the first place. Although
courts rarely hold directors personally liable in thehundreds of shareholder suits filed every year, overthe past several years there have been a few casesin which directors have been held personally andfinancially liable for their decisions.
Self-Assessment Exercise
Online exercises are provided for the learn-ing objectives in this module. Please visitwww.mbaiq.com to complete the online exercisesand to calculate your MBA IQ Score.

JWBT150-Vallabhaneni c09 July 15, 2009 14:40
268

JWBT150-Vallabhaneni c10 July 28, 2009 18:36
LEARNING MODULE 10
International Business
Learning Objective 10.1: UnderstandHow to Develop and ManageInternational Business Strategies 269Organizational Structures 269Models of MNCs 270Types of Decision Making in MNCs 270Types of International Strategies 270International Strategic and
Tactical Objectives 271Learning Objective 10.2: Understand
the Various Issues in InternationalTrade and Investment 271Trade 272Intellectual Property Rights and International
Licensing Agreements 273Foreign Direct Investment 274
Learning Objective 10.3: Understandthe Nature of InternationalProduction Economics 275The Terms of Trade 275
Learning Objective 10.4: Understandthe Nature of International TradeLaws 276
World Trade Organization 276North American Free Trade Agreement 278European Union 278Regional Groups 279
Learning Objective 10.5: Understandthe Various Issues in InternationalFinancial Systems 280
Learning Objective 10.6: UnderstandHow to Staff and ManageInternational Operations 281
Learning Objective 10.7: Understandthe Various Issues in ConductingInternational Business in CrossCultures 281Effects of Cultures 282Global Manager’s Dilemma 282Regional Cultures 282Global Communication Insights 282High- and Low-Context Communications 282Cultural Awareness Learning Program 283Cross-Cultural Negotiations 283Global Mindsets 284
❑ Learning Objective 10.1:UNDERSTAND HOW TO DEVELOPAND MANAGE INTERNATIONALBUSINESS STRATEGIESThe scope of this learning objective includes a dis-cussion of different organizational structures, mod-els, and types of decision making and strategies in-volved in multinational corporations.
Organizational StructuresThe organizational structure of the multinationalcorporation (MNC) evolves over time due to changesin economic policies, tax laws, government regu-lations, and political structures. The organizationalstructure of the MNC varies, in which each man-ager’s level has a varied degree of authority andresponsibility.
Mueller suggests five common forms of organi-zations used by MNCs: (1) the international divi-sion/department, (2) organization by product line,(3) functional organization, (4) geographic organiza-tion, and (5) the global matrix organization.
The international division/department separatesforeign operations from domestic operations. Thisinternational division is usually evaluated as an in-dependent operation and compared with the do-mestic division. Information flows occur from sub-sidiaries to the vice president of the internationaldivision.
Organization by product line results in the inte-gration of domestic and foreign operations and theevaluation of product lines based on worldwide re-sults. Information flows occur from subsidiaries tothe vice president of the product line.
A company grouped by function (such as mar-keting, manufacturing, or accounting) is called a
269
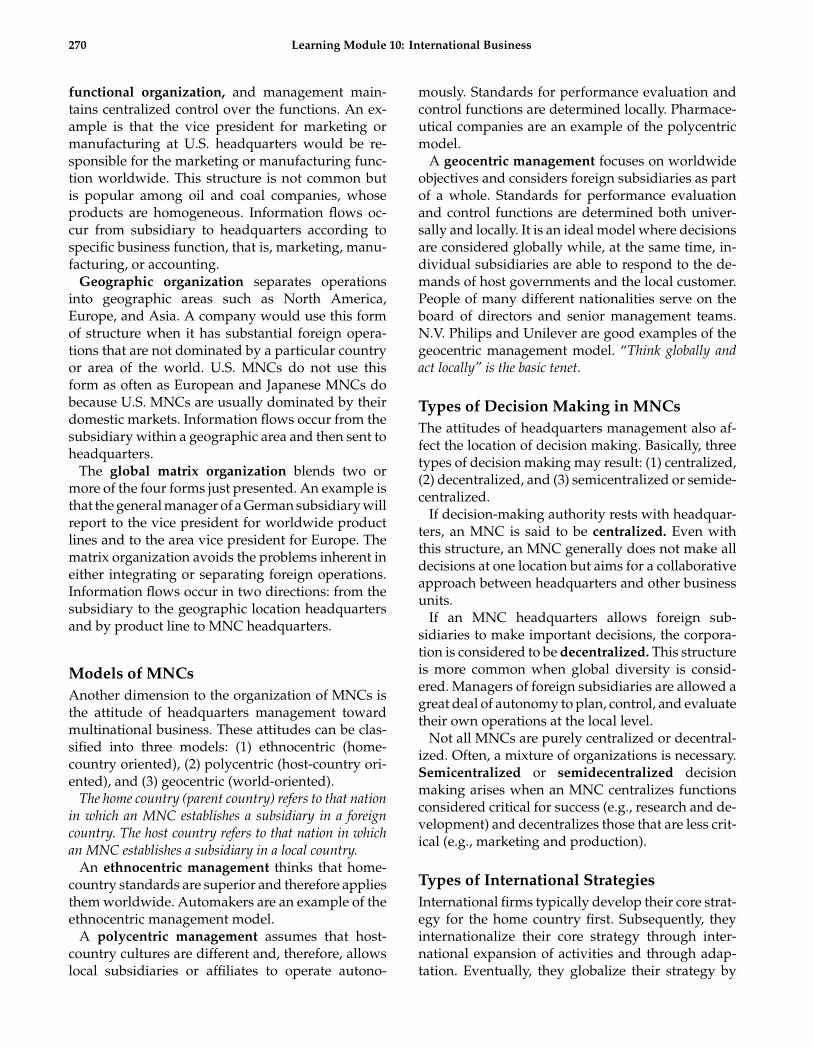
JWBT150-Vallabhaneni c10 July 28, 2009 18:36
270 Learning Module 10: International Business
functional organization, and management main-tains centralized control over the functions. An ex-ample is that the vice president for marketing ormanufacturing at U.S. headquarters would be re-sponsible for the marketing or manufacturing func-tion worldwide. This structure is not common butis popular among oil and coal companies, whoseproducts are homogeneous. Information flows oc-cur from subsidiary to headquarters according tospecific business function, that is, marketing, manu-facturing, or accounting.
Geographic organization separates operationsinto geographic areas such as North America,Europe, and Asia. A company would use this formof structure when it has substantial foreign opera-tions that are not dominated by a particular countryor area of the world. U.S. MNCs do not use thisform as often as European and Japanese MNCs dobecause U.S. MNCs are usually dominated by theirdomestic markets. Information flows occur from thesubsidiary within a geographic area and then sent toheadquarters.
The global matrix organization blends two ormore of the four forms just presented. An example isthat the general manager of a German subsidiary willreport to the vice president for worldwide productlines and to the area vice president for Europe. Thematrix organization avoids the problems inherent ineither integrating or separating foreign operations.Information flows occur in two directions: from thesubsidiary to the geographic location headquartersand by product line to MNC headquarters.
Models of MNCsAnother dimension to the organization of MNCs isthe attitude of headquarters management towardmultinational business. These attitudes can be clas-sified into three models: (1) ethnocentric (home-country oriented), (2) polycentric (host-country ori-ented), and (3) geocentric (world-oriented).
The home country (parent country) refers to that nationin which an MNC establishes a subsidiary in a foreigncountry. The host country refers to that nation in whichan MNC establishes a subsidiary in a local country.
An ethnocentric management thinks that home-country standards are superior and therefore appliesthem worldwide. Automakers are an example of theethnocentric management model.
A polycentric management assumes that host-country cultures are different and, therefore, allowslocal subsidiaries or affiliates to operate autono-
mously. Standards for performance evaluation andcontrol functions are determined locally. Pharmace-utical companies are an example of the polycentricmodel.
A geocentric management focuses on worldwideobjectives and considers foreign subsidiaries as partof a whole. Standards for performance evaluationand control functions are determined both univer-sally and locally. It is an ideal model where decisionsare considered globally while, at the same time, in-dividual subsidiaries are able to respond to the de-mands of host governments and the local customer.People of many different nationalities serve on theboard of directors and senior management teams.N.V. Philips and Unilever are good examples of thegeocentric management model. “Think globally andact locally” is the basic tenet.
Types of Decision Making in MNCsThe attitudes of headquarters management also af-fect the location of decision making. Basically, threetypes of decision making may result: (1) centralized,(2) decentralized, and (3) semicentralized or semide-centralized.
If decision-making authority rests with headquar-ters, an MNC is said to be centralized. Even withthis structure, an MNC generally does not make alldecisions at one location but aims for a collaborativeapproach between headquarters and other businessunits.
If an MNC headquarters allows foreign sub-sidiaries to make important decisions, the corpora-tion is considered to be decentralized. This structureis more common when global diversity is consid-ered. Managers of foreign subsidiaries are allowed agreat deal of autonomy to plan, control, and evaluatetheir own operations at the local level.
Not all MNCs are purely centralized or decentral-ized. Often, a mixture of organizations is necessary.Semicentralized or semidecentralized decisionmaking arises when an MNC centralizes functionsconsidered critical for success (e.g., research and de-velopment) and decentralizes those that are less crit-ical (e.g., marketing and production).
Types of International StrategiesInternational firms typically develop their core strat-egy for the home country first. Subsequently, theyinternationalize their core strategy through inter-national expansion of activities and through adap-tation. Eventually, they globalize their strategy by

JWBT150-Vallabhaneni c10 July 28, 2009 18:36
LEARNING OBJECTIVE 10.2: UNDERSTAND THE VARIOUS ISSUES IN INTERNATIONAL TRADE AND INVESTMENT 271
integrating operations across nations. These stepstranslate into four distinct types of strategies appliedby international enterprises:
1. Ethnocentric strategy. Following World War II,U.S. enterprises operated mainly from an ethno-centric perspective. These companies producedunique goods and services, which they offeredprimarily to the domestic market. Lack of inter-national competition offset their need to be sensi-tive to cultural differences. When these firms ex-ported goods, they did not alter them for foreignconsumption—the costs of alterations for culturaldifferences were assumed by foreign buyers. Ineffect, this type of company had one strategy forall markets.
2. Multidomestic strategy. The multidomestic firmhas a different strategy for each of its foreign mar-kets. According to Craig (1976), in this type ofstrategy, “a company’s management tries to oper-ate effectively across a series of worldwide posi-tions with diverse product requirements, growthrates, competitive environments, and politicalrisks. The company prefers that local managersdo what is necessary to succeed in research anddevelopment, production, marketing, and distri-bution, but holds them responsible for results.” Inessence, this type of corporation competes withlocal competitors on a market-by-market basis.
3. Global strategy. The global corporation uses all ofits resources against its competition in a very inte-grated fashion. All of its foreign subsidiaries anddivisions are highly interdependent in both oper-ations and strategy. Therefore, whereas in a mul-tidomestic strategy the managers in each countryreact to competition without considering what istaking place in other countries, in a global strategy,competitive moves are integrated across nations.The same kind of move is made in different coun-tries at the same time or in a systematic fashion.For example, a competitor is attacked in one na-tion in order to exhaust its resources for anothercountry, or a competitive attack in one nation iscountered in a different country—in that instance,the counterattack in a competitor’s home marketis a party to an attack on one’s home market.
4. Transnational strategy. The transnational strat-egy provides for global coordination (like theglobal strategy) and at the same time it allowslocal autonomy (like the multidomestic strategy).Nestle, the world’s largest food company, head-quartered in Switzerland, follows this strategy.
The challenges that managers of transnationalcorporations face are to identify and exploit cross-border synergies and to balance local demandswith the global vision for the corporation. Build-ing an effective transnational organization re-quires a corporate culture that values global dis-similarities across cultures and markets.
International Strategic andTactical ObjectivesOrganizations generally establish two kinds of mea-surable objectives:
� Strategic objectives, which are guided by the en-terprise’s mission or purpose and deal with long-term issues, associate the enterprise to its exter-nal environment and provide management with abasis for comparing performance with that of itscompetitors and in relation to environmental de-mands. Examples of strategic objectives include toincrease sales, to increase market share, to increaseprofits, and to lower prices by becoming an inter-national firm.
� Tactical objectives, which are guided by the enter-prise’s strategic objectives and deal with shorterterm issues, identify the key result areas in whichspecific performance is essential for the successof the enterprise and aim to attain internal effi-ciency. For example, they identify specifically howto lower costs, to lower prices, to increase output,to capture a larger portion of the market, and topenetrate an international market.
❑ Learning Objective 10.2:UNDERSTAND THE VARIOUSISSUES IN INTERNATIONALTRADE AND INVESTMENTInternational business is classified into three cat-egories: (1) trade, (2) intellectual property rights(trademarks, patents, and copyrights) and interna-tional licensing agreements, and (3) foreign direct in-vestment. To the marketer, these broad categories de-scribe three important methods for entering a foreignmarket. To the lawyer, they also represent the formof doing business in a foreign country and the legalrelationship between parties to a business transac-tion. Each method brings a different set of problemsto the firm because the level of foreign penetrationand entanglement in various countries is different.

JWBT150-Vallabhaneni c10 July 28, 2009 18:36
272 Learning Module 10: International Business
TradeTrade consists of the import and export of goodsand services. Exporting is the term generally usedto refer to the process of sending goods out of acountry, and importing is used to denote whengoods are brought into a country. However, a moreaccurate definition is that exporting is “the shipmentof goods or the rendering of services to a foreignbuyer located in a foreign country.” Importing isthen defined as “the process of buying goods from aforeign supplier and entering them into the customsterritory of a different country.” Every export entailsan import and vice versa.
A country will have a trade deficit when it con-sumes more than it produces and imports the dif-ference from other countries. A country will becomea debtor nation when there is a huge trade deficitand when it borrows to finance the domestic budgetdeficit.
ExportingTrade is often a firm’s first step into internationalbusiness. Compared to the other forms of interna-tional business (licensing and investment), trade isrelatively uncomplicated. It provides the inexperi-enced or smaller firm with an opportunity to pene-trate a new market or at least to explore foreign mar-ket potential, without significant capital investmentand the risks of becoming a full-fledged player (thatis, citizen) in the foreign country. For many largerfirms, including multinational corporations, export-ing may be an important portion of their businessoperations. The U.S. aircraft industry, for example,relies heavily on exports for significant revenues.
Exporting is generally divided into two types: (1)direct and (2) indirect. Direct exporting seems simi-lar to selling goods to a domestic buyer. A prospec-tive foreign customer may have seen a firm’s prod-ucts at a trade show, located a particular companyin an industrial directory, or been recommended byanother customer. A firm that receives a request forproduct and pricing information from a foreign cus-tomer may be able to handle it routinely and exportdirectly to the buyer. With some assistance, a firmcan overcome most hurdles, get the goods properlypackaged and shipped, and receive payment as an-ticipated. Although many of these onetime sales areturned into long-term business success stories, manymore are not. A firm hopes to develop a regularbusiness relationship with its new foreign customer.
However, the problems that can be encountered evenin direct exporting are considerable.
Direct exporting is often done through foreign salesagents who work on commission. It also can be doneby selling directly to foreign distributors. Foreigndistributors are independent firms, usually locatedin the country to which a firm is exporting, that pur-chase goods for resale to their customers. They as-sume the risks of buying and warehousing goodsin their market and provide additional product sup-port services. The distributor usually services theproducts they sell, thus relieving the exporter of thatresponsibility. They often train end users to use theproduct, extend credit to their customers, and bearresponsibility for local advertising and promotion.
Indirect exporting is used by companies seekingto minimize their involvement abroad. Lacking ex-perience, personnel, or capital, they may be unableto locate foreign buyers or not yet ready to handlethe mechanics of a transaction on their own. Thereare several different types of indirect exporting. Ex-port trading companies (ETCs) market the productsof several manufacturers in foreign markets. Theyhave extensive sales contacts overseas and experi-ence in air and sea shipping. They often operate withthe assistance and financial backing of large banks,thus making the resources and international contactsof the bank’s foreign branches available to the man-ufacturers whose products they market. ETCs arelicensed to operate under the U.S. antitrust laws.
Export management companies (EMCs), however,are really consultants who advise manufacturers andother exporters. Firms that cannot justify their ownin-house export managers use them. They engagein foreign market research, identify overseas salesagents, exhibit goods at foreign trade shows, pre-pare documentation for export, and handle languagetranslations and shipping arrangements. As in directexporting, all forms of indirect exporting can involvesales through agents or to distributors.
Importing and Global SourcingHere, importing is presented from the perspectiveof the global firm for which importing is a regularand necessary part of their business. Global sourc-ing is the term commonly used to describe the pro-cess by which a firm attempts to locate and purchasegoods or services on a worldwide basis. These goodsmay include, for example, raw materials for manu-facturing, component parts for assembly operations,

JWBT150-Vallabhaneni c10 July 28, 2009 18:36
LEARNING OBJECTIVE 10.2: UNDERSTAND THE VARIOUS ISSUES IN INTERNATIONAL TRADE AND INVESTMENT 273
commodities such as agricultural products or min-erals, or merchandise for resale.
Methods, Restrictions, and Barriersof International TradeTariffs, nontariff barriers, and domestic content lawshave a tremendous influence on how firms maketheir trade and investment decisions. These deci-sions in turn are reflected in the patterns of worldtrade and the flows of investment capital.
Tariffs A tariff is a tax imposed on imported goods,usually as a percentage of the product’s value. Im-port duties, or tariffs, have been a source of gov-ernment revenue far longer than income and value-added taxes. Goods entering a country are taxed onan ad valorem (percent of value) basis. Many foreigncountries prefer to use tariffs since it is relatively easyto check and control as goods come through desig-nated ports.
Nontariff barriers are all barriers to importing orexporting other than tariffs. Nontariff barriers aregenerally a greater barrier to trade than are tariffs be-cause they are more insidious. Unlike tariffs, whichare published and easily understood, nontariff bar-riers are often disguised in the form of governmentrules or industry regulations and are often not under-stood by foreign companies. Countries impose non-tariff barriers to protect their national economic, so-cial, and political interests. Imports might be bannedfor health and safety reasons. Imported goods usu-ally have to be marked with the country of origin andlabeled in the local language, so consumers knowwhat they are buying.
Specific examples of nontariff barriers include thefollowing:
� Technical barrier to trade or product standard.Examples of product standards include safetystandards, electrical standards, and environmen-tal standards.
� Embargo. An embargo is a total or near-total banon trade with a particular country, sometimes en-forced by military action and usually imposed forpolitical purposes.
� Boycott. A boycott is a refusal to trade or do busi-ness with certain firms, usually from a particularcountry, on political or other grounds.
� Export control. An export control limits the typeof product that may be shipped to any particularcountry. They are usually imposed for economic
or political purposes and are used by all nations ofthe world.
� Import quotas. A quota is simply a quantitativerestriction applied to imports. Under World TradeOrganization (WTO), import quotas are supposedto be banned, but there are so many exceptionsthat the ban is not that useful. In fact, as tariffshave been reduced as an instrument of protection,the tendency has been to replace them with quo-tas. Tariffs focus on taxes, while quotas focus onquantities.
Domestic Content Laws Another way many coun-tries have attempted to assure the participation ofdomestic producers has been through domestic con-tent laws. These laws stipulate that when a productis sold in the marketplace, it must incorporate a spec-ified percentage of locally made components. Theselaws must meet “local content requirements.”
Intellectual Property Rights andInternational Licensing AgreementsIntellectual property rights are a grant from a gov-ernment to an individual or firm of the exclusive le-gal right to use a copyright, patent, or trademark fora specified time. Copyrights are legal rights to artisticor written works, including books, software, films,and music, or to such works as the layout design ofa computer chip. Trademarks include the legal rightto use a name or symbol that identifies a firm or itsproduct. Patents are governmental grants to inven-tors assuring them of the exclusive legal right to pro-duce and sell their inventions for a period of years.Copyrights, trademarks, and patents comprise sub-stantial assets of many domestic and internationalfirms. As valuable assets, intellectual property canbe sold or licensed for use to others through a licens-ing agreement.
International licensing agreements are contractsby which the holder of intellectual property willgrant certain rights in that property to a foreignfirm under specified conditions and for a specifiedtime. Licensing agreements represent an importantforeign market entry method for firms with mar-ketable intellectual property. For example, a firmmight license the right to manufacture and distributea certain type of computer chip or the right to usea trademark on apparel such as bluejeans or de-signer clothing. It might license the right to distributeHollywood movies or to reproduce and market

JWBT150-Vallabhaneni c10 July 28, 2009 18:36
274 Learning Module 10: International Business
word-processing software in a foreign market, or itmight license its patent rights to produce and sella high-tech product or pharmaceutical. U.S. firmshave extensively licensed their property around theworld and in recent years have purchased the tech-nology rights of Japanese and other foreign firms.
Technology TransferThe exchange of technology and manufacturingknow-how between firms in different countriesthrough arrangements such as licensing agreementsis known as technology transfer. Transfers of tech-nology and know-how are regulated by governmentcontrol in some countries. For instance, governmentregulation might require that the licensor introduceits most modern technology to the developing coun-tries or train workers in its use.
International FranchisingFranchising is a form of licensing that is gaining inpopularity worldwide. The most common form offranchising is known as a business operations fran-chise, usually used in retailing. Under a typical fran-chising agreement, the franchisee is allowed to usea trade name or trademark in offering goods or ser-vices to the public in return for a royalty based on apercentage of sales or other fee structure. The fran-chisee will usually obtain the franchiser’s know-howin operating and managing a profitable business andits other “secrets of success” (ranging from a “secretrecipe,” to store design, to accounting methods).
Foreign Direct InvestmentThe term foreign investment, or foreign direct in-vestment, refers to the ownership and active controlof ongoing business concerns, including investmentin manufacturing, mining, farming, assembly oper-ations, and other facilities of production. A distinc-tion is made between the home and host countries ofthe firms involved. The home country refers to thatcountry under whose laws the investing corporationwas created or is headquartered. For example, theUnited States is home to multinational corporationssuch as Ford, Exxon, and IBM, to name a few, butthey operate in host countries throughout every re-gion of the world. Of the three forms of internationalbusiness, foreign investment provides the firm withthe most involvement and perhaps the greatest riskabroad. Investment in a foreign plant is often a result
of having had successful experiences in exporting orlicensing, and of the search for ways to overcome thedisadvantages of those other entry methods. For ex-ample, by producing its product in a foreign countryinstead of exporting, a firm can avoid quotas and tar-iffs on imported goods, avoid currency fluctuationson the traded goods, provide better product serviceand spare parts, and more quickly adapt products tolocal tastes and market trends. Manufacturing over-seas for foreign markets can mean taking advantageof local natural resources, labor, and manufacturingeconomies of scale. Foreign investment in the UnitedStates is often called reverse investment.
Multinational corporations wishing to enter a for-eign market through direct investment can structuretheir business arrangements in many different ways.Their options and eventual course of action may de-pend on many factors, including industry and mar-ket conditions, capitalization of the firm and financ-ing, and legal considerations. Some of these optionsinclude the startup of a new foreign subsidiary com-pany, the formation of a joint venture with an exist-ing foreign company, or the acquisition of an existingforeign company by stock purchase. For now, keep inmind that multinational corporations are usually nota single legal entity. They are global enterprises thatconsist of any number of interrelated corporate enti-ties, connected through extremely complex chains ofstock ownership. Stock ownership gives the invest-ing corporation tremendous flexibility when invest-ing abroad.
The wholly owned foreign subsidiary is a “for-eign” corporation organized under the laws of aforeign host country but owned and controlled bythe parent corporation in the home country. Becausethe parent company controls all of the stock in thesubsidiary, it can control management and financialdecision making.
The joint venture is a cooperative business ar-rangement between two or more companies forprofit. A joint venture may take the form of a part-nership or corporation. Typically, one party will con-tribute expertise and another the capital, each bring-ing its own special resources to the venture. Jointventures exist in all regions of the world and in alltypes of industries. Where the laws of a host coun-try require local ownership or where investing for-eign firms have a local partner, the joint venture isan appropriate investment vehicle. Local participa-tion refers to the requirement that a share of thebusiness be owned by nationals of the host coun-try. These requirements are gradually being reduced

JWBT150-Vallabhaneni c10 July 28, 2009 18:36
LEARNING OBJECTIVE 10.3: UNDERSTAND THE NATURE OF INTERNATIONAL PRODUCTION ECONOMICS 275
in most countries that, in an effort to attract moreinvestment, are permitting wholly owned sub-sidiaries. Many American companies do not favorthe joint venture as an investment vehicle becausethey do not want to share technology, expertise, andprofits with another company.
Another method of investing abroad is for twocompanies to merge or for one company to acquireanother ongoing firm. This option has appeal be-cause it requires less know-how than does a newstartup and can be concluded without disruption ofbusiness activity.
❑ Learning Objective 10.3:UNDERSTAND THE NATURE OFINTERNATIONAL PRODUCTIONECONOMICSIncreased total world output is a good argumentfor free trade between countries. Incentives exist fortrade to develop along the lines of comparative ad-vantage. Countries achieve comparative advantagein certain goods due to international differences indemand or supply.
The theory of comparative advantage explainshow mutually beneficial trade can occur when onecountry is less efficient than another county in theproduction of all commodities. The less-efficientcountry should specialize in and export the com-modity in which its absolute disadvantage is small-est and should import the other commodity.
Countries should specialize when they have theirgreatest absolute advantage or in their least abso-lute disadvantage. This rule is known as the law ofcomparative advantage. An absolute advantage isthe ability to produce a good using less input than ispossible anywhere in the world.
Production of the good with the lower price ex-pands, and the country with a lower relative price ofa product has comparative advantage in that prod-uct. Therefore, production and trade follow the lineof comparative advantage. For trade to occur alongthe lines of comparative advantage, the relative wageratio must lie between the extremes of the differencesin relative productive advantages.
The Heckscher-Ohlin (HO) theorem states that acountry will have a comparative advantage in andtherefore will export that good whose productionis relatively intensive in the factor with which thatcountry is relatively well endowed. For example,a country that is relatively capital-abundant com-
pared with another country will have a comparativeadvantage in the good that requires more capitalper worker to produce.
In a competitive environment, trade flows are de-termined by profit-seeking firms. If a product isrelatively cheap in one country, it will tend to beexported to those places where it is relatively ex-pensive. This practice supports the assumption thattrade will flow in the direction of comparative ad-vantage. Each country exports its comparative advantagegood and imports its comparative disadvantage good.
Which Country Has the ComparativeAdvantage?
Labor Hours per Unit of Output
Country A Country B
Cotton 3 12Automobile 6 8
Note that country A is four times (that is, 12 to 3)more efficient in the production of cotton relativeto country B. However, country A is only 4/3 (thatis, 8/6) more efficient in the production of auto-mobiles relative to country B. Because country A’sgreatest absolute advantage is in the productionof cotton, it is said to have a comparative advan-tage in cotton. Because country B’s least absolutedisadvantage is in the production of automobiles,it is said to have a comparative advantage inautomobiles.
The Terms of TradeThe advantages realized as a result of trade are calledthe gains from trade, which are shared among im-porting and exporting countries through the termsof trade. The terms of trade is related to the quan-tity of imported goods that can be obtained per unitof goods exported. They are measured by the ratioof the price of exports to the price of imports. Arise in the price of imported goods, with the priceof exported goods unchanged, indicates a fall in theterms of trade; it will now take more exports to buythe same quantity of imports. Similarly, a rise in theprice of exported goods, with the price of importedgoods unchanged, indicates a rise in the terms oftrade; it will now take fewer exports to buy the samequantity of imports.

JWBT150-Vallabhaneni c10 July 28, 2009 18:36
276 Learning Module 10: International Business
Because international trade involves many coun-tries and many products, it is good to compute acountry’s terms of trade as an index number:
Terms of Trade = (Index of Export Prices)/(Index of Import Prices) × 100
A rise in the index number is referred to as a fa-vorable change in a country’s terms of trade, mean-ing more goods can be imported per unit of goodsexported than before.
A fall in the index number is referred to as an unfa-vorable change in a country’s terms of trade, mean-ing fewer goods can be imported per unit of goodsexported than before. It must export more to pay forany given amount of imports.
Calculation of New Terms of Trade Index
The export price index rises from 100 to 120, andthe import price index rises from 100 to 110. Whatis the new terms of trade number? The new termsof trade index increases from 100 to 109, meaningthat a unit of exports will buy 9 percent moreimports than at the old terms of trade (i.e.,(120/110) – 1.00 = 9%).
❑ Learning Objective 10.4:UNDERSTAND THE NATURE OFINTERNATIONAL TRADE LAWSThe scope of international trade laws includes WorldTrade Organization (WTO), North American FreeTrade Agreement (NAFTA), The European Union(EU), and other regional groups.
World Trade OrganizationTrade liberalization refers to the efforts of govern-ments to reduce tariffs and nontariff barriers to trade.In 1995, the Geneva-based WTO was created to ad-minister the rules and to assist in settling trade dis-putes between its member nations. All WTO nationsare entitled to normal trade relations with one an-other. This is referred to as Most Favored Nation(MFN) trading status. This means that a membercountry must charge the same tariff on importedgoods as, and not a higher one than, that charged onthe same goods coming from other WTO membercountries. Trade liberalization has led to increasedeconomic development and an improved quality oflife around the world.
Implementation of the Uruguay Round agreementis meant to further open markets by reducing tariffsworldwide by one-third; improve WTO proceduresover unfair trade practices; broaden WTO coverageby including areas of trade in services, intellectualproperty rights, and trade-related investment thatpreviously were not covered; and provide increasedcoverage to the areas of agriculture, textiles andclothing, government procurements, and trade andthe environment.
The WTO launched a new round of negotiations inDoha, Qatar in 2001 to conclude in 2004 but collapsedin 2006 due to major differences between parties.The renewed negotiations were designed to lowertrade barriers among poor nations and help themin exporting agricultural products and textiles andto improve labor-intensive industries. The goal wasto integrate poor nations with rich nations into theglobal trading system.
Agreement for Market AccessThe main contribution of the market access agree-ments would be to significantly lower, or eliminate,tariff and nontariff barriers and to expand the ex-tent of tariff bindings, on industrial products amongWTO signatories. The global economic impact of thisagreement is substantial.
Provisions for Subsidies and CountervailingDutiesSubsidies essentially lower a producer’s costs or in-crease its revenues. A subsidy is financial assistanceprovided to domestic or foreign producers by theirrespective governments in the form of cash pay-ments, low-interest loans, tax-breaks, and price sup-ports. Consequently, producers may sell their prod-ucts at lower prices than their competitors from othercountries. Subsidies to firms that produce or sellinternationally traded products can distort interna-tional trade flows.
The United States has historically provided fewerindustrial subsidies than most countries, and it hassought to eliminate trade-distorting subsidies pro-vided by foreign governments.
Countervailing duty laws can address some of theadverse effects that subsidies can cause. Counter-vailing duties are special customs duties imposed tooffset subsidies provided on the manufacture, pro-tection, or export of a particular good.
The agreement would create for the first time threecategories of subsidies and remedies: (1) prohibited

JWBT150-Vallabhaneni c10 July 28, 2009 18:36
LEARNING OBJECTIVE 10.4: UNDERSTAND THE NATURE OF INTERNATIONAL TRADE LAWS 277
subsidies (known as the “red-light” category); (2)actionable subsidies (known as the “yellow-light”category), and (3) nonactionable subsidies (knownas the “green-light” category.
Prohibited subsidies include subsidies to encour-age exports, including de facto export subsidies andsubsidies contingent on the use of local content. Ac-tionable subsidies are domestic subsidies againstwhich remedies can be sought if they are shownto distort trade. Nonactionable subsidies includethose that are not specific (i.e., not limited to an enter-prise or industry or group of enterprises or indus-tries). Subsidies also are nonactionable if they fallinto three classes: (1) certain government assistancefor research and precompetitive development activ-ity, (2) certain government assistance for disadvan-taged regions, and (3) certain government assistanceto adapt existing plants and equipment to new envi-ronmental requirements.
Provision for AntidumpingDumping is generally considered to be the sale of anexported product at a price lower than that chargedfor the same or a like product in the “home” marketof the exporter. This practice is thought of as a formof price discrimination that can potentially harm theimporting nation’s competing industries.
Dumping may occur as a result of exporter busi-ness strategies that include: trying to increase anoverseas market share, temporarily distributingproducts in overseas markets to offset slack demandin the home market, lowering unit costs by exploit-ing large-scale production, and attempting to main-tain stable prices during periods of exchange ratefluctuations.
Provision for SafeguardsA safeguard is a temporary import control or othertrade restriction a country imposes to prevent injuryto domestic industry caused by increased imports.The new Safeguard Agreement would require thatsafeguard measures be limited to an eight-year pe-riod for developed countries and ten years for de-veloping countries. It provides for suspending theautomatic right to retaliate to a safeguard measurefor the first three years. However, it would main-tain the requirement that safeguards be applied onan MFN basis rather than being applied selectively(applied to just the country or countries causing in-jury to the domestic industry).
Agreement on Trade-Related Aspectsof Intellectual Property RightsThe World Intellectual Property Organizations(WIPO), a UN specialized agency, is a world bodywhose mission is to promote the protection ofintellectual property rights throughout the worldthrough cooperation among countries and, whereappropriate, in collaboration with international or-ganizations and to ensure administrative coopera-tion among the intellectual property unions. WIPOadministers a number of international agreementson intellectual property protection, including inparticular the Berne Convention for the Protec-tion of Literary and Artistic Works, which pro-vides for copyright protection and the Paris Con-vention for the Protection of Industrial Property,which provides protection for patents, trademarks,and industrial designs and the repression of unfaircompetition.
Agreement on Trade in ServicesService industries dominate the U.S. economy andare important contributors to U.S. exports. The U.S.service industry is also the world’s largest exporterof services. International trade in services takes placethrough various channels, including:
� Cross-border transactions, such as transmission ofvoice, video, data, or other information and thetransportation of goods and passengers from onecountry to another
� Travel of individual consumers to another coun-try (e.g., services provided to nonresident tourists,students, and medical patients)
� Sales of services (e.g., accounting, advertising, andinsurance) through foreign branches or other affil-iates established in the consuming country
� Travel of individual producers to another country(e.g., services provided to foreign clients by busi-ness consultants, engineers, lawyers, etc.)
The Uruguay Round meetings created the GeneralAgreement on Trade in Services (GATS), which isthe first multilateral, legally enforceable agreementcovering trade and investment in the services sector.
Agreement on Trade-RelatedInvestment MeasuresThere is consensus among many, primarily devel-oped, countries that foreign direct investment canhave a favorable effect on a host country’s economy.

JWBT150-Vallabhaneni c10 July 28, 2009 18:36
278 Learning Module 10: International Business
The foreign direct investment can create jobs, in-crease tax revenues, and introduce new technologies.It also increases the host country wages and produc-tivity and seems to have a net positive effect on thecompetitiveness of the host economy.
Agriculture Provisions of the Uruguay RoundThe Uruguay Round represented the first time thatWTO contracting parties undertook to substantiallyreform agricultural trade. The Punta del Este minis-terial declaration recognized an urgent need to sta-bilize the world agriculture market and liberalizetrade by reducing import barriers, disciplining theuse of direct and indirect subsidies that affect trade,and minimizing the adverse effect of sanitary andphytosanitary regulations and barriers. The decla-ration recognized that other negotiating areas werelikely to improve agricultural trade as well, such asefforts to strengthen the dispute-resolution process.The sanitary and phytosanitary regulations and bar-riers are measures taken to protect human, animal,or plant life or health.
North American Free Trade AgreementThe North American Free Trade Agreement(NAFTA), which went into effect on January 1,1994, was intended to facilitate trade and invest-ment throughout North America (United States,Canada, and Mexico). It incorporates features suchas the elimination of tariff and nontariff barriers.NAFTA also supports the objective of locking inMexico’s self-initiated, market-oriented reforms. Byremoving barriers to the efficient allocation of eco-nomic resources, NAFTA was projected to gener-ate overall, long-term economic gains for membercountries—modest for the United States and Canadaand greater for Mexico. For the United States, this isdue to the relatively small size of Mexico’s econ-omy and because many Mexican exports to theUnited States were already subject to low or no du-ties. Under NAFTA, intraindustry trade and copro-duction of goods across the borders were expectedto increase, enhancing specialization and raisingproductivity.
NAFTA also included procedures first to avoidand then to resolve disputes between parties to theagreement. Separately, the three NAFTA countriesnegotiated and entered into two supplemental agree-ments designed to facilitate cooperation on environ-ment and labor matters among the three countries.
NAFTA will create the largest free trade zone in theworld, with 360 million people and an annual grossnational product totaling over six trillion dollars.
Major Provisions of NAFTAMajor provisions include “rules of origin”; importand export quotas and licenses; technical standardsand certification; escape clauses; telecommunica-tions networks; cross-border trade in services; an-tidumping and subsidy laws; cross-subsidization;investments; performance requirements; right toconvert and transfer local currencies; disputes; in-tellectual property rights; due process; temporaryentry visas; and the side agreements.
Impacts and Implementation of NAFTAAssessment of NAFTA’s effects is a complex under-taking because the provisions last 10 to 15 years.While NAFTA is not yet fully implemented, U.S.trade with NAFTA members has accelerated and isin accordance with pre-NAFTA expectations.
At the sector level, there are diverse impacts fromNAFTA. Within sectors, these may include increasesor decreases in trade flows, hourly earnings, and em-ployment. Economic efficiency may improve fromthis reallocation of resources, but it creates costs forcertain sectors of the economy and labor force, in-cluding job dislocation.
In general, NAFTA or broader trade policies can-not be expected to substantially alter overall U.S.employment levels, which are determined largely bydemographic conditions and macroeconomic factorssuch as monetary policy.
European UnionThe European Union (EU), often called the Com-mon Market, is a supranational legal regime withits own legislative, administrative, treaty-making,and judicial procedures. To create this regime,many European nations have surrendered substan-tial sovereignty to the EU. European Union law hasreplaced national law in many areas and the EU le-gal system operates as an umbrella over the legalsystems of the member states. The EU law is vastand intricate. The EU is the largest market for ex-ports from the United States.
The tasks of EU include creation of an economicand monetary union with emphasis on price stability

JWBT150-Vallabhaneni c10 July 28, 2009 18:36
LEARNING OBJECTIVE 10.4: UNDERSTAND THE NATURE OF INTERNATIONAL TRADE LAWS 279
with the goal of establishing a Europe “without in-ternal frontiers.”
The Council, the Commission, the Parliament,the Court of JusticeThe Council consists of representatives of the rulinggovernments of the member states. The EuropeanCommunity Treaty requires the Council to act by aqualified majority on some matters and with una-nimity on others.
The Commission is independent of the memberstates. Its 20 commissioners are selected by councilappointment. They do not represent member statesor take orders from member state governments. TheCommission is charged with the duty of acting onlyin the best interests of the Union and serves as theguardian of the Treaties. The Commission largelymaintains EU relations with the WTO. The Commis-sion proposes and drafts EU legislation and submitsto the Council for adoption.
The Parliament historically played an advisoryrole. The European Parliament has the power to putquestions to the Commission and the Council con-cerning Union affairs. It also has the power, so farunused, to censure the Commission, in which eventall the Commissioners are required to resign as abody. As a minimum, the Parliament has a right tobe consulted and to give an “opinion” as part of theEU legislative process. The opinion is not binding onthe Commission or Council.
The Court of Justice is to ensure that in the inter-pretation and application of the Treaty “the law” isobserved. There are 15 Justices (one from each state)that make up the European Court of Justice. If a con-flict arises between Union law and the domestic lawof a member state, the Court of Justice has held thatthe former prevails. When there is no conflict, bothUnion law and domestic law can coexist.
Major Provisions of the European UnionThe major provisions of the EU laws include freemovement of goods, free movement of workers, freemovement of capital, free movement of payments,establishment of a monetary system, a tax system,and trade rules with nonmember states.
Regional GroupsMany nations are contemplating or have alreadyformed regional economic integration to capture
the economic gains and international negotiatingstrength that regionalization can bring. The follow-ing list provides some regions or groups:
� Several groups have been formed in Africa, includ-ing UDEA, CEAO, and ECOWAS. The purpose isto establish a common customs and tariff approachtoward the rest of the world and to formulate acommon foreign investment trade.
� Regional groups have been established in LatinAmerica and the Caribbean (CARICOM, CACM,LAFTA/LAIA). The Latin American Free TradeAssociation (LAFTA) had small success in reduc-ing tariffs and developing the region through co-operative industrial sector programs. These pro-grams allocated industrial production among theparticipating states. In 1994, some 37 nationssigned the Association of Caribbean States agree-ment with long-term economic integration goals.
� Gulf Cooperations Council (GCC) was formedbetween Bahrain, Kuwait, Oman, Qatar, SaudiArabia, and United Arab Emirates with objectivesto establish freedom of movement, a regional ar-maments industry, common banking and finan-cial systems, a unified currency policy, a cus-toms union, a common foreign-aid program, and ajoint, international investment company, the GulfInvestment Corporation. The GCC has alreadyimplemented trade and investment rules con-cerning tariffs on regional and imported goods,government contracts, communications, trans-portation, real estate investment, freedom of move-ment of professionals, and development of aUniform Commercial Code. In 1987, the GCC en-tered into negotiations with the EU that resultedin a major 1990 trade and cooperation agreement.
� The Andean Common Market (ANCOM) wasfounded by Bolivia, Chile, Colombia, Ecuador,and Peru in 1969, primarily to counter the eco-nomic power of Argentina, Brazil, and Mexico andto reduce dependency on foreign capital. Later,Venezuela joined and Chile left the group. TheANCOM Commission has not been activist on be-half of regional integration like the EU Commis-sion. It mostly reacts to proposals put forth by theJunta, the administrative arm of ANCOM.
� The Association of South East Asian Nations(ASEAN) was formed in 1967 by Indonesia,Malaysia, the Philippines, Singapore, and Thai-land. Brunei joined in 1984, Vietnam in 1995.The Bangkok Declaration, establishing ASEAN asa cooperative association, is a broadly worded
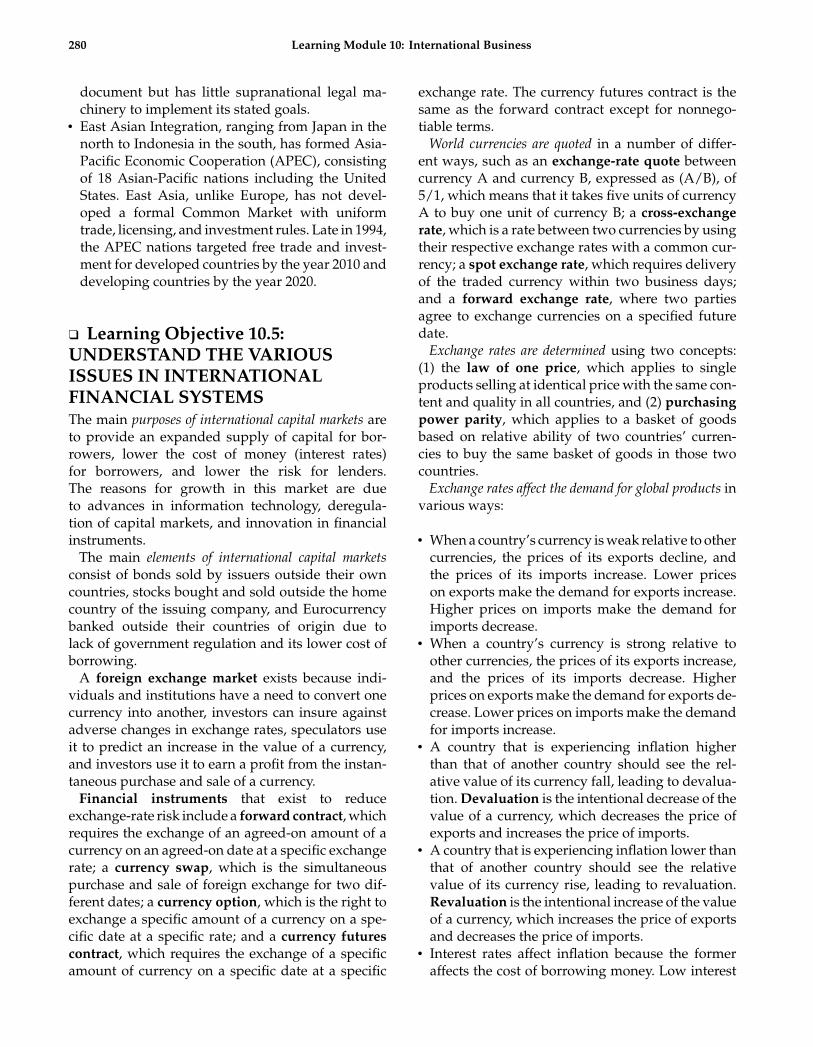
JWBT150-Vallabhaneni c10 July 28, 2009 18:36
280 Learning Module 10: International Business
document but has little supranational legal ma-chinery to implement its stated goals.
� East Asian Integration, ranging from Japan in thenorth to Indonesia in the south, has formed Asia-Pacific Economic Cooperation (APEC), consistingof 18 Asian-Pacific nations including the UnitedStates. East Asia, unlike Europe, has not devel-oped a formal Common Market with uniformtrade, licensing, and investment rules. Late in 1994,the APEC nations targeted free trade and invest-ment for developed countries by the year 2010 anddeveloping countries by the year 2020.
❑ Learning Objective 10.5:UNDERSTAND THE VARIOUSISSUES IN INTERNATIONALFINANCIAL SYSTEMSThe main purposes of international capital markets areto provide an expanded supply of capital for bor-rowers, lower the cost of money (interest rates)for borrowers, and lower the risk for lenders.The reasons for growth in this market are dueto advances in information technology, deregula-tion of capital markets, and innovation in financialinstruments.
The main elements of international capital marketsconsist of bonds sold by issuers outside their owncountries, stocks bought and sold outside the homecountry of the issuing company, and Eurocurrencybanked outside their countries of origin due tolack of government regulation and its lower cost ofborrowing.
A foreign exchange market exists because indi-viduals and institutions have a need to convert onecurrency into another, investors can insure againstadverse changes in exchange rates, speculators useit to predict an increase in the value of a currency,and investors use it to earn a profit from the instan-taneous purchase and sale of a currency.
Financial instruments that exist to reduceexchange-rate risk include a forward contract, whichrequires the exchange of an agreed-on amount of acurrency on an agreed-on date at a specific exchangerate; a currency swap, which is the simultaneouspurchase and sale of foreign exchange for two dif-ferent dates; a currency option, which is the right toexchange a specific amount of a currency on a spe-cific date at a specific rate; and a currency futurescontract, which requires the exchange of a specificamount of currency on a specific date at a specific
exchange rate. The currency futures contract is thesame as the forward contract except for nonnego-tiable terms.
World currencies are quoted in a number of differ-ent ways, such as an exchange-rate quote betweencurrency A and currency B, expressed as (A/B), of5/1, which means that it takes five units of currencyA to buy one unit of currency B; a cross-exchangerate, which is a rate between two currencies by usingtheir respective exchange rates with a common cur-rency; a spot exchange rate, which requires deliveryof the traded currency within two business days;and a forward exchange rate, where two partiesagree to exchange currencies on a specified futuredate.
Exchange rates are determined using two concepts:(1) the law of one price, which applies to singleproducts selling at identical price with the same con-tent and quality in all countries, and (2) purchasingpower parity, which applies to a basket of goodsbased on relative ability of two countries’ curren-cies to buy the same basket of goods in those twocountries.
Exchange rates affect the demand for global products invarious ways:
� When a country’s currency is weak relative to othercurrencies, the prices of its exports decline, andthe prices of its imports increase. Lower priceson exports make the demand for exports increase.Higher prices on imports make the demand forimports decrease.
� When a country’s currency is strong relative toother currencies, the prices of its exports increase,and the prices of its imports decrease. Higherprices on exports make the demand for exports de-crease. Lower prices on imports make the demandfor imports increase.
� A country that is experiencing inflation higherthan that of another country should see the rel-ative value of its currency fall, leading to devalua-tion. Devaluation is the intentional decrease of thevalue of a currency, which decreases the price ofexports and increases the price of imports.
� A country that is experiencing inflation lower thanthat of another country should see the relativevalue of its currency rise, leading to revaluation.Revaluation is the intentional increase of the valueof a currency, which increases the price of exportsand decreases the price of imports.
� Interest rates affect inflation because the formeraffects the cost of borrowing money. Low interest

JWBT150-Vallabhaneni c10 July 28, 2009 18:36
LEARNING OBJECTIVE 10.7: UNDERSTAND THE VARIOUS ISSUES IN CONDUCTING INTERNATIONAL BUSINESS IN CROSS CULTURES 281
rates encourage more debt, cause more spending,and create inflation. High interest rates discour-age debt, cause low spending, and do not createinflation.Because real interest rates do not consider inflationand hence are equal across countries, any differ-ence in the exchange rates of two countries mustbe due to different inflation rates.
❑ Learning Objective 10.6:UNDERSTAND HOW TO STAFFAND MANAGE INTERNATIONALOPERATIONSThe scope of international production (operations)strategies includes conducting capacity-planningstudies to produce output satisfying demand; per-forming facilities-location planning for identifyingoptimal locations after considering the cost–benefitanalysis; determining the location of operations de-cisions, whether it is centralized or decentralized;deciding on production-process planning, whetherit is making standardized or customized prod-ucts; performing facility-layout planning to locatemachines, materials, and departments; conductingquality planning to comply with total quality man-agement (TQM) principles and international stan-dards organization (ISO) 9000 supplier certificationstandards; and making invest-reinvest-divest deci-sions in manufacturing, retail, office, and warehousefacilities after considering political, legal, economic,and social risks in the host country.
The scope of international acquisition of materi-als includes evaluating make-or-buy decisions forraw materials, parts, and components; making in-sourcing and outsourcing decisions for raw mate-rials, parts, and components; deciding on quantityand quality of raw materials acquired either fromlocal or outside sources; and making fixed-asset de-cisions in acquiring plant, property, and equipmentfrom either local or outside sources.
The scope of international logistics includes ship-ping costs by air, sea, or ground to transport rawmaterials and finished goods in and out of thehost country; and keeping inventories at a mini-mum level using just-in-time (JIT) philosophy inmanufacturing.
The scope of international staffing policies in-cludes deciding who fits best to the job at hand.These staffing policies should be aligned with theMNC models of organizational structures.
An ethnocentric staffing policy states that thehome-country nationals should be employed in in-ternational operations in the host country.
A polycentric staffing policy states that the host-country nationals should be employed in interna-tional operations in the host country.
A geocentric staffing policy states that the best-qualified individuals worldwide should be em-ployed in the international operations in the hostcountry. This policy usually applies to senior-levelmanagers, who may come from the home country,from the host country, or from a third country.
Culture in a home country could be different fromthe culture in a host country and vice versa. Cul-tural training helps to cope with culture shock fordeparting managers and reverse culture shock forreturning managers. The ability to adapt to culturaldifferences is needed in all departing managers.
An effective compensation policy should take intoaccount of local cultures, laws, and practices. Basepay, bonus payments, fringe benefits, cost-of-livingadjustments, and cost-of-education adjustments allmust be considered.
Most of labor–management relations are the samebetween the home country and the host country, ex-cept for cultural differences and political influencesin the host country.
❑ Learning Objective 10.7:UNDERSTAND THE VARIOUSISSUES IN CONDUCTINGINTERNATIONAL BUSINESSIN CROSS CULTURESCulture provides people with identity. Harris sum-marized characteristics of culture into ten categories:(1) sense of self and space, (2) communication andlanguage, (3) dress and appearance, (4) food andfeeding habits, (5) time consciousness, (6) relation-ships, (7) values and norms, (8) beliefs and attitudes,(9) mental process and learning, and (10) work habitsand practices (Harris and Moran 1991).
Corporate culture affects how an organizationcopes with competition and change, whether interms of technology, economics, or people. Thework culture stimulates or constricts the energies ofpersonnel, whether through slogans and myths ortaboos. Now management is more cognizant of itscustoms and traditions, rules and regulations, poli-cies and procedures—such components of cultureare being used to make work more enjoyable, to

JWBT150-Vallabhaneni c10 July 28, 2009 18:36
282 Learning Module 10: International Business
increase productivity, and to meet customer needsand competitive challenges.
Effects of CulturesPersons of dissimilar backgrounds usually requiremore time than those of the same culture to be-come familiar with each other, to be willing to speakopenly, to share sufficiently in common ideas, and tounderstand one another.
Therefore, education and training of global leadersmust include formal learning in the various culturaldimensions. With globalization of business, man-agers and leaders need to become more transnationaland transcultural in their thinking, planning, and in-volvement with people.
Differences in customs, behavior, and values resultin problems that can be managed only through effec-tive cross-cultural communication and interaction.When people have misunderstandings or commit“errors” when working with persons from differentcultures, they are often unaware of any problem.Cross-cultural mistakes result when we fail to rec-ognize that persons of other cultural backgroundshave different goals, customs, thought patterns, andvalues than our own. Differences do not necessarilymean barriers; they can become bridges to under-standing and enrichment of human lives.
Global Manager’s DilemmaGlobal managers operating transnationally are com-monly faced with the following situation: in onecountry something is a lawful or accepted practice,and elsewhere it is illegal. Bribes, for example, maybe a common way of doing business to ensure ser-vice in the host-country culture but are quite illegalin the home-country culture.
Advances in mass media, transportation, andtravel are breaking down the traditional barriersamong groups of peoples and their differing cul-tures so that a homogenization process is underway.Global managers should be alert to serving this newcommunity in human needs and markets with strate-gies that are transnational.
Global planning not only requires an effective in-ternational management information system but in-put from a variety of locals at different levels ofsophistication. Even when there are apparent sim-ilarities of peoples in geographic regions, culturaldifferences may require alteration of strategic mar-ket planning.
Regional CulturesEven in the United States, there are cultural differ-ences between the south and the north and betweenthe east and the west regions. Food habits, language,accent, pace of life, work attitudes, and values aredifferent. Culture affects decision making too.
Global Communication InsightsAll behavior is communication because all behaviorcontains a message, whether intended or not. Com-munication is not static and passive, but rather it isa continuous and active process without beginningor end. A communicator is not simply a sender or areceiver of messages but can be both at the sametime. Culture poses communication problems be-cause there are so many variables unknown to thecommunicators. As the cultural variables and differ-ences increase, the number of communication misunder-standings increases.
High- and Low-Context CommunicationsAnthropologist Edward Hall makes a vital dis-tinction between high- and low-context culturesand how this matter of context impacts communi-cations. A high-context culture uses high-contextcommunications—that is, information is either inthe physical context or internalized in the person.Japan, Saudi Arabia, and Africa are examples ofcultures engaged in high-context communications,as are the Chinese and Spanish languages. How-ever, a low-context culture employs low-contextcommunications—most information is contained inexplicit codes, such as words. North Americancultures engage in low-context communications,whether in Canada or the United States, and Englishis a low-context language (Hall 1990).
In the communication process, a low-context cul-ture places the meaning in the exact verbal descrip-tion of an event. Individuals in such a culture rely onthe spoken word. The common statement that typ-ifies this idea is, “Say what you mean.” However,in the high-context culture, much of the meaning isnot from the words but is internalized in the per-son. Meaning comes from the environment and islooked for in the relationships between the ideas ex-pressed in the communication process. High-contextcultures tend to be more human-oriented than low-contextcultures. The extended-family concept fits into the high-context culture.

JWBT150-Vallabhaneni c10 July 28, 2009 18:36
LEARNING OBJECTIVE 10.7: UNDERSTAND THE VARIOUS ISSUES IN CONDUCTING INTERNATIONAL BUSINESS 283
During negotiations or when working withJapanese or Latin Americans, they are looking formeaning and understanding in what is not said—inthe nonverbal communication or body language, inthe silences and pauses, in relationships and empa-thy. North Americans place emphasis on sendingand receiving accurate messages directly, usually bybeing articulate with words. Specifically, Japanesecommunicate by not stating things directly, whileAmericans usually do just the opposite and “spell itall out.”
Cultural Awareness Learning ProgramThe aim of the Canadian International DevelopmentAgency’s training program is to instill seven skillsthat could be offered as the objectives of all culturalawareness learning. These skills can be applied tounderstand people, whether they are local, regional,or international:
1. Communicate respect.2. Be nonjudgmental.3. Personalize knowledge and perceptions.4. Display empathy.5. Practice role flexibility.6. Demonstrate reciprocal concern.7. Tolerate ambiguity.
These seven skills are associated with effectivemanaging and transferring of knowledge in a differ-ent culture. The degree to which managers and audi-tors possess these skills marks their potential effec-tiveness in working in a multicultural environment.
Cross-Cultural NegotiationsNegotiating across cultures is far more complexthan negotiating within a culture because foreignnegotiators have to deal with differing negotiatingstyles and cultural variables simultaneously. In otherwords, the negotiating styles that work at home gen-erally do not work in other cultures. As a result,cross-cultural business negotiators have one of themost complicated business roles to play in organi-zations. They are often thrust into a foreign societyconsisting of what appears to be “hostile” strangers.They are put in the position of negotiating profitablebusiness relationships with these people or suffer-ing the negative consequences of failure. And quiteoften they find themselves at a loss as to why theirbest efforts and intentions have failed them.
How to Avoid Failure inInternational NegotiationsNegotiators in a foreign country often fail becausethe local counterparts have taken more time to learnhow to overcome the obstacles normally associatedwith international/cross-cultural negotiations. Fail-ure may occur because of time and/or cost con-straints. For example, a negotiator may be given amuch shorter period of time to obtain better con-tract terms than was originally agreed to in a coun-try where negotiations typically take a long time.A negotiator may think, “What works in the homecountry is good enough for the rest of the world,” butthis is far from the truth. In fact, strategies that fail totake into account cultural factors are usually naive ormisconceived. Typically, the obstacles to overcomeinclude:
� Learning the local language� Learning the local culture� Arriving well-prepared for the negotiations
How Much Must One Know about theForeign Culture?Realistically, it is nearly impossible to learn every-thing about another culture, although one mightcome close if one lives in the culture for several years.The reason for this is that each culture has developed,over time, multifaceted structures that are muchtoo complex for any foreigner to understand totally.Therefore, foreign negotiators need not have totalawareness of the foreign culture; they do not need toknow as much about the foreign culture as the locals,whose frames of reference were shaped by that cul-ture. However, they will need to know enough aboutthe culture and about the locals’ negotiating stylesto avoid being uncomfortable during (and after) ne-gotiations. Besides knowing enough to not fail, theyalso need to know enough to win. For example, innegotiations between Japanese and American busi-nesspeople, Japanese negotiators have sometimesused their knowledge that Americans have a lowtolerance for silence to their advantage.
In other words, in order for negotiation to takeplace, the foreigner must at least recognize thoseideas and behaviors that the locals intentionally putforward as part of the negotiation process—and thelocals must do the same for the foreigners. Bothsides must be capable of interpreting these behav-iors sufficiently to distinguish common from con-flicting positions, to spot movement from positions,

JWBT150-Vallabhaneni c10 July 28, 2009 18:36
284 Learning Module 10: International Business
and to respond in ways that sustain communication.Ultimately, cross-cultural negotiators must deter-mine their counterparts’ personal motivations andagendas and adapt the negotiation style to them.
The purpose of the previous discussion is to de-velop a cross-cultural negotiating process. The pro-cess includes both strategy and tactics. Strategyrefers to a long-term plan, and tactics refers to theactual means used to implement the strategy.
Strategic and Tactical Planning for InternationalNegotiationsStrategic planning for international negotiations in-volves several stages: (1) preparation for face-to-face negotiations, (2) determining settlement range,(3) determining where the negotiations should takeplace, (4) deciding whether to use an individual ora group of individuals in the negotiations, and (5)learning about the country’s views on agreements/contracts.
Tactical planning for international negotiations in-volves determining how to obtain leverage, use de-lay tactics, and deal with emotions.
Ethical ConstraintsBusiness ethics and corporate social responsibilityplace constraints on negotiators. For example, a ne-gotiator’s ethical concerns for honesty and fair deal-ings, regardless of the power status of negotiatingparties, will affect the outcome. There is no globalstandard or view of what is ethical or unethical be-havior in business transactions—what is viewed asunethical behavior in one culture may be viewedas ethical in another culture and vice versa. For in-stance, if a negotiator on one side “pays off” an in-fluential decision maker on the other side to obtain afavorable decision, it would be an unethical businesspractice in some cultures (and illegal in the UnitedStates), but it would be quite acceptable in othercultures.
Global MindsetsCultural forces represent another important concernaffecting international human resources (HR) man-agement. In addition to organizational culture, na-tional cultures also exist. Culture is composed ofthe societal forces affecting the values, beliefs, andactions of a distinct group of people. Cultural dif-ferences certainly exist between nations, but sig-
nificant cultural differences exist within countriesalso. One only has to look at the conflicts causedby religion or ethnicity in Central Europe and otherparts of the world to see the importance of culturein international organizations. Convincing individ-uals from different ethnic or tribal backgrounds towork together may be difficult in some parts of theworld.
Geert Hofstede conducted research on more than100,000 IBM employees in 53 countries, and hedefined five dimensions useful in identifying andcomparing culture. These dimensions include powerdistance, individualism, masculinity/femininity,uncertainty avoidance, and long-term orientation(Hofstede 1984).
The dimension of power distance refers to the in-equality among the people of a nation. In countriessuch as Canada, the Netherlands, and the UnitedStates, there is less inequality than in such countriesas France, Mexico, and Brazil. As power distancescores increase, there is less status and authority dif-ference between superiors and subordinates.
One way in which differences on this dimensionaffect HR activities is that the reactions to manage-ment authority differ among cultures. A more au-tocratic approach to managing is more common inmany countries, while in the Netherlands and theUnited States there may be more use of employeeparticipation in decision making.
Another dimension of culture identified by Hofst-ede is individualism, which is the extent to whichpeople in a country prefer to act as individuals in-stead of members of groups. On this dimension, peo-ple in some Asian countries tend to be less individ-ualistic and more group-oriented, whereas those inthe United States are more individualistic. An im-plication of these differences is that more collectiveaction and less individual competition is likely inthose countries that deemphasize individualism.
The cultural dimension masculinity/femininityrefers to the degree to which “masculine” values pre-vail over “feminine” values. Masculine values iden-tified by Hofstede were assertiveness, performanceorientation, success, and competitiveness, whereasfeminine values included quality of life, close per-sonal relationships, and caring. Respondents fromJapan had the most masculinity, while those fromthe Netherlands had more feminine-oriented values.Differences on this dimension may be tied to the roleof women in the culture. Considering the differentroles of women and what is “acceptable” for womenin the United States, Saudi Arabia, Japan, and Mexico
JWBT150-Vallabhaneni c10 July 28, 2009 18:36
LEARNING OBJECTIVE 10.7: UNDERSTAND THE VARIOUS ISSUES IN CONDUCTING INTERNATIONAL BUSINESS 285
suggests how this dimension might affect the assign-ment of women expatriates to managerial jobs in thevarious countries.
The dimension of uncertainty avoidance refers tothe preference of people in a country for structuredrather than unstructured situations. A structured sit-uation is one in which rules can be established, andthere are clear guides on how people are expected toact. Nations focusing on avoiding uncertainty, suchas Japan and France, tend to be more resistant tochange. In contrast, people in places such as theUnited States and Great Britain tend to have more“business energy” and to be more flexible.
A logical use of differences in this factor is to an-ticipate how people in different countries will reactto changes instituted in organizations. In more flex-ible cultures, what is less certain may be more in-triguing and challenging, which may lead to greaterentrepreneurship and risk taking than in the more“rigid” countries.
The dimension of long-term orientation refers tovalues people hold that emphasize the future, asopposed to short-term values, which focus on thepresent and the past. Long-term values include thrift
and persistence, whereas short-term values includerespecting tradition and fulfilling social obligations.Hofstede developed this dimension a decade afterhis original studies on dimension. A long-term ori-entation was more present in Japan and India, whilepeople in the United States and France tended tohave more short-term orientations.
Differences in many other facets of culture couldbe discussed. But it is enough to recognize that inter-national HR managers and professionals must rec-ognize that cultural dimensions differ from coun-try to country and even within countries. Therefore,the HR activities appropriate in one culture or coun-try may have to be altered to fit appropriately intoanother culture or country.
Self-Assessment Exercise
Online exercises are provided for the learningobjectives in this module. Please visit www.mbaiq.com to complete the online exercises andto calculate your MBA IQ Score.

JWBT150-Vallabhaneni c10 July 28, 2009 18:36
286

JWBT150-Vallabhaneni c11 July 28, 2009 18:5
LEARNING MODULE 11
Project Management
Learning Objective 11.1: Define ProjectManagement and Identify SuccessCriteria for Projects 287Project Management Defined 287Project Success Criteria 288
Learning Objective 11.2: Understandthe Various Types of Risks in ProjectManagement 289Types of Project Risks 289Risk Management Plan 291
Learning Objective 11.3: Understandthe Various Types of ProjectStructures and Organizations 291Functional-Type Organization 292Project-Type Organization 293Matrix-Type Organization 293Advantages and Disadvantages
of Project Structures 294Learning Objective 11.4: Understand
the Project Management Process,Including Its Lifecycles 294The Project Management Process 294
Learning Objective 11.5: Understandthe Various Methods in Project
Planning, Estimating, Controlling,and Reporting 296Project Planning Methods 297Project Estimating Methods 298Project Controlling Methods 300Project Reporting Methods 301Project Progress 302
Learning Objective 11.6: Understandthe Various Methods in ProjectScheduling 303Program Evaluation and Review Technique 303Critical Path Method 303CPM versus PERT 304Work-Breakdown Structure 306Gantt Chart 306
Learning Objective 11.7: Understandthe Project Management Metrics,Problems, and GovernanceMechanisms, Including ProjectAudits 306Project Management Metrics 307Problems in Project Management 308Project Governance Mechanisms 309Project Management Audit 309
❑ Learning Objective 11.1:DEFINE PROJECT MANAGEMENTAND IDENTIFY SUCCESSCRITERIA FOR PROJECTSMany projects fail for various reasons—some validand some invalid. It is important for a project man-ager to understand what makes a project a success.
The ultimate benefit of implementing project man-agement techniques is having a satisfied customer.Usually, a contractor is hired by a customer to per-form a project. Completing the full project scope ina quality manner, on time, and within budget pro-vides a great feeling of satisfaction. For a contractor,
it could lead to additional business from the samecustomer or from new customers referred by previ-ously satisfied customers.
Project Management DefinedA project is the result of a plan of action to achievea specific goal within defined resource parame-ters (e.g., time, cost, materials, quality, and peo-ple). Projects must be well managed for them tobe successful in utilizing resources. Many orga-nizations apply a variety of project managementtechniques to optimize project success and enhancethe likelihood of meeting project-specific as well as
287

JWBT150-Vallabhaneni c11 July 28, 2009 18:5
288 Learning Module 11: Project Management
organization-wide goals. These techniques includemonitoring project performance, establishing incen-tives to meet project goals, and developing a projectmanagement team with the right people and theright skills. This can help avert cost overruns, sched-ule delays, and performance problems common tomany organizations.
It is important to develop performance measuresand link project outcomes to business unit andstrategic goals and objectives. The key is monitor-ing project performance and establishing incentivesfor accountability and using cross-functional teamsto involve those with the technical and operationalexpertise necessary to plan and manage the project.
Project Success CriteriaA baseline establishes a standard to decide whethera project is a success or failure. The criteria shouldbe derived from standards.
BaselineThe key in determining the success or failure of aproject, program, or function is establishing its cur-rent state before any changes are considered or im-plemented. This is the baseline. The baseline is usedin a variety of areas. Gap analysis, for example, usesthe baseline to show the difference between the cur-rent state and the target goal or objective.
Performance measures, regardless of type, musthave a baseline measurement to show the changesor improvements a project undergoes as it achievesits goal. Establishing a baseline measure is essentialin establishing the validity of a performance mea-sure. A baseline measure is usually the first measuretaken of a system or project. Subsequent measure-ments may be defined as the new baseline if substan-tial changes to the system make the earlier baselineobsolete or reduce the effectiveness of the particularperformance measure.
Each project manager and functional area man-ager must choose those performance measures thatclearly indicate achievement of goals and mission fortheir area of responsibility. Some examples of per-formance measures include customer satisfaction,speed of response, quality, percentage of availability,mean-time-between-failure (MTBF), and percentageof initial budget expended.
An initial baseline document is prepared once aspart of the project planning process. This identifiesmilestones, costs, and schedules that are planned for
each project for the next fiscal year. While it is under-stood that milestones sometimes do run over fiscalyears, for accurate reporting purposes, a milestoneshould be broken up to explain what is being ac-complished by fiscal year. After developing the ini-tial baseline, the baseline data should be updatedperiodically, say monthly or quarterly.
The initial baseline data include project descrip-tion with milestones, planned start date, plannedend date, planned duration hours, and planned cost.The updated baseline data include actual start date,actual end date, actual duration in hours, percentcomplete, and actual cost.
Project Critical Success FactorsThe outcome of any project can be either a success ora failure. There are certain factors leading to success;and not following these success factors can lead tofailure. Below are critical success factors useful toproject managers, functional managers, and seniormanagers alike:
� Planning and communication are critical to suc-cessful project management. They prevent prob-lems from occurring or minimize their impact onthe achievement of the project objective when theydo occur.
� Taking the time to develop a well-thought-out planbefore the start of the project is critical to the suc-cessful accomplishment of any project.
� A project must have a well-defined objective—anexpected result or product, defined in terms ofscope, schedule, and cost, and agreed on by thecustomer.
� Involve the customer as a partner in the successfuloutcome of the project through active participationduring the project.
� Effective and frequent personal communication iscrucial to successful project management.
� A high degree of face-to-face communication is im-portant early in the project to foster team building,develop good working relationships, and establishmutual expectations.
� Body language and customs reflective of culturaldiversity must be considered in communications.
� Be careful not to use remarks, words, or phrasesthat can be construed to be sexist, racist, prejudi-cial, or offensive.
� The heart of communication is understanding—not only to be understood, but also to under-stand. Half of making communication effective is

JWBT150-Vallabhaneni c11 July 28, 2009 18:5
LEARNING OBJECTIVE 11.2: UNDERSTAND THE VARIOUS TYPES OF RISKS IN PROJECT MANAGEMENT 289
listening. Failure to listen can cause a breakdownin communication.
� Communication should be straightforward, unam-biguous, free of technical jargon, and not offensive.
� Achieving customer satisfaction requires ongoingcommunication with the customer to keep the cus-tomer informed and to determine whether expec-tations have changed. Regularly ask the customerabout the level of satisfaction with the progress ofthe project.
� Keep the customer and project team informedof the project status and potential problems in atimely manner.
� Project status meetings should be held on a regu-lar basis. Discuss meeting guidelines at a projectteam meeting at the beginning of the project, soeveryone understands what behavior is expectedduring project meetings.
� Do not confuse busyness and activity with accom-plishment when communicating project progress.
� The key to effective project control is measuring ac-tual progress and comparing it to planned progresson a timely and regular basis and taking correctiveaction immediately, if necessary.
� Reports must be written to address what is of in-terest to the readers, not what is of interest to theperson writing the report.
� Make reports concise. Pay as much attention toformat, organization, appearance, and readabilityas to the content.
� Early in the project, agreement should be reachedregarding how changes will be authorized anddocumented.
� When documents are updated, they should imme-diately be distributed to all team members whosework will be affected.
� After the conclusion of a project, performanceshould be evaluated to learn what could be im-proved if a similar project were to be undertakenin the future. Feedback should be obtained fromthe customer and the project team.
❑ Learning Objective 11.2:UNDERSTAND THE VARIOUSTYPES OF RISKS IN PROJECTMANAGEMENTThere are several risks facing a project due to cost,time, quality, and performance uncertainties. Riskmitigation strategies can be developed to reduce orminimize project risks.
Types of Project RisksHaving a strategy to deal with the risk that is inher-ent in large projects, say IT projects, is critical. One ofthe greatest risk factors to the success of IT projectsis the amount of development that is planned. Full-scale development is where the potential is greaterfor significant cost and schedule overruns and low-ered performance goals. In a project environment,cost, benefit, and schedule estimates are typicallyuncertain.
The types of risks in an IT project, along with riskmitigation strategies, include the following.
Technology RiskTechnology risk is considered as the risk that a prod-uct or service may not meet its intended objectivesto be able to interface with current processes or soft-ware correctly. This form of risk can include bothtechnical feasibility and technical obsolescence. Riskmitigation strategies can include: maximum use ofcommercial software, practicing open competition,and performing pilot or prototype testing.
A risk exists when these technology risk items arenot in place:
� Plan for validating that user needs are met� Existence of load test in accordance with industry
standards� Evaluation of technology options� Availability of track record for system� Maintainability and ability to upgrade key tech-
nologies� Vendor’s ability to implement technology
Implementation and Operational RiskImplementation and operational risk deals withtime constraints. This form of risk includes both theamount of time necessary to complete the task andthe compatibility between computing platforms.Another risk is whether the project becomes op-erational in nature. Risk mitigation strategies caninclude phased implementation, cross-organizationinvolvement, and proven integrated managementteam.
A risk exists when these operational risk items arenot in place:
� Organization’s familiarity with proposed hard-ware and software environment
� Development of system operating procedures
JWBT150-Vallabhaneni c11 July 28, 2009 18:5
290 Learning Module 11: Project Management
� Experience and ability of existing staff to supporta new system
� Impact to organization of a system failure� Number of business units impacted
Project Management RiskProject management risk speaks directly to man-agement risk. This human element is difficult to ac-curately incorporate into a risk assessment but isa critical factor nonetheless. Risk mitigation strate-gies can include cost estimates prepared by a neutralthird party, use of earned value management (EVM)techniques, use of open competition, use of financialincentives for contractor performance, distributingrisk between the contractor and the organization,and implementing a sound acquisition plan usingmodular contracting.
A risk exists when these project management riskitems are not in place:
� Experience levels of project management teams� Number of training days for each team member� Existence of work plan for the entire project life-
cycle� Degree of development of measurable milestones� Length of time allowed for project implementation� Existence of system for tracking unresolved
issues� Definition of user and system development skill
requirements� Number of project milestone reviews
Economic and Financial RisksEconomic risk encompasses such events as miscal-culating a discount factor or failing to appropriatelyquantify other risks such as technology risk. Finan-cial risk becomes an issue if budgeted dollars are notavailable when they are scheduled to be.
A risk exists when these financial risk items are notin place:
� Size of expenditure required� Existence of cost–benefit analysis� Existence of defined payback and timeframe of
payback� Reputation and financial status of vendor(s)
Strategic RiskStrategic risk determines how closely a project islinked with its mission and risks. It is important to
be comprehensive and include all risk sources re-gardless of frequency, probability of occurrence, ormagnitude of gain or loss. Risk mitigation strategiescan include cross-department or cross-organizationefforts, project goals mapped directly to organiza-tional strategic plans, and consistent execution ofplans.
A risk exists when these strategic risk items are notin place:
� Alignment with the organization’s overall busi-ness strategy
� Clarity of expression of anticipated project out-comes
� Presence of metrics to verify the successful com-pletion of each project phase
� Number of or percent of stakeholder participationin projects
Change Management RiskChange management risk attempts to estimate howeasily pilots and prototypes could be incorporatedinto existing systems. This type of risk also ad-dresses how severely a business would potentiallybe impacted by a system failure. Risk mitigationstrategies can include employee involvement in theproject planning process, training and implementa-tion schedules, incentives to use the new system,management leadership, phased implementation,responsive support functions, and outreach commu-nication plan.
A risk exists when these change management riskitems are not in place:
� Development of an acceptance plan for newsystem
� Magnitude and nature of change introduced bysystem
� Institutionalizing the change risk
Human Capital RiskHuman capital risk results from users’ lack of ex-perience with a given technology (i.e., first datawarehouse project and first system implementationproject).
Dependency RiskDependency risk deals with risks between a newproject and other projects.
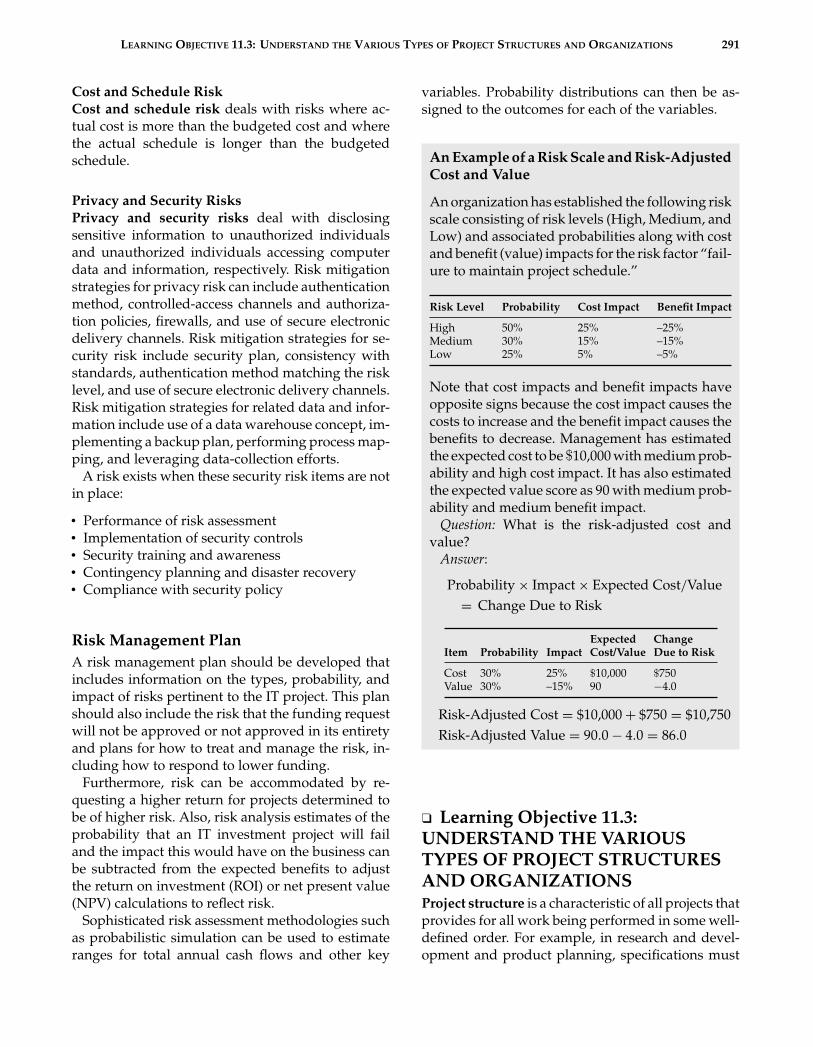
JWBT150-Vallabhaneni c11 July 28, 2009 18:5
LEARNING OBJECTIVE 11.3: UNDERSTAND THE VARIOUS TYPES OF PROJECT STRUCTURES AND ORGANIZATIONS 291
Cost and Schedule RiskCost and schedule risk deals with risks where ac-tual cost is more than the budgeted cost and wherethe actual schedule is longer than the budgetedschedule.
Privacy and Security RisksPrivacy and security risks deal with disclosingsensitive information to unauthorized individualsand unauthorized individuals accessing computerdata and information, respectively. Risk mitigationstrategies for privacy risk can include authenticationmethod, controlled-access channels and authoriza-tion policies, firewalls, and use of secure electronicdelivery channels. Risk mitigation strategies for se-curity risk include security plan, consistency withstandards, authentication method matching the risklevel, and use of secure electronic delivery channels.Risk mitigation strategies for related data and infor-mation include use of a data warehouse concept, im-plementing a backup plan, performing process map-ping, and leveraging data-collection efforts.
A risk exists when these security risk items are notin place:
� Performance of risk assessment� Implementation of security controls� Security training and awareness� Contingency planning and disaster recovery� Compliance with security policy
Risk Management PlanA risk management plan should be developed thatincludes information on the types, probability, andimpact of risks pertinent to the IT project. This planshould also include the risk that the funding requestwill not be approved or not approved in its entiretyand plans for how to treat and manage the risk, in-cluding how to respond to lower funding.
Furthermore, risk can be accommodated by re-questing a higher return for projects determined tobe of higher risk. Also, risk analysis estimates of theprobability that an IT investment project will failand the impact this would have on the business canbe subtracted from the expected benefits to adjustthe return on investment (ROI) or net present value(NPV) calculations to reflect risk.
Sophisticated risk assessment methodologies suchas probabilistic simulation can be used to estimateranges for total annual cash flows and other key
variables. Probability distributions can then be as-signed to the outcomes for each of the variables.
An Example of a Risk Scale and Risk-AdjustedCost and Value
An organization has established the following riskscale consisting of risk levels (High, Medium, andLow) and associated probabilities along with costand benefit (value) impacts for the risk factor “fail-ure to maintain project schedule.”
Risk Level Probability Cost Impact Benefit Impact
High 50% 25% –25%Medium 30% 15% –15%Low 25% 5% –5%
Note that cost impacts and benefit impacts haveopposite signs because the cost impact causes thecosts to increase and the benefit impact causes thebenefits to decrease. Management has estimatedthe expected cost to be $10,000 with medium prob-ability and high cost impact. It has also estimatedthe expected value score as 90 with medium prob-ability and medium benefit impact.
Question: What is the risk-adjusted cost andvalue?
Answer:
Probability × Impact × Expected Cost/Value= Change Due to Risk
Item Probability ImpactExpectedCost/Value
ChangeDue to Risk
Cost 30% 25% $10,000 $750Value 30% –15% 90 −4.0
Risk-Adjusted Cost = $10,000 + $750 = $10,750Risk-Adjusted Value = 90.0 − 4.0 = 86.0
❑ Learning Objective 11.3:UNDERSTAND THE VARIOUSTYPES OF PROJECT STRUCTURESAND ORGANIZATIONSProject structure is a characteristic of all projects thatprovides for all work being performed in some well-defined order. For example, in research and devel-opment and product planning, specifications must

JWBT150-Vallabhaneni c11 July 28, 2009 18:5
292 Learning Module 11: Project Management
be determined before drawings can be made. In ad-vertising, artwork must be made before layouts canbe done. Project organization is where the reportingrelationships and the work location rest predomi-nantly with the project manager. Although there arevarious ways in which people can be organized towork on projects, the most common types of organi-zation structures are functional, project, and matrix.Each type is discussed next.
Functional-Type OrganizationFunctional organization structures are typically usedin businesses that primarily sell and produce stan-dard products and seldom conduct external projects.For example, a company that manufactures and sellsvideo recorders and players may have a functionalorganization structure. In the functional organiza-tion structure, groups consist of individuals who per-form the same function, such as engineering or man-ufacturing, or have the same expertise or skills, suchas electronics engineering or testing. Each functionalgroup, or component, concentrates on performing itsown activities in support of the company’s businessmission. The focus is on the technical excellence andcost competitiveness of the company’s products, aswell as the importance of the contribution of eachfunctional component’s expertise to the company’sproducts.
A company with a functional structure may peri-odically undertake projects, but these are typicallyin-house projects rather than projects for externalcustomers. Projects in a functional-type organizationmight involve developing new products, designing acompany information system, redesigning the officefloor plan, or updating company policy and proce-dures manual. For such projects, a multifunctionalproject team or task force is formed, with membersselected by company management from the appro-priate subfunctions in marketing, engineering, man-ufacturing, and procurement. Team members maybe assigned to the project either full-time or part-time, for a part of the project or for the entire projectduration. In most cases, however, individuals con-tinue to perform their regular functional jobs whilethey serve part-time on the project task force. One ofthe team members or possibly one of the functionalvice presidents is designated as the project leader ormanager.
In a functional-type organization, the project man-ager does not have complete authority over theproject team, since administratively the members
still work for their respective functional managers.Because they view their contribution to the projectin terms of their technical expertise, their allegianceremains to their functional managers. If there is con-flict among the team members, it usually works itsway through the organization hierarchy to be re-solved, slowing down the project effort. On the otherhand, if the company president does give the projectmanager the authority to make decisions when thereis disagreement among team members, decisionsmight reflect the interests of the project manager’sown functional component rather than the best in-terests of the overall project. For example, take thesituation in which there is disagreement about thedesign of a new product, and the project manager,who is from the engineering function, makes a de-cision that reduces the engineering design cost ofthe product but increases the manufacturing cost.In reporting project progress to the company presi-dent, the project manager then makes some biasedcomments regarding the viewpoints of team mem-bers from other functional components, such as, “Ifmanufacturing were more willing to consider otherproduction methods, they could make the productfor a lower cost. Engineering has already reducedits design costs.” Such a situation could require thecompany president to get drawn into handling theconflict.
The functional organization structure can be ap-propriate for internal company projects. However,since projects are not a part of the normal routine,it is necessary to establish a clear understanding ofthe role and responsibilities of each person assignedto the project task force. If the project manager doesnot have full authority for project decisions, thenhe must rely on leadership and persuasion skills tobuild consensus, handle conflict, and unify the taskforce members to accomplish the project objective.The project manager also needs to take time to regu-larly update other functional managers in the com-pany on the project status and thank them for thesupport of their people assigned to the task force.
There may be situations in which a task force isassigned to work on a project that is strictly within aparticular functional component. For example, themanager of technical documentation may form atask force of editors and documentation specialiststo develop common standards for all technical docu-ments. In such a case, the particular functional man-ager has full authority over the project, and conflictcan be handled more quickly than when it ariseswithin a multifunctional project team.

JWBT150-Vallabhaneni c11 July 28, 2009 18:5
LEARNING OBJECTIVE 11.3: UNDERSTAND THE VARIOUS TYPES OF PROJECT STRUCTURES AND ORGANIZATIONS 293
Companies with functional organization struc-tures seldom perform projects involving externalcustomers, as such organizations do not have projectmanagers designated to manage customer-fundedprojects. Rather, functional-type organizations con-centrate on producing their products and sellingthem to various customers.
Project-Type OrganizationIn the project-type organization, each project is oper-ated like a mini-company. All the resources neededto accomplish each project are assigned full-time towork on that project. A full-time project managerhas complete project and administrative authorityover the project team. (In the functional-type orga-nization, the project manager may have project au-thority, but the functional manager retains adminis-trative and technical authority over his people whoare assigned to the team.) The project-type organiza-tion is well positioned to be highly responsive to theproject objective and customer needs because eachproject team is strictly dedicated to only one project.
A project-type organization can be cost-inefficientboth for individual projects and for the company.Each project must pay the salaries of its dedicatedproject team, even during parts of the project whenthey are not busy. For example, if a delay in onepart of the project leaves some resources with nowork to do for several weeks, project funds mustcover these costs. If the amount of unapplied timebecomes excessive, the project can become unprof-itable and drain the profits from other projects. Froma company-wide viewpoint, a project-type organiza-tion can be cost-inefficient because of the duplicationof resources or tasks on several concurrent projects.
Because resources are not shared, they may not bediverted to a similar concurrent project even whenthey are not busy on or being used for the projectto which they are dedicated. Also, there is little op-portunity for members of different project teams toshare knowledge or technical expertise, since eachproject team tends to be isolated and focused strictlyon its own project. However, there may be somecompany-wide support functions that serve all theprojects such as the human resources function servesall projects.
In a project-type organization, detailed and accu-rate planning and an effective control system arerequired to assure optimum utilization of the projectresources in successfully completing the projectwithin budget.
Project organization structures are found primarilyin companies that are involved in very large projects.Such projects can be of high (multimillion) dollarvalue and long (several years) duration. Project orga-nization structures are prevalent in construction andaerospace industries. They are also used in the non-business environment, such as a volunteer-managedfundraising campaign, town centennial celebration,class reunion, or variety show.
Matrix-Type OrganizationThe matrix-type organization is a hybrid (a mix ofboth the functional and project organization struc-tures). It provides the project and customer focus ofthe project structure, but it retains the functional ex-pertise of the functional structure. The project andfunctional components of the matrix structure eachhave their responsibilities in contributing jointly tothe success of each project and the company. Theproject manager is responsible for project results,while functional managers are responsible for pro-viding resources needed to achieve the results.
The matrix-type organization provides for effec-tive utilization of company resources. The functionalcomponents (systems engineering, testing, and soforth), home of the technical staff, provide a pool ofexpertise to support ongoing projects.
Project managers come under the project compo-nent of the organization. When the company receivesan order for a new system, the vice president ofprojects assigns a project manager to the project.A small project may be assigned to a project man-ager who is already managing several other smallprojects. A large project may be assigned a full-timeproject manager.
The matrix-type organization provides opportu-nities for people in the functional components topursue career development through assignment tovarious types of projects. As they broaden their expe-rience, individuals become more valuable for futureassignments and enhance their eligibility for higher-level positions within the company. As each individ-ual in a particular functional component develops abroad base of experience, the functional managergains greater flexibility to assign individuals to dif-ferent kinds of projects.
All of the individuals assigned to a given projectcomprise the project team, under the leadership ofa project manager who integrates and unifies theirefforts. Individuals assigned to several small projectswill be members of several different project teams.

JWBT150-Vallabhaneni c11 July 28, 2009 18:5
294 Learning Module 11: Project Management
Each member of a project team has a dual reportingrelationship; in a sense, each member has two man-agers: a (temporary) project manager and a (perma-nent) functional manager. For a person assigned toseveral concurrent projects, changing work prioritiescan cause conflict and anxiety.
It is critical to specify to whom the team mem-ber reports and for what responsibilities or tasks.Therefore, it is important that project manage-ment responsibilities and functional managementresponsibilities be delineated in a matrix-typeorganization.
In the matrix organization structure, the projectmanager is the intermediary between the companyand the customer. The project manager defines whathas to be done (work scope), by when (schedule), andfor how much money (budget) to meet the projectobjective and satisfy the customer. He is responsi-ble for leading the development of the project plan,establishing the project schedule and budget, andallocating specific tasks and budgets to the variousfunctional components of the company organiza-tion. Throughout the project, the project manageris responsible both for controlling the performanceof the work within the project schedule and budgetand for reporting project performance to the cus-tomer and to the company’s upper management. Aproject administrator may be assigned to each projectto support the project manager and project team inplanning, controlling, and reporting.
Each functional manager in a matrix organizationstructure is responsible for how the assigned worktasks will be accomplished and who (which specificpeople) will do each task. The functional managerof each organization component provides technicalguidance and leadership to the individuals assignedto projects. He is also responsible for ensuring thatall tasks assigned to that functional component arecompleted in accordance with the project’s technicalrequirements, within the assigned budget, and onschedule.
The matrix-type organization provides a checks-and-balances environment. The fact that potentialproblems can be identified through both its projectand its functional structure reduces the likelihoodthat problems will be suppressed beyond the pointwhere they can be corrected without jeopardizingthe success of the project. The matrix organiza-tion structure allows for fast response upon prob-lem identification because it has both a horizontal(project) and a vertical (functional) path for the flowof information.
Advantages and Disadvantagesof Project StructuresWe discussed the characteristics of the functional-,project-, and matrix-type organizations. The follow-ing table lists some significant advantages and disad-vantages particular to each of the three organizationstructures:
ProjectStructure Advantages Disadvantages
Functionalstructure
No duplication ofactivities
InsularitySlow response time
Functional excellence Lack of customer focus
Projectstructure
Control over resources Cost-inefficiencyResponsiveness to
customersLow level of
knowledge transferamong projects
Matrixstructure
Efficient utilization ofresources
Dual reportingrelationships
Functional expertiseavailable to allprojects
Need for balance ofpower
Increased learning andknowledge transfer
Improvedcommunication
Customer focus
❑ Learning Objective 11.4:UNDERSTAND THE PROJECTMANAGEMENT PROCESS,INCLUDING ITS LIFECYCLESA structured and disciplined approach is needed tomanage projects due to their complexity, size, andscope. Dividing a project into phases (lifecycles) canhelp in managing projects successfully.
The Project Management ProcessSuccinctly, the project management process meansplanning the work and then working the plan. A coach-ing staff may spend hours preparing unique plansfor a game; the team then executes the plans in anattempt to achieve victory. Similarly, project manage-ment involves a process of first establishing a plan andthen implementing that plan to accomplish the projectobjective.
A project lifecycle consists of four phases: identi-fying needs (phase 1), developing a proposed solu-tion (phase 2), performing the project (phase 3), andterminating the project (phase 4).

JWBT150-Vallabhaneni c11 July 28, 2009 18:5
LEARNING OBJECTIVE 11.4: UNDERSTAND THE PROJECT MANAGEMENT PROCESS, INCLUDING ITS LIFECYCLES 295
Phase 1: Identifying the NeedsThe first phase involves the identification of a need,problem, or opportunity that is the basis for a cus-tomer requesting proposals (the request for pro-posal, RFP) from internal sources (project team)and/or external parties (e.g., contractors) to addressthe identified need or solve the problem.
The front-end effort in managing a project must befocused on establishing a baseline plan that providesa roadmap for how the project scope will be accom-plished on time and within budget. This planningeffort includes the following steps:
1. Clearly define the project objective. The definitionmust be agreed upon by the customer and theindividual or organization that will perform theproject.
2. Divide and subdivide the project scope into major“pieces” or work packages. Although major projectsmay seem overwhelming when viewed as awhole, one way to conquer even the most mon-umental endeavor is to break it down. A work-breakdown structure (WBS) is a hierarchical treeof work elements or items accomplished or pro-duced by the project team during the project. Thework-breakdown structure usually identifies theorganization or individual responsible for eachwork package.
3. Define the specific activities that need to be performedfor each work package in order to accomplish the projectobjective.
4. Graphically portray the activities in the form of a net-work diagram. This diagram shows the necessarysequence and interdependencies of activities toachieve the project objective.
5. Make a time estimate for how long it will take to com-plete each activity. It is also necessary to determinewhich types of resources and how many of eachresource are needed for each activity to be com-pleted within the estimated duration.
6. Make a cost estimate for each activity. The cost isbased on the types and quantities of resourcesrequired for each activity.
7. Calculate a project schedule and budget to determinewhether the project can be completed within the re-quired time, with the allotted funds, and with the avail-able resources. If not, adjustments must be made tothe project scope, activity time estimates, or re-source assignments until an achievable, realisticbaseline plan (a roadmap for accomplishing theproject scope on time and within budget) can beestablished.
Planning determines what needs to be done, whowill do it, how long it will take, and how much it willcost. The result of this effort is a baseline plan. Takingthe time to develop a well-thought-out plan is criti-cal to the successful accomplishment of any project.Many projects have overrun their budgets, missedtheir completion dates, or only partially met theirrequirements because there was no viable baselineplan before the project was started.
Attempting to perform a project without first es-tablishing a baseline plan is foolhardy. The baselineplan for a project can be displayed in graphical ortabular format for each time period (week, month)from the start of the project to its completion. Infor-mation should include the:
� Start and completion dates for each activity� Amounts of the various resources that will be
needed during each time period� Budget for each time period, as well as the cumu-
lative budget from the start of the project througheach time period
Once a baseline plan has been established, it mustbe implemented. This involves performing the workaccording to plan and controlling the work so thatthe project scope is achieved within budget andschedule to the customer’s satisfaction.
Phase 2: Developing a Proposed SolutionThe second phase requires the submission of a pro-posal to the customer with a solution to solve theproblem. Potential contractors spend a considerableamount of time and effort in developing RFPs to winthe contract from the customer, thus facing a bid/no-bid decision. A bid error can happen as follows:
� Yes-bid error can happen when the contractor isnot qualified to do the project work and yet decidesto submit the RFP.
� No-bid error can happen when the contractor isqualified to do the project work and yet decidesnot to submit the RFP.
Phase 3: Performing the ProjectThis third phase calls for the implementation of theproposed solution and ends when the customer issatisfied that the requirements have been met andthe project objective has been accomplished.
Once the baseline plan has been developed, projectwork can proceed. The project team, led by theproject manager, will implement the plan and

JWBT150-Vallabhaneni c11 July 28, 2009 18:5
296 Learning Module 11: Project Management
perform the activities, or work elements, in accor-dance with the plan. The pace of project activity willincrease as more and various resources become in-volved in performing the project tasks.
While the project work is being performed, it isnecessary to monitor progress to ensure that every-thing is going according to plan. This involves mea-suring actual progress and comparing it to plannedprogress. To measure actual progress, it is importantto keep track of which activities have actually beenstarted and/or completed, when they were startedand/or completed, and how much money has beenspent or committed. If, at any time during the project,comparison of actual progress to planned progressreveals that the project is behind schedule, overrun-ning the budget, or not meeting technical specifi-cations, corrective action must be taken to get theproject back on track.
Before a decision is made to implement correctiveaction, it may be necessary to evaluate several alter-native actions to make sure the corrective action willbring the project back within the scope, time, andbudget constraints of the objective. Be aware, for in-stance, that adding resources to make up time andget back on schedule may result in overrunning theplanned budget. If a project gets too far out of con-trol, it may be difficult to achieve the project objec-tive without sacrificing the scope, budget, schedule,or quality.
The key to effective project control is measuring ac-tual progress and comparing it to planned progresson a timely and regular basis and taking correctiveaction immediately, if necessary. Hoping that a prob-lem will go away without corrective intervention isnaive. The earlier a problem is identified and cor-rected, the better. Based on actual progress, it is pos-sible to forecast a schedule and budget for comple-tion of the project. If these parameters are beyondthe limits of the project objective, corrective actionsneed to be implemented at once.
Phase 4: Terminating the ProjectThe fourth and final phase of the project lifecycle is ter-minating (closing) the project. It starts after projectwork has been completed and includes various ac-tions to close out the project properly.
The purpose of properly terminating a project isto learn from the experience gained on the projectin order to improve performance on future projects.Therefore, the activities associated with terminatingthe project should be identified and included in
the project’s baseline plan. They should not bedone merely as spontaneous afterthoughts. Theseactivities might include organizing and filing projectdocuments, receiving and making final payments,and conducting post-project evaluation meetingswithin both the contractor’s and the customer’sorganizations.
The termination phase starts when performance ofthe project is completed and the customer accepts theresult. In some situations, this might be a somewhatformal event in which an automated system satis-fies a set of criteria or passes tests that were statedin the contract. Another activity that must be per-formed during the termination phase is assuring thatall payments have been collected from the customer.
During the project termination phase, the projectmanager should prepare a written performanceevaluation of each member of the project team andmention how each has expanded his knowledgeas a result of the project assignment, as well aswhat areas he needs to develop further. If a projectteam member does not report directly to the projectmanager within the company’s organizationalstructure, the project manager should provide acopy of the performance evaluation to the person’simmediate supervisor.
Finally, no successful project should end withoutsome type of celebration. This can range from an in-formal pizza party after work to a more formal event,with speakers from the customer’s organization andawards or certificates of recognition for project par-ticipants.
Another important activity during the terminationphase is holding post-project evaluation meetings.These meetings should be conducted internally,within the organization that performed the project,as well as with the customer. The purpose of suchmeetings is to evaluate performance of the project,to determine whether the anticipated benefits fromthe project were actually achieved, and to identifywhat can be done to improve performance on futureprojects.
❑ Learning Objective 11.5:UNDERSTAND THE VARIOUSMETHODS IN PROJECTPLANNING, ESTIMATING,CONTROLLING, AND REPORTINGTypically, a project plan is used to manage andcontrol project implementation and includes

JWBT150-Vallabhaneni c11 July 28, 2009 18:5
LEARNING OBJECTIVE 11.5: UNDERSTAND THE VARIOUS METHODS IN PROJECT PLANNING 297
performance measurement baselines for scheduleand cost, major milestones, major deliverables,major assumptions, target dates, and risks and con-tingencies associated with the project. By trackingcost, schedule, and technical performance, a projectteam is aware of potential problem areas and isable to determine any impact of the deviation anddecide whether corrective action is needed. Regularreview of the status of cost, schedule, and technicalperformance goals by individuals outside theproject team allows for an independent assessmentof the project and verification that the project ismeeting stated goals.
Plans should be separated from scheduling and es-timating should be a part of planning. Project plan-ning is the act of stating what activities must occurin a project and in what order these activities musttake place. Project scheduling follows planning andis defined as the act of producing project timetablesin consideration of the plan and costs. Project con-trolling is ensuring that plans are accomplished. Thecorrect sequence is:
Planning → Estimating → Scheduling →Controlling → Reporting
After management has approved the project, it isimportant to estimate the size of the project in termsof time, scope, quality, and resources, which becomesa basis for project planning and controlling work.The time element is related to project complexity,staff training needs, and staff communication com-plexity. The scope element is related to project size,its difficult level, and the number of affected internaldepartments and external parties to coordinate. Thequality element is related to how well the projectrequirements are defined, understood, and costed.The resources element is related to human resources(e.g., number of people, their experience, and theirperformance levels) and computing resources (e.g.,computers, their memory, and their storage).
Project Planning MethodsThe project plan should specify key points within theproject, products to be available at these points, andthreats to the delivery of these products at the pre-dicted time. Detailed knowledge of project planningcomponents is essential.
The project plan is a document that describes howthe project manager plans to conduct project work. Itmust define tasks and the resources required to com-
plete the project. Regardless of the size, every projectneeds to have a plan that clearly defines what is tobe accomplished, specifies by whom and when itwill be performed, and indicates how much it willcost. The plan defines responsibilities and account-abilities for the people who are involved. The projectplan should be viewed as a living document, mean-ing that it will be updated as needed. Specifically,the planning document needs to have the followingitems in place:
MilestonesMilestones are a list of major checkpoints forprogress review and measurement of work. Mile-stone charts show achievements by plotting activi-ties against time.
DeliverablesMost project activities can be defined with start andstop points and with clearly measurable deliver-ables. Each project must have objectives and goalsto be achieved with resources assigned to it. Man-agement needs to know what parts of the projectare most likely to cause serious delays. This knowl-edge will lead to management actions that achieveproject objectives and deadlines. Deliverables definethe specific outcomes (i.e., tangible work products)to be achieved and periodic status-reporting informsmanagement whether agreed-on deliverables willactually be delivered on the expected date.
BaselineOnce approved by management, the project plan be-comes a baseline document, which is a starting pointfor future changes. Any subsequent changes requiremanagement approval, thus bringing discipline andstructure to the process of change. Also, any sub-sequent changes will be compared to the baseline,where the latter becomes a standard.
AssumptionsMany assumptions go into the development of aproject plan, since the project manager is constantlyfaced with many uncertainties. Assumptions are re-quired for a good understanding of the project di-rection. These assumptions need to be spelled out indetail so that the next project manager understandsthem clearly for reformulating the plan. Manage-ment also needs to know what these assumptions

JWBT150-Vallabhaneni c11 July 28, 2009 18:5
298 Learning Module 11: Project Management
are prior to their approval of the project. Wrongassumptions may cost time and money, in additionto causing poor quality. Such assumptions include:
� Responsibility for providing test data� Availability of computer time� Critical schedule milestones� Programming languages, automated tools, and
physical facilities to be used during the project.
RisksEvery project has risks, although risk levels varyfrom low to high. Significant risks or exposures thatmay delay or jeopardize the project should be docu-mented and explained. Management is interested inknowing the risks so that they can allocate resourcesto reduce or eliminate them.
DependenciesProject tasks depend on each other. The schedulesand interrelationships of the tasks and the order inwhich they must be completed should be includedin the project plan. If the starting of task C dependson the completion of tasks A and B, this must bespelled out in the project plan, since doing it in anyother way causes quality problems and results inout-of-sequence work.
ContingenciesNo matter how carefully the project plan is put to-gether, deviations or disasters occur. Prudent man-agement will plan for contingencies to handle disas-ters and deviations. Contingencies require allocatingadditional resources (people, time, money, and facil-ities) over and beyond the required ones as a cushionagainst any unpleasant or unexpected outcomes.
Network DiagramsA network diagram showing what tasks can be donein parallel and what tasks can start only when othersare completed helps the project manager plan better.Network diagrams show the time sequence of tasksand how they are related to each other. Techniquessuch as work-breakdown structure (WBS) and mile-stones provide input to the development of networkdiagrams.
Project Estimating MethodsEstimating is an art and a science. It is an essentialpart of project management, since management ap-
proval to proceed with the project and subsequentcontrolling comes from proper estimations. If esti-mations deviate too much, it causes the project togo over budget, and time delays lead to user dis-satisfaction. Therefore, proper care should be takenduring estimating. The element of uncertainty has amajor impact on estimating. The four components oftime, scope, quality, and resources are interrelated. Anychange in one component affects the other three. De-cisions must be made after considering these fourcomponents together.
TimeIn a project environment, time is related to cost.There appears to be a schedule threshold for eachproject that is difficult to estimate. Many develop-ment and maintenance tasks are sequential and can-not be arbitrarily compressed or reorganized. Un-derstanding the nature of tasks makes it possible toestimate minimum effective task duration.
For example, adding more people to compensatefor a delayed project may increase the complexityof the effort by breaking it in such a way as to bemeaningless, increase the training required for theadditional personnel, and increase the complexityof project communication. The net effect may be toincrease the schedule as well as the cost.
It is important to allocate more time to certain ac-tivities, such as requirements analysis and designwork. Design deficiencies are much cheaper and eas-ier to fix when discovered early rather than duringthe testing or implementation stage.
ScopeProject scope focuses on what is included and whatis excluded in the project and product. It consists offeatures and functions of the product, including factorssuch as software size, difficulty of product, software re-liability, programming language, documentation, devel-opment methods, and automated tools. Any changes inthese factors affect the scope of the project, which inturn affects other factors, such as quality, time/cost,and resources.
Software Size The number of system interfaces, andthe number of people involved in a project, affectscost as software size increases.
Difficulty of Product Project staff productivity varieswith the difficulty level of the system being devel-oped or maintained. Some types of applications tend

JWBT150-Vallabhaneni c11 July 28, 2009 18:5
LEARNING OBJECTIVE 11.5: UNDERSTAND THE VARIOUS METHODS IN PROJECT PLANNING 299
to be more difficult than others. The type of softwarefunction, such as real-time or batch, also influencesdevelopment difficulty.
Software Reliability Four major criteria exist for de-termining reliability of software. It must (1) providecontinuity of operations, (2) utilize uniform designand implementation techniques, (3) produce accu-rate output, and (4) be easy for users to understand.
Programming Languages Project costs are deter-mined to some extent by the type of programminglanguage used. For example, second-generation pro-gramming languages are more expensive to usethan third- or fourth-generation languages. Pro-grammers experienced in second-generation lan-guages are hard to find and keep and are expensiveas well. Development and maintenance costs shouldboth be considered here.
Documentation It costs money to develop and main-tain system documentation. It may be necessary toexplore the need for technical writers.
Development Methods It is generally accepted that aproject with the application of structured methodscosts less than one with unstructured methods. Thescope of the structured methods includes use of top-down design, programming, and the testing and useof structured walkthroughs.
Automated Tools Automated tools such as compil-ers, database managers, flowchart packages, utilityprograms, test data generators, and test drivers af-fect time and cost factors. Costs associated with toolsare a function of tool complexity, features, use, andmaturity. Automated tools may reduce the time re-quired, if the staff knows how to use them, or theycould increase the time, if the staff is not experiencedwith their use.
QualitySystem requirements drive the entire project, includ-ing quality. Inconsistent and incomplete specifica-tion of system requirements, and poor translationof these requirements into estimates of time, cost,quality, and resources, are major concerns.
To ensure a quality product, requirements should bewell-defined, well-understood, and well-costed. Incom-plete definition of requirements is a major cause ofcost overruns. If there are too many people in theproject, misinterpretation of requirements and re-
lated communication problems may occur. Require-ments should be firmed up before detailed designwork begins. This practice not only increases qualitybut also leads to accurate costing. Removing unnec-essary constraints on project members and stabiliz-ing requirements also increase the quality of the endproduct.
ResourcesThe scope of estimating resources covers bothhuman and computing resources. Factors such asnumber of people, experience of people, and indi-vidual performance should be taken into consider-ation for estimating human resources. On the otherhand, computing resources include the availabilityof computer time for development work and auto-mated tools required during development and main-tenance.
� Number of people. Too many people on oneproject may decrease productivity and increasecommunication problems. On the other hand, toofew people will increase the project’s elapsedtime and further delay the project’s completiondate. The right number of people should beestimated.
� Experience of people. Although there is no di-rect correlation between years of experience of theproject staff and productivity, it has been foundthat experience with a similar project increasesproductivity.
� Individual performance. Since individuals vary intheir performance levels, this factor must be givenhigher importance in estimate. It is variability inperformance that may decide the success of theproject.
� Computing resources. The amount of computertime required for a given development effort iseasily underestimated. Both development and op-erations time must be accurately estimated.
� Quantitative and qualitative methods. Both quan-titative and qualitative methods are in use to es-timate project variables such as time, resources,and cost. No single method is complete; instead,a combination of methods is suggested. Quantita-tive methods include models based on techniquessuch as regression analysis (a method of paramet-ric modeling). The regression method expresses aquantifiable relationship between dependent andindependent variables for the current or histori-cal system. New cost estimates may then be made

JWBT150-Vallabhaneni c11 July 28, 2009 18:5
300 Learning Module 11: Project Management
for the new system, using relationships from histo-rical data.
It should be remembered that models are sub-ject to unreliable and biased results. This may beminimized by performing a detailed decomposi-tion of project tasks (e.g., WBS) so that ambiguitiesare removed.
Other examples of quantitative methods includecomparisons and simple ratios. Quantitative meth-ods should be complemented with qualitativemethods such as rules of thumb, heuristics, andtrial-and-error methods.
Project Controlling MethodsIn any project, there will be at least four types ofcontrols applied:
1. Time control. Project network scheduling beginswith the construction of a diagram that reflectsthe interdependencies and time requirements ofthe individual tasks that make up a project. It callsfor work plans prepared in advance of the project.Once the overall schedule is established, weeklyor biweekly review meetings should be held tocheck progress against schedule. Control must berigorous, especially at the start, so that missedcommitments call for immediate correctiveaction.
2. Cost control. Periodic reports showing the bud-get, the actual cost, and variances is a good startfor cost controls. It is necessary to break the com-prehensive cost summary reports into work pack-ages or major tasks and focus on major prob-lems and opportunities. The cost reports shouldbe distributed to technical and functional man-agers alike.
3. Quality control. Quality control comprises threeelements: defining performance criteria, express-ing the project objective in terms of quality stan-dards, and monitoring progress toward thesestandards. Examples of performance criteria in-clude market penetration of a product line, pro-cessing time for customer inquiries, and the like.Both quantitative and qualitative measures needto be defined.
4. Earned value management (EVM). EVM pro-vides a standard means of objectively measuringwork accomplished based on the budgeted valueof that work—it is “what you got for what it cost.”EVM is a project management technique that inte-
grates cost, schedule, and technical performancemeasures to monitor and control project resourcesand compile results into one set of metrics so thateffective comparisons can be made. It also helpsevaluate and control project risk by measuringproject progress in monetary terms. It providesthe project manager with a more complete pictureof the health of the entire project, not just certainsegments of the project.
The fourth control, EVM, incorporates three vitalaspects of effective project/program management:scoping, costing, and scheduling. EVM is a techniqueaimed at comparing resource planning to schedulesand to technical, cost, and schedule requirements.
The EVM technique serves two distinct purposes:it encourages the effective use of internal cost andschedule management systems and it affords the or-ganization the ability to rely on timely data producedby those systems for determining product-orientedcontracts status. In order to perform an EVM analy-sis, one needs to start with a solid baseline schedulethat accurately reflects how much work is plannedfor each time period. After this baseline is deter-mined and captured, work becomes earned in somequantitative form as work is performed. This earnedwork is then compared to the initial resource allo-cation estimates in order to determine whether theproject or investment has utilized its resources mean-ingfully and cost-efficiently.
Example of Application of EVM Technique
Schedule and Cost VariancesThe percent complete estimate method allows fora monthly or quarterly estimate of the percentageof completed work to be made by the project man-ager in charge of the work package. These esti-mates are expressed as cumulative values against100 percent of the milestone value. The earnedvalue is then calculated by applying that percent-age to the total budget for that work package.
Project A is authorized with a budget of$1,000,000 over a four-quarter, one-year, time pe-riod. The planned value for the first quarter calledfor an accomplishment of 30 percent or $300,000(0.30 × $1,000,000) of the value of the work sched-uled. Actual costs are $250,000. The earned value

JWBT150-Vallabhaneni c11 July 28, 2009 18:5
LEARNING OBJECTIVE 11.5: UNDERSTAND THE VARIOUS METHODS IN PROJECT PLANNING 301
estimate based on 20 percent of work completedis $200,000 (i.e., 0.20 × $1,000,000).
Schedule Variance = Earned Value − PlannedValue = $200,000 − $300,000 = −$100,000
where a negative amount means the project is be-hind schedule.
Cost Variance = Earned Value − Actual Costs= $200,000 − $250,000 = −$50,000
where a negative amount means the project has acost overrun.
Schedule and Cost Performance Indices
Schedule Performance Index (SPI) = EarnedValue/Planned Value = $200,000/$300,000= 0.67
Cost Performance Index (CPI) = Earned Value/
Actual Costs = $200,000/$250,000 = 0.80
A project with SPI and CPI of 1.0 is better, lessthan 1.0 is not good, and the largest negative valueshould be given top priority to work on it first.
Forecast of Final Project CostsOne can forecast a range of final cost requirementsfor project A using the SPI and CPI indices:
Low-End Forecast = Total Budget Value/SPI= $1,000,000/0.67 = $1,492,537= $1.5 million (approximately)
High-End Forecast = Total Budget Value/
(SPI × CPI) = $1,000,000/(0.67 × 0.80)= $1,000,000/0.536 = $1,865,672= $1.9 million (approximately)
A range of final cost projections between a min-imum of $1.5 million and a maximum of $1.9 mil-lion are needed to complete project A.
EVM is most effective when implemented usinga bottom-up and incremental approach. Examiningsmall, manageable chunks is a more efficient processfor identifying problems and root causes and allowsthe project manager to assess the health and risks of aproject more accurately. Generally, small milestonesare easier to plan for (their scope can be defined morespecifically) and can be measured more objectively
than large ones. Project managers should ensure thatmilestones (or submilestones) are as small and spe-cific as possible, in terms of scheduling. It is goodto limit milestone duration to a single fiscal year (orless) instead of multiyear milestones.
Other Types of Project ControlSince a project can have a number of people work-ing on it for a long time, monitoring and controlbecome essential management tools. Formal con-trol techniques include change-management policy,procedures, and forms; logs; checklists; and statusreports. Phone conversations and face-to-face com-munications are examples of informal control tech-niques. Where possible, formal control techniquesshould be practiced, since they provide some evi-dence as to what has been said and when to resolvea question or dispute.
Change ManagementChange is a constant aspect of dynamic project man-agement environments, where several people inter-act with each other. Specifically, project requirementschange, design approaches change, business needschange, and team member turnover occurs. Anychange in the baseline document is a change. Theproject manager should define the cost/time andschedule impact so that the change can be given afair evaluation. If the change justifies the estimatedimpact on the project, a decision may be made toincorporate it.
A change-management procedure is needed to in-troduce discipline into the change process. Some ba-sic change-management techniques include: loggingall changes with a sequential control number, assign-ing the change task to the appropriate staff, check-ing progress periodically, and reporting the statusof the change (e.g., completed, deferred or pend-ing). Communication is tied to change-managementin that timely communications are important to allparties affected by the change. Communication me-dia should be tied to the importance of the messagebeing communicated.
Project Reporting MethodsEffective and frequent personal communication iscrucial to keep the project moving, identify potentialproblems, solicit suggestions for improving project

JWBT150-Vallabhaneni c11 July 28, 2009 18:5
302 Learning Module 11: Project Management
performance, keep abreast of whether the customeris satisfied, and avoid surprises. Personal communi-cation can occur through words or nonverbal behav-ior, such as body language. Personal communicationcan be oral or written.
Oral CommunicationPersonal oral communication can be face to faceor via telephone. It can be by means of voice mailor videoconferencing. Information can be communi-cated in a more accurate and timely manner throughoral communication. Such communication providesa forum for discussion, clarification, understanding,and immediate feedback. Face-to-face communica-tion also provides an opportunity to observe thebody language that accompanies the communica-tion. Even phone conversations allow the listener tohear the tone, inflection, and emotion of the voice.Body language and tone are important elements thatenrich oral communication. Face-to-face situationsprovide an even greater opportunity for enrichedcommunication than phone conversations do.
Written CommunicationPersonal written communication is generally carriedout through internal memos to the project team andexternal letters to the customer or others outsidethe firm, such as subcontractors. Memos and letterscan be transmitted in hardcopy or through e-mail orgroupware.
� Reporting. Written reports are just as important asoral reports in communicating information abouta project. The required types, content, format, fre-quency, and distribution of reports that the projectorganization must prepare may be specified by thecustomer in the contract. There are two types ofproject reports: progress reports and final report:� Progress reports. It is important to keep in mind
that a progress report is not an activity report.Do not confuse activity or busyness with progressand accomplishment. The customer, in particular,is interested in project accomplishments—whatprogress has been made toward achieving theproject’s objective rather than what activities theproject team was busy doing.
� Final report. The project final report is usually asummary of the project. It is not an accumulationof the progress reports, nor is it a blow-by-blowstory of what happened throughout the project.
Project ProgressManagement needs to assess the progress of projects.To do that, meaningful and measurable checkpointsare needed, combined with a progress-reportingmechanism to determine whether the project is onschedule. Reporting mechanisms should fit the sizeof the project, meaning that a small project may notneed the elaborate reporting mechanism that a largeproject would require.
Team members should believe in the periodicprogress-reporting mechanism, since they are theones providing input to management. A 90 percentcompletion syndrome should be watched for, sincethe team members may report the task as 90 per-cent completed week after week. A better approachwould be to require estimated times and efforts tocomplete all tasks. Status-monitoring can be accom-plished with periodic status reports and scheduledmeetings.
Course CorrectionsNo project stands still and very few projects pro-ceed according to plan. Therefore, midpoint reviewsor some other checkpoint reviews are needed tobring the project back on schedule. During thesecourse corrections, management assesses the situ-ation, identifies the problems, isolates the causes ofproblems, and allocates resources to fix problems.Timely and proactive action by management is vitalto prevent major disasters and delays.
Project CommunicationProject communication can take place in severalways in which meetings and reports are a vital partof it. Project management should provide reportingguidelines to project members so that consistencyand quality of reporting can be maintained. Withthis approach, trends and problems can be readilyseen due to a standard reporting format.
With regard to meetings, certain guidelines shouldbe followed so that attendees do not consider meet-ings to be a waste of time. Specific guidelines in-clude defining the purpose of the meeting, inform-ing the attendees in advance with an agenda of whatis expected of them, inviting the right people to themeeting, keeping the meeting to a small size (lessthan 10), limiting the length of the meeting to lessthan an hour, bringing the meeting to a definiteconclusion, and setting a clear direction for futureevents.

JWBT150-Vallabhaneni c11 July 28, 2009 18:5
LEARNING OBJECTIVE 11.6: UNDERSTAND THE VARIOUS METHODS IN PROJECT SCHEDULING 303
❑ Learning Objective 11.6:UNDERSTAND THE VARIOUSMETHODS IN PROJECTSCHEDULINGTwo popular project scheduling techniques includeprogram evaluation and review technique (PERT)and critical path method (CPM). Other related toolsand techniques include work-breakdown structure(WBS) and Gantt charts.
Program Evaluation and ReviewTechniqueProject management frequently uses network dia-grams to plan the project, evaluate alternatives, andcontrol large and complex projects toward comple-tion. The program evaluation and review technique(PERT) requires extremely careful plans from thevery outset of the project. This allows managementto allocate resources to critical areas before they be-come critical. This will alert a manager to trouble ar-eas or bottlenecks before they become a major prob-lem and the source of a project overrun. PERT alsohelps to allocate resources but has no influence onthe excellence of the end product.
PERT improves communication upward to themanager and the customer (client). It lets the su-pervisor believe that the project manager is doinga superior job, regardless of how well the projectmanager is actually performing.
When PERT is used on a project, the three timeestimates (optimistic, most likely, and pessimistic)are combined to determine the expected durationand the variance for each activity:
1. Optimistic. An estimate of the minimum time anactivity will take. This is based on everything “go-ing right the first time.” It can be obtained underunusual, “good-luck” situations.
2. Most likely. An estimate of the normal time anactivity will take—a result that would occur mostoften if the activity could be repeated a number oftimes under similar circumstances.
3. Pessimistic. An estimate of the maximum time anactivity will take—a result that can occur only ifunusually “bad luck” is experienced.
The expected times determine the critical path,and the variances for the activities on this pathare summed to obtain the duration variance for
the project. The expected completion time is com-puted as:
Expected Completion Time = 1/6 (a + 4m + b)
where a is optimistic time, m is most likely time, andb is pessimistic time. The expected activity times de-rived from a three-estimate, PERT-type calculationprovide a more accurate estimate and allow the ac-tivity time variance to be calculated and included inthe estimates of project duration.
Example of Calculation of ExpectedCompletion Time
A company is planning a multiphase constructionproject. The time estimates for a particular phaseof the project are:
Optimistic 2 monthsMost likely 4 monthsPessimistic 9 months
Question: Using PERT, what is the expected com-pletion time for this particular phase?
Answer: The expected completion time would be4.5 months:
1/6 (a + 4m + b) = 1/6 (2 + 4 × 4 + 9) = 27/6 = 4.5
Critical Path MethodThe critical path method (CPM) is a powerful butbasically simple technique for analyzing, planning,and scheduling large, complex projects. In essence,the tool provides a means of determining which jobsor activities, of the many that comprise a project, arecritical in their effect on total project time and howbest to schedule all jobs in the project in order to meeta target date at minimum cost. CPM is an extensionof PERT.
Critical path scheduling helps coordinate the tim-ing of activities on paper and helps avert costly emer-gencies. The network diagram must be developedin detail as much as possible so that discrepancies,omissions, and work coordination problems can beresolved inexpensively, at least to the extent that theycan be foreseen.
Project diagrams of large projects can be con-structed by sections. Within each section the taskis accomplished one arrow at a time by asking andanswering the following questions for each job:� What immediately preceded this job?� What immediately succeeds (follows) this job?� What can be concurrent with this job?

JWBT150-Vallabhaneni c11 July 28, 2009 18:5
304 Learning Module 11: Project Management
If the maximum time available for a job equals itsduration, the job is called “critical.” A delay in a crit-ical job will cause a comparable delay in the projectcompletion time. A project contains at least one con-tiguous path of critical jobs through the project dia-gram from beginning to end. Such a path is called acritical path, and there can be only one critical pathat a time in a project.
Characteristics of a project for analysis by CPMinclude the following:
� The project consists of a well-defined collection ofjobs or activities that, when completed, mark theend of the project.
� The jobs may be started and stopped indepen-dently of each other, within a given sequence.
� The jobs are ordered in a technological sequence(for example, the foundation of a house must beconstructed before the walls are erected).
CPM focuses attention on those jobs that are criti-cal to the project time, it provides an easy way todetermine the effects of shortening various jobs inthe project, and it enables the project manager toevaluate the costs of a “crash” program. Crashing aproject means reducing its time with increasing cost.
Crashing a project is a subjective decision. Themanager needs to decide which activities on the criti-cal path should be crashed first because the activitieson the noncritical path need not be crashed at all. Itis physically possible to shorten the time requiredby critical jobs by assigning more people to the jobs;working overtime; and using different equipment,materials, and technology.
Two types of time dimensions are needed to crasha project: normal time and crash time. Crash time isthe time required by the path if maximum effort andresources are diverted to the task along this path.A balance can be obtained when a manager knowswhat the normal time and the crash time would be.The goal is to select the activity on the critical pathwith the least crash cost per day to crash first.
Example of Computation of Crash Costper Day
ActivityNormalTime
NormalCost
CrashTime
CrashCost
CrashCost/Day
123N
Crash cost per day is computed as:
(Crash Cost − Normal Cost)/(Normal Time− Crash Time)
CPM versus PERTCPM and PERT methods are essentially similar ingeneral approach and have much in common. How-ever, important differences in implementation de-tails exist. They were independently derived andbased on different concepts. Both techniques definethe duration of a project and the relationships amongthe project’s component activities. An important fea-ture of the PERT approach is its statistical treatmentof the uncertainty in activity time estimates, whichinvolves the collection of three separate time esti-mates and the calculation of probability estimates ofmeeting specified schedule dates.
CPM is different from PERT in two areas:
1. The use of only one time estimate for each activity(and thus no statistical treatment of uncertainty)
2. The inclusion, as an integral part of the overallscheme, of a procedure for time/cost trade-off tominimize the sum of direct and indirect projectcosts
CPM is the same as PERT in two areas:
1. They both use a network diagram for project rep-resentation, in which diagram circles represent ac-tivities with arrows indicating precedence.
2. They both calculate early and late start and finishtimes and slack time.
Whereas PERT and CPM are based on different as-sumptions, they are related to each other becauseof the obvious relationship between time and cost.The “ideal” network technique would combine theconcepts of CPM’s crashing strategy with PERT’sprobability distribution of activity times to derivethe optimum project duration and cost.
Some examples of the application of PERT andCPM techniques are:
� Construction and maintenance of chemical plantfacilities, highways, dams, buildings, railroads,and irrigation systems
� Planning of retooling programs for high-volumeproducts in plants such as automotive and appli-ance plants

JWBT150-Vallabhaneni c11 July 28, 2009 18:5
LEARNING OBJECTIVE 11.6: UNDERSTAND THE VARIOUS METHODS IN PROJECT SCHEDULING 305
� Introduction of a new product� Installation of a computer system� Acquisition of a company
Application of PERT and CPM Techniques
Example 1The network in Exhibit 11A describes the interre-lationships of several activities necessary to com-plete a project. The arrows represent the activities.The numbers above the arrows indicate the num-ber of weeks required to complete each activity.
1Start
2
4
8
76
5
3 Finish
3
8
4
5
27
9
6
45
Exhibit 11A PERT Network
Question 1: What is the shortest time to completethe project?
Answer 1: The longest path from node 1 to node8 is path 1–2–4–8. Since all other paths are shorterin duration than path 1–2–4–8, the activities alongthose paths can be completed before the activi-ties along path 1–2–4–8. Therefore, the amount oftime to complete the activities along path 1–2–4–8,which is 19 weeks (4 + 6 + 9), is the shortest timeto complete the project.
Question 2: What is the critical path for theproject?
Answer 2: The critical path is the sequence of ac-tivities that constrains the total completion timeof the project. The entire project cannot be com-pleted until all the activities on the critical path(the longest path) are completed.
Path 1–2–4–8, which takes 19 weeks, is the crit-ical path. Activities along each of the other threepaths can be completed (each requires less than 19weeks) before the activities along 1–2–4–8 can. Theother three paths are: 1–2–5–8 (requires 4 + 5 +8 = 17 weeks), 1–2–5–7–8 (requires 4 + 5 + 5 +4 = 18 weeks), and 1–3–6–7–8 (requires 3 + 7 +2 + 4 = 16 weeks).
Example 2During an operational audit, an internal auditingteam discovers the following document:
Project Analysis
Activity Time in WeeksPrecedingActivity
A 3 —B 3 AC 7 AD 4 AE 2 BF 4 BG 1 C, EH 5 D
Using the Project Analysis document, the auditsupervisor prepares the PERT diagram shown inExhibit 11B.
1 2 4
3
5
6A 3
B 3 F 4E 2
C 7 G 1
D 4 H 5
Exhibit 11B PERT Project Analysis
Question 1: What is the earliest completion timethat is indicated by the project analysis?
Answer 1: There are three paths:
Path 1 A–B–F = 3 + 3 + 4 = 10 weeks
Path 2 A–C–G = 3 + 7 + 1 = 11 weeksPath 3 A–D–H = 3 + 4 + 5 = 12 weeks
Path 3 has the earliest completion time of 12 weekssince it has the longest time to complete.
Question 2: What is the earliest time by whichnode 4 would be reached?
Answer 2: There are two paths by which node 4can be reached:
Path A A–C = 3 + 7 = 10 weeksPath B A–B–E = 3 + 3 + 2 = 8 weeks
Path A has the earliest time of 10 weeks to reachnode 4 since it has the longest time.
Source: Certified Internal Auditor (CIA) Exams from the In-
stitute of Internal Auditors (IIA), Altamonte Springs, Florida,
USA.

JWBT150-Vallabhaneni c11 July 28, 2009 18:5
306 Learning Module 11: Project Management
A time-related concept in PERT/CPM is slacktime, which is free time associated with each ac-tivity in a project as it represents unused resourcesthat can be diverted to the critical path. Noncrit-ical paths have slack time, whereas critical pathshave no slack time. Slack is extra time available forall events and activities not on the critical path. Anegative slack condition can prevail when a calcu-lated end date does not achieve the planned enddate. The slack time is also called a safety factoror float in that it allows a manager to shorten thelead-times or reevaluate the sequencing of activi-ties along the critical paths or to change the scopeof work.
When the earliest time and the latest time for anevent are identical, the event has zero slack time—itsscheduled start time is automatically fixed; to delaythe calculated start time is to delay the whole project.When jobs or operations follow one after another,there is no slack time.
The difference between a job’s early start time andits late start time or between early finish time andlate finish time is called total slack (TS), which rep-resents the maximum amount of time a job may bedelayed beyond its early start time without delayingthe total project’s completion time. The paths havingthe greatest slack time can be examined for possibleperformance or resource trade-offs.
For example, jobs with positive total slack allowthe project scheduler some discretion is establishingtheir start times. This flexibility can be applied tosmoothing work schedules in that peak loads maybe relieved by shifting jobs on the peak days to theirlate starts.
Total slack time (TS) is computed as:
TS = LS − ES or LF − EF
where LS is latest start time, ES is earliest start time,LF is latest finish time, and EF is earliest finishtime.
Another kind of slack is free slack (FS), which isthe amount of time a job can be delayed withoutdelaying the early start of any other job. A job withpositive total slack may or may not also have freeslack, but the latter never exceeds the former.
The amount of free slack time (FS) is computed as:
FS = EF − ES
where EF is earliest finish time and ES is earliest starttime of all its immediate successors.
Work-Breakdown StructureThe work-breakdown structure (WBS) was first in-tended as the common link between schedules andcosts in PERT cost application. Later, it became animportant tool for conceptual organization of anyproject. The WBS provides the necessary logic andformalization of task statements. The WBS preparesthe work packages, which usually represent the low-est division of the end items.
Gantt ChartThe Gantt chart is a horizontal bar chart that al-lows a manager to evaluate whether existing re-sources can handle work demand or whether activ-ities should be postponed. The Gantt chart is usedfor milestone scheduling where each milestone hasa start and completion date. A milestone representsa major activity or task to be accomplished (e.g.,a design phase in a computer system developmentproject).
The Gantt chart is a graphical illustration of ascheduling technique. The structure of the chartshows output plotted against units of time. It doesnot include cost information. It highlights activitiesover the life of a project and contrasts actual timeswith projected times using a horizontal (bar) chart.It gives a quick picture of a project’s progress inknowing the status of actual timelines and projectedtimelines.
There may be a lower probability of a cost/schedule overrun if PERT is used because of its so-phistication as a scheduling method compared toless sophisticated scheduling methods such as Ganttcharts and milestone scheduling. If there is slacktime, there is no need to use sophisticated and tightscheduling methods such as PERT.
❑ Learning Objective 11.7:UNDERSTAND THE PROJECTMANAGEMENT METRICS,PROBLEMS, AND GOVERNANCEMECHANISMS, INCLUDINGPROJECT AUDITSA project manager is equipped with metrics, gov-ernance mechanisms, cost models, and projectaudits not only to solve current project-related prob-lems but also to improve performance of futureprojects.
JWBT150-Vallabhaneni c11 July 28, 2009 18:5
LEARNING OBJECTIVE 11.7: UNDERSTAND THE PROJECT MANAGEMENT METRICS AND PROBLEMS 307
Project Management MetricsManagement metrics measure how closely a projectconforms to development plans and assess whetheran acquisition is at risk of delay or cost increases.They provide quantitative information. These tech-niques require considerable information about thesystem being developed and can be used only aftersystem design. The metrics will generally be usedafter contract award, in order to assess how well theorganization is managing the system developmentprocess.
Software metrics, which use mathematical mod-els to measure elements of the development process,are intended to help organizations better understandand manage the relationships between resource de-cisions, development schedules, and the cost of soft-ware projects. By using software metric tools, anauditor can independently evaluate software devel-opment projects by analyzing project budgets, re-quirements, schedules, and resources, and then con-firming or questioning cost, schedule, and resourceestimates.
Different metrics may be useful for an audit, de-pending on the objectives and status of an acqui-sition. Using cost models to estimate the cost andlength of time necessary to develop a new software,for example, is appropriate only after requirementshave been defined, a system design has been de-veloped, and the size of the new system has beenestimated. The models described here require esti-mates of either the lines of code or number of func-tion points that the new system will include. Costmodels project the time and cost to develop a sys-tem on the basis of estimates of the system’s size andother pertinent factors. Cost models may be used be-fore a solicitation for software development is issuedin order to assess the reasonableness of the projectschedule (if a system design has been prepared) orafter a contract has been awarded and software de-velopment has begun.
Cost ModelsCost models are tools that estimate the effort neededto develop software, based on assumed relationshipsbetween the size of a system and the effort neededto design, code, and test the software. These mod-els can help the auditor assess whether the acqui-sition’s estimated cost and schedule are reasonable.Each model uses cost drivers, which are parameterssuch as the level of experience of the programmers,the reliability requirements of the programs, and the
complexity of the project, along with the estimatedproject size, to derive overall cost and schedule esti-mates for the acquisition. When a system involvingsoftware is being developed, one or more cost mod-els may be useful. A model will be more reliableif it takes into account the organization’s historicalexperience in developing computer-based informa-tion systems. Typically cost models are derived usingdata gathered from years of experience with a widerange of software development projects.
Many cost models are based on industry-recognized models, such as the Constructive CostModel (COCOMO), PRICE, Putnam, and Jensen.Auditors should use these cost models to look fordiscrepancies with the cost and schedule estimatesestablished for an acquisition. By varying the esti-mated values for cost drivers, the auditor may alsobe able to perform a sensitivity analysis illustrat-ing where project estimates are most susceptible tochange. However, cost models have significant limi-tations in accuracy unless their underlying assump-tions of system size and cost drivers are carefullychosen and reflect the organization’s previous expe-rience in system development. It is a matter of audi-tor judgment to decide how discrepant project esti-mates and estimates provided by cost models shouldbe to raise concerns about risks of cost and scheduleoverruns. In making this judgment, the project audi-tor should take into account the uncertainty of esti-mates and assumptions made in using a cost model.
Project auditors should use a cost model to providegeneral estimates and not precise figures. This is dueto the nature of estimates in that they are based onprojections of an inherently uncertain future. Audi-tors should also ensure that the cost model used isconsistent with the software development method-ology of the project under consideration. A systemdeveloped through rapid prototyping, for example,should be evaluated with a cost model that takesprototyping into account.
Other Project IndicatorsIn addition to cost models, five indicators such asproblem reports, software volatility, developmentprogress, software size, and staff stability are im-portant to assess how effectively an organization ismanaging system development projects (in-house orcontractor developed). These indicators measure dif-ferences between what an organization planned forits contractor to accomplish by certain points in thesystem development lifecycle and the actual results.

JWBT150-Vallabhaneni c11 July 28, 2009 18:5
308 Learning Module 11: Project Management
In most cases, this comparison is most easily donegraphically. Using more than one indicator can give abroader picture of a project’s status. Auditors shoulduse indicators appropriate to the project under re-view and for which data are available. These indi-cators require that the system development work beunderway. A comparison of the actual number offunctions successfully tested to the number plannedin the acquisition schedule, for example, requiresthat system testing be underway.
1. Problem reports. This indicator involves trackingthe number of open and closed problems reportedas a system is developed. A problem could beany anomaly discovered during design, coding,testing, or implementation. Problems are distin-guished from failures of code, which representdefects discovered during operation. Contractsshould specify how problems are to be identifiedand reported. By reviewing these reports and not-ing how quickly problems are resolved, auditorscan obtain an understanding of how well the con-tractor is performing.
A trend chart can be drawn showing the num-ber of new problems reported and the numberof problems closed over time and to show anybacklog that may be developing. The auditor mayalso choose to report total problems reported andresolved or break them out by level of priority.Measuring the length of time that problems haveremained open will demonstrate how quicklysoftware problems are resolved once found.
2. Software volatility. Software volatility refers tothe number of additions to, changes in, anddeletions from the system requirements. It canbe measured graphically to see trendlines forboth approved system requirements and cumula-tive changes where the latter includes additions,deletions, and modifications to requirements.Steady increases in the number of system require-ments and changes to requirements may indi-cate that the project is at risk for delays and costoverruns.
3. Development progress. This indicator involvesthe comparison of actual to expected programsin the design, coding, and integrating of systemunits. Units can be measured in terms of computersoftware units or computer software configura-tion items. If the project team does not complete itsdesign or programming and testing activities asplanned, this indicator can show schedule delaysbefore major milestones are reached. The progress
indicator can show all elements of design, coding,testing, and integrating, or it may treat them asseparate indicators.
4. Software size. This indicator changes in the ex-pected magnitude of the software developmenteffort. The size of the system, measured in source-lines of code as established by the system design,may change as the system is coded. Changes insize can be expressed as total lines of code orcan be broken out into new, modified, and reusedlines of code. Changes in the estimated systemsize may indicate that the project was overesti-mated or underestimated in size and complex-ity. These changes may also indicate that require-ments are changing and may be related to the soft-ware volatility presented earlier. Increasing esti-mates of software size should alert the auditorthat the project’s schedule and expected cost maybe underestimated. Changes in the expected sys-tem size may necessitate reestimates of the de-velopment cost, using the cost models describedearlier.
5. Staff stability. Tracking the total number of staffmembers assigned to a system development ef-fort compared to planned staffing levels providesanother indicator of potential problems. The au-ditor can examine projected versus actual levelsof total staff or of key, experienced individuals.Understaffing may result in schedule slippage.Adding staff late in a project can actually causefurther slippage—the law of diminishing returnswill set in.
Problems in Project ManagementProject managers face unusual problems in tryingto direct and harmonize the diverse forces at workin the project situation. Their main difficulties arisefrom three sources:
1. Organizational uncertainties. The working re-lationships between the project manager andfunctional department managers have not beenclearly defined by senior management. Uncertain-ties arise with respect to handling delays, costoverruns, work assignments, and design changes.Unless the project manager is skillful in handlingthese situations, senior management may resolvethem in the interest of functional departments, atthe expense of the project as a whole.
2. Unusual decision pressures. When uncertaintiesare added to the situation, the project manager has

JWBT150-Vallabhaneni c11 July 28, 2009 18:5
LEARNING OBJECTIVE 11.7: UNDERSTAND THE PROJECT MANAGEMENT METRICS AND PROBLEMS 309
to make his decisions based on limited data andwith little or no analysis. He must move fast, evenif it means an intuitive decision that might exposehim to senior management’s criticism. Decisionsto sacrifice time for cost, cost for quality, or quality fortime, are common in most projects. There is a clearindication that the project manager needs supportfrom senior management due to these trade-offs.
3. Inadequate senior management support. Seniormanagement can seldom give the project manageras much guidance and support as his line counter-part gets. Delays in initial approval of the projectby senior management, inability to resolve con-flicts between the project manager and the func-tional department managers, and delays in allo-cating resources are the most common issues onwhich the project manager needs more attentionfrom senior management. Otherwise, project per-formance can be hampered.
Project Governance MechanismsProject governance mechanisms include establishinga project steering committee and project oversightboard and conducting a project management audit.
The project steering committee is a high-levelcommittee to integrate several functions of the or-ganization. The project oversight board is similar tothe steering committee except that it is focused on aspecific project at hand. The board:
1. Reviews the project request and scope2. Assesses the project impact3. Approves the project funding4. Challenges the costs, schedules, and benefits5. Monitors the project progress6. Reviews project deliverables7. Solves the project-related problems
Regarding the project scope, the board determineswhat is in scope and what is out of scope so that scopecreep does not happen. Any changes in project scopeare controlled by change-management procedures.
Project Management AuditThe scope of project management audit consistsof reviewing project planning, organizing, staffing,leading, and controlling tasks for effectiveness andefficiency and determining whether project objec-tives and goals are achieved.
The major objective of the project managementprocess, a part of the software assurance process, is to
establish the organizational structure of the projectand assign responsibilities. The process uses the sys-tem requirements documentation and informationabout the purpose of the software, criticality of thesoftware, required deliverables, and available timeand other resources to plan and manage the soft-ware development and maintenance processes. Theproject management process begins before softwaredevelopment starts and ends when its objectiveshave been met. The project management processoverlaps and often reiterates other software assur-ance processes. It establishes/approves standards,implements monitoring and reporting practices, de-velops high-level policy for quality, and cites lawsand regulations for compliance.
Review the following activities performed by theproject manager in the project planning area:
1. Set objectives or goals—(a) determine the de-sired outcome for the project, (b) analyze anddocument the system and software require-ments, (c) define the relationships between thesystem and software activities, (d) determinemanagement requirements and constraints (re-source and schedule limitations), (e) define suc-cess criteria, and (f) always include delivery ofsoftware that satisfies the requirements on timeand within budget.
2. Plan for corrective action.3. Develop project strategies—decide on major or-
ganizational goals (e.g., quality) and developa general program of action for reaching thosegoals.
4. Develop policies for the project—make standingdecisions on important recurring matters to pro-vide a guide for decision making.
5. Determine possible courses of action—developand analyze different ways to conduct theproject; anticipate possible adverse events andproject areas; state assumptions; develop contin-gency plans; predict results and possible coursesof action.
6. Make planning decisions—evaluate and selecta course of action from among alternatives.This includes: (a) choosing the most appropriatecourse of action for meeting project goals and ob-jectives, (b) making trade-off decisions involvingcosts, schedule, quality, design strategies, andrisks, and (c) selecting methods, tools, and tech-niques (both technical and managerial) by whichthe output and final product will be developedand assured and the project will be managed.

JWBT150-Vallabhaneni c11 July 28, 2009 18:5
310 Learning Module 11: Project Management
7. Set procedures and rules for the project—establish methods, guides, and limits for accom-plishing the project activities.
8. Select a scheduling process appropriate for de-velopment and maintenance methods.
9. Prepare budgets—allocate estimated costs(based on project size, schedule, staff) to projectfunctions, activities, and tasks, and determinenecessary resources.
10. Document, distribute, and update project plans.
Review the following activities performed by theproject manager in the project organizing area:
1. Identify and group required tasks—tasks aregrouped into logical entities (e.g., analysis tasks,design tasks, coding tasks, and test tasks) and aremapped into organizational entities.
2. Select and establish organizational structures—define how the project will be organized (e.g.,line, staff, or matrix organization) using contrac-tual requirements and principles of independentverification and validation.
3. Create organizational positions—specify job titlesand position descriptions.
4. Define responsibilities and authorities—decidewho will have the responsibility of completingtasks and who has the authority to make deci-sions related to the project.
5. Establish position qualifications—identify thequalities personnel must have to work on theproject (e.g., experience, education, programminglanguages, and tool usage).
6. Document organizational structures—documentlines of authority, tasks, and responsibilities in theproject plan.
Review the following activities performed by theproject manager in the project staffing area:
1. Fill organizational positions—fill the jobs estab-lished during organizational planning with qual-ified personnel.
2. Assimilate newly assigned personnel—famili-arize newly assigned personnel with any projectprocedures, facilities, equipment, tools, or plans.
3. Educate and train personnel as necessary.
4. Provide for general development of project staffmembers.
5. Evaluate and appraise personnel.6. Compensate project personnel (e.g., salary and
bonus).7. Terminate project assignments—reassign or ter-
minate personnel at the end of a project.8. Document staffing decisions—document staffing
plans and training policies adopted.
Review the following activities performed by theproject manager in the project leading area:
1. Provide leadership—the project manager pro-vides direction to project members by interpretingplans and requirements.
2. Delegate project authority.3. Build project teams.4. Coordinate and communicate project activities
between in-house and contractor personnel.5. Resolve project conflicts.6. Manage changes after considering the inputs, out-
puts, costs/benefits.7. Document directing decisions taken.
Review the following activities performed by theproject manager in the project controlling area:
1. Develop standards of performance—select or ap-prove standards to be used for the software de-velopment and maintenance activities.
2. Establish monitoring and reporting systems suchas milestones, deliverables, schedules.
3. Analyze results by comparing achievements withstandards, goals, and plans.
4. Apply corrective action to bring requirements,plans, and actual project status into conformance.
5. Document the controlling methods used.
Self-Assessment Exercise
Online exercises are provided for the learningobjectives in this module. Please visit www.mbaiq.com to complete the online exercises andto calculate your MBA IQ Score.

JWBT150-Vallabhaneni c12 July 28, 2009 18:25
LEARNING MODULE 12
Decision Sciences and Managerial Economics
Learning Objective 12.1: Learn How toApply Quantitative Methods toBusiness 311Basic Statistics 312Basic Probabilities 312Linear Programming Models 312Inventory Models 313Waiting-Line or Queuing Models 313Decision Analysis Models 313Forecasting Models 317Sales Seasonality and Deseasonality 318Statistical Process Control Methods 318Simulation Models 319Sensitivity Analysis 319The Time Value of Money 319Simple Ratios 320Profit Models 320Discriminant and Multivariate Analysis 320Cluster Analysis 320Consumer Research Models 320Multicriteria Decision Models 321
Learning Objective 12.2: Understandthe Basic Principles and Concepts inEconomics 321
Learning Objective 12.3: Understandthe Basic Principles and Applicationsof Microeconomics 322Economic Implications of Competition 322Economic Implications of Demand and Supply 323Economic Implications of Utility 323
Economic Implications of Perfect Competition 323Economic Implications of Monopolistic
Competition 324Economic Implications of Oligopolies 324Economic Implications of Monopolies 324Economic Implications of Labor Economics 325Economic Implications of Structure of Product
Markets 325Learning Objective 12.4: Understand
the Basic Principles and Applicationsof Macroeconomics 325Economic Implications of Employment, Interest
Rates, and Investment Theories 325Economic Implications of Economic Growth 326Methods of Measuring Economic Performance 328Aggregate Demand and Supply 329Fiscal Policy 330Monetary Policy 331Money Supply 332
Learning Objective 12.5: Understandthe Basic Principles and Applicationsof Key Economic Indicators 332Nature of Key Economic Indicators 332Specific Types of Key Economic Indicators 333
Learning Objective 12.6: Understandthe Nature of Economic BusinessCycles and Industry Growth Levels 333Economic Business Cycles 333OECD Business Cycles 334Industry Growth Levels 335
❑ Learning Objective 12.1: LEARNHOW TO APPLY QUANTITATIVEMETHODS TO BUSINESSQuantitative methods in business have differentuses depending on the type of business problem tobe solved and the type of industry. For example,the banking industry may use waiting-line or queu-ing models, sensitivity analysis, and simulation tech-niques in combination more often than other indus-
tries. Usually, quantitative methods involve a com-bination of mathematical equations, formulas, mod-els, and statistics with computer programs—calleddecision sciences.
Quantitative methods can help managers and ex-ecutives make better decisions. The focus is on thedecision-making process and on the role of quantita-tive analysis in that process. The difference betweenthe model and the situation or managerial problemit represents is an important point. Mathematical
311

JWBT150-Vallabhaneni c12 July 28, 2009 18:25
312 Learning Module 12: Decision Sciences and Managerial Economics
models are abstractions of real-world situations andas such cannot capture all the aspects of the real sit-uation. However, if a model can capture the majorrelevant aspects of the problem and can then providea solution recommendation, it can be a valuable aidto decision making.
One of the characteristics of quantitative analysisthat will become increasingly apparent is the searchfor a best solution to the problem. In carrying outquantitative analysis, we shall attempt to developprocedures for finding the best or optimal solution.
Basic StatisticsThere are many aspects to basic statistics, includ-ing mean, median, mode, mean absolute deviation,variance, standard deviation, coefficient of variation,and mean squared error.
� Mean is the simple average of observed measure-ments.
� Median is the halfway point of the data; that is, halfof the numbers are above it and half are below.
� Mode is the value that occurs most frequently.� Mean absolute deviation (MAD) is a measure of
dispersion in the data. This measure is the averageof the absolute values of all the forecast errors. Asmaller MAD is better.
� Variance, similar to MAD, measures the averagedistance from each number to the mean. We needto square each deviation and then take the averageof all the squared deviations. Variance is difficultto interpret.
� Standard deviation is the square root of the vari-ance. Assuming normal distribution, 68 percent ofthe data will be within one standard deviation ofthe mean, 95 percent of the data will be within twostandard deviations of the mean, and 99 percent ofthe data will be within three standard deviationsof the mean.
� The coefficient of variation tells us whether thedispersion is large or small relative to the average.It is computed by dividing the standard deviationby the mean. Smaller dispersion is good.
� Mean squared error (MSE) measures the averageof the sum of the squared differences between theactual time series data and the forecasted data. Asmaller MSE is preferred.
The choice between MAD and MSE is up to theindividual making the decision. For the same set ofdata, the value of MSE is larger than that of MAD.Both MAD and MSE measure forecast errors.
Basic ProbabilitiesA probability is a numerical measure of the like-lihood that an event or outcome will occur. Basicrequirements of probability include that for each ex-perimental outcome, the value must be between 0and 1 and that all individual probabilities must addup to 1.
There are three methods to assign probabilities:the classical method, the relative frequency method,and the subjective method. The classical method as-signs probabilities based on the assumption that ex-perimental outcomes are equally likely. The relativefrequency method assigns probabilities based onexperimentation or historical data. The subjectivemethod assigns probabilities based on the judgmentof the person assigning the probabilities. Businessmanagers and executives use the subjective methodmore frequently than the other methods.
An important application of probabilities is in thecalculation of expected value where each outcome(e.g., payoff) is multiplied with its correspondingprobability of occurrence.
Linear Programming ModelsLinear programming is a resource allocation andproblem-solving model that has been developed forsituations involving maximizing or minimizing alinear function subject to linear constraints that limitthe degree to which a single objective can be pur-sued (e.g., maximizing revenues, minimizing costs,or maximizing profits).
The model is built with a linear objective function,a set of linear constraints, and nonnegative decisionvariables. Objective function is the expression thatdefines the quantity to be maximized or minimizedin a linear programming model. Constraint is anequation or inequality that rules out certain combi-nations of decision variables as feasible solutions. Adecision variable is a controllable input for a linearprogramming model.
Examples of applications of linear programminginclude determining the proper mix of ingredientsin a food, paint, drug, chemical, or gasoline product,meeting the product specifications, and deciding onthe media selection (e.g., newspapers, magazines,radio, television, and direct mail) and marketing re-search (e.g., conducting customer surveys at a mini-mum cost).
Extensions to linear programming models in-clude goal programming, which is a technique forsolving multicriteria decision problems by relax-ing the assumption of a single objective; integer

JWBT150-Vallabhaneni c12 July 28, 2009 18:25
LEARNING OBJECTIVE 12.1: LEARN HOW TO APPLY QUANTITATIVE METHODS TO BUSINESS 313
programming, where some or all of the decision vari-ables can take only integer values; nonlinear pro-gramming, where some or all relationships are non-linear; transportation model, which is concernedwith shipping goods from a variety of origins toa variety of destinations with the goal of minimiz-ing route miles, shipping costs, and delivery delays;transshipment model, which is an extension of thetransportation model to product distribution prob-lems involving transfer points and possible ship-ments between any pair of nodes; and assignmentmodel, which is a network flow problem that ofteninvolves the assignment of agents to tasks; it can beformulated as a linear program and is a special caseof the transportation model.
Inventory ModelsInventory models are used by managers faced withthe dual problems of maintaining sufficient inven-tories to meet demand for goods (e.g., order coststo place the order, receive the order, and inspect theorder) and, at the same time, incurring the lowestpossible inventory holding costs (e.g., cost of capi-tal tied up in the inventory and storage costs). Ex-amples of applications of inventory models includecalculating the economic order quantity (EOQ) thatminimizes the total cost (e.g., order costs and holdingcosts) and calculating the reorder point for inventoryreplenishment.
If Q is the order quantity, then the how-much-to-order decision involves finding the value of Q thatwill minimize the sum of ordering and holding costs.The formula for EOQ is:
Q = EOQ =√
2DCoCh
where D is annual sales demand in units, Co is cost ofplacing one order, and Ch is cost of holding (carrying)one unit in inventory for the year.
The point at which stock on hand must be replen-ished is called reorder point (RP). It is also the in-ventory level at which an order should be placed.The formula for RP is:
Reorder Point = Lead-Time × Usage Rate
or RP = LT × UR
Waiting-Line or Queuing ModelsWaiting-line or queuing models have been devel-oped to help managers understand and make bet-ter decisions concerning the operation of systems
involving waiting lines. Waiting-line models are ap-plied in a bank teller operation (manual or auto-mated teller machines—ATMs) or a cash register ata department or food store to control the customer’swaiting time. A model is developed in terms of cus-tomer arrival times, service times, and the numberof ATM machines installed.
Decision Analysis ModelsDecision analysis models can be used to determineoptimal strategies in situations involving several de-cision alternatives and an uncertain or risk-filled pat-tern of future events. Uncertain future events arecalled chance events and the outcomes of the chanceevents are called states of nature. The goal of thedecision-maker is to maximize profits or minimizelosses.
Decision-making is a frequent and important activ-ity for business managers and executives alike and isrelated to risk levels. With respect to risk, individu-als act differently and can be grouped into three cat-egories: risk-takers, risk neutral, and risk-averters.When contrasted with a risk-taking entrepreneur, aprofessional manager is likely to be more cautiousas a risk-taker (i.e., he is either risk neutral or a risk-averter). Another factor is that risks are related toreturns. The higher the risk, the greater the returnand vice versa. Also, controls are related to risks.The higher the risk, the greater the need for controlsand vice versa. Controls reduce or eliminate risksand exposures.
Influence diagrams, payoff tables, decision trees,and market research studies are used to solve de-cision problems. An influence diagram shows therelationships among decisions, chance events, andconsequences for a decision problem (nodes). Pay-off tables show the financial consequences (payoffs)in terms of the alternative decisions (e.g., manufac-ture domestic, buy abroad, and buy domestic) thatcan be made and the alternative states of nature thatmight result (e.g., low, medium, or high volume).The decision tree is a diagram showing the logicalprogression that occurs over time in terms of de-cisions and outcomes and is particularly useful insequential decision problems—where a series of de-cisions need to be made with each in part dependingon earlier decisions and outcomes.
Four general types of decisions exist, which re-quire different decision procedures: (1) decisions un-der certainty, (2) decisions under risk, (3) decisionsunder uncertainty, and (4) decisions under conflictor competition.
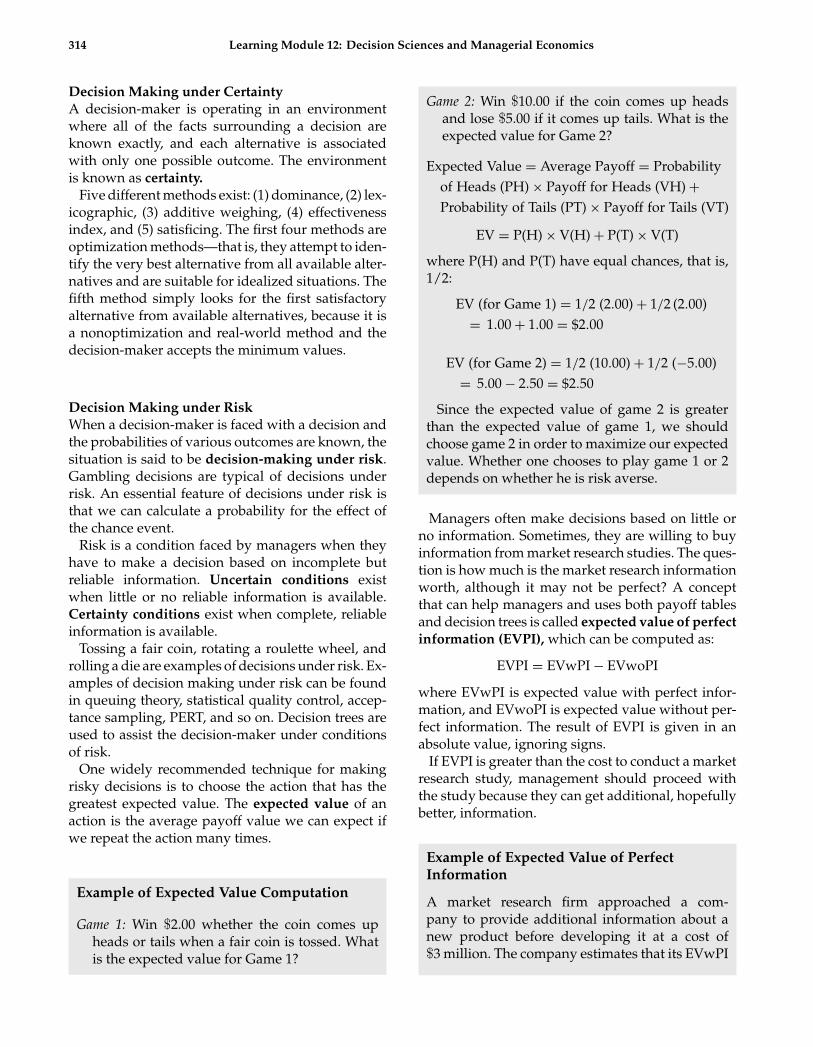
JWBT150-Vallabhaneni c12 July 28, 2009 18:25
314 Learning Module 12: Decision Sciences and Managerial Economics
Decision Making under CertaintyA decision-maker is operating in an environmentwhere all of the facts surrounding a decision areknown exactly, and each alternative is associatedwith only one possible outcome. The environmentis known as certainty.
Five different methods exist: (1) dominance, (2) lex-icographic, (3) additive weighing, (4) effectivenessindex, and (5) satisficing. The first four methods areoptimization methods—that is, they attempt to iden-tify the very best alternative from all available alter-natives and are suitable for idealized situations. Thefifth method simply looks for the first satisfactoryalternative from available alternatives, because it isa nonoptimization and real-world method and thedecision-maker accepts the minimum values.
Decision Making under RiskWhen a decision-maker is faced with a decision andthe probabilities of various outcomes are known, thesituation is said to be decision-making under risk.Gambling decisions are typical of decisions underrisk. An essential feature of decisions under risk isthat we can calculate a probability for the effect ofthe chance event.
Risk is a condition faced by managers when theyhave to make a decision based on incomplete butreliable information. Uncertain conditions existwhen little or no reliable information is available.Certainty conditions exist when complete, reliableinformation is available.
Tossing a fair coin, rotating a roulette wheel, androlling a die are examples of decisions under risk. Ex-amples of decision making under risk can be foundin queuing theory, statistical quality control, accep-tance sampling, PERT, and so on. Decision trees areused to assist the decision-maker under conditionsof risk.
One widely recommended technique for makingrisky decisions is to choose the action that has thegreatest expected value. The expected value of anaction is the average payoff value we can expect ifwe repeat the action many times.
Example of Expected Value Computation
Game 1: Win $2.00 whether the coin comes upheads or tails when a fair coin is tossed. Whatis the expected value for Game 1?
Game 2: Win $10.00 if the coin comes up headsand lose $5.00 if it comes up tails. What is theexpected value for Game 2?
Expected Value = Average Payoff = Probabilityof Heads (PH) × Payoff for Heads (VH) +Probability of Tails (PT) × Payoff for Tails (VT)
EV = P(H) × V(H) + P(T) × V(T)
where P(H) and P(T) have equal chances, that is,1/2:
EV (for Game 1) = 1/2 (2.00) + 1/2 (2.00)= 1.00 + 1.00 = $2.00
EV (for Game 2) = 1/2 (10.00) + 1/2 (−5.00)= 5.00 − 2.50 = $2.50
Since the expected value of game 2 is greaterthan the expected value of game 1, we shouldchoose game 2 in order to maximize our expectedvalue. Whether one chooses to play game 1 or 2depends on whether he is risk averse.
Managers often make decisions based on little orno information. Sometimes, they are willing to buyinformation from market research studies. The ques-tion is how much is the market research informationworth, although it may not be perfect? A conceptthat can help managers and uses both payoff tablesand decision trees is called expected value of perfectinformation (EVPI), which can be computed as:
EVPI = EVwPI − EVwoPI
where EVwPI is expected value with perfect infor-mation, and EVwoPI is expected value without per-fect information. The result of EVPI is given in anabsolute value, ignoring signs.
If EVPI is greater than the cost to conduct a marketresearch study, management should proceed withthe study because they can get additional, hopefullybetter, information.
Example of Expected Value of PerfectInformation
A market research firm approached a com-pany to provide additional information about anew product before developing it at a cost of$3 million. The company estimates that its EVwPI
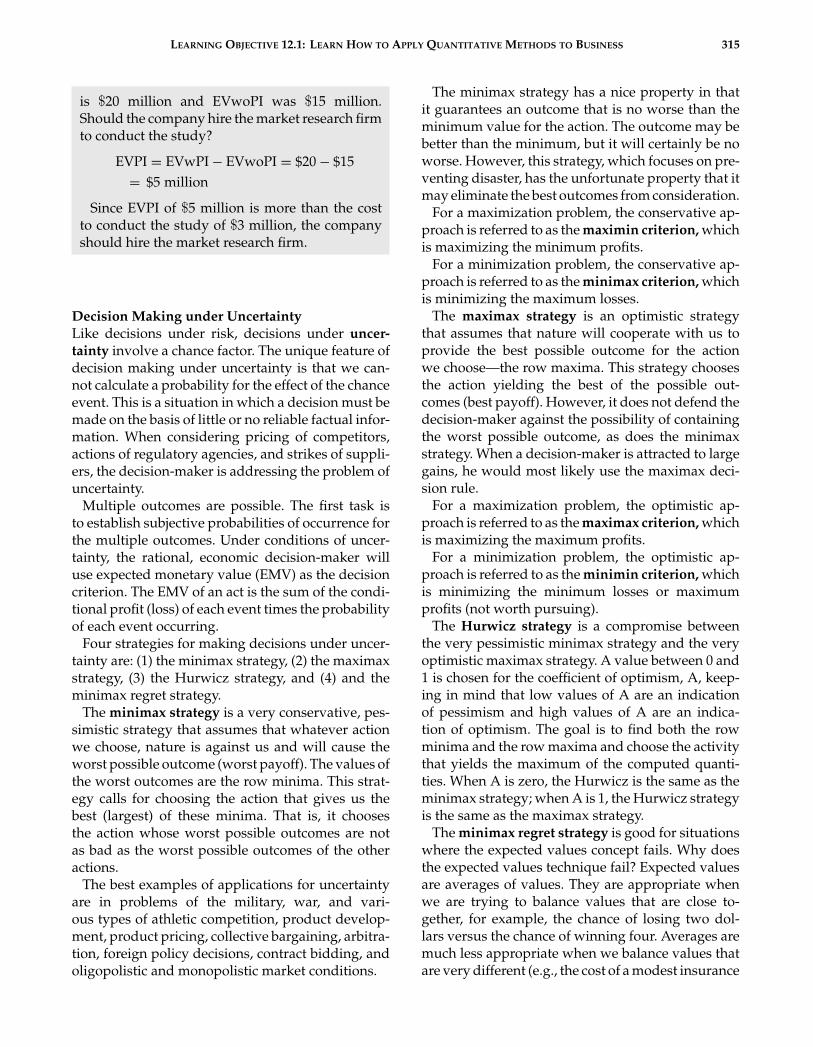
JWBT150-Vallabhaneni c12 July 28, 2009 18:25
LEARNING OBJECTIVE 12.1: LEARN HOW TO APPLY QUANTITATIVE METHODS TO BUSINESS 315
is $20 million and EVwoPI was $15 million.Should the company hire the market research firmto conduct the study?
EVPI = EVwPI − EVwoPI = $20 − $15= $5 million
Since EVPI of $5 million is more than the costto conduct the study of $3 million, the companyshould hire the market research firm.
Decision Making under UncertaintyLike decisions under risk, decisions under uncer-tainty involve a chance factor. The unique feature ofdecision making under uncertainty is that we can-not calculate a probability for the effect of the chanceevent. This is a situation in which a decision must bemade on the basis of little or no reliable factual infor-mation. When considering pricing of competitors,actions of regulatory agencies, and strikes of suppli-ers, the decision-maker is addressing the problem ofuncertainty.
Multiple outcomes are possible. The first task isto establish subjective probabilities of occurrence forthe multiple outcomes. Under conditions of uncer-tainty, the rational, economic decision-maker willuse expected monetary value (EMV) as the decisioncriterion. The EMV of an act is the sum of the condi-tional profit (loss) of each event times the probabilityof each event occurring.
Four strategies for making decisions under uncer-tainty are: (1) the minimax strategy, (2) the maximaxstrategy, (3) the Hurwicz strategy, and (4) and theminimax regret strategy.
The minimax strategy is a very conservative, pes-simistic strategy that assumes that whatever actionwe choose, nature is against us and will cause theworst possible outcome (worst payoff). The values ofthe worst outcomes are the row minima. This strat-egy calls for choosing the action that gives us thebest (largest) of these minima. That is, it choosesthe action whose worst possible outcomes are notas bad as the worst possible outcomes of the otheractions.
The best examples of applications for uncertaintyare in problems of the military, war, and vari-ous types of athletic competition, product develop-ment, product pricing, collective bargaining, arbitra-tion, foreign policy decisions, contract bidding, andoligopolistic and monopolistic market conditions.
The minimax strategy has a nice property in thatit guarantees an outcome that is no worse than theminimum value for the action. The outcome may bebetter than the minimum, but it will certainly be noworse. However, this strategy, which focuses on pre-venting disaster, has the unfortunate property that itmay eliminate the best outcomes from consideration.
For a maximization problem, the conservative ap-proach is referred to as the maximin criterion, whichis maximizing the minimum profits.
For a minimization problem, the conservative ap-proach is referred to as the minimax criterion, whichis minimizing the maximum losses.
The maximax strategy is an optimistic strategythat assumes that nature will cooperate with us toprovide the best possible outcome for the actionwe choose—the row maxima. This strategy choosesthe action yielding the best of the possible out-comes (best payoff). However, it does not defend thedecision-maker against the possibility of containingthe worst possible outcome, as does the minimaxstrategy. When a decision-maker is attracted to largegains, he would most likely use the maximax deci-sion rule.
For a maximization problem, the optimistic ap-proach is referred to as the maximax criterion, whichis maximizing the maximum profits.
For a minimization problem, the optimistic ap-proach is referred to as the minimin criterion, whichis minimizing the minimum losses or maximumprofits (not worth pursuing).
The Hurwicz strategy is a compromise betweenthe very pessimistic minimax strategy and the veryoptimistic maximax strategy. A value between 0 and1 is chosen for the coefficient of optimism, A, keep-ing in mind that low values of A are an indicationof pessimism and high values of A are an indica-tion of optimism. The goal is to find both the rowminima and the row maxima and choose the activitythat yields the maximum of the computed quanti-ties. When A is zero, the Hurwicz is the same as theminimax strategy; when A is 1, the Hurwicz strategyis the same as the maximax strategy.
The minimax regret strategy is good for situationswhere the expected values concept fails. Why doesthe expected values technique fail? Expected valuesare averages of values. They are appropriate whenwe are trying to balance values that are close to-gether, for example, the chance of losing two dol-lars versus the chance of winning four. Averages aremuch less appropriate when we balance values thatare very different (e.g., the cost of a modest insurance

JWBT150-Vallabhaneni c12 July 28, 2009 18:25
316 Learning Module 12: Decision Sciences and Managerial Economics
premium versus the risk of being impoverished bya serious car accident).
The minimax regret decision criterion chooses thestrategy that minimizes the maximum opportunityloss. To measure regret, take the difference betweenthe value of the outcome you actually obtained andthe maximum value you could have obtained if youhad chosen a different alternative.
The minimax regret approach is minimizing themaximum regret value or opportunity loss. Oppor-tunity loss is the amount of loss (i.e., lower profit orhigher cost) from not making the best decision foreach state of nature.
Decision Making under Conflict or CompetitionDecision making under conflict or competition isreferred to as game theory, and it uses the mini-max strategy. There are two types of games underconflict or competition: (1) a zero-sum game and(2) a non-zero-sum game.
Game theory is used when the states of nature ofthe decision-maker are the strategies of the oppo-nent. When one opponent gains at the loss of theother, it is called a zero-sum game, involving a com-plete conflict of interest. Games with less than com-plete conflict of interest are termed non-zero-sumgames. In non-zero-sum games, the gains of onecompetitor are not completely at the expense of theother competitors.
The majority of business competitive actions in-volve non-zero-sum games. Non-zero-sum gamesrequire that the payoffs be given for each player sincethe payoff of one player can no longer be deductedfrom the payoff of the other, as in zero-sum games.Prisoner’s dilemma is a type of business game situ-ation where one firm is concerned about the actionsof its rivals. Prisoner’s dilemma is a classic conflict-of-interest situation. The outcome of the prisoner’sdilemma game cannot be predicted conclusively. Anexample of payoff table is shown here:
States of Nature
Alternatives 1 2 3 4 Expected Profit
ABC
States of nature are uncontrollable future eventsthat can affect the outcomes of a decision. The bestexamples of applications of zero-sum games are in
problems of the military, war, and various types ofathletic competition. The best examples of applica-tions of non-zero-sum games are in product develop-ment, product pricing, collective bargaining, arbitra-tion, foreign policy decisions, contract bidding, andoligopolistic and monopolistic market conditions.
The simplest type of gain is the two-person zero-sum game. The players, X and Y, are equal in in-telligence and ability. The term zero sum is usedbecause the sum of gains exactly equals the sum oflosses. The sum of player X’s gains (or losses) andplayer Y’s losses (or gains) is zero. Such a game, inwhich the sum of gains and losses added up over allplayers is zero, is called a zero-sum game.
Game theory is a framework to help decision-makers to decide when a firm’s payoffs depend onactions taken by other firms. Game theory is usedto develop effective competitive strategies for set-ting prices, for deciding the level of product quality,for deciding on research and development work, forsetting the advertising budget, and for establishingpublic policy.
There are several concepts in game theory:
� In a simultaneous-move game, each decision-maker makes choices without specific knowledgeof his competitor’s countermoves.
� In a sequential-move game, each decision-makermakes his move after observing his competitor’smoves.
� In a one-shot game, the interaction between com-petitors occurs only once.
� In a repeat game, the interaction between competi-tors is continuous.
A game theory strategy is a decision rule that de-scribes the action taken by a decision-maker at anypoint in time. Prisoner’s dilemma is a classic conflict-of-interest situation, as evidenced in a simultaneous-move and one-shot game.
Two strategies exist: dominant strategy and securestrategy. A dominant strategy is a decision that givesthe best result for either party regardless of the actiontaken by the other. In this strategy, each party cancontrol the range of outcomes, but no one can controlthe ultimate outcome. A secure strategy (also calledthe maximum strategy) is a decision that guaranteesthe best possible outcome given the worst possiblescenario.
Nash equilibrium is a set of decision strategieswhere no firm can improve its own payoff byunilaterally changing its own strategy. Each firm’ssecure strategy is to offer a discount price

JWBT150-Vallabhaneni c12 July 28, 2009 18:25
LEARNING OBJECTIVE 12.1: LEARN HOW TO APPLY QUANTITATIVE METHODS TO BUSINESS 317
regardless of the other firm’s actions. The outcomeis that both firms offer discount prices and earn rel-atively modest profit, and this outcome is called aNash equilibrium.
A Nash bargaining game is another application ofthe simultaneous-move and one-shot game wheretwo competitors or players bargain (haggle) oversome items of value, and they have only once chanceto reach an agreement.
Pure Strategy and Mixed StrategyA pure strategy exists if there is one strategy forplayer X and one strategy for player Y that willbe played each time. The payoff, which is obtainedwhen each player plays his pure strategy, is called asaddle point. The saddle point represents an equilib-rium condition that is optimum for both competitors.
The Wald criterion, which is a variant of decisionmaking under uncertainty, is a useful technique todetermine whether a pure strategy exists. A saddlepoint can be recognized because it is both the small-est numerical value in its row and the largest numer-ical value in its column. Not all two-person zero-sumgames have a saddle point. When a saddle point ispresent, complex calculations to determine optimumstrategies and game values are unnecessary.
When a pure strategy does not exist, a fundamen-tal theorem of game theory states that the optimumcan be found by using a mixed strategy. In a mixedstrategy, each competitor randomly selects the strat-egy to employ according to a previously determinedprobability of usage for each strategy. A mixed strat-egy involves making a selection each time periodby tossing a coin, selecting a number from a tableof random numbers, or by using some probabilisticprocess.
There is a simple test to determine whether a pureor mixed strategy is best. If the maximum of the rowminima (the maximin) equals the minimum of thecolumn maxima (the minimax), then a pure strategyis best. Otherwise, use the mixed strategy.
Forecasting ModelsManagement frequently estimates sales, costs, in-come, market share, interest rates, inflation, andmanufacturing capacity utilization.
Forecasting models are used to predict future as-pects of a business operation such as estimating salesvolume, short-term cash flow needs, and long-termexternal funding needs using stocks, bonds, or loans.
There are at least seven forecasting methods avail-able: simple moving-average, weighted moving-average, exponential smoothing, heuristics, con-joint analysis, regression analysis, and Markov pro-cess analysis. The simple moving-average, weightedmoving-average, and exponential smoothing are ex-amples of time-series models.
The simple moving-average method smoothestime series data by averaging each successivegroup of data points. The weighted moving-averagemethod smoothes time series data by computing aweighted average of past time series data. The sum ofthe weights must equal 1. The exponential smooth-ing method uses a weighted average of past timeseries data to arrive at smoothed time series datathat can be used as forecasts. Smoothing constantsare used in the exponential smoothing method. Thesmoothing constant is a parameter that provides theweight given to the most recent time series data.The exponential smoothing method is better than thesimple moving average because it uses a weightedaverage of past time series data to arrive at smoothedtime series data.
The heuristics method uses rules of thumb thatshorten the time or work required to find a reason-ably good solution to a complex problem. One aspectof it is a naive approach based on intuition, whereit assumes that this month’s sales are equal to lastmonth’s sales. The heuristics method uses a trial-and-error approach.
Conjoint analysis is a statistical techniquewhere customers’ preferences for different attributes(such as product offers or advertising impacts)are decomposed to determine the customer’s in-ferred utility function and relative value for eachattribute.
Regression analysis is a causal forecasting methodthat can be used to develop forecasts when time se-ries data are not available. Regression analysis is astatistical technique that can be used to develop amathematical equation showing how variables arerelated. For example, regression models can be usedto determine the effect of advertising budget on salesrevenue and to estimate manufacturing overheadcosts and rates.
Two types of regression analysis are simple linearregression and multiple regression. In simple lin-ear regression, there will be only two variables: onedependent variable and one independent variable.In multiple regression, there will be more than twovariables: one dependent variable and more than oneindependent variable.

JWBT150-Vallabhaneni c12 July 28, 2009 18:25
318 Learning Module 12: Decision Sciences and Managerial Economics
The following equation is an example of a simplelinear regression model:
Y = m x + b
where Y is the dependent variable (sales), m is slope,X is the independent variable (disposable income),and b is the intercept.
A histogram or a bar diagram provides a fre-quency distribution of the measured data. A scatterdiagram is used to determine whether a relation-ship exists between the dependent variable (verti-cal, y axis) and an independent variable (horizontal,x axis). With the regression equation, managementcan estimate future period sales by knowing the fu-ture period’s disposable income.
MSE is an approach to measuring the accuracy ofa forecasting model. The MSE is a quantity used inregression to estimate the unknown value of the vari-ance of the error term.
Regression analysis deals with two statistical val-ues: (1) value of the coefficient of determination and(2) value of correlation or correlation coefficient. Thevalue of the coefficient of determination is alwaysbetween 0 and 1. The higher this value, the betterthe regression line fits the data. For example, a co-efficient of determination value of 0.97 means that97 percent of the variations in sales can be explainedby variations in disposable income. The value of cor-relation or correlation coefficient is always between–1 and +1. A correlation value near –1 or +1 indicatesthat there is a very strong linear relation between thesales and income variables. For example, a correla-tion coefficient value of 0.985 indicates a very stronglinear relation between these two variables.
Markov-process analysis is useful in studying theevolution of certain systems over repeated trials asit shows the probability of moving from a currentstate to any future state. Markov-process analysisdoes not optimize a system; instead, it describes thefuture and steady-state behavior of a system.
Examples of applications of Markov-process anal-ysis include: to describe the probability that a ma-chine, functioning in one period, will function orbreak down in another period; to determine the mar-ket share for a company; to identify changes in thecustomer’s collection experience in accounts receiv-able (i.e., to determine the amount of bad debts intotal accounts receivable amounts); to determine theextent to which customers switch brands; to identifyemployee fill rates for job openings; and to identifyemployee succession planning moves.
Sales Seasonality and DeseasonalitySales for many businesses exhibit seasonality overtime. Seasonal index is a measure of the seasonal ef-fect on a time-series. A seasonalized time-series isa set of observations measured at successive pointsin time or over successive periods of time. A sea-sonal index above 1 indicates a positive effect, a sea-sonal index of 1 indicates no seasonal effect, and aseasonal index less than 1 indicates a negative effect.
A deseasonalized time-series is one that hashad the effect of season removed. Deseasonalizedsales are calculated by dividing original time-seriesdata by corresponding seasonal index values. Themonthly or quarterly forecast is obtained by multi-plying the trend forecast by seasonal index values.
Statistical Process Control MethodsAll business processes, including production andservices, exhibit variation in some dimension (e.g., adeviation from the standard specification of weight,size, and performance) that must be controlled tocontain costs and improve quality. Control charts, apart of statistical process control (SPC) methods, canbe used in a production environment to determinewhether a production process is in control with theuse of upper and lower control limits. Similarly, SPCmethods can be used to track a call center staff’s per-formance in terms of revenue produced per hour ornumber of calls attended per hour.
Another application of SPC is in monitoring thecash position of a company, which is subject to fluc-tuations. The management goal is to invest excessidle cash and to meet ongoing financial obligations.A lower control limit (LCL) representing the mini-mum cash amount and an upper control limit (UCL)representing the maximum cash amount can be de-veloped. As long as the target cash balance (TCB) isbetween the LCL and the UCL, no action needs to betaken. The LCL acts as a safety stock in inventory ora required compensating balance. When the actualcash balance reaches the LCL, investment securitiesworth TCB – LCL are to be sold in order to returnthe cash balance to the target level. When the actualcash balance reaches the UCL, investment securitiesworth UCL – TCB are to be bought in order to returnthe cash balance to the target level.
The formulas used in the cash management model(Miller-Orr model) include the following:
UCL = (3 × TCB) − (2 × LCL)ACB = ((4 × TCB) − LCL)/3

JWBT150-Vallabhaneni c12 July 28, 2009 18:25
LEARNING OBJECTIVE 12.1: LEARN HOW TO APPLY QUANTITATIVE METHODS TO BUSINESS 319
where ACB is average cash balance.
Investment Securities to Be Sold = TCB − LCLInvestment Securities to Be Bought = UCL − TCB
Simulation ModelsThe primary objective of simulation models is to de-scribe the behavior of a real system. A model is de-signed and developed, and a study is conducted tounderstand the behavior of the simulation model.Characteristics that are learned from the model arethen used to make inferences about the real system.Later, the model is modified (asking what-if ques-tions) to improve the system’s performance. Thebehavior of the model in response to the what-ifquestions is studied to determine how well the realsystem will respond to the proposed modifications.Thus, the simulation model will help the decision-maker by predicting what can be expected in real-world practice. A key requisite is that the logic ofthe model should be as close to the actual operationsas possible. In most cases, a computer is used forsimulation models.
Examples of applications of simulation models in-clude: to determine risk levels in a new productdevelopment idea, to select an inventory replenish-ment level that would balance the profit level andcustomer service level, to identify traffic flow pat-terns in a highway, to understand a bank’s customerwaiting lines, and to identify airline ticket overbook-ing patterns.
Computer simulation should not be viewed as anoptimization technique but as a way to improve thebehavior or performance of the system through ad-justing model parameters.
Sensitivity AnalysisSensitivity analysis is an evaluation of how certainchanges in inputs result in what changes in outputsof a model or system. Change is inevitable. Pricesof raw materials change as demand fluctuates, andchanges in the labor market cause changes in pro-duction costs. Sensitivity analysis provides the man-ager with the information needed to respond to suchchanges without rebuilding the model. For example,bank management can use sensitivity analysis tech-niques to determine the effects of policy changes onthe optimal mix for its portfolio of earning assets.
Computer simulation techniques can be used toperform sensitivity analysis. The capability to ask
what-if questions is one of the biggest advantages ofcomputer simulation.
The Time Value of MoneyMoney received today has a different value in thefuture, and money to be received in the future has adifferent value today due to the time value of money(TVM). Both present value and future value tech-niques use interest rates to bring them to a commonmoney denominator. Compounding is the process ofdetermining the future value of present cash flows,which is equal to the beginning principal plus the in-terest earned. Discounting is the process of findingthe present value of future cash flows, which is thereciprocal of compounding.
Many applications of TVM include setting upschedules for paying off loans, acquiring new equip-ment and facilities using capital budgeting tech-niques, and establishing the value of any asset (e.g.,real estate, factories, machinery, oil wells, stocks,and bonds) whose value is derived from future cashflows.
TVM factors for present value of $1 due at the endof n periods (n = 5 years) at 4 to 10 percent interestrates are given here:
Period 4% 6% 8% 10%
5 0.8219 0.7473 0.6806 0.6209
TVM factors for present value of an annuity of$1 per period for n periods (n = 5 years) at 4 to10 percent interest rates are given here:
Period 4% 6% 8% 10%
5 4.4518 4.2124 3.9927 3.7908
TVM factors for future value of $1 at the end of nperiods (n = 5 years) at 4 to 10 percent interest ratesare given here:
Period 4% 6% 8% 10%
5 1.2167 1.3382 1.4693 1.6105
TVM factors for future value of an annuity of $1 perperiod for n periods (n = 5 years) at 4 to 10 percentinterest rates are given here:
Period 4% 6% 8% 10%
5 5.4163 5.6371 5.8666 6.1051

JWBT150-Vallabhaneni c12 July 28, 2009 18:25
320 Learning Module 12: Decision Sciences and Managerial Economics
The present cash flows or the future cash flows aremultiplied with the above TVM factors to determinethe corresponding total future values or total presentvalues.
Simple RatiosSimple ratios are used to analyze the relationshipsbetween financial statements (e.g., income state-ment, balance sheet, and cash flow statement) andto calculate depreciation, depletion, and amortiza-tion expenses. Depreciation is a cost allocation in theform of an expense for using tangible fixed assetssuch as plant and equipment. Depletion is a cost al-location for using tangible natural assets such as coaland iron ore resources. Amortization is a cost alloca-tion for using intangible assets such as patents andcopyrights.
Profit ModelsProfit models establish a quantitative relationshipbetween sales volumes and costs. Management candetermine a profit model from revenue-volume andcost-volume models as follows:
P (x) = R (x) − C (x)
where P is profit, x is volume in units, R is revenue,and C is total cost of producing x units, which in-cludes total fixed costs and variable costs.
For example, total revenue-volume model is R (x) =$10x, where x is sales volume in units and $10 isthe selling price per unit (marginal revenue).
For example, total cost-volume model is C (x) =$5,000 + $5x, where x is production volume inunits, $5,000 is total fixed cost, and $5 is variablecost per unit (marginal cost).
Substituting the R (x) and C (x) values in P (x) =R (x) – C (x) equation gives the following result:
P (x) = $10x − ($5,000 + 5x) = 5x − $5,000
The company needs to sell x = 1,000 units (i.e.,$5,000/$5) to cover fixed costs and variable costswith zero profit.
The breakeven point (BEP) is 1,000 units whereprofit is zero and revenues and costs are equal. TheBEP in units can also be calculated as:
BEP = (Total Fixed Costs)/(Selling Price perUnit − Variable Cost per Unit)
BEP = ($5,000)/($10 − $5) = 1,000 Units
Discriminant and Multivariate AnalysisDiscriminant analysis is an identification proce-dure. This technique can be applied to a wide va-riety of research and predictive problems, and in-terpretation and classification of data. It studies thedifferences between two or more groups and a set ofdiscriminant variables simultaneously. For example,multiple discriminant analysis is used for construct-ing credit-scoring indexes when granting a personalcredit to an individual customer or to a business cus-tomer for granting a trade credit, and for identifyingbusinesses that might go bankrupt.
Multivariate analysis is a research technique usedto determine how a combination of variables inter-acts to cause a particular outcome. For example,multivariate analysis can be applied to determinethe multiple variables affecting an employee’s pro-ductivity. Examples of these multiple variables in-clude conscientious personality, high challengingtask, and higher satisfaction with job and life. It iscalled bivariate analysis when an employee’s pro-ductivity is solely based on morale (i.e., one-to-onecausal relationship between two variables such asproductivity and morale).
Cluster AnalysisCluster analysis is a statistical technique to iden-tify groups of entities that have similar character-istics that can be applied to data mining and mar-ket research areas. For example, cluster analysis canbe used by data mining analysts to find groupsof customers with similar characteristics from cus-tomer order and demographic data and by mar-ket researchers to divide the population of subjectsto interview into mutually exclusive groups (e.g.,city blocks and counties) and draw a sample of thegroups from the segmented population.
Consumer Research ModelsMarketing engineering is the application of statisti-cal and mathematical models to marketing researchin order to study consumer habits, attitudes, andpreferences. Marketers use the results of thisresearch in developing new products, evaluatingtest markets, and allocating advertisement budgetto products.
Examples of consumer models include cognitive,attitudinal, compositional (e.g., lexicographic, con-junctive, and linear compensatory), and decomposi-tional (e.g., conjoint analysis) models.

JWBT150-Vallabhaneni c12 July 28, 2009 18:25
LEARNING OBJECTIVE 12.2: UNDERSTAND THE BASIC PRINCIPLES AND CONCEPTS IN ECONOMICS 321
Multicriteria Decision ModelsUsually, managers evaluate various alternativesacross multiple decision criteria using both quan-titative and qualitative methods. Multicriteria de-cision models bring discipline to unstructured andpoorly understood problems when there is no clear“best” choice. Examples of application of this modelinclude supplier evaluation criteria, product qualityevaluation criteria, and service quality evaluationcriteria because these examples need multiple di-mensions to consider and require multiple factors toevaluate.
❑ Learning Objective 12.2:UNDERSTAND THE BASICPRINCIPLES AND CONCEPTSIN ECONOMICSEconomics is the study of making choices in usingresources when there is scarcity of resources. Thefollowing are major principles and concepts in eco-nomics:
� Opportunity cost is the cost of a forgone choicewhen selecting some other choice (i.e., it is theamount of sacrifice to get something). It is a trade-off between two choices and is an example ofimplicit cost that does not require money pay-ments to acquire inputs. The various principlesand concepts in economics are equally applica-ble to both business and personal situations. Op-portunity costs should be considered in decisionmaking.
� Sunk cost is a cost that has already been incurredor committed to incur and that cannot be recov-ered. Sunk costs should not be considered in deci-sion making because they are past costs and haveno relevance to current or future costs.
� Profits are maximized when revenues are max-imized and costs are minimized. Profits are oftwo types: economic profits and accounting prof-its. Economic profit is total revenue minus totaleconomic cost. Total revenue is the total money re-ceived from selling goods or rendering services.Accounting profit is total revenue minus total ac-counting cost. Accounting profit is always higherthan the economic profit since the former does notconsider opportunity cost.
� Economic cost is the total cost of inputs used inthe production of goods and services—equal to
explicit costs (accounting costs) plus implicit costs(opportunity costs).
� Accounting cost is the explicit costs of productionor service inputs, where these costs represent theactual money paid to acquire inputs. The resources(e.g., labor, money, materials, energy, and machin-ery) used to produce goods and services are knownas factors of production or simply productioninputs.
� Two concepts related to economic profit includeeconomic-value-added (EVA) and market-value-added (MVA). EVA is defined as a company’s netoperating profit after-tax minus the charges for theuse of capital (i.e., invested capital times the cost ofcapital) invested in the company’s tangible assets.MVA measures the total market value of a com-pany’s outstanding stock plus the company’s debtor total market value minus invested capital. Whena company’s MVA is positive, it indicates that ithas created wealth for its stockholders, and it goeshand in hand with a high EVA measurement.
� Average fixed cost is total fixed cost divided by thequantity produced both in short run and long run.Fixed costs are those costs that do not change withquantity produced (e.g., rent).
� Average variable cost is total variable cost di-vided by the quantity produced both in short runand long run. Variable costs are those costs thatdo change with the quantity produced (e.g., laborwages).
� Average total cost is average fixed cost plus aver-age variable cost both in short run and long run.A firm will earn normal profit when price equalsaverage total cost.
� Average total cost per unit is total cost divided bythe quantity of units produced.
� Average profit per unit is total profit divided bythe quantity of units produced or sold.
� Marginal revenue is the change in total revenuefrom selling one more unit of output.
� Marginal cost is the change in total cost due to aone-unit change in output both in short run andlong run.
� Marginal profit is marginal revenue minusmarginal cost.
� Marginal revenue equals marginal cost at theprofit-maximizing level of output both in short runand long run.
� Marginal profit is the change in total profit dueto a one-unit change in output both in short runand long run. Profit is maximized when marginalprofit is zero.
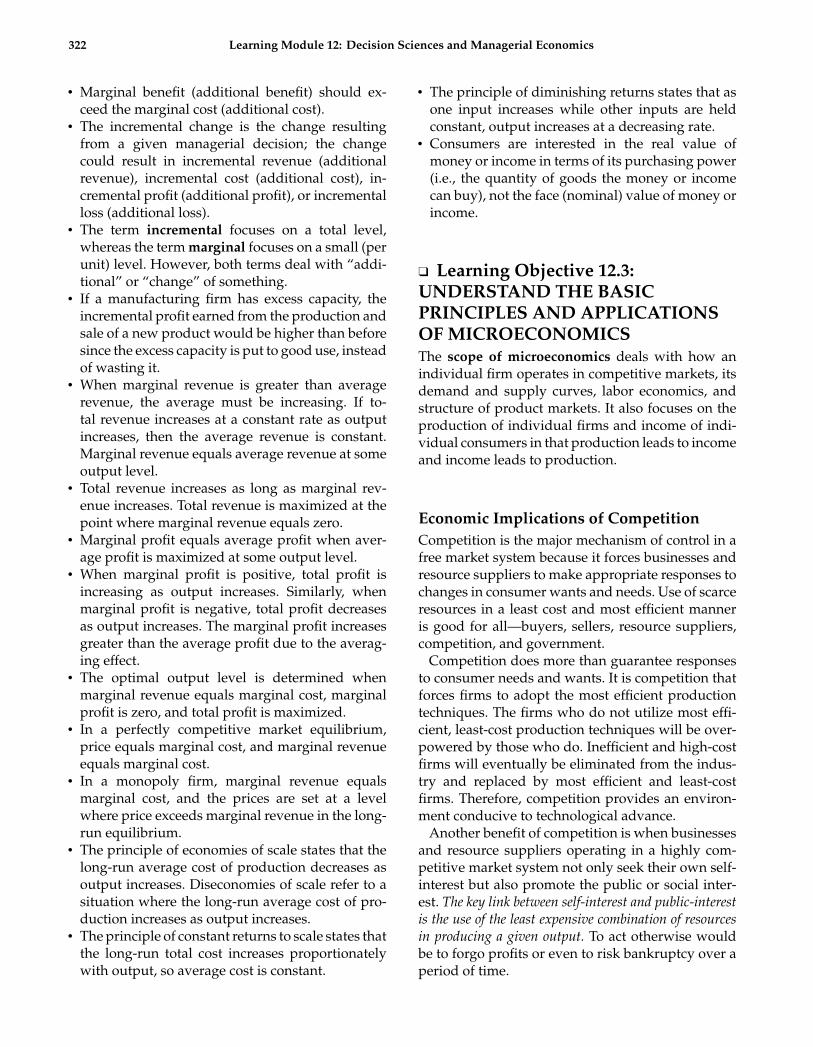
JWBT150-Vallabhaneni c12 July 28, 2009 18:25
322 Learning Module 12: Decision Sciences and Managerial Economics
� Marginal benefit (additional benefit) should ex-ceed the marginal cost (additional cost).
� The incremental change is the change resultingfrom a given managerial decision; the changecould result in incremental revenue (additionalrevenue), incremental cost (additional cost), in-cremental profit (additional profit), or incrementalloss (additional loss).
� The term incremental focuses on a total level,whereas the term marginal focuses on a small (perunit) level. However, both terms deal with “addi-tional” or “change” of something.
� If a manufacturing firm has excess capacity, theincremental profit earned from the production andsale of a new product would be higher than beforesince the excess capacity is put to good use, insteadof wasting it.
� When marginal revenue is greater than averagerevenue, the average must be increasing. If to-tal revenue increases at a constant rate as outputincreases, then the average revenue is constant.Marginal revenue equals average revenue at someoutput level.
� Total revenue increases as long as marginal rev-enue increases. Total revenue is maximized at thepoint where marginal revenue equals zero.
� Marginal profit equals average profit when aver-age profit is maximized at some output level.
� When marginal profit is positive, total profit isincreasing as output increases. Similarly, whenmarginal profit is negative, total profit decreasesas output increases. The marginal profit increasesgreater than the average profit due to the averag-ing effect.
� The optimal output level is determined whenmarginal revenue equals marginal cost, marginalprofit is zero, and total profit is maximized.
� In a perfectly competitive market equilibrium,price equals marginal cost, and marginal revenueequals marginal cost.
� In a monopoly firm, marginal revenue equalsmarginal cost, and the prices are set at a levelwhere price exceeds marginal revenue in the long-run equilibrium.
� The principle of economies of scale states that thelong-run average cost of production decreases asoutput increases. Diseconomies of scale refer to asituation where the long-run average cost of pro-duction increases as output increases.
� The principle of constant returns to scale states thatthe long-run total cost increases proportionatelywith output, so average cost is constant.
� The principle of diminishing returns states that asone input increases while other inputs are heldconstant, output increases at a decreasing rate.
� Consumers are interested in the real value ofmoney or income in terms of its purchasing power(i.e., the quantity of goods the money or incomecan buy), not the face (nominal) value of money orincome.
❑ Learning Objective 12.3:UNDERSTAND THE BASICPRINCIPLES AND APPLICATIONSOF MICROECONOMICSThe scope of microeconomics deals with how anindividual firm operates in competitive markets, itsdemand and supply curves, labor economics, andstructure of product markets. It also focuses on theproduction of individual firms and income of indi-vidual consumers in that production leads to incomeand income leads to production.
Economic Implications of CompetitionCompetition is the major mechanism of control in afree market system because it forces businesses andresource suppliers to make appropriate responses tochanges in consumer wants and needs. Use of scarceresources in a least cost and most efficient manneris good for all—buyers, sellers, resource suppliers,competition, and government.
Competition does more than guarantee responsesto consumer needs and wants. It is competition thatforces firms to adopt the most efficient productiontechniques. The firms who do not utilize most effi-cient, least-cost production techniques will be over-powered by those who do. Inefficient and high-costfirms will eventually be eliminated from the indus-try and replaced by most efficient and least-costfirms. Therefore, competition provides an environ-ment conducive to technological advance.
Another benefit of competition is when businessesand resource suppliers operating in a highly com-petitive market system not only seek their own self-interest but also promote the public or social inter-est. The key link between self-interest and public-interestis the use of the least expensive combination of resourcesin producing a given output. To act otherwise wouldbe to forgo profits or even to risk bankruptcy over aperiod of time.

JWBT150-Vallabhaneni c12 July 28, 2009 18:25
LEARNING OBJECTIVE 12.3: UNDERSTAND THE BASIC PRINCIPLES AND APPLICATIONS OF MICROECONOMICS 323
Economic Implications of Demandand SupplyTo understand how demand and supply forces work,it is important to understand the market in whichthey operate. A market is an institution or mecha-nism that brings together buyers and sellers of par-ticular goods and services. A buyer is a demander. Aseller is a supplier.
The basic determinants of an individual’s demandcurve for a specific product include preferencesor tastes, money income, and the prices of othergoods.
Markets assume a wide variety of forms: local,national, or international in scope; personal or im-personal actions by buyers and sellers; and small orlarge (gas station versus stock market). All these situ-ations, which link the potential buyer with potentialsellers, comprise markets.
Changes in Demand and Supply
When a price is changed, it will cause a change indemand, resulting in movement from one point toanother on a fixed demand curve. This situation isreferred to as “change in the quantity demanded.”
When a nonprice determinant of demand ischanged, it will cause a change in demand, re-sulting in shifting the demand curve either left orright of the fixed demand curve. This is referredto as “change in demand.”
When a price is changed, it will cause a changein supply, resulting in movement from one pointto another on a fixed supply curve. This situationis referred to as “change in the quantity supplied.”
When a nonprice determinant of supply ischanged, it will cause a change in supply, result-ing in shifting the supply curve either left or rightof the fixed supply curve. This is referred to as“change in supply.”
The equilibrium price and quantity for a product isdetermined by market demand and supply. It is thepoint of intersection of the downward-sloping de-mand curve and the upward-sloping supply curve.Two things can be concluded here:
1. Quantity supplied will exceed quantity de-manded when a price is above the equilibriumprice. Surplus of goods will occur. This in turnreduces prices and increases consumption.
2. Quantity demanded will exceed quantity sup-plied when a price is below the equilibrium price.Shortage of goods will occur. This in turn increasesprices and increases quantity supplied.
Economic Implications of UtilityThe law of demand says that a high price usuallydiscourages consumers from buying a product orservice and that a low price encourages them to buy.Three types of explanations exist to represent con-sumer behavior and the downward-sloping demandcurve. These include income and substitution effects,law of diminishing marginal utility, and indifferencecurves.
The income effect indicates that, at a lower price,one can afford more of the good without givingup any alternative goods. The purchasing power ofone’s money income is increased due to lower prices.
The substitution effect states that, at a lower price,one has the incentive to substitute the cheaper goodfor similar goods that are now relatively more expen-sive (e.g., beef is substituted for pork or chicken).
A more sophisticated explanation of consumer be-havior and consumer equilibrium is based on budgetlines and indifference curves.
A budget line shows the various combinations oftwo products A and B, which can be purchased witha given money income. An indifference curve showsall combinations of products A and B that will yieldthe same level of satisfaction or utility to the con-sumer. Hence, the consumer will be indifferent as towhich combination is actually obtained.
Economic Implications of PerfectCompetitionA perfect (pure) competition is described as a mar-ket with many sellers and buyers of a homogeneousproduct that has no barriers to market entry, whereboth buyers and sellers take the market price asgiven and where the demand is perfectly elastic(e.g., corn and wheat).
The firm operating in a perfectly competitive mar-ket need only decide how much to produce giventhe market price and should be concerned about themarket supply curve and the law of supply. Marginalrevenue (MR) is constant and equal to marginal cost(MC) and product price (P), where MR = MC = P.Perfect competition cannot influence the price of theproduct it is selling. It assumes that no firm has a

JWBT150-Vallabhaneni c12 July 28, 2009 18:25
324 Learning Module 12: Decision Sciences and Managerial Economics
significant impact on the market and that it does notmatter what the size of the firm is. Cost, price, andproduct quality information is known to all buyersand sellers.
Economic Implications ofMonopolistic CompetitionA monopolistic competition is described as a marketwith many sellers and buyers of a slightly differentproduct that has no barriers to market entry andwhere the demand is elastic but not perfectly elastic(e.g., grocery stores and coffee shops). The funda-mental difference between perfect competition andmonopolistic competition is based on the existenceof product differentiation. Cost, price, and productquality information is known to all buyers andsellers.
A large firm operating in a monopolistic competi-tion may be able to influence prices. Large numbersof rivals is a characteristic of perfect competition andmonopolistic competition (a blend of monopoly andcompetition). No mutual interdependence exists.
Economic Implications of OligopoliesThe oligopolistic industry is characterized by thepresence of a few firms dominating the market withhomogeneous or differentiated products or servicesand with demand being less elastic than the demandfacing monopolistic competition. Examples includealuminum and automobile industries and public ac-counting firms. The primary causes for the existenceof oligopolies are economies of scale, large barriersto entry into the industry, and mergers and acquisi-tions.
When setting prices, the oligopolistic firm shouldconsider the reaction of rivals in addition to costand demand data. This results in mutual interde-pendence. A price war can result when one firm cutits prices.
There is no standard model of oligopoly, unlikepure competition and pure monopoly. The lattertwo refer to clear-cut market arrangements whileoligopoly does not. The presence of many variationsof oligopoly prevents the development of a simplemodel describing oligopolistic behavior. It is impos-sible to estimate the demand and marginal-revenuedata when the reaction of rivals is highly uncertain.
Prices change less frequently in oligopoly than theydo under pure competition, pure monopoly, or mo-
nopolistic competition. When oligopolistic prices dochange, other firms are likely to change their prices.This might suggest a collusion among firms in set-ting and changing prices. Greater barriers to collu-sion exist when general economic conditions are re-cessionary.
Four models of pricing are available for a firm op-erating in an oligopoly industry: “kinked” demandcurve, collusive pricing, price leadership, and cost-plus pricing:
1. In the kinked demand curve, a price increase isignored, a price cut is followed, and the curve hasa gap or break.
2. In collusive pricing, prices are fixed through anunspoken agreement, price war can occur, andentry of new firms is controlled.
3. In price leadership, the dominant firm sets theprice or initiates price changes.
4. In cost-plus pricing, a markup is added to costs, itis good for multiproduct firms, and it works withcollusive pricing and price leadership situations.
Economic Implications of MonopoliesAbsolute or pure monopoly exists when a single firmis the sole producer of a unique product where thefirm’s demand curve is the same as the market de-mand curve, meaning the firm is the market and isa price-maker. Examples of monopolies include thegas and electric companies and professional sports.The four characteristics of a pure monopoly includesingle seller, no close substitutes, price-maker, andbarriers to entry and exit. “Barriers to exit” meansthere is a limit on asset redeployment from one lineof business or industry to another. Pure monopolycan be equated to imperfect competition. The ab-sence of rivals is a characteristic of pure monopoly.No mutual interdependence exists.
When a perfectly discriminating monopolist low-ers price, the reduced price applies only to the addi-tional unit sold and not to prior units. Hence, price,marginal revenue, and marginal cost are equal forany unit of output (i.e., P = MR = MC). The marginal-revenue curve coincides with its demand curve, andthere is an incentive to increase production.
When the nondiscriminating monopolist lowersprice to sell additional output, the lower price willapply not only to the additional sales but also to allprior units of output. Consequently, marginal rev-enue is less than price, and the marginal-revenuecurve lies below the demand curve. This condition

JWBT150-Vallabhaneni c12 July 28, 2009 18:25
LEARNING OBJECTIVE 12.4: UNDERSTAND THE BASIC PRINCIPLES AND APPLICATIONS OF MACROECONOMICS 325
creates a disincentive to increase production. In thelong run, monopolies set prices at a level where priceexceeds marginal revenue (i.e., P > MR).
Economic Implications ofLabor EconomicsLabor economics deals with wages, wage rates, andproductivity of workers. Wages are the price paid forthe use of labor, where labor includes all blue- andwhite-collar workers, professionals, and owners ofsmall businesses. Wage rate is a price paid for theuse of units of labor service.
Basically, there are two types of wages: nominal(money) wages and real wages. Nominal wages arethe amounts of money received per unit of time(hour, day, week, month, year). Real wages are thequantity of goods and services that can be obtainedwith nominal wages. Real wages depend on one’snominal wages and the prices of the goods and ser-vices purchased. Real wages are the “purchasing power”of nominal wages. Nominal wages and real wages need notmove together.
Economic Implications of Structureof Product MarketsThe structure of product markets addresses resourcepricing and level of employment as factors of pro-duction. Production factors cost money to acquirematerials and to pay for utilities and wages. Productprices are determined by the interaction of the forcesof demand and supply. Similarly, the price of a factorof production is determined by the interaction of themarket demand and supply for that factor. The mar-ket demand for a factor is derived from the demandcurve of a single firm for the factor.
Monopsony refers to one form of imperfect com-petitive market where there is a single buyer of a par-ticular factor of production such as the sole miningemployer in a mining town. Because of the greaterfactor productivity enjoyed by this firm, it can pay ahigher price for the factor and become a monopson-ist. Monopsony also results from lack of geographicand occupational mobility of factors of production.
Oligopsonistic and monopsonistic competitionrefers to other forms of imperfect competition infactor markets. An oligopsonistic competitor is oneof few buyers of a homogeneous or differentiatedfactor. A monopsonistic competitor is one of manybuyers of a differentiated factor. Both oligopsonistic
and monopsonistic competitors face a rising supplycurve of the factor; that is, they must pay higher fac-tor prices for greater quantities of the factor. Theirmarginal factor cost curve lies above the factor sup-ply curve.
❑ Learning Objective 12.4:UNDERSTAND THE BASICPRINCIPLES AND APPLICATIONSOF MACROECONOMICSThe scope of macroeconomics includes fiscal andmonetary policies, employment and unemploy-ment, inflation, interest rates, economic growth,economic performance, government spending, andmoney supply in the economy. It also focuses onproduction and income of the economy as a whole.
Economic Implications of Employment,Interest Rates, and Investment TheoriesEssentially, there are two theories of employment:classical and Keynesian. Classical economists sug-gest that full employment is the norm of a marketeconomy and that a laissez-faire (hands-off) pol-icy is best. Keynesian economics holds that unem-ployment is characteristic of laissez-faire capitalism,and activist government policies are required if oneis to avoid the waste of idle resources. Keynesianeconomists believe that full employment is acciden-tal. The basic question is: Can the market systemprovide for an efficient allocation of resources andachieve and maintain full employment of availableresources?
Classical economists view aggregate supply asdetermining the full-employment level of real na-tional output while aggregate demand establishesthe price-level. Aggregate demand is stable as longas there are no significant changes in the money sup-ply. When aggregate demand declines, the price willfall to eliminate the temporary excess supply and torestore full employment.
Keynesian economists view aggregate demand asunstable and price and wages as downwardly in-flexible. A decline in the aggregate demand has noeffect on the price level and the real output falls,resulting in unemployment. Volatility of aggregatedemand and downward inflexibility of prices meanthat unemployment can persist for extended periodsof time. An increase in savings will decrease grossnational product (GNP).

JWBT150-Vallabhaneni c12 July 28, 2009 18:25
326 Learning Module 12: Decision Sciences and Managerial Economics
With a fixed supply of money, higher product pricelevels increase the demand for money balances, in-crease the interest rate, and reduce investment. Witha fixed supply of money, lower product price levelsreduce the demand for money balances, decrease theinterest rate, and increase investment.
Interest rate is the major determinant of invest-ment. But other factors or variables determine thelocation of the investment-demand curve. Changesin these other variables, called noninterest determi-nants, shift the investment-demand curve, either tothe right or to the left. Any factor that increases theexpected net profitability of investment will shift theinvestment-demand curve to the right. Any factorthat decreases the expected net profitability of in-vestment will shift the investment-demand curve tothe left.
Economic Implicationsof Economic GrowthGrowth economics is concerned with the questionof how to increase the economy’s productive ca-pacity or full employment. Measures of economicgrowth include gross domestic product (GDP), grossnational product (GNP), and net national product(NNP). Measures of price changes include consumerprice index (CPI) and producer price index (PPI).
GDP is the total market value of all final goodsand services produced by a country in a given year.It measures total output of a country. The two mainvariables that contribute to increases in a nation’sreal GDP are labor productivity and total workerhours. GDP is computed as:
GDP = Consumption + Investment + GovernmentPurchases + Net Exports
where consumption is purchases by consumers, in-vestment is purchases by private sector firms, gov-ernment purchases include purchases by all levelsof government, and net exports are net purchasesby the foreign sectors (i.e., net exports are equal todomestic exports minus domestic imports).
Economic growth is the sustained increase in realGDP over a long period of time. Real GDP takesprice changes into account, whereas nominal GDPtakes current prices into account.
GDP deflator is the most appropriate inflation in-dex to use when a firm is attempting to estimate theinflation rate on all goods and services over a recenttime period. It measures how prices of goods andservices included in GDP change over time. GDP
deflator is calculated as:
GDP Deflator = [(Nominal GDP)/(Real GDP)] × 100
Example of Computation of GDP Deflator
Real GDP in year 2008 is $50,000, which is the baseyear with index of 100. Nominal GDP in year 2008is $60,000. What is the GDP deflator for 2009 andby what percentage did prices increase betweenthe two years?
GDP Deflator for 2009 = ($60,000)/($50,000)× 100 = 112
Price Increase = (112 − 100)/100 = 0.12 = 12%
GNP is GDP plus total income earned worldwideby U.S. firms and its residents. The sale of final goodsis included in the GNP and the sale of intermediategoods is excluded from the GNP. GNP is all-inclusiveand better than GDP.
NNP equals GNP minus depreciation. NNP iscomposed of the total market value of all final goodsand services produced in the economy in one yearminus the capital consumption allowance (i.e., de-preciation).
Economic growth is defined and measured in twoways: (1) as the increase in real GNP or NNP thatoccurs over a period of time or (2) as the increase inreal GNP or NNP per capita that occurs over time.
Nominal GNP = Real GNP + Inflation
The growth of real output and income per capita issuperior for comparisons of living standards amongnations or regions. Economic growth is usuallycalculated in terms of annual percentage rates ofgrowth.
The growth of total output relative to populationmeans a higher standard of living. Similarly, a dropin total output relative to population means a lowerstandard of living. A growing economy provides anincrement in its annual real output, which it can useto satisfy existing needs or to undertake new so-cial programs (e.g., eliminating poverty and clean-ing up the environment). Growth lessens the burdenof scarcity. This in turn allows a nation to realize ex-isting economic goods and undertake new programsby government. Even a small difference in the rateof growth becomes very important because of themultiplicative, compound interest effect.
The GNP is a quantity measure, not quality.Hence, it measures national economic performance,

JWBT150-Vallabhaneni c12 July 28, 2009 18:25
LEARNING OBJECTIVE 12.4: UNDERSTAND THE BASIC PRINCIPLES AND APPLICATIONS OF MACROECONOMICS 327
market-oriented activity, and the size of national out-put, not improvements in product quality.
Characteristics of GNP
� GNP will rise with an increase in governmentpurchases of services (i.e., government spend-ing).
� GNP will fall following an increase in imports.� A deficit in the balance of payments occurs
when imports exceed exports.� A surplus in the balance of payments occurs
when exports exceed imports.� The basic source of improvements in real wage
rates and in the standard of living is productiv-ity growth.
� When gross investment is less than deprecia-tion, the capital stock of the economy is shrink-ing.
� An increase in the average hours worked perweek of production workers would provide aleading indicator of a future increase in GNP.
The following three items are included in the GNPcalculation: (1) capital consumption allowance orgoods used up in producing the GNP, (2) Social Se-curity contributions, and (3) undistributed corporateprofits. The buying and selling of corporate bondswould not be included in the GNP calculation.
Under the income approach, the GNP is measured as:
Depreciation Charges + Indirect Business Taxes+ Wages, Rents, Interest, and Profits
Under the output (expenditures) approach, the GNP iscalculated as:
Consumption + Investments + GovernmentPurchases + Expenditures by Foreigners
There are two fundamental ways by which any so-ciety can increase its real output and income: (1) byincreasing its inputs of resources and (2) by increas-ing the productivity of those inputs. Real GNP (i.e.,total output) in any year depends on the input of la-bor (measured in worker-hours) multiplied by laborproductivity (measured as real output per workerper hour).
Real GNP = Labor Input × Labor Productivity
The hours of labor input (worker-hours) depend onthe size of the employed labor force and the lengthof the average workweek. Labor productivity is de-
termined by technological progress, the quantity ofcapital goods with which workers are equipped, thequality of labor itself, and the efficiency with whichthe various inputs are allocated, combined, andmanaged.
CPI is a statistic used to measure the changes inprices in a market basket of selected items. The CPIis one factor in setting cost-of-living adjustments(COLA) in a country. Critics of CPI argue that it over-states increases in the cost of living. This is due to theconstant composition of the market basket of itemswhose prices are measured. Chain-weighted indexis a method for calculating changes in prices that usesan average of base years from neighboring years.
The PPI measures the price of a basket of commodi-ties at the point of their first commercial sale. Thepurchasing managers’ index is a composite indexbased on data from a monthly report on producers’prices.
Example of Application of CPI, Inflation, andReal Income
Assume that in 2005 a business analyst makes$40,000 per year and five years later his incomeincreases to $90,000. The CPI increases from 100to 250. What is the real income in 2005 prices forthe later years? The real income (in 2005 prices)for the later years is as follows:
Inflation Rate = (250 − 100)/250 = 150/250= 0.60 = 60%
Real Income = Nominal Income − Inflation Rate= 100% − 60% = 40%
Therefore, real income in 2005 prices is $90,000 ×0.40 = $36,000.
Three ingredients or factors in economic growthare supply factor, demand factor, and allocativefactor.
The first, supply factor, relates to the physical abil-ity of an economy to grow. These include the quan-tity and quality of its natural and human resources,the supply or stock of capital goods, and technol-ogy. These factors permit an economy to produce agreater real output.
Demand factor is the second ingredient of eco-nomic growth. It relates to full employment of itsexpanding suppliers of resources. This requires agrowing level of aggregate demand.

JWBT150-Vallabhaneni c12 July 28, 2009 18:25
328 Learning Module 12: Decision Sciences and Managerial Economics
The third factor, the allocative factor, requires fullproduction. It is the combination of the actual useof resource suppliers and the allocation of those re-sources to obtain the maximum amount of usefulgoods produced.
Supply and demand factors in growth are related toeach other. These three factors (supply, demand, andallocative) can also be related to a production pos-sibilities curve. This curve shows the various maxi-mum combinations of products that can be producedgiven the quantity and quality of the natural, human,and capital resources and technology. A negativelysloped curve reflects the concept of opportunity cost.An opportunity cost is the value of a resource in itsbest alternative use. Opportunity costs are implicitcosts and generally are imputed.
Methods of Measuring EconomicPerformanceThe basic goals of the public and private sectors areto achieve both the full employment of resources anda stable price level. Two major methods exist to measureeconomic performance of a country: (1) unemploymentand (2) inflation.
UnemploymentThe key point is that the level of output dependsdirectly on total or aggregate expenditures. A highlevel of total spending means it will be profitable forthe various industries to produce large outputs, andit will be profitable for various resource suppliers tobe employed at high levels. Hence,
Total Spending = Private Sector Spending+ Public Sector Spending
Private sector spending alone is not enough to keepthe economy at full employment. The government’sobligation (public spending) is to augment privatesector spending sufficient to generate full employ-ment. Government has two basic economic tools withwhich to accomplish public spending: (1) spending pro-grams and (2) taxes. Specifically, government shouldincrease its own spending on public goods and ser-vices on the one hand and reduce taxes in orderto stimulate private sector spending on the other.Unemployment results when either private sectorspending or public sector spending does not mea-sure up to expectations.
There are four variations of employment or unem-ployment:
1. Full employment means that all people 16 yearsof age or older are employed or are actively seek-ing employment or that cyclical unemploymentis zero. Inflation occurring during a period of fullemployment is most likely to be demand-pull in-flation. In an economy that is near full employ-ment, a decrease in the money supply is likely todecrease the price level.
2. Frictional unemployment will always exist in adynamic economy. It is short-run unemploymentthat is caused by people voluntarily changing jobsor by frictions that result from lack of knowledgeabout job opportunities and lack of labor mobility.
Thus, full employment means that only fric-tional unemployment exists. In other words, thereis no cyclical or structural unemployment whenthe economy is operating at full employment.There always will be some unemployment at alltimes caused by workers changing jobs. Frictionalunemployment occurs when both jobs and theworkers qualified to fill them are available. It isequal to about 5 or 6 percent.
3. Cyclical employment is unemployment that re-sults from inadequate aggregate demand duringthe recession and depression phases of the busi-ness cycle.
4. Structural unemployment is unemployment thatresults from an economy’s failure to adjust com-pletely and efficiently to basic structural changessuch as changes in technology, changes in con-sumer preferences, and changes in the geographiclocations of certain industries. It is equal to about5 or 6 percent. Structural changes prevent certainpeople from obtaining jobs because of their geo-graphic location, race, age, inadequate education,or lack of training. People who are structurally un-employed are often referred to as the “hard-core unem-ployed.”
Inflation and DeflationIf aggregate spending exceeds full-employment out-put, excess spending will have the effect of increas-ing the price level. Therefore, excessive aggregatespending is inflationary. Government intervenes toeliminate the excess spending by cutting its ownexpenditures and by raising taxes so as to curtailprivate spending. The inverse relationship betweenunemployment and inflation is embodied in thePhillips curve.
� Total spending should increase to generate full em-ployment.

JWBT150-Vallabhaneni c12 July 28, 2009 18:25
LEARNING OBJECTIVE 12.4: UNDERSTAND THE BASIC PRINCIPLES AND APPLICATIONS OF MACROECONOMICS 329
� Excessive aggregate spending leads to inflation.� An increase in the price level would tend to de-
crease consumption.
Inflation is a rise in the general level of prices; defla-tion is a decline in the general level of prices. Whenprices rise, purchasing power or the ability to buygoods and services declines. If prices double, pur-chasing power is reduced to one-half of its previouslevel. Thus, inflation reduces the purchasing power ofmoney. Inflation does not mean that the prices of allgoods and services rise. Some prices rise, others fall,and some do not change at all; but on the average,prices rise.
The basic cause of inflation is spending in excessof what an economy can produce. If an economy hasunemployed resources, an increase in aggregate de-mand tends to increase output and employment agreat deal and to increase prices only slightly. Whenan economy is fully employed, an increase in ag-gregate demand forces prices to increase sharplybecause resources are scarce and output cannot beincreased.
Types of Inflation There are seven types of inflation:
1. Cost-push inflation is a rise in prices broughtabout by production costs increasing faster thanproductivity. Since labor is usually the largest costof production, cost-push inflation is often calledwage-push inflation. The expected impact is anincrease in unemployment.
2. Demand-pull inflation is a rise in prices causedby an increase in aggregate demand when aneconomy’s resources are fully employed and pro-duction cannot be increased. The expected impactis a decrease in unemployment.
3. Structural inflation results when demand in-creases or costs increase in certain industries eventhough aggregate demand equals aggregate sup-ply for the nation as a whole.
4. Profit-push inflation occurs when corporate prof-its increase before wages increase. An increasein corporate profits can result from increases inprices or from improvements in productivity thatreduce the labor cost per unit.
5. Hyperinflation or pure inflation is a rise in priceswith a very small, if any, increase in output.
6. Creeping inflation is a slow upward movementin prices over a period of several years. Creepinginflation is usually defined as a 1, 2, or 3 percent in-crease in the general price level each year. Creep-ing inflation generally accompanies growth and
full employment. Many economists prefer creep-ing inflation to price stability accompanied by un-employment and lack of economic growth.
7. Bottleneck inflation can be associated with an ag-gregate supply curve that is steep. Before the re-distribution effects of inflation can be discussed, adistinction must be made between money incomeand real income. Money income is the amount ofmoney or number of dollars a person receives forthe work he does; real income is the amount ofgoods and services the money income will buy orthe purchasing power of the money income. Realincome is thus a function of money income andthe prices of goods and services.
Effects of Inflation If nominal income increases fasterthan the price level, then real income will rise. Threeclasses of people (e.g., fixed-income groups, credi-tors, and savers) generally suffer from inflation, andthree classes of people (e.g., flexible money incomegroups, debtors, and speculators) generally benefitfrom inflation.
Nature of Deflation Deflation is a decrease in prices.Deflation can be induced through contractionarymonetary and fiscal policies. If deflation occurs in theUnited States, it becomes cheaper for other countriesto buy U.S. goods. Deflation can arise automaticallydue to an excess of imports over exports.
Aggregate Demand and SupplyAggregate demand is the total demand for goodsand services in an entire economy (i.e., demand forGDP by individual consumers, private sector firms,the government at all levels, and the foreign sector).The aggregate demand curve, which shows the rela-tionship between the level of prices and the quantityof real GDP demanded, is affected in three differ-ent ways: the wealth effect (i.e., a lower price levelleads to a higher level of wealth), the interest rateeffect (i.e., a lower price level leads to a lower in-terest rate), and the international trade effect (i.e., alower price level leads to an increased demand fordomestic goods). There are factors other than pricelevel changes that affect the aggregate demandcurve, including changes in the supply of money,changes in government spending, changes in taxes,and all other changes in demand (e.g., increase in ex-ports, increase in consumer spending, and increasein private investment spending).

JWBT150-Vallabhaneni c12 July 28, 2009 18:25
330 Learning Module 12: Decision Sciences and Managerial Economics
Factors that increase the aggregate demand includeincrease in government spending, decrease in taxes,and increase in the money supply. Factors thatdecrease the aggregate demand include decrease in gov-ernment spending, increase in taxes, and decrease inthe money supply.
The relationship between the level of incomeand consumer spending is known as the con-sumption function, which states that when con-sumers have more income, they will purchase moregoods and services. Two concepts in this area in-clude marginal propensity to consume (MPC) andmarginal propensity to save (MPS), with the under-standing that whatever income a consumer has notspent (consumed) is saved. The MPC and MPS arecomputed as:
MPC = Additional Consumption/Additional Income
MPS = Additional Savings/Additional Income
Note that the sum of the MPC and the MPS alwaysequals 1.
There is a GDP multiplier effect taking place inthe aggregate demand in that small changes in totalspending in the economy could lead to large changesin GDP and income. The GDP multiplier is computedin two ways:
GDP Multiplier = Total Shift in AggregateDemand/Initial Shift in Aggregate Demand
GDP Multiplier = 1/(1 − MPC)
Increase in GDP and Income = GDP Multiplier× Increase in Spending
Example of Computation of GDPMultiplier Effect
A government increased its spending by $20 bil-lion and the MPC is 0.5. What is the GDP mul-tiplier? What is the total increase in GDP andincome?
GDP Multiplier = 1/(1 − MPC) = 1/(1 − 0.5)= 1/0.5 = 2.0
Increase in GDP and Income = GDP Multiplier× Increase in Spending = 2.0 × $20 billion= 40 billion
Aggregate supply focuses on equating an econ-omy’s demand for output with firms’ ability to sup-ply output. This concept is similar to an individ-
ual firm’s demand and supply for its products. Theaggregate supply curve shows the relationship be-tween the level of prices and the quantity of outputsupplied. Two supply curves are in effect: long-run(vertical) and short-run (flat):
� In the long-run supply curve, the level of outputis dependent solely on the factors of supply (e.g.,labor, capital, and technology) and is independentof the price level. The economy is at full employ-ment and changes in the price level do not affectemployment.
� In the short-run supply curve, the level of out-put is dependent primarily on demand and isindependent of the price level, except for smallprice changes. The firms are assumed to supplyall the output demanded by adjusting their pro-duction levels. However, an increase in externalevents such as an increase in oil prices can in-crease a firm’s costs and reduce its profits, and thefirms increase their product prices to cover the in-creased costs. This is called a supply shock becauseit raises prices and decreases output, resulting ina recession. This phenomenon is called stagflationto indicate an increase in prices and a decrease inoutputs.
Fiscal PolicyGovernments can use fiscal policy as a tool to combateconomic downturns and recessions with changesin taxes and spending levels that affect the level ofGDP and aggregate demand. Two scenarios can oc-cur from a change in fiscal policy:
Scenario 1: Expansionary fiscal policy means an in-crease in government spending and a decrease intaxes, which increases the aggregate demand andwhich shifts the aggregate demand curve to theright. This policy action increases the GDP anddecreases unemployment when the current levelof GDP is below full employment. This expan-sionary policy increases the money supply.
Scenario 2: Contractionary fiscal policy means a de-crease in government spending and an increase intaxes, which decreases the aggregate demand andwhich shifts the aggregate demand curve to theleft. This policy action brings the GDP back to fullemployment when the current level of GDP ex-ceeds full employment, resulting in high inflationassociated with an overheated economy. This con-tractionary policy decreases the money supply.

JWBT150-Vallabhaneni c12 July 28, 2009 18:25
LEARNING OBJECTIVE 12.4: UNDERSTAND THE BASIC PRINCIPLES AND APPLICATIONS OF MACROECONOMICS 331
Both expansionary and contractionary policies areexamples of stabilization policies with actions tobring the economy closer to full employment or po-tential output. However, poorly timed stabilizationpolicies can magnify economic fluctuations with in-side lags (i.e., the time it takes to formulate andimplement a policy change) and outside lags (i.e.,the time it takes for the policy change to actuallywork and to see the results). Automatic stabiliz-ers are taxes and transfer payments that wouldstabilize the GDP without government’s explicitaction.
The fiscal multiplier states that the final shift inthe aggregate demand curve will be larger than theinitial change. Two scenarios can happen here, asfollows:
Scenario 1: If government spending increased by$20 billion, that would initially shift the aggre-gate demand curve to the right by $20 billion andthe total shift will be larger, say $30 billion.
Scenario 2: If government spending decreased by$20 billion, that would initially shift the aggre-gate demand curve to the left by $20 billion andthe total shift will be larger, say $30 billion.
Monetary PolicyGovernments use monetary policy as a tool to bal-ance the demand for money with the supply ofmoney, which determines the interest rate (i.e., thecost of money). The U.S. Federal Reserve Bank (orCentral Bank) can influence the interest rate levels inthe economy, as follows:
� In the short run, the Federal Reserve (Fed) canlower interest rates, which increases money sup-ply, which in turn increases investment spend-ing, real GDP, and net exports because the costof money is cheaper.
� In the short run, the Fed can increase interest rates,which decreases money supply, which in turn de-creases investment spending, real GDP, and netexports because the cost of money is higher.
� In the long run, the Fed does not have the powerto control real GDP.
� In the long run, changes in the money supply willaffect inflation only in that increased money sup-ply will increase inflation and vice versa. Whenthere is inflation, two types of interest rates takeon importance: nominal interest rate, which is theinterest rate quoted in the market, and real in-terest rate, which is the actual rate earned after
considering the inflation:
Nominal Interest Rate = Real Interest Rate+ Inflation Rate
The real interest rate determines the investmentspending levels in the economy.
Reasons for individuals and firms to demandmoney include to facilitate short-term transactions,to provide liquidity without incurring excessivecosts, and to reduce short-term risk when comparedto holding stocks and bonds. The amount of moneythey want to hold depends on interest rates, real GDPlevels, and the price levels.
Ways to increase the money supply include actionstaken by the Fed in terms of changing the amount ofreserves, changing reserve requirements, and chang-ing the discount rate:
� The Fed changes the amount of reserves frequentlythrough open market operations, which includesopen market purchases (i.e., purchasing govern-ment bonds from the private sector to increase themoney supply, to decrease the interest rates, andto decrease the currency exchange rates) and openmarket sales (i.e., selling government bonds to theprivate sector to decrease the money supply, toincrease the interest rates, and to increase the cur-rency exchange rates). When private citizens andindividual firms write checks to one another, thereis no change in the money supply because the to-tal amount of reserves in the banking system isunchanged. Only the Fed has the power to changethe total amount of reserves in the banking system.
� The Fed changes the reserve requirements forbanks infrequently. It can increase the money sup-ply by reducing the banks’ reserve requirementsso that banks will have more money to lend out.Similarly, it can decrease the money supply by in-creasing the banks’ reserve requirements so thatbanks will have less money to lend out.
� The Fed changes the discount rate, which is theinterest rate at which individual banks can borrowmoney from the Fed (the big bank). The big bankcan lower the discount rate to increase the moneysupply because bank borrowing is less costly. Sim-ilarly, it can raise the discount rate to reduce themoney supply because bank borrowing is morecostly. In addition to going to the Fed, individualbanks can borrow reserves from other banks, if itis cheaper than the Fed, through the federal fundsmarket using the federal funds interest rate.

JWBT150-Vallabhaneni c12 July 28, 2009 18:25
332 Learning Module 12: Decision Sciences and Managerial Economics
Similar to lags in fiscal policy, monetary policy alsohas lags. The inside lags for monetary policy arerelatively short compared to those for fiscal policy.However, the outside lags for monetary policy arequite long, in part due to changes in interest ratestaking a long time to make their effects felt.
Money SupplyMoney is used as a medium of economic exchangebetween buyers and sellers of goods and services.The money supply in the United States is measuredin terms of M1 and M2, along with their components:
Components of M1 Components of M2
+ Currency held by the public+ Demand deposits (deposits in
checking accounts)+ Traveler’s checks
+ M1+ Deposits in savings and
loans accounts+ Deposits in money market
mutual funds+ Time deposits of less than
$100,000
M2 is broader than M1, and all M2 assets need tobe converted to M1 before using them. Credit cardsare not part of the money supply, but debit cardsare because the latter is used like a check, whereasthe former eventually uses money from the bankto pay for the purchases. Hence, the credit card is,unlike money, not a medium of exchange, not a unitof account, and not a store of value. Instead, creditcards are convenient and faster because they makebusiness transactions easier and quicker to handle.
Banks create money and in part determine moneysupply through deposits and loans. Loans and re-serves are assets of a bank, whereas deposits andowners’ equity are liabilities of a bank. Accordingto law, banks are required to keep an amount of re-serve ratio as reserves, which are part of depositsand which are not available for loans. The reserveratio is the ratio of reserves to deposits.
Total Reserves = Required Reserves + Excess Reserves
Law stipulates the required reserves, and banksdecide the excess reserves, which are additional re-serves beyond the required reserves.
The money multiplier, which is 1/reserve ratio,expands the initial cash deposits into several roundsof deposits and loans in the entire banking system:
� Cash deposited into the banking system increasesthe money multiplier and increases the money sup-ply because more money is available for loans.
� Cash not deposited into the banking system de-creases the money multiplier and decreases themoney supply because that cash money is notavailable for loans.
� Cash withdrawals from a bank reduce the moneysupply because less money is available for loans.
� Excess reserves held by banks also decrease themoney multiplier and the money supply becauseless money is available for loans.
� The banking system as a whole can expand themoney supply only if new reserve amounts comeinto the system.
❑ Learning Objective 12.5:UNDERSTAND THE BASICPRINCIPLES AND APPLICATIONSOF KEY ECONOMIC INDICATORSThe scope of key economic indicators includes de-scribing their nature and specific types, as follows.
Nature of Key Economic IndicatorsBusiness conditions relate to business cycles. Thebusiness cycle is the up and down movement ofan economy’s ability to generate wealth. Businesscycles have a predictable structure but variable tim-ing. Decisions such as ordering inventory, borrow-ing money, increasing staff, and spending capital aredependent on the current and predicted business cy-cle. For example, decision making in preparation fora recession, such as cost reduction and cost contain-ment, is especially difficult. Also, during a recession,defaults on loans can increase due to bankruptciesand unemployment.
Timing is everything when it comes to makinggood cycle-sensitive decisions. Managers need tomake appropriate cutbacks prior to the beginning ofa recession. Similarly, managers cannot get caughtshort during a period of rapid expansion. Economicforecasting is a necessity for predicting business cy-cles and swings. Trend analysis, economic surveys,opinions, and simulation techniques are quite use-ful to managers trying to stay abreast of the latesteconomic developments.
Businesses use economic forecasts in making in-vestment and production decisions. When they fore-see an economic downturn, inventories may be re-duced. When prices are expected to rise quickly, theybuy goods in advance and add to equipment andplant. These decisions are based on key economicindicators.

JWBT150-Vallabhaneni c12 July 28, 2009 18:25
LEARNING OBJECTIVE 12.6: UNDERSTAND THE NATURE OF ECONOMIC BUSINESS CYCLES AND INDUSTRY GROWTH LEVELS 333
Specific Types of Key Economic IndicatorsFour types of economic indicators are used in fore-casting: leading indicators, coincident indicators,lagging indicators, and composite economic index.They all deal with timing of certain events takingplace in the economy.
1. Leading indicators change in advance of othervariables. These are the least likely to be accurate.However, they are the most useful for businessplanning because they provide information for ac-tion. The consumer price index (CPI) is often usedin making plans for inflation and wages becauseit is a leading economic indicator.
The index of leading indicators is broadly rep-resentative of the economy as its components aredrawn from six separate groups of cyclical indi-cators. Those covered groups include labor force,employment, and unemployment; sales, orders,and deliveries; fixed capital investment; prices;personal income and consumer attitudes; andmoney, credit, interest rates, and stock prices. Theleading index is primarily useful during times ofuncertainty.
Leading indicators include: average workweekof production workers in manufacturing; aver-age initial weekly claims for state unemploymentinsurance; new orders for consumer goods andmaterials, adjusted for inflation; vendor perfor-mance; new orders for nonmilitary capital goodspurchases, adjusted for inflation; new buildingpermits issued; index of stock prices; money sup-ply; spread between rates on 10-year Treasurybonds and federal funds; and index of consumerexpectations.
Diffusion indexes indicate the level of wors-ening or improving conditions in manufacturingand are highly correlated with growth rates ex-pressed by leading indicators. That is, a low dif-fusion index is associated with low growth rates,and a high diffusion index is associated with highgrowth rates. When a diffusion index is 40 percent,it means that 60 percent of the leading indicatorshave fallen.
2. Coincident indicators change at the same time asother variables change. Examples include infla-tion, unemployment, and consumer confidence.The coincident economic index is primarily usedas a tool for dating the business cycle, that is, de-termining turning points such as cyclical peaksand troughs. Manufacturing and trade sales will
determine whether a business cycle is turning intopeaks or troughs.
3. Lagging indicators change after the other vari-ables change. These are more accurate, but theinformation is much less useful for decision mak-ing. Examples of lagging indicators include av-erage duration of unemployment; inventories tosales ratio for manufacturing and trade; changein labor cost per unit of output, manufacturing;average prime rates; commercial and industrialloans; consumer installment credit to personal in-come ratio; and change in consumer price indexfor services.
4. Composite economic index is based on the otherthree indicators: leading, coincident, and lagging.
❑ Learning Objective 12.6:UNDERSTAND THE NATURE OFECONOMIC BUSINESS CYCLESAND INDUSTRY GROWTH LEVELSA linkage is shown among business cycles, eco-nomic growth of a nation, and industry growth lev-els. The firm’s growth rate is compared to that of theeconomy.
Economic Business CyclesEvery nation seeks economic growth, full employ-ment, and price level stability, which is not easy toachieve due to business cycles.
The business cycle refers to the recurrent ups anddowns in the level of economic activity that extendsover time. The coincident economic index is pri-marily used as a tool for dating the business cycle,that is, determining turning points such as cyclicalpeaks and troughs. Manufacturing and trade saleswill determine whether a business cycle is turninginto peaks or troughs.
Economists suggest four phases of the business cy-cle: peak, recession, trough, and recovery. The dura-tion and strength of each phase is variable. Someeconomists prefer to talk of business fluctuations,rather than cycles, because cycles imply regularitywhile fluctuations do not.
1. Peak. The economy is at full employment, and thenational output is close to capacity. The price levelis likely to rise.
2. Recession. Both output and employment decline,but prices tend to be relatively inflexible in a

JWBT150-Vallabhaneni c12 July 28, 2009 18:25
334 Learning Module 12: Decision Sciences and Managerial Economics
downward direction. Depression sets in whenthe recession is severe and prolonged, and pricesfall. In an economy experiencing a recessionwith low inflation, the central bank could stim-ulate the economy by purchasing securities inthe secondary market, which will increase moneysupply.
3. Trough. Both output and employment bottom-outat their lowest levels.
4. Recovery. Both output and employment expandtoward full employment. As recovery intensifies,price levels may begin to rise prior to the realiza-tion of full employment and capacity production.
Economists suggest many theories supporting thereasons behind the nature of the four phases of thebusiness cycle and its impact on business activity.Examples include:
� Innovations (e.g., computers, drugs, syntheticfibers, and automobiles) have greater impact oninvestment and consumer spending and thereforeon output, employment, and the price level. Thisinnovation is not regular and continued.
� Political and random events such as war have amajor impact on increasing employment and in-flation followed by slump when peace returns.
� Monetary policy of the government has a majorimpact on business activity. When government cre-ates too much money, inflation results. When gov-ernment restricts money supply, it results in loweroutput and unemployment.
� The level of total expenditures has a major impacton the levels of output and employment, as fol-lows:� When total expenditure is low, output, employ-
ment, and incomes will be low. Less productionwill be profitable to the business.
� When total expenditure is high, output, employ-ment, and incomes will be high. More produc-tion will be profitable to the business.
� Many businesses such as retail, automobile, con-struction, and agriculture are subject to seasonalvariations (e.g., pre-Christmas and pre-Easter).
� Business activity is also subject to a secular trend.The secular trend of an economy is its expansionor contraction over a long period of time (i.e., 25 ormore years). Both seasonal variations and seculartrends are due to noncyclical fluctuations.
� It is important to note that various individualsand various segments of the economy are affectedin different ways and in different degrees by thebusiness cycle. For example, consumer durable
and consumer nondurable goods industries are af-fected in different ways:� Those industries producing heavy capital goods
and consumer durables (e.g., household appli-ances and automobiles), called hard goods in-dustries, are highly sensitive to the businesscycle. Both production and employment willdecline during recession and increase duringrecovery. Producers cut the output and employ-ment instead of lowering prices due to their con-centration in the industry. Price cuts could bemodest, even if they occur. Consumers postponetheir purchase decisions and producers post-pone their investment decisions.
� Output and employment in consumer non-durable goods industries are less sensitive to thebusiness cycle. This is because food and clothes,which are examples of the consumer nondurableindustry, are simply necessities of life. Theseare called soft goods industries. Because it isa highly competitive and low-concentration in-dustry, prices will be cut instead of productionand employment. Production decline would bemodest, even if it occurs.
OECD Business CyclesAccording to the Organization for Economic Co-operation and Development (OECD) at www.oecd.org, business cycles are recurrent sequences of alter-nating phases of expansion (peak) and contraction(trough) in economic activity. A phase is defined asthe time span between a peak and a trough. A cy-cle is defined as the time span separating two turn-ing points of the same nature (two peaks or twotroughs). A turning point occurs in a series whenthe deviation-from-trend series reaches a local max-imum (peak) or a local minimum (trough). Growthcycle peaks (end of expansion) occur when activity isfurthest above its trend level. Growth cycle troughs(end of contraction or recession) occur when activityis furthest below its trend level.
Three different business cycle concepts exist:(1) the classical cycle refers to fluctuations in thelevel of the economic activity (e.g., measured by in-dex of industrial production—IIP), (2) the growthcycle refers to fluctuations in the economic activityaround the long-run potential level or fluctuationsin the output-gap (e.g., measured by the de-trendedGDP or IIP), (3) the growth rate cycle refers to fluc-tuations of the growth rate of economic activity (e.g.,GDP growth rate).

JWBT150-Vallabhaneni c12 July 28, 2009 18:25
LEARNING OBJECTIVE 12.6: UNDERSTAND THE NATURE OF ECONOMIC BUSINESS CYCLES AND INDUSTRY GROWTH LEVELS 335
The composite leading indicator (CLI) is an ag-gregate time-series displaying a reasonably consis-tent leading relationship with the reference seriesfor the business cycle in a country. The CLI focuseson the growth cycle concept and is constructed byaggregating together component series selected ac-cording to multiple criteria, such as economic signif-icance, cyclical behavior, and data quality. Compo-nent series are economic time series, which exhibitleading relationship with a reference series at theturning points. Cyclical indicator systems are con-structed around a reference series. The reference se-ries is the economic variable whose cyclical move-ments the CLI intended to predict and include IIPand GDP.
Other related concepts include trend, de-trending,smoothing, and normalization:
� Trend. In time-series analysis, a given time-seriescan be decomposed into four components (i.e.,cyclical, trend, seasonal, and irregular).
� De-trending. De-trending is a procedure in whichthe long-term trend, which may obscure cyclicalvariations in the component or the reference series,is removed.
� Smoothing. Smoothing eliminates the noise fromtime-series, and makes the cyclical signal clearer.
� Normalization. Normalization is the transforma-tion of the de-trended component series prior toaggregation into CLI to express the cyclical move-ments in a comparable form, on a common scale.The method used to calculate normalized indicesis to subtract the mean from the observed valueand then to divide the resulting difference by the
mean absolute deviation (MAD). Finally the seriesis relocated to have a mean of 100.
Industry Growth LevelsAnother interesting concept is to compare thegrowth of a firm (industry) with that of the econ-omy. Four growth indicators are:
1. Supernormal growth is the part of the lifecycle ofa firm in which its growth is much faster than thatof the economy as a whole.
2. Normal growth is the growth that is expected tocontinue into the foreseeable future at about thesame rate as that of the economy as a whole. Thegrowth rate of a firm is equal to the nominal grossnational product (GNP), which is real GNP plusinflation.
3. Zero growth indicates that a firm experiences azero percent growth compared to the economy asa whole.
4. Negative growth indicates that a firm experienc-ing a decline in growth compared to the economyas a whole.
Self-Assessment Exercise
Online exercises are provided for the learning ob-jectives in this module. Please visit www.mbaiq.com to complete the online exercises and to cal-culate your MBA IQ Score.

JWBT150-Vallabhaneni c12 July 28, 2009 18:25
336

JWBT150-Vallabhaneni ref June 21, 2009 13:46
References
Anupindi et al., Managing Business Process Flows(MBPF): Principles of Operations Management, 2nd ed.(Upper Saddle River, NJ Pearson/Prentice Hall, 2006),Appendix I, MBPF Checklist, pp. 313–315.
Blake, Robert R., and Jane Srygley Mouton, “A Compar-ative Analysis of Situationalism and 9, 9 Managementby Principle,” Organizational Dynamics, Spring 1982.
Bologna, Jack, Handbook on Corporate Fraud (Stoneham,MA: Butterworth-Heinemann, 1993).
Bolton, Robert, People Skills (New York: Simon & Schuster,1979).
Brinkerhoff, Robert O., and Dennis E. Dressler, Productiv-ity Measurement: A Guide for Managers and Evaluators,Applied Social Research Methods Series, Volume 19(Newbury Park, CA: Sage Publications, 1990).
Business Roundtable, Business Roundtable’s Principles ofCorporate Governance (Washington, DC: 2005), pp. 2–3,7–10, 10–12.
Carroll, Archie B., “A Three-Dimensional ConceptualModel of Corporate Social Performance,” Academy ofManagement Review, Vol. 4, No. 4, 1979, pp. 497–505.
Cohen, Herb, You Can Negotiate Anything (Secaucus, NJ:Lyle Stuart, 1980).
Craig, Jack, Multinational Cooperatives: An Alternative forWorld Development (Saskatoon, Saskatchewan, Canada:Western Producers Prairie Books, 1976).
Davia, Howard R., Patrick C. Coggins, John C. Wideman,and Joseph T. Kastantin, Management Accountant’s Guideto Fraud Discovery and Control (Hoboken, NJ: John Wiley& Sons, 1992).
Hall, E.T., and M.R. Hall, Understanding Cultural Differ-ences: Keys to Success in West Germany, France, and theUnited States (Yarmouth, ME: Intercultural Press, 1990).
Harris, Philip R., and Robert T. Moran, Managing Cul-tural Differences, 3rd ed. (Houston, TX: Gulf Publishing,1991).
Hofstede, Geert, Cultural Consequences: InternationalDifferences in Work-Related Values (Beverly Hills: SagePublishing, 1984).
Kreitner, Robert, Management, 9th ed. (Boston: HoughtonMifflin, 2004).
Lewin, Kurt, Personal Psychology, Autumn 1989.Mintzberg, Henry, “Managerial Work: Analysis from
Observation,” Management Science, October 1971.Gerhard Mueller, Helen Gernon, and Gary Meek, Account-
ing: An International Perspective, 3rd ed. (Burr Ridge, IL:Irwin, 1994).
National Institute of Standards and Technology (NIST),“Contingency Planning Guide for Information Tech-nology Systems (SP 800-34)” (Gaithersburg, MD: U.S.Department of Commerce, 2002).
National Institute of Standards and Technology (NIST),“Information Security Handbook: A Guide for Man-agers (SP 800-100, Draft),” System Development LifeCycle (Chapter 3) (Gaithersburg, MD: U.S. Departmentof Commerce, 2006).
National Institute of Standards and Technology (NIST),“Guide to Test, Training, and Exercise Programs for ITPlans and Capabilities (SP 800-84)” (Gaithersburg, MD:U.S. Department of Commerce, 2006).
Porter, Michael E., Competitive Strategy (New York: TheFree Press, 1980).
Robbins, Stephen P., Organizational Behavior (EnglewoodCliffs, NJ: Prentice Hall, 1993).
Robbins, Stephen P., and Timothy A. Judge, OrganizationalBehavior, 12th ed. (Upper Saddle River, NJ: PearsonEducation, 2007), Chapters 1 and 17.
Schriesheim, Chester, James Tolliver, and OrlandoBehling, “Influence Tactics Used by Subordinates,”Journal of Applied Psychology, June 1990.
Weber, Ann L., Social Psychology (New York: Harper-Collins, 1992).
337

JWBT150-Vallabhaneni ref June 21, 2009 13:46
338

JWBT150-Vallabhaneni ind August 7, 2009 18:59
Index
5Ms – resources, 925Ws – whys, 507-S – McKinsey framework, 87Ss – production, 507Ws – Waste, 49360-degree feedback – employee performance, 114720-degree review – senior managers’ performance,
114
A
Absolute advantage, 275Absorption costing method – production, 140Accept or reject errors – capital budgeting, 172Accountability of an individual – IT, 220Accountability, 11Accounting cost, 321Accounting cycle, 121Accounting estimates, 266Accounting information qualities, 121Accounting period concept – accounting, 121Accounting profit, 321Accounting rate of return (ARR) method, 172Accrual-basis accounting, 122Accruals – financing, 165Activity network diagram – QM tool, 97Activity-based costing (ABC) method, 20, 151Actual cost, 141Added-value negotiating (AVN), 32Adverse impact – diversity, 106Advertising carryover effect, 84Advertising effectiveness ratio, 84Advertising elasticity, 84Advertising response analysis, 84Affinity diagram – QM tool, 97Agency costs – employees, 266Agency problems- employees, 266Aggregate demand – economics, 329Aggregate production planning (APP), 60Aggregate supply – economics, 330Alternative processing sites – disaster recovery:
Cold site, 203Hot site, 203
Mirrored site, 204Mobile site, 203Warm site, 203
Alternative risk transfer (ART) tools and methods, 182,246
Antitrust laws, 248–250Application systems, 199Applications controls, 240Applications of PERT/CPM, 305Applications software failures, 208Appraisal costs – COQ, 94Arbitrator – labor relations, 115Assembly time – production, 48Assessment center – employee, 107Asset management ratios – financial statements, 137Assurance services – IT, 220Attribute chart – SPC, 99Attribute control chart – SPC, 99Audit process, 260Authority – management, 11Autocratic leader, 14Automated teller machines (ATMs), 234Automatic stabilizers – economy, 331Availability of system and data – IT, 220Average cost, 141Average fixed cost, 321Average profit per unit, 321Average total cost per unit, 321Average total cost, 321Average variable cost, 321Avoidable cost, 142
B
Backbone – network, 215Backsourcing – procurement, 64Backup methods – IT, 202Balance sheet limitations, 126Balance sheet, 122, 125, 134Balanced scorecard system – management, 21Brand extension, 75Bank loans, 164Bankruptcy laws, 251
339

JWBT150-Vallabhaneni ind August 7, 2009 18:59
340 Index
Bar-coding systems, 68Basic probabilities, 312Basic statistics, 312BATNA – negotiations, 32BCG matrix model vs. GE model, 9BCG matrix model:
Cash cows, 9Dogs, 9Stars, 9Question marks, 9
Benchmarking, 101–102Benefit-cost analysis (BCA), 175Benefit-cost-ratio (BCR), 173Benefit-investment ratio (BIR) method, 174Best practices, 101Beta (market) risk, 178Big Q, little q, 93Bill of material (BOM) – production, 58Bivariate analysis, 320Black belts – Six-Sigma, 96Blue-ocean strategy, 7Blue-team testing – IT security, 222Board independence, 259Board of directors (BODs), 256Bond prices vs. interest rates, 166Bond valuation, 182Bonds and notes, 128Bonds, 165Book value model, 183Bottleneck inflation, 329Brainstorming – problem solving tool, 24Brand dilution, 75Brand elements, 72Brand equity, 73, 75Brand value, 72–73Branding and packaging, 88Breakdown maintenance, 65Breakeven market share, 83Breakeven point (BEP), 148Bridges – network, 215Brouters – network, 215Budgeted cost, 141Buffer management – TOC, 62Bumping procedures – union, 104Business ethics, 253Business combinations – accounting, 132Business entity concept – accounting, 120Business games – employee, 110Business impact analysis (BIA) – disaster recovery and risk,
201, 243Business laws, 247Business policy, 252Business process improvement (BPI), 101Business process redesign (BPD), 101Business process reengineering (BPR), 101Business valuation, 183
C
Call option – stocks, 168Capability ratio – SPC, 99
Capacity mixing options – production:Chase, 60Level, 60Mixed, 60
Capacity requirements planning (CRP), 60Capacity utilization – production, 60Capital asset pricing model (CAPM) approach, 170Capital budgeting errors – accept or reject, 172Capital budgeting international, 178Capital budgeting, 171Capital rationing, 178Captive insurance method, 182Career development plan, 113Career development programs, 113Career development, 112Career path, 112Career security, 113Cash budget, 154Cash conversion cycle model, 160Cash flow risk, 178Cash kiting, 157Cash lapping, 265Cash management model – Miller-Orr, 318Cash management techniques, 159Cash management, 158Cash presentation on the balance sheet, 157Cash skimming, 265Cash-basis accounting, 122Cause-and-effect diagram – QC tool, 97Centralized control, 238Centralized organization, 13Chain of command – management, 11, 22Chain-weighted index – prices, 327Change and problem management – IT, 211Change management – project, 301Change management risk – project, 290Channel operating efficiency, 83Channel performance, 83Channel’s cost per customer transaction, 82Channel’s transaction value, 82Charismatic leader, 16Check float, 157Check lapping, 157Check sheets – QC tool, 97Checklists, 222Check-summing software, 221Classical economists, 325Closed system, 13Cluster analysis, 320Coaching, 111Cobranding, 75Coincident indicators – economics, 333Collaboration vs. compromise, 31Combination controls, 240Commercial paper – finance, 164Committed cost, 143Common cost, 141Common equity, 167–168Common Internet services, 229Common size analysis – financial statements, 136Common stock valuation, 183

JWBT150-Vallabhaneni ind August 7, 2009 18:59
INDEX 341
Communication barriers, 34Communication chain, 33Communication defined, 33Communication effectiveness, 35Comparative ratios – financial statements, 136Compensating controls, 240Competitive markets, 77Competitive strategies, 6Competitor analysis, 73Complementary controls, 240Compliance costs and benefits, 252Compliance management, 251Compliance process, 251Composite economic index, 333Composite leading indicators, 335Compromise vs. collaboration, 31Computer controls, 240Computer equipment preventive maintenance,
210Computer integrated manufacturing (CIM), 68Computer job scheduling practices, 208Computer network types, 211Computer operations, 209Computer production control procedures, 208Computer production job turnover procedures, 208Computer security audit, 262Computer security practices, 219Computer system logs, 210Computer-aided design (CAD), 68Computer-aided manufacturing (CAM), 68Concentrators – network, 216Conceptual skill – management, 17Concurrent control, 20Concurrent control, 238Concurrent engineering, 92Confidentiality of data and system information – IT,
220Configuration management – IT, 197Configuration management – IT, 222Conflict defined, 35Conflict resolution techniques, 37Conflict triggers, 37Conjoint analysis – forecasting, 317Connectivity hardware, 214Console operations – computer, 209Consolidated financial statements, 132Construction audit, 260–261Consumer price index (CPI), 326–327Consumer product safety laws, 250Consumer research models, 320Contingency plan – disaster recovery, 206Contingency plan exercises – disaster recovery, 207Contingency plan maintenance – disaster recovery,
207Contingency plan testing – disaster recovery, 206Contingency plan training – disaster recovery, 206Contingency planning process- disaster recovery, 201Continuous improvement – quality, 92Continuous process improvement (CPI), 101Contract audit, 260–261Contract defined, 247–248
Contractionary fiscal policy, 330Contradictory controls, 240Contribution margin (CM) method, 148–149Control assessment, 241Control characteristics, 236Control chart – QC and SPC tool, 97–98Control costs and benefits, 237Control design, 236Control implementation, 237Control placement, 236Control requirements, 241Control responsibilities, 241Controllable cost, 142Controlling defined, 19Controls classification, 237Controls over cash, 157Controls-by-action, 239Controls-by-interaction, 240Controls-by-location, 238Controls-by-nature, 237Controls-by-strength, 239Conversion cost, 141Convertible bonds, 166Corporate audits, 260Corporate culture, 281Corporate fraud, 263–264Corporate governance standards, 256–257Corporate governance, 256Corporate social responsibility, 253–255Corrective controls, 240Correlation analysis – forecasting, 47Correlation diagram – QC tool, 97Cost and schedule risk – project, 291Cost behavior concepts, 141–143Cost behaviors and patterns, 143Cost center, 152Cost concept – accounting, 120Cost of a lost sale, 77Cost of capital issues, 171Cost of common stock, 170Cost of debt, 169Cost of goods sold, 123Cost of preferred stock, 169Cost of quality (COQ), 92, 94Cost of retained earnings, 170Cost-benefit analysis (CBA), 175, 244Cost-effectiveness analysis (CEA), 176Cost-of-living adjustment (COLA), 327Cost-push inflation, 329Cost-volume-profit (CVP) analysis, 148CPM and PERT, 303–304CPM/PERT applications, 305Credit derivatives, 180Credit swaps, 180Creeping inflation, 329Critical path method (CPM), 303Critical path, 304Critical-to-quality (CTO) technique, 94Cross-cultural negotiations, 283Cross-exchange rate – foreign, 280Crossover chart – cost and volume, 48

JWBT150-Vallabhaneni ind August 7, 2009 18:59
342 Index
Cultural awareness learning program, 283Cultural training – international, 281Currency futures contract, 280Currency options, 179, 280Currency swaps, 180, 280Current assets, 126Current cost, 141Current liabilities, 126, 160Customer loyalty score, 78Customer relationship management (CRM), 59Customer response index (CRI), 84Customer retention rate, 77Customer service quality, 83Customer value, 82Customer’s needs – marketplace:
Delighted, 94Dissatisfied, 94Satisfied, 94
Customer-reach, 83CVP assumptions and limitations, 148Cycle counting, 56Cycle sock, 53Cycle time, 55Cyclical unemployment, 328
D
Data and systems backup – IT, 202Data control procedures – IT, 208Data integrity, 200Data marts – database, 227Data mining – database, 227Data modeling – database, 227Data origination, preparation, and input, 199Data output, 200Data processing, 199Data sharing- database, 223Data views – database, 223Data warehouse – database, 227Database – computer, 223Database design approaches, 224Database management system (DBMS), 223Debentures – bonds, 166Debt management ratios – financial statements,
137Debt types, 163Decentralized control, 238Decentralized organization, 13Decision analysis models, 313Decision defined, 24Decision making vs. problem solving, 25Decision sciences, 311Decision table, 64Decision tree, 65, 84, 313Decision types, 25Decision-making in MNCs, 270Decision-making models, 24Decision-making process, 24Decision-making under certainty, 314Decision-making under conflict or competition, 316Decision-making under risk, 314
Decision-making under uncertainty, 315Defense-in-depth strategy – IT security, 218Deflation, 327Degree of fraud, 264Delegation, 11, 19, 111Demand forecasting, 46Demand-pull inflation, 329Democratic leader, 14Dependency risk – project, 290Dependent demand inventory systems, 53Derivative securities, 180Deseasonalized time-series – forecasting, 318Design capacity – production, 60Design for manufacturability, 151Design for Six Sigma model (DCOV), 95Design of experiments (DOE), 98Design-to-cost, 151Detective controls, 239Deterministic data – decision making, 25Devaluation of currency, 280Devil’s advocate, 25Differential analysis, 150Differential costs, 143, 150Differential income or loss, 150Differentiation strategy, 6Diffusion index – industry growth, 333Direct cost, 141Directive controls, 239Discounted abnormal earnings model, 184Discounted cash flow (DCF) model, 184Discretionary cost, 142Discriminant analysis, 320Diseconomies of scale, 322Disparate treatment – diversity, 106Displaced cost, 142Distributed data model – database, 226Distribution requirements planning (DRP), 59Distribution system, 57Diversification strategy, 5Divestiture – business, 3, 186Dividend payment procedures, 189Dividend policy in practice, 188Dividend policy in theory, 187Division of labor, 11Double-entry accounting system, 122Downsizing, 3, 103Downtime – equipment, 65Downward communications, 34Dual branding, 75Due-diligence audit, 261Dysfunctional conflict, 36
E
Earned value management (EVM) technique – project,300
Earnings per share (EPS), 124E-commerce infrastructure, 232E-commerce software, 232Economic analysis, 244Economic and financial risks – project, 290

JWBT150-Vallabhaneni ind August 7, 2009 18:59
INDEX 343
Economic business cycles:Peak, 333Recession, 333Recovery, 334Trough, 334
Economic cost, 321Economic entity assumption – accounting, 120Economic growth, 326Economic implications of competition, 322Economic implications of demand and supply, 323Economic implications of economic growth, 326Economic implications of employment, interest rates, and
investment theories, 325Economic implications of labor economics, 325Economic implications of monopolies, 324Economic implications of monopolistic competition,
324Economic implications of oligopolies, 324Economic implications of perfect competition, 323Economic implications of structure of product markets,
325Economic implications of utility, 323Economic order quantity (EOQ) – inventory, 53–54Economic profit model, 184Economic profit, 321Economic-value-added (EVA) model, 20, 184, 321Economies of scale, 322Economy defined, 43EDI system, 232–233Effective capacity – production, 60Effectiveness defined, 43Effects of international cultures, 282Efficiency defined, 43Electronic business (e-business), 230Electronic commerce (e-commerce), 230Electronic data interchange (EDI) security issues, 231Electronic funds transfer (EFT) system, 233E-mail security issues, 231Embezzlement, 265Embodied cost, 142Empirical decision models, 24Employee attitude survey, 116Employee development, 109Employee disciplinary actions, 114–115Employee exit interviews, 116Employee feedback, 116Employee firing errors, 115Employee fraud symptoms, 265Employee hiring errors, 107Employee orientation, 110Employee performance appraisal system factors, 113Employee resignation, 115Employee selection process, 106Employee survey feedback, 112Employee termination, 115Employee training, 109Employment interview, 108Employment laws, 251Employment tests, 107Employment-at-will doctrine, 114Engineered cost, 143
Enterprise resource planning (ERP), 59Enterprise risk management (ERM) program, 246Entrepreneurs vs. leaders vs. managers, 19Entrepreneurs, 19Environmental quality engineering, 93Environmental laws, 250Equipment maintenance, 65Equity types, 167Equivalent uniform annual cost (EUAC), 173Escalation of commitment – decision, 32European union (EU), 278–279Evaluating training and development (T&D) programs,
110Excess reserves – banks, 332Exchange rate risk, 178Executive orientation, 110Expansionary fiscal policy, 330Expectancy theory, 21Expectancy-value model (EVM), 72Expected monetary value (EMV), 65, 315Expected value analysis – risk, 245Expected value of perfect information (EVPI), 314Expired cost, 141Exponential smoothing – forecasting, 317Exporting/importing, 272External auditors, 260External failure costs – COQ, 94External opportunities – environment, 4External threats – environment, 4Extranet, 230
F
Facets of decision making, 24Feedback control, 20, 238Feed-forward control, 20, 238Financial analysis model, 184Financial asset valuation, 182Financial audit, 260Financial breakeven analysis, 156Financial control, 156Financial engineering – risks, 181Financial instruments, 280Financial leverage, 156Financial plans, 154Financial statement analysis, 133Financial statement ratios limitations, 139Financial statement types, 122Financial transactions security issues, 231First-line managers, 18Fiscal multiplier, 331Fiscal policy, 330Fiscal policy lags:
Inside, 331Outside, 331
Fishbone diagram – QC tool, 97Five focusing steps – TOC, 63Five resources (5Ms) – organization, 92Fixed cost, 141Flexible budget, 152Flexible manufacturing systems (FMS), 67

JWBT150-Vallabhaneni ind August 7, 2009 18:59
344 Index
Floating-rate bonds, 166Flow diagram, 48Flowcharting – QC tool, 97Focus strategy, 7Food and drug administration laws, 250Force-field analysis – problem solving tool, 24Forecasting HR availability, 103Forecasting HR requirements, 103Forecasting models, 317Foreign currency transactions, 132Foreign direct investment (FDI), 274Foreign subsidiary, 274Foreign-exchange market, 280Foreign-exchange rate quote, 280Formal communications, 34Formal organization chart, 11Forward contracts, 179, 280Forward exchange rate, 280Forward logistics, 58Fraud – degree of, 264Fraud red-flags, 264Fraud types, 263–264Frictional unemployment, 328Full cost, 141Full employment, 328Full-volume backups – IT, 209Functional conflict, 35Functional managers, 18Functional-type-organization – project, 292–293Futures contracts, 179
G
Gains from trade, 275Game theory – decision, 316Gantt charts, 61, 306Gap analysis, 244Gateways – network, 214GDP deflator, 326GDP multiplier, 330GE model vs. BCG matrix model, 9GE model, 9General agreement on trade and services (GATS), 277General controls, 240General managers, 18Generally accepted accounting principles (GAAP), 121Global communication insights, 282Global manager’s dilemma, 282Global mindsets, 284–285Global operations, 3Global sourcing, 272Goal-setting theory, 22Going-concern assumption – accounting, 120Grand strategy, 2Grapevine – communication, 34Green belts – Six-Sigma, 96Grievance procedures- union, 115Gross domestic product (GDP), 326Gross margin or profit, 149Gross national product (GNP), 325–327
Gross rating points (GRPs) – advertising, 84Group behaviors, 26Group cohesiveness, 28Group development stages, 26–27Group dynamics, 25Group effectiveness, 27Group or organizational conflict, 36Group polarization, 26Group structures, 28Groups and individuals, 27Groupshift, 26Groupthink, 26
H
Halo error – employee performance, 114Hard goods, 334Hard-controls, 239Hard-issues, 239Hard-skills, 239Heckscher-Ohlin (HO) theorem, 275Help-desk function, 210Herzberg two-factor theory, 21Heuristics – forecasting, 317Hidden financial reporting risks, 181Hierarchical data model – database, 225High-context cultural communications, 282Histogram – QC tool, 97Historical cost concept – accounting, 120Historical cost, 141Holding company, 187Horizontal communications, 34Horizontal hierarchy, 11Horizontal market, 87Horn error – employee performance, 114Hoshin planning – Japanese, 91House of quality (HOQ), 98Human capital metrics, 116–117Human capital risk – project, 290Human resource (HR) planning, 103Human resource planning process, 103Human skill – management, 17Hurwicz strategy – decision, 315Hyperinflation, 329HyperText Markup Language (HTML) – Web, 232
I
Implementation and operational risk – project, 289Implementing training and development (T&D) programs,
110Implicit cost, 143Importing/exporting, 272Imputed cost, 143In-basket training – employee, 110Income bonds, 166Income statement, 122–123, 133Incremental backups – IT, 209Incremental cash flows, 176Incremental change, 322

JWBT150-Vallabhaneni ind August 7, 2009 18:59
INDEX 345
Incremental cost, 142Indenture – legal document, 165Independent demand inventory systems, 52Indexed bonds, 166Indifference curves – economics, 323Indirect cost, 141Individual career planning, 112–113Individuals and groups, 27Industrial engineering, 92Industry growth levels:
Negative, 335Normal, 335Supernormal, 335Zero, 335
Inflation rate, 327, 331Inflation, 327–329Influence diagrams – decision, 313Informal communications, 34Informal organization chart, 11Information engineering – database, 228Information plans, 195Information security strategic plans, 217Information systems planning, 194–195Information technology (IT) function, 192Information transactions security issues, 231Insider trading scandals, 259–260Insourcing, 64Inspection priority index, 100Integrated service digital networks (ISDN), 213Integrity checkers – software, 221Integrity of system and data – IT, 219Intellectual property (IP) rights, 273Intellectual property laws, 250Interactive leader, 16Interest rates vs. bond prices, 166Internal auditors, 260Internal controls, 237Internal failure costs – COQ, 94Internal rate of return (IRR) method – modified,
175Internal rate of return (IRR) method – regular,
174Internal strengths – strategy, 4Internal weaknesses – strategy, 4International acquisition of materials, 281International businesses, 271International cultural training, 281International franchising, 274International labor-management relations, 281International licensing agreements, 273International logistics, 281International negotiations, 283–284International production strategies, 281International staffing policies:
Ethnocentric, 281Geocentric, 281Polycentric, 281
International strategies – types, 270–271International trade barriers, 273International trade, 272
Internet protocol (IP) – network, 228–229Internet security-related problems, 229Internet, 228Interrelationship digraph – QM tool, 97Inter-role conflict – groups, 28Interviewing methods – employee, 108Interviewing problems – employee, 108Intranet, 230Intrusion detectors – IT security, 221Inventory analysis – ABC system, 55Inventory asset valuation, 182Inventory conversion period, 160Inventory investment, 53Inventory levels, 53Inventory models, 313Inventory-related costs, 54Inverted file data model – database, 226Investment center, 152Investment securities laws, 250Ishikawa diagram – QC tool, 97ISO 14000 environmental standards, 93ISO 14001 environmental standards, 93ISO 9000 standards, 93IT acquisition plans, 195IT audit, 260IT general security plans, 218IT operational plan, 192, 194,195IT operations, 207IT planning framework, 192IT planning process, 194IT planning, 192IT plans assessment, 196IT security plans, 195IT security policy, 218IT strategic plan, 192–194IT strategies, 192IT tactical plan, 192, 194, 195IT training plans, 195
J
Jidoka – quality, 92JIT inventory, 51JIT layout, 52JIT partnerships, 51JIT philosophy, 92JIT production processing, 51JIT production, 50JIT purchasing, 50JIT quality, 51JIT scheduling, 51JIT strategy, 50JIT transportation, 51Job analysis, 104Job applicant acceptance rate, 106Job applicant pool, 106Job applicant selection ratio, 106Job applicant selection tests, 107Job applicant yield rate, 106Job description, 105

JWBT150-Vallabhaneni ind August 7, 2009 18:59
346 Index
Job design, 104Job enlargement, 105Job enrichment, 105Job order cost systems, 151Job rotation, 105, 111Job scheduling methods – production:
Backward, 161Forward, 161
Job sequencing methods – production:Critical ratio, 61EDD, 61FCFS, 61Johnson’s rule, 61LPT, 61SPT, 61
Job simplification, 105Job specification, 105Joint cost, 141Joint venture, 187, 274Junk bonds, 167
K
Kaizen – quality, 92Kanban system – production, 51Key economic indicators, 332Keynesian economists, 325Knowledge, skills, and abilities (KSAs), 21, 104, 109,
113
L
Lagging indicators – economics, 333Lapping of cash, 265Larceny, 265Law of comparative advantage, 275Law of one price – exchange rates, 280Leaders vs. managers vs. entrepreneurs, 19Leaders, 19Leadership categories, 16Leadership defined, 14Leadership grid, 14Leadership theories, 14Leading indicators – economics, 333Lean operations, 52Learning organizations, 109Learning-curve analysis, 63Leases, 129–130Level 5 leader, 16Leveraged buyout (LBO), 187Levers in process management, 66Lifetime value of a customer, 78Line managers, 18Linear programming (LP) models, 312–313Linear regression analysis – forecasting, 47Liquidation value model, 184Liquidation – business, 3Liquidity ratios – financial statements, 136Loading jobs – production, 61
Local-area network (LAN), 211–212Logical data model – database, 225Logistics – international, 281Logistics management, 57Long-run costs, 141Long-run supply curve – economics, 330Long-term debt, 165Long-term financing, 167Low-context cultural communications, 282Low-cost leadership strategy, 7
M
Machine selection – production, 64Make-or-buy analysis, 63Management controls, 20, 237Management defined, 17Management development (MD) process, 110Management fraud symptoms, 264–265Management functions, 10Management representation in audit, 265–266Management skills, 17Management types, 17Management, 256Management-by-objectives (MBO), 22Management-by-wandering around (MBWA), 34Manager’s information processing styles, 26Manager’s intuitive style, 26Manager’s thinking style, 26Managerial roles:
Informational, 18Interpersonal, 18Decisional, 18
Managers vs. leaders vs. entrepreneurs, 19Managers, 19Managing corporate risks, 246Manual controls, 240Manufacturing cycle efficiency (MCE), 48Manufacturing cycle time (MCT), 48Marginal benefit, 322Marginal change, 322Marginal cost, 141, 321Marginal profit, 321Marginal propensity to consume (MPC), 330Marginal propensity to save (MPS), 330Marginal revenue, 321Marginal-cost-of-capital (MCC), 171Market development index (MDI), 80Market development strategy, 5Market penetration strategy, 5Market share index (MSI), 80Market value ratios – financial statements, 139Marketable securities management, 161Marketable securities risks, 162Marketable securities selection criteria, 162Marketing budget, 85Marketing communications mix, 75Marketing engineering, 320Marketing mix, 72Marketing of services, 86

JWBT150-Vallabhaneni ind August 7, 2009 18:59
INDEX 347
Marketing portfolio analysis, 85Marketing profitability metrics, 80Marketing public relations (MPR), 84Marketing-related financial metrics, 86Market-value-added (MVA) model, 20, 184, 321Markov-process analysis – forecasting, 318Maslow’s needs hierarchy theory, 21Master black belts – Six-Sigma, 96Master production schedule (MPS), 58Matching concept -accounting, 120Material requirements planning (MRP), 58Materiality concept- accounting, 120Matrix diagram – QM tool, 97Matrix organization, 13Matrix-type organization – project, 293–294Metropolitan-area network (MAN), 211–212Maximax strategy – decision, 315Maximum allowable outage (MAO), 201McKinsey 7–S framework, 8Mean time between failures (MTBF), 65Measuring defined, 20Mechanistic structure – organization, 13Mediator – labor relations, 115Mentoring, 19, 111Merger analysis, 186Merger motives, 185Merger tactics, 185Merger types:
Beachhead, 185Congeneric, 185Conglomerate, 185Horizontal, 185Vertical, 185
Metadata management – database, 227Middle managers, 18Minimax regret strategy – decision, 315Minimax strategy – decision, 315Mission statement, 5Mixed cost, 141Monetary policy, 331Monetary policy lags:
Inside, 332Outside, 332
Monetary unit assumption – accounting, 120Money income, 329Money multiplier, 332Money supply – M1 and M2, 332Money transfer mechanisms, 159Monopoly firm, 322Monopsonistic competitor, 325Monopsony, 325Monte Carlo simulation, 177Mortgage bonds, 166Motivation defined, 21Motivation strategies, 22Motivation theories, 21Multicorporate networks, 213Multicriteria decision models, 321Multinational corporations (MNCs) models, 270Multivariate analysis, 320
N
Nash bargaining game – decision, 317Nash equilibrium – decision, 316Natural variation – SPC, 98Nearshoring – procurement, 64Negligent hiring, 109Negligent referral, 109Negligent retention, 109Negotiation defined, 30Negotiation elements, 30Negotiation modes, 31Negotiation process, 30Negotiations – cross-cultural, 283Negotiations – international, 283–284Negotiations Do’s and Don’ts, 31Net cash flows, 176Net marketing contribution (NMC), 78, 79, 83Net national product (NNP), 326Net operating income (NOI), 156Net present value (NPV) method, 173Net present value model, 184Net promoter score – marketing, 78Net working capital, 160Network architecture, 217Network changes, 216Network data model – database, 226Network interface cards (NICs), 216Network interoperability, 217Network management, 216New-product development errors – drop/go, 76New-product development process, 75Nominal GDP, 326Nominal GNP, 326Nominal group technique – problem solving tool, 24Nominal income, 327, 329Nominal interest rate, 331Nominal value of money, 322Nominal wages, 325Noncontrollable cost, 142Non-current assets, 126Non-current liabilities, 126Nonrealistic conflict, 35Non-tariff barriers – trade, 273Non-zero-sum game – decision, 316Normative decision models, 24Norms – groups, 28North American free trade agreement (NAFTA), 278
O
Object data model – database, 226Objectivity concept – accounting, 120OECD business cycles:
Classical, 334Growth, 334Growth rate, 334
Off-balance sheet accounting practices, 181Offline quality control, 100Offshoring – procurement, 64

JWBT150-Vallabhaneni ind August 7, 2009 18:59
348 Index
Oligopsonistic competitor, 325Ombudsperson – labor relations, 115Online quality control, 100On-the-job (OJT) training, 110Open system, 13Open-book management, 20Operating breakeven analysis, 156Operating budget advantages, 146Operating budget benefits, 144Operating budget dimensions, 144Operating budget limitations, 146Operating budget preparation, 144Operating budget techniques 145Operating budget types, 145Operating budgets, 143Operating expenses, 123Operating leverage, 156Operational application systems, 198Operational audit, 260, 263Operational controls, 238Operational plan, 10Opportunity cost, 142, 176, 321Opportunity loss – decision, 316Optimal capital structure, 171Optimal order quantity, 54Option (choice) analysis – uncertainty, 244Order qualifier, 72Order winner, 72Organic structure – organization, 13Organization charts, 11Organization development (OD) intervention techniques,
111Organization development (OD) process, 111Organization structure, 11–12Organizational behavior defined, 38Organizational career planning, 112–113Organizational change defined, 39Organizational change resistance, 40Organizational change types, 40Organizational culture defined, 39Organizational decline defined, 41Organizational development defined, 41Organizational effectiveness defined, 41Organizational mission, 5Organizational objectives, 5Organizational or group conflict, 36Organizational portfolio plan, 5Organizational strategies, 5Organizational structures – MNCs, 269–270Organizing defined, 11Out-of-pocket cost, 142Outplacement – job, 104Output measurement criteria, 43Outsourcing – procurement, 64
P
Packaging and branding, 88Pareto diagram – QC tool, 97Pareto principle, 55Partnerships, 132
Password checkers – software, 221Pause strategy –stability, 3Payables deferred period, 161Payback method, 172Payoff tables – decision, 313, 316Penetration testing – IT security, 222Pensions, 130Perfectly competitive market, 322Performance audit, 262–263Performance measurement system design, 43Period cost, 141Personal conflict, 36Person-role conflict – groups, 28PERT and CPM, 303–304PERT/CPM applications, 305Phillips curve – economics, 328Physical data model – database, 225Plan-do-check-adjust (PDCA) cycle, 92Planning defined, 10Planning levels, 10Planning process, 10Planning tools, 10Planning types, 10Plant selection, 64Point-of-sale (POS) systems, 68Point-of-sale (POS) terminals, 234Poka-yoke – quality, 92Portfolio strategy – competitive, 8Portfolio techniques – competitive, 8Post audit of capital projects, 176Postcontrol, 238Post-exit questionnaires – employee, 116Precontrol, 238Pre-employment screening process, 108Pre-employment tests, 107Preferred stock valuation, 183Preferred stock, 168–169Prevention costs – COQ, 94Preventive controls – disaster recovery, 201Preventive controls – management, 239Preventive maintenance, 65Price multiple model, 184Price response analysis, 75Pricing methods, 73–74Pricing strategies, 73Prime cost, 142Principle of constant returns, 322Principle of diminishing returns, 322Prioritization matrices – QM tool, 97Prisoner’s dilemma – decision, 316Privacy and security risk – project, 291Privacy audit, 262Pro forma balance sheet, 155Probabilistic data – decision making, 25Problem and change management – IT, 211Problem defined, 23Problem solving vs. decision making, 25Problem-solving process, 23Process capability – SPC, 99Process capability index (PCI) – SPC, 99Process chart, 48

JWBT150-Vallabhaneni ind August 7, 2009 18:59
INDEX 349
Process control systems, 68Process cost systems, 151Process decision program chart – QM tool, 97Process management levers, 66Process management methods, 101Process management tools, 101Process mapping tools, 97Process mapping, 48Process time – production or service, 48Process variation causes – SPC, 98Producer price index (PPI), 326–327Product audit, 89Product classification, 87Product cost, 142Product definition, 87Product development strategy, 5Product lifecycle concept, 88Product line, 88Product management, 87Product mix, 88Product profitability, 88Product quality decision – go/no-go, 99Product research and development (R&D) costs,
130–131Product variability, 50Product’s lifecycle cost, 81Product’s relative performance, 81Product’s relative price, 81Product-by-value analysis, 49Production economics, 63Production metrics, 66Production possibilities curve – economics, 328Production process flows, 66Production scheduling methods, 61Production strategies – international, 281Production strategies, 47Production strategy tools, 48Productivity defined, 42Productivity improvement criteria, 42Productivity improvements, 43Productivity measurement components, 42Productivity measurement guidelines, 43Profit center, 152Profit models, 320Profitability index (PI) method, 173Profitability ratios – financial statements, 138Profit-push inflation, 329Program evaluation and review technique (PERT),
303Project assumptions, 297Project baseline, 288, 297Project cash flows, 176Project champions – Six-Sigma, 96Project change management, 301Project communication, 302Project contingencies, 298Project controlling methods, 300Project controlling, 297Project cost control, 300Project cost models, 307Project course corrections, 302
Project crashing, 304Project critical success factors (CSFs), 288Project deliverables, 297Project dependencies, 298Project earned value management (EVM) technique,
300Project estimating methods, 298Project float, 306Project free slack time, 306Project governance mechanisms, 309Project indicators, 307–308Project lifecycle, 294–296Project management audit, 309–310Project management defined, 287Project management metrics, 307Project management problems, 308–309Project management process, 294Project management risk, 290Project manager, 18, 294Project milestones, 297Project network diagrams, 298Project organization, 292Project oversight board, 309Project performance measures, 288Project plan, 296Project planning methods, 297Project planning, 297Project progress, 302Project quality control, 300Project quality, 299Project reporting methods, 301–302Project resources, 299Project risk assessment, 177Project risk management plan, 291Project risk types, 289–291Project risks, 298Project safety factor, 306Project scheduling, 297Project scope, 298Project slack time, 306Project steering committee, 309Project structures – advantages and disadvantages,
294Project structures, 291Project success criteria, 288Project time control, 300Project time, 298Project total slack time, 306Project-bid errors, 295Project-type-organization, 293Protocol converters – IT, 214Proxy fight – stockholder votes, 168Proxy process – stockholder votes, 266Pull strategy-marketing expenses, 82Pull system – manufacturing and distribution, 52Pull system – throughput, 50Pull technology – IT, 229Purchasing power parity – exchange rates, 280Pure inflation, 329Push strategy-marketing expenses, 82Push system – manufacturing and distribution, 52

JWBT150-Vallabhaneni ind August 7, 2009 18:59
350 Index
Push system – throughput, 50Push technology – IT, 229Put option – stocks, 168Putable bonds, 166
Q
Qualitative methods in risk management, 245Quality assurance, 91Quality at the source, 101Quality audit, 91, 261Quality circles, 91, 112Quality concepts, 91Quality control (QC) circles, 22Quality control (QC) tools, 97Quality control, 91Quality cost index – COQ, 94Quality council, 92Quality definitions:
Judgment-based, 93Manufacturing-based, 94Product-based, 94User-based, 94Value-based, 94
Quality drivers, 93Quality engineering, 91, 100Quality function deployment (QFD), 98Quality improvements, 92Quality inspection, 100–101Quality loss function (QLF), 91, 100Quality management (QM) tools, 97Quality of service – VoIP, 213Quality planning, 91Quality robustness, 100Quality tools, 97Quantitative methods in business, 311Quantitative methods in risk management, 245Queuing or waiting-line models, 313
R
Rated capacity – production, 60Real GDP – economy, 326Real GNP – economy, 326–327Real income, 327, 329Real interest rate, 331Real value of money, 322Real wages, 325Realistic conflict, 35Reality checks, 25Receivables conversion period, 161Reciprocal agreements – disaster recovery, 204Recovery controls, 240Recovery strategies, – disaster recovery, 202Recovery time objective (RTO), 201Recruiting cost per hire, 106Recruitment factors, 105Recruitment for diversity, 106Recruitment methods, 105Recruitment sources, 105
Red flags – fraud, 264Red-ocean strategy, 7Red-team testing – IT security, 222Redundant arrays of independent disks (RAID),
202Regional cultures – national and international,
282Regional groups – international trade, 279Regression analysis – forecasting, 317Relational data model – database, 225Relevant costs, 150Reorder point – inventory, 55Repeaters – network, 215Replacement cost model, 184Replacement cost, 143Required reserves – banks, 332Reserve ratio – banks, 332Responsibility accounting, 152Responsibility – management, 11Restrictive covenants – bonds, 165Restructuring – organization, 103Retailer’s transaction value, 82Retrenchment, 3Return on quality (ROQ), 96Return on training (ROT), 110Revaluation of currency, 280Revenue center, 152Revenue management – service, 60Revenue recognition concept – accounting, 121Reverse auctions in e-commerce, 231Reverse innovation – marketing, 76Reverse investment, 274Reverse logistics, 58Reverse marketing, 58Reverse mentoring, 111Reverse purchasing, 58Reverse-splits – stocks, 189Rework cost, 143Rightsizing – organization, 103Risk assessment, 241–242Risk avoidance control, 241Risk evaluation, 241, 243Risk management tools, 243Risk management, 241Risk management methodology, 242Risk mitigation, 241–242Risk, 241Role-playing – employee, 110Roles – groups, 28Roles of senior executives, 258–259Roles of the BODs, 257–258Roles of the CEOs, 258–259Routers – network, 215Rules of behavior, 221
S
Saddle point for competitors – decision, 317Safety audit, 262Safety stock, 53

JWBT150-Vallabhaneni ind August 7, 2009 18:59
INDEX 351
Savings investment ratio (SIR) method, 174Scalar principle – management, 11Scatter diagram – QC tool, 97Scenario analysis, 177Seasonalized time-series – forecasting, 318Secure electronic transactions (SET), 232Securitizations, 181Security audit -IT, 222Security concepts in planning, 218Security considerations in SDLC, 198Security controls and safeguards, 221–222Security goals and objectives, 219–220Security-in-depth strategy – IT, 218Segregation of duties, 211Self-managed teams, 22Senior champions – Six-Sigma, 96Sensitivity analysis, 177, 244, 319Sensitivity training (T-group training), 112Separation of duties, 211Separation of ownership from control, 266Sequential engineering, 92Servant leader, 16Service blueprinting, 48Service characteristics:
Inseparability, 86Intangibility, 86
Service marketing obstacles, 87Service quality, 86–87Service-level agreement (SLA) – disaster recovery,
204Service-level management – IT, 211Seven Ss (7Ss) in production, 50Share development index (SDI), 81Shareholders, 256Shareholders’ equity, 126Short-run cost, 142Short-run supply curve – economics, 330Short-term debt, 163Short-term financing, 165Simple moving-average – forecasting, 317Simple ratios – financial statements, 320Simulation models, 319Single points of failure – IT security, 218Single ratios – financial statements, 136Sinking fund – debt, 165Situation analysis, 3Situational leadership theory, 15Six-Sigma improvement model (DMAIC), 95Six-Sigma players, 96Six-Sigma, 94Skimming cash, 265Slowing cash disbursements, 159Smoothing constant (beta) – forecasting, 317Soft goods, 334Soft-controls, 239Soft-issues, 239Soft-skills, 239Software metering product, 222Software quality assurance (QA) libraries, 208Source inspection, 100–101
Sources of cash, 154Sovereignty risk, 179Span of control – organization structure, 12Span of management – organization structure, 12Speeding cash collections, 159Spinoff – assets, 186Stable and unstable processes – SPC, 99Staff managers, 18Staffing policies – international, 281Stagflation, 330Stakeholder empowerment, 92Standard cost, 142Standard costing, 151Statement of cash flows, 123, 127, 135Statement of retained earnings, 122, 124, 134Statement of shareholders’ equity, 122, 125Statistical process control (SPC) methods, 98, 318Step cost, 142Stock-dividends, 189Stock-repurchases, 189Stock-splits, 189Strategic business units (SBUs), 8Strategic control, 4Strategic initiatives, 193–194Strategic management defined, 2Strategic management process, 2Strategic objectives – international, 271Strategic plan, 10Strategic planning process, 5Strategic planning, 3Strategic risk – project, 290Strategy formulation, 3Strategy implementation, 4Structural inflation, 329Structural unemployment, 328Structured query language (SQL) – database, 227Subjective scoring – risk, 245Success-failure analysis, 25Succession planning – employee, 112Sunk cost, 142, 176, 321Supplier certification, 57Supplier’s breakeven analysis, 63Supply chain, 56Supply shock – recession, 330Switches – network, 216SWOT analysis – company assessment, 244Symptoms of employee fraud, 265Symptoms of management fraud, 264–265Synectics – problem solving tool, 24Synthetic leases, 181System analyzers, 222System backups, 209System development lifecycle (SDLC):
Development/acquisition phase, 197Disposal phase, 197Implementation phase, 197Initiation phase, 196Operations/maintenance phase, 197
System documentation, 200System logs – IT, 210, 222

JWBT150-Vallabhaneni ind August 7, 2009 18:59
352 Index
System redundancy, 66System reliability, 65System security plans, 218Systems analysis – problem solving tool, 24Systems and data backup – IT, 202
T
Tactical objectives – international, 271Tactical plan, 10Target costing, 151Tariffs – trade, 273TCP/IP framework – network, 228–229Team building methods:
Adjourning, 29Forming, 29Norming, 29Performing, 29Storming, 29
Team building, 112Technical controls, 238Technical skill – management, 17Technology risk – project, 289Technology transfer, 274Term loans, 165Terms-of-trade index, 276Terms-of-trade, 275Theory of comparative advantage, 275Theory of Constraints (TOC), 62Theory T employees, 18Theory T+ employees, 18Theory X employees, 18Theory Y employees, 18Theory Z employees, 18Throughput – production, 49–50Time value of money, 319Time-series models – forecasting, 46Top managers, 17Total leverage, 156Total productive maintenance (TPM), 65Total quality management (TQM), 93Total revenue, 322Total throughput, 48Toyota production system, 52Trade credit, 163Traditional costing systems, 151Traditional innovation – marketing, 76Training and development (T&D) delivery systems,
110Training and development (T&D) learning methods,
110Training and development (T&D) needs, 110Training and development (T&D) objectives, 110Trait leadership theory, 14Transactional leader, 16Transfer pricing criteria, 147Transfer pricing international, 147Transfer pricing methods, 147Transfer pricing, 146Transformational leadership theory, 16
Transmission control protocol (TCP) – network,228–229
Transnational strategy, 3Treasury bonds, 166Treasury stock, 189Tree diagram – QM tool, 97Trend analysis – financial statements, 136Type I statistical error – SPC, 99Type II statistical error – SPC, 99
U
Unavoidable cost, 142Uncommitted cost, 143Unemployment, 328Unexpired cost, 142Unit-of-measure concept – accounting, 120Unity of command, 11Unstable and stable processes – SPC, 99Uptime- equipment, 65Upward communications, 34Uses of cash, 154
V
Value analysis, 48Value engineering, 48Value index, 49Value research, 48Value/price ratio, 82Value-added network (VAN), 212, 231Value-based location strategy, 49Values – groups, 28Value-stream mapping, 48–49Variability – product, 50Variable chart – SPC, 98Variable control chart – SPC, 99Variable cost, 142Variable costing method – production, 140Vendor agreements – disaster recovery, 205Vertical hierarchy, 11Vertical market, 87Virtual leader, 16Virtual networks, 213Virtual private network (VPN), 212, 230Virtual teams, 30Virus scanners, 221Visionary leader, 16Voice communication networks – VoIP, 213Voice of the customer (VOC), 98
W
Wage-push inflation, 329Waiting-line or queuing models, 313Wald criterion in decision making, 317Warehouses, 57Warrant options – stock, 166, 168, 180Web management issues, 230Weighted moving-average – forecasting, 317

JWBT150-Vallabhaneni ind August 7, 2009 18:59
INDEX 353
Weighted-average-cost-of-capital (WACC), 171White belts – Six-Sigma, 96Wide-area network (WAN), 211–212Work breakdown structure (WBS) – project, 298, 306Working capital asset investment policies:
Relaxed, 161Restricted, 161Moderate, 161
Working capital financing policies:Aggressive, 161Conservative, 161Maturity matching, 161
Working capital, 160Working stock, 53
World intellectual property organizations (WIPO),277
World trade organization (WTO), 276–277
Y
Yellow belts – Six-Sigma, 96Yield management – service, 60
Z
Zero-coupon bonds, 167Zero-sum game – decision, 316

General Management • Leadership • Strategy • Operations •Marketing • Quality and
Process • HR • Accounting • Finance • IT • Corporate Control • Business Law • Eth-
ics • Corporate Governance • International Business • Project Management • Deci-
sion Sciences • Economics • General Management • Leadership • Strategy • Opera-
tions •Marketing • Quality and Process • HR • Accounting • Finance • IT • Corporate
Control • Business Law • Ethics • Corporate Governance • International Business
• Project Management • Decision Sciences • Economics • General Management •
Leadership • Strategy • Operations •Marketing • Quality and Process • HR • Ac-
counting • Finance • IT • Corporate Control • Business Law • Ethics • Corporate
Governance • International Business • Project Management • Decision Sciences •
Economics • General Management • Leadership • Strategy • Operations •Market-
ing • Quality and Process • HR • Accounting • Finance • IT • Corporate Control •
Business Law • Ethics • Corporate Governance • International Business • Project
Management • Decision Sciences • Economics • General Management • Leader-
ship • Strategy • Operations •Marketing • Quality and Process • HR • Accounting •
Finance • IT • Corporate Control • Business Law • Ethics • Corporate Governance
• International Business • Project Management • Decision Sciences • Economics
• General Management • Leadership • Strategy • Operations •Marketing • Quality
and Process • HR • Accounting • Finance • IT • Corporate Control • Business Law
• Ethics • Corporate Governance • International Business • Project Management
• Decision Sciences • Economics • General Management • Leadership • Strategy
• Operations •Marketing • Quality and Process • HR • Accounting • Finance • IT •
Corporate Control • Business Law • Ethics • Corporate Governance • International
Business • Project Management • Decision Sciences • Economics • General Man-
agement • Leadership • Strategy • Operations •Marketing • Quality and Process •
HR • Accounting • Finance • IT • Corporate Control • Business Law • Ethics • Cor-
porate Governance • International Business • Project Management • Decision Sci-
ences • Economics • General Management • Leadership • Strategy • Operations
•Marketing • Quality and Process • HR • Accounting • Finance • IT • Corporate
Control • Business Law • Ethics • Corporate Governance • International Business
• Project Management • Decision Sciences • Economics • General Management •
Leadership • Strategy • Operations •Marketing • Quality and Process • HR • Ac-
counting • Finance • IT • Corporate Control • Business Law • Ethics • Corporate
Governance • International Business • Project Management • Decision Sciences •
Economics • General Management • Leadership • Strategy • Operations •Market-
ing • Quality and Process • HR • Accounting • Finance • IT • Corporate Control •
Business Law • Ethics • Corporate Governance • International Business • Project
Management • Decision Sciences • Economics • General Management • Leader-
4-COLOR GLOSSY
Geneerraal Managgeemmeenntt • Leadership • Strategy • Operatiioonnss •Markettiinng • Quality and
Prroocess • HHRR • Accountinngg •• FFiinnaannce • IITT • CCoorrppoorraatte Controll • Busineesss Law • Eth-
iics • Coorrporate GGoovernance • International Business • PPrrooject MMaanagemeent • Deci-
sion SScienceess • Econommiiccss • GGeneral Managemenntt • Leadersshhip • Sttrrategy •• Opera-
tionnss •Marrkketing • QQuality and Process • HR • Accountinngg • Finaannce • ITT • Corppoorate
Conntrol • Busineess Law • EEtthhiiccss • CCorporattee GGoovernance •• Internnaationaall Businneess
• PProjectt Manaagement ecision Sciences • Econ ics • eeneral MManaggementt •
Leaadershhip • SStrateg • Operations •Marketing • Qu y and PProcessss • HRR • Acc--
couunting • Finaance • • Corporate Control • Business aw • EEtthics •• Corpporate
Goveernancce • Innternat nal Business • Pro ect Mana eme • Deciision SSciencces •
Econoomics • Genneral nagement • Leadership • Strategy Operaationss •Marrket-
iing • QQualityy and Proce • HR • Accounting • Finance • IT Corpoorate CContrrool •
BBusinesss Laww • Etthhics • orporate Governance • Internationaal Businness •• Projeect
Maanagemment • Deccision ciences • Economics • General Maannagemeent • Leaddeer-
shiipp • Sttrrategyy • Opperatio s •Marketing • Quality and Process • HR • Accountingg •
Finaance •• IT • Corpoorate ntrol • Business Law • Ethics • Coorrporatee Goveernannce
• Innternattionall Business • Project Management • Decision Scciences • Ecoonomiics
• Geenerall Manaagement • adership • Strategy • Operations ••Marketting •• Quallity
andd Proceess • HR • Accou ting • Finance • IT • Corporate Conntrol • Businness LLaw
• Etthics •• Corpporate Gov nance • International Business • PProjectt Manaagemment
• Deecisioon Scieencess • Ec omics • General Management • eeadershhip • Strattegy
• OOpperatiions ••Markeeting Quality and Process • HR • Accounnting • Finannce • IT •
Corrporatee Conntrol •• Busin ss Law • Ethics • Corporate Gove nance • Inteernatioonal
Bussiness • Prooject MMana ment • Decision Sciences • Economics •• Genneral MMan-
ageement • Leaadershhip • S ate • O erations •Marketin • Qualityy and Proceess •
HR • Accoountinng • FFinanc • IT • Corporate Control • Busin ss Laww • Ethhics • Cor-
porraate Goovernaance •• Inter ational Business • Project Man ementt • Deecisionn Sci-
enccees • EEconomics • Gen al Management • Leadership Strateegy • OOperaationss
•Maarketinng • QQualityy and ocess • HR • Accounting • nance • IT •• Corpporatee
Conntrol • Businness LLaaw • Ethhiiccs • Corporate Governanccee • Interrnationnal Buusinesss
• Prroject Managgementt • Decisioonn SScciieenncceess • EEccoonnoommics • Genneeral MManageementt •
Leaddershipp • Strraategy •• Operations •Marketing • Quality anndd Procceess • HHR • AAc-
counntting • FFinancee • IT • CCoorrppoorate Control • Busineessss LLaw • Etthhics • CCorporraate
Goverrnnance •• Internaattiioonal Business • Project Management • DDecisionn Sciencces •
Econommiics • Geenneral Manageemmeenntt •• LLeeaaddeerrsshhiipp • SSttrraatteegy • Operaattiions •MMarket-
ing • Qualliittyy and Proocceess • HR • Accounting • Finance • IT • CCoorporate CControl •
Business Laww •• Ethics • Corporatte GGoveerrnnaannccee •• IInntternational Businneesss • Project
Management • Decciissiioonn Sciences • Economics • General Mannaaggement • Leader-
DEVI �VALLABHANENI
VA
LL
AB
HA
NE
NI
WHAT’S�YOURMBA IQ?
WH
AT’S�YOU
R�MBA
IQ?
A Manager’s Career Development Tool
A M
anager’s C
areer Developm
ent Tool
CALCULATE�YOUR�MBA�IQ�and achieve core competencies
in 12 functional areas of management
What’s your MBA IQ? A combination of what you know and how much you’ve applied this knowledge on the job, your MBA IQ is what defi nes your
management knowledge in today’s business climate. It’s what keeps you at the top of your profession, an expert in your specialized fi eld with an understand-ing, as well, of cross-functional disciplines.
Arming you with a solid foundation across the entire MBA curriculum to interact with colleagues, clients, senior management, and professors at a higher, more advanced level, international business expert Devi Vallabhaneni helps you get the most from MBA-level topics—and ultimately, develop your career.
This authoritative road map facilitates advanced management education and reveals a structured approach for career development in the management profession, equipping you with nuts-and-bolts coverage of:
• General management, leadership, and strategy
• Operations management
• Marketing management
• Quality and process management
• Human resources management
• Accounting
• Finance
• Information technology
• Corporate control, law, ethics, and governance
• International business
• Project management
• Decision sciences and managerial economics
The related self-assessment exercises available at www.mbaiq.com allow you to compute your MBA IQ. You can fi nd out where your weaknesses are and then begin to develop your knowledge base to gain profi ciency in all management areas and become a true business generalist.
Since the MBA degree has become a de facto standard in management education, the goal of What’s Your MBA IQ? is to make the knowledge contained in an MBA accessible to all business practitioners. As a result, this book is equally relevant to business practitioners, whether or not they pursue an MBA. Also, your organization can use What’s Your MBA IQ? to assess its business practitioners’ readiness for corporate rotation programs, high-potential programs, the CABM, the CBM, or an MBA degree.
DEVI VALLABHANENI, CABM, CBM,
CPA, is the
President and
CEO of the
Association of
Professionals
in Business
Management. Prior to founding
this nonprofi t and higher-
education organization,
she worked for Gap, Inc.,
in international business
development, as well as in Gap’s
online business development
where she was responsible for
devising expansion strategies
for Gap, Banana Republic, and
Old Navy brands. In addition,
she helped start and worked
with Arthur Andersen’s litigation
services practice at their
Singapore and Hong Kong offi ces.
She earned her MBA from the
Harvard Business School and
sincerely believes that sustained
career development begins with
knowledge development.
ISBN: 978-0-470-43957-9
$45.00 USA | $54.00 CAN