What’s Up? Staff gathering 17 March 2011. RESEARCH AND INNOVATION POLICY GUIDELINES FOR 2011-2015...
27
What’s Up? Staff gathering 17 March 2011
-
Upload
edwin-dixon -
Category
Documents
-
view
215 -
download
2
Transcript of What’s Up? Staff gathering 17 March 2011. RESEARCH AND INNOVATION POLICY GUIDELINES FOR 2011-2015...

What’s Up?
Staff gathering 17 March 2011

RESEARCH AND INNOVATION POLICY GUIDELINES FOR 2011-2015
Research and Innovation Council 17 December 2010
• Guidelines for necessary national actions and funding solutions starting from the next governmental term of office (2011-2015).
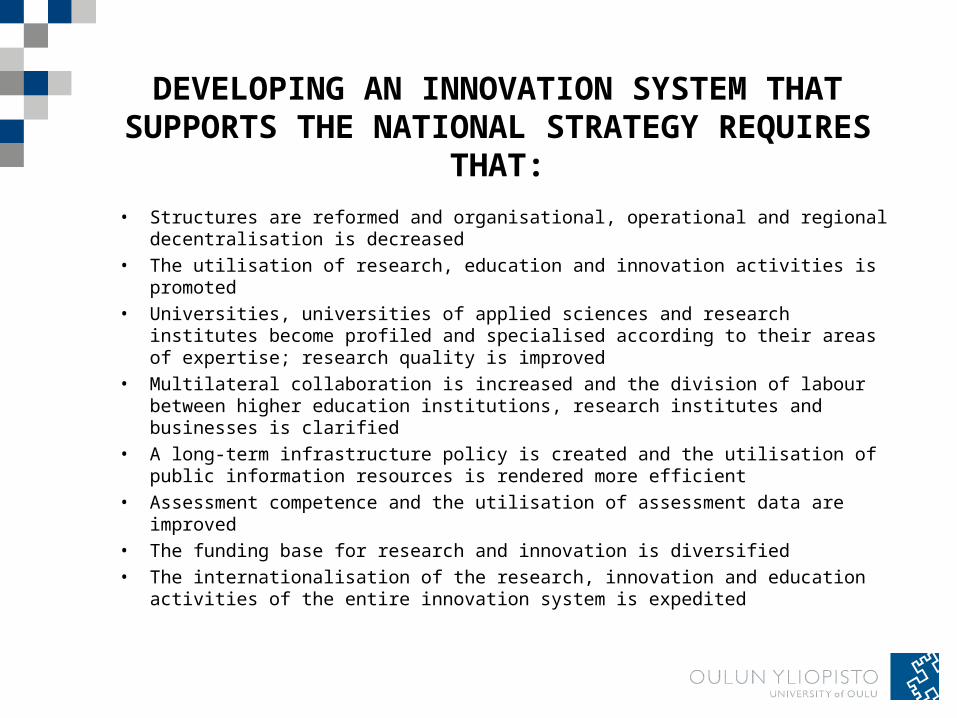
DEVELOPING AN INNOVATION SYSTEM THAT SUPPORTS THE NATIONAL STRATEGY
REQUIRES THAT:
• Structures are reformed and organisational, operational and regional decentralisation is decreased
• The utilisation of research, education and innovation activities is promoted• Universities, universities of applied sciences and research institutes
become profiled and specialised according to their areas of expertise; research quality is improved
• Multilateral collaboration is increased and the division of labour between higher education institutions, research institutes and businesses is clarified
• A long-term infrastructure policy is created and the utilisation ofpublic information resources is rendered more efficient
• Assessment competence and the utilisation of assessment data are improved
• The funding base for research and innovation is diversified• The internationalisation of the research, innovation and education activities
of the entire innovation system is expedited

Strategic development guidelines
• Higher education institutions, research institutes and high quality competence clusters will be improved with resources that become available when present structures and operations are dismantled
• Incentives towards business collaboration will be created for higher education institutions
• The efficient utilisation of the research results of the higher education institutions is improved: The research and innovation support services of the higher education institutions will be reorganised into larger wholes that improve competence
• The share of EU funding of the entire research and innovation funding of universities and research institutes will be doubled in the 2010s (5,8 % in 2009)
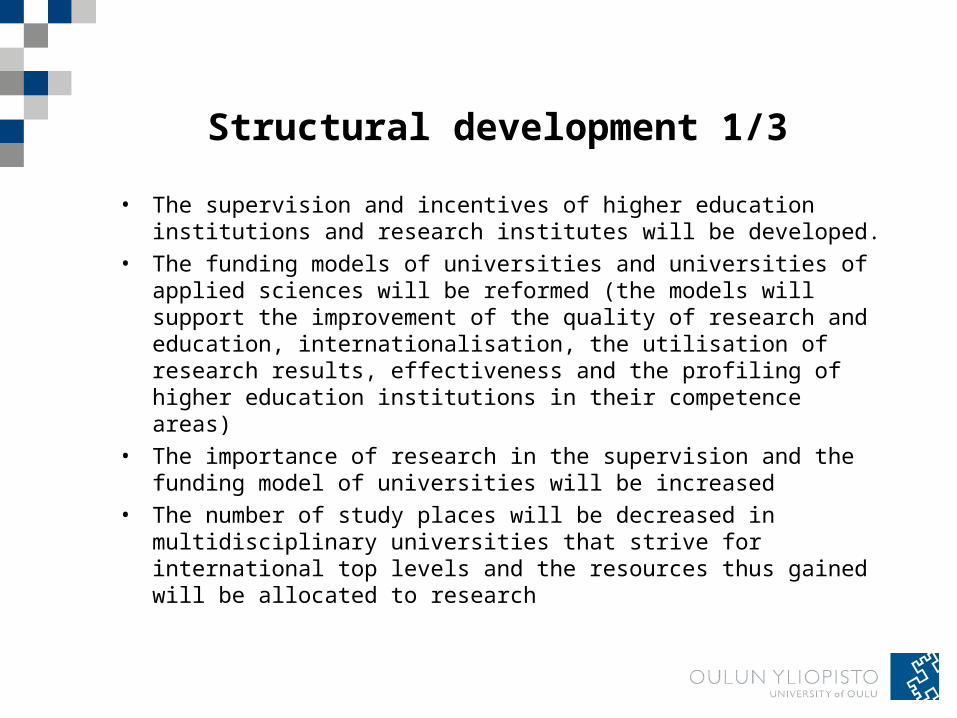
Structural development 1/3
• The supervision and incentives of higher education institutions and research institutes will be developed.
• The funding models of universities and universities of applied sciences will be reformed (the models will support the improvement of the quality of research and education, internationalisation, the utilisation of research results, effectiveness and the profiling of higher education institutions in their competence areas)
• The importance of research in the supervision and the funding model of universities will be increased
• The number of study places will be decreased in multidisciplinary universities that strive for international top levels and the resources thus gained will be allocated to research
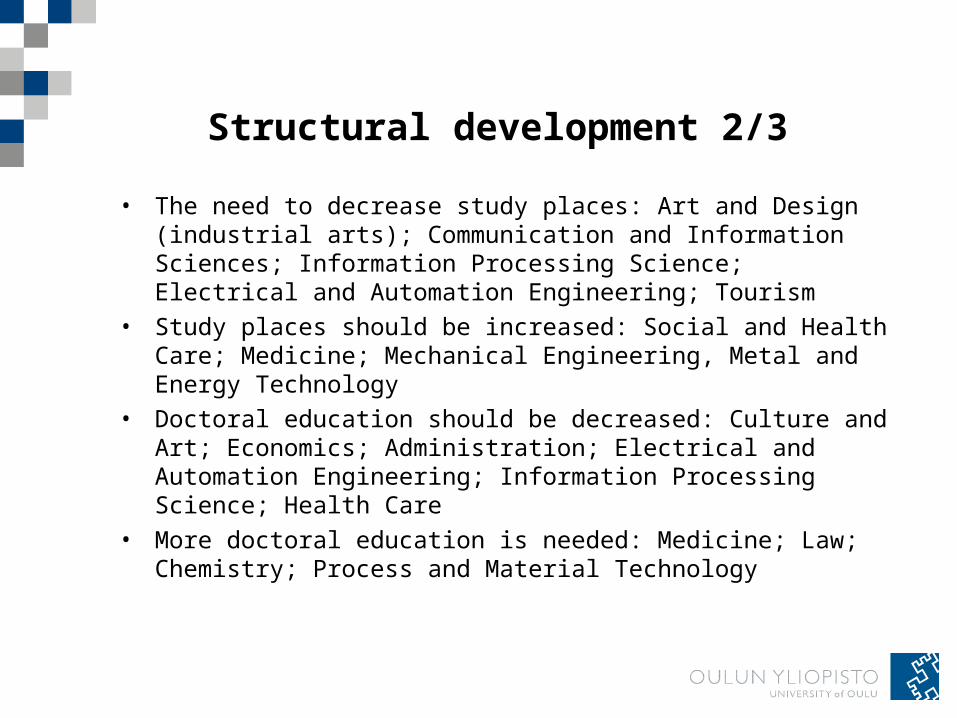
Structural development 2/3
• The need to decrease study places: Art and Design (industrial arts); Communication and Information Sciences; Information Processing Science; Electrical and Automation Engineering; Tourism
• Study places should be increased: Social and Health Care; Medicine; Mechanical Engineering, Metal and Energy Technology
• Doctoral education should be decreased: Culture and Art; Economics; Administration; Electrical and Automation Engineering; Information Processing Science; Health Care
• More doctoral education is needed: Medicine; Law; Chemistry; Process and Material Technology

Structural development 3/3
• Forming stronger alliances between higher education institutions
• The activities and resources of the Centre of Expertise programme will be reallocated after the programme period ending in 2013
• In research and innovation policy and regional policy, efficient tools and collaboration platforms will be created based on the strengths and needs of the regions
• The Strategic Centres for science, technology and innovation will continue to operate
• An infrastructure organ will be established
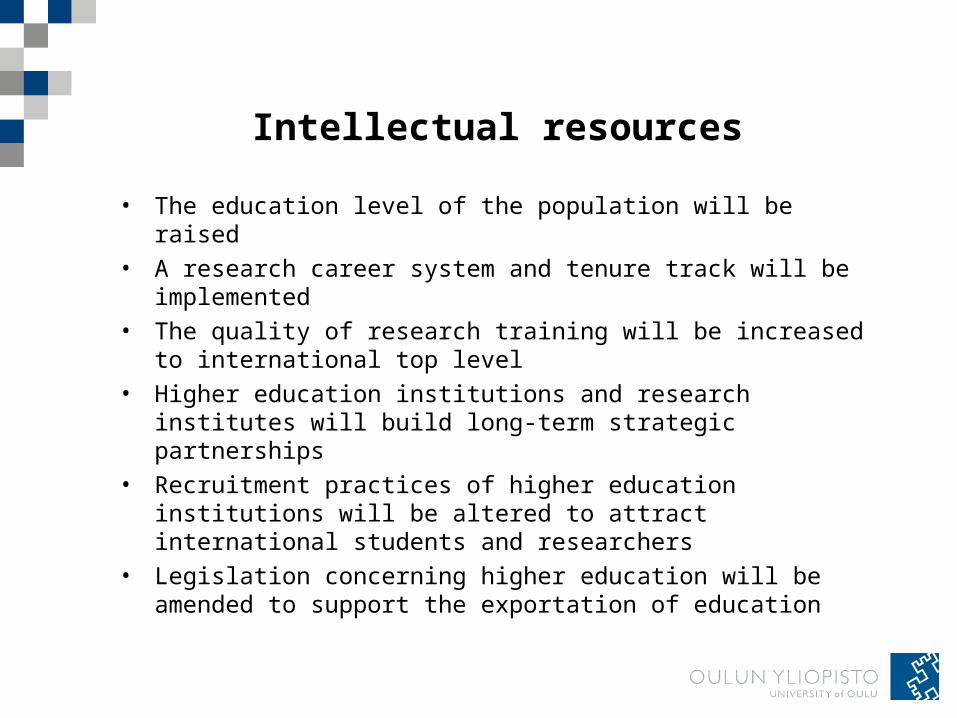
Intellectual resources
• The education level of the population will be raised• A research career system and tenure track will be
implemented• The quality of research training will be increased to
international top level• Higher education institutions and research institutes will
build long-term strategic partnerships• Recruitment practices of higher education institutions will be
altered to attract international students and researchers• Legislation concerning higher education will be amended to
support the exportation of education

Developing funding
• The national goal is to keep the GDP percentage of research and development in 4 % in the 2010s
• Public investment must be 1,2 % of GDP• The share of the private sector must be at least 2/3• The increase of public R&D funding in 2011-2015 (from
the level of 2011 and according to the 2011 value of money) will be 370 million euros in total. R&D funding will be increased in real terms at least 4,0% per year.
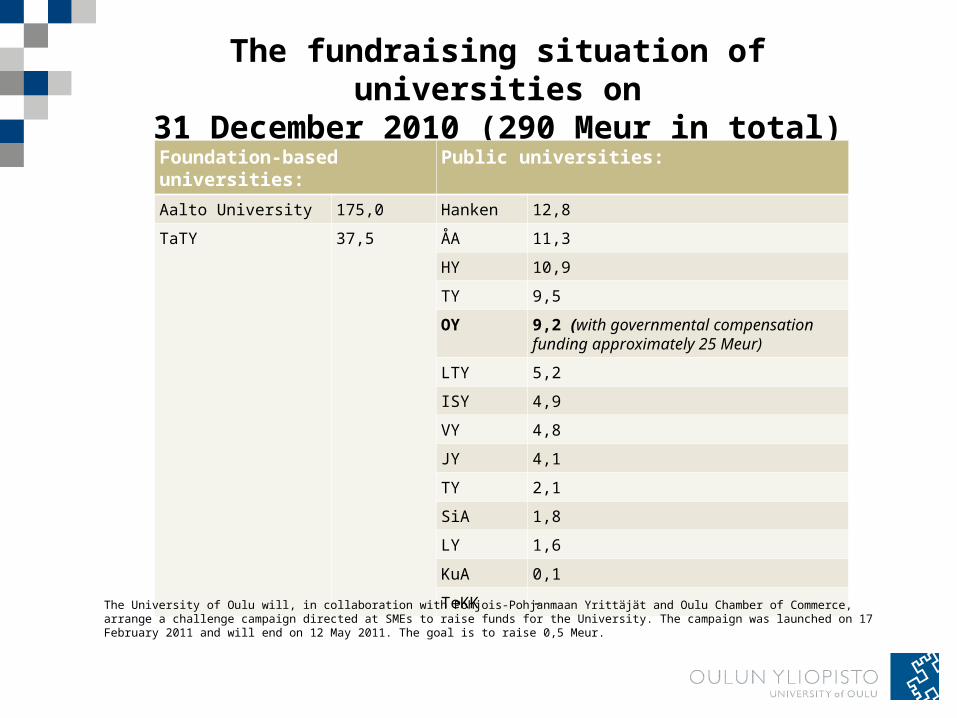
The fundraising situation of universities on
31 December 2010 (290 Meur in total)Foundation-based universities:
Public universities:
Aalto University 175,0 Hanken 12,8
TaTY 37,5 ÅA 11,3
HY 10,9
TY 9,5
OY 9,2 (with governmental compensation funding approximately 25 Meur)
LTY 5,2
ISY 4,9
VY 4,8
JY 4,1
TY 2,1
SiA 1,8
LY 1,6
KuA 0,1
TeKK - The University of Oulu will, in collaboration with Pohjois-Pohjanmaan Yrittäjät and Oulu Chamber of Commerce, arrange a challenge campaign directed at SMEs to raise funds for the University. The campaign was launched on 17 February 2011 and will end on 12 May 2011. The goal is to raise 0,5 Meur.

The biggest winners in Finland
Percentage point changes in the degree shares of the universities from 2007 to 2009-10
Master’s degreesU of Turku +1.16%U of Oulu +1.00%U of Jyväskylä +0.96%(engineering degrees have been excluded)
Doctoral degreesU of Tampere +1.11%U of Oulun yliopisto +0.94%Tampere U of Tech. +0.83%

Master’s and Bachelor’s degrees in 2010
• in 2010 Master’s and Bachelor’s degrees were granted at an accelerated rate in comparion to the past (this holds even after excluding the Faculty of Technology)
• in particular, the Fall of 2010 was exceptionally productive
Master’s degrees Bachelor’s degreesField 2008 2009 2010 2008 2009 2010Humanities 265 148 183 319 222 223Education 368 134 184 197 171 212Natural Sciences 524 165 218 557 214 232Medicine 89 110 124Dentistry 38 35 34Healt Sciences 71 33 40 48 61 46Engineering 392 345 508 48 77 213Economics 185 138 161 77 129 137Total 1932 1108 1452 1246 874 1063

Results from research and researcher training in 2010
Category 2009 2010 Target Change
Doctoral degrees 154 141 158 11 % below target
Publications 3521 3520 Below target
International referee publications/teachers& researchers
0.90 1.15 1.20 Classification change - close to target
Miscellaneous scientific publications/teachers& researchers
0.87 0.52 1.20 Classification change
Supplementary funding (% of total funding)
30.2 30.7 35.0 Significant undersupply
Academy of Finland
14 612 18 141 + 20 %
Tekes 11 522 13 773 + 20 %
EU framework programs
4 999 6 670 Higher in 2008
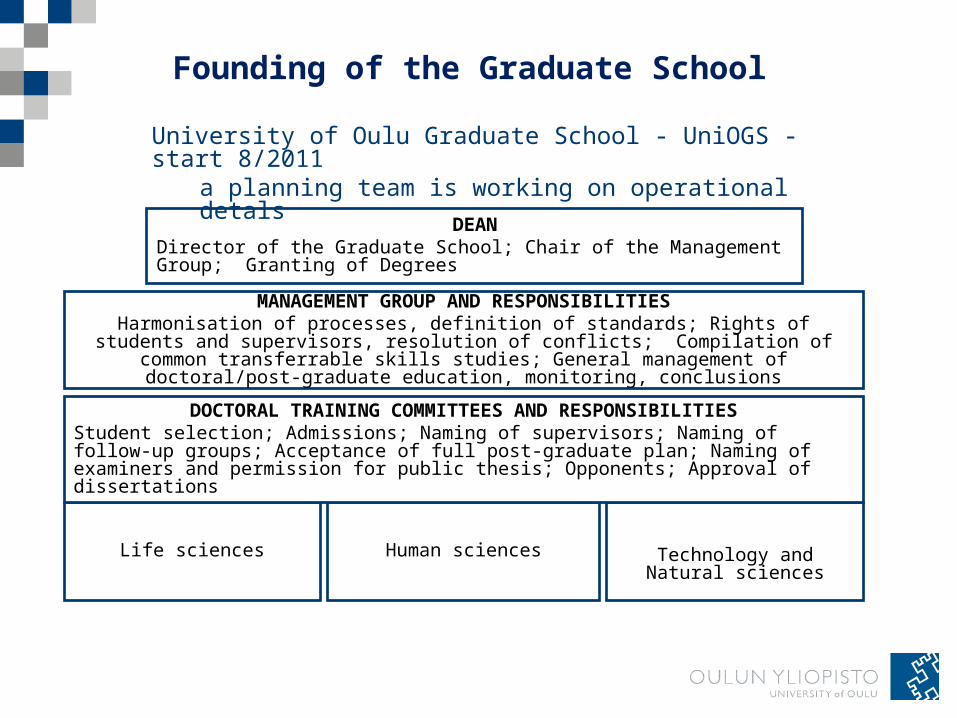
MANAGEMENT GROUP AND RESPONSIBILITIESHarmonisation of processes, definition of standards; Rights of students and
supervisors, resolution of conflicts; Compilation of common transferrable skills studies; General management of doctoral/post-graduate education, monitoring,
conclusions
Life sciences Human sciences Technology and Natural sciences
DOCTORAL TRAINING COMMITTEES AND RESPONSIBILITIESStudent selection; Admissions; Naming of supervisors; Naming of follow-up groups; Acceptance of full post-graduate plan; Naming of examiners and permission for public thesis; Opponents; Approval of dissertations
DEANDirector of the Graduate School; Chair of the Management Group; Granting of Degrees
Founding of the Graduate School
University of Oulu Graduate School - UniOGS - start 8/2011a planning team is working on operational detals

Milestones reached
• The quality assurance system of the University of Oulu passed the audit of the Finnish Higher Education Evaluation Council (FINHEEC)
• The Commission of the European Union granted the University of Oulu its Diploma Supplement Label
• Two new FiDiPro professors
• International recruitment program launced• recruitment packages for 12 new research groups • + 5 PhD in selected areas• the posts are being filled

Master’s degrees in Finland 2010
Institution 2007 2008 2009
2010(advance
information)% of country
2009-10% of country
2007U of Helsinki 2562 4442 1 561 2 228 15,29 18,45U of Jyväskylä 1374 2104 1 068 1 226 9,26 9,90U of Oulu 1342 1932 1 108 1 452 10,33 9,67U of Eastern Finland 1240 1960 801 1 028 7,38 8,93U of Turku 1393 2320 1061 1286 9,47 10,03U of Tampere 1093 1993 784 896 6,78 7,87Åbo Akademi 527 850 320 343 2,68 3,80U of Vaasa 399 784 288 343 2,55 2,87U of Lapland 397 661 264 358 2,51 2,86Aalto 1626 2192 1 567 2 280 15,53 11,71Tampere U of Tech. 837 809 794 1532 9,39 6,03Lappeenranta U of Tech. 638 770 609 867 5,96 4,60Hanken School of Econ. 215 517 122 203 1,31 1,55Sibelius Academy 151 301 105 123 0,92 1,09Theatre Academy 60 120 42 58 0,40 0,43Academy of Fine Arts 30 70 34 25 0,24 0,22
Total 13 884 21 825 10 528 14 247 100 100
Share of the University of Oulu 2007 9.7%, 2008 8.9% , 2009 10.5%, 2010 10.2%
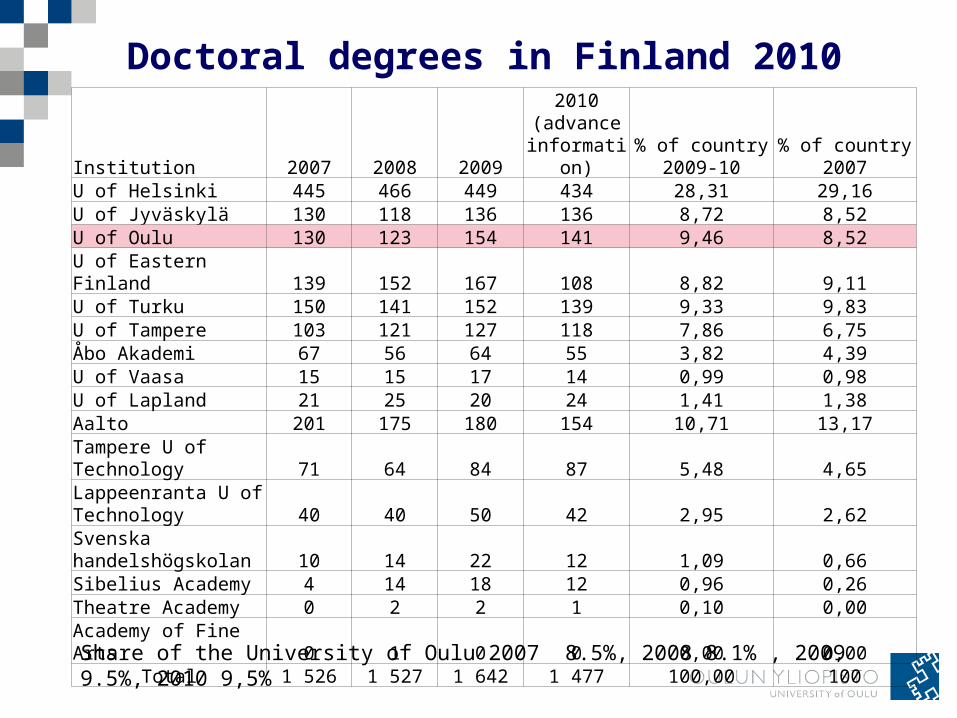
Doctoral degrees in Finland 2010
Institution 2007 2008 2009
2010(advance
information)% of country
2009-10% of country
2007U of Helsinki 445 466 449 434 28,31 29,16U of Jyväskylä 130 118 136 136 8,72 8,52U of Oulu 130 123 154 141 9,46 8,52U of Eastern Finland 139 152 167 108 8,82 9,11U of Turku 150 141 152 139 9,33 9,83U of Tampere 103 121 127 118 7,86 6,75Åbo Akademi 67 56 64 55 3,82 4,39U of Vaasa 15 15 17 14 0,99 0,98U of Lapland 21 25 20 24 1,41 1,38Aalto 201 175 180 154 10,71 13,17Tampere U of Technology 71 64 84 87 5,48 4,65Lappeenranta U of Technology 40 40 50 42 2,95 2,62Svenska handelshögskolan 10 14 22 12 1,09 0,66Sibelius Academy 4 14 18 12 0,96 0,26Theatre Academy 0 2 2 1 0,10 0,00Academy of Fine Arts 0 1 0 0 0,00 0,00
Total 1 526 1 527 1 642 1 477 100,00 100
Share of the University of Oulu 2007 8.5%, 2008 8.1% , 2009 9.5%, 2010 9,5%

Background for the 2010 figures
• The starting point for 2010 was challenging, because the University budget for 2010 was very adverse, approx. 6 M€– This resulted from the decrease in the level of basic funding
compared to 2009– Previously agreed contractual pay raises of approx. 4 %
• The financial situation of the University improved significantly during the accounting period
• The improvements in the financial situation result from saving actions and one-time instalments– Co-operation negotiations conducted in winter/spring 2010
commenced the saving actions– Number of personnel decreased in 2010 compared to the
previous year– One-time instalments improving financial performance came
to a total of 4,5 M€ in 2010

Background for the 2010 figures
• In December a great amount of working hours were transferred in SOLE TM –working time allocation system from government`s basic funding to project funding
• One-time and unforeseeable instalments affecting financial performance– Decrease of holiday pay debt and its affect on performance approx.
1,7 M€– Cost-free Certia services (January-April) + returned fees approx. 1M€– Supplementary budget approx. 1,8 M€
• With the new universities’ collective labour agreement a large number of University employees were transferred under worked-off time => greatly affected the amount of holiday pay debt entered in the balance => decrease of 1,7 M€ in holiday pay debt improved our result last year
• Strategy funds were allocated to profit centres late last year => approximately 2 - 2,5 M€ of positive effect on financial result, when some of the money was not spent
Background for the 2010 figures
• University personnel costs began to decrease in 2010 compared to 2009– As a starting point it was known that agreed-upon pay
raises of 4 % were coming in 2010– Approx. 180 persons less in 2010 compared to 2009– This was due to the great uncertainties in the operation
in early 2010; main reasons were the co-operation negotiations and the transfer to new legal status
– Another great effect was the decrease of holiday pay debts and resulting entry that improved performance
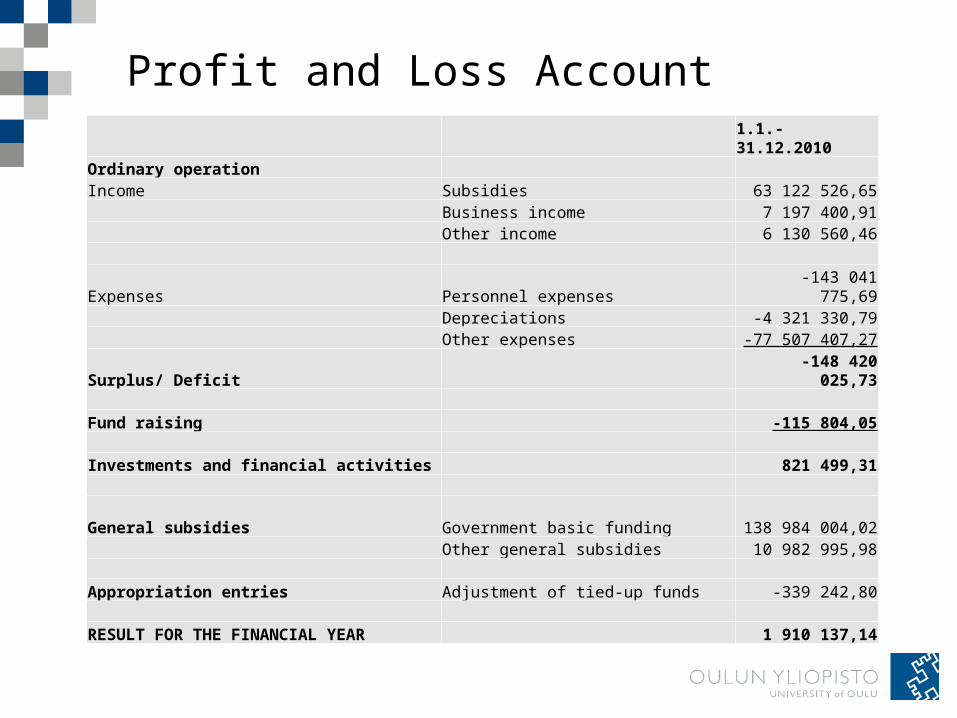
Profit and Loss Account
1.1.-31.12.2010
Ordinary operation Income Subsidies 63 122 526,65 Business income 7 197 400,91 Other income 6 130 560,46
Expenses Personnel expenses -143 041 775,69 Depreciations -4 321 330,79 Other expenses -77 507 407,27
Surplus/ Deficit -148 420
025,73 Fund raising -115 804,05 Investments and financial activities 821 499,31
General subsidies Government basic funding 138 984 004,02 Other general subsidies 10 982 995,98 Appropriation entries Adjustment of tied-up funds -339 242,80 RESULT FOR THE FINANCIAL YEAR 1 910 137,14

Income and expenses
Basic funding 139 M€Teacher training school`s community compensation 4,9 M€Other general subsidies 11 M€Additional funding 71,6 M€Operational income total 226,4 M€
Personnel expenses 143 M€Depreciations 4,3 M€Material, instruments and goods 11,2 M€Service purchases 13,2 M€Facility rents and other rents 35,7 M€Travel costs 6,3 M€Other expenses 11,1 M€Operational expenses total 224,8 M€
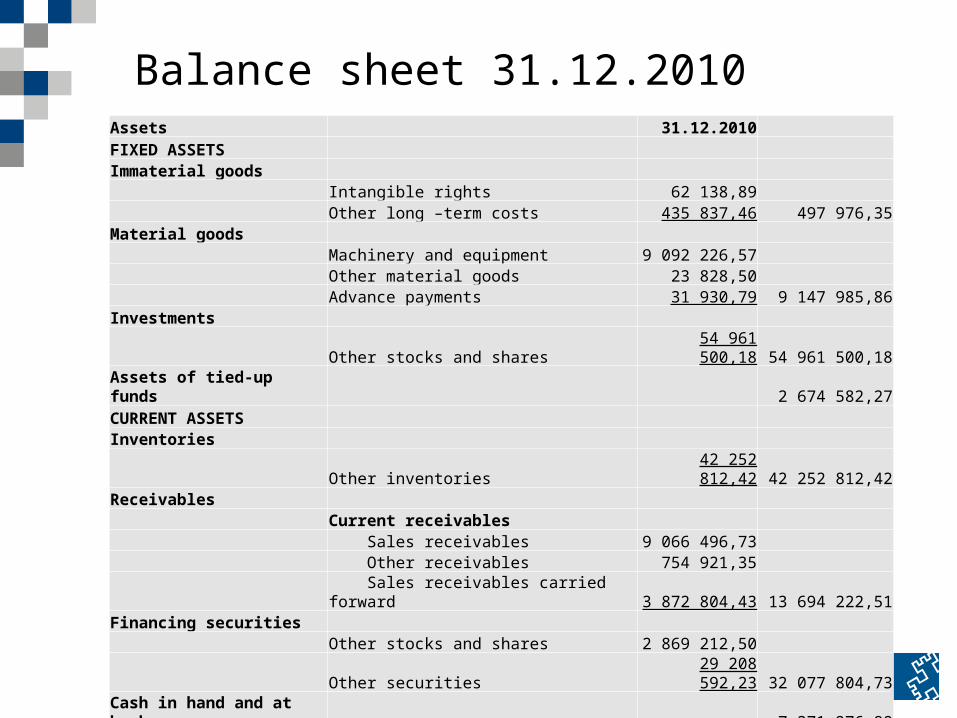
Balance sheet 31.12.2010Assets 31.12.2010 FIXED ASSETS Immaterial goods Intangible rights 62 138,89 Other long –term costs 435 837,46 497 976,35Material goods Machinery and equipment 9 092 226,57 Other material goods 23 828,50 Advance payments 31 930,79 9 147 985,86Investments Other stocks and shares 54 961 500,18 54 961 500,18Assets of tied-up funds 2 674 582,27CURRENT ASSETS Inventories Other inventories 42 252 812,42 42 252 812,42Receivables Current receivables Sales receivables 9 066 496,73 Other receivables 754 921,35 Sales receivables carried forward 3 872 804,43 13 694 222,51Financing securities Other stocks and shares 2 869 212,50 Other securities 29 208 592,23 32 077 804,73Cash in hand and at banks 7 371 276,88
ASSETS TOTAL 162 678 161,20

Balance sheet 31.12.2010
Liabilities EQUITY Basic capital 62 078 090,31Tied-up funds 2 594 107,48Free funds 1 927 586,34Other equity
Operation capital 30 374 582,32
Net result (loss) for the financial year 1 910 137,14 32 284 719,46Equity in total 98 884 503,59 CURRENT LIABILITIES Short-term liabilities
Advances received37 728 424,04
Accounts payable 6 304 584,28 Other liabilities 3 940 664,26
Accruals15 819 985,03 63 793 657,61
Liabilities in total 162 678 161,20

Forecast for the year 2011
• The profitability of core operations the most important factor when estimating the level of funding
• Current funding model valid until the end of 2012– Factors defining the level of basic funding known up until
then• New funding model for universities will be published at the
end of y2011• The future level of basic funding will also be affected by the
general financial situation of the state and the new government`s attitude towards the university sector
• The financial status and performance of 2011 are predicted to remain moderately good
• Approximately 3 M€’s worth of additional costs in the form of unemployment insurance premiums is forthcoming in 2012

Personnel data 2009-2010

Man-years by staff categories
2006
2007
2008
2009
2010
Teachers & researchers
1516 1536 1562 1577 1617
Other personnel 1417 1406 1327 1292 1141Training schools 120 116 113 115 110
3053 3058 3002 2984 2868
Man-years excluding part-time teaching
3008 3010 2948 2936 2792