WhatCounts.com: Find and Grow Your Email Marketing ROI
88
Find and Grow Your Email Marketing ROI Christopher S. Penn, Director of Inbound Marketing www.WhatCounts.com
-
Upload
christopher-penn -
Category
Business
-
view
1.247 -
download
0
description
Transcript of WhatCounts.com: Find and Grow Your Email Marketing ROI

Find and Grow Your Email Marketing ROI
Christopher S. Penn, Director of Inbound Marketingwww.WhatCounts.com

Fair Warning

http://www.whatcounts.com/pinterest

#wcroi

Find Grow

Find

What?When?How?

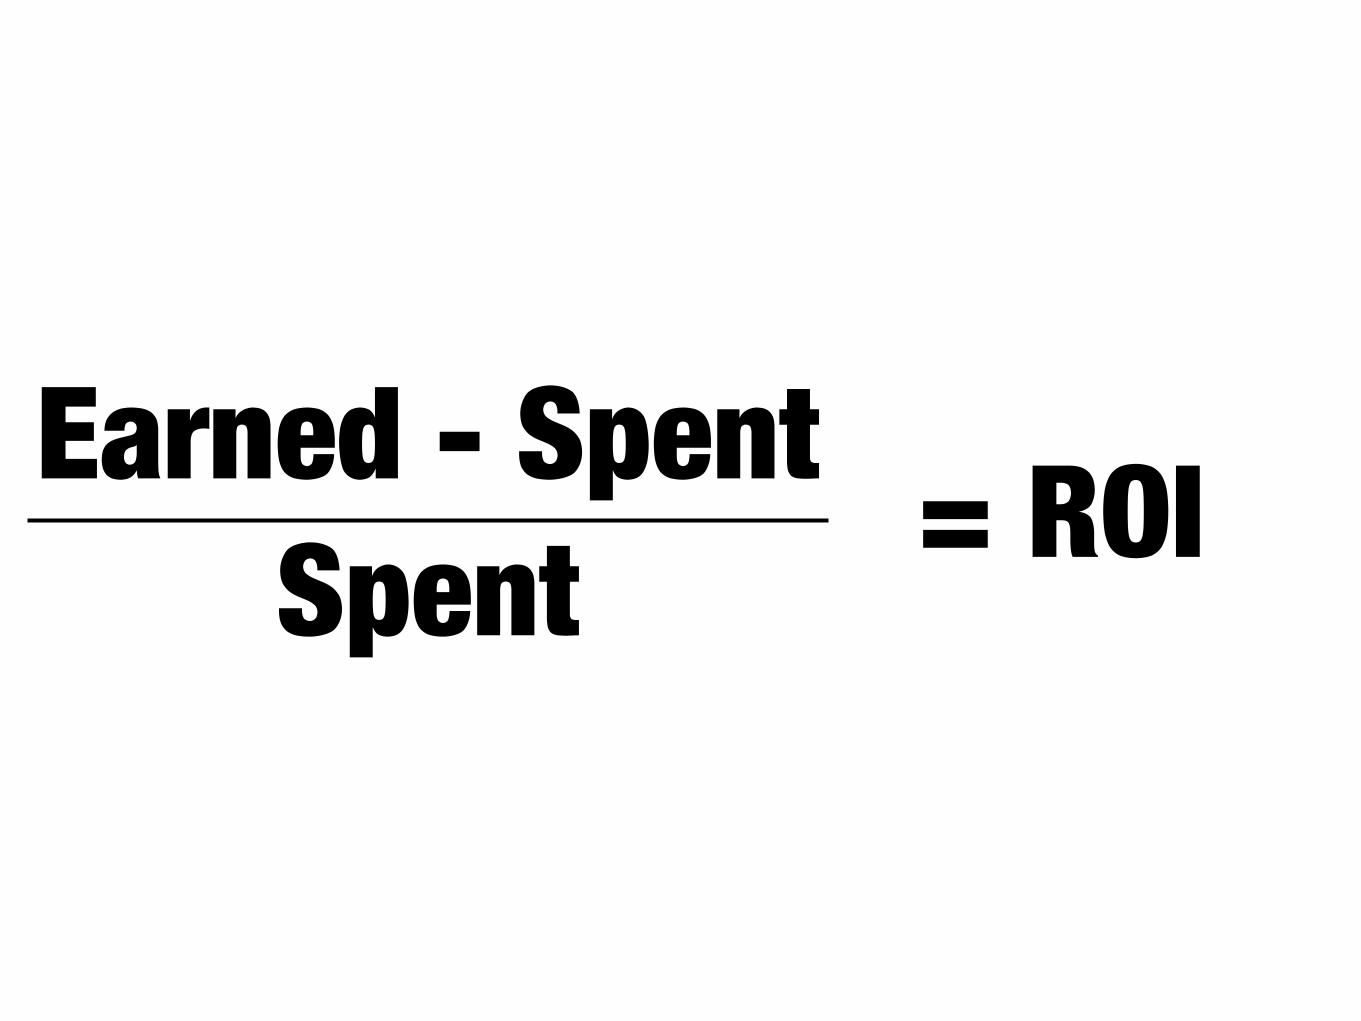
Returnon
Investment

Earned - SpentSpent
= ROI

ROI is a financial equation.Accept no substitutes.

Return on “influence”Return on conversationReturn on engagement

1,000 - 500500
= 100%

250 - 500500
= -50%
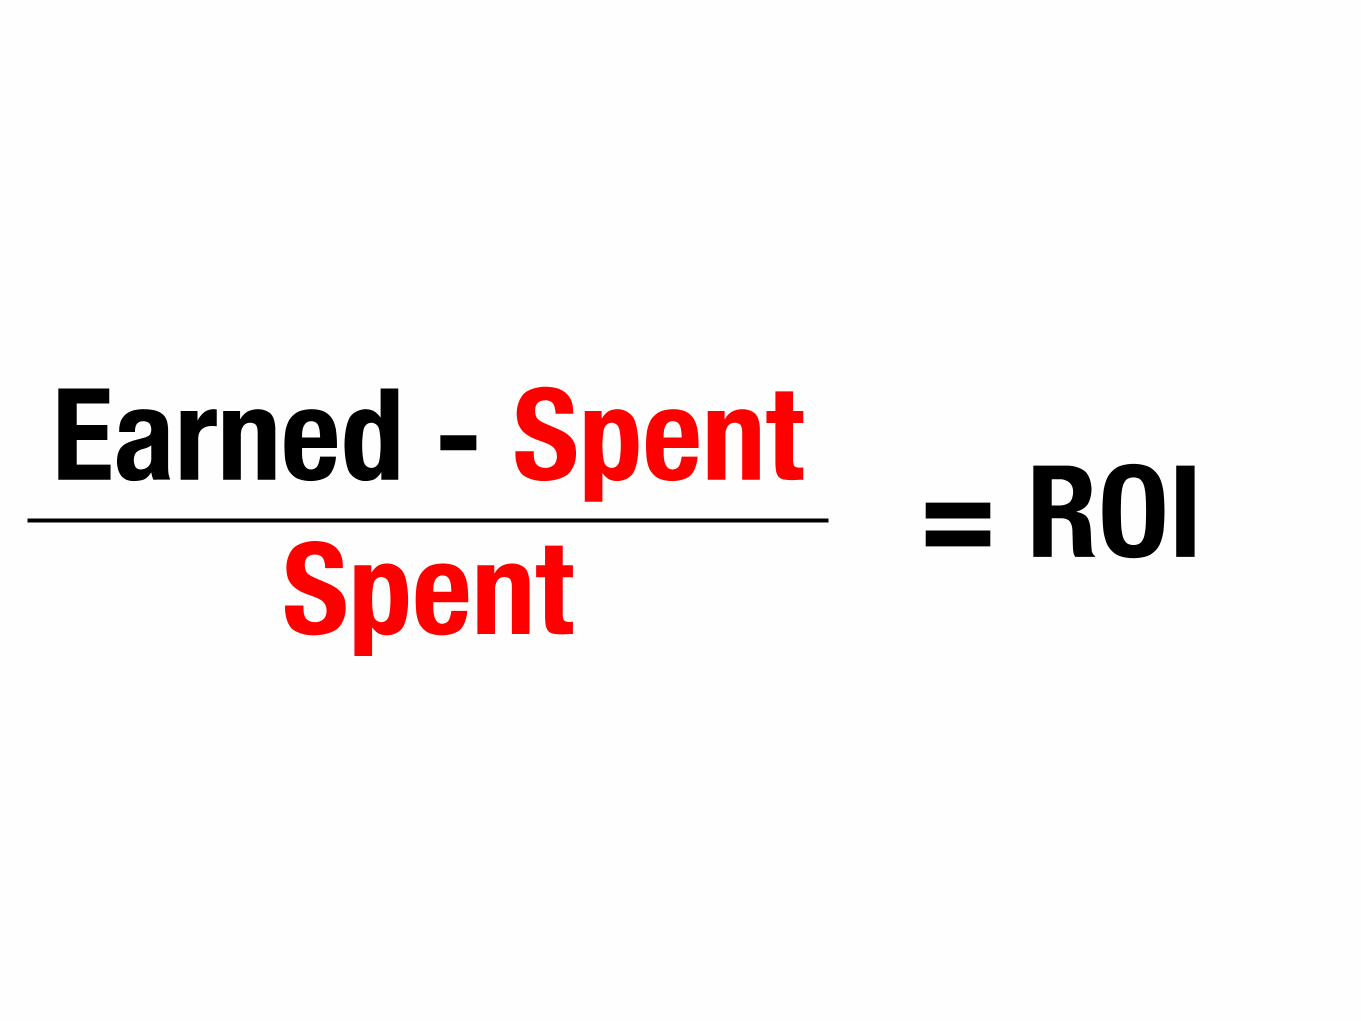
Earned - SpentSpent
= ROI

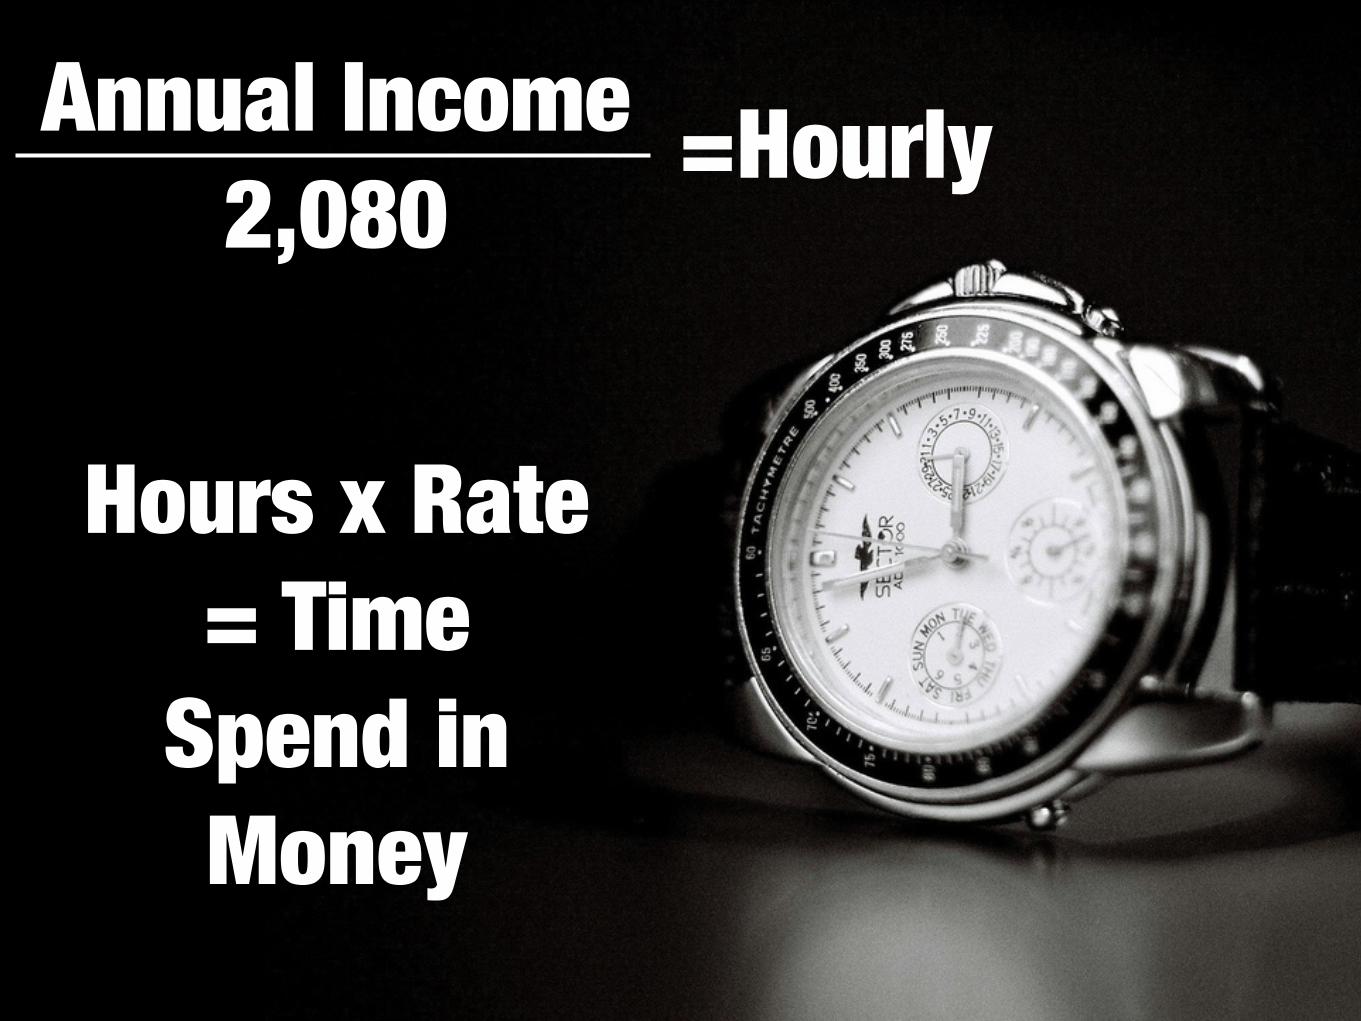
Marketers woefully undervalue time spent as money in ROI.


Annual Income2,080
=Hourly
Annual Income2,080
=Hourly
Hours x Rate = Time
Spend in Money
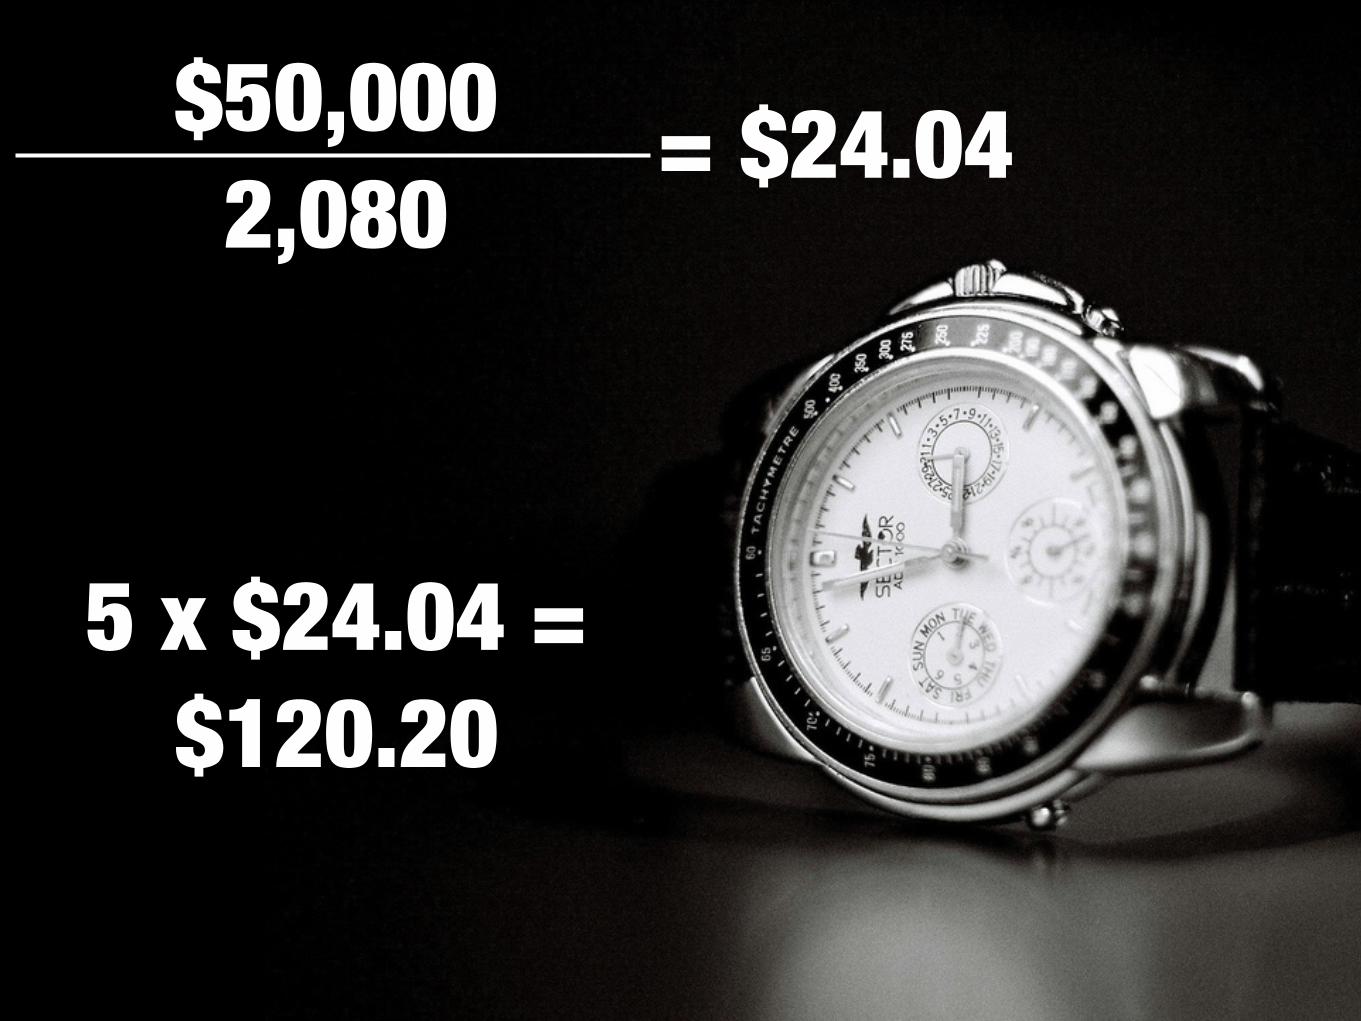
$50,0002,080
= $24.04
5 x $24.04 = $120.20

1000 - 620.20620.20
= 61.2%
100% ROI vs. 62% ROI

Money Earned:Money Spent:
Hourly Rate:Time Spent:
Time Spent in Money:
Total Spent:
Total Earned-Total SpentTotal Spent
$_______$_______
$_______ _______$_______
$_______
_______%
Worksheet 1

What?When?How?

ROI is not everything

Audience
Prospects
Leads
Customers
Evangelists

ROI really important!
ROI is really important when you need maximum results for tight resources.

ROI not as important!

ROI is not as important when you are making strategic choices for investment.

What?When?How?

Earned - SpentSpent
= ROI
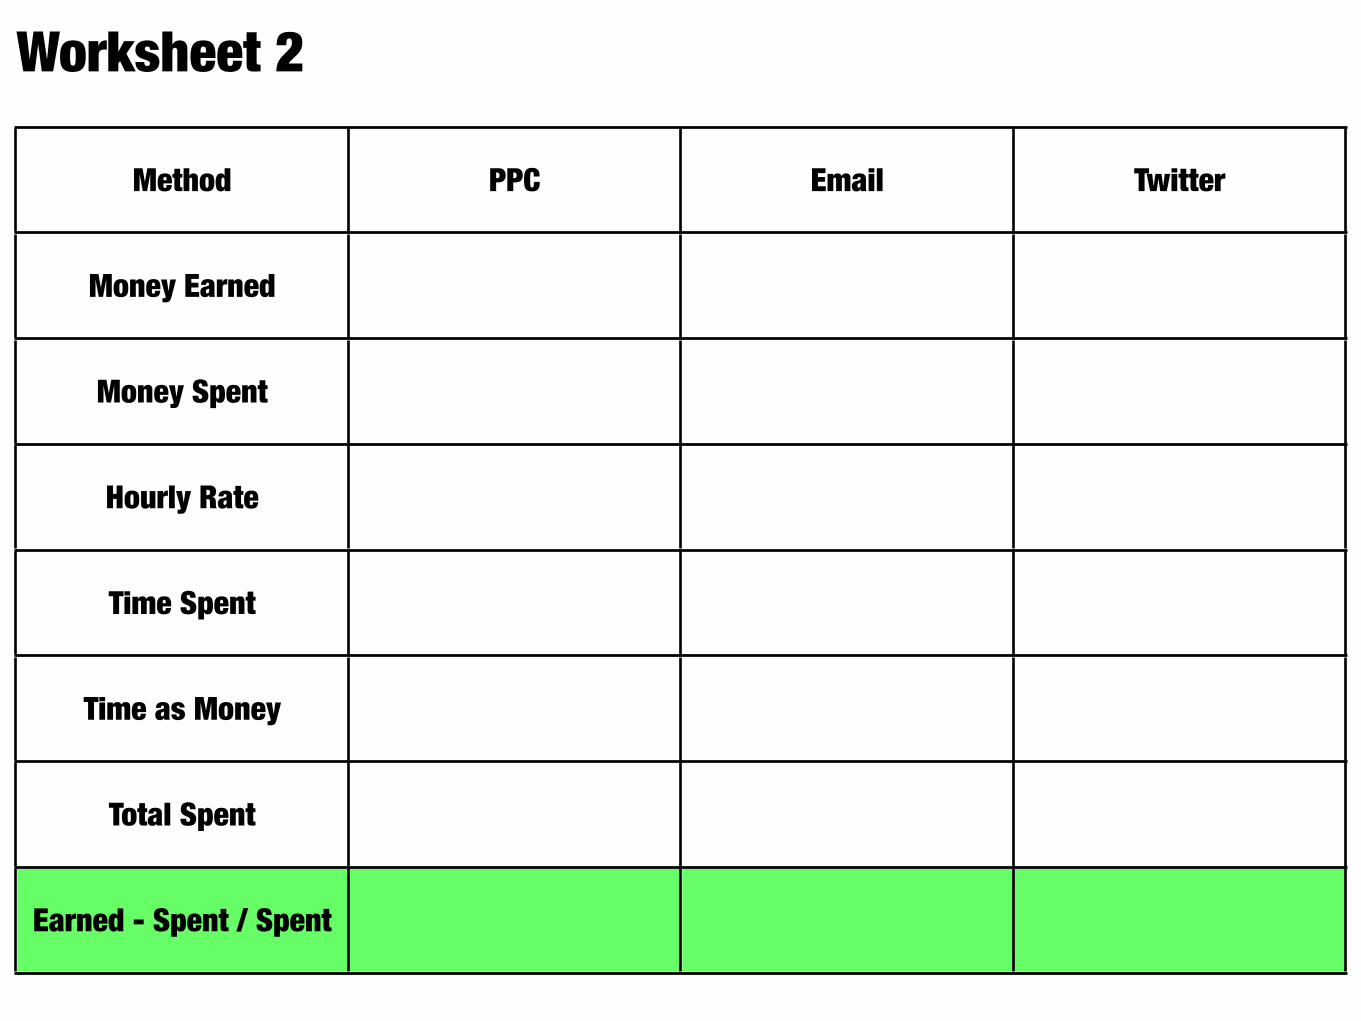
Worksheet 2
Method PPC Email Twitter
Money Earned
Money Spent
Hourly Rate
Time Spent
Time as Money
Total Spent
Earned - Spent / Spent
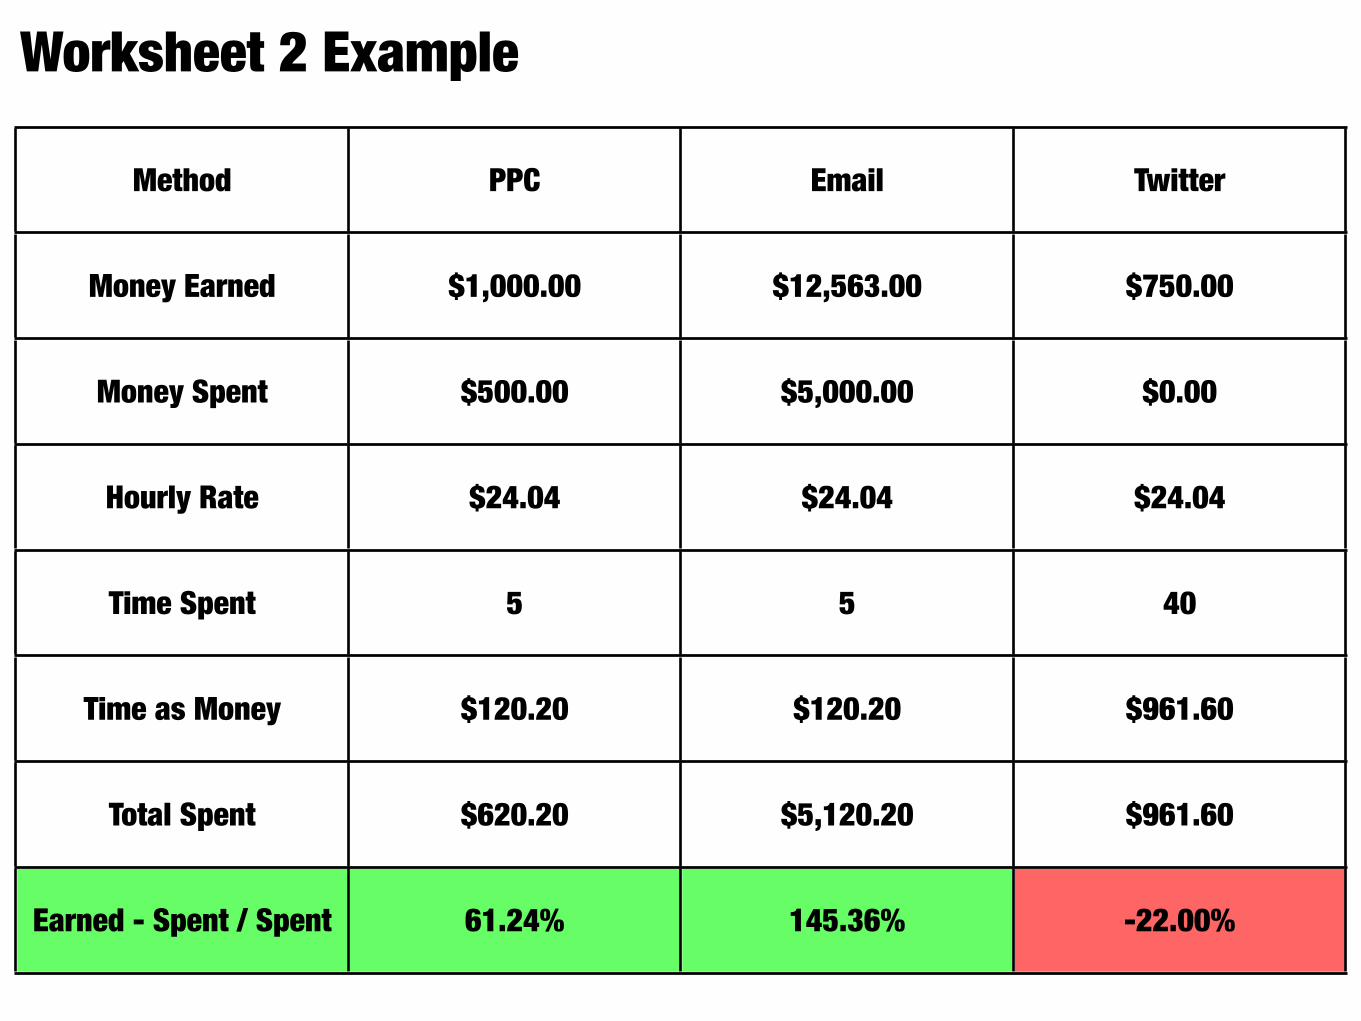
Worksheet 2 Example
Method PPC Email Twitter
Money Earned $1,000.00 $12,563.00 $750.00
Money Spent $500.00 $5,000.00 $0.00
Hourly Rate $24.04 $24.04 $24.04
Time Spent 5 5 40
Time as Money $120.20 $120.20 $961.60
Total Spent $620.20 $5,120.20 $961.60
Earned - Spent / Spent 61.24% 145.36% -22.00%

Worksheet 2 Example
Method PPC Email Twitter
Money Earned $1,000.00 $12,563.00 $750.00
Money Spent $500.00 $5,000.00 $0.00
Hourly Rate $24.04 $24.04 $24.04
Time Spent 5 5 40
Time as Money $120.20 $120.20 $961.60
Total Spent $620.20 $5,120.20 $961.60
ROI 61.24% 145.36% -22.00%

But wait!

Last Touch Problem


Webinar
Tweet
PPC Ad
Blog Post
Sponsored
Which caused the sale?

Old school single channel ROI is broken

Back to the
drawing board
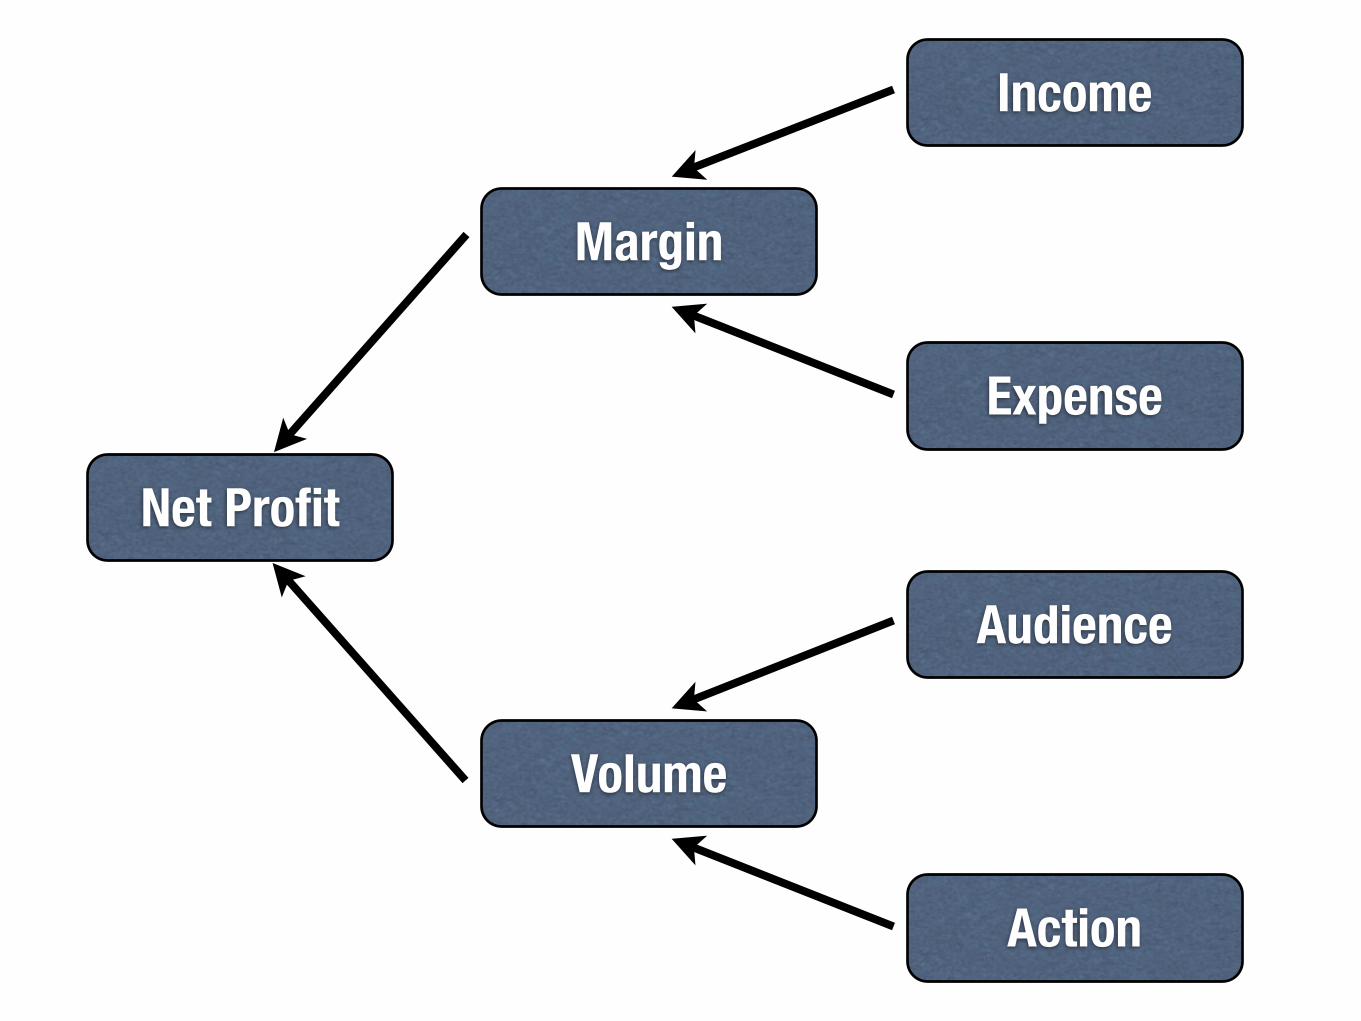
Net Profit
Margin
Volume
Income
Expense
Audience
Action
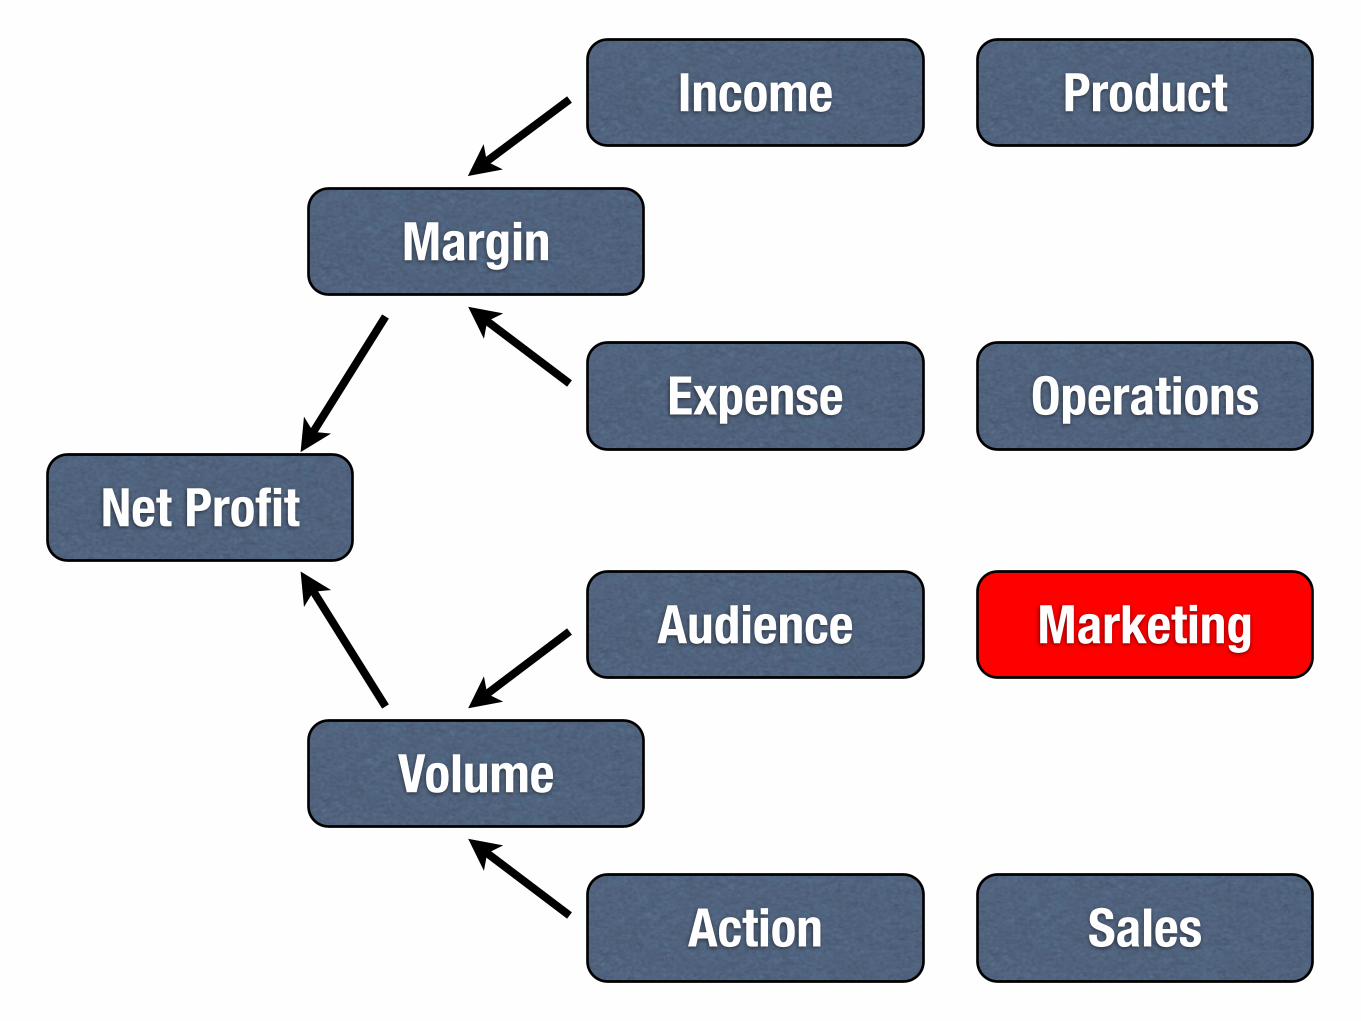
Net Profit
Margin
Volume
Income
Expense
Audience
Action
Product
Operations
Marketing
Sales

EPA

Earned - SpentNumber of Actions

Money Earned:Money Spent:
Hourly Rate:Time Spent:
Time Spent in Money:
Total Spent:
Total Earned-Total SpentValuable Actions
$_______$_______
$_______ _______$_______
$_______
_______ EPA
Worksheet 3

So what?


Yes, but so what?

Last Touch Problem Solved

MCFOne Phrase:

Google Analytics Multichannel Funnels get us much closer to real ROI.

Multichannel Revenue

Email “closed” 179 interactions for $67,987 but helped 96 more for $36,796
Total Return: $104,783

Find email dependencies
Earned - SpentSpent
= ROI

104,783-3,3003,300 = 3075%

The Big Picture ofInternet Marketing ROI

Grow

ROI is good for making post-campaign keep or kill decisions.
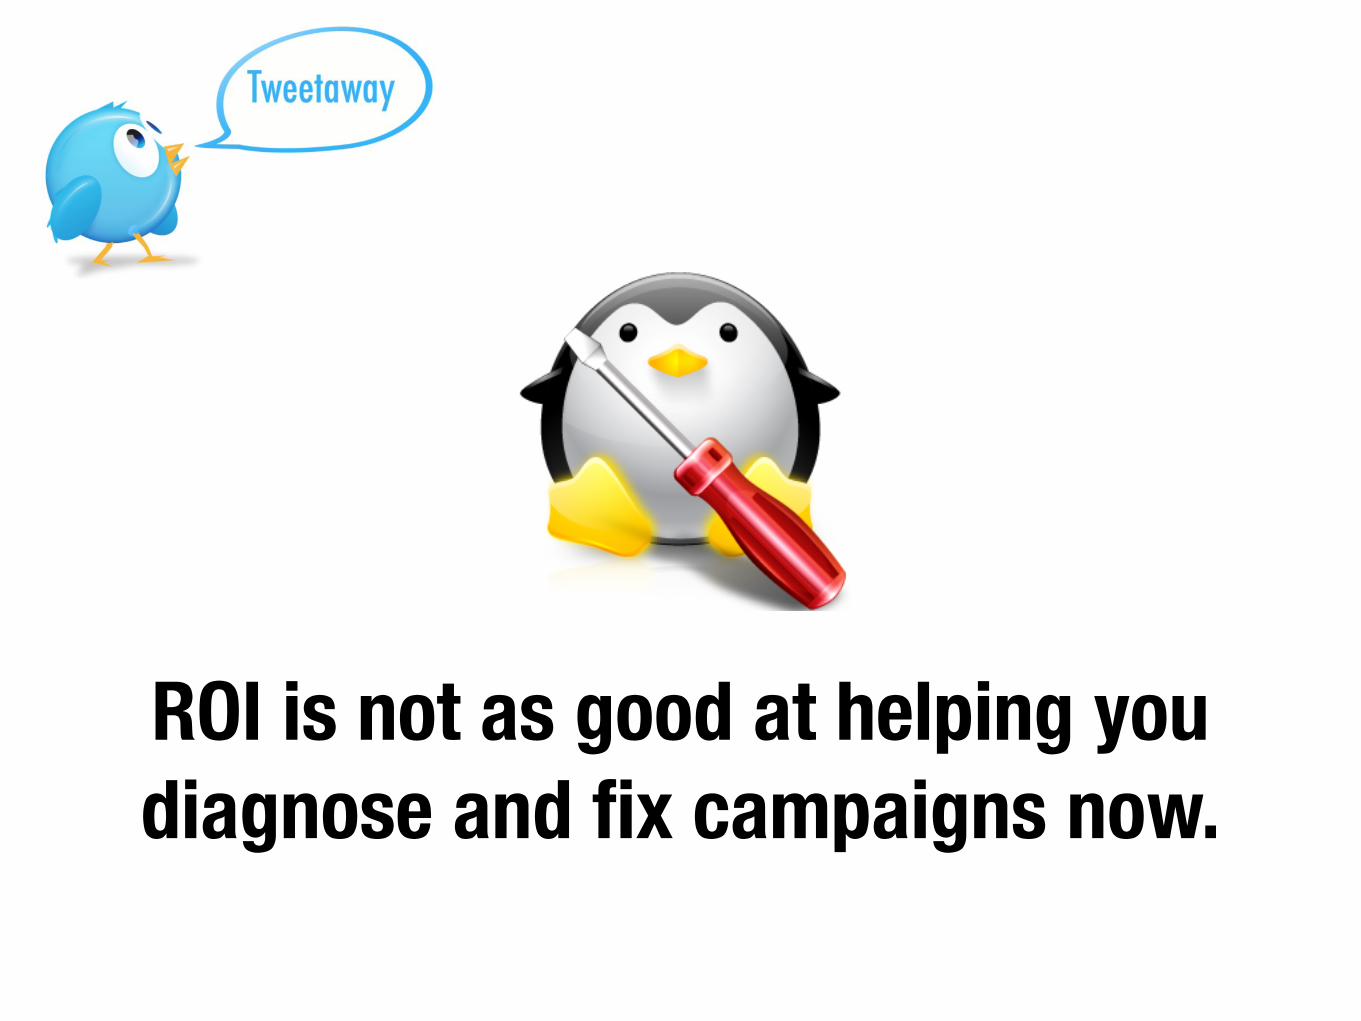
ROI is not as good at helping you diagnose and fix campaigns now.

Sales
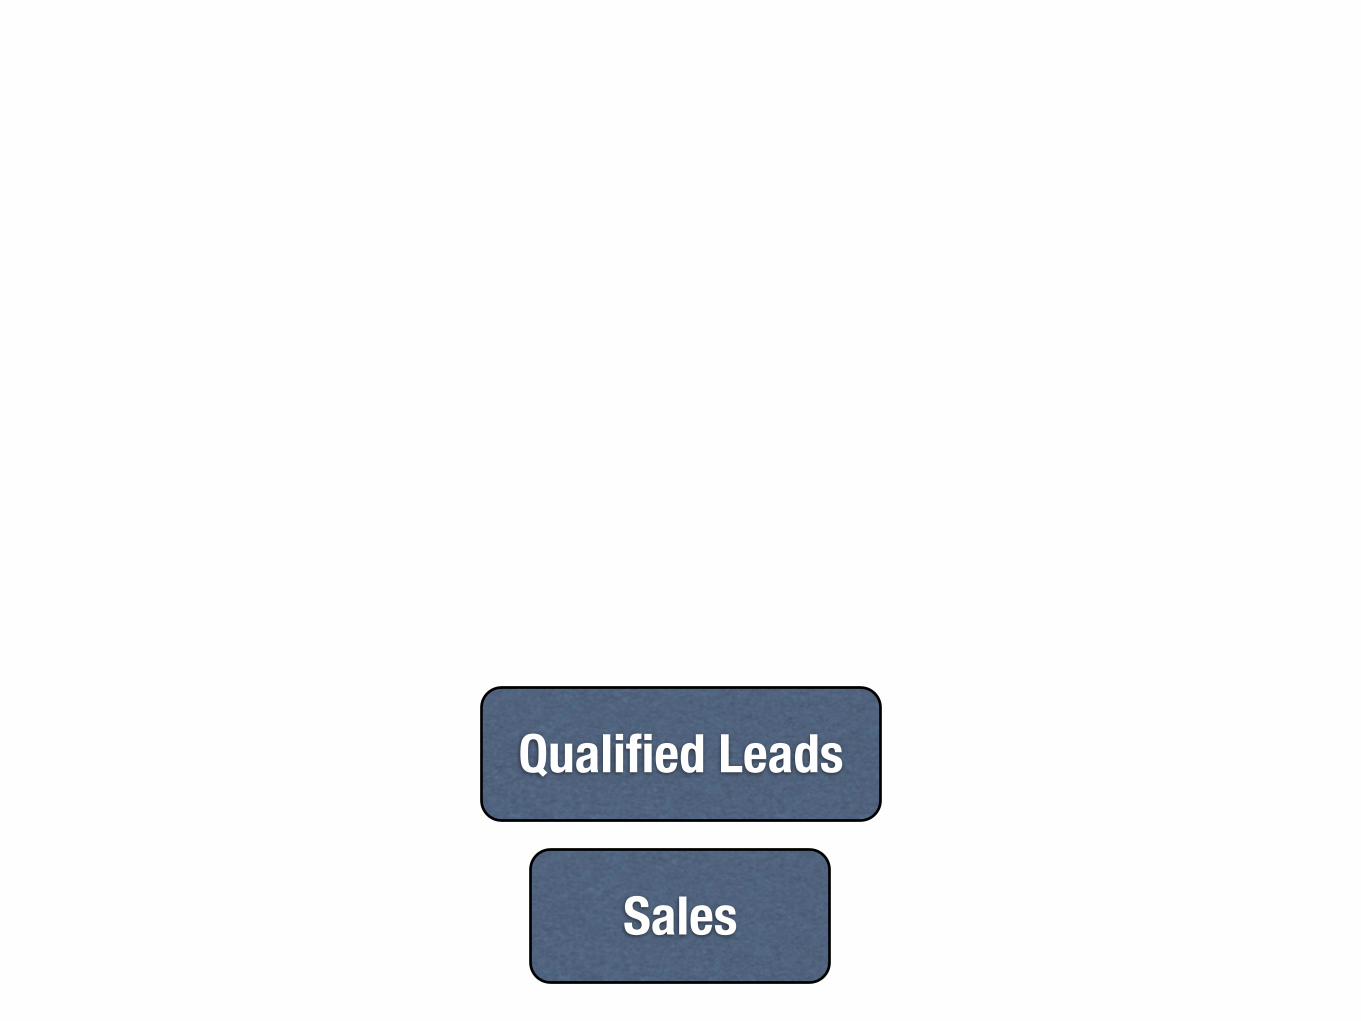
Sales
Qualified Leads

Sales
Qualified Leads
Prequalified Leads

Sales
Qualified Leads
Prequalified Leads
Interested Prospects

Sales
Qualified Leads
Prequalified Leads
Interested Prospects
Active Audience

Sales
Qualified Leads
Prequalified Leads
Interested Prospects
Active Audience
Potential Audience

Sales
Qualified Leads
Prequalified Leads
Interested Prospects
Active Audience
Potential Audience

Sales
Qualified Leads
Prequalified Leads
Interested Prospects
Active Audience
Potential Audience
50
100
200
400
800
25

Sales
Qualified Leads
Prequalified Leads
Interested Prospects
Active Audience
Potential Audience
50
100
200
400
800
25
50%
50%
50%
50%
50%

Sales
Qualified Leads
Prequalified Leads
Interested Prospects
Active Audience
Potential Audience
25
50
100
400
800
12.5
50%
50%
50%
25%
50%

Diagram out your sales and marketing KPIs and find the most broken step.
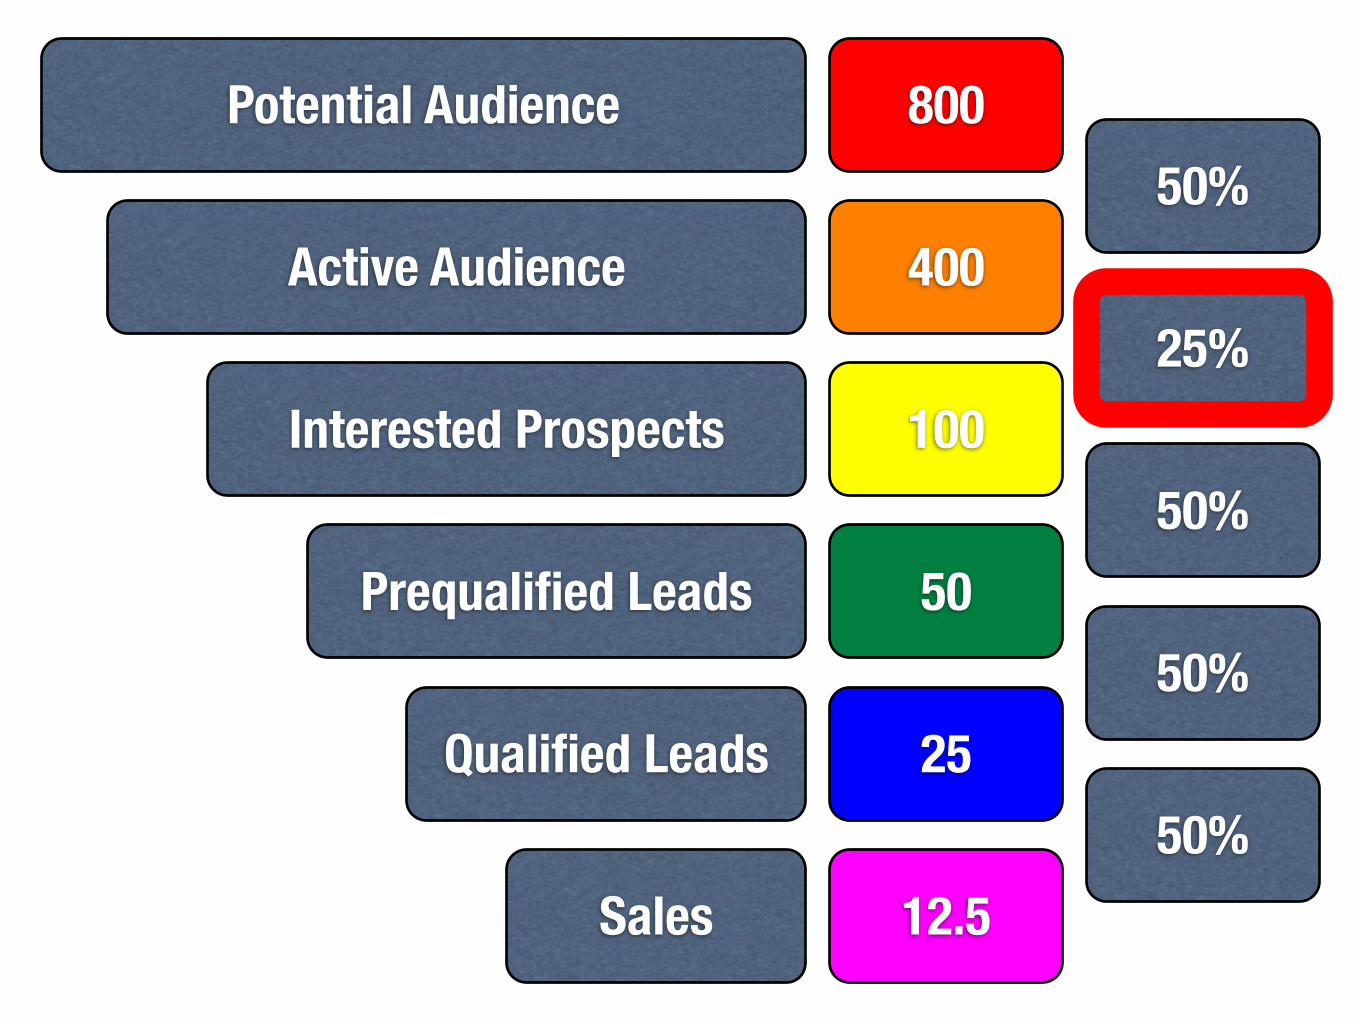
Sales
Qualified Leads
Prequalified Leads
Interested Prospects
Active Audience
Potential Audience
25
50
100
400
800
12.5
50%
50%
50%
25%
50%
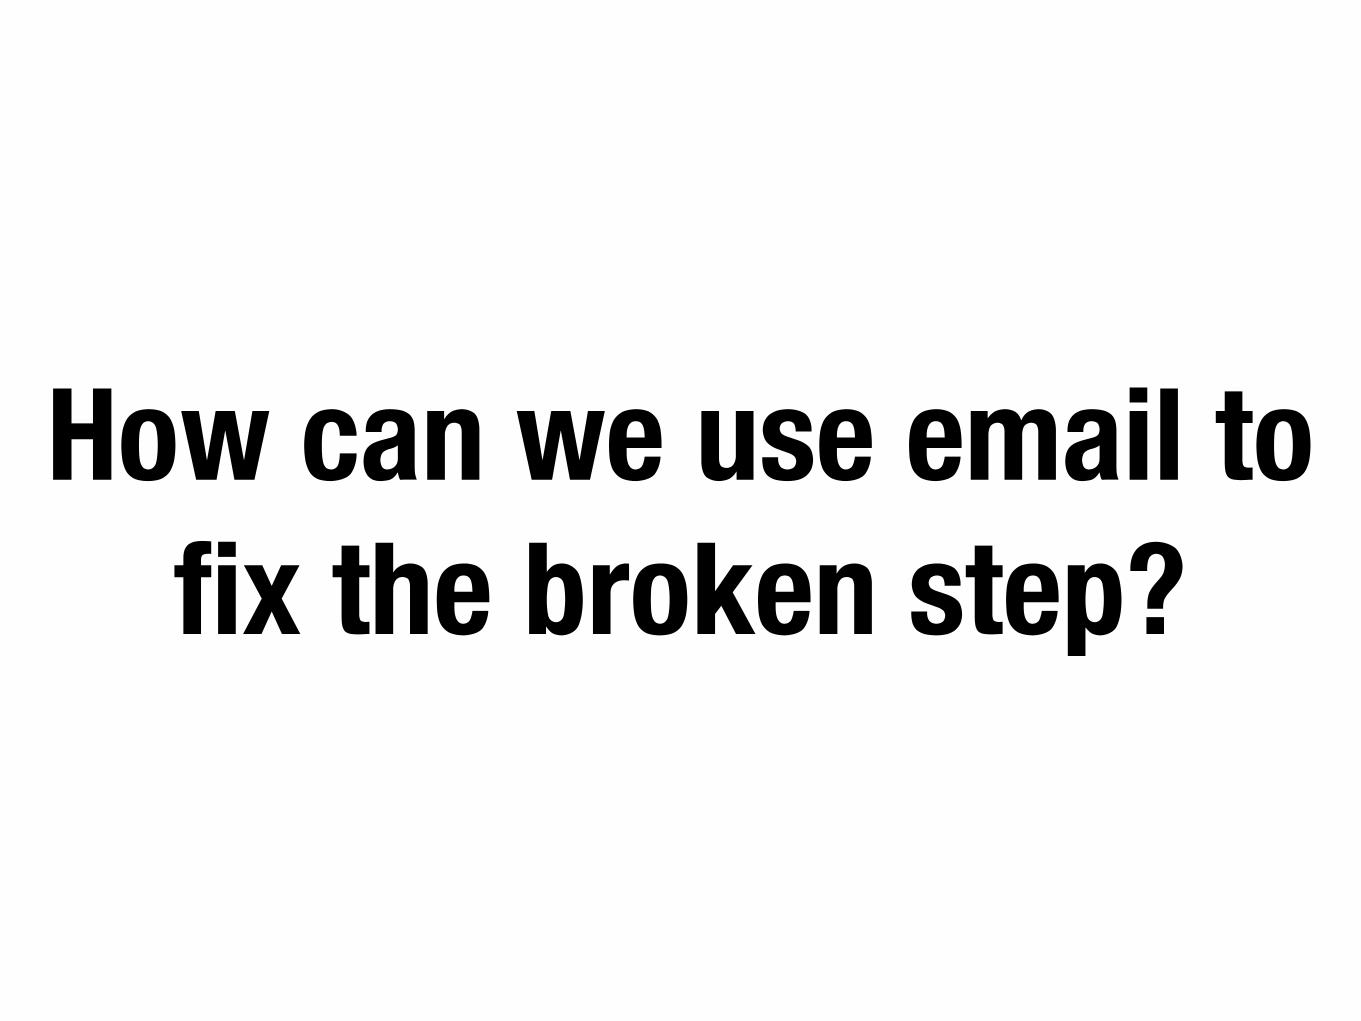
How can we use email to fix the broken step?

Interested Prospects
Active Audience
100
400
25%

Sales
Qualified Leads
Prequalified Leads
Interested Prospects
Active Audience
Potential Audience
37.5
75
150
400
800
18.75
50%
50%
50%
37.5%
50%

Find out if your email even got to your list

168

Move email up in the chain
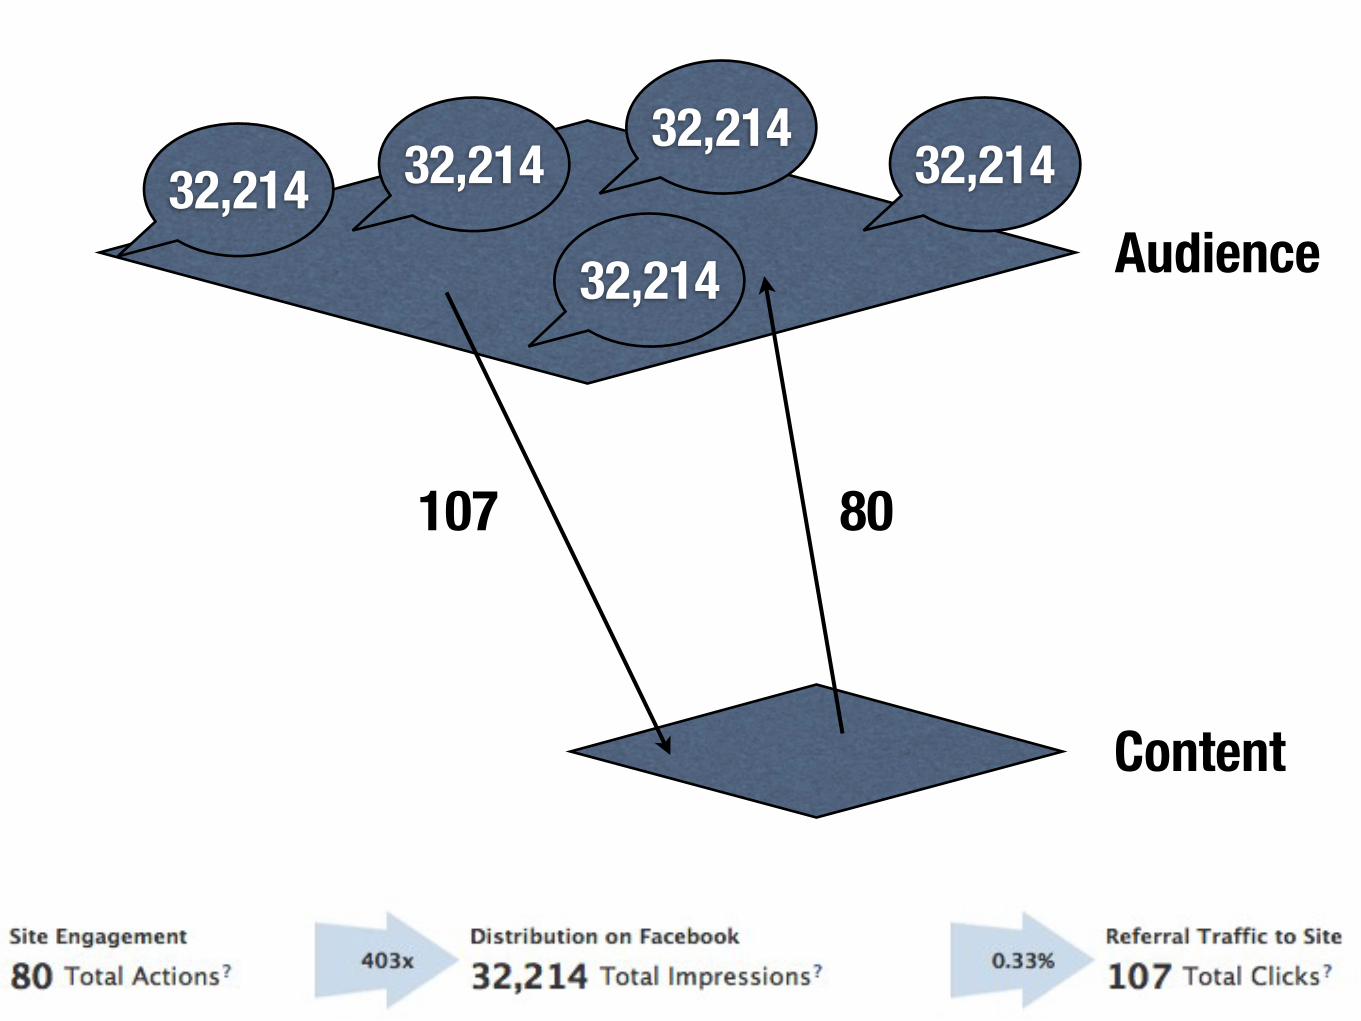
80
32,21432,214
32,21432,214
32,214
107
Audience
Content

Test the optimum combination of performance

Visit a website
Follow/Like socially
Subscribe to blog
Subscribe to email
Download eBook
Attend webinar
Incr
easi
ng le
vel o
f com
mitm
ent o
r effo
rt o
n cu
stom
er’s
par
t >>
The Ladder of Comm
itment (christopherspenn.com
)
Buy something

Affiliate marketing

Any opportunity to be helpful is an
opportunity to earn money. @chrisbrogan

Earned
Spent
Money

Find Grow

866-804-0076www.whatcounts.com
@WhatCountswww.whatcounts.com/facebookwww.whatcounts.com/linkedin
www.whatcounts.com/gpluswww.whatcounts.com/pinterest

Questions?