What role for private employment services on the labour market? By Stefano Scarpetta
19
WHAT ROLE FOR PRIVATE EMPLOYMENT SERVICES ON THE LABOUR MARKET? Stefano Scarpetta Director of Employment, Labour and Social Affairs OECD CIETT World Employment Conference 28 th May 2015, Rome
-
Upload
assolavoro -
Category
Recruiting & HR
-
view
102 -
download
1
Transcript of What role for private employment services on the labour market? By Stefano Scarpetta

WHAT ROLE FOR PRIVATE
EMPLOYMENT SERVICES
ON THE LABOUR MARKET?
Stefano ScarpettaDirector of Employment, Labour and Social AffairsOECD
CIETT World Employment Conference28th May 2015, Rome

KEY CHALLENGES
2

The jobs recovery remains incomplete
Note: Countries shown by ascending order of the maximum gap (country-specific trough).a) Aggregate of 15 OECD countries of the euro area.Source: OECD calculations based on OECD Economic Outlook (database), http://dx.doi.org/10.1787/data-00688-en.
Employment gap Percentage-points change in the employment rate since the onset of the crisis (Q4 2007)
POLISR
DEUAUT
AUSCHL
TURLU
XBEL
CHEKOR
CZEHUN
FRAJP
NNOR
SWEOECD
CANSVK
NLD GBR
EA15 (a
)ITA
MEXNZL
FIN USADNK
SVNPRT
EST ISLESP
GRC IRL-15
-10
-5
0
5
10
Maximum gap(country-specific trough)
Current gap (Q4 2014)
Projected gap (Q4 2016)
%

Unemployment is declining but further progress is required
Note: Countries shown by ascending order of the current unemployment rate (Q4 2014).a) Aggregate of 15 OECD countries of the euro area.Source: OECD calculations based on OECD Economic Outlook (database), http://dx.doi.org/10.1787/data-00688-en.
Unemployment ratePercentage of the labour force
KORJP
NNOR
CHEMEX
DEU ISLISR
GBRUSA
AUTNZL
CZEAUS
DNKCHL
ESTCAN
LUXOECD
NLD HUNSWE
POLBEL
FIN SVNFRA IRL
TUR
EA15 (a
)SVK ITA
PRTESP
GRC0
5
10
15
20
25
30
Current value(Q4 2014)
Start of the crisis (Q4 2007)
Projected value (Q4 2016)
%

Long-term unemployment remains persistently high
Note: Countries are shown in ascending order of the incidence of long-term unemployment in Q4 2014.a) Data are not seasonally adjusted but smoothed using three-quarter moving averages. OECD is the weighted average of 33 OECD countries excluding Chile. b) 2014 for Israel. Source: OECD calculations based on quarterly national labour force surveys.
Long-term unemployed (more than one year) as a percentage of total unemployed,a
Q4 2007-Q4 2014b
KORMEX ISR
NZL ISLCAN
TURSWE
AUSUSA
DNK FIN LUX
AUTNOR
GBR G7OECD
CHEJP
NPOL
FRANLD EST
DEUHUN
CZEEU28 BEL
EA19 ESPSVN IRL
PRT ITASVK
GRC0
10
20
30
40
50
60
70
80Q4 2007 Q4 2014
%

The NEET rate among youth has increased
Percentage of youth (aged 15-29)
a) OECD is the unweighted average of 32 countries (excluding Chile and Israel).b) 2008 for Korea.c) 2013 for Korea and the United States.Source : OECD estimates based on national labour force surveys.
A. NEET rate in 2014c, selected OECD countries B. Percentage-points change in NEET rate, 2007b – 14c, selected OECD countries
0
5
10
15
20
25
30
35
40
45
Share of youth population unemployed and not in education or training in 2014
Share of youth population inactive and not in education or training in 2014
NEET rate in 2007
%
-15
-10
-5
0
5
10
15Share of youth population unemployed and not in education or training
Share of youth population inactive and not in education or training
NEET rate
%

7
Mismatch is prevalent whether by skills, qualifications or field
Prevalence of skills, qualification and field-of-study mismatchAs a percentage of employed workers, 2012a,b
*The OECD Survey of Adult Skills only covered Flanders (BEL) and England/N. Ireland (GBR).a) Workers are classified as mismatched by qualification if they have higher or lower qualifications than required by their job; workers are classified as mismatched in terms of literacy skills if they have literacy proficiency exceeding or below that required in their job; workers are classified as mismatched by field of study if they are working in an occupation that is not related to their field of study.b) Occupation is only available at the 2-digit level in the ISCO-08 classification for Australia. It is not possible to assess the extent of field of study mismatch using the same definition used for other countries.Source: OECD calculations based on the Survey of Adult Skills (PIAAC) 2012.

Many of the jobs destroyed as a result of the crisis will not come back in the recovery
Annual percentage change, employees in the non-agricultural business sector,a Q4 2007-Q4 2014
a) Manufacturing refers to mining, manufacturing and utilities and business services to trade, transport and communication, accommodation and food services, financial services, real estate and business services.
Source: OECD calculations based on the European quarterly national accounts, on the Current Employment Statistics survey for the United States and on the labour force survey for Japan.
Manufacturing Construction Business services Non-agricultural business sector
Euro area Japan United States
Q4 200
7
Q3 200
8
Q2 200
9
Q1 201
0
Q4 201
0
Q3 201
1
Q2 201
2
Q1 201
3
Q4 201
3
Q3 201
4-5
-4
-3
-2
-1
0
1
2
3%
Q4 200
7
Q3 200
8
Q2 200
9
Q1 201
0
Q4 201
0
Q3 201
1
Q2 201
2
Q1 201
3
Q4 201
3
Q3 201
4-3
-2
-1
0
1
2%
Q4 200
7
Q3 200
8
Q2 200
9
Q1 201
0
Q4 201
0
Q3 201
1
Q2 201
2
Q1 201
3
Q4 201
3
Q3 201
4-10
-8
-6
-4
-2
0
2
4%

Changes in the composition of employment by type of contract
Annual percentage change in total employment by work status
in the euro area, Q4 2007-Q4 2014
Source: OECD calculations based on the European Labour Force Survey (EU-LFS).
Q4 200
7
Q1 200
8
Q2 200
8
Q3 200
8
Q4 200
8
Q1 200
9
Q2 200
9
Q3 200
9
Q4 200
9
Q1 201
0
Q2 201
0
Q3 201
0
Q4 201
0
Q1 201
1
Q2 201
1
Q3 201
1
Q4 201
1
Q1 201
2
Q2 201
2
Q3 201
2
Q4 201
2
Q1 201
3
Q2 201
3
Q3 201
3
Q4 201
3
Q1 201
4
Q2 201
4
Q3 201
4
Q4 201
4-3
-2
-1
0
1
2
3
Permanent Temporary Self-employed Employed
%

KEY BUILDING BLOCKS FOR FOSTERING MORE
INCLUSIVE AND RESILIENT LABOUR MARKETS
10

The central role of the Employment Service
11
Inclusive and
resilient labour
markets
Opportunities
EmployabilityMotivationEnsuring that
jobseekers have the motivation to seek
work
Intensive case management,
placement services and participation in
measures to increase employability
Addressing demand-side barriers and expanding employment opportunities for jobseekers

Effective and efficient labour market policies and institutions
12
How can the employment
services achieve more with less?
Which role can PPPs and contracted out
services play?
How to address the challenges of decentralised
systems?
How to manage performance and
ensure continuous improvement and
learning?

Effective and efficient labour market policies and institutions
13
How can the employment
services achieve more with less?
Transition to e-services as one solution
(e.g. in EU, BRA, MEX, IND, DEU)
Saving costs, while also increasing service
availability and accessibility?
E.g. though online benefit applications (e.g. in AUS, GBR, TUR, ESP, and ITA)
Far-reaching changes in NLD: 2/3 of local PES offices closed
Effective and efficient labour market policies and institutions
14
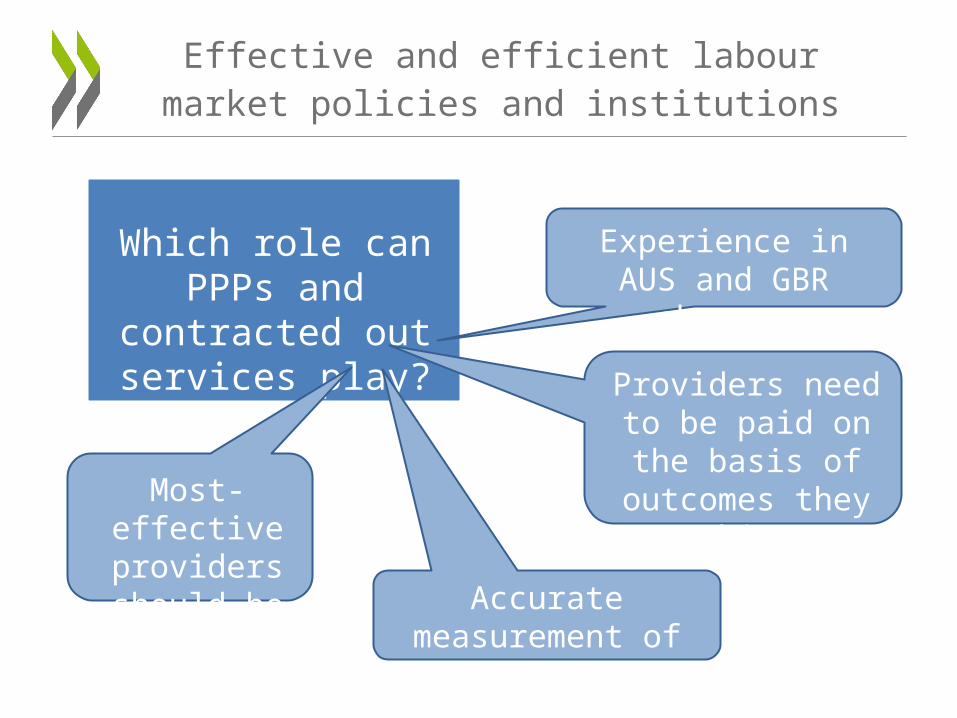
Which role can PPPs and contracted out
services play?
Experience in AUS and GBR shows …
Providers need to be paid on the basis of
outcomes they achieve
Accurate measurement of performance is key
Most-effective providers should
be able to expand

• Restrictions on private employment agencies relate to fees, types of employment, licensing by the authorities, etc. have been eased.
• Temporary work agency (TWA) assignments in OECD countries represent a fraction of total employment, but they account for large share of job starts in some countries.
Significance of TWA work for the overall employment services:- Major source of job vacancies for the unemployed - TWA assignments may convert to a permanent post, or provide
work experience that allows other placements e.g. “reverse marketing” of the hard-to-place unemployed
- There is a risk of cycling between short-term contracts and benefits
15
Private agencies in the labour market

• PES often outsource a high percentage of their budget for individual jobseeker services, e.g. job clubs, training.
• Where PES outsource the individual case management function, PrEAs tend to be one of the successful bidder.
• Outsourcing of case management is structured variably, e.g.– Targeted on all registered unemployed vs. specific groups; – Voluntary jobseeker participation and freedom to switch provider at any
time vs. assignment or multi-year commitment to the provider– Purchaser defines provider processes vs. provider autonomy (“black box”)– Fixed fees vs. payment for results; e.g. payment for 6-month job outcomes
• Since the mid-2000s, the recourse to outsourced case management has increased in some countriers, UK (Work Programme, 2011) and Ireland (JobPath, 2015). There is also some non-OECD business (Saudi Arabia).
16
Experiences with outsourcing

Effective and efficient labour market policies and institutions
17
How to address the challenges of decentralised
systems?
Usually, federal funding for unemployment benefits
Employment services managed by the
regional or local level (e.g. CAN, CHE, ESP, ITA, DNK)
CHE & DEU: comparative benchmarking of local offices
DNK: national authorities define key procedures

Effective and efficient labour market policies and institutions
18
How to manage performance and
ensure continuous improvement and
learning?Performance indicators
should show relation between inputs and
final outcomes
In OECD, expenditure on PES and ALMPs
ranges from 0.01% to 2.1% of GDP
Evaluation is crucial to ensure effective and efficient spending
Test locally and evaluate before national rollout

19
Thank you
Read more about our work
Email: [email protected]
Website: www.oecd.org/employment/outlook
Follow us on Twitter : @OECD_Social