Pensions at a Glance: Latin America and the Caribbean...John P. Martin, Monika Queisser, Stefano...
180
Pensions at a Glance: Latin America and the Caribbean Public Disclosure Authorized Public Disclosure Authorized Public Disclosure Authorized Public Disclosure Authorized
Transcript of Pensions at a Glance: Latin America and the Caribbean...John P. Martin, Monika Queisser, Stefano...

Consult this publication on line at http://dx.doi.org/10.1787/pension_glance-2014-en.
This work is published on the OECD iLibrary, which gathers all OECD books, periodicals and statistical databases.Visit www.oecd-ilibrary.org for more information.
Pensions at a Glance:Latin America and the Caribbean
Pensions at a Glance: Latin America and the CaribbeanContentsIntroduction
Executive summary
Chapter 1. Policy issues: Coverage and adequacy
Chapter 2. Key demographic indicators
Chapter 3. Key pension policy indicators
Chapter 4. Pensions at a Glance: Latin America and the Caribbean – Country profi les
ISBN 978-92-64-22054-681 2014 18 1 P
Pen
sion
s at a Glance
: Latin A
merica an
d th
e Carib
bean
9HSTCQE*ccafeg+
Pub
lic D
iscl
osur
e A
utho
rized
Pub
lic D
iscl
osur
e A
utho
rized
Pub
lic D
iscl
osur
e A
utho
rized
Pub
lic D
iscl
osur
e A
utho
rized
WB456286
Typewritten Text
94320


Pensions at a Glance
LATIN AMERICA AND THE CARIBBEAN

This work is published on the responsibility of the Secretary-General of the OECD. The
opinions expressed and arguments employed herein do not necessarily reflect the official
views of OECD member countries, the World Bank, its Board of Executive Directors, or of
the governments they represent or of the Inter-American Development Bank, its Board of
Directors, or the countries they represent.
This document and any map included herein are without prejudice to the status of or
sovereignty over any territory, to the delimitation of international frontiers and boundaries
and to the name of any territory, city or area.
ISBN 978-92-64-22054-6 (print)ISBN 978-92-64-22496-4 (PDF)
Photo credits: Cover © .
Corrigenda to OECD publications may be found on line at: www.oecd.org/about/publishing/corrigenda.htm.
© OECD, The International Bank for Reconstruction and Development/The World Bank and IADB 2014
This work is available under the Creative Commons Attribution Non-Commercial No Derivatives 3.0 IGO license (CC BY-NC-ND 3.0 IGO)
http://creativecommons.org/licenses/by-nc-nd/3.0/igo/legalcode, you are free to copy, redistribute and adapt the material, including for
commercial purposes, under the following conditions:
Attribution – Please cite the work as follows: OECD/IDB/The World Bank (2014), Pensions at a Glance: Latin America and the Caribbean,
OECD Publishing. DOI: 10.1787/pension_glance-2014-en. License (CC BY-NC-ND 3.0 IGO).
Translations – If you create a translation of this work, please add the following disclaimer along with the attribution: This translation
was not created by the OECD, The World Bank or IADB and should not be considered an official OECD, The World Bank or IADB
translation. The OECD, The World Bank or IADB shall not be liable for any content or error in this translation.
Adaptations – If you create an adaptation of this work, please add the following disclaimer along with the attribution: This is an
adaptation of an original work by the OECD, The World Bank and the IADB. Responsibility for the views and opinions expressed in the
adaptation rests solely with the author or authors of the adaptation and are not endorsed by the OECD, The World Bank or the IADB.
Third-party content – the OECD, The World Bank or the IADB do not necessarily own each component of the content contained within
the work. Therefore, neither the OECD nor The World Bank or the IADB warrant that the use of any third-party owned individual
component or part contained in the work will not infringe on the rights of those third parties. The risk of claims resulting from such
infringement rests solely with you. If you wish to re-use a component of the work, it is your responsibility to determine whether
permission is needed for that re-use and to obtain permission from the copyright owner. Examples of components can include, but are
not limited to, tables, figures, or images.
All queries on rights and licenses should be addressed to OECD e-mail: [email protected].
Please cite this publication as:OECD/IDB/The World Bank (2014), Pensions at a Glance: Latin America and the Caribbean,OECD Publishing.http://dx.doi.org/10.1787/pension_glance-2014-en

FOREWORD
PENSIONS AT A GLANCE: LATIN AMERICA AND THE CARIBBEAN © OECD, THE WORLD BANK AND IDB 2014 3
Foreword
Pensions at a Glance in Latin America and the Caribbean provides for the first time an ample
range of indicators for comparing pension system design of 26 countries in Latin America and the
Caribbean. The indicators are comparable with those of OECD countries and selected G20 members,
published by the OECD.
This report was prepared jointly by the pension teams in the Labor Markets and Social Security
Unit of the Inter-American Development Bank (IDB), the Social Policy Division of the Organisation for
Economic Co-operation and Development (OECD) Directorate for Employment, Labour and Social
Affairs, and the Social Protection and Labor Global Practice of the World Bank (WB). The core team
was composed of Angel Melguizo (OECD, formely IDB), David Kaplan (IDB), Robert Palacios (WB),
Carolina Romero (WB), Anna Cristina d’Addio (OECD), Andrew Reilly (OECD) and Edward
Whitehouse (OECD).
National officials from Ministries of Labour, Ministries of Social Protection, Ministries of Finance
and Pension authorities in all 26 Latin American and Caribbean countries provided active and
invaluable input to the report, confirming and validating the country profiles in almost all cases. We
would like to acknowledge the contributions from Camila Mejia (IDB) and Brooks Evans (consultant,
World Bank), the effective dialogue led by Nathyeli Acuna and Ana Paula Sanchez (IDB), and the
support of the Knowledge and Learning Sector at the IDB, in particular from Maria Nelly Pavisich
throughout this process.
The report has benefited from the commentary of many other national officials and colleagues,
notably Mariano Bosch, Santiago Levy, Carmen Pages-Serra and Norbert R. Schady from the IDB,
John P. Martin, Monika Queisser, Stefano Scarpetta and Anne Sonnet from the OECD and
Phillip O’Keefe, Gonzalo Reyes, Rafael Rofman and Fiona Stewart from the World Bank.
The OECD pension models, that underpin the indicators of pension entitlements, use the APEX
(Analysis of Pension Entitlements across Countries) models developed by Axia Economics.


TABLE OF CONTENTS
PENSIONS AT A GLANCE: LATIN AMERICA AND THE CARIBBEAN © OECD, THE WORLD BANK AND IDB 2014 5
Table of contents
Acronyms and abbreviations . . . . . . . . . . . . . . . . . . . . . . . . . . . . . . . . . . . . . . . . . . . . . . . . . 7
Executive summary . . . . . . . . . . . . . . . . . . . . . . . . . . . . . . . . . . . . . . . . . . . . . . . . . . . . . . . . . 9
Introduction . . . . . . . . . . . . . . . . . . . . . . . . . . . . . . . . . . . . . . . . . . . . . . . . . . . . . . . . . . . . . . . 11
Chapter 1. Policy issues: Coverage and adequacy . . . . . . . . . . . . . . . . . . . . . . . . . . . . . . . . 13
Coverage and contribution density . . . . . . . . . . . . . . . . . . . . . . . . . . . . . . . . . . . . . . . . 14
Future adequacy of retirement incomes . . . . . . . . . . . . . . . . . . . . . . . . . . . . . . . . . . . . 20
Economic well-being of the elderly . . . . . . . . . . . . . . . . . . . . . . . . . . . . . . . . . . . . . . . . 23
Pensions and retirement incomes . . . . . . . . . . . . . . . . . . . . . . . . . . . . . . . . . . . . . . . . . 26
Social pensions . . . . . . . . . . . . . . . . . . . . . . . . . . . . . . . . . . . . . . . . . . . . . . . . . . . . . . . . . 27
Conclusion . . . . . . . . . . . . . . . . . . . . . . . . . . . . . . . . . . . . . . . . . . . . . . . . . . . . . . . . . . . . . 32
Notes. . . . . . . . . . . . . . . . . . . . . . . . . . . . . . . . . . . . . . . . . . . . . . . . . . . . . . . . . . . . . . . . . . 32
References . . . . . . . . . . . . . . . . . . . . . . . . . . . . . . . . . . . . . . . . . . . . . . . . . . . . . . . . . . . . . 33
Chapter 2. Key demographic indicators . . . . . . . . . . . . . . . . . . . . . . . . . . . . . . . . . . . . . . . . 39
Fertility . . . . . . . . . . . . . . . . . . . . . . . . . . . . . . . . . . . . . . . . . . . . . . . . . . . . . . . . . . . . . . . . 40
Life expectancy . . . . . . . . . . . . . . . . . . . . . . . . . . . . . . . . . . . . . . . . . . . . . . . . . . . . . . . . . 42
Old-age support ratio . . . . . . . . . . . . . . . . . . . . . . . . . . . . . . . . . . . . . . . . . . . . . . . . . . . . 44
Chapter 3. Key pension policy indicators . . . . . . . . . . . . . . . . . . . . . . . . . . . . . . . . . . . . . . . 47
Architecture of national pensions systems . . . . . . . . . . . . . . . . . . . . . . . . . . . . . . . . . 48
Methodology and assumptions . . . . . . . . . . . . . . . . . . . . . . . . . . . . . . . . . . . . . . . . . . . 50
Gross pension replacement rates . . . . . . . . . . . . . . . . . . . . . . . . . . . . . . . . . . . . . . . . . . 52
Tax treatment of pensions and pensioners . . . . . . . . . . . . . . . . . . . . . . . . . . . . . . . . . 54
Net pension replacement rates. . . . . . . . . . . . . . . . . . . . . . . . . . . . . . . . . . . . . . . . . . . . 56
Gross pension wealth. . . . . . . . . . . . . . . . . . . . . . . . . . . . . . . . . . . . . . . . . . . . . . . . . . . . 58
Net pension wealth . . . . . . . . . . . . . . . . . . . . . . . . . . . . . . . . . . . . . . . . . . . . . . . . . . . . . 60
Pension-earnings link . . . . . . . . . . . . . . . . . . . . . . . . . . . . . . . . . . . . . . . . . . . . . . . . . . . 62
Weighted averages: Pension levels and pension wealth . . . . . . . . . . . . . . . . . . . . . . . 64
Retirement-income package . . . . . . . . . . . . . . . . . . . . . . . . . . . . . . . . . . . . . . . . . . . . . . 66
Chapter 4. Pensions at a Glance/Latin America and the Carribean – Country profiles . . 69
Guide to the country profiles . . . . . . . . . . . . . . . . . . . . . . . . . . . . . . . . . . . . . . . . . . . . . 70
Argentina . . . . . . . . . . . . . . . . . . . . . . . . . . . . . . . . . . . . . . . . . . . . . . . . . . . . . . . . . . . . . . 72
Bahamas. . . . . . . . . . . . . . . . . . . . . . . . . . . . . . . . . . . . . . . . . . . . . . . . . . . . . . . . . . . . . . . 77
Barbados. . . . . . . . . . . . . . . . . . . . . . . . . . . . . . . . . . . . . . . . . . . . . . . . . . . . . . . . . . . . . . . 80
Belize . . . . . . . . . . . . . . . . . . . . . . . . . . . . . . . . . . . . . . . . . . . . . . . . . . . . . . . . . . . . . . . . . 84
Bolivia . . . . . . . . . . . . . . . . . . . . . . . . . . . . . . . . . . . . . . . . . . . . . . . . . . . . . . . . . . . . . . . . . 88
Brazil . . . . . . . . . . . . . . . . . . . . . . . . . . . . . . . . . . . . . . . . . . . . . . . . . . . . . . . . . . . . . . . . . . 92
Chile . . . . . . . . . . . . . . . . . . . . . . . . . . . . . . . . . . . . . . . . . . . . . . . . . . . . . . . . . . . . . . . . . . 96

TABLE OF CONTENTS
PENSIONS AT A GLANCE: LATIN AMERICA AND THE CARIBBEAN © OECD, THE WORLD BANK AND IDB 20146
Colombia . . . . . . . . . . . . . . . . . . . . . . . . . . . . . . . . . . . . . . . . . . . . . . . . . . . . . . . . . . . . . . 100
Costa Rica. . . . . . . . . . . . . . . . . . . . . . . . . . . . . . . . . . . . . . . . . . . . . . . . . . . . . . . . . . . . . . 105
Dominican Republic . . . . . . . . . . . . . . . . . . . . . . . . . . . . . . . . . . . . . . . . . . . . . . . . . . . . . 111
Ecuador. . . . . . . . . . . . . . . . . . . . . . . . . . . . . . . . . . . . . . . . . . . . . . . . . . . . . . . . . . . . . . . . 115
El Salvador . . . . . . . . . . . . . . . . . . . . . . . . . . . . . . . . . . . . . . . . . . . . . . . . . . . . . . . . . . . . . 119
Guatemala . . . . . . . . . . . . . . . . . . . . . . . . . . . . . . . . . . . . . . . . . . . . . . . . . . . . . . . . . . . . . 123
Guyana . . . . . . . . . . . . . . . . . . . . . . . . . . . . . . . . . . . . . . . . . . . . . . . . . . . . . . . . . . . . . . . . 127
Haiti . . . . . . . . . . . . . . . . . . . . . . . . . . . . . . . . . . . . . . . . . . . . . . . . . . . . . . . . . . . . . . . . . . 131
Honduras . . . . . . . . . . . . . . . . . . . . . . . . . . . . . . . . . . . . . . . . . . . . . . . . . . . . . . . . . . . . . . 134
Jamaica . . . . . . . . . . . . . . . . . . . . . . . . . . . . . . . . . . . . . . . . . . . . . . . . . . . . . . . . . . . . . . . . 137
Mexico . . . . . . . . . . . . . . . . . . . . . . . . . . . . . . . . . . . . . . . . . . . . . . . . . . . . . . . . . . . . . . . . 140
Nicaragua . . . . . . . . . . . . . . . . . . . . . . . . . . . . . . . . . . . . . . . . . . . . . . . . . . . . . . . . . . . . . . 144
Panama. . . . . . . . . . . . . . . . . . . . . . . . . . . . . . . . . . . . . . . . . . . . . . . . . . . . . . . . . . . . . . . . 148
Paraguay . . . . . . . . . . . . . . . . . . . . . . . . . . . . . . . . . . . . . . . . . . . . . . . . . . . . . . . . . . . . . . . 153
Peru . . . . . . . . . . . . . . . . . . . . . . . . . . . . . . . . . . . . . . . . . . . . . . . . . . . . . . . . . . . . . . . . . . . 157
Suriname . . . . . . . . . . . . . . . . . . . . . . . . . . . . . . . . . . . . . . . . . . . . . . . . . . . . . . . . . . . . . . 162
Trinidad and Tobago . . . . . . . . . . . . . . . . . . . . . . . . . . . . . . . . . . . . . . . . . . . . . . . . . . . . . 165
Uruguay . . . . . . . . . . . . . . . . . . . . . . . . . . . . . . . . . . . . . . . . . . . . . . . . . . . . . . . . . . . . . . . 169
Venezuela. . . . . . . . . . . . . . . . . . . . . . . . . . . . . . . . . . . . . . . . . . . . . . . . . . . . . . . . . . . . . . 173
Look for the StatLinks2at the bottom of the tables or graphs in this book.
To download the matching Excel® spreadsheet, just type the link into your
Internet browser, starting with the http://dx.doi.org prefix, or click on the link from
the e-book edition.
Follow OECD Publications on:
This book has... StatLinks2A service that delivers Excel files from the printed page! ®
http://twitter.com/OECD_Pubs
http://www.facebook.com/OECDPublications
http://www.linkedin.com/groups/OECD-Publications-4645871
http://www.youtube.com/oecdilibrary
http://www.oecd.org/oecddirect/ OECD
Alerts

ACRONYMS AND ABBREVIATIONS
PENSIONS AT A GLANCE: LATIN AMERICA AND THE CARIBBEAN © OECD, THE WORLD BANK AND IDB 2014 7
Acronyms and abbreviations
APEX Analysis of Pension Entitlements across Countries
DB Defined-benefit
DC Defined-contribution
IDB Inter-American Development Bank
GDP Gross domestic product
PAYG Pay as you go
SA Social assistance
ArgentinaINDEC National Institute of Statistics and Census
RIPTE Average taxable wages of full-time employees
PBU Basic Pension Benefit
SSS Secretariat of Social Security
BoliviaCCM Monthly Contribution Compensation
UFV Housing Promotion Unit
ColombiaDANE National Administrative Department of Statistics
FGPM Minimum Pension Guarantee Fund
GPM Minimum Pension Guarantee
IPC Consumer Price Index
MFMP Medium-term Fiscal Framework
PPSAM Older Adult Social Protection Programme
RAIS Individual Savings System with a Welfare Benefit
RPM Defined-benefit of Average Premiums
UVT Tax Value Unit
ChileUF Unit of account
Costa RicaCCSS Costa Rican Social Insurance Fund
FCL Workers’ Pension Fund
IMAS Social Assistance Institute
INA National Technical Institute
ROP Mandatory Pension System

ACRONYMS AND ABBREVIATIONS
PENSIONS AT A GLANCE: LATIN AMERICA AND THE CARIBBEAN © OECD, THE WORLD BANK AND IDB 20148
Dominican RepublicSESPAS State Secretariat of Public Health and Social Assistance
HondurasIHSS Honduran Social Security Institute
ParaguayIPS Paraguayan Social Insurance Institute
IRP Individual Income Tax
PeruCIC Individual Savings Accounts
EPS Health Care Facility
REJA Early Retirement Scheme due to Unemployment
SIAF Integrated System of Financial Administration
SNP National Pension System
SPP Private Pension System
UruguayBPC Benefits and Contributions thresholds
IASS Social Security Assistance Tax
VenezuelaIMS Median Salary Index
IVSS Venezuelan Institute of Social Security
UT Tax unit

Pensions at a Glance
Latin America and the Caribbean
© OECD, The World Bank and IDB 2014
9
Executive summary
The biggest pension policy challenge faced by most countries in Latin America and theCaribbean (LAC) today is low coverage of formal pension systems, both in terms of theproportion of workers participating in pension schemes and the proportion of the elderlyreceiving some kind of pension income. Efforts to close the coverage gap, for example,through non-contributory pensions, are therefore at the heart of the pension policy debatein the region. However, these policies might pose significant fiscal challenges in the nextdecades as the population ages. Chapter 2 presents three main indicators describing thedemographic conditions relevant for pension policy, namely fertility rates, life expectancyand old-age support ratios. This is followed by a systematic comparison, in Chapter 3, ofsystem designs across countries using the standard OECD Pensions at a Glance typology andpresenting several key indicators of adequacy, including gender-specific gross and netreplacement rates and pension wealth at different income levels. Finally, Chapter 4 providesthe profiles of each pension system in Latin America and the Caribbean in terms of theirarchitecture, rules and parameters.
Key findingsActive coverage, i.e. contribution payments of workers to mandatory pension schemes,is low in LAC countries. On average in the region, only 45 in 100 workers are contributing
to or affiliated with a pension scheme, a share that has not changed much in the last
decades, despite significant structural pension reforms. However, some countries have
expanded the share of individuals aged 65 or older receiving pension benefits, mostly by
means of non-contributory pensions and special regimes for the self-employed.
The low level of contributions to pension schemes reflects a series of socioeconomic
characteristics, notably education, gender and income. Educational attainment has a
significant impact on the likelihood of contributing to pension systems: more educated
workers are more likely to contribute than less educated workers. Gender is also important
as the average labour force participation rate for women in LAC is 56% compared with 83%
for men. The gender gap ranges from 20% in Bolivia, Chile, Jamaica, and Uruguay to 40% in
Guatemala, Honduras and Mexico. Finally, income differences between households also
have an important impact. Workers in the highest quintile of the income distribution have
relatively high rates of contribution, while low-income workers rarely contribute to
pension schemes. Only 20 to 40% of the middle-income workers contribute to pension
schemes, making them particularly vulnerable to old age poverty risks.
A key determinant of pension coverage in LAC is the type of employment. On average,
64 out of 100 salaried workers contribute to a pension scheme in LAC compared to only 17
out of 100 self-employed workers. The size of the firm also matters. In big firms with over
50 workers, 71% of salaried workers contribute, compared with 51% in medium-sized firms
(with 6 to 50 workers) and 24% in small ones (with fewer than six workers).

EXECUTIVE SUMMARY
PENSIONS AT A GLANCE: LATIN AMERICA AND THE CARIBBEAN © OECD, THE WORLD BANK AND IDB 201410
Frequent transitions between formality, informality and inactivity generate very
significant contribution gaps in workers’ careers in LAC, which will put the adequacy of
future retirement incomes at risk. In almost all systems, incomplete contribution histories
result in lower pension entitlements, or even ineligibility, which means that both the size
of these contribution gaps and their distribution over time need to be examined.
A large share of older people in LAC will have to rely on other sources of income thancontributory pensions, such as work income, assets such as housing, transfers, social
pensions and informal family support. Household structure, an important factor for the
well-being of the elderly, shows that poorer older people are more likely to be living with a
family member. Most of the elderly poor in the region live in multi-generational
households suggesting that their welfare is closely tied to that of their family. The
long-term trends of increased urbanisation and lower fertility will likely weaken these ties
in the future, which will make access to the formal pension system more important.
The role of social pensions in LAC is expanding and, in some countries, they are alreadya major element of the pension system. These programmes have taken various forms
with varying outcomes across countries. In terms of coverage and relative generosity,
social pensions are most important in Guyana and Bolivia, followed by Venezuela and
Brazil.
In sum, a two-pronged approach will be needed in order to deal with the coverage gap.It is important to increase formal labour market participation, especially for women, so
that people can build future pension entitlements in their own right. To the extent possible,
workers should be integrated into the contributory systems to boost pension savings and
ensure pension adequacy. At the same time, the role for non-contributory (social) pensions
is increasing throughout the region and can be a powerful tool for improving the economic
well-being of the elderly. These programmes should be assessed both from the
perspectives of adequacy and financial sustainability as well as how they interact with
other elements of the social protection system, including social assistance and
contributory pensions.

INTRODUCTION
PENSIONS AT A GLANCE: LATIN AMERICA AND THE CARIBBEAN © OECD, THE WORLD BANK AND IDB 2014 11
Introduction
The biennial OECD Pensions at a Glance series was launched in 2005 for OECD countries and
subsequently expanded in 2011 to include the remaining G20 countries. Following the launch
of Pensions at a Glance Asia-Pacific in 2009, this new regional publication covers pensions in Latin
America and the Caribbean; it is a joint product by the Inter-American Development Bank, the
Organisation for Economic Co-operation and Development and the World Bank.
The main objective of OECD Pensions at a Glance is to provide a set of indicators of pension
system design using a standard methodology that allows for comparison. These indicators are
not intended to show which design is superior but rather, to allow for cross-country
comparisons. As in previous volumes in the series, this volume includes a special analytical
chapter on a subject considered to be a high priority for policy makers in the region. In this
issue, the coverage and adequacy of Latin American pension systems are analysed.
Starting in the early 1990s, a series of pension reforms were introduced throughout
Latin America, altering the fundamental design of many pension systems in the region. In
particular to address the long-term financial sustainability in the context of population
ageing, a number of countries moved from defined-benefit pay-as-you-go public pension
systems to systems relying heavily on privately-managed individual accounts.
While the financial sustainability of pension systems may have improved in many
countries, there was, however, little or no progress on a second key measure of
performance, namely coverage. The challenge of increasing coverage, often through
non-contributory pensions, has become the issue most discussed in the region today.*
Coverage, defined both as the proportion of workers participating in pension schemes
and the proportion of the elderly receiving some kind of pension income, continues to be
the most important pension challenge in the region. In the two decades that followed the
pension reforms in Latin America, the share of workers contributing to a pension system
of any kind barely changed in most countries, leading to a growing emphasis on policies
that would address the stubborn coverage gap. The general issue of coverage and more
specifically contribution density is covered in Chapter 1 of this report.
In addition to sustainability and coverage, the third key measure of a pension system
is adequacy and this report aims to provide a set of comparable indicators across the region
for the first time. This first edition of Pensions at a Glance: Latin America and the Caribbean
extends the comparative analysis of adequacy and benefit design that has largely been
restricted to the higher income OECD countries until now.
* See for example, Rofman, R., I. Apella and E. Vezza (2013), “Mas Allá de las Pensiones Contributivas:Catorce Experiencias en América Latina”, World Bank, Washington, DC; and Bosch, M., A. Melguizoand C. Pagés (2013), “Better Pensions, Better Jobs: Towards Universal Coverage in Latin America andthe Caribbean”, Inter-American Development Bank, Washington, DC.

INTRODUCTION
PENSIONS AT A GLANCE: LATIN AMERICA AND THE CARIBBEAN © OECD, THE WORLD BANK AND IDB 201412
These comparisons are difficult without a standardised methodology and presenting
the information across countries in an easily understandable manner is a challenge. The
collaboration of the three institutions responsible for this study has made it possible to
expand the set of countries where these comparisons can be made. To this end,
Chapter 2 provides descriptive data on the underlying demographic conditions,
particularly those relevant for pension policy. This descriptive analysis is followed by a
systematic comparison of system design across countries using the standard OECD
Pensions at a Glance typology. Chapter 3 provides some key indicators of adequacy including
gross and net replacement rates and pension wealth for men and women at different
income levels.
Chapter 4 provides the profiles of each country’s pension system in 26 Latin American
countries in terms of their architecture, rules and parameters. This is the basis for the
comparative adequacy indicators. It is also a useful reference for researchers and
policymakers interested in specific details about individual countries.
Pensions at a Glance: Latin America and the Caribbean does not advocate any particular kind
of pension system or type of reform. The goal is to inform debates on retirement-income
systems with data that can be used as a reference point. This positive approach to the
analysis of adequacy also recognizes that the benefit design is, to a large extent, a decision
that will vary across societies. At the same time, as reform options are discussed in each
country, it is important to understand the trade-offs involved.
Through comparisons, countries can learn valuable lessons from other pension
systems and their experiences of retirement-income reforms. However, as in all attempts
to make valid international comparisons, there are limitations that should be noted. The
methodology applied (described in Chapter 3) involves simulating the outcomes for
individual workers under certain assumptions about when these individuals begin to work,
how long they contribute and the exogenous variables that affect the outcome including
wage growth, mortality and interest rates. Pension benefits are projected for workers at
different levels of earnings, covering all mandatory sources of retirement income for
private-sector workers, including minimum pensions, basic and means-tested schemes,
earnings-related programmes and defined contribution schemes. Also included is the
impact of the personal income tax and social security contributions on living standards in
work and in retirement: all indicators are presented gross and net of taxes and contributions.
The comparison is not of predicted outcomes but rather, the results for similar individuals
that are implied by the design of the pension scheme. So, for example, while two countries
may have similar, even identical system designs, a significant difference in the patterns of
contribution or life expectancy at retirement age would in practice, yield different actual
outcomes. Recognising the particular importance of this limitation for Latin America where
there is evidence of low contribution density, especially at the lower end of the income scales,
Chapter 1 of the report extends the usual micro-level analysis and reports on the sensitivity of
the results. The framework is flexible to changing assumptions, the impact of policy reforms
and economic developments on pension entitlements can be simulated.
Crucially, the indicators derived from the analysis refer to someone entering the
workforce today. It is prospective in this sense with the advantage that this approach takes into
account reforms that have already taken place. It does not, however, allow for comparisons of
those already retired based on earlier rules. This highlights the fact that pension scheme do
change over time and the indicators presented here will need to be updated in future volumes.

Pensions at a Glance
Latin America and the Caribbean
© OECD, The World Bank and IDB 2014
13
Chapter 1
Policy issues: Coverage and adequacy
The general issue of coverage and more specifically contribution density is coveredin Chapter 1. Coverage, defined both as the proportion of workers participating inpension schemes and the proportion of the elderly receiving some kind of pensionincome, continues to be the most important pension challenge in the region. In thetwo decades that followed the pension reforms in Latin America, the share ofworkers contributing to a pension system of any kind barely changed in mostcountries, leading to a growing emphasis on policies that would address thestubborn coverage gap. While two countries may have similar, even identicalsystem designs, a significant difference in the patterns of contribution or lifeexpectancy at retirement age would in practice, yield different actual outcomes.Recognising the particular importance of this limitation for Latin America wherethere is evidence of low contribution density, especially at the lower end of theincome scales, Chapter 1 of the report extends the usual micro-level analysis andreports on the sensitivity of the results.

1. POLICY ISSUES: COVERAGE AND ADEQUACY
PENSIONS AT A GLANCE: LATIN AMERICA AND THE CARIBBEAN © OECD, THE WORLD BANK AND IDB 201414
Coverage and contribution densityActive coverage,1 defined as the participation of workers in mandated pension
schemes, one of the conventional measures of formality,2 is low in much of Latin America
and the Caribbean (LAC). Some countries in the region have made significant progress in
terms of expanding the proportion of those aged 65 or older who are actually receiving
pension benefits, mostly due to the implementation of non-contributory pensions and
special regimes for the self-employed. Even in countries where a large percentage of the
labour force contributes to pension, pension contributions are often too irregular to finance
adequate old-age pensions for the majority of the population. Following the model of
traditional Bismarckian social insurance systems that is common in many OECD countries,
participation in pension saving schemes in LAC is largely determined by participation in
formal employment offering social protection coverage and accumulated pension
contributions. Policy makers in LAC face important challenges on both fronts, given the low
female participation rates and widespread informality in the region, which results in a lack
of coverage for some and low contribution densities for others.
According to 2010 household surveys in a range of countries,3 affiliation with and
contributions to pension systems are low on average in LAC and very low in many countries.
On average, only 45 in each 100 workers (aged between 15 and 64 years old) are contributing to
or affiliated with a pension scheme in the 19 countries analysed (see Figure 1.1).4 In other
words, approximately 130 million workers were not contributing in 2010 to an old-age pension
scheme. This situation is especially pronounced in some Andean and Central American
countries (Bolivia, Guatemala, Honduras, Nicaragua, Paraguay and Peru) where less than 20%
of the total workforce are contributing. Another group of countries, some of them among the
most dynamic of the region (such as Colombia, the Dominican Republic and Mexico), only 30
to 40% of all workers contribute. Finally, in most higher-income countries by regional
standards, such as Argentina, Brazil, Chile, Costa Rica, Panama and Uruguay, between 50 and
70% contribute. This is still low by international standards (Jütting and de Laiglesia, 2009).
Structural pension reforms during the 1990s in LAC, following the early experience of
Chile in 1981, did not change this picture (see Box 1.1 for a description of the evolution over the
last two decades). As Figure 1.1 shows, a range of different pension schemes have been
implemented in the region from the traditional defined-benefit pay-as-you-go public systems
to defined contributions based on individual capital accounts managed by the private sector
along with parallel and mixed structures. Overall, no particular type of pension scheme
predominates in terms of having higher pension contribution frequencies and higher numbers
of formal sector workers. (For an analysis of the macroeconomic effects of structural pension
reforms, see Gill et al., 2005 and for a focus on labor market dynamics, see Bosch et al., 2013.)
The low levels of contribution to pension schemes correlate to a series of socioeconomic
characteristics. Educational attainment has a powerful impact on the likelihood of
contributing to pension systems; more educated workers are more likely to contribute than
less educated workers. Data from the same household surveys show that, on average, only

1. POLICY ISSUES: COVERAGE AND ADEQUACY
PENSIONS AT A GLANCE: LATIN AMERICA AND THE CARIBBEAN © OECD, THE WORLD BANK AND IDB 2014 15
Figure 1.1. Contributors or affiliates as a percentage of total workers(aged 15-64 years), around 2010
DB = Defined benefit; DC = Defined contribution.Source: Bosch, M., A. Melguizo and C. Pagés (2013), “Better Pensions, Better Jobs: Towards Universal Coverage in LatinAmerica and the Caribbean”, Inter-American Development Bank, Washington, DC.
1 2 http://dx.doi.org/10.1787/888933161314
Box 1.1. Main trends in pension savings in Latin Americaand the Caribbean since the 1990s
Using available household survey data, Rofman and Oliveri (2012) studied activecoverage rates in most countries in LAC since the early 1990s. Their analysis confirmedthat active coverage rates have not increased significantly in the region remaining lowregardless of the type of pension scheme analysed.
The number of those contributing to or affiliated with a pension scheme as a percentageof the active labour force went down from 42% in the early 1990s to around 32% in the 2000sand then went back up to 37% by the end of the decade. On average, active pension coveragefell in almost all of the countries of the region between the early 1990s and the early 2000s,i.e. the period during which most private pension schemes were implemented. The differentfinancial crises inside and outside the region, the privatisation of public services and tradeliberalisation are some of the reasons behind these trends. At the end of the 2000s, coverageof the economically active population was less than 30% in eight countries (Bolivia, theDominican Republic, El Salvador, Guatemala, Honduras, Nicaragua, Paraguay and Peru) andabove 60% in only three (Chile, Costa Rica and Uruguay).
There are, however, significant differences among countries. In particular, countrieswith the highest coverage rates at the beginning of the 1990s (such as Chile and Uruguay)continued to consolidate their pension systems, reaching today coverage rates close to70%. Other countries, such as Peru and the Dominican Republic, have significantlyincreased their active coverage rates since the 1990s, even though they are still below 30%.In a third group of countries, such as Ecuador, Nicaragua, and Paraguay, the coverage ratecontinued to decline over the last two decades. No particular trend in coverage can beobserved in the remaining set of countries.
Given the low levels of pension contributions, other elements of the current labourmarkets in Latin America and the weak impact of growth, it is likely that pension coveragewill continue to be low in the future, thus presenting policy makers with one of the keychallenges for economic and social policy.
100
90
80
70
60
50
40
30
20
10
0
BOLPER PRY
GUAHON NIC EC
USLV COL
DOMJA
MMEX
VEN ARGPAN
BRACHL
URYCRI
% DC Parallel DB-DC DB Mixed DB-DC
LAC19 = 44.70%

1. POLICY ISSUES: COVERAGE AND ADEQUACY
PENSIONS AT A GLANCE: LATIN AMERICA AND THE CARIBBEAN © OECD, THE WORLD BANK AND IDB 201416
22% of workers with eight years of education or less contribute to any pension scheme,
compared to 42% of those who have between nine and 13 years of education, and 68% of
those who have 14 years or more. Again, there are large differences between countries. For
instance, in Bolivia, Paraguay and Peru, fewer than 5% of the least educated workers have a
formal job, while this percentage is considerably higher in Costa Rica (60%) and Uruguay
(54%). Moreover, the gap between the least and the most educated seems to be increasing
over time in countries such as Colombia, Peru and Venezuela (Rofman and Oliveri, 2012).
The likelihood that a worker contributes also has a gender dimension. The average labour
force participation rate for women in the LAC19 countries is 56% compared to 83% for men
(which compare with OECD averages of 62% and 80% respectively). The gender gap ranges
from 20% in Bolivia, Chile, Jamaica, and Uruguay to 40% in Guatemala, Honduras, and Mexico.
Women generally report fewer years of formal employment than men because of career
interruptions for child rearing and other caregiving responsibilities and of certain pension
policies encouraging their earlier retirement. These facts combined with women’s longer life
expectancy imply that women on average spend longer periods in retirement with lower
pensions, increasing the probability of female poverty in old-age. However, a comparison
between Chile and Brazil (OECD, 2012) showed that a significant proportion of women working
in different categories of informal employment in both countries have “indirect” pension
coverage through their spouses’ contributions, which entitle them to survivor pensions.
Women who participate in the labor market contribute very similarly to men in all
countries. The most significant differences in LAC can be observed in Costa Rica where
coverage is 12 percentage points higher for men and in Venezuela where it is 9% higher for
women. Given the weak connection of women with the labor market in many Latin
American countries, which translates into lower levels of coverage, non-contributory
pensions can play a key role in reducing old-age poverty among women (OECD, 2011).
Income differences between households also have an important impact on the
probability that people contribute. In all LAC countries, workers in the highest quintile (the
20% highest-income workers) have relatively high rates of contribution of between 80% and
98% in Costa Rica and Uruguay (see Figure 1.2). In contrast, low-income workers rarely
contribute to pension schemes; their rates of contribution exceed 20% only in one-quarter
of the sample (Brazil, Chile, Costa Rica, the Dominican Republic and Uruguay).
Middle-income workers defined in Easterly (2001) as workers in quintiles two to four
that contribute to a pension scheme represent between 20 and 40% of total employment in
half of the countries analysed (see Carranza et al., 2012 for an analysis of Colombia, Mexico
and Peru). In these countries, the so-called emerging middle class seems particularly
vulnerable to old-age poverty risks as they may not make enough contributions to qualify
for a pension (see OECD, 2010; and Ferreira et al., 2013).
In relative terms, the gap in pension contribution rates between the lowest quintile
and the middle class is largest in countries such as Argentina, Brazil, Panama, and
Venezuela where it exceeds 55 percentage points. In the majority of the countries displayed
in Figure 1.2, middle-income workers are very far from reaching the coverage rates of those
in the highest quintile, and in half of the countries (including some of the biggest
economies such as Colombia, Ecuador, Mexico and Peru), this difference exceeds
40 percentage points. The gap between the highest and lowest income quintiles is also very
large, especially in Colombia, Ecuador and Panama. These figures highlight another
important issue for policy makers in the decades to come – the potential impact of uneven
pension coverage and contributions on income inequality.

1. POLICY ISSUES: COVERAGE AND ADEQUACY
PENSIONS AT A GLANCE: LATIN AMERICA AND THE CARIBBEAN © OECD, THE WORLD BANK AND IDB 2014 17
Regardless of socioeconomic characteristics, the main determinant of pensioncoverage is the type of employment (as previously shown in Levy, 2008; Pagés, 2010; OECD,2010; and Ribe et al., 2010). On average, while 64 out of 100 salaried workers contribute to apension scheme in the LAC13 countries,5 only 17 out of 100 self-employed workers do so(see Figure 1.3). Among the LAC13 countries, only Brazil, Chile, Costa Rica and Uruguayseem to be getting significant pension savings from the self-employed. Voluntaryaffiliation in some cases, a lack of enforcement despite mandatory affiliation in others, andthe usual factors behind low pension savings (low and irregular income, myopia, andprocrastination) explain this challenging situation.
Figure 1.2. Contributors or affiliates as a percentage of total workers(aged 15-64 years) by income quintile, around 2010
Note: The household survey data for Jamaica do not make it possible to control for income levels.Source: Author based on Bosch, M., A. Melguizo and C. Pagés (2013), “Better Pensions, Better Jobs: Towards UniversalCoverage in Latin America and the Caribbean”, Inter-American Development Bank, Washington, DC.
1 2 http://dx.doi.org/10.1787/888933161329
Figure 1.3. Contributors or affiliates as a percentage of total workers(aged 15-64 years) by type of employment, around 2010
Note: The available data do not make it possible to differentiate contribution rates by occupation in Argentina, theDominican Republic, Ecuador, Jamaica, Peru, and Venezuela.Source: Bosch, M., A. Melguizo and C. Pagés (2013), “Better Pensions, Better Jobs: Towards Universal Coverage in LatinAmerica and the Caribbean”, Inter-American Development Bank, Washington, DC.
1 2 http://dx.doi.org/10.1787/888933161332
100
90
80
70
60
50
40
30
20
10
0
%
GUAPRY
PER BOLHON NIC EC
UMEX
COLSLV
DOMVEN ARG
PANBRA
CRICHL
URY
Q1 Q2-4 Q5
100
80
60
40
20
0
%
GUAPRY
BOLHON NIC
MEXPAN
BRACRI
CHLURY
COLSLV
Self-employed Employees

1. POLICY ISSUES: COVERAGE AND ADEQUACY
PENSIONS AT A GLANCE: LATIN AMERICA AND THE CARIBBEAN © OECD, THE WORLD BANK AND IDB 201418
The size of the firm also plays an important role in the contributions of salaried workers.
The larger the firm, the more employees tend to contribute, irrespective of their wage levels. In
big firms with over 50 workers, 71% of salaried workers contribute, compared with 51% in
medium-sized firms (with 6 to 50 workers) and 24% in small ones (with fewer than
six workers). On average in the LAC19 countries, the share of middle-low-income workers
(those in deciles 2 and 3) in big firms who contribute to a pension scheme is similar to the
proportion of high-income self-employed or high-income salaried workers in small firms
(see Figure 1.4). These workers face similar issues as the self-employed, particularly as related
to enforcement.
The analysis so far has focused on static cross-sectional data that are publicly
available from national household surveys. However, there is a widespread consensus that
in LAC, as is the case in most emerging economies (Jütting and de Laiglesia, 2009), workers
move frequently between formal and informal jobs and also between salaried jobs and
self-employment. On average in the seven Latin America countries displayed in Table 1.1,
21% of formal workers moved into inactivity (5%), unemployment (3%), self-employment (4%),
or directly into informal salaried jobs (9%) over a two-year period. In Colombia and Mexico,
25% of formal workers tend to move towards occupations with either less frequent or no
contributions every year.
This high level of labour mobility shows the limitations of using cross-sectional
household data since only longitudinal data make it possible to follow workers over time.
Therefore, generally the household survey data in the region cannot be used, except with
great caution, to proxy contribution histories over a worker’s whole career. Fortunately, some
countries publish and share research databases based on administrative records, which
enable analysts to estimate contribution densities by looking at the share of time during
which an affiliate has actively saved by making contributions to the pension scheme.
Figure 1.4. Contributors or affiliates as a percentage of total workers(aged 15-64 years) by income decile and occupation in LAC18, around 2010
Note: Small firms employ two to five workers, medium firms employ 6 to 50, and big firms have over 50 employees.LAC18 represents the weighted average of Argentina, Bolivia, Brazil, Chile, Colombia, Costa Rica, Dominican Republic,Ecuador, Guatemala, Honduras, Mexico, Nicaragua, Panama, Peru, Paraguay, El Salvador, Uruguay and Venezuela.Source: Bosch, M., A. Melguizo and C. Pagés (2013), “Better Pensions, Better Jobs: Towards Universal Coverage in LatinAmerica and the Caribbean”, Inter-American Development Bank, Washington, DC.
1 2 http://dx.doi.org/10.1787/888933161344
100
80
60
40
20
0
%100
80
60
40
20
0
%
Self-employedEmployees
D1 D2 D3 D4 D5 D6 D7 D8 D9 D10
Small firmBig firm
Medium firm
D1 D2 D3 D4 D5 D6 D7 D8 D9 D10

1. POLICY ISSUES: COVERAGE AND ADEQUACY
PENSIONS AT A GLANCE: LATIN AMERICA AND THE CARIBBEAN © OECD, THE WORLD BANK AND IDB 2014 19
As shown in Figure 1.5, in Chile, El Salvador, Mexico, and Peru, an unweighted average
of over 40% of the working-age population is not affiliated to any pension scheme. This is
driven by significantly lower female labour participation compared to men (for example,
only 23 out of 100 working-age women in Peru are affiliated). Administrative records suggest
that contributions are even lower and more irregular among the affiliated. According to these
official records, more than half of the affiliates in these four Latin American countries
contribute for less than six months each year. Among women, this share of low-density
affiliates rises to 55%, with the largest share being in Chile where 60% of women affiliated
with the pension system have contributed for less than 50% of the time.
Table 1.1. Circumstances of formal workers after one yearPercentages
Inactivity Unemployment Self-employment Informal salaried workers Formality
Colombia 6 7 4 9 75Bolivia 3 2 3 11 81Ecuador 3 1 4 7 85Peru 3 3 7 8 79Venezuela 5 3 7 7 77Mexico 7 2 3 13 75Argentina 5 3 2 7 83Average 5 3 4 9 79
Source: Goñi, E. (2013), Pandemic Informality, Inter-American Development Bank, Washington, DC, for Colombia,Bolivia, Ecuador, Peru, and Venezuela; Pagés. C. and M. Stampini (2009), “No Education, No Good Jobs? Evidence onthe Relationship between Education and Labor Market Segmentation”, Journal of Comparative Economics, Vol. 37, No. 3,pp. 387-401, for Argentina; and Bosch, M. and W.F. Maloney (2006), “Gross Worker Flows in the Presence of InformalLabor Markets. The Mexican Experience 1987-2002”, Discussion Paper No. 0753, Centre for Economic Performance,London School of Economics & Political Science, London, for Mexico.
1 2 http://dx.doi.org/10.1787/888933161847
Figure 1.5. Affiliation and contribution densities by gender in Chile, Mexico, Peruand El Salvador
Percentage of working-age population
Source: Bosch, M., A. Melguizo and C. Pagés (2013), “Better Pensions, Better Jobs: Towards Universal Coverage in LatinAmerica and the Caribbean”, Inter-American Development Bank, Washington, DC, based on Forteza, A., I. Apella,E. Fajnzylber, C. Grushka, I. Rossi and G. Sanroman (2009), “Work Histories and Pension Entitlements in Argentina,Chile, and Uruguay”, Social Protection Discussion Papers No. 52446, World Bank, Washington, DC, for Chile; Argueta, N.(2011), “Entre el individuo y el Estado: condicionantes financieros del sistema de pensiones en El Salvador”,Fundaungo, San Salvador, for El Salvador; and official data for Mexico and Peru.
1 2 http://dx.doi.org/10.1787/888933161356
%0 10 20 30 40 50 60 70 80 90 100
Not affiliated (0-50) (50-100) Other affiliations
Men
Women
Men
Women
Men
Women
Men
Women
Chile
Mex
ico
Peru
El S
alva
dor

1. POLICY ISSUES: COVERAGE AND ADEQUACY
PENSIONS AT A GLANCE: LATIN AMERICA AND THE CARIBBEAN © OECD, THE WORLD BANK AND IDB 201420
In summary, both the household survey data and administrative records show that
LAC countries are far from having workers contribute regularly. Therefore, in order to be
realistic in terms of predicting outcomes, any simulations of future pension entitlements
should incorporate scenarios with less than complete contribution careers. The
next section will present some estimates using the OECD pension models and some
stylised work histories as well as estimates from official records.
Future adequacy of retirement incomesThe contribution gaps of LAC men and women, correlated with high transition rates,
high shares of informality, and low employment rates, will have a significant impact on the
future adequacy of retirement incomes. In almost all systems, incomplete contribution
histories result in lower pension entitlements.
● In defined-contribution schemes, periods without contributions in the early years of a
worker’s career have a particularly negative impact given the effect of compound
interest.
● In defined-benefit systems, if gaps are prolonged or are concentrated at the end of the
working life, some workers may not reach the required number of years of contributions
to receive even the minimum contributory pension.
Therefore, it is important to examine not only the size of these contribution gaps but
also their distribution over time. The analysis of data from two pilot surveys carried out by
the Inter-American Development Bank (IDB) in 2008 for Lima (Peru) and Mexico City
(Mexico) suggests, for example, that gaps tend to be distributed evenly during a working
life, which is consistent with the frequent labour transitions discussed above. In Lima and
Mexico City, workers aged 55 to 59 years old contribute to the pension schemes for an
average of 18 and 17 years, respectively. Assuming that these workers entered the labour
market at age 20, their average contribution densities may be estimated to be about 48 and
47%, respectively.
However, these results should be taken only as rough proxies of contribution densities
since they just reflect a self-reported cross-section, taken in 2008, of the whole
contribution history of every worker in the survey. Also, only a few countries in the region
(e.g. Chile and Mexico) have sufficient administrative data to construct the entire
contribution history. This highlights the need for better and longer panel data as job
mobility may be part of a worker’s longer-term plan and thus may not be evident in the
short-term data.
To address this issue, Figures 1.6 and 1.7 illustrate a key pension indicator, the net
pension replacement rate, for workers with different stylised contribution densities. Given
the lack of real contribution histories for the majority of countries and the imperfections of
cross-sectional data, the figures illustrate three stylised profiles for male workers: i) formal
workers (100% density of contributions, which is representative of high-income workers in
most countries); ii) workers with 60% contribution densities (close to average in less
informal countries such as Argentina, Chile, Panama, and Uruguay); and iii) workers with
30% contribution densities (the average in more informal countries such as Colombia, the
Dominican Republic, Ecuador, El Salvador and Mexico). Contribution gaps are assumed to
be evenly distributed with age, in line with the results for Mexico City and Lima/Peru.

1. POLICY ISSUES: COVERAGE AND ADEQUACY
PENSIONS AT A GLANCE: LATIN AMERICA AND THE CARIBBEAN © OECD, THE WORLD BANK AND IDB 2014 21
Figure 1.6. Replacement rates by wage level in selected defined-benefit pensionschemes
Note: See Chapter 3 below for an explanation of the assumption of the OECD pension models. The X axis refers towage as multiple of average wage and the Y axis refers to the percentage of own wage.Source: OECD pension models.
1 2 http://dx.doi.org/10.1787/888933161360
120
100
80
60
40
20
00.25 0.50 0.75 1.00 1.50 2.00 3.00 5.00
60
50
40
30
20
10
00.25 0.50 0.75 1.00 1.50 2.00 3.00 5.00
250
200
150
100
50
00.25 0.50 0.75 1.00 1.50 2.00 3.00 5.00
100
00.25 0.50 0.75 1.00 1.50 2.00 3.00 5.00
80
00.25 0.50 0.75 1.00 1.50 2.00 3.00 5.00
90
50607080
40302010
90
50607080
40302010
50
60
70
40
30
20
10
00.25 0.50 0.75 1.00 1.50 2.00 3.00 5.00
120
100
80
60
40
20
00.25 0.50 0.75 1.00 1.50 2.00 3.00 5.00
100% 60% 30%
Argentina Bahamas
Colombia DB Ecuador
Nicaragua Panama
Paraguay

1. POLICY ISSUES: COVERAGE AND ADEQUACY
PENSIONS AT A GLANCE: LATIN AMERICA AND THE CARIBBEAN © OECD, THE WORLD BANK AND IDB 201422
Figures 1.6 and 1.7 show very significant differences between these categories that are
especially large in defined-benefit systems when workers are not eligible for minimum
contributory pensions because of low densities (for example, in Nicaragua and Panama). In
defined-contribution schemes, replacement rates tend to be lower given that they reflect
only contributions and financial returns (whereas defined-benefit systems may
incorporate some implicit subsidies). Meanwhile, defined-benefit schemes have minimum
vesting rules that can lead to not having a pension even after having contributed for several
years. For instance, in Mexico’s old defined-benefit system workers who contributed for
fewer than ten years received no benefits at all. Finally, net replacement rates were
simulated by combining administrative data on densities and wage levels for Chile and
Mexico (Figure 1.8). The results suggest that workers who earn half of the minimum wage
in both countries have contribution densities of 13% and 8% respectively, much lower than
Figure 1.7. Replacement rates by wage level in selected defined-contributionand mixed pension schemes
Note: See Chapter 3 below for an explanation of the assumption of the OECD pension models. The X axis refers towage as multiple of average wage and the Y axis refers to the percentage of own wage.Source: OECD pension models.
1 2 http://dx.doi.org/10.1787/888933161377
1009080
6070
4050
2030
100
0.25 0.50 0.75 1.00 1.50 2.00 3.00 5.00
45
25
35
20
40
30
151050
0.25 0.50 0.75 1.00 1.50 2.00 3.00 5.00
25
20
15
10
5
00.25 0.50 0.75 1.00 1.50 2.00 3.00 5.00
200
00.25 0.50 0.75 1.00 1.50 2.00 3.00 5.00
140
00.25 0.50 0.75 1.00 1.50 2.00 3.00 5.00
120
60
80
100
40
20
180
100120140160
80604020
80
100
120
60
40
20
00.25 0.50 0.75 1.00 1.50 2.00 3.00 5.00
100% 60% 30%
Chile Colombia DC
Dominican Republic El Salvador
Mexico Uruguay

1. POLICY ISSUES: COVERAGE AND ADEQUACY
PENSIONS AT A GLANCE: LATIN AMERICA AND THE CARIBBEAN © OECD, THE WORLD BANK AND IDB 2014 23
those who earn either the average wage (24% and 17% respectively) or three times the
average wage (82% and 55% respectively). Because of the non-contributory components in
some of these countries, net replacement rates for these low-wage low-density workers
can be above 50%.6 Considering only the contributory components, the net replacement
rates barely reach 10 to 15% for low-income and middle-income workers respectively.
Finally, the net pension replacement rates for high-income workers (who would not benefit
from the targeted non-contributory components) range between 15 and 32%, and these
differences would be much bigger in absolute terms.
Economic well-being of the elderlyGrowing concern about the effects of limited coverage on the current and future
adequacy of pensions in the region must be viewed in the broader context of the economic
well-being of older people in general. A large share of older people in LAC will have to rely
on other sources of income than contributory pensions. This includes work income, assets
such as housing,7 informal transfers, and support within households and families and
from government programmes such as social pensions (discussed in more detail below).
An important starting point for the analysis of the economic well-being of the elderly
is their household structure. Figure 1.9 plots the relationship between per capita income
(in USD PPP) and co-residence – which is defined as a person aged 60 or older living with
family members other than a spouse. While there is a strong (negative) relationship
between income level and the likelihood that an elderly person will be living with a family
member, there are nevertheless significant variations between countries with similar
income levels. Chile and Mexico are clear outliers with high incomes and high co-residence
rates.
In addition to the cross-country pattern, the income/co-residence relationship also
applies within countries with the lower part of the income distribution having higher
co-residence rates, as shown in Table 1.2. Most of the elderly poor in Latin America live in
multi-generational households suggesting that the welfare of the vast majority of the
Figure 1.8. Replacement rates by wage level in Chile and Mexico
Note: The X axis refers to wage as multiple of average wage and the Y axis refers to % of own wage.Source: Authors’ own calculations.
1 2 http://dx.doi.org/10.1787/888933161381
70
60
50
40
30
20
10
00.5 1 3
70
60
50
40
30
20
10
00.5 1 3
Contributory Non-contributory
Chile Mexico

1. POLICY ISSUES: COVERAGE AND ADEQUACY
PENSIONS AT A GLANCE: LATIN AMERICA AND THE CARIBBEAN © OECD, THE WORLD BANK AND IDB 201424
region’s elderly who receive no formal pension income is closely tied to that of their family.
At the same time, evidence of intra-household allocation of resources is scarce and little is
known about the relative consumption of the elderly in this regard.
The long-term trends of increased urbanisation and lower fertility will also reduce the
chances of this kind of family support being available in the future implying that the
limitations of the formal pension system will become increasingly important. However,
well-targeted programmes such as cash transfers aimed at poor households have the
potential to reach most of the elderly poor.8
Figure 1.9. Comparison of co-residence rates in Latin American countries
Note: This figure includes 55 countries.Source: Calculations based on ASPIRE Household Survey Data, World Bank Database.
1 2 http://dx.doi.org/10.1787/888933161396
Table 1.2. Co-residence rates by quintile in LACPercentages
Poorest 2 3 4 Richest
Argentina 68 56 42 47 40
Bolivia 79 54 68 66 64
Brazil 85 59 59 57 55
Chile 79 65 61 64 57
Colombia 74 81 84 75 61
Costa Rica 67 55 70 73 65
Dominican Republic 87 78 75 75 65
Ecuador 64 70 70 68 60
El Salvador 81 84 80 74 69
Guatemala 78 80 84 78 75
Honduras 85 84 85 82 77
Mexico 66 72 71 69 65
Nicaragua 95 92 92 87 78
Panama 68 76 68 65 51
Paraguay 74 82 80 72 67
Peru 70 73 71 73 66
Uruguay 64 42 40 33 27
Venezuela 80 88 86 85 73
Source: Calculations based on ASPIRE Household Survey Data, World Bank Database.1 2 http://dx.doi.org/10.1787/888933161856
18 000
16 000
14 000
12 000
10 000
8 000
6 000
4 000
0
2 000
40 50 60 70 80 90 100
R² = 0.5351
Elderly co-residence rate (%)
Income per capita (USD PPP)
Nicaragua
Honduras
BoliviaParaguay
Guatemala
El SalvadorDominican Rep.
PeruEcuador
Jamaica
ColombiaBrazil Panama
Costa RicaUruguay
VenezuelaChile
Mexico

1. POLICY ISSUES: COVERAGE AND ADEQUACY
PENSIONS AT A GLANCE: LATIN AMERICA AND THE CARIBBEAN © OECD, THE WORLD BANK AND IDB 2014 25
There is little evidence that the elderly are poorer than the non-elderly. Figure 1.10 shows
that relative poverty rates at the individual level are lower for the elderly in all of the
countries where data are available. The most dramatic differences are in countries with
large social pension programmes such as Bolivia and Brazil or where there is high coverage
of the contributory pension scheme as in Chile and Uruguay.
Table 1.3 compares elderly and non-elderly households to see which are more likely to
be found in the bottom two quintiles of the distribution. The table shows that in most
countries the elderly are less likely to live in households in the bottom two quintiles of the
income distribution than in households in the higher quintiles. However, it also shows that
the results of such comparisons can be very sensitive to assumptions regarding how size
and composition of the household affects welfare. An important adjustment often made in
the literature is an adult equivalence scale which assumes that children have lower
consumption needs. Another important adjustment that is sometimes made to ensure
valid inter-household comparisons is to take into account the economies of scale involved
in household consumption. To the extent that some consumption is shared, a larger
household may not consume as much per capita as a smaller household and yet may enjoy
the same living standard. Intuitively, there are certain fixed costs involved in a household
of whatever size, meaning that additional members make little difference to the
household’s overall consumption.
In Table 1.3, the first and fourth columns show the share of elderly and non-elderly
households in the bottom 40% of the distribution without adjusting for household
composition or size. The rates are also shown for both groups adjusted for the composition
and size of the household. In general, the results show that, even with these adjustments,
households with elderly members are less likely to be in the bottom two quintiles of the
distribution than households with no elderly members.9 The most important exceptions
are Costa Rica and the Dominican Republic. In three countries, the difference is marginal,
and in two-thirds of the countries – Argentina, Bolivia, Brazil, Colombia, El Salvador,
Figure 1.10. Relative poverty rates of the elderly and non-elderly in Latin America
Source: Calculations based on ASPIRE Household Survey Data, World Bank Database.1 2 http://dx.doi.org/10.1787/888933161408
0 5 10 15 20 25 30
Elderly poverty Overall poverty
ChileUruguay
NicaraguaDominican Republic
MexicoCosta RicaVenezuela
EcuadorParaguay
El SalvadorPeru
HondurasColombia
GuatemalaBrazil
PanamaBolivia
Relative poverty rate (50% median per capita)

1. POLICY ISSUES: COVERAGE AND ADEQUACY
PENSIONS AT A GLANCE: LATIN AMERICA AND THE CARIBBEAN © OECD, THE WORLD BANK AND IDB 201426
Honduras, Nicaragua, Paraguay, Uruguay and Venezuela – the advantage held by elderly
households over households with no elderly members is significant. Brazil stands out
because elderly households are less than half as likely to be found in the bottom two
quintiles as households with no elderly members. This is undoubtedly due to a large extent
to the high level of spending on Brazil’s rural pension scheme (see below) as well as the
high coverage of formal sector workers by contributory pensions. The Brazilian example is
an extreme case where spending on rural pensions is three times as much as the more
well-known “Bolsa Familia” targeted to poor households. The latter programme
disproportionately benefits children. In each country, the allocation of scarce budget
resources raises the question of this type of tradeoff.
Pensions and retirement incomesAs would be expected given the evidence presented earlier regarding coverage, the
importance of pensions in the incomes of households with elderly members varies widely
across the region. However, in most countries, they play a relatively limited role in poor
households. The exceptions are countries with very high coverage rates and those that rely
heavily on non-contributory or social pensions.
Figure 1.11 shows the relationship between the percentage of elderly households in
the bottom 40% of the distribution that receive any pension income and per capita income
(in USD PPP) in 55 countries around the world. There is clearly a positive relationship
between income and the coverage of low-income households across the sample, but the
correlation is not high. This is due to the fact that while contributory pension coverage is
higher the richer the country, social pension policies can increase the coverage among the
bottom part of the income distribution even in poor countries. The same is true for LAC
countries, with Venezuela and the Dominican Republic having much lower coverage than
other countries at the same income level.10 In contrast, Bolivia stands out as having much
Table 1.3. Households with or without elderly members in the bottom 40%
Any elderly –unadjusted
Any elderly –economies
of consumption
Any elderly –economies
of scale
No elderly –unadjusted
No elderly –economies
of consumption
No elderly –economies
of scale
Argentina 0.302 0.277 0.314 0.433 0.443 0.43
Bolivia 0.357 0.34 0.368 0.411 0.414 0.407
Brazil 0.228 0.211 0.222 0.451 0.456 0.453
Colombia 0.37 0.358 0.36 0.411 0.416 0.414
Costa Rica 0.41 0.389 0.425 0.397 0.403 0.392
Dominican Republic 0.436 0.415 0.443 0.387 0.395 0.385
Ecuador 0.381 0.363 0.389 0.406 0.413 0.404
El Salvador 0.363 0.348 0.36 0.416 0.422 0.417
Guatemala 0.397 0.394 0.401 0.4 0.401 0.4
Honduras 0.402 0.393 0.405 0.399 0.402 0.398
Nicaragua 0.351 0.344 0.349 0.421 0.423 0.421
Paraguay 0.364 0.343 0.361 0.411 0.418 0.413
Uruguay 0.283 0.254 0.309 0.46 0.474 0.446
Venezuela 0.369 0.36 0.363 0.411 0.414 0.413
Note: The cutoff is set at 40% of the welfare distribution. The assumption is that the consumption of the elderly andyouth is 75% of that of adults. Economies of scale are assumed to be 0.7. The shading indicates the poorest group.Source: Calculations based on ASPIRE Household Survey Data, World Bank Database.
1 2 http://dx.doi.org/10.1787/888933161865

1. POLICY ISSUES: COVERAGE AND ADEQUACY
PENSIONS AT A GLANCE: LATIN AMERICA AND THE CARIBBEAN © OECD, THE WORLD BANK AND IDB 2014 27
higher coverage than other countries with a similar income level such as Honduras and
Nicaragua. Coverage in Bolivia measured in this way is likely to have increased further in
the last few years since the data point does not reflect the most recent change in the
Renta Dignidad programme that reduced the eligibility age from 65 to 60. Several countries
are outliers in that the share of elderly in the bottom 40% receiving pensions is relatively
low given its income level. Interestingly, and as discussed in the next section, some of
these countries are now in the process of introducing or expanding their social pension
schemes.11
Social pensionsThe expansion of non-contributory pensions (also known as “social pensions”) or cash
transfers targeted to the elderly is a global phenomenon12 but nowhere has it been more
dramatic than in Latin America. Rofman et al. (2013) documented this recent phenomenon
for ten countries in the region that together represent more than 90% of the population of
LAC. Table 1.4, which is based on this study, traces the most important policy changes over
the last two decades and clearly shows the recent pattern of expansion of these
non-contributory programmes.
The programmes are all aimed at increasing the share of the elderly population
receiving government transfers but have taken various forms. Bolivia pays a universal
pension although with some reduction for those receiving contributory pensions.
Venezuela makes eligibility contingent on not receiving a contributory pension as does
Mexico. In Argentina, eligibility restrictions for contributory pensions were relaxed for
certain cohorts but the change is temporary.13 Finally, in Chile, the social pension is
integrated with the contributory pension with the aim of reducing incentives not to
contribute to evade the defined-contribution scheme (see Box 1.2). These variations in
social pension design imply significant differences in cost and incentives.
Figure 1.11. Share of the elderly in the bottom two quintileswho receive a pension
Source: Calculations based on ASPIRE Household Survey Data, World Bank Database.1 2 http://dx.doi.org/10.1787/888933161413
18 000
16 000
14 000
12 000
10 000
8 000
6 000
4 000
0
2 000
0 2010 30 40 50 60 70 80 90 100
R² = 0.3474
Pension receipt by households with elderly, poorest 40th percentile (%)
Income per capita (USD PPP)
NicaraguaHonduras
Bolivia
ParaguayGuatemala
El Salvador Dominican Rep.Peru EcuadorColombia Brazil
Panama
Costa RicaUruguayVenezuela
ChileMexico

1. POLICY ISSUES: COVERAGE AND ADEQUACY
PENSIONS AT A GLANCE: LATIN AMERICA AND THE CARIBBEAN © OECD, THE WORLD BANK AND IDB 201428
Table 1.4. Expansion of non-contributory pensions in LAC, 1990-2013
1990-2001 2001-07 2008-13
Brazil (1991): FUNRURAL pension age is reducedto 60 for men and 55 for women
Guyana (1993): Old-age pension becameuniversal
Bolivia (1996): Bonosol
Argentina (2003): Advance old-age pensionwas established
Belize (2003): Non-Contributory PensionProgramme (NCP)
Colombia (2003): PPSAM Social ProtectionProgramme for Older People
Ecuador (2003): Pension for Older People
Guatemala (2005): Economic ContributionProgramme for Older People
Mexico (2007): 70 y más
Bolivia (2008): Renta Dignidad
Chile (2008): Pension Basica Solidaria deVejez
Ecuador (2009): Pension for Older Peoplebecomes universal
El Salvador (2009): Universal Basic Pension
Panama (2009): 100 a los 70
Argentina (2010): The state provides alife-long pension equal to 70% of theminimum pension or ARS 832.64/month
Peru (2011): Pension 65
Mexico (2012): 70 y mas was extended tolocalities with more than 30.000 inhabitants
Colombia (2012-13): Extension to allcitizens over 65 without pension benefitsliving in poor rural areas
Mexico (2013): Change from 70 y más to 65y más and announced shift to universality
Source: Authors based on Rofman, R., I. Apella and E. Vezza (2013), “Mas Allá de las Pensiones Contributivas: CatorceExperiencias en América Latina”, World Bank, Washington, DC.
Box 1.2. Integrating non-contributory and contributory pensions:Chile’s new solidarity pillar
Chile introduced a new solidarity pillar in 2008 that would complement the existingcontributory pension system based on individual capitalisation. In 1981, Chile hadreplaced its traditional defined-benefit PAYG pension system with a defined-contributionsystem with individual accounts managed by specialised private firms. Two types ofnon-contributory benefit existed: i) a social assistance pension targeted to the lowestincome quintile of the population with eligibility precluded if there was any other sourceof pension; and ii) a minimum pension guarantee for pension fund contributors that hadattained only low balances after at least 20 years of contributions.
By 2006, it was clear that, although the system had been very successful in obtaininghigh real rates of returns for the pension funds, pension levels would not be adequate fora large portion of the population. Most members of the system did not contributefrequently enough to build a large balance. Although the proportion of the labour forcethat worked in the formal sector was relatively high at around 60%, only a minority heldsteady jobs in the formal sector. Berstein et al. (2006) estimated that around 50% ofmembers would receive a pension lower than the minimum pension, and many would notreach the 20 years of contributions required for the pension guarantee. On the other hand,many of these individuals would not be poor enough to qualify for the social assistancepension. As a result, low- to middle-income individuals fell into a coverage gap.

1. POLICY ISSUES: COVERAGE AND ADEQUACY
PENSIONS AT A GLANCE: LATIN AMERICA AND THE CARIBBEAN © OECD, THE WORLD BANK AND IDB 2014 29
Box 1.2. Integrating non-contributory and contributory pensions:Chile’s new solidarity pillar (cont.)
In order to increase pension levels, the government followed a dual strategy by:i) expanding contributory coverage so that anyone who is able to save makes pensioncontributions; and ii) providing a non-contributory minimum pension level and asupplement for low pensions through a new solidarity pillar.
Measures to expand the contributory base included gradually introducing mandatorycontributions for the self-employed through the tax system, strengthening enforcement,and creating incentives for workers to make voluntary contributions. With regard tonon-contributory benefits, Chilean policy makers faced a trade-off between providingincome protection and reducing incentives to save. The new solidarity pillar had to bedesigned in a way to be compatible with incentives to contribute in the system. Sinceneither the existing social assistance pension nor the minimum pension guaranteeprovided adequate income support to alleviate poverty in old age, it was decided that thenew pillar would replace both programmes. In order to maintain some incentives tocontribute, the benefit was designed not as an absolute minimum floor guarantee but as aminimum pension for individuals with no contributions plus a top-up for individuals withcontributions. The amount of the top-up would be reduced depending on the level of thecontributory pension. The reduction was designed so that the total pension (the sum of thecontributory and non-contributory pensions) would always be increasing along with thebalance accumulated in the individual account. In other words, the new solidarity pillarwas designed as a minimum pension benefit with a “clawback” as shown in the diagrambelow. The amount of the minimum benefit was set at a level above the existing socialassistance pension (but below the minimum pension guarantee), and the clawback ratewas set at a level close to 30%. Operationally, the new solidarity pillar was composed of twobenefits: i) the basic solidarity pension (PBS) for individuals with no contributions and ii) asolidarity pension supplement (APS), which is the top-up for individuals with somecontributory pension. The target population for the new benefits would be individualsaged 65 years or older who belonged to the 60% poorest households and had a minimumof 20 years of residency in the country. Thus, the minimum benefit went from being atargeted poverty alleviation programme to a broad programme aimed at excluding themost affluent, and the contribution requirement was replaced by a residency condition.
Clawback in the solidarity pillar
Totalpension
PBS
APS
Self-financed pension

1. POLICY ISSUES: COVERAGE AND ADEQUACY
PENSIONS AT A GLANCE: LATIN AMERICA AND THE CARIBBEAN © OECD, THE WORLD BANK AND IDB 201430
In addition to differences in coverage and eligibility rules, benefit levels vary widely,
resulting in significant differences in costs as shown in Table 1.5.
In six countries, social pension recipients represent more than one-half of the
population aged 65 and over. In Bolivia, Guyana, and Suriname, social pensions are
essentially universal.14 In contrast, social pensions are clearly marginal in El Salvador,
Paraguay, and Peru and do not exist at all in Haiti, Honduras, and Nicaragua. Benefit levels
also vary widely. Benefits range from only 3% of national per capita income in Jamaica to
more than 40% in Venezuela. Comparing the relative generosity of social pensions is
complicated by the different expected durations of retirement between countries, which
are determined by life expectancy at the age at which a worker becomes eligible for the
social pension. One way to capture this is by calculating the present value of social pension
payments from the age of eligibility until death taking into account country-specific
Table 1.5. Social pensions in Latin-American countries
Programme
Eligibility conditions
Coverage and adequacyTargeting
Qualifyingconditions
Means tested/Povertytargeted
Pension/benefit test
Geographicallytargeted
AgeBeneficiaries/
65+ pop.
Benefit/Income per
capita
Social pensionwealth/GDPper capita
Argentina Pensiones Asistenciales y y n 70 1.8% 25.0% 1.7
Bahamas Old Age Non-Contributory Pension y y n 65 .. .. 1.7
Barbados Non-contributory Old Age Pension y y n 65 + 6 m 30.1% 23.3% 2.9
Belize Non-Contributory Pension Programme y y n 67/65 30.0% 12.5% 1.9
Bolivia Renta Dignidad n n n 60 91.0% 12.6% 2.4
Brazil Previdencia Rural n y 60/55 86.0% 17.2% 5.0
Beneficio de Prestacao Continuada y y n 65 12.0% 33.0% ..
Chile Pension Basica Solidaria de Vejez y y n 65 83.0% 12.0% 2.1
Colombia PPSAM y y y 57/52 44.0% 4.3% 1.0
Costa Rica Regimen No Contributivo y y n 65 59.0% 17.8% 3.2
Dominican Republic Nonagenarios y y n 60 .. n.a. 3.0
Ecuador Pension para Adultos Mayores y y n 65 56.0% 7.7% 1.8
El Salvador Pension Basica Universal y y y 70 17.0% 12.2% 2.2
Guatemala Aporte economico del Adulto Mayor y y n 65 16.0% 18.0% 2.8
Guyana Old Age Pension n n n 65 151.0% 18.0% 2.4
Haiti Not applicable
Honduras Not applicable
Jamaica PATH y y n 60 24.0% 2.0% 0.5
Mexico 65 y mas n y y 65 63.0% 5.0% 0.6
Nicaragua Not applicable
Panama 100 a los 70 n y n 70 81.0% 12.6% 1.7
Paraguay Pension alimentaria y y n 65 29.0% 29.3% 4.4
Peru Pension 65 y y y 65 41.0% 8.6% 1.3
Suriname Not applicable
Trinidad and Tobago Senior Citizen Pension y y n 65 99.0% 30.5% 4.6
Uruguay Pensiones no contributivas y y n 70 7.0% 22.0% 3.3
Venezuela, RB Gran Mision Amor Mayor y y n 60/55 23.0% 18.0% 6.9
y: yes; n: no; ..: not available.Note: Social pension wealth is the present value of the stream of payments at current levels from eligibilty age until death based oncountry specific mortality tables.Source: Rofman et al. (2013), Social Pension Database HelpAge, Household Surveys and author’s calculations.
1 2 http://dx.doi.org/10.1787/888933161872

1. POLICY ISSUES: COVERAGE AND ADEQUACY
PENSIONS AT A GLANCE: LATIN AMERICA AND THE CARIBBEAN © OECD, THE WORLD BANK AND IDB 2014 31
mortality patterns. The last column of Table 1.5 shows the present value of benefits. This
takes into account not only the differences in benefit levels but also the differences in life
expectancy at the age of eligibility. By this measure, Venezuela has by far the most
generous social pension, followed by Suriname and Brazil. While Bolivia, Guyana, and
Suriname all have universal pensions, the social pension wealth indicator suggests that
Suriname’s relative benefit level is twice as generous as that of the other two countries.
Combining the social pension wealth indicator with the coverage rate makes it
possible to compare social pensions in different countries. Figure 1.12 below maps the
social pension programmes in the region in three dimensions – pension wealth is on the
x axis, coverage is on the y axis, and the size of the circle is proportional to the expense of
the programme. This is calculated by projecting spending through to 2040 and dividing the
present value by current GDP.15
The figure shows that, in terms of coverage and relative generosity, social pensions are
most important in Guyana and Bolivia, followed by Venezuela and Brazil. Although not
shown on the figure, Suriname and Trinidad are also among the largest social pension
programmes in the region, and Trinidad’s ageing projections suggest that it will be among
the most expensive. These last two will also be the most expensive because their
populations will age more rapidly in the next two decades. The Government of Mexico
recently announced that it would further extend coverage and double benefits; while the
full implementation of Chile’s new social pension will increase its coverage over the next
few years. Social pensions play a much less prominent role in the rest of the region.16
Figure 1.12 makes it possible to make comparisons between countries by abstracting
from their different demographic situations. These differences are quite large. The
proportion of the population aged 65 and above is around 14% in Uruguay but less than 5%
in Bolivia. As the younger populations begin to age, countries with large social pensions
(according to the indicator in Figure 1.12) can expect large spending increases unless the
programmes become more targeted or less generous.
Figure 1.12. Social pensions in Latin American countries
Note: Pension wealth is on the x axis, coverage is on the y axis, and the size of the circle is proportional to theexpense of the programme.Source: Rofman, R., I. Apella and E. Vezza (2013), “Mas Allá de las Pensiones Contributivas: Catorce Experiencias enAmérica Latina”, World Bank, Washington, DC, and HelpAge International.
1 2 http://dx.doi.org/10.1787/888933161427
2.0
0
0.2
0.4
0.6
1.6
1.8
0.8
1.0
1.2
1.4
0 1 2 3 4 5 6
Social pension recipients/pop 65+
PV of social pension/income per capita
Bolivia
Guyana
Barbados
Costa Rica
Paraguay
Brazil
Venezuela
Mexico
Chile

1. POLICY ISSUES: COVERAGE AND ADEQUACY
PENSIONS AT A GLANCE: LATIN AMERICA AND THE CARIBBEAN © OECD, THE WORLD BANK AND IDB 201432
In summary, the role of social pensions is expanding in Latin America and the
Caribbean, and, in some countries, they are already a major element of the pension
system. While social pensions can help to fill the coverage gaps in the region’s contributory
pension schemes, the more extensive and generous programmes will present policy
makers with a fiscal challenge as the population ages.
ConclusionThis chapter has focused on the coverage of formal pension systems, both in terms of
active workers that contribute as well as the elderly that receive pensions, increasingly
from non-contributory pensions. Coverage is an issue with a high priority in the region
today and the gaps arise from a number of factors including:
● non-compliance or informal labour activity that precludes participation contributory
pension schemes
● low contribution density which, in turn, affects the adequacy of future pensions for many
individuals, especially those with low incomes
● current elderly whose lack of pension income reflect these first two dimensions but in
the past
● the role and coverage of social pensions, i.e. cash transfers to the elderly that are not tied
to contributory pension schemes.
The countries in Latin America and the Caribbean are attempting to address the
coverage issue in different ways but the most evident trend and the policy that appears to
be having the most impact is the extension of social pensions. In addition to its impact on
coverage, this policy shift has important long term fiscal implications in these aging
countries. It also affects the analysis of adequacy that is the subject of the rest of this
report. For example, in countries like Bolivia, where the social pension is the only source of
income for the vast majority of the elderly, the design of the contributory scheme is less
relevant for assessing the adequacy of the system and for making international
comparisons. At the same time, countries that are adopting social pension schemes that
will complement the pension income of some workers receiving a contributory pension, as
in Chile, must now pay closer attention to the implications of this approach for adequacy.
Notes
1. This term is equivalent to pension contribution rate in the book Bosch et al. (2013).
2. Informality has been defined using different criteria. According to Enste and Schneider (2000),informal activity is defined as all economic activities in unregistered enterprises that contribute tothe gross national product (GNP). Informality has also been defined in terms of the occupation (asconsisting of own-account workers and unpaid family workers) or by the size of the unit ofproduction (ECLAC, 2008). Other international organisations have defined informal workers asthose who do not benefit from social security and are not protected by labour regulations (ILO andWTO, 2009; and OECD, 2010, in case of lacking a written contract). This section will follow thedefinition used by Bosch et al. (2013) in which formal sector workers are those who makecontributions to any pension scheme.
3. Argentina: Encuesta Permanente de Hogares – Continua (EPHC), 2010; Bolivia: Encuesta de Hogares(EH), 2009; Brazil: Pesquisa Nacional por Amostra de Domicilio (PNAD), 2011; Chile: EncuestaCASEN (CASEN), 2011; Colombia: Gran Encuesta Integrada de Hogares (GEIH), 2010; Costa Rica:Encuesta de Hogares de Propósitos Múltiples (ENAHO), 2010; Dominican Republic: EncuestaNacional de Fuerza de Trabajo (ENFT), 2010; Ecuador: Encuesta Periódica de Empleo, Desempleo ySubempleo (ENEMDU), 2010; El Salvador: Encuesta de Hogares de Propósitos Múltiples (EHPM),2010; Guatemala: Encuesta Nacional de Empleo e Ingresos (ENEI), 2010; Honduras: Encuesta de

1. POLICY ISSUES: COVERAGE AND ADEQUACY
PENSIONS AT A GLANCE: LATIN AMERICA AND THE CARIBBEAN © OECD, THE WORLD BANK AND IDB 2014 33
Hogares Permanente de Propósitos Múltiples (EPHPM), 2010; Jamaica: Labor Force Survey (LFS),2010; Mexico: Encuesta Nacional sobre Ingresos y Gastos de los Hogares (ENIGH), 2010; Nicaragua:Encuesta Continua de Hogares (ECH), 2010 ; Panama: Encuesta de Hogares (EH), 2010; Paraguay:Encuesta Permanente de Hogares (EPH), 2010; Peru: Encuesta Nacional de Hogares (ENAHO), 2010 ;Uruguay: Encuesta Continua de Hogares (ECH), 2010; and Venezuela: Encuesta de Hogares porMuestreo (EHPM), 2010); Colombia: GEIH
4. These are data on contributions when available (in Argentina, Brazil, Chile, Colombia, Costa Rica,Ecuador, El Salvador, Guatemala, Honduras, Jamaica, Mexico, Nicaragua, Panama, Paraguay, Peru,Venezuela and Uruguay). Some countries only have data on contributions made by salariedworkers (Argentina, Ecuador, Paraguay, Peru, the Dominican Republic and Venezuela). In the rest,the figures relate to affiliation with a pension scheme. This distinction has important implications.Affiliates or members are those who at some time registered for the pension system but who mayor may not have continued contributing. Meanwhile, the term contributors refers only to thosewho are contributing to the system at a specific moment in time. Many of the affiliates do notmake contributions regularly, meaning that they may not be eligible to receive pension benefits inthe future.
5. Data are not readily available for the whole sample of countries.
6. Non- contributory pensions supplement the contributory pension or establish a minimum pensionlevel.
7. See Pensions at a Glance 2013: OECD and G20 Countries (2013a) for a discussion of the role of homeownership. The same section shows that the elderly are substantially more likely to own theirhomes than younger household heads.
8. For example, Behrman and Parker (2013) have shown the benefits of the targeted cash transferprogramme to the elderly poor in Mexico.
9. The combination of both types of adjustment is not shown because the results remain similar.
10. It is interesting to note that in 2012, Venezuela introduced a new social pension scheme that islikely to have dramatically increased coverage of those at the bottom of the distribution assumingthat the programme is well-targeted.
11. The data for Mexico, which are for 2010, do not reflect the reduction in the age of eligibility from 70to 65 and the recent government announcement that the programme will be made universal.Venezuela introduced a new social pension in 2012 that has dramatically increased coverage.
12. See Knox-Vydmanov and Palacios (2013).
13. See Rofman et al. (2013).
14. Even universal social pension schemes such as Bolivia’s do not cover the entire elderly populationbecause of a variety of implementation issues. See Rofman et al. (2013).
15. This is based on two key assumptions – first, that the real value of the benefit will remain constantthroughout the projection and, second, that the same ratio of beneficiaries to elderly people willpersist.
16. Data were not available for Suriname but it is likely to be among the countries with the highestscores.
References
Argueta, N. (2011), “Entre el individuo y el Estado: condicionantes financieros del sistema de pensionesen El Salvador”, Fundaungo, San Salvador.
Behrman, J. and S. Parker (2013), “Is the Health of the Aging Improved by Conditional Cash TransferPrograms? Evidence from Mexico”, Demography, Vol. 50, No. 4, pp. 1363-1386, August.
Berstein, S., G. Larraín and F. Pino (2006), “Chilean Pension Reform: Coverage Facts and PolicyAlternatives”, Economia, Vol. 6, No. 2, pp. 227-279.
Bosch, M. and W.F. Maloney (2010), “Comparative Analysis of Labor Market Dynamics Using MarkovProcesses: An Application to Informality”, Labour Economics, Vol. 17, No. 4, pp. 621-631.
Bosch, M. and W.F. Maloney (2006), “Gross Worker Flows in the Presence of Informal Labor Markets.The Mexican Experience 1987-2002”, Discussion Paper No. 0753, Centre for Economic Performance,London School of Economics & Political Science, London.

1. POLICY ISSUES: COVERAGE AND ADEQUACY
PENSIONS AT A GLANCE: LATIN AMERICA AND THE CARIBBEAN © OECD, THE WORLD BANK AND IDB 201434
Bosch, M., A. Melguizo and C. Pagés (2013), “Better Pensions, Better Jobs: Towards Universal Coveragein Latin America and the Caribbean”, Inter-American Development Bank, Washington, DC.
Carranza, L., A. Melguizo and D. Tuesta (2012), “Matching Pension Schemes in Colombia, Mexico, andPeru: Experiences and Prospects”, in R. Holzmann, R. Hinz, N. Takayama, and D. Tuesta (eds.),Matching Defined Contribution Schemes: Role and Limits to Increase Coverage in Low- and Middle-incomeCountries, World Bank, Washington, DC, pp. 193-213.
Da Costa, R., J.R. de la Iglesia, E. Martínez and A. Melguizo (2011), “The Economy of the Possible:Pensions and Informality in Latin America”, OECD Development Centre Working Paper No. 295, OECDPublishing, Paris, http://dx.doi.org/10.1787/5kgj0vdgrk8v-en.
Easterly, W. (2001), “The Middle Class Consensus and Economic Development”, Journal of EconomicGrowth, Vol. 6, No. 4, pp. 317-335.
ECLAC – Economic Commission for Latin America and the Caribbean (2008), “Social Panorama of LatinAmerica”, Social Development Division and the Statistics and Economic Projections Division of theEconomic Commission for Latin America and the Caribbean, Santiago.
Enste, D.H. and F. Schneider (2000), “Shadow Economies: Size, Causes, and Consequences”, Journal ofEconomic Literature, Vol. 38, No. 1, pp. 77-114.
Ferreira, F.H.G., J. Messina, J. Rigolini, L.-F. Lopez-Calva, M.A. Lugo and R. Vakis (2013), “EconomicMobility and the Rise of the Latin American Middle Class”, World Bank, Washington, DC.
Forteza, A., I. Apella, E. Fajnzylber, C. Grushka, I. Rossi and G. Sanroman (2009), “Work Histories andPension Entitlements in Argentina, Chile, and Uruguay”, Social Protection Discussion PapersNo. 52446, World Bank, Washington, DC.
Gill, I., T. Packard and J. Yermo (2005), Keeping the Promise of Social Security in Latin America, StanfordUniversity Press and The World Bank, Washington, DC.
Goñi, E. (2013), Pandemic Informality, Inter-American Development Bank, Washington, DC.
Help Age International, www.helpage.org/.
ILO – International Labour Organization, and WTO – World Trade Organization (2009), Globalization andInformal Jobs in Developing Countries, International Labour Organization, Geneva.
Jütting, J. and J.R. de Laiglesia (eds.) (2009), Is Informal Normal? Towards More and Better Jobs in DevelopingCountries, OECD Development Centre, OECD Publishing, Paris, http://dx.doi.org/10.1787/9789264059245-en.
Knox-Vydmanov, C. and R. Palacios (2013), “The Growing Role of Social Pensions: History, Taxonomy,and Key Performance Indicators”, Public Administration and Development.
Levy, S. (2008), “Good Intentions, Bad Outcomes: Social Policy, Informality, and Economic Growth inMexico”, Brookings Institution Press, Washington, DC.
OECD (2013a), Pensions at a Glance: OECD and G20 Countries, OECD Publishing, Paris, http://dx.doi.org/10.1787/pension_glance-2013-en.
OECD (2013b), Pensions at a Glance Asia/Pacific 2013, OECD Publishing, Paris, http://dx.doi.org/10.1787/pension_asia-2013-en.
OECD (2012), Closing the Gender Gap: Act Now, OECD Publishing, Paris, http://dx.doi.org/10.1787/9789264179370-en.
OECD (2011), “Report on the Gender Initiative: Gender Equality in Education, Employment andEntrepreneurship 2011”, OECD Publishing, Paris, www.oecd.org/education/48111145.pdf.
OECD (2010), Latin American Economic Outlook 2011: How Middle-class is Latin America?, OECDDevelopment Centre, OECD Publishing, Paris, http://dx.doi.org/10.1787/leo-2011-en.
Pagés, C. (2010), “The Age of Productivity: Transforming Economies from the Bottom Up”, Inter-AmericanDevelopment Bank and Palgrave Macmillan, New York.
Pagés. C. and M. Stampini (2009), “No Education, No Good Jobs? Evidence on the Relationship betweenEducation and Labor Market Segmentation”, Journal of Comparative Economics, Vol. 37, No. 3, pp. 387-401.
Ribe, H., D.A. Robalino and I. Walker (2010), “From Right to Reality: Achieving Effective Social Protectionfor All in Latin America and the Caribbean”, World Bank, Washington, DC.
Rofman, R. and M.L. Oliveri (2012), “Pension Coverage in Latin America: Trends and Determinants”,Social Protection and Labor Discussion Paper No. 1217, World Bank, Washington, DC.
Rofman, R., I. Apella and E. Vezza (2013), “Mas Allá de las Pensiones Contributivas: CatorceExperiencias en América Latina”, World Bank, Washington, DC.

1. POLICY ISSUES: COVERAGE AND ADEQUACY
PENSIONS AT A GLANCE: LATIN AMERICA AND THE CARIBBEAN © OECD, THE WORLD BANK AND IDB 2014 35
Social Security Administration (2010), “Social Security Programs throughout the World: The Americas,2009”, www.ssa.gov/policy/docs/progdesc/ssptw/2008-09/americas/index.html.
United Nations (2011), “World Population Prospects: The 2010 Revision”, Department of Economic andSocial Affairs, Population Division, United Nations, New York, http://esa.un.org/unpd/wpp/index.htm.
Whitehouse, E. (2006), Pensions Panorama; World Bank, Washington, DC, http://elibrary.worldbank.org/doi/pdf/10.1596/978-0-8213-6764-3.
World Tax Rates 2010/2011, www.taxrates.cc/.

1. POLICY ISSUES: COVERAGE AND ADEQUACY
PENSIONS AT A GLANCE: LATIN AMERICA AND THE CARIBBEAN © OECD, THE WORLD BANK AND IDB 201436
The following country references apply to the entire publicationand not only to Chapter 1
Argentina
ANSES – Administración Nacional de la Seguridad Social, www.anses.gob.ar/.
Asociación Federal de Ingresos Públicos. Impuesto a las ganancias, http://biblioteca.afip.gov.ar/gateway.dll/Otras%20Publicaciones/Cuadroslegs/ganancias_coeficientes_y_montos_23042004.htm.
Banco Central de la República de Argentina, www.bcra.gov.ar/.
Instituto Nacional de Estadística y Censos (2011), “Evolución de la Distribución Funcional del Ingreso”,Remuneración del Trabajo Asalariado, Cuarto trimestre de 2010, www.indec.mecon.ar/nuevaweb/cuadros/17/cgi_03_11.pdf.
Ministerio de Economía y Finanzas Públicas de la Nación Argentina, Informe de Presupuesto de laAdministración Pública Nacional, www.mecon.gov.ar/consulta/detallado/index0.html.
Obra social de jubilados y pensionados, de personas mayores de 70 años sin jubilación, deex combatientes de Malvinas, www.pami.org.ar/.
Pensión mínima por vejez, www.anses.gob.ar/jubilados-pensionados/diario-de-los-grandes/archivos/DIARIO%20N%205.pdf.
Prestaciones del régimen Previsional Público, Ley 24241, Título II Capítulo II.
Resolución ANSES No. 651/2010, Prestación Básica Universal, http://biblioteca.afip.gov.ar/gateway.dll/Normas/ResolucionesComunes/res_16000651_2010_07_28.xml.
Secretaría de Seguridad Social, Ministerio de Trabajo Empleo y Seguridad Social.
Sistema Integrado Previsional Argentino. Ley 24.241. Creación. Ámbito de aplicación. Disposicionescomplementarias y transitorias. Consejo Nacional de Previsión Social. Creación y Misión.Compañías de Seguros. Prestaciones No Contributivas. Normas sobre el Financiamiento.Sancionada: Setiembre 23 de 1993.
Sistema Integrado Previsional Argentino, Ley 26.425, Régimen Previsional Publico, Unificación.Sancionada: Noviembre 2008.
Bolivia
Art. 8 de la Ley No. 065, Ley de Pensiones, 10 December 2010.
Ley No. 3785, 23 November 2007. De los Trabajadores Estacionales y la Pensión Mínima.
Ley No. 3791, 28 November 2007. De la Renta Universal de Vejez (Renta Dignidad).
Ley No. 065, 10 December 2010.
Ministerio de Economía y Finanzas Públicas, Viceministerio de Pensiones y Servicios Financieros.
Estadísticas Económicas de Pensiones. Estado Plurinacional de Bolivia.
Brazil
Censo Demográfico – 2010, www.sidra.ibge.gov.br/cd/cd2010agsub.asp
IBGE – Instituto Brasileiro de Geografia e Estatística, Tábua Completa de Mortalidade, Ambos os Sexos– 2010, www.ibge.gov.br/home/estatistica/populacao/tabuadevida/2010/ambossexos.pdf.
Ministério da Previdência Social, www.previdencia.gov.br/vejaNoticia.php?id=43029.
Chile
Banco Central de Chile, www.bcentral.cl/.
CELADE – Comisión económica para América Latina y el Caribe, División de Población, www.eclac.org/celade/proyecciones/basedatos_BD.htm
DIPRES – Dirección de Impuestos (2010), Ley de presupuestos del sector público, www.dipres.cl/572/articles-50148_pres_2010.pdf.

1. POLICY ISSUES: COVERAGE AND ADEQUACY
PENSIONS AT A GLANCE: LATIN AMERICA AND THE CARIBBEAN © OECD, THE WORLD BANK AND IDB 2014 37
INE – Instituto nacional de Estadística (2004), CHILE: Estimaciones y Proyecciones de Población porSexo y Edad, País Urbano-Rural 1990-2020, www.ine.cl/canales/chile_estadistico/demografia_y_vitales/proyecciones/Informes/Microsoft%20Word%20-%20InforP_UR.pdf.
Colombia
Acto Legislativo 01 de 2005.
DANE – Departamento Administrativo Nacional de Estadística, www.dane.gov.co/.
Ley No. 100 de 1993.
Ley No. 797 de 2003.
Ley No. 860 de 2003.
Ley No. 1328 de 2009.
Ministerio de Hacienda y Crédito Público (2011), Marco Fiscal de Mediano Plazo 2011,www.minhacienda.gov.co/MinHacienda/haciendapublica/polit icafiscal/informacionfiscal/marcofiscalmedianoplazo/Documento%20MFMP%202011.pdf.
Costa Rica
Ley de Protección al Trabajador, Ley No. 7.983.
Ley régimen privado de pensiones complementarias, No. 7523.
Ministerio de Hacienda República de Costa Rica (2010), Informe de Desempeño de la Gestión deFinanzas Públicas (PEFA), www.hacienda.go.cr/NR/rdonlyres/3DAE65CC-41B6-42F6-ABE9-F213D58E93C8/28176/PEFACR.PDF.
Reglamento del Seguro de Salud, Artículo No. 62.
Dominican Republic
Banco Central de Republica Dominicana, www.bancentral.gov.do.
Ley No. 87-01, Artículos 15, 83 & 95.
Ministerio de Hacienda, Dirección General del Presupuesto, DIGEPRES 2010, informe de EjecuciónPresupuestaria del Gobierno Central 2010.
Oficina Nacional de Estadística (2011), República Dominicana en Cifras 2011.
Secretaria de Estado de Trabajo, Consejo Nacional de Seguridad Social, Ley 87-01 que crea el SistemaDominicano de Seguridad Social.
Ecuador
Ley de Seguridad Social No. 2001-55.
Ley reformatoria de la Seguridad Social Artículo No. 234.
Ministerio de Finanzas del Ecuador, Subsecretaria de Presupuestos, Ejecución presupuestariaconsolidad, Sectorial Bienestar Social 2010.
Sistema Integrado de Indicadores Sociales de Ecuador, www.siise.gob.ec/siiseweb/.
El Salvador
Ley Orgánica de la Superintendencia de Pensiones y Ley del Sistema de Ahorro para Pensiones.
Ministerio de Hacienda, Estadísticas Fiscales. 2010, Estadísticas básicas sobre las finanzaspúblicas 2010.
Guatemala
Decreto No. 85-2005 del Congreso de la República de Guatemala, Art. 2.
Honduras
Reglamento General de la Ley del Seguro Social, Art. 111, www.ilo.org/dyn/travail/docs/930/Reglamento%20General%20de%20la%20%20Ley%20del%20IHSS.pdf.

1. POLICY ISSUES: COVERAGE AND ADEQUACY
PENSIONS AT A GLANCE: LATIN AMERICA AND THE CARIBBEAN © OECD, THE WORLD BANK AND IDB 201438
Nicaragua
Decreto No. 974, Ley de Seguridad Social.
Ley Orgánica de Seguridad Social, Art. 50.
Panama
Gaceta Oficial (2000), No. 24. 285, Ley No. 24 de 2000.
Gaceta Oficial (2001), No. 24337, Ley No. 29-2001.
Gaceta Oficial (2010), No. 26641-A, Ley No. 60-2010.
Ley No. 8, 6 February 1997.
Ley de Seguro Social.
Paraguay
Ministerio de Hacienda, www.hacienda.gov.py/web-hacienda/index.php.
Peru
Decreto Ley No. 19990, 20530, 25967.
Ley No. 27617, Ley No. 29426.
Ministerio de Economía y Finanzas, Cierre del Presupuesto del Sector Publico para el año fiscal 2010.
SUNAT – Superintendencia Nacional de Administración Tributaria, www.sunat.gob.pe/.
Uruguay
Banco Central del Uruguay, www.bcu.gub.uy/Servicios-Financieros-SSF/AFAPMemoriaTrimestral/esen06d1210.pdf.
Decreto No. 283/010, 20 September 2010 sobre la jubilación y pensión mínima, http://archivo.presidencia.gub.uy/sci/decretos/2010/09/mtss_100.pdf.
Instituto Nacional de Estadísticas, www.ine.gub.uy.
Ley No. 16.713, 3 September 1995 sobre régimen previsional, www.parlamento.gub.uy.
Ley No. 18.395, 24 October 2008 sobre modificaciones al régimen previsional, www.parlamento.gub.uy.
Ley No. 18.083, 27 December 2006 sobre la reforma tributaria, www.parlamento.gub.uy.
Ley No. 18 .341 , 30 August 2008 sobre las modif icac iones a la reforma tr ibutar ia ,www.parlamento.gub.uy.
Ley No. 18.314, 4 July 2008 sobre el Impuesto de Asistencia a la Seguridad Social (IASS),www.parlamento.gub.uy.
Ley No. 18.241, 27 December 2007 sobre la asistencia a la vejez, www.parlamento.gub.uy.
Ministerio de Economía y Finanzas, Indicadores Económicos del Gobierno Central, www.mef.gub.uy/indicadores.php.
Venezuela
Anuario de Estadísticas Precios y Mercado Laboral 2009.
Artículo de la Gaceta oficial No. 38.628, 16 February 2007.
Ley del Seguro Social, Decreto No. 6266, Instituto Venezolano de los Seguros Sociales.
Ley Orgánica del Sistema de Seguridad Social, Gaceta Oficial No. 37.600 de fecha 30 de diciembrede 2002.
Ministerio de Planificación y Finanzas. Sistema Integrado de Indicadores Sociales de Venezuela.

Pensions at a Glance
Latin America and the Caribbean
© OECD, The World Bank and IDB 2014
39
Chapter 2
Key demographic indicators
Although fertility rates in the majority of LAC countries are above the populationreplacement rate, they have been declining in the last 30 years. Together withincreasing life expectancy, declining fertility rates are the main drivers of populationageing.
Fertility rates and how they have changed over time are explored in the firstindicator in this chapter, along with a brief discussion of explanations for the trends.Changes in life expectancy – at birth and at age 65 – over time are shown. There isalso a brief discussion of how life expectancy might change in the future.
Population ageing itself is addressed by the third indicator, i.e. the old-age supportratio equal to the number of people of working age relative to the number of pensionage. The old-age support ratio is shown for a century: historical data back to 1960and projections forward to 2060.

PENSIONS AT A GLANCE: LATIN AMERICA AND THE CARIBBEAN © OECD, THE WORLD BANK AND IDB 201440
FERTILITY
The total fertility rates averaged 2.57 childrenper woman across LAC countries in the period 2005-10,well above the level that ensures population replace-ment. However there has been a trend since theearly 1960s for fewer children, as a result of wideraccess to contraception and the inclusion of morewomen in labour markets. The fall in fertility rates islikely to reflect changes in both individuals’ lifestylepreferences and in the social trends towards increas-ing female labour force participation, higher educa-tion levels and lower political or religious constraintsto access secure contraceptive devices.
The recent decrease in fertility rates is predictedto continue, albeit at a slower rate. It is forecast toaverage 2.29 across LAC countries by 2015-20 and thenfall below the stable population figure thereafter.By 2025-30 the fertility rate is projected to fall to 2.10,reaching 1.98 by 2035-40, 1.91 by 2045-50 and 1.87by 2055-60.
By 2055-60 only Bolivia at 2.11 and Guatemala at2.27 are expected to have fertility rates above thereplacement level of 2.1.
Low fertility rates have wider social and eco-nomic consequences, due to the resulting populationaging process. In the short term, the decline in fertilityresults in a “demographic bonus”, as the relativeweight of children and youth declines and the propor-tion of those in active age increases. However, thisbonus last only a few decades, and after a while thesustained increase in the proportion of elderly morethan compensates the decline in children. Also, in themedium to long term, as family size declines there arefewer family caregivers to help people in old age,which results in growing demand for old-age care ser-vices. Secondly, if no changes in retirement agesoccur, there may be a growing burden on people of
working age to finance pensions and health care forolder people that would eventually force authorities toreview the public pension systems’ parameters toensure sustainability. Thirdly, the workforce will alsoage and so might be less adaptable to technologicalchange, which some authors have linked with declin-ing productivity and economic growth. Finally, ageingmay result in a smaller pool of savings to financeinvestment in the economy as older people use theirsavings to support their consumption.
Different authors have expressed their concernas fertility tends to decline faster among educated,high income urban families, hence resulting in a pat-tern where most children are born to poorer and morevulnerable households, with less access to opportuni-ties during their early years. While most projectionsforesee that these gaps will decline overtime, this is aserious concern for those working to reduce the inci-dence of poverty and promoting the accumulation ofhuman capital throughout society.
Definition and measurement
The total fertility rate is the number of childrenthat would be born to each woman if she were to liveto the end of her child-bearing years and if the likeli-hood of her giving birth to children at each age wasthe currently prevailing age-specific fertility rates. It isgenerally computed by summing up the age-specificfertility rates defined over a five-year interval. Giventhat the probability of giving birth to a boy is slightlyhigher than to a girl across all human populations, atotal fertility rate of 2.1 children per women in a con-text of low and stable mortality levels ensures broadstability of the population, on the assumption of nosignificant net migration flows.
Key results
The total fertility rate is above the replacement level – the number of children needed to keep the totalpopulation constant – in 20 out of 26 LAC countries for 2005-10. The only exceptions are the Bahamas,Brazil, Chile and Costa Rica (at replacement level of 1.9) and Trinidad and Tobago and Barbados at 1.8.However, the fertility levels have declined in each ten-year period over the last 30 years, with the exceptionof Barbados between 1995 and 2005. Fertility rates have a profound implication for pension systemsbecause they, along with life expectancy, are the drivers of population ageing.

FERTILITY
PENSIONS AT A GLANCE: LATIN AMERICA AND THE CARIBBEAN © OECD, THE WORLD BANK AND IDB 2014 41
2.1. Total fertility rates, 1975-2050
1975-80 1985-90 1995-00 2005-10 2015-20 2025-30 2035-40 2045-50 2055-60
Argentina 3.44 3.05 2.63 2.25 2.12 2.01 1.94 1.89 1.87
Bahamas 2.96 2.65 2.33 1.91 1.87 1.84 1.83 1.82 1.83
Barbados 2.16 1.77 1.74 1.83 1.86 1.88 1.90 1.91 1.92
Belize 6.20 4.70 3.85 2.94 2.52 2.24 2.05 1.93 1.85
Bolivia 5.80 5.00 4.32 3.50 3.04 2.70 2.46 2.27 2.11
Brazil 4.31 3.10 2.45 1.90 1.75 1.69 1.69 1.71 1.74
Chile 2.80 2.65 2.21 1.90 1.79 1.77 1.78 1.80 1.81
Colombia 4.34 3.24 2.75 2.45 2.17 1.97 1.86 1.80 1.80
Costa Rica 3.78 3.37 2.58 1.92 1.73 1.67 1.68 1.71 1.75
Dominican Republic 4.76 3.65 2.98 2.67 2.35 2.10 1.94 1.84 1.80
Ecuador 5.09 4.02 3.19 2.75 2.43 2.20 2.03 1.91 1.85
El Salvador 5.46 4.20 3.30 2.35 2.08 1.90 1.80 1.75 1.75
Guatemala 6.20 5.70 5.00 4.15 3.52 3.04 2.70 2.45 2.27
Guyana 4.42 2.52 2.53 2.77 2.40 2.19 2.06 1.99 1.94
Haiti 5.80 5.70 4.62 3.55 2.90 2.50 2.24 2.06 1.94
Honduras 6.60 5.37 4.30 3.31 2.80 2.46 2.22 2.04 1.92
Jamaica 4.00 3.10 2.67 2.40 2.16 2.00 1.90 1.85 1.84
Mexico 5.25 3.63 2.80 2.37 2.06 1.86 1.76 1.74 1.75
Nicaragua 6.35 5.00 3.60 2.76 2.33 2.08 1.91 1.82 1.78
Panama 4.19 3.24 2.87 2.62 2.36 2.17 2.02 1.94 1.89
Paraguay 5.20 4.77 3.88 3.08 2.72 2.46 2.26 2.10 1.99
Peru 5.38 4.10 3.10 2.60 2.29 2.07 1.92 1.83 1.80
Suriname 4.20 3.00 2.80 2.42 2.16 1.99 1.89 1.84 1.83
Trinidad and Tobago 3.24 2.75 1.82 1.80 1.79 1.79 1.80 1.81 1.82
Uruguay 2.89 2.53 2.30 2.12 2.00 1.93 1.88 1.86 1.86
Venezuela 4.47 3.65 2.94 2.55 2.28 2.07 1.94 1.86 1.82
LAC26 4.59 3.71 3.06 2.57 2.29 2.10 1.98 1.91 1.87
OECD countries
Canada 1.73 1.62 1.56 1.63 1.70 1.76 1.80 1.83 1.85
France 1.86 1.81 1.76 1.97 1.98 1.99 1.99 1.99 1.99
Germany 1.51 1.43 1.35 1.36 1.46 1.54 1.59 1.64 1.68
Portugal 2.55 1.62 1.48 1.36 1.33 1.44 1.53 1.62 1.68
Spain 2.55 1.46 1.19 1.41 1.57 1.67 1.74 1.79 1.82
United Kingdom 1.73 1.84 1.74 1.88 1.89 1.89 1.90 1.90 1.90
United States 1.77 1.92 2.00 2.06 1.98 1.98 1.99 1.99 1.99
Source: United Nations, World Population Prospects – 2012 Revision.1 2 http://dx.doi.org/10.1787/888933161889

PENSIONS AT A GLANCE: LATIN AMERICA AND THE CARIBBEAN © OECD, THE WORLD BANK AND IDB 201442
LIFE EXPECTANCY
Mortality declines started early in the twentiethcentury in most countries in Latin America and theCaribbean. By 1950, life expectancy at birth wasslightly over 50 years in the region, an indicator thatimproved by more than 40% in the following 50 years.
While mortality declined at all ages, the maindriver of the increase in life expectancy at birth was thereduction in infant mortality rate for several decades.Only by 2005 did the increases in life expectancy atbirth become slower than those of life expectancy atage 65. This decline in old-age mortality is especiallyimportant for the finances of retirement-income sys-tems, as older people are living ever longer. In 2010-15,on average in LAC countries, women aged 65 couldexpect to live an additional 18.6 years, which is forecastto increase to 22.0 years by 2050-55. Men of the sameage could expect to live 16.1 more years in 2010-15,with a projected increase of 2.8 years by 2050-55 toreach 18.9 years. Gender gaps in the longevity of olderpeople are expected to remain broadly constant in rel-ative terms but increase in absolute terms (from 2.5 to3.1 years on average in LAC countries). Paying pensionsfrom age 65 would become around 15-20% more expen-sive under these forecasts.
There is considerable variation between LAC coun-tries in life expectancy at older ages. Women in Chile arepredicted to live another 25.8 years on reaching age 65in 2050-55. In contrast, women in Guyana are expectedto live an extra 15.9 years from age 65 in 2050-55. Thefigure for Chile is considerably higher than any othercountries, with Belize and Costa Rica being the nexthighest at 25.0 and 24.8 years respectively.
For men there is less variation between countriesthan there is for women. Costa Rica has the longestlife expectancy at age 65 of 22.0 years in 2050-55, fol-lowed by Chile at 21.8 years. Again, Guyana has theshortest life expectancy for 65-year-old: 13.3 years.
The gender life-expectancy gap at age 65 is pre-dicted to be between two and five years in favour ofwomen for every LAC country in 2050-55.
This is a worldwide trend, and as a result manycountries have increased or plan to increase theirpension ages. Others have introduced elements intotheir retirement-income provision that will automati-cally adjust the level of pensions as people live longer.Both of these options will have to be considered in theLAC region as life expectancy estimates continue toincrease and with retirement ages being under 65 inmany countries, meaning that retirement duration isin fact higher than the figures quoted above.
Overall, longevity gains are due to rising livingstandards, but also greater access to quality healthservices. While socioeconomic differences at all ages(and particularly among children) have been signifi-cant for many years, future declines in mortality areexpected to reduce the gaps currently observed acrosssocial groups in most countries.
Definition and measurement
Life expectancy is defined as the average numberof years that people of a particular age could expect tolive if they experienced the age- and sex-specific mor-tality rates prevalent in a given country in a particularyear. Since the determinants of longevity changeslowly, life expectancy is best analysed over a longtime horizon.
Sources and further reading
Whitehouse, E.R. (2007), “Life-Expectancy Risk andPensions: Who Bears the Burden?”, OECD Social,Employment and Migration Working Paper No. 60,OECD Publishing, Paris, http://dx.doi.org/10.1787/060025254440.
Whitehouse, E.R. and A. Zaidi (2008), “Socio-EconomicDifferences in Mortality: Implications for PensionPolicy”, OECD Social, Employment and MigrationWorking Paper No. 71, OECD Publishing, Paris,http://dx.doi.org/10.1787/231747416062.
Key results
The remarkable decline in mortality, as evidenced by the increase in life expectancy, is one of the greatestachievements of the last century. Lives continue to get longer, and this trend is predicted to continue.In 2010-15, life expectancy at birth averaged 70.7 years for men and 76.6 years for women. Among women,the figure was highest in Chile (82.6 years), followed by Costa Rica, Uruguay, Jamaica, Panama, Argentina,Mexico and Ecuador, all above 79.0 years. For men, life expectancy at birth was highest in Costa Rica(77.7 years) followed by Chile, Mexico and Panama.

LIFE EXPECTANCY
PENSIONS AT A GLANCE: LATIN AMERICA AND THE CARIBBEAN © OECD, THE WORLD BANK AND IDB 2014 43
2.2. Additional life expectancy at age 65, in years, men and women, in 2010-15 and 2050-55
Source: United Nations, World Population Prospects – 2012 Revision.1 2 http://dx.doi.org/10.1787/888933161434
2.3. Life expectancy at birth, in years, men and women, in 2010-15
Source: United Nations, World Population Prospects – 2012 Revision.1 2 http://dx.doi.org/10.1787/888933161442
2050-55 2010-15
30 25 20 15 10 10 15 20 255 50 0
21.721.821.821.8
21.020.2
21.222.021.721.8
21.421.3
20.321.5
20.420.820.8
19.019.0
19.720.1
19.619.219.5
18.919.0
18.017.7
16.816.1
13.515.0
14.113.2
27.326.9
25.825.325.225.024.924.8
24.424.224.124.123.923.823.723.623.423.123.122.822.822.722.222.122.0
21.420.420.3
19.719.2
18.217.7
16.115.9
FranceSpainChile
CanadaPortugal
BelizeGermany
Costa RicaPanama
United KingdomEcuador
NicaraguaHonduras
MexicoBrazil
United StatesPeru
ArgentinaUruguay
GuatemalaDominican Republic
El SalvadorColombiaBahamasLAC26
VenezuelaJamaica
BarbadosParaguaySuriname
Trinidad and TobagoBoliviaHaiti
Guyana
Women Men
40
45
50
55
60
65
70
75
80
85
90
ESP
FRA
CANDEU PRT
CHLGBR CRI
USAURY
JAM
PANARG
MEXEC
UBHS
NICBRB
COLVEN BRA
PER BLZSLV
LAC26DOM
HNDGTM
PRYSUR
TTO BOLGUY
HTI
78.8
78.2
79.3
78.2
76.8
77.0 78
.5
77.7
76.4
73.6
70.3
74.7
72.5 74
.9
73.5
72.0
71.6 72
.9
70.3 71
.7
70.2 72
.0
70.8
67.7 70
.7
70.3 71
.3
68.4 70
.0
67.8
66.3
64.9
63.5
61.1
85.2
85.1
83.5
83.1
82.8
82.6
82.4
82.1
81.2
80.5
77.6 80
.4
79.8
79.7
79.3
78.1
77.7
77.7
77.6
77.6
77.5
77.4
77.0
77.0
76.6
76.6
76.2
75.5
74.5
74.2
73.6
69.3
68.8
64.8
Women Men

PENSIONS AT A GLANCE: LATIN AMERICA AND THE CARIBBEAN © OECD, THE WORLD BANK AND IDB 201444
OLD-AGE SUPPORT RATIO
In 2010, the demographically oldest LAC countrywas Uruguay, with a support ratio of only 4.0. Argentinawas next at 5.3, followed by Barbados at 6.1, with Chileand Jamaica being the only other countries underseven.
The youngest countries were Belize and Guyana,with support ratios of 12.8 and 15.4 respectively, fol-lowed by Haiti and Honduras, both around 11.0.Another three countries, namely Bolivia, Colombiaand Nicaragua all have support ratios above 10.0.
The evolution of support ratios depends on mor-tality, fertility rates and migration. As shown in theprevious two indicators, LAC countries have seen con-tinual increases in life expectancy, which most ana-lysts forecast to continue in the future (with particularimpact on old-age mortality). This trend, togetherwith the continuous decline in fertility will result inan increase of the percentage of older people and thenumber of pensioners.
There have also been substantial declines in fer-tility, which, of course, will reduce the relative size ofcohorts of workers entering the labour market. Sincethe babies have already been born, we know the scaleof the change in the number of people of working agefor the next two decades. For example, fertility ratesare already below the replacement level in countrieslike Costa Rica, Brazil or Chile, meaning that new gen-erations will be smaller than those of their parents. Inthe future, however, there is a great deal of uncer-tainty over how fertility rates will evolve.
For the LAC region as a whole, the decline in thesupport ratio is forecast to continue at a reasonablysteady rate in the future. There is, however, predicted to
be a considerable convergence between LAC countries,with demographically younger countries ageing morerapidly. By far the most rapid population ageing amongLAC countries will be in Guyana. The support ratio isprojected to drop from the aforementioned 15.4 in 2010to 8.9 by 2030 and 4.5 by 2060. Guyana will move frombeing the youngest country in the LAC region to thefourth youngest in 2060.
The other LAC countries that are currently demo-graphically young – Belize, Haiti and Honduras – willalso age relatively rapidly. Like Guyana, they willremain among the youngest LAC countries in 2060,with support ratios of 3.1 in Belize, 4.7 in Haiti and 3.4in Honduras. Only Guatemala at 4.9 and Bolivia at 4.8are projected to have a higher ratio by 2060.
By 2060 18 of the countries in the region are fore-cast to have a support ratio of less than three withChile lowest at 1.8, followed by Costa Rica at 1.9 andBrazil at 2.1.
This support ratio can be misleading for theLAC region. Not all individuals of retirement age areactually working, and in the region many countriesallow for retirement benefits well below the65-years-old threshold. Also, there are many elderlywith no access to pensions, given the contributorynature of these programmes.
Definition and measurement
The projections for old-age support ratios usedhere are based on the most recent “medium-variant”population projections. They are drawn fromthe United Nation, World Population Prospects – 2012Revision.
Key results
Population ageing is one of the main driving forces behind the wave of pension reforms across the worldin recent years. The old-age support ratio is an important indicator of the pressures that demographicspose for pension systems. It measures how many people there are of working age (20-64) relative to thenumber of retirement age (65+). At the moment, there are just over eight people of working age for everyone of pension age on average.
LAC countries have been ageing for some time, but generally at a slow rate: between 1950 and 1980, theaverage support ratio decreased from 13.4 to 10.2. However, the decline in the more recent period has beenslower, with the fall from 10.2 to 8.4 taking 30 years. From 2010, population ageing is expected to accelerate.By 2030, the support ratio is projected to reach 5.0 and fall further to under 2.5 by 2060.

OLD-AGE SUPPORT RATIO
PENSIONS AT A GLANCE: LATIN AMERICA AND THE CARIBBEAN © OECD, THE WORLD BANK AND IDB 2014 45
2.4. Old-age support ratios – historical and projected values, 1950-2050
Source: United Nations, World Population Prospects – 2012 Revision.1 2 http://dx.doi.org/10.1787/888933161452
20.00
16.00
12.00
8.00
4.00
0
1950
1955
1960
1965
1970
1975
1980
1985
1990
1995
2000
2005
2010
2015
2020
2025
2030
2035
2040
2045
2050
20.00
16.00
12.00
8.00
4.00
0
1950
1955
1960
1965
1970
1975
1980
1985
1990
1995
2000
2005
2010
2015
2020
2025
2030
2035
2040
2045
2050
20.00
16.00
12.00
8.00
4.00
0
1950
1955
1960
1965
1970
1975
1980
1985
1990
1995
2000
2005
2010
2015
2020
2025
2030
2035
2040
2045
2050
20.00
16.00
12.00
8.00
4.00
0
1950
1955
1960
1965
1970
1975
1980
1985
1990
1995
2000
2005
2010
2015
2020
2025
2030
2035
2040
2045
2050
20.00
16.00
12.00
8.00
4.00
0
1950
1955
1960
1965
1970
1975
1980
1985
1990
1995
2000
2005
2010
2015
2020
2025
2030
2035
2040
2045
2050
Chile LAC26
BrazilBelize Bolivia
BarbadosArgentina Bahamas
Guyana LAC26
GuatemalaEcuador El Salvador
Domin. Rep.Colombia Costa Rica
LAC26
PanamaMexico Nicaragua
JamaicaHaiti Honduras
Venezuela LAC26
Trinidad and Tobago Uruguay
SurinameParaguay Peru
United States LAC26
Spain Portugal United Kingdom
GermanyCanada France


Pensions at a Glance
Latin America and the Caribbean
© OECD, The World Bank and IDB 2014
47
Chapter 3
Key pension policy indicators
Pension entitlements are calculated using the OECD pension models. The theoreticalcalculations are based on national parameters and rules applying in 2010 andassume workers entering the labour market in that year at age 20. The full impactof pension reforms that have already been legislated but are currently being phasedin is taken into account in the calculations. The indicators are preceded by a note onthe architecture of national pension systems followed by a note on methodology andassumptions.
The pension entitlements indicators begin with the familiar replacement rate: theratio of pension to individual earnings. The first looks at gross (before tax)replacement rates from all mandatory and quasi-mandatory sources, for a singleperson. The second shows an analysis of the tax treatment of pensions andpensioners. The third indicators shows replacement rates in net terms, takingaccount of taxes and contributions paid on earnings and pensions.
There follow three indicators of “pension wealth”: the lifetime value of the flow ofretirement benefits. This is a more comprehensive measure than replacement ratesbecause it takes account of pension ages, indexation and life expectancy. The firsttwo indicators are gross and net pension wealth, the third is the change in grosspension wealth.
The balance between two policy goals – providing adequate old-age incomes andreplacing a target share of earnings – is explored in the next pair of indicators. Theysummarise the progressivity of pension benefit formulae and the link betweenpensions and earnings.
The final two indicators of entitlements average across individuals with differentearnings levels, and show pension levels, pension wealth and the role of each partof the retirement-income system.

PENSIONS AT A GLANCE: LATIN AMERICA AND THE CARIBBEAN © OECD, THE WORLD BANK AND IDB 201448
ARCHITECTURE OF NATIONAL PENSIONS SYSTEMS
Programmes aimed to prevent poverty in oldage – first-tier, redistributive schemes – are providedby the public sector and are of three main types.
Resource-tested or targeted plans pay a higherbenefit to poorer pensioners and reduced benefits tobetter-off retirees. In these plans, the value of benefitsdepend either on income from other sources or onboth income and assets. All countries have generalsocial safety-nets of this type, but in some cases theyonly cover a few older people who had many careerinterruptions. Nine LAC countries are marked in thiscolumn. Full-career workers with low earnings wouldbe entitled to resource-tested benefits in these coun-tries.
Basic schemes pay either flat rate benefits (thesame amount to every retiree) or their value dependsonly on years of work, not on past earnings. Addi-tional retirement income does not change the entitle-ment. Some five LAC countries have a basic pensionscheme or other provisions with a similar effect.
Minimum pensions, which share many featureswith resource-tested plans, are found in two LACcountries. The value of entitlements takes accountonly of pension income.
Among the LAC countries, only Suriname doesnot have mandatory, second-tier provision. In theother 25 countries, there are two kinds of scheme.
Defined-benefit (DB) plans are provided by thepublic sector in 21 LAC countries. Retirement incomedepends on the number of years of contributions andindividual earnings.
Defined-contribution (DC) plans are compulsoryin six LAC countries (in two additional countries,Colombia and Peru, it is possible to choose either a DBor a DC scheme). In these schemes, contributions flowinto an individual account. The accumulation of con-tributions and investment returns is usually con-verted into a pension-income stream at retirement.
Notional-accounts schemes record contributions inan individual account and apply a rate of return to thebalances. This return is typically based on the growth ofthe covered wage bill or average wage. The accounts are“notional” in that the balances exist only on the books ofthe managing institution. At retirement, the accumu-lated notional capital is converted into a stream of pen-sion payments using a formula based on life expectancy.Designed to mimic DC schemes, they are often callednotional defined-contribution plans (NDC). These arenot presently found in the LAC region.
Retirement-income systems are diverse and often involve a number of different programmes. Classifyingpension systems and different retirement-income schemes is consequently difficult. The taxonomy ofpensions used here consists of two mandatory “tiers”: a redistributive part and a savings part. Voluntaryprovision, be it individual or employer-provided, makes up a third tier.

ARCHITECTURE OF NATIONAL PENSIONS SYSTEMS
PENSIONS AT A GLANCE: LATIN AMERICA AND THE CARIBBEAN © OECD, THE WORLD BANK AND IDB 2014 49
3.1. Taxonomy: Different types of retirement-income provision
3.2. Structure of retirement-income provision
Public Public Private
Resource-tested Basic Minimum Type Type
OECD membersArgentina ✓ DBBahamas ✓ DBBarbados ✓ DBBelize ✓ DBBolivia ✓ DBBrazil DBChile ✓ ✓ DCColombia DB/DCCosta Rica ✓ DB DCDominican Republic ✓ DCEcuador ✓ DBEl Salvador DCGuatemala DBGuyana ✓ DBHaiti ✓ DBHonduras DBJamaica ✓ DBMexico ✓ ✓ DCNicaragua DBPanama DBParaguay DBPeru DB/DCSuriname ✓
Trinidad and Tobago DBUruguay DB DCVenezuela DBOECD countriesCanada ✓ ✓ DBFrance ✓ DB + pointsGermany ✓ PointsPortugal ✓ DBSpain ✓ DBUnited Kingdom ✓ ✓ ✓ DBUnited States DB
DB = Defined benefit; DC = Defined contribution; NDC = Notional accounts.Source: See country profiles in Chapter 4 of this report.
1 2 http://dx.doi.org/10.1787/888933161899
Retirement-income system
Second TierMandatory, savings
Third TierVoluntary, savings
First TierMandatory, adequacy
Public PrivatePrivateBasic
Resource-tested/social assistance
Minimum pension(second tier)
Defined benefit Definedbenefit
Definedcontribution
Definedbenefit
Definedcontribution
Points
Notional accounts

PENSIONS AT A GLANCE: LATIN AMERICA AND THE CARIBBEAN © OECD, THE WORLD BANK AND IDB 201450
METHODOLOGY AND ASSUMPTIONS
The pension entitlements that are presented arethose that were legislated in the LAC countries at thetime of writing. Changes in rules that have alreadybeen legislated, but are being phased-in gradually, areassumed to be fully in place from the start. Reformsthat have been legislated since 2010 are includedwhere sufficient information is available.
The values of all pension-system parametersreflect the situation in the year 2010. Where reformshave taken place more recently, parameters have beenre-calculated for 2010 values assuming that thechanged rules were already in place.
The calculations show the pension entitlementsof a worker who enters the system today and retiresafter a full career. The main results are shown for asingle person.
Career length
A full career is defined here as entering thelabour market at age 20 and working until the stan-dard pension-eligibility age, which, of course, variesbetween countries. The implication is that the lengthof career varies with the statutory retirement age:40 years for retirement at 60, 45 with retirement ageat 65, 47 with retirement at 67, etc.
Coverage
The pension models presented here include allmandatory pension schemes for private-sector work-ers, regardless of whether they are public (i.e. theyinvolve payments from government or from socialsecurity institutions, as defined in the System ofNational Accounts) or private. For each country, themain national scheme for private-sector employees ismodelled. Schemes for civil servants, public-sectorworkers and special professional groups are excluded.
Resource-tested benefits for which retired peoplemay be eligible are also modelled. These can bemeans-tested, where both assets and income are takeninto account, purely income-tested or withdrawn onlyagainst pension income. The calculations assume thatall entitled pensioners take up these benefits. Wherethere are broader means tests, taking account also ofassets, the income test is taken as binding. It isassumed that the whole of income during retirementcomes from the mandatory pension scheme (or fromthe mandatory plus voluntary pension schemes inthose countries where the latter are modelled).
Pension entitlements are compared for workerswith a range of different earnings levels: between0.5 times and four times the economy-wide average.This range permits an analysis of future retirementbenefits of both the poorest and richer workers.
Economic variables
The comparisons are based on a single set of eco-nomic assumptions for all countries and other majoreconomies analysed. In practice, the level of pensionswill be affected by economic growth, wage growth andinflation, and these will vary across countries. A sin-gle set of assumptions, however, ensures that the out-comes of the different pension regimes are notaffected by different economic conditions. In this way,differences across countries in pension levels reflectdifferences in pension systems and policies alone.The baseline assumptions are set out below.
Price inflation is assumed to be 2.5% per year. Inpractice, this assumption has little effect on theresults because of indexation.
Real earnings growth of 2% per year (given theassumption for price inflation, this implies nominalwage growth of 4.55%). Individual earnings areassumed to grow in line with the economy-wide aver-age. This means that the individual is assumed toremain at the same point in the earnings distribution,earning the same percentage of average earnings inevery year of the working life.
The real rate of return after administrative chargeson funded, defined-contribution pensions is assumedto be 3.5% per year.
The discount rate (for actuarial calculations) isassumed to be 2% per year. The discount rate is set atthe same rate as real earnings growth, which is a com-mon finding of growth models and other dynamiceconomic models (see Queisser and Whitehouse, 2006for a discussion of the discount rate).
The baseline modelling uses country-specificprojections of mortality rate from the United Nationspopulation Database for the year 2055.
The calculations assume that benefits fromdefined-contribution plans are paid in the form of aprice-indexed life annuity at an actuarially fair price.This calculation is based on the mortality projections.If people withdraw the money in alternative ways, thecapital sum at the time of retirement is the same: it is
Part of the analysis presented in Chapter 1, the indicators of pension entitlements that follow here inChapter 3 and the results presented in Chapter 4 use the OECD pension models. The methodology andassumptions are common to the analysis of all countries, allowing the design of pension systems to becompared directly. Future entitlements are computed under today’s parameter and rules.

METHODOLOGY AND ASSUMPTIONS
PENSIONS AT A GLANCE: LATIN AMERICA AND THE CARIBBEAN © OECD, THE WORLD BANK AND IDB 2014 51
only the way that the benefits are spread that ischanged.
Taxes and social security contributions
The modelling assumes that tax systems andsocial-security contributions remain unchanged inthe future. This implicitly means that “value” param-eters, such as tax allowances or contribution ceilings,are adjusted annually in line with average earnings,while “rate” parameters, such as the personal incometax schedule and social security contribution rates,remain unchanged.
Caveats and interpretation of indicators
A number of caveats are necessary when using theindicators presented below. First, these indicators arenot meant to serve as projections. This is especiallyimportant to emphasize in LAC countries where thestandardised assumptions clearly do not reflect theactual experience of many, if not most countries. Amongthe most important deviations are those related to cov-erage or contribution patterns. The empirical evidence(see Chapter 1) shows that the minority of workerswould have the kind of complete contribution historiesassumed in the modelling. Moreover, “contribution den-sity” is positively correlated with income level. This real-ity should be kept in mind when referring to thereplacement rate and pension wealth figure.
Another important caution in interpreting thedata regards the mortality tables that are used. Whilethere is little evidence, it is very likely that mortalityrates of workers contributing to pension schemes andworking in the formal sector are lower than those ofagricultural workers or those that spend their careers inthe informal sector. (Given the focus of this edition oncoverage, simulations based on variants on the standardcoverage assumption were provided in Chapter 1) Thistends to understate pension wealth estimates andannuities in the case of defined-contribution schemeswhich use these tables to convert an accumulatedbalance to a stream of payments.
The prevalence of defined-contribution schemesin the region also means that the assumption regard-ing rates of return on individual accounts plays animportant role in generating the indicator. The effectof compounding over forty years or more is powerfuland small changes in this variable will have majoreffects on the pension levels in many LAC countries.The actual experience in some countries (e.g. Chileand Mexico) over relatively long periods of time hassignificantly exceeded the return assumed here evenafter taking into account costs. The experience is lesspositive in some countries or the extent of the experi-ence to date is too short to assess.
It is also important to note that unlike mostOECD countries, the non-contributory pension in LACis the only source of pension income for the bottompart of the income distribution where there is oftennegligible coverage from the contributory scheme.This is especially true in the lower income countries.This should be taken into consideration when lookingat the figures below and particularly, the lowest wageworkers. In fact, many of them would not be eligiblefor any contributory pension income.
Finally, regardless of country or region, theseindicators refer specifically to workers entering thelabour force today. This allows the results to reflectreforms that are being phased in gradually but thatwill only have an impact in the long run. In a compre-hensive analysis, the outcomes for different cohortswould be required.
The indicators presented here are meant to cap-ture the implicit objectives of the pension systemdesigns. They cannot, nor do they aspire, to predictthe outcomes for workers.
Further reading
Queisser, M. and E.R. Whitehouse (2006), “Neutral orFair? Actuarial Concepts and Pension-SystemDesign”, OECD Social, Employment and MigrationWorking Papers, No. 40, OECD Publishing, http://dx.doi.org/10.1787/351382456457.

PENSIONS AT A GLANCE: LATIN AMERICA AND THE CARIBBEAN © OECD, THE WORLD BANK AND IDB 201452
GROSS PENSION REPLACEMENT RATES
Many countries attempt to protect low-incomeworkers from old-age poverty by providing higherreplacement rates for them than for average earners.For example, workers earning only half the averagereceive replacement rates averaging more than 73%,compared with 62% for average earners. However,replacement rates in 12 countries are the same ataverage and half-average pay.
At the top of the range, there are four countriesthat provide low earners with pensions equal to orhigher than their earnings when working: Colombia(replacement rate of 103%), Jamaica (101%), Paraguay(104%) and Venezuela (138%). At the other end of thescale, the Dominican Republic and Haiti offer replace-ment rates of 23% and 30%, respectively. Some coun-tries, such as El Salvador and less so Mexico andSuriname, pay relatively small benefits to averageearners, but are towards the middle of the range forlow-income workers. As Suriname pays a flat benefitthe proportion obviously decreases proportionally asearnings increase.
On average in the 26 LAC countries, the grossreplacement rate at twice average earnings is 55%,somewhat below the 62% figure for average earners.For these earners, country variations are again wide.Replacement rates exceed 90% in two countries:Ecuador and Paraguay. At the other end of the spectrum,the Dominican Republic, El Salvador, Haiti, Mexico andSuriname offer replacement rates of less than 30%.
For the higher earners, namely those with earn-ings of three times the average, the picture is againsimilar. The overall average for the region has fallen to51% with Ecuador and Paraguay continuing to havethe highest replacement rates, as in both countries
there is no ceiling to contributions at this level. TheBahamas and Peru now join the Dominican Republic,El Salvador, Haiti, Mexico and Suriname as countrieswith replacement rates below 30%.
Gross pension replacement rates for women dif-fer (due to a lower pension eligibility age for womenthan for men) in many countries. Differences betweenthe sexes are substantial in Chile, with replacementrates around 10 to 13 percentage points lower forwomen than they are for men across the earningsrange. In Argentina, Brazil, Colombia, El Salvador,Honduras, Panama and Venezuela, replacement ratesfor women are also lower than they are for men, butless so than in Chile. The value for women is alsolower in Mexico, but this is due to a higher annuityrate rather than a difference in retirement age.
Definition and measurement
The gross replacement rate is defined as grosspension entitlement divided by gross pre-retirementearnings. Often, the replacement rate is expressed asthe ratio of the pension to final earnings (just beforeretirement). Here, however, pension benefits areshown as a share of individual lifetime average earn-ings (revalued in line with economy-wide earningsgrowth). Under the baseline assumptions, workersearn the same percentage of economy-wide averageearnings throughout their career. In this case, lifetimeaverage revalued earnings and individual final earn-ings are identical. If people move up the earnings dis-tribution as they get older, then their earnings justbefore retirement will be higher than they were onaverage over their lifetime and replacement rates cal-culated on individual final earnings would be lower.
Key results
The gross replacement rate shows the level of pensions in retirement relative to earnings when working.For workers with average earnings, the gross replacement rate averages 62% in the 26 LAC countries. Butthere is significant cross-country variation. At the bottom of the range, the Dominican Republic, Haiti,Mexico and Suriname offer future replacement rates of less than 30% for people starting work today withaverage earnings throughout their career. Ecuador, Nicaragua, Paraguay and Venezuela, at the top of therange, offer replacement rates of more than 90%. Other countries with high projected replacement rates(between 75% and 80%) are Argentina, Costa Rica and Panama.

GROSS PENSION REPLACEMENT RATES
PENSIONS AT A GLANCE: LATIN AMERICA AND THE CARIBBEAN © OECD, THE WORLD BANK AND IDB 2014 53
3.3. Gross pension replacement rates by earnings
Individual earnings, multiple of mean for men (women where different)
0.5 1.0 2.0 3.0 0.5 1 2 3
Argentina 89.5 (82.2) 77.5 (70.3) 71.5 (64.3) 69.5 (62.3) Nicaragua 94.2 94.2 75.3 75.3
Bahamas 56.5 56.5 33.6 22.4 Panama 78.4 (72.8) 78.4 (72.8) 78.4 (72.8) 78.4 (72.8)
Barbados 60.0 60.0 50.5 33.7 Paraguay 104.1 104.1 104.1 104.1
Belize 69.0 69.0 57.7 38.5 Peru (DB) 76.8 70.6 35.3 23.5
Bolivia 37.5 41.0 33.9 31.6 Suriname 59.3 29.7 14.8 9.9
Brazil 56.2 (51.2) 58.3 (53.2) 62.6 (57.1) 52.5 (47.9) Trinidad and Tobago 66.3 35.1 36.6 36.6
Chile 60.2 (50.7) 43.9 (34.4) 39.2 (26.2) 39.2 (25.6) Uruguay 52.5 52.5 63.3 73.8
Colombia (DB) 102.6 70.8 (64.1) 70.8 (64.1) 70.8 (64.1) Venezuela 137.6 (132.9) 94.2 (89.5) 72.5 (67.8) 65.3 (60.6)
Costa Rica 87.7 79.4 79.4 79.4 LAC26 72.6 (71.2) 61.9 (60.2) 55.4 (53.2) 51.4 (49.2)
Dominican Republic 22.8 22.8 22.8 22.8
Ecuador 94.2 94.2 94.2 94.2 OECD countries
El Salvador 93.1 46.6 29.2 (23.3) 29.2 (21.9) Canada 77.3 44.0 22.0 14.7
Guatemala 67.8 67.8 67.8 67.8 France 55.1 49.0 37.1 32.9
Guyana 68.2 66.0 66.0 52.0 Germany 43.2 43.2 33.6 22.4
Haiti 29.8 29.8 29.8 29.8 Portugal 61.2 54.6 53.6 52.6
Honduras 64.9 (60.9) 64.9 (60.9) 64.9 (60.9) 64.9 (60.9) Spain 73.9 73.9 57.2 38.1
Jamaica 101.3 72.2 57.7 43.2 United Kingdom 56.6 31.9 16.8 11.2
Mexico 57.3 29.5 (28.6) 27.4 (24.9) 26.7 (24.3) United States 50.3 38.7 28.8 20.6
Source: OECD pension models. 1 2 http://dx.doi.org/10.1787/888933161903
3.4. Gross pension replacement rates: Average earners
Source: OECD pension models. 1 2 http://dx.doi.org/10.1787/888933161464
3.5. Gross pension replacement rates: Low and high earners
Source: OECD pension models. 1 2 http://dx.doi.org/10.1787/888933161478
125
100
75
50
25
0
DOMMEX
SUR HTIGBR
TTO USABOL
DEU CHLCAN
SLV FRA
URYPRT
BHSBRA
BRB
LAC26HND
GUYGTM BLZ
PER COLJA
M ESP
ARGPAN CRI
NIC ECU
VEN PRY
150
125
100
75
50
25
0
DOM HTIBOL
DEU USAURY
FRA
BRABHS
GBRMEX
SURBRB
CHLPRT
HNDTTO GTM
GUYBLZ
LAC26ES
PPER CAN
PAN CRIARG
SLV NIC ECU
JAM
COLPRY
VEN
GRR low GRR high

PENSIONS AT A GLANCE: LATIN AMERICA AND THE CARIBBEAN © OECD, THE WORLD BANK AND IDB 201454
TAX TREATMENT OF PENSIONS AND PENSIONERS
Of the 26 LAC countries five of them provideadditional basic relief under the personal income tax.Generally, this takes the form of an extra tax allow-ance or tax credit.
A significant number of countries offer tax relieffor particular source of retirement income. Relief fromincome tax for public pensions, either full or partial, isavailable in 13 LAC countries. Overall, 17 LAC coun-tries have some concession for older people or pen-sion income under their personal income taxes. Inonly nine is the tax treatment of pensions and pen-sioners the same as it is for people of working age.
Virtually all LAC countries levy employee socialsecurity contributions on workers. However 16 ofthese countries do not levy social security contribu-tions on pensioners. The rate of contributions in theten countries that do levy social security contribu-tions on retirees is always lower than the rate chargedon workers. Typically, older people do not pay contri-butions for pensions or unemployment (for obviousreasons). However, pensioners can be subject to leviesto pay for health or long-term care and, in some cases,are liable for “solidarity” contributions to finance abroad range of benefits.
Empirical results
The charts show the percentage of income paidin taxes and contribution by workers and pensioners.
Starting with pensioners, countries have beenranked by the proportion of income paid in tax at thereplacement rate that an average earner would see inretirement (as set out in the indicator of “Gross pension
replacement rates” above). In 16 of the LAC countries,such a pensioner would not pay any income tax inretirement. This is either because pensions are nottaxable or the basic income-tax reliefs offered to olderpeople are above the pension level. Pensionerswith the gross replacement rate for an averageearner would pay 3.8% of their income in taxes andcontributions.
The other two bars in the charts aim to showdirectly the impact of different tax and contributiontreatment of earnings and pensions. The longer barshows the amount of taxes and contributions paid bya worker with average earnings. This averages 9.7% inLAC countries and 26.2% in the OECD countries listed.
The middle bar shows how much a pensionerwould pay with the same income: that is, a pensionworth the same as average earnings. This averages4.1% in LAC countries, some 5.6 percentage points lessthan what a worker pays with the same level ofincome.
The difference between this 4.1% rate for pen-sioners with an income equal to average earnings andthe 3.5% paid in taxes and contributions paid onincomes equal to the gross replacement rate for anaverage earner illustrates the impact of progressivityin income-tax systems.
References
Keenay, G. and E.R. Whitehouse (2003), “The Role ofthe Personal Tax System in Old-age Support: ASurvey of 15 Countries”, Fiscal Studies, Vol. 24,No. 1, pp. 1-21.
Key results
The personal tax system plays an important role in old-age support. Pensioners often do not pay socialsecurity contributions. Personal income taxes are progressive and pension entitlements are usually lowerthan earnings before retirement, so the average tax rate on pension income is typically less than the taxrate on earned income. In addition, most income tax systems give preferential treatment either to pensionincomes or to pensioners, by giving additional allowances or credits to older people.

TAX TREATMENT OF PENSIONS AND PENSIONERS
PENSIONS AT A GLANCE: LATIN AMERICA AND THE CARIBBEAN © OECD, THE WORLD BANK AND IDB 2014 55
3.6. Treatment of pensions and pensioners under personal income taxand social security contributions
Extra taxFull or partial relieffor pension income
Social securitycontributions
Extra taxFull or partial relieffor pension income
Social securitycontributions
Allowance/credit
Publicscheme
Privatescheme
PensionsAllowance/
creditPublic
schemePrivatescheme
Pensions
Argentina ✓ Low Mexico ✓ None
Bahamas None Nicaragua ✓ None
Barbados ✓ None Panama ✓ Low
Belize None Paraguay ✓ Low
Bolivia ✓ Low Peru ✓ None
Brazil ✓ None Suriname ✓ Low
Chile ✓ Low Trinidad and Tobago Now
Colombia Low Uruguay ✓ Low
Costa Rica None Venezuela ✓ Low
Dominican Republic ✓ None
Ecuador ✓ None Canada ✓ ✓ ✓ None
El Salvador Low France Low
Guatemala None Germany ✓ ✓ Low
Guyana ✓ None Portugal ✓ None
Haiti None Spain ✓ None
Honduras None United Kingdom ✓ None
Jamaica ✓ ✓ None United States ✓ ✓ None
Source: On-line country profiles available at www.oecd.org/els/social/pensions/PAG.1 2 http://dx.doi.org/10.1787/888933161919
3.7. Personal income taxes and social security contributions paid by pensioners and workers
Source: OECD pension models; OECD tax and benefit models.1 2 http://dx.doi.org/10.1787/888933161483
0 10 20 30 40 50 0 10 20 30 40 50
Worker (at average earnings)Pensioner (at gross replacement rate of average earner) Pensioner (at income equal to average earnings)
Taxes and contributions (% of income) Taxes and contributions (% of income)
ParaguayPortugal
United KingdomBolivia
ArgentinaSuriname
United StatesVenezuela
PanamaFrance
El SalvadorChile
SpainUruguayGermanyColombia
JamaicaNicaraguaHonduras
GuatemalaDominican Republic
BahamasBelize
MexicoCosta Rica
EcuadorBrazil
BarbadosPeruHaiti
CanadaTrinidad and Tobago
Guyana

PENSIONS AT A GLANCE: LATIN AMERICA AND THE CARIBBEAN © OECD, THE WORLD BANK AND IDB 201456
NET PENSION REPLACEMENT RATES
The previous indicator of the “Tax treatment ofpensions and pensioners” showed the important rolethat the personal tax and social security contributionsystems play in old-age income support. Pensionersoften do not pay social security contributions andreceive preferential treatment under the income tax.Progressivity of income taxes coupled with grossreplacement rates of less than 100% also mean thatpensioners pay less in income tax than workers. As aresult, net replacement rates are usually higher thangross replacement rates.
For average earners, the pattern of replacementrates across countries is very similar to that for thegross replacement rate. In many countries there iseither no income tax liability at any earnings level orthe threshold means that it does not apply to averageearners. Also pensioners are even more unlikely tohave to pay tax than those of working age. Thereforefor those countries where replacement rates are rela-tively low, people tend to pay much less in income taxwhen retired than they did when working. The liabil-ity to social security contributions is also greatlyreduced, if not removed entirely. Specifically pension-ers are certainly not going to have to pay contributionsfrom their income towards pensions and unemploy-ment but other social security payments are also usu-ally at a lower rate.
Within the LAC region there is considerable vari-ation between countries at average earnings level,with Ecuador, Nicaragua, Paraguay and Venezuelaeither above or very close to a 100% replacement rate.Conversely the Dominican Republic, Haiti, Mexico andSuriname all have replacement rates under 33%.
For low-earners, the effect of taxes and contribu-tions on net replacement rates is more muted than forworkers higher up the earnings scale. This is becauselow-income workers typically pay less in taxes andcontributions than those on average earnings. Inmany cases, their retirement incomes are below the
level of the standard reliefs in the personal income tax(allowances, credits, etc.). Thus, they are often unableto benefit fully from additional concessions granted topensions or pensioners under the personal incometax.
The difference between gross and net replace-ment rates for low earners is 4 percentage points onaverage. Argentina, Peru and Uruguay have muchhigher replacement rates for low earners measure ona net basis than in gross terms.
The net replacement rate for workers earning200% of the average is highest in Ecuador and Paraguay,both still above 100%. The lowest replacement ratesare found in the Dominican Republic, El Salvador andparticularly Suriname. In all countries, workers earn-ing 200% of the average will receive pensions thatamount to well below one-third of their net earningswhen working.
For the highest earners, at 300% of the average,the highest net replacement rates are again in Ecuadorand Paraguay. The number of countries with replace-ment rates below one-third has increased comparedto those earning 200% of the average. As well as theDominican Republic, El Salvador and Suriname, asabove, the Bahamas, Mexico and Peru can also beincluded, with Bolivia and Haiti just above this level.
Definition and measurement
The net replacement rate is defined as the indi-vidual net pension entitlement divided by netpre-retirement earnings, taking account of personalincome taxes and social security contributions paid byworkers and pensioners. Otherwise, the definitionand measurement of the net replacement rates arethe same as for the gross replacement rate (see theprevious indicator).
Details of the rules that national tax systems applyto pensioners can be found in the country profiles.
Key results
For average earners, the net replacement rate across the LAC averages 66%, which is 4 percentage pointshigher than the gross replacement rate. This reflects the higher taxes and contributions that people paidon their earnings when working than they pay on their pensions in retirement. Net replacement rates againvary across a large range, from under 24% in the Dominican Republic to well over 100% in Ecuador andParaguay for average earners.
For low earners (with half of mean earnings), the average net replacement rate across LAC countries is76%. For high earners (300% of mean earnings) the average net replacement rate is 57%, lower than for lowearners. As with gross replacement rates, the differences with earnings reflect progressive features ofpension systems, such as minimum benefits and ceilings on pensionable earnings.

NET PENSION REPLACEMENT RATES
PENSIONS AT A GLANCE: LATIN AMERICA AND THE CARIBBEAN © OECD, THE WORLD BANK AND IDB 2014 57
3.8. Net pension replacement rates by earning
Individual earnings, multiple of mean for men (women where different)
0.5 1.0 2.0 3.0 0.5 1 2 3
Argentina 104.6 (96.1) 90.6 (82.1) 89.6 (81.4) 83.3 (76.1) Nicaragua 94.2 96.6 76.7 77.8
Bahamas 58.8 58.8 34.5 22.8 Panama 79.1 (73.4) 78.8 (73.2) 84.1 (78.1) 89.1 (82.7)
Barbados 66.2 66.5 60.5 42.5 Paraguay 104.1 103.8 105.6 105.8
Belize 76.3 72.5 59.4 41.6 Peru (DB) 88.3 81.1 40.6 28.5
Bolivia 36.4 41.7 36.0 33.9 Suriname 62.6 32.8 18.6 13.3
Brazil 61.1 (55.7) 64.1 (58.4) 72.8 (66.4) 64.3 (58.7) Trinidad and Tobago 68.3 37.6 43.8 42.5
Chile 69.2 (58.3) 50.5 (39.6) 46.3 (31) 47.3 (31) Uruguay 67.7 65.9 75.2 86.2
Colombia ( DB) 102.7 73.8 (66.8) 75.3 (68.2) 75.8 (68.6) Venezuela 143.7 (138.8) 98.5 (93.6) 75.4 (70.5) 67.8 (63.1)
Costa Rica 90.3 84.5 86.0 87.4 LAC26 76.4 (74.9) 66.2 (64.4) 60.9 (58.6) 57.3 (55)
Dominican Republic 23.2 23.7 24.2 25.6
Ecuador 102.8 103.3 103.6 105.3 OECD countries
El Salvador 85.4 45.2 30.1 (23.9) 30.6 (23.4) Canada 94.8 56.5 31.4 22.6
Guatemala 69.9 70.1 72.2 75.7 France 64.6 60.7 48.9 44.2
Guyana 72.0 75.7 74.4 59.4 Germany 56.3 58.5 45.3 30.6
Haiti 31.8 32.5 33.8 33.7 Portugal 71.0 69.8 71.8 69.4
Honduras 67.0 (62.8) 67.1 (62.9) 66.0 (61.9) 65.6 (61.5) Spain 79.3 80.1 63.9 45.3
Jamaica 103.9 74.1 67.1 52.6 United Kingdom 70.2 41.6 23.7 16.6
Mexico 58.0 31.2 (30.3) 32.1 (29.2) 32.4 (29.4) United States 59.7 48.5 38.9 28.9
Source: OECD pension models. 1 2 http://dx.doi.org/10.1787/888933161925
3.9. Net pension replacement rates: Average earners
Source: OECD pension models. 1 2 http://dx.doi.org/10.1787/888933161491
3.10. Net pension replacement rates: Low and high earners
Source: OECD pension models. 1 2 http://dx.doi.org/10.1787/888933161502
125
100
75
50
25
0
DOMMEX
HTISUR
TTO GBRBOL
SLV USACHL
CANDEU BHS
FRA
BRAURY
LAC26BRB
HNDPRT
GTM BLZCOL
JAM
GUYPAN
ESP
PER CRIARG NIC VEN EC
UPRY
175
150
125
100
75
50
25
0
DOM HTIBOL
DEU MEXBHS
USABRA
SURFR
ACHL
BRBHND
URYTTO GTM
GBRPRT
GUY
LAC26BLZ
PANES
PSLV PER CRI
NICCAN
COLEC
UJA
MPRY
ARGVEN
NRR low NRR high

PENSIONS AT A GLANCE: LATIN AMERICA AND THE CARIBBEAN © OECD, THE WORLD BANK AND IDB 201458
GROSS PENSION WEALTH
Replacement rates give an indication of the pen-sion promise, but they are not comprehensive mea-sures; they look only at benefit level at the point ofretirement. For a full picture, life expectancy, retire-ment age and indexation of pensions must also betaken into account. Together, these determine for howlong the pension benefit is paid, and how its valueevolves over time. Pension wealth – a measure of thestock of future flows of pension benefits – takesaccount of these factors. It can be thought of as thelump sum needed to buy an annuity giving the sameflow of pension payments as that promised by man-datory retirement-income schemes.
Gross pension wealth for men is highest in Ecuadorat average earnings level, followed by Nicaragua. Pen-sion wealth in Ecuador averages 23.2 times earningsfor average earners, nearly double the LAC26 figure of12.0 times earnings. Pension wealth for average earn-ers is lowest in the Dominican Republic and Mexico,due to relatively low replacement rates.
Higher replacement rates mean that pensionwealth tends to be higher for low earners than foraverage earners. For men with half- average earn-ings, pension wealth is 13.9 times individual earn-ings on average, compared with 12.0 times for peoplewith average earnings. Similarly, for women with lowearnings, pension wealth of 16.1 compares with13.7 times individual earnings for average earners.For men, in the three countries where pensionwealth for low earners is highest (Ecuador, Nicaraguaand Venezuela), its value is between 22 to 25 timesindividual earnings.
For the very high earners, at three times the aver-age wage, the pension promise is naturally lower thanfor average earners, at 10.1 for men and 11.4 forwomen. There is even more variation at this earningslevel as for men Ecuador is still highest at 23.2 reflect-ing the lack of a ceiling to pensions, whilst Surinameis at only 2.1 due to the flat rate benefit that is paid toall.
Impact of life expectancy
In countries with shorter life expectancies, such asBolivia, Guyana and Haiti, the expected duration ofretirement is shorter, and so, other things equal, thepension promise becomes more affordable. The effect isthe reverse in Chile, Costa Rica and Uruguay, where lifeexpectancies are high. Unlike measures of replacementrates, the link between affordability and life expectancyis captured by the pension-wealth indicator.
Similarly, since women’s life expectancy is longerthan men’s, pension wealth for women is relativelyhigher in all countries. This is simply because pensionbenefits can be expected to be paid over a longerretirement period. Also, some countries still havelower retirement ages for women; this extends thepayment period even further.
Impact of indexation
Pension wealth is also affected by indexationrules. If pensions are indexed to wage growth then theimpact on pension wealth figures will generally begreater than if price indexation, or a combination ofthe two were used. This of course assumes that earn-ings tend to grow faster than prices, so that pensionwealth is higher with these more generous indexationprocedures than with price indexation.
Different indexation policies also affect the pen-sion wealth of women relative to men. Women’s lon-ger life expectancy means that they tend to benefitmore from more generous indexation procedures(above price inflation, for example).
Definition and measurement
The calculation of pension wealth uses a uniformdiscount rate of 2%. Since the comparisons refer to pro-spective pension entitlements, the calculations usecountry-specific mortality rates by age and sex pro-jected for the year 2055. Pension wealth is expressed asa multiple of gross annual individual earnings.
Key results
Pension wealth measures the total value of the lifetime flow of retirement incomes. For male averageearners, pension wealth in the region is, on average, 12.0 times annual earnings. The figure is higher forwomen – 13.7 times individual earnings – because of their longer life expectancy.

GROSS PENSION WEALTH
PENSIONS AT A GLANCE: LATIN AMERICA AND THE CARIBBEAN © OECD, THE WORLD BANK AND IDB 2014 59
3.11. Gross pension wealth by earnings
Individual earnings, multiple of mean Individual earnings, multiple of mean
0.5 1.0 2.0 3.0 0.5 1.0 2.0 3.0 0.5 1.0 2.0 3.0 0.5 1.0 2.0 3.0
Men Women Men Women
Argentina 13.6 11.8 10.8 10.5 17.1 14.6 13.4 13.0 Nicaragua 22.7 22.7 18.1 18.1 25.2 25.2 20.2 20.2
Bahamas 8.5 8.5 5.1 3.4 10.2 10.2 6.1 4.1 Panama 13.8 13.8 13.8 13.8 15.0 15.0 15.0 15.0
Barbados 10.0 10.0 8.4 5.6 12.6 12.6 10.6 7.0 Paraguay 18.5 18.5 18.5 18.5 20.0 20.0 20.0 20.0
Belize 13.3 13.3 11.2 7.4 14.9 14.9 12.4 8.3 Peru (DB) 12.0 11.0 5.5 3.7 13.4 12.3 6.2 4.1
Bolivia 8.7 9.5 7.9 7.3 9.7 10.6 8.8 8.2 Suriname 12.5 6.3 3.1 2.1 14.4 7.2 3.6 2.4
Brazil 15.7 16.3 17.5 14.7 18.2 18.9 20.3 17.0 Trinidad and Tobago 13.7 7.2 7.6 7.6 16.4 8.7 9.1 9.1
Chile 9.8 7.2 6.4 6.4 10.8 7.3 5.6 5.5 Uruguay 12.1 12.1 14.1 16.0 14.5 14.5 16.8 19.0
Colombia (DB) 17.6 12.2 12.2 12.2 22.1 13.8 13.8 13.8 Venezuela 24.9 17.1 13.1 11.8 30.0 20.2 15.3 13.7
Costa Rica 14.8 13.4 13.4 13.4 16.4 14.9 14.9 14.9 LAC26 13.9 12.0 10.8 10.1 16.1 13.7 12.3 11.4
Dominican Republic 4.2 4.2 4.2 4.2 4.6 4.6 4.6 4.6
Ecuador 23.2 23.2 23.2 23.2 25.6 25.6 25.6 25.6 OECD countries
El Salvador 17.2 8.6 5.4 5.4 21.1 10.6 5.3 5.0 Canada 12.5 7.1 3.6 2.4 14.2 8.1 4.1 2.7
Guatemala 14.5 14.5 14.5 14.5 16.4 16.4 16.4 16.4 France 10.5 9.4 7.1 6.3 12.0 10.7 8.1 7.2
Guyana 14.3 13.9 13.9 10.9 17.3 16.7 16.7 13.1 Germany 8.6 8.6 6.7 4.5 9.9 9.9 7.7 5.1
Haiti 7.0 7.0 7.0 7.0 7.7 7.7 7.7 7.7 Portugal 8.6 8.2 8.0 7.9 10.0 9.2 9.0 8.9
Honduras 12.6 12.6 12.6 12.6 16.1 16.1 16.1 16.1 Spain 13.0 13.0 10.1 6.7 14.8 14.8 11.5 7.6
Jamaica 15.7 11.2 9.0 6.7 17.4 12.4 9.9 7.4 United Kingdom 8.8 4.9 2.6 1.7 9.9 5.6 2.9 1.9
Mexico 9.4 4.8 4.5 4.4 10.3 5.2 4.5 4.4 United States 8.0 6.2 4.6 3.3 9.0 6.9 5.1 3.7
Source: OECD pension models.1 2 http://dx.doi.org/10.1787/888933161934
3.12. Gross pension wealth by earnings and sex
Note: Countries are ranked in order of gross pension replacement rates (GRR) of average earners, i.e. mean GRR in the chart.Source: OECD pension models.
1 2 http://dx.doi.org/10.1787/888933161517
35 30 3025 2520 2015 1510 105 50 0
Low men Low women Mean men Mean women
Dominican RepublicMexico
United KingdomUnited States
SurinameHaiti
CanadaChile
Trinidad and TobagoPortugalBahamasGermany
El SalvadorFranceBolivia
BarbadosPeru
JamaicaArgentina
LAC26UruguayColombiaHonduras
SpainBelize
Costa RicaPanamaGuyana
GuatemalaBrazil
VenezuelaParaguayNicaraguaEcuador
Low earners (men and women) Average (mean) earners (men and women)

PENSIONS AT A GLANCE: LATIN AMERICA AND THE CARIBBEAN © OECD, THE WORLD BANK AND IDB 201460
NET PENSION WEALTH
Because net pension wealth is expressed as amultiple of individual gross earnings, it is less thangross pension wealth (if there is some tax liability dur-ing retirement) or the same (if pensions are not taxedor pension income is below tax thresholds). This isclear in the two charts opposite. For example, pensionwealth is the same, in both net and gross terms, inBrazil and Ecuador because pensions are not taxable.This is the case though in over half of the countries inthe region.
Therefore the rankings of pension wealth do notreally change when measured on a net rather than agross basis. The main exception to this is Colombiawhich is ranked 16th for men and 17th for women forgross pension wealth but is 10th for men and 12th forwomen in net pension wealth rankings.
Impact of individual earnings
Low earners are not liable for taxes or contributionsin 17 of the LAC countries covered. The same is also thecase for average earners in the same 17 countries and in15 of them for those at twice average earnings.
For high earners, those at three times the aver-age, there are still twelve countries that are identicalfor gross and net figures. There is actually greaterrange in the results, with those in Ecuador with pen-sion wealth around twelve times that of Suriname.Half of countries have net pension wealth in the rangeof seven to 13 times annual earnings. The main excep-tions to this, along with Ecuador and Suriname men-tioned above, are Nicaragua (at 18.1 times earnings formen), followed by Paraguay at 17.7 times. At the otherend of the scale are the Bahamas at 3.4 and Peru at3.7 times earnings.
For women the picture is virtually identical, butdue to higher life expectancy and, in some cases,lower retirement ages the duration spent in retire-ment will be longer. Therefore the level of pensionwealth is naturally going to be higher as a result.The largest difference across all earnings levels is in
Honduras, where women have a net pension wealthabout 28% higher than that for men. The exceptions tothis trend are for women earning twice or three timesaverage earnings in Chile or El Salvador, where in bothcases the net pension wealth for women is slightlysmaller than that for men. This is because womenreceive a lower replacement rate than men as theyretire five years earlier and with the ceiling to contri-butions applying at these earnings levels the longerduration of retirement does not quite balance the pic-ture.
It is important to note that these calculationslook at the benefit side of the pension system only.The impact of taxes and contributions paid by peopleof working age on living standards during retirementrelative to when working work are discussed above inthe indicator of “Net pension replacement rates”.
Definition and measurement
Net pension wealth is the present value of theflow of pension benefits, taking account of the taxesand social security contributions that retirees have topay on their pensions. It is measured and expressedas a multiple of gross annual individual earnings inthe respective country. The reason for using grossearnings as the comparator is to isolate the effects oftaxes and contribution paid in retirement from thosepaid when working. This definition means that grossand net pension wealth is the same where people arenot liable for contributions and income taxes on theirpensions.
Taxes and contributions paid by pensioners arecalculated conditional on the mandatory pensionbenefit to which individuals at different levels of earn-ings. They calculations take account of all standardtax allowances and tax reliefs as well as concessionsgranted either to pension income or to people of pen-sion age.
Details of the rules that national tax systemsapply to pensioners can be found in country profiles.
Key results
Net pension wealth, like the equivalent indicator in gross terms, shows the present value of the lifetimeflow of pension benefits. But it also takes account of taxes and contribution paid on retirement incomes.Both figures for pension wealth are expressed as a multiple of individual gross earnings.
For average earners, net pension wealth for LAC countries averages 11.6 times gross individual earningsfor men and 13.3 for women. Values are higher for women than men, due mainly to differences in lifeexpectancy between the sexes.

NET PENSION WEALTH
PENSIONS AT A GLANCE: LATIN AMERICA AND THE CARIBBEAN © OECD, THE WORLD BANK AND IDB 2014 61
3.13. Net pension wealth by earnings
Multiple of individual annual gross earnings Multiple of individual annual gross earnings
0.5 1.0 2.0 3.0 0.5 1.0 2.0 3.0 0.5 1.0 2.0 3.0 0.5 1.0 2.0 3.0
Men Women Men Women
Argentina 13.2 11.4 10.3 9.4 16.6 14.2 12.9 11.8 Nicaragua 22.7 22.7 18.1 18.1 25.2 25.2 20.2 20.2
Bahamas 8.5 8.5 5.1 3.4 10.2 10.2 6.1 4.1 Panama 12.9 12.9 12.9 12.9 14.0 14.0 14.0 14.0
Barbados 10.0 10.0 8.4 5.6 12.6 12.6 10.6 7.0 Paraguay 18.5 18.5 18.0 17.7 20.0 19.9 19.4 19.1
Belize 13.3 13.3 11.2 7.4 14.9 14.9 12.4 8.3 Peru (DB) 12.0 11.0 5.5 3.7 13.4 12.3 6.2 4.1
Bolivia 8.5 9.2 7.6 7.1 9.5 10.3 8.6 8.0 Suriname 11.9 6.0 3.0 2.0 13.7 6.9 3.4 2.3
Brazil 15.7 16.3 17.5 14.7 18.2 18.9 20.3 17.0 Trinidad and Tobago 13.7 7.2 7.6 7.1 16.4 8.7 9.1 8.5
Chile 9.1 6.7 5.9 5.9 10.1 6.8 5.2 5.1 Uruguay 10.8 10.3 11.1 12.4 13.0 12.3 13.3 14.7
Colombia (DB) 11.8 8.2 8.2 8.2 14.9 9.3 9.3 9.3 Venezuela 23.4 16.0 12.3 11.0 28.2 19.0 14.4 12.8
Costa Rica 14.8 13.4 13.4 13.1 16.4 14.9 14.9 14.6 LAC26 13.3 11.6 10.3 9.5 15.4 13.3 11.7 10.7
Dominican Republic 4.2 4.2 4.2 4.2 4.6 4.6 4.6 4.6
Ecuador 23.2 23.2 23.2 23.2 25.6 25.6 25.6 25.6 OECD countries
El Salvador 15.3 7.7 4.8 4.8 18.8 9.4 4.7 4.5 Canada 12.5 7.1 3.6 2.4 14.2 8.1 4.1 2.7
Guatemala 14.5 14.5 14.5 14.5 16.4 16.4 16.4 16.4 France 10.1 8.4 6.1 5.3 11.5 9.5 7.0 6.0
Guyana 14.3 13.9 11.8 9.0 17.3 16.7 14.2 10.8 Germany 7.8 7.0 5.0 3.3 8.9 8.1 5.7 3.8
Haiti 7.0 7.0 7.0 6.8 7.7 7.7 7.7 7.5 Portugal 8.6 8.1 7.2 6.6 10.0 9.1 8.1 7.4
Honduras 12.6 12.6 12.6 12.6 16.1 16.1 16.1 16.1 Spain 12.2 11.1 8.1 5.4 13.9 12.5 9.2 6.1
Jamaica 15.7 11.2 9.0 6.7 17.4 12.4 9.9 7.4 United Kingdom 8.7 4.8 2.5 1.7 9.8 5.4 2.8 1.9
Mexico 9.4 4.8 4.5 4.4 10.3 5.2 4.5 4.4 United States 7.9 5.9 4.2 3.0 8.8 6.6 4.7 3.4
Source: OECD pension models.1 2 http://dx.doi.org/10.1787/888933161947
3.14. Gross versus net pension wealth by sex, average earner
Source: OECD pension models.1 2 http://dx.doi.org/10.1787/888933161529
20.0
17.5
15.0
12.5
10.0
7.5
5.0
2.52.5 5.0 7.5 10.0 12.5 15.0 17.5 20.0
20.0
17.5
15.0
12.5
10.0
7.5
5.0
2.52.5 5.0 7.5 10.0 12.5 15.0 17.5 20.0
ARG
BHS
BRB
BLZ
BOL
BRA
CAN
CHL
COL
CRI
DOM
SLV
FRA
DEU
GTMGUY
HTI
HND
JAM
MEX
PAN
PRY
PER
PRT
ESP
ARG
BHS
BRB
BLZ
BOL
BRA
CAN
CHL
COL
CRI
DOM
SLVFRA
DEU
GTMGUY
HTI
HND
JAM
MEX
PAN
PRY
PER
PRT
ESP
Net pension wealth (multiple of individual earnings)
Gross pension wealth (multiple of individual earnings)
Men
Net pension wealth (multiple of individual earnings)
Gross pension wealth (multiple of individual earnings)
Women

PENSIONS AT A GLANCE: LATIN AMERICA AND THE CARIBBEAN © OECD, THE WORLD BANK AND IDB 201462
PENSION-EARNINGS LINK
The charts show relative pension levels on thevertical axis and individual pre-retirement earningson the horizontal. A flat curve in the charts shows norelationship between pension and earnings, while alinear increasing function means the link is strong.
Countries have been grouped by the degree towhich pension benefits are related (or not) to individ-ual pre-retirement earnings.
Panel A shows just one country where there is nolink between pension entitlements and pre-retirementearnings. In Suriname there is a flat rate paymentbased on residency requirements rather than havingany direct link to the past career. Therefore the graphis flat and is the same across all the earnings levelswith no direct link.
At the other end of the spectrum for the LAC regionlie about 14 countries with a very strong link betweenpension entitlements and pre-retirement earnings(Panels D and E). In all of the countries contained inthese two charts there are no ceilings on pensionableearnings at twice the average. Therefore as the earningsincrease the future pension entitlement increases pro-portionally. The difference in gradients represents thedifference in accrual rate for each additional period ofcontribution in a defined-benefit scheme or the contri-bution for a defined-contribution scheme.
In some cases the lowest earners are entitled to aminimum pension but these tend to pass once earn-ings are slightly above the 50% of average level. In manyof these countries the upward trend would continue asthe earnings levels increase as again there is no ceilingthat would apply. This can be seen more in the grossreplacement rate indicator discussed previously.
Perhaps the most interesting group of countriesare covered in Panel B and Panel C. The countries havebeen split into two distinct groups depending on thestructure of the pension system in place.
Panel B generally includes those countries thathave a reasonably high level of minimum pension butthereafter there is a clear link between earnings andfuture pension entitlement. For example in El Salvadorthe minimum pension is at such a level relative toaverage earnings that those earning up to about 160%of the average are still entitled. After this level of earn-ings then the pension increases proportionally to theearnings level as the pension is defined contributionwith a ceiling well above twice the average. At theother end of the spectrum in Colombia the minimumpension would be paid to those up to about 70% ofaverage earnings under a defined-benefit approach.Above this earnings level there is a standard defined-benefit formula with additional accrual increases foreach year of contribution.
The remaining countries in Panel C follow thereverse pattern to those included in Panel B. In thissense there is a clear link to earnings at the lower endof the pay scale but then there is a ceiling to contribu-tions or there is a maximum pension in place. Thevalue of this maximum pension in relation to earn-ings level clearly affects the point at which the graphflattens. More countries would be included here if weexpanded the earnings level beyond two times theaverage as discussed above. In both Barbados andBelize the ceiling comes into effect at approximately170% of average earnings whereas in the Bahamas it isat 120% of average earnings and at only 90% of averagefor Peru.
Key results
In some countries, such as Ecuador, Panama and Paraguay, there is a very strong link between pensionentitlements and pre-retirement earnings. In contrast, flat-rate benefits in Suriname mean that there is nolink between pension and earnings.

PENSION-EARNINGS LINK
PENSIONS AT A GLANCE: LATIN AMERICA AND THE CARIBBEAN © OECD, THE WORLD BANK AND IDB 2014 63
3.15. The link between pre-retirement earnings and pension entitlementsGross pension entitlements as a proportion of economy-wide average earnings
Source: OECD pension models.1 2 http://dx.doi.org/10.1787/888933161539
0 0
0 000
2.00
1.75
1.50
1.25
1.00
0.75
0.50
0.25
0
2.00
1.75
1.50
1.25
1.00
0.75
0.50
0.25
2.00
1.75
1.50
1.25
1.00
0.75
0.50
0.25
2.00
1.75
1.50
1.25
1.00
0.75
0.50
0.25
2.00
1.75
1.50
1.25
1.00
0.75
0.50
0.25
0 0.25 0.50 0.75 1.00 1.25 1.50 1.75 2.00
0.25 0.50 0.75 1.00 1.25 1.50 1.75 2.00 0.25 0.50 0.75 1.00 1.25 1.50 1.75 2.00
00 0.25 0.50 0.75 1.00 1.25 1.50 1.75 2.00 0.25 0.50 0.75 1.00 1.25 1.50 1.75 2.00
Suriname
UruguayTrinidad and Tobago
El Salvador Mexico
ColombiaBolivia Chile
PeruBelize
Bahamas Barbados
Paraguay Venezuela
Panama Honduras
NicaraguaEcuador Guatemala
Jamaica
Dominican Republic Guyana
Haiti
Costa RicaArgentina Brazil
Panel E
Panel DPanel C
Panel BPanel A

PENSIONS AT A GLANCE: LATIN AMERICA AND THE CARIBBEAN © OECD, THE WORLD BANK AND IDB 201464
WEIGHTED AVERAGES: PENSION LEVELS AND PENSION WEALTH
The weighted average relative pension level com-bines data on the distribution of earnings with calcu-lations of pension entitlements. This aggregatemeasure is then expressed as a percentage of econ-omy-wide average (mean) earnings. Replacementrates are generally higher for low earners and viceversa. But there are many more low earners thanthere are high earners.
The results are shown in the first and second col-umns of the table for men and women respectively. Atthe top of the range, the weighted average pensionlevel is above 90% in Ecuador, Nicaragua, Paraguay andVenezuela. In another three countries – Argentina,Costa Rica and Panama – the weighted average pen-sion level is above 80% of the average earnings. At theother end of the scale, in four LAC countries (theDominican Republic, Haiti, Mexico and Suriname) theweighted average pension level is less than 40% ofaverage earnings.
The same type of weighting procedure can alsobe applied to the pension wealth measure. Pensionwealth is the most comprehensive measure of thescale of the pension promise made to today’s workers,as it allows for differences between countries in pen-sion ages, life expectancy and indexation policies.Weighted average pension wealth is expressed as amultiple of economy-wide average earnings.
The results are shown in the third and fourth col-umns of the table. Values well above the average forweighted average pension wealth, between 18.2and 23.2 for men and 20.0 and 25.6 of average earningsfor women, are found in Ecuador, Nicaragua, Paraguayand Venezuela. Argentina, Belize, Colombia, CostaRica, Guyana, Honduras, Panama and Uruguay areclosely clustered with values of this indicator of
around 12 to 14 times average earnings for men andaround 14 to 17 times average earnings for women.
When converted to United States dollars (at mar-ket exchange rates) the average pension promiseamount to USD 80 000 for men and USD 93 000 forwomen (fifth and sixth column of the table). Thesenumbers represent the present value of the transfersthat societies are promising on average to future retir-ees under the current pension system rules.
In the Bahamas and Venezuela the average pen-sion wealth is very high while at the other end of thespectrum, in the Dominican Republic pension wealthis well below the average for LAC, at 4.2 times averageearnings for men and 4.6 times average earnings forwomen. Pension wealth is also relatively low in coun-tries with shorter life expectancy such as Haiti andSuriname.
Definition and measurement
The indicators build on the calculations of pen-sion entitlements (pension levels and pension wealth)for people earning between 0.3 and 3 times the econ-omy-wide average.
Each level of individual earnings is given a weightbased on its importance in the distribution of earn-ings. The calculations use national data. The earningsdistribution is skewed in all countries. The mode (orpeak) of the distribution and the median (the earningslevel both below and above which half of employeesare situated) are significantly less than the mean.Thus, there are many people with low earnings, andfewer with high earnings, so low earners are given alarger weight in the calculation of the indicator thanhigh earners.
Key results
The indicators so far have shown replacement rates, relative pension levels and pension wealth forpeople at different levels of earnings. By taking a weighted average of these indicators over the earningsrange, the measures presented here show the average for the pension level at the time of retirement andpension wealth, the lifetime value of pension payments.
The first of these is designed to show the level of the average retirement income, taking account of thedifferent treatment of workers with different incomes. The average pension level is 64.1% of economy-wideaverage earnings for men and 62.2% for women across the LAC26 countries.
The second aims to summarise the total cost of providing old-age incomes. Weighted average pensionwealth is an average of 12.2 times annual economy-wide average earnings for men and 14.0 for women.

WEIGHTED AVERAGES: PENSION LEVELS AND PENSION WEALTH
PENSIONS AT A GLANCE: LATIN AMERICA AND THE CARIBBEAN © OECD, THE WORLD BANK AND IDB 2014 65
3.16. Weighted averages: Pension levels and pension wealthPercentage of economy-wide average earnings
Weighted average pension level Weighted average pension wealth Average pension wealth (USD)
Men Women Men Women Men Women
Argentina 81.0 73.3 12.0 15.0 162 000 203 000Bahamas 50.3 50.3 7.9 9.5 173 000 208 000Barbados 58.7 58.7 9.7 12.2 135 000 170 000Belize 67.5 67.5 12.9 14.4 57 000 64 000Bolivia 40.9 40.9 9.4 10.5 17 000 19 000Brazil 62.2 56.7 16.3 18.9 162 000 188 000Chile 46.7 35.6 7.7 7.9 91 000 93 000Colombia 77.1 71.6 12.9 15.3 81 000 96 000Costa Rica 83.8 83.8 13.4 15.0 103 000 115 000Dominican Republic 24.0 24.0 4.2 4.6 21 000 23 000Ecuador 99.1 99.1 23.2 25.6 102 000 112 000El Salvador 49.0 47.3 10.1 12.2 4 000 5 000Guatemala 71.4 71.4 14.5 16.4 40 000 45 000Guyana 68.4 68.4 13.8 16.6 40 000 48 000Haiti 31.4 31.4 7.0 7.7 5 000 5 000Honduras 68.4 64.1 12.6 16.1 40 000 51 000Jamaica 73.7 73.7 11.9 13.1 60 000 66 000Mexico 39.5 37.2 5.8 6.1 40 000 42 000Nicaragua 91.5 91.5 21.7 24.2 31 000 35 000Panama 82.6 76.7 13.8 15.0 105 000 114 000Paraguay 109.6 109.6 18.5 20.0 74 000 80 000Peru 61.2 61.2 10.3 11.5 54 000 60 000Suriname 29.7 29.7 7.2 8.3 56 000 65 000Trinidad and Tobago 42.7 42.7 9.0 10.7 103 000 122 000Uruguay 59.5 59.5 12.5 14.9 143 000 170 000Venezuela 96.9 91.9 18.2 21.7 181 000 216 000LAC26 64.1 62.2 12.2 14.0 80 000 93 000OECD countriesCanada 42.9 42.9 7.3 8.3 328 000 373 000France 45.8 45.8 9.0 10.2 409 000 463 000Germany 43.8 43.8 8.3 9.5 472 000 540 000Portugal 59.1 59.1 7.9 9.0 184 000 209 000Spain 69.9 69.9 12.6 14.2 419 000 472 000United Kingdom 31.1 31.1 5.4 6.1 289 000 327 000United States 38.3 38.3 6.3 7.1 288 000 324 000
Source: OECD pension models. 1 2 http://dx.doi.org/10.1787/888933161957
3.17. Weighted averages compared: Pension levels versus pension wealth by sex
Source: OECD pension models. 1 2 http://dx.doi.org/10.1787/888933161548
25
22
10
15
5
02.5 3.5 4.5 5.5 6.5 7.5 8.5 9.5
30
25
20
15
10
5
02.5 3.5 4.5 5.5 6.5 7.5 8.5 9.5
CANCHL
FRADEU
MXN
PRT
ESP
GBR
USA
ARG
BRA
BHS
BRB
BLZ
BOL
COL
CRI
ECU
SLV
GTMGUY
HTI
HND
JAM
NIC
PAN
PERSUR
TTO
URY
VEN
LAC26
CAN CHL
FRA
DEU
MXN
PRT
ESP
GBR
USA
ARG
BRA
BHSBRB
BLZ
BOL
COL CRI
SLV
GTMGUY
HTI
HNDJAM
PAN
PER
SUR
TTOURY
VEN
LAC26
ECU
NIC
Weighted average pension wealth (WAPW)
Weighted average pension level (WAPL)
Men
Weighted average pension wealth (WAPW)
Weighted average pension level (WAPL)
Women

PENSIONS AT A GLANCE: LATIN AMERICA AND THE CARIBBEAN © OECD, THE WORLD BANK AND IDB 201466
RETIREMENT-INCOME PACKAGE
Starting with the first tier, it is important to notethat the calculations cover full-career workers only.All of the first-tier programmes will be much moreimportant for people with incomplete contributionhistories. But it is hard to obtain information on thedistribution of past contribution histories let alonepredict them into the future.
There are basic schemes in five LAC countries.The value of these benefits does not depend on indi-vidual earnings or other pension entitlements. Man-datory pensions for full-career workers in Surinameare entirely from a basic scheme. In Bolivia andJamaica basic pensions contribute 43-44% of the totalpension promise. The levels in Argentina and Mexicoare slightly lower at 17% and 12% respectively.
For full career workers there is a minimum pen-sion in only one LAC country, Mexico, accounting for15% of the total pension. Most LAC countries have asafety-net for low-income pensioners. But in most ofthem, full-career workers, even those with low earn-ings, will not be eligible. There is one exception, Chile,providing 17% of the pension promise.
The balance between first- and second-tierschemes in the retirement-income package is shownin the top chart. The second tier accounts for 82% ormore in all but five LAC countries. In many cases, thisreflects high target replacement rates in the secondtier. In others, the benefit formula of the publicscheme is progressive: redistribution done by the firsttier in other countries is carried out by second-tierplans.
Second-tier schemes
The second tier of mandatory benefits is dividedin the table between public and private providers andbetween defined-contribution (DC) and defined-bene-fit (DB) or earnings-related provision. There are public,earnings-related schemes in 23 LAC countries. Theexceptions are Chile and Mexico which have privatedefined-contribution schemes and Suriname whichonly has a basic scheme. For the 23 countries theyprovide all of the benefits for full-career workers in 18of the countries, with the exceptions being Argentina,Bolivia, Costa Rica, Jamaica and Uruguay.
Six countries – Chile, Costa Rica, Dominican Republic,El Salvador, Mexico and Uruguay – mandate participa-tion in privately managed, defined-contributionschemes. In addition, a significant share of workers inColombia and Peru exercise the option to contribute toprivately managed, DC schemes, although they havethe option to choose a public, DB scheme. The propor-tion of the benefits generated by the DC component ofthe system varies widely. For example, in Chile andMexico, the simulation shows that 83 and 72% of thepension is generated by the DC component while thesame figure for Costa Rica and Uruguay is 19 and 3%,respectively.
Definition and measurement
The structure of the pension package is illustratedusing the indicator of weighted average pension wealthpresented above, divided into different components.The weights derive from earnings-distribution data.
Key results
The retirement-income package is divided into different components. The first is a redistributive part,designed to ensure pensioners achieve an absolute minimum standard of living. A savings part forms thesecond, with the aim of achieving a target income in retirement compared with earnings when working.This indicator, showing the division of national pension systems between these tiers and between publicand private provision, again demonstrates substantial differences in national policies.

RETIREMENT-INCOME PACKAGE
PENSIONS AT A GLANCE: LATIN AMERICA AND THE CARIBBEAN © OECD, THE WORLD BANK AND IDB 2014 67
3.18. Structure of the retirement-income packagePercentage contribution of mandatory components of the pension system to weighted average pension wealth
First tier Second tier
Total
First tier Second tier
TotalResource-tested
Basic MinimumPublic
ERPublic
DCPrivate
DBPrivate
DCResource-tested
Basic MinimumPublic
ERPublic
DCPrivate
DBPrivate
DC
Argentina 17.4 82.6 100.0 Nicaragua 100.0 100.0
Bahamas 100.0 100.0 Panama 100.0 100.0
Barbados 100.0 100.0 Paraguay 100.0 100.0
Belize 100.0 100.0 Peru 100.0 100.0
Bolivia 43.2 56.8 100.0 Suriname 100.0 100.0
Brazil 100.0 100.0 Trinidad and Tobago 100.0 100.0
Chile 17.1 82.9 100.0 Uruguay 97.4 2.6 100.0
Colombia 100.0 100.0 Venezuela 100.0 100.0
Costa Rica 80.7 19.3 100.0
Dominican Republic 100.0 100.0 OECD countries
Ecuador 100.0 100.0 Canada 15.8 32.9 51.3 100.0
El Salvador 100.0 100.0 France 100.0 100.0
Guatemala 100.0 100.0 Germany 100.0 100.0
Guyana 100.0 100.0 Portugal 0.7 99.3 100.0
Haiti 100.0 100.0 Spain 100.0 100.0
Honduras 100.0 100.0 United Kingdom 1.7 47.5 38.3 12.5 100.0
Jamaica 43.8 56.2 100.0 United States 100.0 100.0
Mexico 12.3 15.3 72.4 100.0
DB = defined benefit; DC = defined contribution; ER = earnings related.Source: OECD pension models.
1 2 http://dx.doi.org/10.1787/888933161969
3.19. Balance between first-tier, redistributive programmes and mandatory,second-tier, income-replacement schemes
Percentage of weighted average pension wealth
Source: OECD pension models.1 2 http://dx.doi.org/10.1787/888933161554
100
90
80
70
60
50
40
30
20
10
0
FRA
DEU ESP
USABHS
BLZCOL
DOMEC
USLV
GTMGUY
HTI NICPAN
PRYTTO VEN CRI
BRBHND
URYPER PRT
CHLARG
MEXBOL
JAM
CANGBR
BRASUR
Second-tier First-tier

Pensions at a Glance
Latin America and the Caribbean
© OECD, The World Bank and IDB 2014
69
Chapter 4
Pensions at a Glance/Latin Americaand the Carribean – Country profiles
Chapter 4 of Pensions at a Glance: Latin American and the Caribbean presentsprofiles of national pension systems. Each country profile summarises thearchitecture of national schemes and provides key indicators on demographics,public pension spending and average earnings. It then goes on to provide thedetailed parameters and rules of the pension system in 2010, explain the calculationof pension entitlements and show the main results. First though, there is a briefguide to the contents of the national profiles.

4. PENSIONS AT A GLANCE/LATIN AMERICA AND THE CARRIBEAN – COUNTRY PROFILES – GUIDE TO THE COUNTRY PROFILES
PENSIONS AT A GLANCE: LATIN AMERICA AND THE CARIBBEAN © OECD, THE WORLD BANK AND IDB 201470
Guide to the country profiles
The country profiles use a common framework. First, there is a brief summary of the
national retirement-income system and a table of key indicators. This background table
comprises average earnings, public pension expenditures, life expectancy and the
dependency ratio (the number of pensioners for every 100 workers). Data both for the
country in question and the average for the OECD as a whole are presented.
Secondly, there is a detailed description of the rules and parameters of the pension
schemes that make up each country’s retirement-income system. These are structured as
follows.
● Qualifying conditions: Pension eligibility (or “retirement”) age and years of contributions
required to receive a pension.
● Benefit calculation: The rules for each schemes making up the pension system, such as
basic, resource-tested and minimum pensions as well as public, earnings-related and
mandatory private plans.
● Variant careers for early and late retirement.
● Personal income tax and social security contributions.
● Earnings valorisation.
● Social assistance programmes for old-age population.
The treatment of pensioners under the personal income tax and social security
contributions, for reasons of space, is not described in this edition (for all OECD countries,
taxes and social security contributions paid by workers are those in force in the year 2010).
However, the on-line version of the country profiles, available at www.oecd.org/els/social/
pensions/PAG, does include this information. For details on the taxes and social security
contributions paid by workers, see OECD (2013), Taxing Wages.
Values of all pension parameters and other relevant figures such as minimum wages
are given in national currencies and as a proportion of average earnings.
In each country profile, a table gives expected relative pension values, replacement
rates and pension wealth at different individual levels of earnings for mandatory pension
schemes. (See Chapter 3 of this report for definition and measurement of the different
indicators.) These are given in both gross and net terms (the latter taking account of taxes
and contributions paid when working and when drawing the pension).

4. PENSIONS AT A GLANCE/LATIN AMERICA AND THE CARRIBEAN – COUNTRY PROFILES – GUIDE TO THE COUNTRY PROFILES
PENSIONS AT A GLANCE: LATIN AMERICA AND THE CARIBBEAN © OECD, THE WORLD BANK AND IDB 2014 71
Summary charts show the breakdown of the gross relative pension value into the
different components of the pension scheme (the first row of the charts). As far as possible,
the same, terminology is used to describe these schemes. The particular national scheme
that is described can be found in the text of the country study. Some standard
abbreviations are used in the legends of the charts:
● SA: Social assistance;
● Targeted: Separate resource-tested schemes for older people;
● Minimum: A minimum pension within an earnings related scheme;
● Basic: A pension based only on number of years of coverage or residency;
● Earnings-related: All public earnings-related programmes, including notional accounts
and points schemes as well as traditional defined-benefit plans;
● DC: Defined-contribution, mandatory private plans;
● Occupational: Mandatory or quasi-mandatory pensions, which can be provided by
employers, industry-wide schemes, profession-based schemes or publicly.
The second row of country charts shows the effect of personal income taxes and social
security contributions on relative pension values and replacement rates, giving the gross
and net values.
The charts use a standard scale to ease comparisons between countries: the scale for
replacement rates runs to 125% while that for relative pension values runs to 2.5 times
average earnings. The charts show pension entitlements for people earning between 50%
and 200% of economy-wide average earnings.

4. PENSIONS AT A GLANCE/LATIN AMERICA AND THE CARRIBEAN – COUNTRY PROFILES – ARGENTINA
PENSIONS AT A GLANCE: LATIN AMERICA AND THE CARIBBEAN © OECD, THE WORLD BANK AND IDB 201472
Argentina
Argentina: Pension system in 2010
The pension system has twocomponents: a basic component and anadditional social insurance component.For those aged 70 and above there is alsoan age-re lated socia l insurancecomponent and a social assistancecomponent.
Key indicators
Argentina LAC26
Average earnings ARS 53 600 27 700
USD 13 500 7 000
Public pension spending % of GDP 6.4 3.1
Life expectancy At birth 76.2 73.6
At age 65 17.4 17.4
Population over age 65 % of working-age population 19.2 12.3
Qualifying conditionsRetirement age for the basic pension is 65 for men and 60 for women with at least
30 years of service. To meet the contribution qualifying condition, the insured may
substitute two years of age after the retirement age for one year of contributions.
Additional pension (social insurance): Age 65 (men) or age 60 (women) with at least
30 years of service.
Advanced old-age pension (social insurance): Aged 70 or older with at least ten years
of service, with contributions paid while employed or self-employed, including at least five
of the last eight years before leaving employment. A self-employed person must have been
insured for at least five years.
Benefit calculation
Old-age pension (Basic Pension – PBU)
The amount of the monthly pension is ARS 494.38.
Additional pension (social insurance)
The monthly additional pension is equal to 1.5% of the insured’s average adjusted
monthly earnings (weighted average of the monthly amounts for self-employed workers)
for each year of service. It is adjusted using an index equal to the estimated mobility
granted to the benefits in effect.
The maximum monthly earnings for calculating the pension is ARS 11 829.21.
The monthly pension for the elderly is equivalent to 70% of the basic pension and the
additional service benefit. The minimal old-age pension for the elderly is ARS 1 046.63 and
ARS 1 091.50 for dependents of the National Institute of Social Services. The maximum
monthly old-age pension (the sum of the basic pension and the social assistance pension)
is ARS 7 666.38. Pensions are paid monthly with a 13th and 14th payment equal to half of a
regular monthly payment paid in June and December.
Benefits are adjusted every March and September according to changes in the affected
tax collection, specifically social insurance and the INDEC or RIPTE salary index of the SSS.

4. PENSIONS AT A GLANCE/LATIN AMERICA AND THE CARRIBEAN – COUNTRY PROFILES – ARGENTINA
PENSIONS AT A GLANCE: LATIN AMERICA AND THE CARIBBEAN © OECD, THE WORLD BANK AND IDB 2014 73
Variant careers
Early retirement
Early retirement is not possible under the general regime.
Late retirement
There is no limit to delaying the retirement age (the employer has the right to require
an employee to retire), nor is there any advantage to delaying the pension. In any case, for
every year beyond the 30 years of contributions (up to a maximum of 35 years of
contributions), 1.5% of the base income will be recognised. For each year above the
minimum age of benefit withdrawal, one year of service can be substituted for every two
years over the minimum age.
Personal income tax and social security contributions
Taxation of workers
Individual income tax rate ranges from 9% to 35% with seven income brackets.
Social security contributions paid by workers
Employee contributions equal 17%, out of which 11% is mandatory payment to the
Argentine Integrated Social Insurance System (SIPA), 3% is a mandatory payment for social
programmes and a mandatory 3% for the National Institute of Social Services for Retirees
and Pensioners.
Employers contribute 23%, of which 10.17% are for benefits granted by SIPA and the
remaining 12.83% is divided between the Sub-system of Family Allocations (4.44%), the
National Employment Fund (0.89%), the National Institute of Social Services for Retirees
and Pensioners (INSSJP) (1.5%), and other social programmes (6%).
Taxation of pension income
Pension income is taxed as income from work except where the pension is due to the
death or disability of the insured.
Social security contributions paid by pensioners
Inactive pensioners contribute between 3% up to the value of the minimum payment
and 6% over the amount exceeding that amount, depending on the amount of the payment
to old-age social programmes. Working pensioners contribute 11% to the national
employment fund.
Amount %
Up to ARS 10 800.00 0
From ARS 10 800.01 to ARS 20 800.00 9
From ARS 20 800.01 to ARS 30 800.00 14
From ARS 30 800.01 to ARS 40 800.00 19
From ARS 40 800.01 to ARS 70 800.00 23
From ARS 70 800.01 to ARS 100 800.00 27
From ARS 100 800.00 to ARS 130 800.00 31
From ARS 130 800.00 and above 35

4. PENSIONS AT A GLANCE/LATIN AMERICA AND THE CARRIBEAN – COUNTRY PROFILES – ARGENTINA
PENSIONS AT A GLANCE: LATIN AMERICA AND THE CARIBBEAN © OECD, THE WORLD BANK AND IDB 201474
Earnings valorisationThe adjustment to past contributions is made using an updating index. This index is
equal to the projected mobility granted to the existing benefits. The formula that
determines the projected mobility is:
The components of the formula are:
Where:
“m” is the mobility of the period, which is a function defined by tax bracket.
“a” is the bracket of the mobility function prior to the application of the limit.
“RT” is the variation in tax resources per benefit (net of eventual contributions of the
National Treasury to cover deficits of the National Social Security Administration)
developed by the organisation. It compares identical semesters in consecutive years.
“w” is the variation of the general salary index published by the National Institute of
Statistics and Census or the variation of the Average Taxable Payments of Permanent
Workers (RIPTE) index, published by the Social Security Secretariat, whichever is greater. In
both cases, consecutive semesters are compared.
“b” is the bracket of the mobility function that serves as an eventual limit.
“r” is the variation in total resources per benefit of ANSES (net of eventual contributions
of the National Treasury to cover deficits of ANSES). It compares consecutive 12-month
periods.
Social assistance programmes for old-age population
Moratorium
Self-employed workers who meet the age requirements for any of the benefits can
sign up for the voluntary scheme in order to complete the required number of years of
service with the remaining contributions. The regularisation scheme of debts is aimed at
self-employed workers, whether or not they are registered in this scheme, for their
contributions accrued up to September 1993. A moratorium exists for contributions
debited before September 1993.
Social welfare pension (social assistance)
There is an Advanced Old-age pension (established in 2003) for women and men
over 70 without fixed incomes sufficient for their subsistence. In order to receive this
benefit, one must be a native or naturalised Argentine citizen residing in the country, a
foreigner with a minimum of 20 years of continual residence in the country, not be
receiving any other retirement or pension benefits, not have any relatives legally required
to provide food, and not have goods, income, or resources that would enable them to
subsist. The state provides a life-long pension equal to 70% of the minimum pension, or
ARS 732.64/month in 2010. This benefit is incompatible with the receipt of any retirement
or pension whether from the national, provincial or municipal civil service or the military.
Additionally, pensioners with dependents will receive a family allowance.
m =A RT w if a b
B if a b
0 5 0 5
1 03 4
. .
.

4. PENSIONS AT A GLANCE/LATIN AMERICA AND THE CARRIBEAN – COUNTRY PROFILES – ARGENTINA
PENSIONS AT A GLANCE: LATIN AMERICA AND THE CARIBBEAN © OECD, THE WORLD BANK AND IDB 2014 75
Additional programmes
The aim of PAMI Geriatric Care is to provide institutional, integrated and personal
assistance, either temporary or permanent, to insured persons over age 65, dependent or
semi-dependent and/or with extreme psychological or physical deterioration that require
intensive, specialised personal assistance that cannot be provided by the family or who
have no other benefit options.

4. PENSIONS AT A GLANCE/LATIN AMERICA AND THE CARRIBEAN – COUNTRY PROFILES – ARGENTINA
PENSIONS AT A GLANCE: LATIN AMERICA AND THE CARIBBEAN © OECD, THE WORLD BANK AND IDB 201476
Pension modelling results: Argentina
MenMedian earner
Individual earnings, multiple of average
Women (where different) 0.5 0.75 1.0 1.5 2.0
Gross relative pension level 65.1 44.8 61.1 77.5 110.3 143.1
(% average gross earnings) 59.2 41.1 55.7 70.3 99.4 128.5
Net relative pension level 76.1 52.3 71.5 90.6 128.9 163.9
(% net average earnings) 69.2 48.1 65.1 82.1 116.1 148.9
Gross replacement rate 80.3 89.5 81.5 77.5 73.5 71.5
(% individual gross earnings) 73.1 82.2 74.2 70.3 66.3 64.3
Net replacement rate 93.9 104.6 95.3 90.6 88.6 89.6
(% individual net earnings) 85.4 96.1 86.8 82.1 79.8 81.4
Gross pension wealth 12.2 13.6 12.4 11.8 11.1 10.8
(multiple of individual gross earnings) 15.2 17.1 15.5 14.6 13.8 13.4
Net pension wealth 11.8 13.2 12.0 11.4 10.8 10.3
(multiple of individual gross earnings) 14.8 16.6 15.0 14.2 13.4 12.9
1 2 http://dx.doi.org/10.1787/888933161569
0 0.25 0.50 0.75 1.00 1.25 1.50 1.75 2.00 0 0.25 0.50 0.75 1.00 1.25 1.50 1.75 2.00
0 0.25 0.50 0.75 1.00 1.25 1.50 1.75 2.00 0 0.25 0.50 0.75 1.00 1.25 1.50 1.75 2.00
2.5
2.0
1.5
1.0
0.5
0
2.5
2.0
1.5
1.0
0.5
0
1.25
1.00
0.75
0.50
0.25
0
1.25
1.00
0.75
0.50
0.25
0
Gross relative pension level Gross replacement rate
Net and gross relative pension levels Net and gross replacement rates
Individual earnings, proportion of average earnings Individual earnings, proportion of average earnings
Proportion of economy-wide average earnings Proportion of individual earnings
Proportion of economy-wide average earnings Proportion of individual earnings
Individual earnings, proportion of average earnings Individual earnings, proportion of average earnings
GrossNet
BasicSupplement

4. PENSIONS AT A GLANCE/LATIN AMERICA AND THE CARRIBEAN – COUNTRY PROFILES – BAHAMAS
PENSIONS AT A GLANCE: LATIN AMERICA AND THE CARIBBEAN © OECD, THE WORLD BANK AND IDB 2014 77
Bahamas
Bahamas: Pension system in 2010
The pension system consists of anearnings-related component and anold-age grant for those with some butinsufficient contributions. For those withinadequate income there is a non-contributory pension.
Key indicators
Bahamas LAC26
Average earnings BSD 21 900 7 000
USD 21 900 7 000
Public pension spending % of GDP 2.4 3.1
Life expectancy At birth 75.1 73.6
At age 65 18.3 17.4
Population over age 65 % of working-age population 11.9 12.3
Qualifying conditionsRetirement age is 65 with at least 500 weeks of contributions.
Early retirement is possible from age 60 to 64. An insured person under age 65 cannot
receive an old-age benefit if the earnings level is more than half the weekly wage ceiling.
Benefit calculation
Old-age pension
The pension benefit is equal to 30% of the covered wage with at least 500 weeks of
contributions. The pension increases by 1% of the covered wage for each 50-week period of
credited contributions exceeding 500 weeks, up to 60%.
The covered wage is equal to the best five average weekly earnings in the previous ten
years prior to retirement. The minimum pension is equal to BSD 64.33 a week.
If an insured person has between 150 and 499 paid contributions, he or she is eligible
to receive a pension benefit at the age of 65. The benefit is a function of the insured’s
average insurable wage and the number of contributions made.
Grant = 6 × number of complete sets of 50 contributions × Average weekly insurable
wage
Benefits are increased in July and indexed with the increase in the Retail Price Index in
the previous two calendar years.
Non-contributory old-age pension
Bahamian residents aged 65 years or older or who do not meet the contribution
conditions for Retirement Benefit can receive a non-contributory old-age pension. The
benefit is equal to BSD 59.18 a week.
Variant careers
Early retirement
Early retirement is possible and the benefit is reduced by 0.58% for each month the
insured age is under the age of 65.

4. PENSIONS AT A GLANCE/LATIN AMERICA AND THE CARRIBEAN – COUNTRY PROFILES – BAHAMAS
PENSIONS AT A GLANCE: LATIN AMERICA AND THE CARIBBEAN © OECD, THE WORLD BANK AND IDB 201478
Late retirement
Pension deferral is possible at any age over 65. The benefit is increased by 0.58% for
each month the insured age is above 65 up to a maximum of 35%.
Personal income tax and social security contributions
Taxation of workers
Work income is not taxed.
Social security contributions paid by workers
Workers contribute 3.9% of their covered earnings and employers contribute 5.9% of
covered earnings. Self-employed persons contribute 8.8% of covered earnings. Voluntarily
insured persons contribute 5% of weekly average wages or income, based on the insured’s
wages or income of the year before registration. The contribution ceiling increases in July
and is connected to the change in the Retail Price Index in the two previous calendar years
plus 2%.
All of the pension benefits are paid from a single fund. However, 2.45% is allocated to
short-term benefits for sickness, maternity, unemployment or funeral expenses and
0.735% to industrial benefits with the remainder to pensions. The amounts transferred to
short-term benefits and injury benefits are designed to be pay-as-you-go rates. The portion
going to long-term benefits is simply the remainder.
The maximum annual earnings for contribution calculation purposes is BSD 31 200.
The insured person’s mandatory contributions also finance cash sickness, maternity,
unemployment and work injury benefits.
The contributions of the voluntarily insured finance old-age and invalidity and
survivor pensions, as well as funeral and maternity grants.
Taxation of pensioners
Pensions are not taxed.
Social security contributions paid by pensioners
If a pensioner is working and is between 60 and 64 years old he/she contributes 3.9%
of covered earnings: If the pensioner is still working and 65 years or older they contribute
2% of covered earnings for work injury benefits only. No contributions are paid if the
pensioner is not working.

4. PENSIONS AT A GLANCE/LATIN AMERICA AND THE CARRIBEAN – COUNTRY PROFILES – BAHAMAS
PENSIONS AT A GLANCE: LATIN AMERICA AND THE CARIBBEAN © OECD, THE WORLD BANK AND IDB 2014 79
Pension modelling results: Bahamas
MenMedian earner
Individual earnings, multiple of average
Women (where different) 0.5 0.75 1.0 1.5 2.0
Gross relative pension level 45.8 28.2 42.4 56.5 67.1 67.1
(% average gross earnings)
Net relative pension level 47.6 29.4 44.1 58.8 69.9 69.9
(% net average earnings)
Gross replacement rate 56.5 56.5 56.5 56.5 44.8 33.6
(% individual gross earnings)
Net replacement rate 58.8 58.8 58.8 58.8 46.5 34.5
(% individual net earnings)
Gross pension wealth 8.5 8.5 8.5 8.5 6.8 5.1
(multiple of individual gross earnings) 10.2 10.2 10.2 10.2 8.1 6.1
Net pension wealth 8.5 8.5 8.5 8.5 6.8 5.1
(multiple of individual gross earnings) 10.2 10.2 10.2 10.2 8.1 6.1
1 2 http://dx.doi.org/10.1787/888933161572
0 0.25 0.50 0.75 1.00 1.25 1.50 1.75 2.00 0 0.25 0.50 0.75 1.00 1.25 1.50 1.75 2.00
0 0.25 0.50 0.75 1.00 1.25 1.50 1.75 2.00 0 0.25 0.50 0.75 1.00 1.25 1.50 1.75 2.00
2.5
2.0
1.5
1.0
0.5
0
2.5
2.0
1.5
1.0
0.5
0
1.25
1.00
0.75
0.50
0.25
0
1.25
1.00
0.75
0.50
0.25
0
Gross relative pension level Gross replacement rate
Net and gross relative pension levels Net and gross replacement rates
Individual earnings, proportion of average earnings Individual earnings, proportion of average earnings
Proportion of economy-wide average earnings Proportion of individual earnings
Proportion of economy-wide average earnings Proportion of individual earnings
Individual earnings, proportion of average earnings Individual earnings, proportion of average earnings
GrossNet
Earnings-related

4. PENSIONS AT A GLANCE/LATIN AMERICA AND THE CARRIBEAN – COUNTRY PROFILES – BARBADOS
PENSIONS AT A GLANCE: LATIN AMERICA AND THE CARIBBEAN © OECD, THE WORLD BANK AND IDB 201480
Barbados
Barbados: Pension system in 2010
The pension system consists of anearnings-re lated def ined-benef i tcomponent and an old-age grant. Forthose with inadequate income there is anon-contributory pension.
Key indicators
Barbados LAC26
Average earnings BBD 27 800 13 900
USD 13 900 7 000
Public pension spending % of GDP 3.0 3.1
Life expectancy At birth 75.3 73.6
At age 65 15.6 17.4
Population over age 65 % of working-age population 16.7 12.3
Qualifying conditionsIn 2010 the retirement age was 66 years for both men and women with at least
500 weeks of contributions, including at least 150 weeks of paid contributions.
An early pension is possible from age 60 if the insured person is no longer employed.
Late retirement is possible and deferred pension benefit can be withdrawn up to the age
of 70.
A retirement benefit (Old Age Contributory Grant) is paid from age 66 with at least 50
but not more than 499 contributions.
Pensionable ages in Barbados will be rise to 67 as of January 2018.
Benefit calculation
Old-age pension
The pension is 2% of average annual earnings for the first 20 years of contributions.
Each year thereafter adds 1.25% of the average annual earnings.
The average earnings are calculated as the best five years nominal earnings divided
by five. If the number of years worked is less than 15 years, the average is based on total
earnings.
The maximum earnings level for benefit calculation purposes is BBD 900 a week for
employees paid weekly or BBD 3 900 a month for employees paid monthly.
The minimum weekly pension is BBD 155.
The maximum pension is equal to 60% of average insurable earnings.
Prior to 1 January 2006 65 years
1 January 2006 to 31 December 2009 65.5 years
1 January 2010 to 31 December 2013 66 years
1 January 2014 to 31 December 2017 66.5 years
1 January 2018 and after 67 years1
1. The NIS retirement age is flexible so persons may retire at any age from 60to 70.

4. PENSIONS AT A GLANCE/LATIN AMERICA AND THE CARRIBEAN – COUNTRY PROFILES – BARBADOS
PENSIONS AT A GLANCE: LATIN AMERICA AND THE CARIBBEAN © OECD, THE WORLD BANK AND IDB 2014 81
The contributory pensions, maternity and funeral grants are increased by a formula
which may be summarised as the lesser of the three-year average of wage and price
increases obtained via the Central Bank of Barbados.
Old-age grant
A lump sum is paid for each 50-week period of contributions. The lump sum is equal
to six weeks of average earnings.
The average insurable weekly earnings is calculated as the sum of the insurable
earnings (on which contributions have been based), divided by the number of weeks of
contributions.
Non-contributory old-age pension
The amount paid to a person who qualifies for non-contributory pension is BBD 127.00
per week. To qualify an insured individual must be of pensionable age and a citizen of
Barbados or a permanent resident. Special rules apply for blind and deaf people.
An insured person is not entitled to a Non-Contributory Old Age Pension if that
person: i) receives a pension in respect of the public service of Barbados; ii) receives a
pension in respect of public service with another government; or with an international
organisation of which the Government of Barbados is a member; iii) receives a pension
under the National Insurance Scheme at a rate higher than the non-contributory old-age
pension; iv) receives a pension by virtue of a National Insurance and Social Security
Scheme operated by another government; v) receives an income in excess of
BBD 30 per week and is blind or a deaf mute and under the age of 66 years; vi) is
continuously absent from Barbados for any period in excess of six months; vii) is a full time
in-patient at a health service institution maintained by the government such as a hospital
or a home; viii) is detained at any prison.
Variant careers
Early retirement
It is possible to receive a pension from the age of 60 if the insured person is no longer
employed or self-employed. The pension is reduced by 0.5% per month for each month of
early withdrawal before the pensionable age. This reduction is permanent unless the
person decides to work again.
Late retirement
The pension benefit withdrawal may be deferred until age 70. The pension benefit is
increased by 0.5% per month for each month of deferral after the pensionable age.
Personal income tax and social security contributions
Taxation of workers
There is an individual tax allowance of BBD 25 000. The next BBD 35 000 of income is
taxed at 17% tax rate, with income above this level taxed at 35%.
Social security contributions paid by workers
A private sector employee aged 16 to 66 contributes 6.75% to the National Insurance,
while those self-employed contribute 13.5% of covered earnings.

4. PENSIONS AT A GLANCE/LATIN AMERICA AND THE CARRIBEAN – COUNTRY PROFILES – BARBADOS
PENSIONS AT A GLANCE: LATIN AMERICA AND THE CARIBBEAN © OECD, THE WORLD BANK AND IDB 201482
The minimum earnings for contribution calculation purposes are BBD 21 a week for
employees paid weekly or BBD 91 a month for employees paid monthly.
The maximum earnings for contribution calculation purposes are BBD 900 a week for
employees paid weekly, BBD 3 900 a month for employees paid monthly.
Contributions also finance sickness and maternity benefits, work injury benefits,
Unemployment Benefit, Invalidity Benefit/Grant, Disablement Benefit/Grant, Survivors
Benefit/Grant, Funeral Grant and Death Benefit.
Taxation of pensioners
There is an additional allowance of BBD 15 000 for pensioners, raising the total tax
allowance to BBD 40 000 per year for an individual who is 60 years or over and is in receipt
of a pension.
Social security contributions paid by pensioners
Social security contributions are reduced for a pensioner who work and is equal to
0.6%.
Social security contributions by type of worker
Private sector employees – “R”Over 66 and a half or Under 16 –
“E” PrivateSelf-employed – “S”
Employee(%)
Employer(%)
Total (%)Employee
(%)Employer
(%)Total (%)
Employee(%)
Employer(%)
Total (%)
National insurance 6.75 6.75 13.5 0.0 0.0 0.0 13.5 0.0 13.5
Non-contributory 2.0 2.0 4.0 0.0 0.0 0.0 2.0 0.0 2.0
Employment injury 0.0 0.75 0.75 0.0 0.75 0.75 0.0 0.0 0.0
Unemployment 0.75 0.75 1.5 0.0 0.0 0.0 0.0 0.0 0.0
Severance 0.0 0.5 0.5 0.0 0.0 0.0 0.0 0.0 0.0
Training levy 0.5 0.5 1.0 0.5 0.5 1.0 0.5 0.0 0.5
Catastrophe fund 0.1 0.0 0.1 0.1 0.0 0.1 0.1 0.0 0.1
Total 10.1 11.25 21.35 0.6 1.25 1.85 16.1 0.0 16.1

4. PENSIONS AT A GLANCE/LATIN AMERICA AND THE CARRIBEAN – COUNTRY PROFILES – BARBADOS
PENSIONS AT A GLANCE: LATIN AMERICA AND THE CARIBBEAN © OECD, THE WORLD BANK AND IDB 2014 83
Pension modelling results: Barbados
MenMedian earner
Individual earnings, multiple of average
Women (where different) 0.5 0.75 1.0 1.5 2.0
Gross relative pension level 48.6 30.0 45.0 60.0 90.0 101.0
(% average gross earnings)
Net relative pension level 53.9 33.2 49.9 66.5 99.7 111.9
(% net average earnings)
Gross replacement rate 60.0 60.0 60.0 60.0 60.0 50.5
(% individual gross earnings)
Net replacement rate 66.4 66.2 66.4 66.5 70.7 60.5
(% individual net earnings)
Gross pension wealth 10.0 10.0 10.0 10.0 10.0 8.4
(multiple of individual gross earnings) 12.6 12.6 12.6 12.6 12.6 10.6
Net pension wealth 10.0 10.0 10.0 10.0 10.0 8.4
(multiple of individual gross earnings) 12.6 12.6 12.6 12.6 12.6 10.6
1 2 http://dx.doi.org/10.1787/888933161585
0 0.25 0.50 0.75 1.00 1.25 1.50 1.75 2.00 0 0.25 0.50 0.75 1.00 1.25 1.50 1.75 2.00
0 0.25 0.50 0.75 1.00 1.25 1.50 1.75 2.00 0 0.25 0.50 0.75 1.00 1.25 1.50 1.75 2.00
2.5
2.0
1.5
1.0
0.5
0
2.5
2.0
1.5
1.0
0.5
0
1.25
1.00
0.75
0.50
0.25
0
1.25
1.00
0.75
0.50
0.25
0
Gross relative pension level Gross replacement rate
Net and gross relative pension levels Net and gross replacement rates
Individual earnings, proportion of average earnings Individual earnings, proportion of average earnings
Proportion of economy-wide average earnings Proportion of individual earnings
Proportion of economy-wide average earnings Proportion of individual earnings
Individual earnings, proportion of average earnings Individual earnings, proportion of average earnings
GrossNet
Earnings-related

4. PENSIONS AT A GLANCE/LATIN AMERICA AND THE CARRIBEAN – COUNTRY PROFILES – BELIZE
PENSIONS AT A GLANCE: LATIN AMERICA AND THE CARIBBEAN © OECD, THE WORLD BANK AND IDB 201484
Belize
Belize: Pension system in 2010
The pension system consists of anearnings-re lated def ined-benef i tcomponent and a retirement grant forthose with some but insuff ic ientcontributions. For those with inadequateincome there is a non-contributorypension.
Key indicators
Belize LAC26
Average earnings BZD 8 700 13 700
USD 4 400 7 000
Public pension spending % of GDP 1.0 3.1
Life expectancy At birth 73.9 73.6
At age 65 17.7 17.4
Population over age 65 % of working-age population 7.7 12.3
Qualifying conditionsThe legal retirement age is 65 years for both men and women with at least 500 weeks
of accredited contributions, including at least 150 paid contributions. Early retirement due
to unemployment or low earnings (earnings less than BZD 50 per week) is possible from the
age of 60. There is a lump-sum payment (the retirement grant) for those with insufficient
contributions. To receive the grant, the employee must meet the following requirements:
● be an insured contributor between 60 and 64 years old; or
● be an insured contributor 65 years or older (whether employed or not).
● Have at least 26 paid contributions.
Benefit calculation
Old-age pension
The weekly old-age pension benefit is calculated as 30% of the sum of the insurable
earnings during the best three years in the contribution record. This is also supplemented
by:
1. 2% of the average weekly insurable earnings for each unit of 50 paid or credited
contributions in excess of the first 500, up to a total of 750 such contributions; and
2. 1% of the average weekly insurable earnings for each unit of 50 paid or credited
contributions in excess of 750.
The maximum old-age pension is equal to 60% of the average weekly covered earnings
up to a weekly maximum of BZD 192. The minimum pension payable is equal to BZD 47 per
week. The observed values averaged 40.8% in 2010.
Pensions are not indexed.

4. PENSIONS AT A GLANCE/LATIN AMERICA AND THE CARRIBEAN – COUNTRY PROFILES – BELIZE
PENSIONS AT A GLANCE: LATIN AMERICA AND THE CARIBBEAN © OECD, THE WORLD BANK AND IDB 2014 85
Retirement grant
If a person does not qualify for a Retirement Pension, they still might qualify for a
Retirement Grant, which is a one-time lump-sum payment. The minimum grant is a
one-time payment of BZD 800. Two formulas are used to calculate the size of the
Retirement Grant, paying the higher amount of the two:
1. six times the sum of insurable earnings in the best three years of contributions, divided
by 150 and multiplied by the number of 50-week contribution periods; or
2. 2.5 times the sum of weekly insurable earnings divided by the number of contributions
and multiplied by the number of 50-week contribution periods.
Non-contributory old-age pension
The Non-Contributory Pension Programme covers men aged 67 and women aged 65 or
older who have inadequate or no income and are a permanent resident or citizen of Belize.
The monthly payment is BZD 100 for both men and women.
Variant careers
Early retirement
Early retirement is possible from the age of 60 if the insured person is unemployed or
if his/her earnings are less than BZD 50 per week, with at least 500 weeks of credited
contributions including at least 150 paid contributions.
Late retirement
It is not possible to delay retirement.
Personal income tax and social security contributions
Taxation of workers
There is a tax allowance equal to BZD 19 600 for single persons under the age of 65
in 2009/10. All income above this level is taxed at 25%.
In 1 January 2011 a new tier system for personal income tax was introduced. The
allowances are now as follows:
● BZD 25 600 on income below BZD 26 000.
● BZD 24 600 on income above BZD 26 000 but not exceeding BZD 27 000.
● BZD 22 600 on income above BZD 27 000 but not exceeding BZD 29 000.
In the case of all other employed individuals the allowance is BZD 19 600.
Social security contributions paid by workers
All persons in insurable employment pay social security contributions. In 2010, 8% of
a person’s average weekly earnings up to a maximum of BZD 320.00 is payable to the social
security system: 1.54%-points are diverted to short-term benefits; 4.50%-points long-term
benefits; and 1.96%-points employment injury benefits.

4. PENSIONS AT A GLANCE/LATIN AMERICA AND THE CARRIBEAN – COUNTRY PROFILES – BELIZE
PENSIONS AT A GLANCE: LATIN AMERICA AND THE CARIBBEAN © OECD, THE WORLD BANK AND IDB 201486
Weekly contributions consist of an employees’ and employers’ part. The amount
payable by each depends upon the employee’s gross income.
Voluntary contributors pay weekly contributions based on the best 3 years of
contributions paid. Voluntary weekly contributions range from BZD 1.76 to BZD 10.24.
Taxation of pensioners
There are no additional tax allowances. Pensions are tax exempt.
Social security contributions paid by pensioners
For insured persons who work after retirement, the employer is responsible for 100%
of the contributions, a standard BZD 2.60 per week, which covers the employment injury
benefit only.
Weekly contributions to the GSSS
Actual weekly earnings (BZD)Weekly insurableearnings (BZD)
Amount of contribution (BZD) Rate of contribution (%)
Employer Employee Total Employer Employee
Under 70.00 55.00 3.57 0.83 4.40 6.50 1.50
70.00 to 109.99 90.00 5.85 1.35 7.20 6.50 1.50
110.00 to 139.99 130.00 8.45 1.95 10.40 6.50 1.50
140.00 to 179.99 160.00 9.65 3.15 12.80 6.03 1.97
180.00 to 219.99 200.00 11.25 4.75 16.00 5.63 2.38
220.00 to 259.99 240.00 12.85 6.35 19.20 5.35 2.65
260.00 to 299.99 280.00 14.45 7.95 22.40 5.16 2.84
300.00 and over 320.00 16.05 9.55 25.60 5.02 2.98

4. PENSIONS AT A GLANCE/LATIN AMERICA AND THE CARRIBEAN – COUNTRY PROFILES – BELIZE
PENSIONS AT A GLANCE: LATIN AMERICA AND THE CARIBBEAN © OECD, THE WORLD BANK AND IDB 2014 87
Pension modelling results: Belize
MenMedian earner
Individual earnings, multiple of average
Women (where different) 0.5 0.75 1.0 1.5 2.0
Gross relative pension level 55.9 34.5 51.8 69.0 103.5 115.4
(% average gross earnings)
Net relative pension level 58.7 36.2 54.3 72.5 108.7 121.2
(% net average earnings)
Gross replacement rate 69.0 69.0 69.0 69.0 69.0 57.7
(% individual gross earnings)
Net replacement rate 73.3 76.3 73.7 72.5 71.3 59.4
(% individual net earnings)
Gross pension wealth 13.3 13.3 13.3 13.3 13.3 11.2
(multiple of individual gross earnings) 14.9 14.9 14.9 14.9 14.9 12.4
Net pension wealth 13.3 13.3 13.3 13.3 13.3 11.2
(multiple of individual gross earnings) 14.9 14.9 14.9 14.9 14.9 12.4
1 2 http://dx.doi.org/10.1787/888933161596
0 0.25 0.50 0.75 1.00 1.25 1.50 1.75 2.00 0 0.25 0.50 0.75 1.00 1.25 1.50 1.75 2.00
0 0.25 0.50 0.75 1.00 1.25 1.50 1.75 2.00 0 0.25 0.50 0.75 1.00 1.25 1.50 1.75 2.00
2.5
2.0
1.5
1.0
0.5
0
2.5
2.0
1.5
1.0
0.5
0
1.25
1.00
0.75
0.50
0.25
0
1.25
1.00
0.75
0.50
0.25
0
Gross relative pension level Gross replacement rate
Net and gross relative pension levels Net and gross replacement rates
Individual earnings, proportion of average earnings Individual earnings, proportion of average earnings
Proportion of economy-wide average earnings Proportion of individual earnings
Proportion of economy-wide average earnings Proportion of individual earnings
Individual earnings, proportion of average earnings Individual earnings, proportion of average earnings
GrossNet
Earnings-related

4. PENSIONS AT A GLANCE/LATIN AMERICA AND THE CARRIBEAN – COUNTRY PROFILES – BOLIVIA
PENSIONS AT A GLANCE: LATIN AMERICA AND THE CARIBBEAN © OECD, THE WORLD BANK AND IDB 201488
Bolivia
Bolivia: Pension system in 2010
The Integrated Pension Systemconsists of a universal pension, anon-contr ibutory scheme, whichincludes the Renta Dignidad, a mandatoryscheme of individual accounts whichinclude old age, disability and survivalbenefits, and a solidarity scheme andold-age and survival benefit.
Key indicators
Bolivia LAC26
Average earnings BOB 12 800 48 500
USD 1 800 7 000
Public pension spending % of GDP 3.4 3.1
Life expectancy At birth 67.1 73.6
At age 65 14.9 17.4
Population over age 65 % of working-age population 9.8 12.3
Qualifying conditionsThe minimum retirement age is 58 for both men and women. Women are allowed to
retire up to three years earlier (retirement at 55), if they have had pension contributions forat least ten years. There is no maximum retirement age.
Insured people can retire before age 58 when, regardless of their age, if they canfinance a replacement rate equal to at least 60% of the average salary, based on theprevious 24 contributions.
If an insured person upon reaching the age of 58 and having contributed for at leastten years does not reach the target level of 60% a solidarity pension is granted according tothe following scale:
Density of contributions in years Minimum solidarity limit (BOB) Maximum solidarity limit (BOB) Referential percentage
10 47611 51612 55713 59814 63915 67916 721 851 5617 763 1 024 5718 806 1 196 5819 848 1 368 5920 890 1 540 6021 932 1 672 6122 974 1 804 6223 1 016 1 016 6324 1 058 1 058 6425 1 100 1 100 6526 1 120 1 120 6627 1 140 1 140 6728 1 160 1 160 6829 1 180 1 180 6930 1 200 1 200 7031 1 220 1 220 7032 1 240 1 240 7033 1 260 1 260 7034 1 280 1 280 70
35 or more 1 300 1 300 70

4. PENSIONS AT A GLANCE/LATIN AMERICA AND THE CARRIBEAN – COUNTRY PROFILES – BOLIVIA
PENSIONS AT A GLANCE: LATIN AMERICA AND THE CARIBBEAN © OECD, THE WORLD BANK AND IDB 2014 89
When the insured does not meet the requirements for a pension or payment they may
withdraw the accumulated balance in the personal insurance account through minimal
withdrawals equivalent to 60% of the average of the last 24 payments, or a final withdraw
consisting of the return of the capital paid in and its respective earnings.
Benefit calculation
Defined contribution
The defined-contribution pension is a combination of the fraction of the accumulated
balance in the individual account and a Monthly Payments Compensation (CCM), where
applicable. The fraction of the accumulated balance is obtained through a calculation of
the life-time fixed or variable interest income that an insured can earn on the accumulated
balance in his/her personal insurance account. The CCM is the recognition by the state to
its insured by the contributions made to the existing distribution system through
30 April 1997, which are financed with resources from the National Treasury and that have
not generated benefits and payments in the system.
Old-age solidarity pension
The old-age solidarity pension is made up of a fraction of the accumulated balance,
the CCM and the Solidarity Fraction. The Solidarity Fraction is calculated as the difference
between the old-age solidarity pension, the fraction of the accumulated balance, and the
CCM where appropriate to the density of contributions of the insured.
Universal pension (Renta Dignidad)
The pension is BOB 2 400 per year and it is paid as an annuity. The benefit is reduced
by 25% if the person receives any other type of pension (that is, they would be entitled to
75% of the universal pension equivalent to BOB 150/month). The pension benefit is paid
monthly, bimonthly, quarterly, or annually.
Pension benefits are adjusted every three years by the Central Bank and valorisation is
based on the source of funds.
Variant careers
Early retirement
Pension benefits may be claimed before age 58, as long as the insured has not contributed
to the pay-as-you-go system (before May 1997) and finances the accumulated balance in his/
her personal account: and a pension equal to or greater than 60% of their earnings (average of
the last 24 contributions), the amount necessary to finance funeral expenses, and a death
pension for their dependents. There are no penalties for this type of retirement.
Late retirement
There is no mandatory retirement age.
Personal income tax and social security contributions
Taxation of workers
Contributions, additional solidarity contributions, benefits and all of the benefits of
the integrated pension system, as well as the accumulated balance and return obtained by
the managed funds, are not taxed.

4. PENSIONS AT A GLANCE/LATIN AMERICA AND THE CARRIBEAN – COUNTRY PROFILES – BOLIVIA
PENSIONS AT A GLANCE: LATIN AMERICA AND THE CARIBBEAN © OECD, THE WORLD BANK AND IDB 201490
Social security contributions paid by workers
Workers contribute 10% of the contribution base wage for old-age insurance, plus
1.71% of the contribution base wage for disability and survival from injury, 0.5% of the
contribution base wage for administrative fees, and 0.5% of the contribution base wage for
the Solidarity Fund. The minimum base wage for contributions to long-term social security
is the same as the monthly legal minimum wage.
There is no maximum wage for calculating the pension. To this end, the insured with
earnings more than or equal to BOB 13 000 make a periodic provisional declaration. They
pay 1% for earnings above BOB 13 000, 5% for earnings above BOB 25 000 and 10% for
earnings over BOB 35 000.
Short-term Social Security disability (for illness, maternity, or work-related injury) is
financed by the employer on 10% of the total amount earned by the employees.
The employer’s contribution is composed of 1.71% of the contribution base wage for
disability insurance and workplace injury and 3% of the contribution base wage for the
Solidarity Fund.
Taxation of pensioners
Pensions are not taxed.
Social security contributions paid by pensioners
There is a 3% mandatory discount on retirement income for health care (Short-term
social security), for retirees and their beneficiaries.
Indexation of benefitsOld-age pensions (expedited starting on 10 December 2010) are indexed as follows:
The fraction of the accumulated balance is updated to the mortality of the group receiving
an old-age pension, old-age solidarity pension, or pension for dependents, with a death
pension, and the profitability of the old-age fund. The component of the Contribution
Compensation is updated annually to the yearly variation of the UVF, determined by the
Central Bank of Bolivia, in accordance with the consumer-price-index calculated by the
National Institute of Statistics. The Fraction of the Accumulated Balance (FSA) is updated
yearly in accordance with the mortality of the group of insured receiving an old-age
pension, old-age solidarity pension and dependents receiving a death benefit on behalf of
the insured. That is, upon the death of a retiree, 80% of the pension is provided to the
pensions of the dependents or family of the deceased; the other 20% increases the fund for
living retirees. The profitability earned by the Old-Age Fund is also updated. The values of
the solidarity pension are updated every five years.
Social assistance for old-age populationThe Health Insurance for Older Adults (SSPAM) was created in January 2006, and
provides integrated health care free of charge to citizens older than 60 years of age who
reside permanently in Bolivia.

4. PENSIONS AT A GLANCE/LATIN AMERICA AND THE CARRIBEAN – COUNTRY PROFILES – BOLIVIA
PENSIONS AT A GLANCE: LATIN AMERICA AND THE CARIBBEAN © OECD, THE WORLD BANK AND IDB 2014 91
Pension modelling results: Bolivia
MenMedian earner
Individual earnings, multiple of average
Women (where different) 0.5 0.75 1.0 1.5 2.0
Gross relative pension level 35.8 18.7 34.2 41.0 54.4 67.9
(% average gross earnings)
Net relative pension level 36.5 19.1 34.9 41.7 55.4 69.1
(% net average earnings)
Gross replacement rate 44.3 37.5 45.6 41.0 36.3 33.9
(% individual gross earnings)
Net replacement rate 44.3 36.4 45.3 41.7 37.9 36.0
(% individual net earnings)
Gross pension wealth 10.3 8.7 10.6 9.5 8.4 7.9
(multiple of individual gross earnings) 11.5 9.7 11.9 10.6 9.4 8.8
Net pension wealth 10.0 8.5 10.3 9.2 8.2 7.6
(multiple of individual gross earnings) 11.2 9.5 11.5 10.3 9.1 8.6
1 2 http://dx.doi.org/10.1787/888933161606
0 0.25 0.50 0.75 1.00 1.25 1.50 1.75 2.00 0 0.25 0.50 0.75 1.00 1.25 1.50 1.75 2.00
0 0.25 0.50 0.75 1.00 1.25 1.50 1.75 2.00 0 0.25 0.50 0.75 1.00 1.25 1.50 1.75 2.00
2.5
2.0
1.5
1.0
0.5
0
2.5
2.0
1.5
1.0
0.5
0
1.25
1.00
0.75
0.50
0.25
0
1.25
1.00
0.75
0.50
0.25
0
Gross relative pension level Gross replacement rate
Net and gross relative pension levels Net and gross replacement rates
Individual earnings, proportion of average earnings Individual earnings, proportion of average earnings
Proportion of economy-wide average earnings Proportion of individual earnings
Proportion of economy-wide average earnings Proportion of individual earnings
Individual earnings, proportion of average earnings Individual earnings, proportion of average earnings
GrossNet
BasicEarnings-related

4. PENSIONS AT A GLANCE/LATIN AMERICA AND THE CARRIBEAN – COUNTRY PROFILES – BRAZIL
PENSIONS AT A GLANCE: LATIN AMERICA AND THE CARIBBEAN © OECD, THE WORLD BANK AND IDB 201492
Brazil
Brazil: Pension system in 2010
The Regime Geral de Previdência Social(RGPS) , covers the private sectorworkforce. It is financed through payrolltaxes, shared by the employer and theemployee, revenues from sales taxes andfederal transfers that cover shortfalls ofthe system. It is a mandatory, pay-as-you-go financed single-pillar scheme,which is operated by the National SocialSecurity Institute.
Key indicators
Brazil LAC26
Average earnings BRL 16 500 11 600
USD 10 000 7 000
Public pension spending % of GDP 6.8 3.1
Life expectancy At birth 73.8 73.6
At age 65 18.2 17.4
Population over age 65 % of working-age population 12.2 12.3
Qualifying conditionsPrivate-sector employees are entitled to retire with a full pension at age 65 for men
and 60 for women if they have a contribution record of at least 15 years. Alternatively, it is
possible to retire after having contributed to social security for 35 years for men and
30 years for women, irrespective of the retiree’s age. For the models we assume retirement
for men at 55 and at 50 for women.
Benefit calculationOld-age pension
For all workers the benefit is the average of 80% of the best monthly earnings from
July 1994 up to the date of retirement. This average is multiplied by the Factor
Previdenciario only if this factor is higher than 1.0. The Factor Previdenciario is an actuarial
coefficient based on the insured’s contribution rate, contribution period, age and life
expectancy. The minimum monthly earnings for benefit calculation purposes are equal to
the legal monthly minimum wage (BRL 510.0). The maximum monthly earnings for benefit
calculation purposes are BRL 3 467.4. The minimum pension for minimum monthly
contributions is equal to the legal monthly minimum wage.
There are 13 payments a year with benefits adjusted annually according to changes in
the consumer price index. No benefit could be less than the minimum wage which is also
annually adjusted.
Social assistance for old-age pensionThere is a benefit for those who don’t qualify for a retirement benefit. The BPC-LOAS
was created to assist old-age people (65 years old and more, both male and female) or
disabled people whose income per capita at home is under one-quarter on the minimum
wage (floor). They received the amount equal to the minimum wage and their conditions
are revised every two years. This benefit is exclusive: beneficiaries cannot receive another
non-contributory benefit from the government. The logistics is made by the INSS (medical

4. PENSIONS AT A GLANCE/LATIN AMERICA AND THE CARRIBEAN – COUNTRY PROFILES – BRAZIL
PENSIONS AT A GLANCE: LATIN AMERICA AND THE CARIBBEAN © OECD, THE WORLD BANK AND IDB 2014 93
certification and means-test), but the responsibility for the benefit is given to the Ministry
of Social Development and Fight Against Hunger (MDS).
There is another benefit called Previdencia Rural (Rural Pension) for those males aged 60
and females aged 55 or older, who have at least 180 months of work in rural areas. The
benefit is equal to the minimum wage.
Variant careers
Early retirement
There is no minimum age to achieve the early retirement as long as the men have
accomplished 35 years of contributions and the women have accomplished 30 years of
contribution. Nevertheless, if the men are under 65 years old or the women that worked
less than 30 years, the value of the benefit is diminished by a factor (fator previdenciário)
which takes into consideration the age, the number of contributions and the life
expectancy in that specific age in which the person was in the requisition date.
Late retirement
Pensions can be claimed along with employment, and there is therefore no incentive
to delay payment.
Personal income tax and social security contributions
Taxation of workers
In 2010, individuals with monthly income above BRL 1 434.59 pay taxes according to
the following:
Social security contributions paid by workers
There is no difference of contribution between the benefits. The contribution is valid
for all benefits that the category of contributor qualifies the insured to receive.
Taxation of pensioners
There are no special tax allowances or credits for pensioners.
Monthly earning from: To Tax (%)
BRL 1 434.60 BRL 2 246.75 7.5
BRL 2 246.76 BRL 2 995.70 15.0
BRL 2 995.71 BRL 3 743.19 22.5
BRL 3 743.2 Or more 27.5
Insured people2010
Contribution base (BRL) Rate (%)
Employee, household employee and detachedworker
Up to 1 040.22 8.0
From 1 040.23 to 1 733.70 9.0
From 1 733.71 to 3 467.40 1.0
Above 3 467.40 11.0 on the ceiling (3 467.40)

4. PENSIONS AT A GLANCE/LATIN AMERICA AND THE CARRIBEAN – COUNTRY PROFILES – BRAZIL
PENSIONS AT A GLANCE: LATIN AMERICA AND THE CARIBBEAN © OECD, THE WORLD BANK AND IDB 201494
Taxation of pension income
Pensions are not taxed.
Social security contributions paid by pensioners
The beneficiaries do not pay social security contributions on their benefits, but if they
work, social security contributions must be paid on the earnings of their work, in the same
scale that other workers do. Beneficiaries only keep contributing to the social security if the
value of their retirement is above the ceiling (BRL 3 467.40).

4. PENSIONS AT A GLANCE/LATIN AMERICA AND THE CARRIBEAN – COUNTRY PROFILES – BRAZIL
PENSIONS AT A GLANCE: LATIN AMERICA AND THE CARIBBEAN © OECD, THE WORLD BANK AND IDB 2014 95
Pension modelling results: Brazil
MenMedian earner
Individual earnings, multiple of average
Women (where different) 0.5 0.75 1.0 1.5 2.0
Gross relative pension level 47.2 28.1 42.1 58.3 93.9 125.2
(% average gross earnings) 43.1 25.6 38.4 53.2 85.6 114.2
Net relative pension level 51.9 30.9 46.3 64.1 103.2 137.6
(% net average earnings) 47.3 28.2 42.2 58.4 94.1 125.5
Gross replacement rate 58.3 56.2 56.2 58.3 62.6 62.6
(% individual gross earnings) 53.2 51.2 51.2 53.2 57.1 57.1
Net replacement rate 64.1 61.1 61.1 64.1 70.6 72.8
(% individual net earnings) 58.4 55.7 55.7 58.4 64.4 66.4
Gross pension wealth 16.3 15.7 15.7 16.3 17.5 17.5
(multiple of individual gross earnings) 18.9 18.2 18.2 18.9 20.3 20.3
Net pension wealth 16.3 15.7 15.7 16.3 17.5 17.5
(multiple of individual gross earnings) 18.9 18.2 18.2 18.9 20.3 20.3
1 2 http://dx.doi.org/10.1787/888933161616
0 0.25 0.50 0.75 1.00 1.25 1.50 1.75 2.00 0 0.25 0.50 0.75 1.00 1.25 1.50 1.75 2.00
0 0.25 0.50 0.75 1.00 1.25 1.50 1.75 2.00 0 0.25 0.50 0.75 1.00 1.25 1.50 1.75 2.00
2.5
2.0
1.5
1.0
0.5
0
2.5
2.0
1.5
1.0
0.5
0
1.25
1.00
0.75
0.50
0.25
0
1.25
1.00
0.75
0.50
0.25
0
Gross relative pension level Gross replacement rate
Net and gross relative pension levels Net and gross replacement rates
Individual earnings, proportion of average earnings Individual earnings, proportion of average earnings
Proportion of economy-wide average earnings Proportion of individual earnings
Proportion of economy-wide average earnings Proportion of individual earnings
Individual earnings, proportion of average earnings Individual earnings, proportion of average earnings
GrossNet
Targeted

4. PENSIONS AT A GLANCE/LATIN AMERICA AND THE CARRIBEAN – COUNTRY PROFILES – CHILE
PENSIONS AT A GLANCE: LATIN AMERICA AND THE CARIBBEAN © OECD, THE WORLD BANK AND IDB 201496
Chile
Chile: Pension system in 2010
The pension system has threecomponents: a redistributive first tier, asecond tier of mandatory individualaccounts and a voluntary third tier. Theindividual accounts of the defined-contribution type. The redistributive firsttier was substantially extended in apension reform in 2008.
Key indicators
Chile LAC26
Average earnings CLP (million) 5.51 3.26
USD 11 800 7 000
Public pension spending % of GDP 3.4 3.1
Life expectancy At birth 79.8 73.6
At age 65 19.5 17.4
Population over age 65 % of working-age population 16.0 12.3
Qualifying conditions
Defined contribution
Normal retirement age is 65 for men and 60 for women. Pension benefits can be drawn
at any point from that age. Individuals are not required to stop working to claim pension.
Basic and supplementary schemes
The Basic Solidarity Pension (PBS) is payable from age 65 to the 60% poorest population
on condition that people have lived in the country for at least 20 years and at least four of
the five years prior to the claim. The qualifying conditions for the supplementary welfare
pension are the same.
Benefit calculation
Defined contribution
The contribution rate by workers for individual accounts is 10% of earnings.
Administrative charges, averaging 1.55% of earnings, are levied on top of this contribution
(not out of the mandatory contribution). In addition, workers contribute 1.49% of earnings
to the disability and survival insurance premium.
There is a ceiling on contributions, which in December 2010 was set at 64.7 “unidad de
fomento” (real, that is inflation adjusted, units), which was CLP 1 388 147 per month, equal
to eight times the minimum wage in December 2010 (CLP 172 000) and 302% of average
earnings. The ceiling is indexed to the real annual increase of average earnings (1 UF =
CLP 21 455).
At retirement, the accumulated capital can be used to buy an immediate life annuity,
to get a temporary income with a deferred life annuity, to take programmed withdrawals,
or to buy an immediate life annuity with programmed withdrawals. A withdrawal of 15 UFs
is made from the individual account to cover for funeral expenses. For comparison with
other countries, replacement rates have been calculated assuming an actuarially fair
annuity, using sex-specific annuity rates.

4. PENSIONS AT A GLANCE/LATIN AMERICA AND THE CARRIBEAN – COUNTRY PROFILES – CHILE
PENSIONS AT A GLANCE: LATIN AMERICA AND THE CARIBBEAN © OECD, THE WORLD BANK AND IDB 2014 97
Basic
The basic pension (PBS) was CLP 75 840 in December 2010. The basic pension is
indexed with changes in prices.
Supplementary
The 2008 reform also introduced a pension-income-tested supplement as a
replacement for the previous minimum pension. This is payable to all individuals whose
defined-contribution pension is less than a specified amount: the maximum welfare
pension threshold (PMaS). This threshold increased over time as the new system was
phased in:
In general terms, the supplementary benefit is defined as the value of the basic
pension (PBS) – the ratio of PBS to the value of the maximum welfare pension (PMaS)
multiplied by the value of the defined-contribution pension. The key ratio of PBS to PMaS
was 38% in 2010, and fell to just 29% from mid-2011 onwards, thus increasing the
supplementary benefit.
The objective of this new supplementary pension is to improve the living standards of
low-income workers when they move into retirement. The table above shows the new
programme that was gradually phased-in, moving from coverage of 40% of the poorest
pensioners in 2008-09 to 60% from mid-2011 onwards. The modelling of pension
entitlements uses the parameters in place from 2011 (and so will be those applicable to a
new labour-market entrant in 2010). In the modelling the value of the supplementary
pension is indexed in line with prices from 2011 onwards.
Variant careers
Early retirement
Early retirement is allowed at any age in the defined-contribution scheme as long as
the capital accumulated in the account is sufficient to finance a pension above particular
thresholds. The first condition is that the benefit must be worth 150% of the minimum
pension under the old system. From July 2012 onwards, this changed to 80% of the
maximum welfare pension (PMaS). The second condition is that a 70% replacement rate is
reached, relative to earnings in the ten years prior to drawing the pension.
The normal retirement age is reduced by one or two years for each five years of work
under arduous conditions in specified occupations. The maximum reduction of the normal
retirement age is ten years.
Late retirement
It is possible to defer pension claiming after normal retirement age.
Maximum welfare pension (PMaS, CLP) Target coverage of older people (%)
July 2008-June 2009 70 000 40
July-August 2009 120 000 45
September 2009-June 2010 150 000 50
July 2010-June 2001 200 000 55
July 2011 onwards 255 000 60

4. PENSIONS AT A GLANCE/LATIN AMERICA AND THE CARRIBEAN – COUNTRY PROFILES – CHILE
PENSIONS AT A GLANCE: LATIN AMERICA AND THE CARIBBEAN © OECD, THE WORLD BANK AND IDB 201498
Personal income tax and social security contributions
Taxation of pensioners
When claiming a pension individuals are allowed to obtain the “Free Purpose Surplus”
if the remaining balance meets certain conditions. The first one is that the balance is
enough to finance a pension that is at least 150% of the minimum pension under the old
system. From July 2012 onwards, this will change to 100% of the maximum welfare pension
(PMaS). The second condition is that a 70% replacement rate is reached, relative to earnings
in the ten years prior to drawing the pension. The surplus can be obtained in tax-free
annual instalments up to a maximum of 200 Monthly Taxing Monetary Units (UTM) per
year and a total tax-free amount of 1 200 UTM. If obtained as a lump-sum, the maximum
exempt amount is 800 UTM (1 UTM = CLP 37 605).
Taxation of pension income
Same rates as general income tax rates apply. Structure of Income tax is progressive:
Social security contributions paid by pensioners
By 2010, all pensioners paid 7% of pension income for health-care coverage. Since
November 2011 pensioners who belong to the 60% poorest population and beneficiaries of
the redistributive first tier (either of PNS or the pension-income-tested supplement) do not
need to contribute for health coverage. From November 2012 onwards, pensioners
belonging to the 4th earnings quintile will contribute 5% of pension income for health
coverage. The remaining pensioners pay 7% of pension income for health coverage.
Income bracket (UTM)Marginal tax rate (%)
From To (inclusive)
- 13.5 0
13.5 30 5
30 50 10
50 70 15
70 90 25
90 120 32
120 150 37
150+ 40

4. PENSIONS AT A GLANCE/LATIN AMERICA AND THE CARRIBEAN – COUNTRY PROFILES – CHILE
PENSIONS AT A GLANCE: LATIN AMERICA AND THE CARIBBEAN © OECD, THE WORLD BANK AND IDB 2014 99
Pension modelling results: Chile
MenMedian earner
Individual earnings, multiple of average
Women (where different) 0.5 0.75 1.0 1.5 2.0
Gross relative pension level 38.7 30.1 37.0 43.9 58.7 78.3
(% average gross earnings) 31.0 25.4 29.9 34.4 43.4 52.5
Net relative pension level 44.5 34.6 42.6 50.5 67.5 90.1
(% net average earnings) 35.6 29.2 34.4 39.6 49.9 60.3
Gross replacement rate 47.7 60.2 49.3 43.9 39.1 39.2
(% individual gross earnings) 38.2 50.7 39.8 34.4 28.9 26.2
Net replacement rate 54.9 69.2 56.7 50.5 45.7 46.3
(% individual net earnings) 44.0 58.3 45.8 39.6 33.8 31.0
Gross pension wealth 7.8 9.8 8.1 7.2 6.4 6.4
(multiple of individual gross earnings) 8.1 10.8 8.5 7.3 6.2 5.6
Net pension wealth 7.3 9.1 7.5 6.7 5.9 5.9
(multiple of individual gross earnings) 7.6 10.1 7.9 6.8 5.7 5.2
1 2 http://dx.doi.org/10.1787/888933161626
0 0.25 0.50 0.75 1.00 1.25 1.50 1.75 2.00 0 0.25 0.50 0.75 1.00 1.25 1.50 1.75 2.00
0 0.25 0.50 0.75 1.00 1.25 1.50 1.75 2.00 0 0.25 0.50 0.75 1.00 1.25 1.50 1.75 2.00
2.5
2.0
1.5
1.0
0.5
0
2.5
2.0
1.5
1.0
0.5
0
1.25
1.00
0.75
0.50
0.25
0
1.25
1.00
0.75
0.50
0.25
0
Gross relative pension level Gross replacement rate
Net and gross relative pension levels Net and gross replacement rates
Individual earnings, proportion of average earnings Individual earnings, proportion of average earnings
Proportion of economy-wide average earnings Proportion of individual earnings
Proportion of economy-wide average earnings Proportion of individual earnings
Individual earnings, proportion of average earnings Individual earnings, proportion of average earnings
GrossNet
Basic SupplementDC

4. PENSIONS AT A GLANCE/LATIN AMERICA AND THE CARRIBEAN – COUNTRY PROFILES – COLOMBIA
PENSIONS AT A GLANCE: LATIN AMERICA AND THE CARIBBEAN © OECD, THE WORLD BANK AND IDB 2014100
Colombia
Colombia: Pension system in 2010
The system allows people to choosebetween a defined-benefit system(Regimen de Prima Media – RPM) managedby a public sector entity, and theIndividual Savings System with a welfarebenefit (RAIS) managed by the privatesector. For new affiliates, there is aMinimum Pension Guarantee Fund(MPGF).
Key indicators
Colombia LAC26
Average earnings COP (million) 12.0 13.4
USD 6 300 7 000
Public pension spending % of GDP 3.5 3.1
Life expectancy At birth 74.0 73.6
At age 65 17.4 17.4
Population over age 65 % of working-age population 10.5 12.3
Qualifying conditions
Defined-benefit System of Average Premiums (Regimen de Prima Media – RPM)
The income-based scheme has gone through a number of changes since 2006. The
retirement age has progressively increased: for those retiring before 2014, the retirement
age is currently 60 for men and 55 for women; but starting on 1 January 2014, the
retirement age will increase to 62 for men and 57 for women.
The number of weeks of contributions will increase each year by 25 until reaching
1 300 weeks in 2015:
Men older than age 40 and women older than 35 and workers with at least 15 years of
contributions when the individual accounts system went into effect can receive benefits in
accordance with the previous system, or join the private system.
Affiliates of the RPM have the option of receiving alternative compensation, as long as,
having reached the age of eligibility for an old-age pension, they have not contributed the
minimum number of weeks required or they are unable to continue contributing.
System of Individual Savings with Welfare Benefit (Régimen de Ahorro Individualcon Solidaridad – RAIS)
In either the system of individual savings or defined contribution, insured people can
retire when they have a sufficient balance in their individual accounts to finance an
annuity equal to 110% of the minimum pension.
The minimum age to draw a pension is 62 for men and 57 for women, with
1 150 weeks of contributions.
Insured people enrolled in the RAIS receive a return on their contributions with their
respective earnings.
2005 2006 2007 2008 2009 2010 2011 2012 2013 2014 2015
Weeks: 1 050 1 075 1 100 1 125 1 150 1 175 1 200 1 225 1 250 1 275 1 300

4. PENSIONS AT A GLANCE/LATIN AMERICA AND THE CARRIBEAN – COUNTRY PROFILES – COLOMBIA
PENSIONS AT A GLANCE: LATIN AMERICA AND THE CARIBBEAN © OECD, THE WORLD BANK AND IDB 2014 101
Benefit calculation
Earnings-related benefit
Pensions vary between 55% and 65% of the average contribution base wage in the last
ten years, revaluated for inflation, plus 1.5% for each additional period of 50 weeks of
contributions up to a maximum of 80%. (The formula for estimating the percentage of the
pension is 65.5% of the average contribution base wage minus 0.5 percentage points for
each minimum wage on which the person contributed.)
Minimum pension
The minimum pension is equal to the legal minimum wage. Pension benefits are
paid 13 or 14 times a year. Pension the benefits are adjusted annually according to the
consumer price index (IPC) and depending on the value of the benefit.
Defined contributionThe defined-contribution benefit can be paid under a phased withdrawn based, an
annuity, or a combination of the two.
Workers can switch system every five years, up to ten years before reaching retirement
age.
Alternative compensation
The alternative compensation is equal to an average weekly base settlement income
multiplied by the number of weeks of contributions. A weighted average of the percentages
on which the affiliate has contributed is then applied to this result.
Variant careers
Early retirement – RPM
Early retirement is generally not possible. There are two exceptions for individuals
with disabilities or for women with caring responsibilities for disabled children.
Early retirement – RAIS
Pension withdrawal is flexible in RAIS and individuals have the right to an old-age
pension at the age of their choosing given that the accumulated capital enables them to
withdraw a monthly pension equal to or above 110% of the monthly legal minimum wage.
RAIS pension benefits are adjusted annually according to the change of the consumer price
index.
Late retirement – RPM
Late retirement is not possible under the public pension system.
Late retirement – RAIS
The employer is required to make the employer contributions until the worker reaches
age 60 (women) or 62 (men).

4. PENSIONS AT A GLANCE/LATIN AMERICA AND THE CARRIBEAN – COUNTRY PROFILES – COLOMBIA
PENSIONS AT A GLANCE: LATIN AMERICA AND THE CARIBBEAN © OECD, THE WORLD BANK AND IDB 2014102
Personal income tax and social security contributionsTaxation of workers
The income tax rate is calculated in brackets according to the Tax Value Unit (UVT).A personal deduction exists up to 1 090 UVT. The tax on income between 1 091 UVT and1 700 UVT is 19%; it is 28% on UVTs between 1 701 and 4 100; and 33% on UVTs above 4 100.1 UVT = COP 24 555.
Social security contributions paid by workersContributions to the pension system equal 16% of the base contribution income; the
employer pays 12 percentage points and the worker pays the remaining 4 percentage points.
Under the RPM, the contribution rate to the pension system is comprised of:13 percentage points for old-age pension and 3%points for administrative costs andinsurance premiums.
In the RAIS, the contribution rate to the pension system is distributed as follows:11.5 percentage points to the individual account, 3 percentage points for administrativecosts and insurance premiums; 1.5 percentage points for the Minimum Pension GuaranteeFund, which provides the source of funds to complement the pensions of those who meetboth the age and contribution requirements to receive a minimum pension but have notaccumulated enough resources.
The RAIS workers with incomes greater than four times the minimum wagecontribute an additional 1% of their base contribution rate. Workers with incomes greaterthan 16 times the minimum wage contribute an additional 0.2% and 1% on top of theabovementioned 1%, which are allocated to the Solidarity Fund.
The minimum contribution income is equal to the legal minimum wage in effect, andthe maximum base contribution income for the purpose of calculation of benefits is25 times the legal minimum wage in effect.
The legal monthly minimum wage for 2010 was COP 515 000.
The monthly contribution to the health system is 4% of the base contribution income.
Taxation of pensionersRetirement, disability, and old-age pensions and survivor benefits for work-related
injuries are taxed as income on the portion of the monthly payment above 1 000 UVT.
Social security contributions paid by pensionersPensioners contribute to the social insurance system for health care. If their pension
is above ten times the minimum wage in effect, they also contribute to the SolidarityPension Fund.
Pensioners’ monthly contribution to the health care system is 12% of the income.
Social assistanceThe Social Assistance Programme for Old-Age Population (PPSAM) is aimed at
protecting the needy elderly against the economic risk of not earning incomes and againstsocial exclusion. This programme provides an average monthly benefit of COP 62 000.
Additionally, there is a supplementary food benefit for the elderly (Juan Luis Londoñode la Cuesta) equivalent to 30% of the recommended daily caloric and nutritional intake.Currently, this food supplement is being converted to a cash transfer.

4. PENSIONS AT A GLANCE/LATIN AMERICA AND THE CARRIBEAN – COUNTRY PROFILES – COLOMBIA
PENSIONS AT A GLANCE: LATIN AMERICA AND THE CARIBBEAN © OECD, THE WORLD BANK AND IDB 2014 103
Pension modelling results: Colombia (Public pension system)
MenMedian earner
Individual earnings, multiple of average
Women (where different) 0.5 0.75 1.0 1.5 2.0
Gross relative pension level 57.4 51.3 53.1 70.8 106.2 141.6
(% average gross earnings) 51.9 51.3 64.1 96.1 128.2
Net relative pension level 59.8 53.5 55.4 73.8 110.6 147.4
(% net average earnings) 54.1 53.5 66.8 100.1 133.4
Gross replacement rate 70.8 102.6 70.8 70.8 70.8 70.8
(% individual gross earnings) 64.1 68.4 64.1 64.1 64.1
Net replacement rate 73.1 102.7 72.8 73.8 74.8 75.3
(% individual net earnings) 66.2 70.3 66.8 67.6 68.2
Gross pension wealth 12.2 17.6 12.2 12.2 12.2 12.2
(multiple of individual gross earnings) 13.8 22.1 14.8 13.8 13.8 13.8
Net pension wealth 8.2 11.8 8.2 8.2 8.2 8.2
(multiple of individual gross earnings) 9.3 14.9 9.9 9.3 9.3 9.3
1 2 http://dx.doi.org/10.1787/888933161645
0 0.25 0.50 0.75 1.00 1.25 1.50 1.75 2.00 0 0.25 0.50 0.75 1.00 1.25 1.50 1.75 2.00
0 0.25 0.50 0.75 1.00 1.25 1.50 1.75 2.00 0 0.25 0.50 0.75 1.00 1.25 1.50 1.75 2.00
2.5
2.0
1.5
1.0
0.5
0
2.5
2.0
1.5
1.0
0.5
0
1.25
1.00
0.75
0.50
0.25
0
1.25
1.00
0.75
0.50
0.25
0
Gross relative pension level Gross replacement rate
Net and gross relative pension levels Net and gross replacement rates
Individual earnings, proportion of average earnings Individual earnings, proportion of average earnings
Proportion of economy-wide average earnings Proportion of individual earnings
Proportion of economy-wide average earnings Proportion of individual earnings
Individual earnings, proportion of average earnings Individual earnings, proportion of average earnings
GrossNet
Earnings-related

4. PENSIONS AT A GLANCE/LATIN AMERICA AND THE CARRIBEAN – COUNTRY PROFILES – COLOMBIA
PENSIONS AT A GLANCE: LATIN AMERICA AND THE CARIBBEAN © OECD, THE WORLD BANK AND IDB 2014104
Pension modelling results: Colombia (Private pension system)
MenMedian earner
Individual earnings, multiple of average
Women (where different) 0.5 0.75 1.0 1.5 2.0
Gross relative pension level 30.2 18.7 28.0 37.3 56.0 74.6
(% average gross earnings) 22.4 13.8 20.7 27.6 41.4 55.3
Net relative pension level 31.6 19.6 29.3 39.0 58.4 77.8
(% net average earnings) 23.4 14.5 21.7 28.9 43.3 57.6
Gross replacement rate 37.3 37.3 37.3 37.3 37.3 37.3
(% individual gross earnings) 27.6 27.6 27.6 27.6 27.6 27.6
Net replacement rate 38.6 37.6 38.5 39.0 39.5 39.7
(% individual net earnings) 28.6 27.9 28.6 28.9 29.2 29.4
Gross pension wealth 6.4 6.4 6.4 6.4 6.4 6.4
(multiple of individual gross earnings) 6.0 6.0 6.0 6.0 6.0 6.0
Net pension wealth 4.3 4.3 4.3 4.3 4.3 4.3
(multiple of individual gross earnings) 4.0 4.0 4.0 4.0 4.0 4.0
1 2 http://dx.doi.org/10.1787/888933161634
0 0.25 0.50 0.75 1.00 1.25 1.50 1.75 2.00 0 0.25 0.50 0.75 1.00 1.25 1.50 1.75 2.00
0 0.25 0.50 0.75 1.00 1.25 1.50 1.75 2.00 0 0.25 0.50 0.75 1.00 1.25 1.50 1.75 2.00
2.5
2.0
1.5
1.0
0.5
0
2.5
2.0
1.5
1.0
0.5
0
1.25
1.00
0.75
0.50
0.25
0
1.25
1.00
0.75
0.50
0.25
0
Gross relative pension level Gross replacement rate
Net and gross relative pension levels Net and gross replacement rates
Individual earnings, proportion of average earnings Individual earnings, proportion of average earnings
Proportion of economy-wide average earnings Proportion of individual earnings
Proportion of economy-wide average earnings Proportion of individual earnings
Individual earnings, proportion of average earnings Individual earnings, proportion of average earnings
GrossNet
DC

4. PENSIONS AT A GLANCE/LATIN AMERICA AND THE CARRIBEAN – COUNTRY PROFILES – COSTA RICA
PENSIONS AT A GLANCE: LATIN AMERICA AND THE CARIBBEAN © OECD, THE WORLD BANK AND IDB 2014 105
Costa Rica
Costa Rica: Pension system in 2010
The system consists of a defined-benefitscheme, a capitalisation regime thatfinances a portion of the total pension,and a non-contributory pension system.
Key indicators
Costa Rica LAC26
Average earnings CRC 3 871 800 3 508 100
USD 7 700 7 000
Public pension spending % GDP 3.3 3.1
Life expectancy At birth 79.9 73.6
At age 65 19.7 17.4
Population over age 65 % of working-age population 11.3 12.3
Qualifying conditionsEmployees are entitled to retire with an old-age pension at age of 65 if they have at
least 300 months of contributions.
Anyone who has not made 300 contributions can elect to receive a proportional
pension, if they have made at least 180 contributions to the disability, old-age and
survivors’ pension system, and are at least 65 years of age. In this case, the amount of the
proportional pension is calculated as the amount of the corresponding old-age pension
multiplied by the number of contributions, divided by 300. For those who have made
300 contributions but have not reached the retirement age of 60 for women and 62 for men,
the amount of the pension will be reduced proportionally according to the following table:
Retirement ageRequired numberof contributions
Per cent of reduction
Men Women
64 years 9 months 300 2.0 1.5
64 years 6 months 300 3.8 3.3
64 years 3 months 300 5.5 5.0
64 years 300 7.3 6.8
63 years 9 months 300 9.0 8.5
63 years 6 months 300 10.8 10.3
63 years 3 months 300 12.5 12.0
63 years 300 14.3 13.8
62 years 9 months 300 16.0 15.5
62 years 6 months 300 17.8 17.3
62 years 3 months 300 19.5 19.0
62 years 300 21.3 20.8
61 years 9 months 300 22.5
61 years 6 months 300 24.3
61 years 3 months 300 26.0
61 years 300 27.8
60 years 9 months 300 29.5
60 years 6 months 300 31.3
60 years 3 months 300 33.0
60 years 300 34.8

4. PENSIONS AT A GLANCE/LATIN AMERICA AND THE CARRIBEAN – COUNTRY PROFILES – COSTA RICA
PENSIONS AT A GLANCE: LATIN AMERICA AND THE CARIBBEAN © OECD, THE WORLD BANK AND IDB 2014106
A person can also be eligible for an early retirement pension with a greater number of
contributions.
Benefit calculation
Income-based
The amount of the disability or old-age pension includes a basic amount representing
a percentage of the average salary for the first 20 years of contributions (240 contributions).
The earnings bracket of the insured (see the table below) is calculated as the average
earnings in the last 60 months in which contributions were made, adjusted for inflation. A
calculation is applied to this reference salary according to the replacement rate of the
person’s earnings level. The additional rate for each month contributed is 0.0833% after
240 months.
The minimum monthly base contribution wage for the IVM (disability, old age or
death) benefits is CRC 110 000. There is no maximum base contribution wage for the
purpose of calculating benefits.
Disability and survivor’s benefits are paid by the public system. Benefits can be taken
as indexed annuities or programmed retirement.
For 2010, the minimum pension in the first half of the year was CRC 104 054.16 and the
maximum pension was CRC 1 226 194.29 (with no delay) and CRC 1 735 065 (for late
retirement). For the second half of the year, the minimum pension was CRC 107 613 and
the maximum pension was CRC 1 268 130 (with no delay) and CRC 1 794 404 (for late
retirement). Payments are made 13 times a year.
Pensions are indexed to consumer prices.
Years – months Men Women Years – months Men Women Years – months Men Women
59-11 - 450 61-08 - 444 63-05 391 385
60-00 - 450 61-09 - 444 63-06 387 381
60-01 - 450 61-10 - 444 63-07 383 377
60-02 - 450 61-11 462 444 63-08 379 373
60-03 - 450 62-00 456 444 63-09 375 369
60-04 - 449 62-01 453 443 63-10 371 365
60-05 - 449 62-02 450 442 63-11 367 361
60-06 - 448 62-03 447 441 64-00 363 357
60-07 - 448 62-04 443 437 64-01 359 353
60-08 - 448 62-05 439 433 64-02 355 349
60-09 - 448 62-06 435 429 64-03 351 345
60-10 - 447 62-07 431 425 64-04 347 341
60-11 0 447 62-08 427 421 64-05 343 337
61-00 0 446 62-09 423 417 64-06 339 333
61-01 0 446 62-10 419 413 64-07 333 327
61-02 0 446 62-11 415 409 64-08 327 321
61-03 0 446 63-00 411 405 64-09 321 315
61-04 0 445 63-01 407 401 64-10 314 310
61-05 0 445 63-02 403 397 64-11 307 305
61-06 0 444 63-03 399 393 65-00 300 300
61-07 0 444 63-04 395 389

4. PENSIONS AT A GLANCE/LATIN AMERICA AND THE CARRIBEAN – COUNTRY PROFILES – COSTA RICA
PENSIONS AT A GLANCE: LATIN AMERICA AND THE CARIBBEAN © OECD, THE WORLD BANK AND IDB 2014 107
Targeted
The minimum contributory pension is approximately 30% of the average base
contribution wage, while the non-contributory pension is approximately 20% of the
average wage.
Defined contribution
The value of the pension depends on the contributions made by the insured plus the
accumulated interest. The insured can choose to receive the pension as an annuity or
under a programmed retirement scheme.
Variant careers
Early retirement
Those insured that opt for early retirement must cover the missing contributions
when they retire.
In order to draw a full pension and retire early, the insured must meet the requirements
of both age and number of contributions, according to the following table:
Late retirement
Insured persons who meet the requirements for the old-age pension have the right to
an additional pension if they delay retirement, starting from the date on which the legal
and regulatory requirements were met, with no age limit. This additional pension consists
of 0.1333% per month (1.6% annually) over the average reference wage. The amount of the
additional pension for delaying retirement added to the amount of the calculated pension
must not exceed 125% of the salary.
Personal income tax and social security contributions
Taxation of workers
There are income subsidies up to CRC 619 000 per month. Above this level of income,
up to CRC 310 000 are taxed at 10%; incomes above this amount are taxed at 15%.
Social security contributions paid by workers
The contribution to the defined-benefit system is 8% of the base contribution wage;
workers’ pay 2.67%, employers pay 4.92%, and the state pays 0.41% of the base contribution
wage.
Average salary Basic amount (%)
Less than 2 minimum wages 52.5
From 2 to less than 3 minimum wages 51.0
From 3 to less than 4 minimum wages 49.4
From 4 to less than 5 minimum wages 47.8
From 5 to less than 6 minimum wages 46.2
From 6 to less than 8 minimum wages 44.6
8 minimum wages and above 43.0

4. PENSIONS AT A GLANCE/LATIN AMERICA AND THE CARRIBEAN – COUNTRY PROFILES – COSTA RICA
PENSIONS AT A GLANCE: LATIN AMERICA AND THE CARIBBEAN © OECD, THE WORLD BANK AND IDB 2014108
There are additional payments for health and maternity insurance, IMAS and INA.
Contributions to individual accounts equal to 4.25% of wages, of which 1%point is
contributed by the worker and the rest by the employer. Contributions to individual
accounts are charged a commission, which is approximately 8% of returns or 4% of
contributions.
Contributions to the defined benefit or individual capitalisation scheme are made to
the Banco Popular Workers Pension Fund (FLC) and the ROP. The Banco Popular purchases
the financing of supplementary pensions. The Workers Pension Fund is a savings fund
comprising the 3% employer contribution of salaries reported to the CCSS on behalf of
workers. This percentage is accredited to individual accounts, which are owned by the
workers. Every March, 50% of the resources that have been contributed to this individual
account are transferred to the ROP. If the worker desires, they can make a supplemental
contribution to the ROP with resources of the FCL. This contribution is registered as a
sub-account within the individual ROP account.
Contributions to the IVM (disability, old age or death) will be increased until 2035 as
follows:
Taxation of pensioners
Pensions are taxable using the same scale that applies to workers’ earnings.
Item Employer (%) Worker (%) State (%) Total (%)
Pension (old age, disability) 4.92 2.67 0.41 8.00
Other social security contributions
Health and maternity insurance 9.25 5.50 0.25 15.00
Instituto Mixto de Ayuda Social (IMAS) 0.50 - - 0.50
Instituto Nacional de Aprendizaje (INA) 1.50 - - 1.50
Employer (%) Worker (%) Others (%) Total (%)
Pillar 2 – Complementary 3.25 1.00 4.25
Banco Popular 0.25 1.00 1.25
Workers Pension Fund(Fondo de Capitalización Laboral-FCL)
1.5 1.5
Mandatory Pension System(Régimen Obligatorio de Pensiones – ROP)
1.5 50% of the FCL +interest (annual)
1.5% + (0.5 + i)FCL
Total (%) Employer (%) Worker (%) State (%)
Until 31 December 2009 7.50 4.75 2.50 0.25
From 1 January 2010 to 31 December 2014. 8.00 4.92 2.67 0.41
From 1 January 2015 to 31 December 2019. 8.50 5.08 2.84 0.58
From 1 January 2020 to 31 December 2024 9.00 5.25 3.00 0.75
From 1 January 2025 to 31 December 2029 9.50 5.42 3.17 0.91
From 1 January 2030 to 31 December 2034 10.00 5.58 3.33 1.09
From 1 January2035 and beyond 10.50 5.75 3.50 1.25
4. PENSIONS AT A GLANCE/LATIN AMERICA AND THE CARRIBEAN – COUNTRY PROFILES – COSTA RICA
PENSIONS AT A GLANCE: LATIN AMERICA AND THE CARIBBEAN © OECD, THE WORLD BANK AND IDB 2014 109
Social security contributions paid by pensioners
The cost of social security insurance for pensioners receiving disability, old age and
death scheme is covered entirely by the Disability, Old and Death Pension Fund. Pensioners
under this scheme do not contribute to social security.
Social assistance programmes for old-age population
Social welfare pension
There is a non-contributory basic pension (RNC) for people aged 65 and over for
disability or survival that does not fall within the contributory regimes and is only for the
needy. The amount of the benefit is CRC 70 125 per month. This programme is managed by
the CCSS and financed with resources from the Social Development and Family Assistance
Fund and certain specific taxes.

4. PENSIONS AT A GLANCE/LATIN AMERICA AND THE CARRIBEAN – COUNTRY PROFILES – COSTA RICA
PENSIONS AT A GLANCE: LATIN AMERICA AND THE CARIBBEAN © OECD, THE WORLD BANK AND IDB 2014110
Pension modelling results: Costa Rica
MenMedian earner
Individual earnings, multiple of average
Women (where different) 0.5 0.75 1.0 1.5 2.0
Gross relative pension level 64.3 43.8 59.6 79.4 119.1 158.8
(% average gross earnings)
Net relative pension level 68.5 46.6 63.4 84.5 126.8 169.1
(% net average earnings)
Gross replacement rate 79.4 87.7 79.4 79.4 79.4 79.4
(% individual gross earnings)
Net replacement rate 83.9 90.3 83.6 84.5 85.5 86.0
(% individual net earnings)
Gross pension wealth 13.4 14.8 13.4 13.4 13.4 13.4
(multiple of individual gross earnings) 14.9 16.4 14.9 14.9 14.9 14.9
Net pension wealth 13.4 14.8 13.4 13.4 13.4 13.4
(multiple of individual gross earnings) 14.9 16.4 14.9 14.9 14.9 14.9
1 2 http://dx.doi.org/10.1787/888933161658
0 0.25 0.50 0.75 1.00 1.25 1.50 1.75 2.00 0 0.25 0.50 0.75 1.00 1.25 1.50 1.75 2.00
0 0.25 0.50 0.75 1.00 1.25 1.50 1.75 2.00 0 0.25 0.50 0.75 1.00 1.25 1.50 1.75 2.00
2.5
2.0
1.5
1.0
0.5
0
2.5
2.0
1.5
1.0
0.5
0
1.25
1.00
0.75
0.50
0.25
0
1.25
1.00
0.75
0.50
0.25
0
Gross relative pension level Gross replacement rate
Net and gross relative pension levels Net and gross replacement rates
Individual earnings, proportion of average earnings Individual earnings, proportion of average earnings
Proportion of economy-wide average earnings Proportion of individual earnings
Proportion of economy-wide average earnings Proportion of individual earnings
Individual earnings, proportion of average earnings Individual earnings, proportion of average earnings
GrossNet
Earnings-relatedDC

4. PENSIONS AT A GLANCE/LATIN AMERICA AND THE CARRIBEAN – COUNTRY PROFILES – DOMINICAN REPUBLIC
PENSIONS AT A GLANCE: LATIN AMERICA AND THE CARIBBEAN © OECD, THE WORLD BANK AND IDB 2014 111
Dominican Republic
Dominican Republic:Pension system 2010
The pension system is a contributoryscheme, based on individual capitalisationaccounts. All workers, both public andprivate, and their employers mustcontr ibute to their respect ivecapitalisation accounts and must pay aninsurance premium for disability andsurvivor coverage. A minimum pensionis guaranteed.
Key indicators
DominicanRepublic
LAC26
Average earnings DOP 188 900 259 400
USD 5 100 7 000
Public pension spending % GDP 4.6 3.1
Life expectancy At birth 73.4 73.6
At age 65 18.4 17.4
Population over age 65 % of working-age population 11.5 12.3
Qualifying conditionsWorkers with at least 30 years of contributions can retire at the age of 60. Earlier
retirement is also possible from age 55 regardless of the number of contributory years if the
person has sufficient funds to withdraw an annuity greater than 50% of the minimum
pension. Insured persons over age 65 who have contributed for a minimum of 25 years are
eligible for a guaranteed minimum pension.
Individuals over 60 years of age who have been inactive in the system for the
preceding three months upon reaching retirement age and who have not contributed for
the required number of months, the accumulated balance in their individual capitalisation
account will be returned to them.
Benefit calculation
Defined benefit
The defined-benefit schemes that cover public employees and a limited segment of
formal workers in the private sector currently offer old-age insurance coverage to a closed
group of affiliates aged 45 or older at the time that the law went into effect (this law
enabled them to remain covered by these schemes).
New labour-market participants must enter into the mandatory scheme of the new
Dominican Pension System, including those affiliated to the previous schemes and who
were under age 45 when the reform went into effect.
Targeted
The minimum pension of the mandatory scheme is equivalent to the lowest legal
minimum wage in the country, approximately 44% of the average monthly contribution
base wage on 31 December 2010.

4. PENSIONS AT A GLANCE/LATIN AMERICA AND THE CARRIBEAN – COUNTRY PROFILES – DOMINICAN REPUBLIC
PENSIONS AT A GLANCE: LATIN AMERICA AND THE CARIBBEAN © OECD, THE WORLD BANK AND IDB 2014112
Defined contribution
Workers and employers contribute 2.87% and 7.10% of contribution base wages,
respectively, for old-age, disability and survivors insurance. Of this amount, 8.0 percentage
points are allocated to individual capitalisation accounts. Disability and survivor insurance
premiums are established by law up to a maximum of 1.0% of the contributory wages, and
administrative fees are established by law up to a maximum of 0.5% of wages, although the
pension fund management companies also charge up to 30% of the returns on investments
above a certain threshold. There is, also, a charge of 0.07% to finance the Superintendent of
Pensions’ operating costs, and a contribution of 0.4% for the Social Solidarity Fund. Benefits
can be drawn as programmed retirement or annuities indexed to the consumer price
index.
Variant careers
Early retirement
Early retirement is possible. Anyone who meets the age and contributory
requirements for unemployment due to old age can claim a pension. It is also possible to
retire at age 55 if the individual account balance is sufficient to enable an annuity of at
least 150% of the minimum pension.
Late retirement
It is possible to defer pension claiming until after the retirement age of 60.
Personal income tax and social security contributions
Taxation of workers
Social security contributions paid by workers
Insured individuals contribute 2.87% of their wages for old-age, disability and survivors
insurance, insured persons and the employer contribute 7.10%. The minimum contributory
wage for 2010 was DOP 5 635. The minimum contributory wage is derived from averaging
private sector minimum wages. The legal monthly minimum wage for public-sector workers
is DOP 2 600. For family health insurance under the defined-contribution scheme, the
insured person contributes 3.04% and the employer 7.09%. The minimum contributory wage
is equal to the legal minimum wage of the sector in which the insured worker belongs; the
maximum contributory wage is 20 times the legal minimum wage.
Taxation of pensioners
Contributions to Social Security as well as reserves and interest generated by pension
funds are exempt from taxes and direct or indirect charges; likewise, pensions that do not
exceed five times the national minimum wage are exempt from taxes and direct or indirect
charges.
Annual scale 2010 (DOP) Rate
Up to 349 326.00 Exempt
349 326.01-523 988.00 15% above 349 326.01
523 988.01-727 761.01 26 199.00 plus 20% above 523 988.01
727 761.01 and above 466 954.00 plus 25% above 727 761.01

4. PENSIONS AT A GLANCE/LATIN AMERICA AND THE CARRIBEAN – COUNTRY PROFILES – DOMINICAN REPUBLIC
PENSIONS AT A GLANCE: LATIN AMERICA AND THE CARIBBEAN © OECD, THE WORLD BANK AND IDB 2014 113
Social security contributions paid by pensioners
Disabled pensioners must continue to pay old-age, disability, and survivor insurance
and family health insurance at the following rates; 9.97% for old-age, disability and
survivor insurance and 3.0% for family health insurance.
Pensioners receiving old-age pensions under the mandatory regime pay for family
health insurance. The National Social Security Council establishes the contribution rates to
the family health insurance by pensioners and retirees under both the mandatory and the
subsidised mandatory regimes, in accordance with their social and economic condition,
attempting to ensure the greatest possible welfare.
Social assistance programmes for old-age population
Social assistance pension
There is a non-contributory social assistance pension equivalent to 60% of the public
sector minimum wage (DOP 5 117.50 in 2012), resulting in a social assistance pension
benefit of DOP 3 070.50.

4. PENSIONS AT A GLANCE/LATIN AMERICA AND THE CARRIBEAN – COUNTRY PROFILES – DOMINICAN REPUBLIC
PENSIONS AT A GLANCE: LATIN AMERICA AND THE CARIBBEAN © OECD, THE WORLD BANK AND IDB 2014114
Pension modelling results: Dominican Republic
MenMedian earner
Individual earnings, multiple of average
Women (where different) 0.5 0.75 1.0 1.5 2.0
Gross relative pension level 18.5 11.4 17.1 22.8 34.2 45.6
(% average gross earnings)
Net relative pension level 19.2 11.8 17.8 23.7 35.5 47.4
(% net average earnings)
Gross replacement rate 22.8 22.8 22.8 22.8 22.8 22.8
(% individual gross earnings)
Net replacement rate 23.6 23.2 23.5 23.7 23.8 24.2
(% individual net earnings)
Gross pension wealth 4.2 4.2 4.2 4.2 4.2 4.2
(multiple of individual gross earnings) 4.6 4.6 4.6 4.6 4.6 4.6
Net pension wealth 4.2 4.2 4.2 4.2 4.2 4.2
(multiple of individual gross earnings) 4.6 4.6 4.6 4.6 4.6 4.6
1 2 http://dx.doi.org/10.1787/888933161668
0 0.25 0.50 0.75 1.00 1.25 1.50 1.75 2.00 0 0.25 0.50 0.75 1.00 1.25 1.50 1.75 2.00
0 0.25 0.50 0.75 1.00 1.25 1.50 1.75 2.00 0 0.25 0.50 0.75 1.00 1.25 1.50 1.75 2.00
2.5
2.0
1.5
1.0
0.5
0
2.5
2.0
1.5
1.0
0.5
0
1.25
1.00
0.75
0.50
0.25
0
1.25
1.00
0.75
0.50
0.25
0
Gross relative pension level Gross replacement rate
Net and gross relative pension levels Net and gross replacement rates
Individual earnings, proportion of average earnings Individual earnings, proportion of average earnings
Proportion of economy-wide average earnings Proportion of individual earnings
Proportion of economy-wide average earnings Proportion of individual earnings
Individual earnings, proportion of average earnings Individual earnings, proportion of average earnings
GrossNet
DC

4. PENSIONS AT A GLANCE/LATIN AMERICA AND THE CARRIBEAN – COUNTRY PROFILES – ECUADOR
PENSIONS AT A GLANCE: LATIN AMERICA AND THE CARIBBEAN © OECD, THE WORLD BANK AND IDB 2014 115
Ecuador
Ecuador: Pension system in 2010
The pension system is a defined-benefitsystem based on earnings. There is also anon-contributory system for the elderlyin need.
Key indicators
Ecuador LAC26
Average income USD 4 400 7 000
USD 4 400 7 000
Public pension spending % of GDP 1.3 3.1
Life expectancy At birth 76.4 73.6
At age 65 19.6 17.4
Population over 65 % of working-age population 11.9 12.3
Qualifying conditionsPension benefits can be withdrawn at any age with at least 40 years of contributions.
Old-age pension benefits can be withdrawn at age 60 for those with 30 years of
contributions; at age 65 with 15 years; and at age 70 with 12 years of contributions. Special
rules apply for the armed forces and the police who can retire after 25 years of service.
Benefit calculation
Old-age pension
The monthly old-age pension benefit is equal to a percentage of the average base
income for contributions for the last five years that the insured worked. The percentage
varies depending on the total number of years of contributions (50% for ten years, 75% for
30 years, 81.25% for 35 years and 100% for 40 years).
The minimum income for contribution calculation purposes for workers in
microenterprises is USD 185, USD 200 for household workers, USD 218 for private-sector
workers and USD 370 for public-sector workers.
There is no maximum income for contribution calculation purposes.
The minimum monthly pension established for January 2010 has a floor of 50% of the
Unified Basic Salary (SBU), which was equal to USD 120.00 and a ceiling of USD 1 308.00.
Pension benefits are increase discreetly by political decisions. Pensions between
USD 120.00 and USD 500.00 were raised by USD 48.00, while those above USD 500.00 were
raised by USD 40.15.
Minimum pension
Years of contributions Minimum pension (%)
Up to10 years 50 SBU
11-20 years 60 SBU
21-30 years 70 SBU
31-35 years 80 SBU
30- 39 years 90 SBU
40 or more years 100 SBU

4. PENSIONS AT A GLANCE/LATIN AMERICA AND THE CARRIBEAN – COUNTRY PROFILES – ECUADOR
PENSIONS AT A GLANCE: LATIN AMERICA AND THE CARIBBEAN © OECD, THE WORLD BANK AND IDB 2014116
Old-age pensioners may continue to work after they begin pension benefit receipt. However
it is not possible to receive a pension benefit and work for the same employer in the first year.
The pensions are paid monthly and there are two additional bonus payments.
Benefits are adjusted annually in line with earnings, and according to the progressive
SBU scale. Old-age pensions are increased in January.
Career variants
Early retirement
Early retirement is not possible until the contribution requirements are met. Early
retirement is, however, possible for reasons of disability with at least two years of
contributions to the system.
Late retirement
It is possible to defer pension’s withdrawal beyond the age of 65.
Personal income tax and social security contributions
Taxation of workers
Individual income tax rate ranges from 5% to 35% with eight income brackets.
Maximum old-age pension
Years of contributions Pension
10-14 years 2.5 SBU
15-19 years 3 SBU
20-24 years 3.5 SBU
25-29 years 4 SBU
30- 34 years 4.5 SBU
35-39 years 5 SBU
40 or more years 5.5 SBU
Ranges of pension by unified base salary (SBU) Growth coefficient (%)
Up to 0.5 SBU 16.16
0.501 SBUM-1 SBU 12.14
1.01 SBUM-1.50 SBU 9.53
1.501 SBUM-2 SBU 7.31
2.01 SBUM-2.5 SBU 5.61
Greater than 2.501 SBU 4.31
Income taxation, 2010
Basic fraction Additional amount up to Tax on basic fraction Tax on excess of basic fraction (%)
0.00 8 910 0 0
8.910 11 350 0 5
11.350 14 190 122 10
14.190 17 030 406 12
17.030 34 060 747 15
34.060 51 080 3 301 20
51.080 68 110 6 705 25
68.110 90 810 10 963 30
90.810 And above 17 773 35

4. PENSIONS AT A GLANCE/LATIN AMERICA AND THE CARRIBEAN – COUNTRY PROFILES – ECUADOR
PENSIONS AT A GLANCE: LATIN AMERICA AND THE CARIBBEAN © OECD, THE WORLD BANK AND IDB 2014 117
Social security contributions paid by workers
In 2010, private sector employees contributed 9.35% of their earnings. This includes
health, work-related injury and unemployment benefits. The employer’s contribution to
social security is 11.15%.
Taxation of pensioners
Pensioners do not pay VAT (they are reimbursed for value-added taxes). Additionally,
they are given a 50% discount on all basic services.
Social security contributions paid by pensioners
Pensioners do not contribute to social security. If a pensioner decides to return to
work, his/her pension is suspended and he/she receives only a salary, with the
corresponding deductions.
Social assistance programmes for old-age population
Social welfare pension
The Development Voucher (El Bono de Desarrollo) is granted to pensioners who are
over 65, in extreme poverty, and disabled. They can choose to receive a monetary benefit of
USD 35.00 per month per person. According to the results obtained by the Social Registry in
establishing the poverty line, any person who falls under the poverty line is eligible for this
benefit.

4. PENSIONS AT A GLANCE/LATIN AMERICA AND THE CARRIBEAN – COUNTRY PROFILES – ECUADOR
PENSIONS AT A GLANCE: LATIN AMERICA AND THE CARIBBEAN © OECD, THE WORLD BANK AND IDB 2014118
Pension modelling results: Ecuador
MenMedian earner
Individual earnings, multiple of average
Women (where different) 0.5 0.75 1.0 1.5 2.0
Gross relative pension level 76.3 47.1 70.6 94.2 141.2 188.3
(% average gross earnings)
Net relative pension level 83.7 51.7 77.5 103.3 155.0 206.6
(% net average earnings)
Gross replacement rate 94.2 94.2 94.2 94.2 94.2 94.2
(% individual gross earnings)
Net replacement rate 103.2 102.8 103.2 103.3 103.5 103.6
(% individual net earnings)
Gross pension wealth 23.2 23.2 23.2 23.2 23.2 23.2
(multiple of individual gross earnings) 25.6 25.6 25.6 25.6 25.6 25.6
Net pension wealth 23.2 23.2 23.2 23.2 23.2 23.2
(multiple of individual gross earnings) 25.6 25.6 25.6 25.6 25.6 25.6
1 2 http://dx.doi.org/10.1787/888933161679
0 0.25 0.50 0.75 1.00 1.25 1.50 1.75 2.00 0 0.25 0.50 0.75 1.00 1.25 1.50 1.75 2.00
0 0.25 0.50 0.75 1.00 1.25 1.50 1.75 2.00 0 0.25 0.50 0.75 1.00 1.25 1.50 1.75 2.00
2.5
2.0
1.5
1.0
0.5
0
2.5
2.0
1.5
1.0
0.5
0
1.25
1.00
0.75
0.50
0.25
0
1.25
1.00
0.75
0.50
0.25
0
Gross relative pension level Gross replacement rate
Net and gross relative pension levels Net and gross replacement rates
Individual earnings, proportion of average earnings Individual earnings, proportion of average earnings
Proportion of economy-wide average earnings Proportion of individual earnings
Proportion of economy-wide average earnings Proportion of individual earnings
Individual earnings, proportion of average earnings Individual earnings, proportion of average earnings
GrossNet
Earnings-related

4. PENSIONS AT A GLANCE/LATIN AMERICA AND THE CARRIBEAN – COUNTRY PROFILES – EL SALVADOR
PENSIONS AT A GLANCE: LATIN AMERICA AND THE CARIBBEAN © OECD, THE WORLD BANK AND IDB 2014 119
El Salvador
El Salvador: Pension systemin 2010
The pension system in El Salvadorconsists of a privately managed defined-contribution scheme. A guaranteedminimum pension requires 25 years ofcontributions by the minimum retirementage.
Key indicators
El Salvador LAC26
Average income USD 3 700 61 000
USD 400 7 000
Public pension spending % of GDP 1.7 3.1
Life expectancy At birth 72.3 73.6
At age 65 18.3 17.4
Population over age 65 % of working-age population 13.9 12.3
Qualifying conditionsThe pensionable age is 60 for men and 55 for women with 25 years of contributions.
Retirement is also permitted if an individual can claim an annuity equal to 60% of the base
earnings for contribution purposes or 160% of the minimum pension. Twenty-five years of
contributions are required to qualify for a minimum pension.
Benefit calculationDefined contribution
Employees and employers contribute 6.25% and 6.75%, respectively, and, of these
amounts, 10.3%points (increasing to 10.8% from April 2012) is allocated to individual
savings accounts. A maximum of 2.7% (decreasing to 2.2% from April 2012) of earnings for
benefit calculation purposes is used to finance disability and survivors insurance and the
administrative costs. Benefits can be received as defined benefits, annuities, or a
combination of the two.
In the individual savings account system, those who do not meet the minimum
requirements to obtain a pension are refunded the balance in their individual accounts. They
can elect to receive it in a lump sum or in six annual payments. In the latter case, they have the
right to receive health insurance coverage, the cost of which is withheld from the payments.
Targeted
The minimum amount of an old-age and full disability pension in 2010 was
USD 143.64, and for partial disability it was USD 100.55.
Variant careersEarly retirement
Early retirement is possible. Employees or self-employed, can claim a pension before
reaching retirement age or without having the minimum of 25 years of contributions when
the individual pension savings balance is sufficient to finance a pension of 60% or more
than the base salary, which is equal to or above 160% of the minimum pension. These
pensions are considered early retirement pensions, and the penalty is that they do not
carry the government’s minimum pension guarantee. There is no age restriction for
claiming this pension.

4. PENSIONS AT A GLANCE/LATIN AMERICA AND THE CARRIBEAN – COUNTRY PROFILES – EL SALVADOR
PENSIONS AT A GLANCE: LATIN AMERICA AND THE CARIBBEAN © OECD, THE WORLD BANK AND IDB 2014120
Late retirement
Employees or self-employed persons, can delay claiming a pension after reaching
retirement age since the pension is a right that can be exercised at the affiliate’s will, and
there is no penalty with respect to the old-age pension. If upon reaching retirement age the
affiliate has not exercised his/her right and he/she becomes disabled or dies, he/she or
their beneficiaries will receive the equivalent of the old-age pension at that moment,
absolving the pension management company from any further responsibility. There are no
incentives to delay the pension unless a person continues contributing, in which case the
account continues to grow.
Personal income tax and social security contributions
Taxation of workers
No taxes are paid on incomes below USD 2 514.29. Income above that amount up to
USD 6 628.57 pay a tax in the amount of USD 57.14 plus 10% above USD 2 514.29; between
USD 6 628.57 and USD 20 342.85 the tax rate is 20%; and incomes above USD 20 342.85 are
taxed at 30%.
Social security contributions paid by workers
The contribution for health, workmen’s compensation and pension is 10.5% of
earnings. For the first two, the worker contributes 3% on earnings up to USD 685.71, and for
the pension, they pay 6.25% of the declared earnings up to a maximum of earnings for
contribution purposes of USD 5 354.52.
Taxation of pensioners
Pensions as personal earnings are exempt from income tax or any other tax rate or
municipal tax. Pensions of officials and public or municipal employees are constitutionally
protected against taxation.
Social security contributions paid by pensioners
Contributions paid by pensioners are 7.8% for health insurance up to a maximum of
USD 685.71.
Indexation of pensionsIn the Pension Savings System – of individual accounts – only the minimum pensions
are adjusted annually by the Ministry of Finance in the Law on the State Budget, taking into
account the relative variation in the minimum wage for contribution calculation purposes
and available resources of the central government.
For the fiscal exercise of 2009, starting on 1 January, the monthly pensions of the
Public Pension System – the pay-as-you-go system– between USD 130.58 to USD 300.00,
were adjusted for inflation by 10%. Additionally, the minimum total old-age and disability
pension was set at USD 143.64 per month, and the minimum partial disability pension was
set at USD 100.55. These increases were also applied to the both the full and the partial
minimum old-age and disability pensions in the Pension Savings System, that is, the
defined-contribution system.

4. PENSIONS AT A GLANCE/LATIN AMERICA AND THE CARRIBEAN – COUNTRY PROFILES – EL SALVADOR
PENSIONS AT A GLANCE: LATIN AMERICA AND THE CARIBBEAN © OECD, THE WORLD BANK AND IDB 2014 121
Social assistance programmes for old-age population
Social pension
The Rural Solidarity Communities programme assists residents of the country’s
32 poorest municipalities. This programme includes a benefit called Universal Basic
Pension, consisting of a payment of a pension in the amount of USD 50.00 for people over
age 70 who have no other source of income, and who are covered by the Rural Solidarity
Communities programme.

4. PENSIONS AT A GLANCE/LATIN AMERICA AND THE CARRIBEAN – COUNTRY PROFILES – EL SALVADOR
PENSIONS AT A GLANCE: LATIN AMERICA AND THE CARIBBEAN © OECD, THE WORLD BANK AND IDB 2014122
Pension modelling results: El Salvador
MenMedian earner
Individual earnings, multiple of average
Women (where different) 0.5 0.75 1.0 1.5 2.0
Gross relative pension level 46.6 46.6 46.6 46.6 46.6 58.3
(% average gross earnings) 46.6
Net relative pension level 45.2 45.2 45.2 45.2 45.2 57.0
(% net average earnings) 45.2
Gross replacement rate 57.5 93.1 62.1 46.6 31.0 29.2
(% individual gross earnings) 23.3
Net replacement rate 54.4 85.4 58.1 45.2 31.2 30.1
(% individual net earnings) 23.9
Gross pension wealth 10.6 17.2 11.5 8.6 5.7 5.4
(multiple of individual gross earnings) 13.0 21.1 14.1 10.6 7.0 5.3
Net pension wealth 10.6 17.2 11.5 8.6 5.7 5.4
(multiple of individual gross earnings) 11.6 18.8 12.5 9.4 6.3 4.7
1 2 http://dx.doi.org/10.1787/888933161682
0 0.25 0.50 0.75 1.00 1.25 1.50 1.75 2.00 0 0.25 0.50 0.75 1.00 1.25 1.50 1.75 2.00
0 0.25 0.50 0.75 1.00 1.25 1.50 1.75 2.00 0 0.25 0.50 0.75 1.00 1.25 1.50 1.75 2.00
2.5
2.0
1.5
1.0
0.5
0
2.5
2.0
1.5
1.0
0.5
0
1.25
1.00
0.75
0.50
0.25
0
1.25
1.00
0.75
0.50
0.25
0
Gross relative pension level Gross replacement rate
Net and gross relative pension levels Net and gross replacement rates
Individual earnings, proportion of average earnings Individual earnings, proportion of average earnings
Proportion of economy-wide average earnings Proportion of individual earnings
Proportion of economy-wide average earnings Proportion of individual earnings
Individual earnings, proportion of average earnings Individual earnings, proportion of average earnings
GrossNet
DC

4. PENSIONS AT A GLANCE/LATIN AMERICA AND THE CARRIBEAN – COUNTRY PROFILES – GUATEMALA
PENSIONS AT A GLANCE: LATIN AMERICA AND THE CARIBBEAN © OECD, THE WORLD BANK AND IDB 2014 123
Guatemala
Guatemala:Pension system in 2010
The pension system consists of apublic defined-benefit scheme.
Key indicators
Guatemala LAC26
Average income GTQ 21 900 55 900
USD 2 700 7 000
Public pension spending % of GDP 0.8 3.1
Life expectancy At birth 71.9 73.6
At age 65 17.7 17.4
Population over 65 % of the working-age population 10.3 12.3
Qualifying conditionsIn 2010, the retirement age was 60 with at least 180 months (15 years) of contributions.
In 2011 and 2012, at least 192 months (16 years) of contributions will be required.
Starting in 2013, the contribution requirement will be increased to 204 months, and
starting in 2014, it will be increased to 216 months.
Benefit calculation
Old-age pension
The value of the old-age pension in 2010 was equal to 50% of the average wage in the
preceding 60 months, plus 0.5% for every six months of contributions exceeding
120 months.
In 2010, an additional 10% of the amount of the pension for each of the insured’s
dependents was allocated and is paid to the wife or partner or disabled spouse, each minor
child under 18 and disabled children over 18, or the dependent mother and dependent
disabled father who are not themselves receiving a pension. In 2011 and until
September 2012, this 10% was paid to the insured and calculated on the base earnings
regardless of the existence of dependents.
The pension is paid in 12 payments a year plus an additional payment every December
for the same amount as the monthly amount (that is, there are 13 payments per year), plus
a voucher in December for GTQ 500, called the Annual Family Bonus.
The minimum monthly pension is GTQ 340. However, in view of the extra payment
mentioned in the preceding paragraph, the average minimum monthly pension is GTQ 410
per month.
The minimum earnings for calculation purposes is GTQ 6 000. The maximum pension
can reach 80% of the maximum earnings for calculation purposes, or GTQ 4 800.
The base compensation is calculated based on the average wage in the last five years,
with a maximum amount of GTQ 6 000.
If an insured does not meet the minimum requirements of age and number of
contributions, upon request, 70% of the contributions will be returned to him or her.

4. PENSIONS AT A GLANCE/LATIN AMERICA AND THE CARRIBEAN – COUNTRY PROFILES – GUATEMALA
PENSIONS AT A GLANCE: LATIN AMERICA AND THE CARIBBEAN © OECD, THE WORLD BANK AND IDB 2014124
Benefits are adjusted periodically based on actuarial variations in the programme. If
the actuarial evaluation includes a basic increase of 6%, this is not regulated. In practice,
the increases have been between 2% and 4% every two years.
Variant careers
Early retirement
There is no early retirement before age 60.
Late retirement
Upon reaching age 60, the insured can apply for a pension from the Guatemalan Social
Security Institute (IGSS) at any time, as long as they have made the required number of
contributions. For each additional six months, the retirement pension is increased by 0.5%
over what it would have been. This is an incentive to defer retirement.
Personal income tax and social security contributions
Taxation of workers
There is an income subsidy of up to GTQ 36 000 per year. For additional incomes up to
GTQ 65 000 the tax is 15%; from GTQ 65 001 to GTQ 180 000 it is 20%; from GTQ 180 001 to
GTQ 295 000 it is 25%, and for incomes above GTQ 295 000 it is 31%.
Social security contributions paid by workers
These contributions are equal to 1.83% of the base contribution wage. The minimum
contribution income for contribution calculation purposes is equal to the daily minimum
wage. There is no maximum income for contribution calculation purposes.
In Guatemala, minimum wages are paid to agricultural, non-agricultural, and factory
workers.
In addition to contributing 1.83% of their earnings to the disability, old-age and
survivors programme, employees contribute 1% for accident insurance and 2% for sickness
and maternity, for a total of 4.83%.
The employer contributes 3.67% of employees’ earnings to the disability, old-age and
survivors programme.
The state is supposed to pay the equivalent of 25% of the benefits paid; however, it has
never done so.
The employer contributes 7% of the workers’ earnings to the health insurance, the
sickness, maternity, and accidents programme. The state is supposed to contribute 25% of
the earnings, but it has never done so.
Taxation of pensioners
Pensioners do not pay taxes on pensions.
Agricultural and non-agricultural Factory
2010 Q 56/ay Q 51.75/day
2011 Q 63.7/day Q 59.45/day
2012 Q 68/day Q 62.5/day

4. PENSIONS AT A GLANCE/LATIN AMERICA AND THE CARRIBEAN – COUNTRY PROFILES – GUATEMALA
PENSIONS AT A GLANCE: LATIN AMERICA AND THE CARIBBEAN © OECD, THE WORLD BANK AND IDB 2014 125
Social security contributions paid by pensioners
Pensioners do not contribute. If they choose to continue working, pensioners
contribute only to sickness, maternity and accident insurance, which is 3% of their salary.
Social assistance programmes for old-age population
Social pension
There is a non-contributory pension for people over 65 years of age who are needy. The
beneficiaries of this programme are Guatemalan, as defined in Article 144 of the
Constitution, who can demonstrate, through a socioeconomic assessment conducted by a
social worker, that they lack economic resources and are extremely poor. Since 2007, the
payment to beneficiaries who have met these legal requirements is GTZ 400.00 per month.

4. PENSIONS AT A GLANCE/LATIN AMERICA AND THE CARRIBEAN – COUNTRY PROFILES – GUATEMALA
PENSIONS AT A GLANCE: LATIN AMERICA AND THE CARIBBEAN © OECD, THE WORLD BANK AND IDB 2014126
Pension modelling results: Guatemala
MenMedian earner
Individual earnings, multiple of average
Women (where different) 0.5 0.75 1.0 1.5 2.0
Gross relative pension level 54.9 33.9 50.8 67.8 101.7 135.6
(% average gross earnings)
Net relative pension level 56.8 35.0 52.6 70.1 105.1 140.1
(% net average earnings)
Gross replacement rate 67.8 67.8 67.8 67.8 67.8 67.8
(% individual gross earnings)
Net replacement rate 69.9 69.9 69.9 70.1 70.5 72.2
(% individual net earnings)
Gross pension wealth 14.5 14.5 14.5 14.5 14.5 14.5
(multiple of individual gross earnings) 16.4 16.4 16.4 16.4 16.4 16.4
Net pension wealth 14.5 14.5 14.5 14.5 14.5 14.5
(multiple of individual gross earnings) 16.4 16.4 16.4 16.4 16.4 16.4
1 2 http://dx.doi.org/10.1787/888933161696
0 0.25 0.50 0.75 1.00 1.25 1.50 1.75 2.00 0 0.25 0.50 0.75 1.00 1.25 1.50 1.75 2.00
0 0.25 0.50 0.75 1.00 1.25 1.50 1.75 2.00 0 0.25 0.50 0.75 1.00 1.25 1.50 1.75 2.00
2.5
2.0
1.5
1.0
0.5
0
2.5
2.0
1.5
1.0
0.5
0
1.25
1.00
0.75
0.50
0.25
0
1.25
1.00
0.75
0.50
0.25
0
Gross relative pension level Gross replacement rate
Net and gross relative pension levels Net and gross replacement rates
Individual earnings, proportion of average earnings Individual earnings, proportion of average earnings
Proportion of economy-wide average earnings Proportion of individual earnings
Proportion of economy-wide average earnings Proportion of individual earnings
Individual earnings, proportion of average earnings Individual earnings, proportion of average earnings
GrossNet
Earnings-related

4. PENSIONS AT A GLANCE/LATIN AMERICA AND THE CARRIBEAN – COUNTRY PROFILES – GUYANA
PENSIONS AT A GLANCE: LATIN AMERICA AND THE CARIBBEAN © OECD, THE WORLD BANK AND IDB 2014 127
Guyana
Guyana: Pension system in 2010
The pension system consists of anearnings-related component and anold-age grant for those with some butinsufficient contributions.
Key indicators
Guyana LAC26
Average earnings GYD 584 200 1 416 900
USD 2 900 7 000
Public pension spending % of GDP 0.1 3.1
Life expectancy At birth 66.2 73.6
At age 65 13.0 17.4
Population over age 65 % of working-age population 6.6 12.3
Qualifying conditionsAge 60 with at least 750 weeks of paid or credited contributions, including at least
150 weeks of paid contributions; 25 weeks of contributions are credited for each year that
the insured was older than age 35 in 1969, up to 600 weeks. Retirement is not necessary.
The old-age grant is paid if the insured does not satisfy the qualifying conditions for an
old-age pension but had at least 50 weeks of contributions before age 60.
Benefit calculation
Old-age pension
The pension is 40% of the insured’s average weekly covered earnings plus 1% of
average weekly covered earnings for each 50-week period of contributions exceeding 750.
Average weekly covered earnings are based on the insured’s best three years of earnings in
the last five years before age 60.
The maximum weekly earnings for benefit calculation purposes are GYD 29 193. The rate
of pension however, must not be less than 50% of the existing Public Service Minimum Wage
and not greater than 60% of the Average Weekly Insurable Earnings. The public sector monthly
minimum wage is GYD 33 207. Average weekly insurance earnings were GYD 29 193.
In order to calculate the benefits, one needs to obtain the contribution record for the
last five years worked before the age of 60 when the contributor paid at least 13 weeks (or
three months) of annual contributions. Of those last five years, the best three years of
contributions are picked to do the sum:
Sum the number of Contribution Weeks
Weekly pension = (0.4a) + (0.01a) for each group of fifty – (50 contributions over 750)
One (1) year refers to twelve (12) months before the birth month of the Insured Person.
“Best” year means the year with the highest Annual Insurable Earnings.
When the entitled pension is calculated, it is then compared to the minimum pension
at the time the insured person turns 60. If the calculated pension is less, the pensioner is
paid the minimum pension. Otherwise, the pensioner is paid the calculated pension.
Old-age pensions are adjustments to from time to time.
Sum the Annual Insurable EarningsSum the number of Contribution Weekks
Average Weekly Insurance Earnings a ( )

4. PENSIONS AT A GLANCE/LATIN AMERICA AND THE CARRIBEAN – COUNTRY PROFILES – GUYANA
PENSIONS AT A GLANCE: LATIN AMERICA AND THE CARIBBEAN © OECD, THE WORLD BANK AND IDB 2014128
Old-age grant
An Old Age Grant is a single payment. The grant is equal to 8.3% of the insured’s
average annual covered earnings multiplied by the number of 50-week periods of paid or
credited contributions, as follows:
● Obtain the total contribution record
● Obtain the annual insurable earnings for each year of contribution
● Sum the annual insurable earnings for all the years of contributions
● Sum the number of contribution weeks for all the years of contributions
● Divide item (c) by item (d) = Average weekly insurable earnings
● Multiply item (e) by 52 = Average annual insurable earnings
● Grant = 1/12 × item (f) × Number of groups of fifty- (50) Contributions
(in total contribution record).
One (1) year refers to a calendar year.
Variant careers
Early retirement
Early retirement is possible from the age of 60.
Late retirement
Late retirement is possible and a person who qualifies for pension is entitled to 40% of
his or her relevant wage for the first 750 contributions, and an additional 1% for each
complete block of 50 contributions above 750. For example, a person with
1 222 contributions would be entitled to (40 + 9) = 49%. No person is entitled to more than
60% of his relevant wage.
Personal income tax and social security contributions
Taxation of workers
For the year of assessment in 2009 the, year of income equal 2008. The income tax is
calculated on income in excess of GYD 35 000.00 per month or GYD 420 000 per year. The
remainder in excess of the monthly and yearly threshold is taxed at 33.33%.
Social security contributions paid by workers
The NIS extends protection and social insurance coverage to all persons between the
ages of 16 and 60 years who are engaged in insurable employment. This is done on a
compulsory basis for employed and self-employed persons and can continue on a
voluntary basis for those who cease such employment before reaching age 60 years.
Persons younger and older than this and who are in insured are also covered but only for
the Industrial benefit.
Both the employer and employee pay contributions. The total contribution equal 13%
of paid wages to the employee but is derived by a 5.2% deduction from the employee’s pay
and the remaining 7.8% by the employer on behalf of the employee for National Insurance
purposes.
The maximum weekly earnings for contribution calculation purposes are GYD 29 193
(adjusted annually).

4. PENSIONS AT A GLANCE/LATIN AMERICA AND THE CARRIBEAN – COUNTRY PROFILES – GUYANA
PENSIONS AT A GLANCE: LATIN AMERICA AND THE CARIBBEAN © OECD, THE WORLD BANK AND IDB 2014 129
Contributions are paid weekly or monthly depending on the nature of employment.
The insured’s contributions also finance cash sickness, maternity and work injury
benefits.
Taxation of pensioners
Guyana has a standard tax deduction of GYD 420 000 per year. The marginal tax-rate
is then 33.3%.
Taxation of pension income
Pensions are tax exempted.
Social security contributions paid by pensioners
Persons over the age of 60 and pensioners do not pay social security contributions. The
employer is responsible for the social security payments for employed persons above
60and is equal to l.5% to cover persons over 60 or under l6 years old for the Industrial
benefit.

4. PENSIONS AT A GLANCE/LATIN AMERICA AND THE CARRIBEAN – COUNTRY PROFILES – GUYANA
PENSIONS AT A GLANCE: LATIN AMERICA AND THE CARIBBEAN © OECD, THE WORLD BANK AND IDB 2014130
Pension modelling results: Guyana
MenMedian earner
Individual earnings, multiple of average
Women (where different) 0.5 0.75 1.0 1.5 2.0
Gross relative pension level 53.5 34.1 49.5 66.0 99.0 132.0
(% average gross earnings)
Net relative pension level 61.3 39.1 56.7 75.7 103.2 128.6
(% net average earnings)
Gross replacement rate 66.0 68.2 66.0 66.0 66.0 66.0
(% individual gross earnings)
Net replacement rate 71.1 72.0 69.6 75.7 75.7 74.4
(% individual net earnings)
Gross pension wealth 13.9 14.3 13.9 13.9 13.9 13.9
(multiple of individual gross earnings) 16.7 17.3 16.7 16.7 16.7 16.7
Net pension wealth 13.9 14.3 13.9 13.9 12.6 11.8
(multiple of individual gross earnings) 16.7 17.3 16.7 16.7 15.2 14.2
1 2 http://dx.doi.org/10.1787/888933161709
0 0.25 0.50 0.75 1.00 1.25 1.50 1.75 2.00 0 0.25 0.50 0.75 1.00 1.25 1.50 1.75 2.00
0 0.25 0.50 0.75 1.00 1.25 1.50 1.75 2.00 0 0.25 0.50 0.75 1.00 1.25 1.50 1.75 2.00
2.5
2.0
1.5
1.0
0.5
0
2.5
2.0
1.5
1.0
0.5
0
1.25
1.00
0.75
0.50
0.25
0
1.25
1.00
0.75
0.50
0.25
0
Gross relative pension level Gross replacement rate
Net and gross relative pension levels Net and gross replacement rates
Individual earnings, proportion of average earnings Individual earnings, proportion of average earnings
Proportion of economy-wide average earnings Proportion of individual earnings
Proportion of economy-wide average earnings Proportion of individual earnings
Individual earnings, proportion of average earnings Individual earnings, proportion of average earnings
GrossNet
Earnings-related

4. PENSIONS AT A GLANCE/LATIN AMERICA AND THE CARRIBEAN – COUNTRY PROFILES – HAITI
PENSIONS AT A GLANCE: LATIN AMERICA AND THE CARIBBEAN © OECD, THE WORLD BANK AND IDB 2014 131
Haiti
Haiti: Pension system in 2010
The pension system consists of anearnings-related component and anold-age settlement for those with somebut insufficient contributions.
Key indicators
Haiti LAC26
Average earnings HTG 27 200 277 200
USD 700 7 000
Public pension spending % of GDP 0.7 3.1
Life expectancy At birth 63.0 73.6
At age 65 13.7 17.4
Population over age 65 % of working-age population 9.1 12.3
Qualifying conditionsEmployees in commercial, industrial or agricultural sectors are insured by the
ONA insurance. The old-age pension age is equal to 55 with at least 25 years of contributions.
An old-age grant is paid if the insured does not satisfy the qualifying conditions for an
old-age pension benefit.
Benefit calculationOld-age pension
The ONA pension benefit equals one-third of the average wage of the insured person
in the ten years preceding retirement. Past average earnings are not adjusted and benefits
are not indexed.
Old-age settlementUnemployed individuals above the age of 55 and with less than ten years of
contributions are entitled to a refund of contributions for a maximum period of 12 months.
Variant careersEarly retirement
Early retirement is not possible.
Late retirementFor the ONA regime insured individuals with at least 20 years of service do not have a
bonus in case of delayed departure beyond 55 years.
Personal income tax and social security contributionsTaxation of workers
From To Tax (%)
0 HTG 60 000 0
HTG 60 001 HTG 240 000 10
HTG 240 001 HTG 480 000 15
HTG 480 001 HTG 1 000 000 25
HTG 1 000 001 And above 30

4. PENSIONS AT A GLANCE/LATIN AMERICA AND THE CARRIBEAN – COUNTRY PROFILES – HAITI
PENSIONS AT A GLANCE: LATIN AMERICA AND THE CARIBBEAN © OECD, THE WORLD BANK AND IDB 2014132
Social security contributions paid by workers
The contributions of employers and the wage fund establishment of the National Old
Age Insurance will be calculated as follows:
1. Those wages that do not exceed HTG 200 000, 2% paid by both the employee and
employer
2. Wages from HTG 201.00 to HTG 500 000: 3% paid by both the employee and employer
3. Wages from HTG 501 00 to HTG 1 000.00: 4% paid by both the employee and employer
4. For wages above HTG 1 000.00: 6% to be paid by both the employee and employer.
A 1% tax on the salaries of public and private employees contributes towards the
welfare fund (Caisse d’Assistance Sociale).
Disability and survivors are paid out of social contributions.
For public employees, the health care insurance is financed by levies on wages.
Taxation of pensioners
Pensions are exempted of taxes.
Social security contributions paid by pensioners
Old-age pension beneficiaries do not pay social security contributions.

4. PENSIONS AT A GLANCE/LATIN AMERICA AND THE CARRIBEAN – COUNTRY PROFILES – HAITI
PENSIONS AT A GLANCE: LATIN AMERICA AND THE CARIBBEAN © OECD, THE WORLD BANK AND IDB 2014 133
Pension modelling results: Haiti
MenMedian earner
Individual earnings, multiple of average
Women (where different) 0.5 0.75 1.0 1.5 2.0
Gross relative pension level 24.2 14.9 22.4 29.8 44.8 59.7
(% average gross earnings)
Net relative pension level 26.3 16.2 24.3 32.5 48.7 64.9
(% net average earnings)
Gross replacement rate 29.8 29.8 29.8 29.8 29.8 29.8
(% individual gross earnings)
Net replacement rate 31.9 31.8 31.8 32.5 33.3 33.8
(% individual net earnings)
Gross pension wealth 7.0 7.0 7.0 7.0 7.0 7.0
(multiple of individual gross earnings) 7.7 7.7 7.7 7.7 7.7 7.7
Net pension wealth 7.0 7.0 7.0 7.0 7.0 7.0
(multiple of individual gross earnings) 7.7 7.7 7.7 7.7 7.7 7.7
1 2 http://dx.doi.org/10.1787/888933161715
0 0.25 0.50 0.75 1.00 1.25 1.50 1.75 2.00 0 0.25 0.50 0.75 1.00 1.25 1.50 1.75 2.00
0 0.25 0.50 0.75 1.00 1.25 1.50 1.75 2.00 0 0.25 0.50 0.75 1.00 1.25 1.50 1.75 2.00
2.5
2.0
1.5
1.0
0.5
0
2.5
2.0
1.5
1.0
0.5
0
1.25
1.00
0.75
0.50
0.25
0
1.25
1.00
0.75
0.50
0.25
0
Gross relative pension level Gross replacement rate
Net and gross relative pension levels Net and gross replacement rates
Individual earnings, proportion of average earnings Individual earnings, proportion of average earnings
Proportion of economy-wide average earnings Proportion of individual earnings
Proportion of economy-wide average earnings Proportion of individual earnings
Individual earnings, proportion of average earnings Individual earnings, proportion of average earnings
GrossNet
Earnings-related

4. PENSIONS AT A GLANCE/LATIN AMERICA AND THE CARRIBEAN – COUNTRY PROFILES – HONDURAS
PENSIONS AT A GLANCE: LATIN AMERICA AND THE CARIBBEAN © OECD, THE WORLD BANK AND IDB 2014134
Honduras
Honduras: Pension system in 2010
The pension system in Hondurasconsists of a pay-as-you go defined-benefitscheme and an old-age settlement forthose who do not have the requirednumber of contributions.
Key indicators
Honduras LAC26
Average earnings HNL 59 400 131 800
USD 3 100 7 000
Public pension spending % of GDP 5.1 3.1
Life expectancy At birth 73.8 73.6
At age 65 18.3 17.4
Population over age 65 % of working- age population 9.0 12.3
Qualifying conditionsThe mandatory retirement age is 65 for men and 60 for women with 15 years of
contributions. Individuals who do not qualify for an old-age pension will have their
contributions refunded as a lump sum.
Benefit calculation
Old-age pension
For the Social Security Institute (IHSS) scheme, the pension must not be less than 50%
or greater than 80% of the base monthly contribution wage.
The pension is based on the average of the last 180 monthly wages or earnings that
were used as the base monthly contribution wage, indexed to the month in which the
insured qualified for a pension. If the number of months of contributions is less than 180,
the calculation will be based on earnings as of the date of the request based on the
consumer price index, taking as the final date the last contribution and as the initial date
the first contribution, and multiplying the basic monthly earnings by 40% plus 1% of
earnings for every 12 months of contributions exceeding the first 60 months.
In 2010, the average minimum wage was HNL 4 949.70. IHSS pension benefits are
changed by government decree.
Old-age settlement
If an individual does not qualify for an old-age pension the insured is reimbursed with
the total amount contributed in a lump sum.
Variant careers
Early retirement
Early retirement is not possible.
Late retirement
Late retirement is possible and individuals who have met the qualifying age and
contribution requirements and defer their pension withdrawal receive a benefit of 3% instead
of 1% for every year and fraction of a year of contributions beyond the first 60 months.

4. PENSIONS AT A GLANCE/LATIN AMERICA AND THE CARRIBEAN – COUNTRY PROFILES – HONDURAS
PENSIONS AT A GLANCE: LATIN AMERICA AND THE CARIBBEAN © OECD, THE WORLD BANK AND IDB 2014 135
Personal income tax and social security contributions
Taxation of workers
There is a personal income allowance of HNL 70 000.00. Additionally, HNL 20 000.00
are allowed for medical expenses, for a total of HNL 90 000.00.
Social security contributions paid by workers
Workers contribute 1% of their earnings to the IHSS, the private sector contributes 2%,
and the state contributes 0.5%.
There are minimum and maximum monthly earnings amounts for the contribution
calculation purposes. In 2010, the upper limit of contribution was HNL 4 800.00. In 2012,
the upper limit was HNL 7 000.
Taxation of pensioners
Pensions are exempt from taxation, regardless of where the insured worked.
Social security contributions paid by pensioners
Old-age pension beneficiaries do not pay social security contributions.
Social assistance programmes
Honduran institutions grant an annual voucher valued at HNL 800.00. Approximately
300 000 families receive this benefit.
Health and maternity(%)
Old age(%)
Workmen’s compensation(%)
Total
Employer 5.0 2.0 0.02 7.02
Worker 2.5 1.0 3.5
Government 0.5 0.5 1.0
Total 8.0 3.5 0.02 11.52

4. PENSIONS AT A GLANCE/LATIN AMERICA AND THE CARRIBEAN – COUNTRY PROFILES – HONDURAS
PENSIONS AT A GLANCE: LATIN AMERICA AND THE CARIBBEAN © OECD, THE WORLD BANK AND IDB 2014136
Pension modelling results: Honduras
MenMedian earner
Individual earnings, multiple of average
Women (where different) 0.5 0.75 1.0 1.5 2.0
Gross relative pension level 52.6 32.5 48.7 64.9 97.4 129.9
(% average gross earnings) 49.3 30.4 45.7 60.9 91.3 121.8
Net relative pension level 54.3 33.5 50.3 67.1 100.6 134.2
(% net average earnings) 50.9 31.4 47.2 62.9 94.3 125.8
Gross replacement rate 64.9 64.9 64.9 64.9 64.9 64.9
(% individual gross earnings) 60.9 60.9 60.9 60.9 60.9 60.9
Net replacement rate 67.1 67.0 67.1 67.1 66.4 66.0
(% individual net earnings) 62.9 62.8 62.9 62.9 62.2 61.9
Gross pension wealth 12.6 12.6 12.6 12.6 12.6 12.6
(multiple of individual gross earnings) 16.1 16.1 16.1 16.1 16.1 16.1
Net pension wealth 12.6 12.6 12.6 12.6 12.6 12.6
(Multiple of individual gross earnings) 16.1 16.1 16.1 16.1 16.1 16.1
1 2 http://dx.doi.org/10.1787/888933161721
0 0.25 0.50 0.75 1.00 1.25 1.50 1.75 2.00 0 0.25 0.50 0.75 1.00 1.25 1.50 1.75 2.00
0 0.25 0.50 0.75 1.00 1.25 1.50 1.75 2.00 0 0.25 0.50 0.75 1.00 1.25 1.50 1.75 2.00
2.5
2.0
1.5
1.0
0.5
0
2.5
2.0
1.5
1.0
0.5
0
1.25
1.00
0.75
0.50
0.25
0
1.25
1.00
0.75
0.50
0.25
0
Gross relative pension level Gross replacement rate
Net and gross relative pension levels Net and gross replacement rates
Individual earnings, proportion of average earnings Individual earnings, proportion of average earnings
Proportion of economy-wide average earnings Proportion of individual earnings
Proportion of economy-wide average earnings Proportion of individual earnings
Individual earnings, proportion of average earnings Individual earnings, proportion of average earnings
GrossNet
Earnings-related

4. PENSIONS AT A GLANCE/LATIN AMERICA AND THE CARRIBEAN – COUNTRY PROFILES – JAMAICA
PENSIONS AT A GLANCE: LATIN AMERICA AND THE CARIBBEAN © OECD, THE WORLD BANK AND IDB 2014 137
Jamaica
Jamaica: Pension system in 2010
The pension system has a basiccomponent and an additional earnings-related component. For those ineligiblefor the basic pension there is a socialassistance component.
Key indicators
Jamaica LAC26
Average earnings JMD 429 900 590 600
USD 5 100 7 000
Public pension spending % of GDP 0.7 3.1
Life expectancy At birth 74.0 73.6
At age 65 17.4 17.4
Population over age 65 % of working-age population 14.5 12.3
Qualifying conditionsThe retirement age is 65 for men and 60 for women with at least 1 716 weeks of paid
contributions, including an annual average of 39 weeks of paid or accredited contributions.
Women´s retirement age is set to increase to 61 in 2012, 62 in 2013, 63 in 2014, 64 in 2015
and 65 in 2016 to equalise it with men’s retirement age. Retirement is compulsory from 70
for men or 65 for women (increasing to 70 by 2016). A reduced pension is paid for annual
average contributions of between 10 and 38 weeks.
Benefit calculation
Old-age pension
A basic benefit of JMD 2 400 a week is paid with an annual average of 39 weeks of paid
or credited contributions, plus an earnings-related benefit of JMD 0.06 a week for every
JMD 13 of employer/employee contributions paid during the working lifetime.
A reduced pension of JMD 1 800 a week (with annual average contributions of 26 to
38 weeks) or JMD 1 200 a week (with 10 to 25 weeks) is paid, plus an earnings-related
benefit of JMD 0.06 a week for every JMD 13 of employer/employee contributions paid
during the working lifetime.
There is also a spousal supplement of JMD 800 a week.
In general since the system is quite redistributive, the pension consists of the basic
benefit (or flat rate), which constitutes around 90% of the pension, and an earnings-related
component for the remaining 10% of the benefit.
Benefits are not indexed but are reviewed every two years and actuarially adjusted. For
the purpose of the modelling we assume price indexation.
Old-age grant
There is a social assistance programme under the conditional cash programme for
poor families, children, elderly (60+), etc. The elderly, above the age of 60, who qualify for
the programme, receive JMD 900 per month, paid every two months.

4. PENSIONS AT A GLANCE/LATIN AMERICA AND THE CARRIBEAN – COUNTRY PROFILES – JAMAICA
PENSIONS AT A GLANCE: LATIN AMERICA AND THE CARIBBEAN © OECD, THE WORLD BANK AND IDB 2014138
Variant careers
Early retirement
The pension cannot be claimed prior to the retirement age.
Late retirement
Men can continue to contribute to the system until they reach the age of 70, when the
pension cannot be deferred any further. For women, this deferral is only possibly until the
age of 65.This age will be gradually increased to age 70 by 2016.
It needs to be noted that the pension claim must be made no later than three years
after the date of eligibility; failing which only a maximum of three years of arrears will be
paid.
Personal income tax and social security contributions
Taxation of workers
There is a personal allowance of JMD 441 168. Additional income is taxed at 25%.
Social security contributions paid by workers
Both employees and employers contribute 2.5% of covered earnings, of which 2% is the
contribution to the pension and 0.5% is the contribution to the National Health Fund.
Household workers and voluntarily insured persons contribute a flat-rate JMD 50 a week.
The maximum earnings for employee contribution calculation purposes are
JMD 19 230.77 a week or JMD 1 000 000 a year (there are no maximum earnings for
contribution calculation purposes for household workers). Workers also contribute to cash
maternity benefits. Contributions are deducted weekly, fortnightly or monthly, depending
on how the employee is paid.
Taxation of pensioners
Pension benefits are tax exempt. However if a pensioner continues to work beyond the
retirement age some allowances exist depending on the total income. Pensioners have an
additional tax allowance of JMD 80 000 with a further JMD 80 000 for those over age 65.
Taxation of pension income
Old-age pension benefits from the National Insurance Scheme are tax exempt.
Social security contributions paid by pensioners
Pensioners do not pay any social security contributions.

4. PENSIONS AT A GLANCE/LATIN AMERICA AND THE CARRIBEAN – COUNTRY PROFILES – JAMAICA
PENSIONS AT A GLANCE: LATIN AMERICA AND THE CARIBBEAN © OECD, THE WORLD BANK AND IDB 2014 139
Pension modelling results: Jamaica
MenMedian earner
Individual earnings, multiple of average
Women (where different) 0.5 0.75 1.0 1.5 2.0
Gross relative pension level 64.0 50.6 61.4 72.2 93.8 115.4
(% average gross earnings)
Net relative pension level 65.7 51.9 63.0 74.1 96.2 118.4
(% net average earnings)
Gross replacement rate 79.0 101.3 81.9 72.2 62.6 57.7
(% individual gross earnings)
Net replacement rate 81.1 103.9 84.0 74.1 69.3 67.1
(% individual net earnings)
Gross pension wealth 12.3 15.7 12.7 11.2 9.7 9.0
(multiple of individual gross earnings) 13.6 17.4 14.1 12.4 10.8 9.9
Net pension wealth 12.3 15.7 12.7 11.2 9.7 9.0
(Multiple of individual gross earnings) 13.6 17.4 14.1 12.4 10.8 9.9
1 2 http://dx.doi.org/10.1787/888933161731
0 0.25 0.50 0.75 1.00 1.25 1.50 1.75 2.00 0 0.25 0.50 0.75 1.00 1.25 1.50 1.75 2.00
0 0.25 0.50 0.75 1.00 1.25 1.50 1.75 2.00 0 0.25 0.50 0.75 1.00 1.25 1.50 1.75 2.00
2.5
2.0
1.5
1.0
0.5
0
2.5
2.0
1.5
1.0
0.5
0
1.25
1.00
0.75
0.50
0.25
0
1.25
1.00
0.75
0.50
0.25
0
Gross relative pension level Gross replacement rate
Net and gross relative pension levels Net and gross replacement rates
Individual earnings, proportion of average earnings Individual earnings, proportion of average earnings
Proportion of economy-wide average earnings Proportion of individual earnings
Proportion of economy-wide average earnings Proportion of individual earnings
Individual earnings, proportion of average earnings Individual earnings, proportion of average earnings
GrossNet
BasicEarnings-related

4. PENSIONS AT A GLANCE/LATIN AMERICA AND THE CARRIBEAN – COUNTRY PROFILES – MEXICO
PENSIONS AT A GLANCE: LATIN AMERICA AND THE CARIBBEAN © OECD, THE WORLD BANK AND IDB 2014140
Mexico
Mexico: Pension system in 2010
Private sector workers that entered after1 April 2007 or opted for it are coveredunder a mandatory defined-contributionscheme, privately managed and funded.Contributions are made by workers,employers and government. A minimumpension for private sector workers.Transitional rules apply and for somegenerations.
Key indicators
Mexico LAC26
Average earnings MXN 84 100 86 100
USD 6 800 7 000
Public pension spending % of GDP 1.4 3.1
Life expectancy At birth 77.3 73.6
At age 65 18.7 17.4
Population over age 65 % of working-age population 11.4 12.3
Qualifying conditionsNormal retirement age for private sector workers is 65 for men and women, subject to
1 250 weeks (around 24 years) of contribution.
Benefit calculation
Funded scheme
Private sector workers: Workers and employers contribute a total of 6.275% of earnings
to an individual account, to which is added a government contribution equivalent to
0.225% of earnings. An additional 5% contribution is made to an individual housing
account (a scheme known as Infonavit) which reverts to the retirement account when it is
not used. Finally, the government contributes a fixed amount indexed quarterly to inflation
into individual retirement accounts per day of contribution called cuota social or social fee.
As of May 2009, the Social Security Law was amended in order to establish a progressive
social fee, seeking to benefit workers who earn the lowest salaries. The social fees as of
December 2010 are as follows: for workers who earn up to one minimum wage, the social
fee is MXN 4.10647; for those who earn between 1.01 and four times the minimum wage,
MXN 3.93537; for those in the 4.01 to seven times the minimum wage bracket,
MXN 3.76427; for those in the 7.01 to ten times the minimum wage bracket, MXN 3.59316
and finally, for those who earn between 10.01 and 15 times the minimum wage,
MXN 3.42206. For higher wage earners there is no social fee contribution. The social fee is
indexed to inflation every three months.
There is a ceiling on contributions which is 25 times the minimum wage. The
calculations of pension payments are realised by converting the accumulated account
balance (discounting a survival insurance that must be bought to cover the survivors’
benefits) into a price-indexed annuity at normal pension age. Annuity rates are
sex-specific.

4. PENSIONS AT A GLANCE/LATIN AMERICA AND THE CARRIBEAN – COUNTRY PROFILES – MEXICO
PENSIONS AT A GLANCE: LATIN AMERICA AND THE CARIBBEAN © OECD, THE WORLD BANK AND IDB 2014 141
Minimum pension
Private sector workers: The minimum pension is equivalent to a 1997 minimum wage
value indexed to inflation (MXN 24 092.91 in 2010). The minimum pension is effectively
price indexed.
Variant careers
Early retirement
Early retirement is possible from age 60 for men and women. Conditions are that the
worker is not employed and that at least 1 250 weekly contributions have been made.
Members may retire at any age if the accumulated capital in their account allows them to
buy an annuity that is at least 30% higher than the minimum guaranteed pension. In this
case, the worker still has to complete the 1 250 weeks of contributions.
Late retirement
It is not mandatory to retire at 65. It is possible to defer the pension after age 65 for
both private sector workers.
Personal income tax and social security contributions
Taxation of workers
No withholding will be made on the monthly earnings for people who perceive only
the equivalent to the minimum wage in the corresponding geographic area.
For 2010, the annual earnings above the annual minimum wage are taxable according
to the following:
Geographic areaDaily salary Minimum wage per year Five minimum wages per year
MXN MXN MXN
“A” 57.46 20 972.90 104 864.50
“B” 55.84 20 381.60 101 908.00
“C” 54.47 19 881.55 99 407.75
Lower limit Upper limit Fixed lump sumPercentage to be applied
on the excess of the lower limit
MXN MXN MXN %
0.01 5 952.84 0 1.92
5 952.85 50 524.92 1 14.24 6.4
50 524.93 88 793.04 2 966.76 10.88
88 793.05 103 218.00 7 130.88 16
103 218.01 123 580.20 9 438.6 17.92
123 580.21 249 243.48 13 087.44 21.36
249 243.49 392 841.96 39 929.04 23.52
392 841.97 Or more 73 703.40 30

4. PENSIONS AT A GLANCE/LATIN AMERICA AND THE CARRIBEAN – COUNTRY PROFILES – MEXICO
PENSIONS AT A GLANCE: LATIN AMERICA AND THE CARIBBEAN © OECD, THE WORLD BANK AND IDB 2014142
Taxation of pensioners
The allowance for pensioners is set at 15 times the minimum wage.
Taxation of pension income
There is no special relief for pension income above the higher allowances.
Social security contributions paid by pensioners
Pensioners do not pay social security contributions.
Non-Contributory Pensions
The pension alimentaria for adults 68 and older, residing in the Federal District (DF) are
eligible for this benefit which is equal to at least 50% of the minimum wage for the DF
(in 2010, the monthly “pension alimentaria” was MXN 897.30 per month).
Pension “70 y mas”, MXN 500 per month, for the population aged 70 or older, living in
a town with 30 000 or less inhabitants. Beneficiaries must not be recipient of any other
government benefit.

4. PENSIONS AT A GLANCE/LATIN AMERICA AND THE CARRIBEAN – COUNTRY PROFILES – MEXICO
PENSIONS AT A GLANCE: LATIN AMERICA AND THE CARIBBEAN © OECD, THE WORLD BANK AND IDB 2014 143
Pension modelling results: Mexico
MenMedian earner
Individual earnings, multiple of average
Women (where different) 0.5 0.75 1.0 1.5 2.0
Gross relative pension level 28.6 28.6 28.6 29.5 42.3 54.9
(% average gross earnings) 28.6 38.4 49.8
Net relative pension level 30.3 30.3 30.3 31.2 44.7 58.0
(% net average earnings) 30.3 40.6 52.7
Gross replacement rate 46.2 57.3 38.2 29.5 28.2 27.4
(% individual gross earnings) 28.6 25.6 24.9
Net replacement rate 46.8 58.0 38.8 31.2 32.0 32.1
(% individual net earnings) 30.3 29.1 29.2
Gross pension wealth 7.6 9.4 6.3 4.8 4.6 4.5
(multiple of individual gross earnings) 8.3 10.3 6.9 5.2 4.6 4.5
Net pension wealth 7.6 9.4 6.3 4.8 4.6 4.5
(multiple of individual gross earnings) 8.3 10.3 6.9 5.2 4.6 4.5
1 2 http://dx.doi.org/10.1787/888933161743
0 0.25 0.50 0.75 1.00 1.25 1.50 1.75 2.00 0 0.25 0.50 0.75 1.00 1.25 1.50 1.75 2.00
0 0.25 0.50 0.75 1.00 1.25 1.50 1.75 2.00 0 0.25 0.50 0.75 1.00 1.25 1.50 1.75 2.00
2.5
2.0
1.5
1.0
0.5
0
2.5
2.0
1.5
1.0
0.5
0
1.25
1.00
0.75
0.50
0.25
0
1.25
1.00
0.75
0.50
0.25
0
Gross relative pension level Gross replacement rate
Net and gross relative pension levels Net and gross replacement rates
Individual earnings, proportion of average earnings Individual earnings, proportion of average earnings
Proportion of economy-wide average earnings Proportion of individual earnings
Proportion of economy-wide average earnings Proportion of individual earnings
Individual earnings, proportion of average earnings Individual earnings, proportion of average earnings
GrossNet
TargetedDC-fixedDC

4. PENSIONS AT A GLANCE/LATIN AMERICA AND THE CARRIBEAN – COUNTRY PROFILES – NICARAGUA
PENSIONS AT A GLANCE: LATIN AMERICA AND THE CARIBBEAN © OECD, THE WORLD BANK AND IDB 2014144
Nicaragua
Nicaragua: Pension system 2010
The pension system consists of apay-as-you go scheme and an income-based defined-benefit scheme.
Key indicators
Nicaragua LAC26
Average income NIO 31 700 152 500
USD 1 400 7 000
Public pension spending % of GDP 3.1 3.1
Life expectancy At birth 74.7 73.6
At age 65 18.5 17.4
Population over 65 % of working-age population 9.1 12.3
Qualifying conditionsThe retirement age is 60 for men and women if they have a contribution record of at
least 750 weeks. The number of years of contributions required to qualify are reduced for
those who have enrolled in the social insurance system after age 45, who have contributed
for half the time they have been in the system from enrolment to retirement age, and who
have a record of at least 250 weeks of contributions.
There are two non-contributory pension programmes: a) for victims of war, paid to
relatives of the fallen or those who were affected by war and b) special pensions, financed
by the state, paid to distinguished citizens for diverse reasons.
Benefit calculation
Old-age pension
The benefit is 40% of the average earnings for benefit calculation purposes (or 45% of
the average earnings if they are less than twice the minimum wage) plus 1.365% (or 1.59%
if the average earnings are less than twice the minimum wage) for each additional
50 weeks of contributions exceeding 150 weeks. The maximum monthly old-age pension is
80% of the average earnings if the average earnings for benefit calculation purposes are
greater than twice the minimum wage, and 100% if the average earnings for benefit
calculation purposes are less than twice the minimum wage.
The insured’s average earnings is equal to the average of the last 250 weeks of
contributions or the 250 weeks before the last 250 weeks of earnings received (whichever is
greater) multiplied by 4.33.
For insured people who have contributed to social security for between 1 000 and
1 250 weeks, the average earnings for benefit calculation purposes can be calculated based
on the average of the last 200 weeks of contributions multiplied by 4.33; for those who have
contributed for at least 1 250 weeks, the benefit is calculated on the average of the last
150 weeks of contributions multiplied by 4.33.
Pensions are paid monthly and an additional payment is made annually in December.
All pensions are pegged to the exchange rate of the USD as of 30 November of each
year. In the last five years, pensions have been adjusted by 5%.

4. PENSIONS AT A GLANCE/LATIN AMERICA AND THE CARRIBEAN – COUNTRY PROFILES – NICARAGUA
PENSIONS AT A GLANCE: LATIN AMERICA AND THE CARIBBEAN © OECD, THE WORLD BANK AND IDB 2014 145
Pensions that are less than the minimum wage of the manufacturing industry are
periodically adjusted according to changes in the minimum wage approved by the National
Commission on the Minimum Wage and depending on the sustainability of the pension
system.
Variant careers
Early retirement
There is no early retirement.
Late retirement
The pension can be postponed until age 65. A pensioner who continues to work can
receive a pension and a salary but must make the required contributions to the system.
The pension increases by 1% for each 50 weeks of contributions after age 60, up to a
maximum of 5%.
Personal income tax and social security contributions.
Taxation of workers
Income tax tables are as follows:
Social security contributions paid by workers
There are two insurance schemes:
Integrated: Workers are insured to protect against disability, old age and death,
particularly through pensions, in case of work-related accidents or illnesses, as well as
health (sickness and maternity).
Natural persons
Taxable income (brackets)Base tax Applicable percentage On amounts above
From To
1.00 50 000.00 - 0 -
50 000.01 100 000.00 - 10 50 000
100 000.01 200 000.00 5 000.00 15 100 000
200 000.01 300 000.00 20 000.00 20 200 000
300 000.01 500 000.00 40 000.00 25 300 000
500 000.01 Or more 90 000.00 30 500 000
Wage earners
Taxable income (brackets)Base tax Applicable percentage On amounts above
From To
1.00 75 000.00 - 0 -
75 000.01 100 000.00 - 10 75 000
100 000.01 200 000.00 2 500.00 15 100 000
200 000.01 300 000.00 17 500.00 20 200 000
300 000.01 500 000.00 37 500.00 25 300 000
500 000.01 Or more 87 500.00 30 500 000

4. PENSIONS AT A GLANCE/LATIN AMERICA AND THE CARRIBEAN – COUNTRY PROFILES – NICARAGUA
PENSIONS AT A GLANCE: LATIN AMERICA AND THE CARIBBEAN © OECD, THE WORLD BANK AND IDB 2014146
IVM-RP: Workers are insured to protect against disability, old age and death,
particularly through pensions, in case of work-related accidents or illnesses. It applies in
regions of the country where the Nicaraguan Social Security Institute cannot offer health
care services.
For voluntary contributions, either 10% of declared income (for old-age, disability and
survivors and dependents benefits), or 18.25% of declared income (for old-age, disability and
survivors and dependents benefits, health and maternity benefits, and family allowances).
The minimum earnings for benefit calculation purposes are equal to the minimum
wage. The legal monthly minimum wage is between NIO 1 767.57 and NIO 4 030.96, based
on nine economic sectors.
The maximum earnings for benefit calculation purposes are NIO 37 518.
Contributions to social security finance family allowances.
Taxation of pension income
Pensions are not taxed.
Social security contributions paid by pensioners
Pensioners do not pay social contributions.
Social assistance programmes for old-age population
Social welfare pensions
There are pensions for victims of war and special pensions.
Additional programmes
Public sector programmes for the elderly. The government is currently encouraging
programmes to protect the low-income or indigent population, especially the elderly,
through bonds, credits, and other means.
Integrated systemPercentages
Category/Source of financing Employer Employee State Total
Disability, old age and survivors 7.0 4.0 11.0
Workmen’s compensation 1.5 1.5
Sickness/Maternity 6.0 2.25 0.25 8.5
Victims of war 1.5 1.5
Total 16.0 6.25 0.25 22.5
IVM-RP schemePercentages
Category/Source of financing Employer Employee State Total
Disability, old age and survivors 7.0 4.0 11.0
Workmen’s compensation 1.5 1.5
Victims of war 1.5 0.25 1.75
Total 10.0 4.25 0.0 14.25

4. PENSIONS AT A GLANCE/LATIN AMERICA AND THE CARRIBEAN – COUNTRY PROFILES – NICARAGUA
PENSIONS AT A GLANCE: LATIN AMERICA AND THE CARIBBEAN © OECD, THE WORLD BANK AND IDB 2014 147
Pension modelling results: Nicaragua
MenMedian earner
Individual earnings, multiple of average
Women (where different) 0.5 0.75 1.0 1.5 2.0
Gross relative pension level 76.3 47.1 70.6 94.2 113.0 150.7
(% average gross earnings)
Net relative pension level 78.2 48.3 72.5 96.6 115.9 154.6
(% net average earnings)
Gross replacement rate 94.2 94.2 94.2 94.2 75.3 75.3
(% individual gross earnings)
Net replacement rate 95.7 94.2 95.4 96.6 77.2 76.7
(% individual net earnings)
Gross pension wealth 22.7 22.7 22.7 22.7 18.1 18.1
(multiple of individual gross earnings) 25.2 25.2 25.2 25.2 20.2 20.2
Net pension wealth 22.7 22.7 22.7 22.7 18.1 18.1
(multiple of individual gross earnings) 25.2 25.2 25.2 25.2 20.2 20.2
1 2 http://dx.doi.org/10.1787/888933161752
0 0.25 0.50 0.75 1.00 1.25 1.50 1.75 2.00 0 0.25 0.50 0.75 1.00 1.25 1.50 1.75 2.00
0 0.25 0.50 0.75 1.00 1.25 1.50 1.75 2.00 0 0.25 0.50 0.75 1.00 1.25 1.50 1.75 2.00
2.5
2.0
1.5
1.0
0.5
0
2.5
2.0
1.5
1.0
0.5
0
1.25
1.00
0.75
0.50
0.25
0
1.25
1.00
0.75
0.50
0.25
0
Gross relative pension level Gross replacement rate
Net and gross relative pension levels Net and gross replacement rates
Individual earnings, proportion of average earnings Individual earnings, proportion of average earnings
Proportion of economy-wide average earnings Proportion of individual earnings
Proportion of economy-wide average earnings Proportion of individual earnings
Individual earnings, proportion of average earnings Individual earnings, proportion of average earnings
GrossNet
Earnings-related
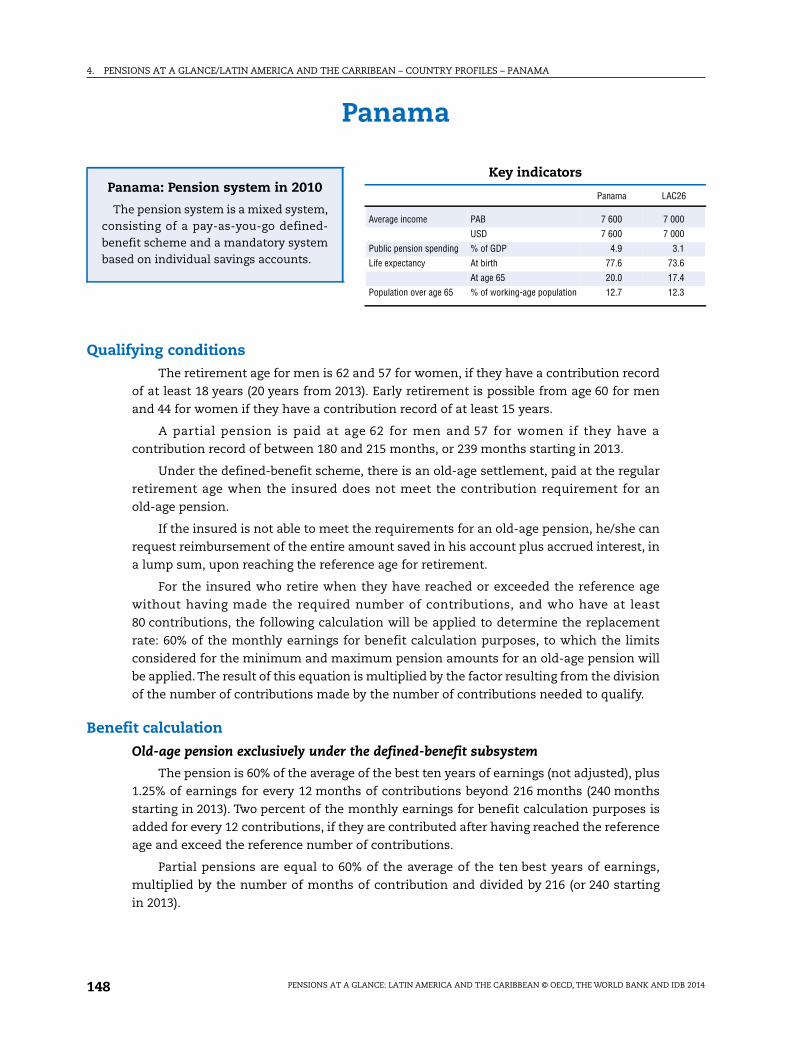
4. PENSIONS AT A GLANCE/LATIN AMERICA AND THE CARRIBEAN – COUNTRY PROFILES – PANAMA
PENSIONS AT A GLANCE: LATIN AMERICA AND THE CARIBBEAN © OECD, THE WORLD BANK AND IDB 2014148
Panama
Panama: Pension system in 2010
The pension system is a mixed system,consisting of a pay-as-you-go defined-benefit scheme and a mandatory systembased on individual savings accounts.
Key indicators
Panama LAC26
Average income PAB 7 600 7 000
USD 7 600 7 000
Public pension spending % of GDP 4.9 3.1
Life expectancy At birth 77.6 73.6
At age 65 20.0 17.4
Population over age 65 % of working-age population 12.7 12.3
Qualifying conditionsThe retirement age for men is 62 and 57 for women, if they have a contribution record
of at least 18 years (20 years from 2013). Early retirement is possible from age 60 for men
and 44 for women if they have a contribution record of at least 15 years.
A partial pension is paid at age 62 for men and 57 for women if they have a
contribution record of between 180 and 215 months, or 239 months starting in 2013.
Under the defined-benefit scheme, there is an old-age settlement, paid at the regular
retirement age when the insured does not meet the contribution requirement for an
old-age pension.
If the insured is not able to meet the requirements for an old-age pension, he/she can
request reimbursement of the entire amount saved in his account plus accrued interest, in
a lump sum, upon reaching the reference age for retirement.
For the insured who retire when they have reached or exceeded the reference age
without having made the required number of contributions, and who have at least
80 contributions, the following calculation will be applied to determine the replacement
rate: 60% of the monthly earnings for benefit calculation purposes, to which the limits
considered for the minimum and maximum pension amounts for an old-age pension will
be applied. The result of this equation is multiplied by the factor resulting from the division
of the number of contributions made by the number of contributions needed to qualify.
Benefit calculation
Old-age pension exclusively under the defined-benefit subsystem
The pension is 60% of the average of the best ten years of earnings (not adjusted), plus
1.25% of earnings for every 12 months of contributions beyond 216 months (240 months
starting in 2013). Two percent of the monthly earnings for benefit calculation purposes is
added for every 12 contributions, if they are contributed after having reached the reference
age and exceed the reference number of contributions.
Partial pensions are equal to 60% of the average of the ten best years of earnings,
multiplied by the number of months of contribution and divided by 216 (or 240 starting
in 2013).

4. PENSIONS AT A GLANCE/LATIN AMERICA AND THE CARRIBEAN – COUNTRY PROFILES – PANAMA
PENSIONS AT A GLANCE: LATIN AMERICA AND THE CARIBBEAN © OECD, THE WORLD BANK AND IDB 2014 149
The average base salary corresponds to the seven best years of contributions up to
31 December 2009 or the ten best years of contributions from 1 January 2010.
The minimum monthly pension is PAB 185.
The maximum monthly pension is PAB 1 500.
There are some maximum monthly pensions of PAB 2 000.00 and PAB 2 500.00 if the
insured meets some specific requirements:
For the insured who has at least 25 years of contributions and average monthly
earnings of at least PAB 2 000.00 in the 15 best years in which he/she made contributions,
the pension can be as much as PAB 2 000.00 per month.
For the insured who has at least 30 years of contributions and average monthly
earnings of at least PAB 2 500.00 in the 20 best years in which he/she made contributions,
the pension can be as much as PAB 2 500.00 per month.
Benefits are adjusted on an ad hoc basis depending on the economic situation in the
country or as established by law. Beginning in 2013 the minimum pension (PAB 235) will be
increased by PAB 10 per month every five years.
Old-age pension under the mixed subsystem
The defined-benefit component grants participating insured people benefits for
disability, old age and death, under the same requirements established by the Exclusively
Defined-Benefit Subsystem, up to the maximum amount established on monthly
contributions of PAB 500.00.
The individual account component is for insured people whose earnings are greater
than PAB 500.00 per month. Those contributions participate in the personal savings
component, which grants a retirement pension contributed and capitalised in a savings
account, as long as it complies with the contribution and age requirements established in
the defined-benefit component. The amount is determined as a programmed old-age
retirement pension, dividing the total amount saved and the accrued interest in the
individual account at the time the pension begins by the actuarial life expectancy,
considered according to the corresponding discount rate on that date. The payment of this
pension is guaranteed through a collective annuity, whose cost is prorated among the
participants in this component and deducted from the contributions to this subsystem.
Old-age settlement-Compensation (only the defined-benefit subsystem)
A lump sum equivalent to one month of old-age pension for every six months of
contributions is granted.
Old-age settlement (mixed subsystem)
This is a lump-sum payment equivalent to the savings and interest accumulated in
the individual account.
Variant careers
Early retirement
A reduced pension can be granted, equal to the old-age pension multiplied by 0.9128
one year before the normal retirement age or by 0.8342 two years before the normal
retirement age.

4. PENSIONS AT A GLANCE/LATIN AMERICA AND THE CARRIBEAN – COUNTRY PROFILES – PANAMA
PENSIONS AT A GLANCE: LATIN AMERICA AND THE CARIBBEAN © OECD, THE WORLD BANK AND IDB 2014150
Late retirement
Deferral gives an additional payment of 2% of earnings for every 12 months of
contributions beyond the normal retirement age.
Personal income tax and social security contributions
Taxation of workers
There is personal allowance of PAB 9 500. Income up to PAB 2 500 is taxed at 20.5%;
between PAB 2 500 and PAB 5 500 at 21.5%; between PAB 5 500 and PAB 10 500 at 23%;
between PAB 10 500 and PAB 20 500 at 24%; and above PAB 20 500 at 27%.
Social security contributions paid by workers
Contributions of the first PAB 500.00 finance the annuity and defined-benefit scheme.
The rest (above PAB 500.00) is accumulated in the individual savings account.
The minimum earnings for contribution calculation purposes is equal to the legal
monthly minimum wage – PAB 235.00 – for household workers; PAB 300 for insured
through voluntary contributions.
There is no maximum earnings for contribution calculation purposes.
In addition to the contributions to IVM (disability, old age or death), both the employer
and the employee contribute to the sickness and maternity scheme, as shown in the
following table:
The law requires the state to make a yearly deposit into a trust fund for the disability,
old-age and death scheme (IVM), to contribute to the sustainability of the scheme, the
amount of PAB 100 million each year (in 2010, 2011 and 2012) and PAB 140 million each
year (starting in 2013 up to 2060).
Contributions to the disability, old age and death schemePercentage
Employee contributionsEmployer contributions to the IVM
(disability, old age or death)Total to IVM
From 2008 to 2010 7.5 3.5 11.0
From 2011 to 2012 8.5 4.0 12.5
2013 and beyond 9.25 4.25 13.5
Percentage contributionPercentage
2010 2011 2012 2013 ➙
Worker 8.00 9.00 9.00 9.75
IVM 7.50 8.50 8.50 9.25
Sickness and maternity 0.50 0.50 0.50 0.50
Employer 11.75 12.00 12.00 12.25
IVM 3.50 4.00 4.00 4.25
Sickness and maternity 8.25 8.00 8.00 8.00
Total 19.75 21.00 21.00 22.00
IVM 11.00 12.50 12.50 13.50
Sickness and maternity 8.75 8.50 8.50 8.50

4. PENSIONS AT A GLANCE/LATIN AMERICA AND THE CARRIBEAN – COUNTRY PROFILES – PANAMA
PENSIONS AT A GLANCE: LATIN AMERICA AND THE CARIBBEAN © OECD, THE WORLD BANK AND IDB 2014 151
Taxation of pensioners
Pensions are not taxed.
Social security contributions paid by pensioners
Pensioners contribute 6.75% of the gross monthly amount of their pensions to
Sickness and Maternity Insurance.
Old-age pensioners receiving pensions from the Social Security Fund (CSS) who
continue to work, contribute to disability, old-age and death insurance at the same
contribution rates as the “active contributing insured”. This contribution does not modify
the amount of their pensions.
Social assistance programmes for old-age population
Social pension
Beginning from 4 August 2009 people over age 70 who do not receive a pension from
the CSS receive a monthly payment of PAB 100.00. This non-contributory allowance is
known as “100 at 70”.
Additional programmes
Pension for seasonal agricultural and construction workers: Starting in 2008,
agricultural or construction workers , whose history of contributions to the CSS is low and
who have, upon reaching the reference age have at least 120 contributions but who have
not reached 180 contributions, can request that the sum total of earnings on which they
made contributions be computed each year as if they had been contributed in a period of
12 months, as long as the total amount contributed does not exceed PAB 3 500.00 annually.
Once it has made the calculation described above, the CSS will recognise an old-age
pension equal to 60% of the base earnings in effect when the worker retires, multiplied by
a factor equal to all of the contributions divided by the reference contribution. This pension
has no minimum amount.

4. PENSIONS AT A GLANCE/LATIN AMERICA AND THE CARRIBEAN – COUNTRY PROFILES – PANAMA
PENSIONS AT A GLANCE: LATIN AMERICA AND THE CARIBBEAN © OECD, THE WORLD BANK AND IDB 2014152
Pension modelling results: Panama
MenMedian earner
Individual earnings, multiple of average
Women (where different) 0.5 0.75 1.0 1.5 2.0
Gross relative pension level 63.5 39.2 58.8 78.4 117.6 156.9
(% average gross earnings) 59.0 36.4 54.6 72.8 109.2 145.7
Net relative pension level 63.8 39.4 59.1 78.8 118.2 157.6
(% net average earnings) 59.3 36.6 54.9 73.2 109.8 146.3
Gross replacement rate 78.4 78.4 78.4 78.4 78.4 78.4
(% individual gross earnings) 72.8 72.8 72.8 72.8 72.8 72.8
Net replacement rate 79.0 79.1 79.1 78.8 80.2 84.1
(% individual net earnings) 73.4 73.4 73.4 73.2 74.5 78.1
Gross pension wealth 13.8 13.8 13.8 13.8 13.8 13.8
(multiple of individual gross earnings) 15.0 15.0 15.0 15.0 15.0 15.0
Net pension wealth 13.8 13.8 13.8 13.8 13.8 13.8
(multiple of individual gross earnings) 14.0 14.0 14.0 14.0 14.0 14.0
1 2 http://dx.doi.org/10.1787/888933161763
0 0.25 0.50 0.75 1.00 1.25 1.50 1.75 2.00 0 0.25 0.50 0.75 1.00 1.25 1.50 1.75 2.00
0 0.25 0.50 0.75 1.00 1.25 1.50 1.75 2.00 0 0.25 0.50 0.75 1.00 1.25 1.50 1.75 2.00
2.5
2.0
1.5
1.0
0.5
0
2.5
2.0
1.5
1.0
0.5
0
1.25
1.00
0.75
0.50
0.25
0
1.25
1.00
0.75
0.50
0.25
0
Gross relative pension level Gross replacement rate
Net and gross relative pension levels Net and gross replacement rates
Individual earnings, proportion of average earnings Individual earnings, proportion of average earnings
Proportion of economy-wide average earnings Proportion of individual earnings
Proportion of economy-wide average earnings Proportion of individual earnings
Individual earnings, proportion of average earnings Individual earnings, proportion of average earnings
GrossNet
Earnings-related

4. PENSIONS AT A GLANCE/LATIN AMERICA AND THE CARRIBEAN – COUNTRY PROFILES – PARAGUAY
PENSIONS AT A GLANCE: LATIN AMERICA AND THE CARIBBEAN © OECD, THE WORLD BANK AND IDB 2014 153
Paraguay
Paraguay: Pension system in 2010
The pension system in Paraguayconsists of a pay-as-you-go system andan earnings-related defined-benefitsystem.
Key indicators
Paraguay LAC26
Average annual income PYG (million) 18.3 32.1
USD 4 000 7 000
Public pension spending % of GDP 2.8 3.1
Life expectancy At birth 72.3 73.6
At age 65 17.1 17.4
Population over age 65 % of working-age population 10.4 12.3
Qualifying conditionsThe retirement age for both men and women is 60, with a record of at least 25 years of
contributions.
Benefit calculation
Old-age pension
The monthly retirement pension is equal to 100% of the average earnings for
contribution calculation purposes.
There is also a proportional retirement granted with 15 years of seniority and 65 years
of age, with a substitution rate of 60%, which increases by 4% for each year of age beyond
15 years of seniority.
The average earnings for contribution calculation purposes is based on the last
36 months of earnings (excluding the last month) before retirement.
The minimum monthly pension is PGY 300 000, which was established by the General
Budget Law (PGN) and was not an entitlement. In 2012, the minimum retirement pension
amount was adjusted to 33% of the legal minimum wage: PYG 547 217.
The maximum monthly old-age retirement pension is 300 times the daily minimum
wage. (The minimum monthly salary is equal to PYG 1 507 484 in 2010. In 2012, the
minimum salary was PYG 1 658 232.)
All income-generating activity must cease after retirement age.
Pensions are paid monthly, plus a bonus (Annual Additional Benefit) in December
equivalent to one month of retirement pension. This is not an entitlement, as the law
states that it is subject to the financial and actuarial viability of the Retirement Fund.
Benefits are adjusted annually according to the consumer price index published by the
Central Bank of Paraguay.
Variant careers
Early retirement
Early retirement can be claimed at 55 years of age (both men and women), with a
record of at least 30 years of contributions.

4. PENSIONS AT A GLANCE/LATIN AMERICA AND THE CARRIBEAN – COUNTRY PROFILES – PARAGUAY
PENSIONS AT A GLANCE: LATIN AMERICA AND THE CARIBBEAN © OECD, THE WORLD BANK AND IDB 2014154
The monthly early retirement pension is equal to 80% of the average earnings for
contribution calculation purposes plus 4% of the annual earnings for every year over 55 up
to 59.
Late retirement
Once an insured person has reached the age and seniority required to qualify for an
ordinary pension, they will receive 100% of the average of the last 36 months. There is no
advantage to contributing for more than the required amount of time.
Personal income tax and social security contributions
Taxation of workers
The personal income tax (IRP) was introduced in August 2012. Workers pay tax as well
as make the contributions that all dependent workers are required to make to the social
security system.
Starting in 2012, independent or self-employed workers who are not covered by the
social security system will have to pay IRP and value-added taxes (VAT).
The IRP establish the following:
For the first year that this law is in effect, the range not affected will be up to 120 annual
minimum wages and will diminish until it reaches 36 annual minimum wages.
In 2012, the only contributors will be those people whose gross earnings are above
120 minimum wages (PYG 198 million). For the second year that this law is in effect, (2013),
only those persons whose gross earnings are above nine monthly minimum wages, or
108 per year, and so on.
Social security contributions paid by workers
Contributions to social security are equal to 9% of gross earnings. The minimum
monthly earnings for the purpose of calculating contributions is equal to the monthly
minimum wage. The monthly minimum wage was PYG 1 507 474 in 2010, and was
PYG 1 658 232 in 2012. There is no maximum level of earnings for contribution calculation
purposes. The contributions to the insurance system described above cover health,
maternity, workmen’s compensation, and old-age benefits.
0 to 36 annual minimum wages Exempt
More than 36 up to 120 8%
More than 120 10%
On 50% of the earnings paid to those who do not residein the country but who earn income in Paraguay
20%
2012 More than 120 minimum wages in the year
2013 More than 9 monthly minimum wages or 108/year
2014 More than 8 monthly minimum wages or 96/year
2015 More than 7 monthly minimum wages or 84/year
2016 More than 6 monthly minimum wages or 72/year
2017 More than 5 monthly minimum wages or 60/year
2018 More than 4 monthly minimum wages or 48/year
2019 More than 3 monthly minimum wages or 36/year

4. PENSIONS AT A GLANCE/LATIN AMERICA AND THE CARRIBEAN – COUNTRY PROFILES – PARAGUAY
PENSIONS AT A GLANCE: LATIN AMERICA AND THE CARIBBEAN © OECD, THE WORLD BANK AND IDB 2014 155
Employers contribute 14% of employees’ earnings. The sum of the employer and
employee contributions is 23%, of which 9 percentage points goes to health insurance,
12.5 percentage points to retirement, and an additional 1.5 percentage point to cover
management and administration fees.
By law, the state must pay 1.5% of the payroll paid by employers to private sector
workers.
Taxation of pensioners
Retirement income is not taxed.
Social security contributions paid by pensioners
Pensioners contribute 6% of their pension income for health insurance in the IPS.
Social assistance programme for the old-age populationElderly in need can receive a pension for food administered by the Ministry of Finance.
This pension is not less than one-quarter of the minimum wage. All natural-born
Paraguayans aged 65 or older who are poor and who reside in Paraguay are eligible to
receive this assistance. The amount in 2010 was PGY 376 871. Those who have outstanding
debts to the state, who receive payments from the public or private sectors including
salaries, retirement, pension and/or social security, are not eligible for this benefit.

4. PENSIONS AT A GLANCE/LATIN AMERICA AND THE CARRIBEAN – COUNTRY PROFILES – PARAGUAY
PENSIONS AT A GLANCE: LATIN AMERICA AND THE CARIBBEAN © OECD, THE WORLD BANK AND IDB 2014156
Pension modelling results: Paraguay
MenMedian earner
Individual earnings, multiple of average
Women (where different) 0.5 0.75 1.0 1.5 2.0
Gross relative pension level 84.3 52.0 78.0 104.1 156.1 208.1
(% average gross earnings)
Net relative pension level 84.4 52.1 78.1 103.8 152.8 201.7
(% net average earnings)
Gross replacement rate 104.1 104.1 104.1 104.1 104.1 104.1
(% individual gross earnings)
Net replacement rate 104.1 104.1 104.1 104.1 104.1 104.6
(% individual net earnings)
Gross pension wealth 18.5 18.5 18.5 18.5 18.5 18.5
(multiple of individual gross earnings) 20.0 20.0 20.0 20.0 20.0 20.0
Net pension wealth 18.5 18.5 18.5 18.5 18.5 18.5
(multiple of individual gross earnings) 20.0 20.0 20.0 19.9 19.5 19.4
1 2 http://dx.doi.org/10.1787/888933161778
0 0.25 0.50 0.75 1.00 1.25 1.50 1.75 2.00 0 0.25 0.50 0.75 1.00 1.25 1.50 1.75 2.00
0 0.25 0.50 0.75 1.00 1.25 1.50 1.75 2.00 0 0.25 0.50 0.75 1.00 1.25 1.50 1.75 2.00
2.5
2.0
1.5
1.0
0.5
0
2.5
2.0
1.5
1.0
0.5
0
1.25
1.00
0.75
0.50
0.25
0
1.25
1.00
0.75
0.50
0.25
0
Gross relative pension level Gross replacement rate
Net and gross relative pension levels Net and gross replacement rates
Individual earnings, proportion of average earnings Individual earnings, proportion of average earnings
Proportion of economy-wide average earnings Proportion of individual earnings
Proportion of economy-wide average earnings Proportion of individual earnings
Individual earnings, proportion of average earnings Individual earnings, proportion of average earnings
GrossNet
Earnings-related

4. PENSIONS AT A GLANCE/LATIN AMERICA AND THE CARRIBEAN – COUNTRY PROFILES – PERU
PENSIONS AT A GLANCE: LATIN AMERICA AND THE CARIBBEAN © OECD, THE WORLD BANK AND IDB 2014 157
Peru
Peru: Pension system in 2010
The system allows people to chooseeither a public pay-as-you-go anddefined-benefit scheme or a defined-contribution scheme managed by theprivate sector. The minimum pension onlycovers affiliates of the pay-as-you-goscheme; the pension fund option has notbeen established.
Key indicators
Peru LAC26
Average earnings PEN 14 600 19 600
USD 5 200 7 000
Public pension spending % of GDP 1.7 3.1
Life expectancy At birth 74.7 73.6
At age 65 17.7 17.4
Population over age 65 % of working-age population 11.4 12.3
Qualifying conditionsWorkers entering the public and private sectors can choose between the system of
individual accounts (Private Pension System – SPP) and the public social insurance system
(National Pension System – SNP). Those who do not elect either system will be affiliated
with the private system. Affiliates to the public system can switch to the private system,
but affiliates of the private system cannot return to the public system except under special
circumstances.
The qualifying age for a pension for both men and women is 65, with a record of
20 years of contributions.
Benefit calculation
Old-age pension – public system
The reference wage for calculating pensions for those with between 20 and 25 years of
contributions is the average earnings for the last five years; between 25 and 30 years, it is
the average earnings for the last four years; and for those with more than 30 years of
contributions, it is the average earnings for the last three years.
The amount of the future pension is determined by multiplying the current wage by
the corresponding replacement rate (according to the table below). For this, there are
five different replacement rates depending on the age range.
Age rangeReplacement rates
% for 20 years of contributions % for each additional year
0-36 30 2
37-46 35 2
47-56 40 2
57-61 45 2
62-110 50 4

4. PENSIONS AT A GLANCE/LATIN AMERICA AND THE CARRIBEAN – COUNTRY PROFILES – PERU
PENSIONS AT A GLANCE: LATIN AMERICA AND THE CARIBBEAN © OECD, THE WORLD BANK AND IDB 2014158
The upper and lower limits are PEN 857.36 and PEN 415, respectively.
In addition to the future pension of the insured, a reserve is calculated which
corresponds to the spouse’s right to a survivor’s pension (it is assumed that the marital
status of all insured people is “married”).
People born after 31 December 1946, receive from 30% to 45% of average earnings in
the last 60 months, according to the insured’s age on 14 June 2002 (30% if younger than age
31, 35% if aged 31 to 39, 40% if aged 40 to 49, or 45% if older than age 49) plus 2% for each
additional year of contributions exceeding 20, up to 100%.
Defined contribution – Private sector
Individual Savings Accounts (Cuentas Individuales de Capitalización – CIC) are managed
by the private sector.
Targeted
People who were born after 31 December 1945, who do not meet the qualifying
conditions are entitled to a minimum pension. The minimum pension established by law
is PEN 415 per month for those affiliates who have contributed for 20 years.
Variant careers
Early retirement
An insured person may draw a retirement pension before age 65 under the following
conditions:
● When the balance of the CIC is sufficient to grant a pension equal to or greater than 50%
of the average of the payments and declared earnings received in the preceding ten years
before the date of the presentation of the retirement application, indexed to the
consumer price index (CPI).
● Workers who, when they joined the SPP, had already met the requirements for early
retirement under the SNP, for which their transfer to the SPP means a potential loss of
well-being in terms of benefit calculation, because their date of entry to the SPP was
before 2 January 2002.
Late retirement
Retirement can be delayed beyond age 65, and there are no penalties for doing so.
Under the public system, once the requirement of 20 years of contributions has been
met, if the affiliate is 65 or older, they receive an increase of 4% of the replacement for each
year, as long as the amount of the maximum pension does not exceed PER 857.
Personal income tax and social security contributions
Taxation of workers
Earnings up to 7 tax units (UIT) is taxed at 0%; between 7 and 27 UIT at 15%; between
27 and 54 UIT at 21%, and above 54 UIT at 30%. (In 2010: 1 UIT = PEN 3 600).

4. PENSIONS AT A GLANCE/LATIN AMERICA AND THE CARRIBEAN – COUNTRY PROFILES – PERU
PENSIONS AT A GLANCE: LATIN AMERICA AND THE CARIBBEAN © OECD, THE WORLD BANK AND IDB 2014 159
Social security contributions by workers
The employee contribution rate to the public scheme is 13%.
The contribution rate to the private scheme is 10%. Additionally, there are average
contributions of 1.87% and 0.96% for administrative fees and for disability and survivors
insurance, respectively, adding up to a total of 12.83%.
There is another contribution to social insurance, which is a voluntary payment for
health insurance provided by a health care facility (EPS) for self-employed workers.
The maximum monthly earnings for the purpose of calculating contributions for
disability and survivor benefits is PEN 7 306.96.
There is no maximum earnings level established for the purpose of calculating
contributions for old-age benefits or administrative fees.
Taxation of pensioners
Pensions are not taxed.
Social security contributions paid by pensioners
Pensioners do not contribute to social security.
Social assistance programmes
Social pension
The National Welfare Assistance programme, known as Pension 65, was created in
October 2011 to protect vulnerable adults over age 65 that are unable to meet basic
subsistence needs. Since its creation, this subsidy has been given progressively to the
poorest districts in the country. It was established as an amount per person, PEN 125. By
July 2012, more than 126 000 older adults had been benefiting from this programme.

4. PENSIONS AT A GLANCE/LATIN AMERICA AND THE CARRIBEAN – COUNTRY PROFILES – PERU
PENSIONS AT A GLANCE: LATIN AMERICA AND THE CARIBBEAN © OECD, THE WORLD BANK AND IDB 2014160
Pension modelling results: Peru (Public pension system)
MenMedian earner
Individual earnings, multiple of average
Women (where different) 0.5 0.75 1.0 1.5 2.0
Gross relative pension level 62.2 38.4 57.6 70.6 70.6 70.6
(% average gross earnings)
Net relative pension level 71.5 44.2 66.2 81.1 81.1 81.1
(% net average earnings)
Gross replacement rate 76.8 76.8 76.8 70.6 47.0 35.3
(% individual gross earnings)
Net replacement rate 88.3 88.3 88.3 81.1 54.1 40.6
(% individual net earnings)
Gross pension wealth 12.0 12.0 12.0 11.0 7.3 5.5
(multiple of individual gross earnings) 13.4 13.4 13.4 12.3 8.2 6.2
Net pension wealth 12.0 12.0 12.0 11.0 7.3 5.5
(multiple of individual gross earnings) 13.4 13.4 13.4 12.3 8.2 6.2
1 2 http://dx.doi.org/10.1787/888933161795
0 0.25 0.50 0.75 1.00 1.25 1.50 1.75 2.00 0 0.25 0.50 0.75 1.00 1.25 1.50 1.75 2.00
0 0.25 0.50 0.75 1.00 1.25 1.50 1.75 2.00 0 0.25 0.50 0.75 1.00 1.25 1.50 1.75 2.00
2.5
2.0
1.5
1.0
0.5
0
2.5
2.0
1.5
1.0
0.5
0
1.25
1.00
0.75
0.50
0.25
0
1.25
1.00
0.75
0.50
0.25
0
Gross relative pension level Gross replacement rate
Net and gross relative pension levels Net and gross replacement rates
Individual earnings, proportion of average earnings Individual earnings, proportion of average earnings
Proportion of economy-wide average earnings Proportion of individual earnings
Proportion of economy-wide average earnings Proportion of individual earnings
Individual earnings, proportion of average earnings Individual earnings, proportion of average earnings
GrossNet
Earnings-related

4. PENSIONS AT A GLANCE/LATIN AMERICA AND THE CARRIBEAN – COUNTRY PROFILES – PERU
PENSIONS AT A GLANCE: LATIN AMERICA AND THE CARIBBEAN © OECD, THE WORLD BANK AND IDB 2014 161
Pension modelling results: Peru (Private pension system)
MenMedian earner
Individual earnings, multiple of average
Women (where different) 0.5 0.75 1.0 1.5 2.0
Gross relative pension level 34.2 34.2 34.2 39.1 58.6 78.1
(% average gross earnings)
Net relative pension level 39.2 39.2 39.2 44.8 67.2 89.6
(% net average earnings)
Gross replacement rate 42.2 68.3 45.5 39.1 39.1 39.1
(% individual gross earnings)
Net replacement rate 48.4 78.4 52.2 44.8 44.8 44.9
(% individual net earnings)
Gross pension wealth 8.1 13.1 8.7 7.5 7.5 7.5
(multiple of individual gross earnings) 9.3 15.0 10.0 8.6 8.6 8.6
Net pension wealth 8.1 13.1 8.7 7.5 7.5 7.5
(multiple of individual gross earnings) 9.3 15.0 10.0 8.6 8.6 8.6
1 2 http://dx.doi.org/10.1787/888933161784
0 0.25 0.50 0.75 1.00 1.25 1.50 1.75 2.00 0 0.25 0.50 0.75 1.00 1.25 1.50 1.75 2.00
0 0.25 0.50 0.75 1.00 1.25 1.50 1.75 2.00 0 0.25 0.50 0.75 1.00 1.25 1.50 1.75 2.00
2.5
2.0
1.5
1.0
0.5
0
2.5
2.0
1.5
1.0
0.5
0
1.25
1.00
0.75
0.50
0.25
0
1.25
1.00
0.75
0.50
0.25
0
Gross relative pension level Gross replacement rate
Net and gross relative pension levels Net and gross replacement rates
Individual earnings, proportion of average earnings Individual earnings, proportion of average earnings
Proportion of economy-wide average earnings Proportion of individual earnings
Proportion of economy-wide average earnings Proportion of individual earnings
Individual earnings, proportion of average earnings Individual earnings, proportion of average earnings
GrossNet
DC

4. PENSIONS AT A GLANCE/LATIN AMERICA AND THE CARRIBEAN – COUNTRY PROFILES – SURINAME
PENSIONS AT A GLANCE: LATIN AMERICA AND THE CARIBBEAN © OECD, THE WORLD BANK AND IDB 2014162
Suriname
Suriname: Pension system in 2010
The public pension is flat rate based ona residency test (General Old Age PensionPlan – AOV). It is a pay as you go system.
There are additional voluntary schemes,which are mainly defined benefit.
Key indicators
Suriname LAC26
Average earnings SRD 221 200 18 900
USD 7 800 7 000
Public pension spending % of GDP 1.2 3.1
Life expectancy At birth 71.0 73.6
At age 65 15.0 17.4
Population over age 65 % of working-age population 11.5 12.3
Qualifying conditionsThe General Old Age Pension Plan (AOV) provides all residents of Surinamese
nationality with a flat old-age pension at the age of 60. Individuals with other nationalities
can qualify if they have ten years of consecutive contributions.
Voluntary pension plans in the private sector
Pension plans are considered as part of the collective labour agreement or the labour
contract between employer and employees. There is no obligation for employers to establish
pension plans for their employees. Pension plans are established on a voluntary basis.
Most of the pension plans are defined-benefit plans targeting a certain replacement
ratio between 60% and 70%. Employees’ and employers’ contributions to sustain the plan
are always well defined as a certain percentage of basic salary or pensionable salary. In a
few plans the employees’ contributions together with the employers’ contributions are a
fixed percentage of the employees’ basic salary or are used to purchase annuities with an
insurance company. Only one defined-contribution scheme is in place. This plan has a very
limited number of participants.
There are also private savings plans, with individual savings accounts, whereby at
termination of service the balance of the savings account is paid in full or in instalments to
the beneficiary. These plans are under administration of provident funds. For the purpose
of the assessment at hand both the defined-contribution plan and the savings plans can be
neglected.
Benefit calculation
Basic
The basic pension is equal to SRD 525 in 2012 and there has been a steady increase in
the general old-age provision from SRD 175 per month in April 2005, to SRD 225
from October 2005, raised to SRD 425 in 2011.
Variant careers
Early retirement
There’s no early retirement under the AOV.

4. PENSIONS AT A GLANCE/LATIN AMERICA AND THE CARRIBEAN – COUNTRY PROFILES – SURINAME
PENSIONS AT A GLANCE: LATIN AMERICA AND THE CARIBBEAN © OECD, THE WORLD BANK AND IDB 2014 163
Late retirement
There is no late retirement under the AOV pension.
Personal income tax and social security contributions
Taxation of workers
The personal allowance in Suriname is based on yearly income. All workers that earn
a higher income than the personal allowance should pay income tax.
Social security contributions paid by workers
The financing of the AOV scheme is provided for by:
4% from the salary as contributions (premiums) from residents of Suriname who are
subject to paying income tax (private or government) and have not yet reached the age of 60;
While the government covers the deficit between contribution and payments. There
contributions by the government from the general resources of the state.
The contributions are levied by the Income Tax Administration and should by virtue of
the act, be transferred to the Fund, which however is not done. About 35% of the population
aged between 20 and 60 years contribute to the system.
Contributions by employees of companies are withheld by the employer on the principles
of pay as you go and have to be transferred monthly to the Income Tax Administration.
Contributions of self-employed have to be paid quarterly on (self) assessment of taxable
income.
The contributions of the government are not specified in the act. In practice the
financing of the scheme functions as a pay-as-you-go system, as:
● the contributions are not sufficient to meet the pension benefits and,
● the contributions of the government are established to cover the shortfall.
In this situation there is no fund accumulation.
Personal income tax and social security contributionsThere is no social security scheme in place. The coverage depends on the collective
labour agreements. Therefore, the levels of the employers’ contributions vary.
Taxation of pensioners
Pensioners are exempted from income taxes, unless they remain working.
Social security contributions paid by pensioners
It does not apply since there is no national social security scheme.
From Up to %
SRD 0.00 SRD 2 646.00 0
SRD 2 646.01 SRD 14 002.80 8
SRD 14 002.81 SRD 21 919.80 18
SRD 21 919.81 SRD 32 839.80 28
SRD 32 839.81 And beyond 38

4. PENSIONS AT A GLANCE/LATIN AMERICA AND THE CARRIBEAN – COUNTRY PROFILES – SURINAME
PENSIONS AT A GLANCE: LATIN AMERICA AND THE CARIBBEAN © OECD, THE WORLD BANK AND IDB 2014164
Pension modelling results: Suriname
MenMedian earner
Individual earnings, multiple of average
Women (where different) 0.5 0.75 1.0 1.5 2.0
Gross relative pension level 29.7 29.7 29.7 29.7 29.7 29.7
(% average gross earnings)
Net relative pension level 32.8 32.8 32.8 32.8 32.8 32.8
(% net average earnings)
Gross replacement rate 36.6 59.3 39.5 29.7 19.8 14.8
(% individual gross earnings)
Net replacement rate 39.6 62.6 42.5 32.8 23.3 18.6
(% individual net earnings)
Gross pension wealth 7.7 12.5 8.3 6.3 4.2 3.1
(multiple of individual gross earnings) 8.9 14.4 9.6 7.2 4.8 3.6
Net pension wealth 7.4 11.9 8.0 6.0 4.0 3.0
(multiple of individual gross earnings) 8.5 13.7 9.1 6.9 4.6 3.4
1 2 http://dx.doi.org/10.1787/888933161802
0 0.25 0.50 0.75 1.00 1.25 1.50 1.75 2.00 0 0.25 0.50 0.75 1.00 1.25 1.50 1.75 2.00
0 0.25 0.50 0.75 1.00 1.25 1.50 1.75 2.00 0 0.25 0.50 0.75 1.00 1.25 1.50 1.75 2.00
2.5
2.0
1.5
1.0
0.5
0
2.5
2.0
1.5
1.0
0.5
0
1.25
1.00
0.75
0.50
0.25
0
1.25
1.00
0.75
0.50
0.25
0
Gross relative pension level Gross replacement rate
Net and gross relative pension levels Net and gross replacement rates
Individual earnings, proportion of average earnings Individual earnings, proportion of average earnings
Proportion of economy-wide average earnings Proportion of individual earnings
Proportion of economy-wide average earnings Proportion of individual earnings
Individual earnings, proportion of average earnings Individual earnings, proportion of average earnings
GrossNet
Basic

4. PENSIONS AT A GLANCE/LATIN AMERICA AND THE CARRIBEAN – COUNTRY PROFILES – TRINIDAD AND TOBAGO
PENSIONS AT A GLANCE: LATIN AMERICA AND THE CARIBBEAN © OECD, THE WORLD BANK AND IDB 2014 165
Trinidad and Tobago
Trinidad and Tobago:Pension system in 2010
The pension system consists of anearnings-related component, and anold-age settlement for those with somebut insufficient contributions. For thosewith inadequate income there is also ameans-tested old-age pension.
Key indicators
Trinidad andTobago
LAC26
Average earnings TTD 72 400 44 200
USD 11 400 7 000
Public pension spending % of GDP 4.4 3.1
Life expectancy At birth 70.0 73.6
At age 65 14.4 17.4
Population over age 65 % of working-age population 13.8 12.3
Qualifying conditionsThe retirement age is 60 years for men and women and an insured individual must
have a minimum of 750 weeks of contributions paid or credited.
The insured between 60 and 65 receive a pension if the insured employee ceases to be,
and continue to receive the benefit even if you return to employment secured before
reaching age 65.
The agreement granted old age for those who do not qualify for a pension, who are
between 60 and 65 and do not have 750 weekly contributions in the form of lump sum
payments.
Benefit calculations
Old-age pension
The pension is set between 30% and 40%, the average weekly earnings, according to
16 wage classes, plus an amount between 0.56% and 0.71% of average weekly earnings for
each period 25 weeks of contributions exceeding 750 weeks.
The average weekly earnings are based on career average salary, according to the
16 categories of wages.
The minimum pension is TTD 2 000.
An average rate of contribution is calculated considering all the contributions. The
income category, corresponding to the average rate is the benchmark to be used for
allocating the amount of the pension.
Convention age: A lump sum is paid to members who do not meet the 750 weeks of
contributions. This amount is three times the total contributions of the insured and the
employer.

4. PENSIONS AT A GLANCE/LATIN AMERICA AND THE CARRIBEAN – COUNTRY PROFILES – TRINIDAD AND TOBAGO
PENSIONS AT A GLANCE: LATIN AMERICA AND THE CARIBBEAN © OECD, THE WORLD BANK AND IDB 2014166
Old-age social assistance
The “Guidelines for Older Adults”, subject to means testing, is given at age 65 or older
with at least 20 years of residence in Trinidad and Tobago and a monthly income not
exceeding TTD 3 000. Monthly allowance of TTD 3 000 to TTD 1 000, is given to residents of
65 years or more, with monthly incomes below the TTD 3 000.
Social assistance is paid monthly and the amount of the benefit depends on income
up to TTD 3 000.
Variant careers
Early retirement
Early retirement is not possible.
Late retirement
There is no benefit in delaying pension benefit withdrawal.
Personal income tax and social contributions
Taxation of workers
There is a tax deduction of TTD 60 000. Income above this amount is taxed at 25%.
Income category Weekly income (TTD)Average weekly
earnings assumptionMonthly income (TTD)
Benefits week(first week) (TDD)
Increase (weekly) afterthe first week (TDD)
I 120.00-199.99 160.00 520.00-866.99 77.50 1.13
II 200.00-269.99 235.00 867.00-1 169.99 100.75 1.58
III 270.00-359.99 315.00 1 170.00-1 559.99 119.35 2.00
IV 360.00-449.99 405.00 1 560.00-1 949.99 137.95 2.42
V 450.00-549.99 500.00 1 950.00-2 382.99 155.00 2.85
VI 550.00-659.99 605.00 2 383.00-2 859.99 183.68 3.46
VII 660.00-769.99 715.00 2 860.00-3 336.99 216.23 4.05
VIII 770.00-879.99 825.00 3 337.00-3 812.99 248.78 4.68
IX 880.00-1 009.99 945.00 3 813.00-4 376.99 283.65 5.32
X 1 010.00-1 129.99 1 070.00 4 377.00-4 896.99 320.85 6.05
XI 1 130.00-1 259.99 1 195.00 4 897.00-5 459.99 358.05 6.73
XII 1 260.00-1 399.99 1 330.00 5 460.00-6 066.99 376.65 7.49
XIII 1 400.00-1 549.99 1 475.00 6 067.00-6 716.99 440.05 8.31
XIV 1 550.00-1 719.99 1 635.00 6 717.00-7 452.99 487.78 9.21
XV 1 720.00-1 914.99 1 818.00 7 453.00-8 299.99 542.23 10.24
XVI 1 915.00 and over 1 915.00 8 300.00 and over 571.31 10.79
Income (TDD)Pension amount (TTD)
From 9/1/2010
0-500 3 000500-1 450 2 550
1 450-1 650 2 3501 650-1 800 2 2001 800-2 000 2 0002 000-2 200 1 8002 200-2 400 1 6002 400-2 600 1 4002 600-2 800 1 2002 800-3 000 1 000

4. PENSIONS AT A GLANCE/LATIN AMERICA AND THE CARRIBEAN – COUNTRY PROFILES – TRINIDAD AND TOBAGO
PENSIONS AT A GLANCE: LATIN AMERICA AND THE CARIBBEAN © OECD, THE WORLD BANK AND IDB 2014 167
Social security contributions by workers
The payment of the tax is shared between the employee and the employer, in the ratio
of 2:1. The employer is legally required to deduct the employee, at the latest, on the date of
payment of wages.
The employee contributes 3.6% of income insured weekly or monthly (January 2010),
according to the 16 categories of salary and the employer contributes 7.2%. The voluntary
contributes 10.8% of insured weekly earnings (in January 2010) in accordance with 16 pay
grades. To calculate the contribution, the minimum weekly income is TTD 120. The
maximum weekly income for purposes of calculating the contribution is TTD 1 915.
Additionally, to cover workers against accidents; employers pay a contribution class z,
which varies from 1.17 to 8.72 week.
Contribution rates have been increasing, from 9.9% to 10.5%, in January 2008, to 10.8%
in January 2010 and will increase to 11.4% in January 2012.
Taxation of pensioners
Pension income is taxable at the same rate as a general workers, at a rate of 25% above
TTD 60 000 per year.
Social security contributions paid by pensioners
There are no contributions made by pensioners. If still working, no deductions are
made from the pensioners’ wages because employer pays the contribution. The employer
pays a Class Z contribution, which insures the employee for the Injury Allowance only.
Social assistance programme for old-age populationThey also have a list of programmes that may help the living conditions of a senior
citizen such as clothing, public transport, medicines, etc.
Income categories and contribution rate
Income categories(TTD)
Weekly income(TTD)
Averageweekly earnings
assumptions (TTD)
Weeklycontributions ofemployees (TTD)
Employers weeklycontribution (TTD)
Total contributionper week (TTD)
Class Z weekly(TTD)
I 120.00-199.99 160.00 5.76 11.52 17.28 1.17
II 200.00-269.99 235.00 8.46 16.92 25.38 1.72
III 270.00-359.99 315.00 11.34 22.68 34.02 2.30
IV 360.00-449.99 405.00 14.58 29.16 43.74 2.96
V 450.00-549.99 500.00 18.00 36.00 54.00 3.65
VI 550.00-659.99 605.00 21.78 43.56 65.34 4.42
VII 660.00-769.99 715.00 25.74 51.48 77.22 5.22
VIII 770.00-879.99 825.00 29.70 59.40 89.10 6.02
IX 880.00-1009.99 945.00 34.02 68.04 102.06 6.90
X 1010.00-1129.99 1.070.00 38.52 77.04 115.56 7.81
XI 1130.00-1259.99 1.195.00 43.02 86.04 129.06 8.72
XII 1260.00-1399.99 1.330.00 47.88 95.76 143.64 9.71
XIII 1400.00-1549.99 1.475.00 53.10 106.20 159.30 1.77
XIV 1550.00-1719.99 1.635.00 58.86 117.72 176.58 11.94
XV 1720.00-1914.99 1.818.00 65.43 130.86 196.29 13.27
XVI 1915.00 and over 1.915.00 68.94 137.88 206.82 13.98

4. PENSIONS AT A GLANCE/LATIN AMERICA AND THE CARRIBEAN – COUNTRY PROFILES – TRINIDAD AND TOBAGO
PENSIONS AT A GLANCE: LATIN AMERICA AND THE CARIBBEAN © OECD, THE WORLD BANK AND IDB 2014168
Pension modelling results: Trinidad and Tobago
MenMedian earner
Individual earnings, multiple of average
Women (where different) 0.5 0.75 1.0 1.5 2.0
Gross relative pension level 33.1 33.1 33.1 35.1 54.9 73.2
(% average gross earnings)
Net relative pension level 35.5 35.5 35.5 37.6 58.9 78.5
(% net average earnings)
Gross replacement rate 40.9 66.3 44.2 35.1 36.6 36.6
(% individual gross earnings)
Net replacement rate 42.3 68.3 45.6 37.6 42.3 43.8
(% individual net earnings)
Gross pension wealth 8.5 13.7 9.1 7.2 7.6 7.6
(multiple of individual gross earnings) 10.1 16.4 10.9 8.7 9.1 9.1
Net pension wealth 8.5 13.7 9.1 7.2 7.6 7.6
(multiple of individual gross earnings) 10.1 16.4 10.9 8.7 9.1 9.1
1 2 http://dx.doi.org/10.1787/888933161811
0 0.25 0.50 0.75 1.00 1.25 1.50 1.75 2.00 0 0.25 0.50 0.75 1.00 1.25 1.50 1.75 2.00
0 0.25 0.50 0.75 1.00 1.25 1.50 1.75 2.00 0 0.25 0.50 0.75 1.00 1.25 1.50 1.75 2.00
2.5
2.0
1.5
1.0
0.5
0
2.5
2.0
1.5
1.0
0.5
0
1.25
1.00
0.75
0.50
0.25
0
1.25
1.00
0.75
0.50
0.25
0
Gross relative pension level Gross replacement rate
Net and gross relative pension levels Net and gross replacement rates
Individual earnings, proportion of average earnings Individual earnings, proportion of average earnings
Proportion of economy-wide average earnings Proportion of individual earnings
Proportion of economy-wide average earnings Proportion of individual earnings
Individual earnings, proportion of average earnings Individual earnings, proportion of average earnings
GrossNet
Earnings-related

4. PENSIONS AT A GLANCE/LATIN AMERICA AND THE CARRIBEAN – COUNTRY PROFILES – URUGUAY
PENSIONS AT A GLANCE: LATIN AMERICA AND THE CARIBBEAN © OECD, THE WORLD BANK AND IDB 2014 169
Uruguay
Uruguay: Pension system in 2010
The insurance system is based on amixed scheme that receives contributionsand grants benefits in combined form,according to earnings brackets. One partis an inter-generational solidarityretirement (defined-benefit) scheme, andthe other is a mandatory individualretirement savings (defined-contribution)scheme. Low-income workers can opt todivide their contributions equallybetween the two components of thescheme. There is a non-contributoryscheme for people who earn less than theminimum wage and who are elderly.
Key indicators
Uruguay LAC26
Average earnings UYU 226 200 138 100
USD 11 400 7 000
Public pension spending % of GDP 8.2 3.1
Life expectancy At birth 77.0 73.6
At age 65 17.8 17.4
Population over age 65 % of working-age population 25.0 12.3
Qualifying conditionsThe retirement age is 60 for both men and women with 30 years of contributions.
Benefit calculation
Defined benefit
The retirement pension benefit is equal to 45% of earnings for contribution calculation
purposes, plus 1% for each year of contributions beyond 30 up to 35 years. Another 0.5% is
added for each year of contributions beyond 35 (up to 2.5%). The pension is increased by 3%
for each year that retirement is deferred beyond age 60 (up to 30%).
Earnings for contribution calculation purposes are equal to the monthly average of
eligible earnings in the last ten years from the individuals registered work history, limited
by the monthly average of the best 20 years earnings uprated with the median salary
increased by 5%.
If it is more favourable to the employee, the base calculation is the average of the
20 years of the highest earnings.
Low-income affiliates who opt to distribute their contributions between the two pillars
of the insurance scheme are benefited in the public scheme (inter-generational solidarity),
with an increase of 50% of eligible allocations.
The maximum pension in 2010 was UYU 18 399.
Pension benefits are indexed according to the Median Salary Index (IMS). In 2010, the
IMS was 11.16% and in 2011, it was 12.94%.

4. PENSIONS AT A GLANCE/LATIN AMERICA AND THE CARRIBEAN – COUNTRY PROFILES – URUGUAY
PENSIONS AT A GLANCE: LATIN AMERICA AND THE CARIBBEAN © OECD, THE WORLD BANK AND IDB 2014170
Targeted
The minimum retirement pension was equal to 1.75 BPC in December 2010
(1 BPC = UYU 2 061 in 2010; 1 BPC = UYU 2 417 in 2012). This amount represented 59% of
the national minimum wage (national minimum wage = UYU 7 200 in 2012).
Variant careers
Early retirement
It is possible to qualify for early retirement if a person is fully and permanently
disabled and if the disability has been work-related.
Late retirement
Pensions benefits are granted to individual who are 70 years of age with 15 years of
contributions, or 69 years old with 17 years of contributions, or 68 years old with 19 years
of contributions, or 67 years of age with 21 years of contributions, or 66 years of age with
23 years of contributions, or 65 years of age with 25 years of contributions. The benefit
increases if the individual postpones retirement. As previously mentioned, at age 60 and
with 30 years of contributions, the replacement rate is 45%, while at age 80 and with
40 years of contributions, the replacement rate is 82.5% of earnings for contribution
calculation purposes.
Personal income tax and social security contributions
Taxation of workers
Earnings (of both employees and self-employed people) are subject to individual
income tax (IRPF). This tax is annual and payments are made monthly, it is personal
(although taxes can be paid by the family unit) and direct, at progressive rates.
Contributions to social insurance (pensions and health) can be deducted.
The monthly income scale is as follows:
Social security contributions paid by workers
Social security contributions equal 15% of gross monthly earnings. There is a ceiling of
UYU 28 067 in the pay-as-you-go system.
There is a mandatory contribution under the individual retirement savings scheme of
15% of gross monthly earnings for the bracket of UYU 28 068 to UYU 84 202 (individual
savings account scheme). The affiliate may contribute voluntarily in the income bracket
that exceeds UYU 84 203.
BPC ranges From To Rate (%)
To 7 BPC 0 14 427 0
More than 7 to 10 BPC 14 427 20 610 10
More than 10 to 15 BPC 20 610 30 915 15
More than 15 to 50 BPC 30 915 103 050 20
More than 50 to 100 BPC 103 050 206 100 22
More than 100 BPC 206 100 25
1 BPC = UYU 2 061 in 2010; for 2012, UYU 2 417.

4. PENSIONS AT A GLANCE/LATIN AMERICA AND THE CARRIBEAN – COUNTRY PROFILES – URUGUAY
PENSIONS AT A GLANCE: LATIN AMERICA AND THE CARIBBEAN © OECD, THE WORLD BANK AND IDB 2014 171
Contributions to the mandatory individual retirement scheme include an average of
1.065% of earnings for contribution calculation purposes for disability and survivors’
insurance and an average of 2.516% of these same earnings for administrative fees.
These amounts are adjusted according to the Median Salary Index, at the same time
that the increases in the remuneration of central government public officials are made.
The intergenerational solidarity retirement scheme is financed, additionally, by
employer contributions (7.5% of aggregate salaries), taxes (7% of value-added tax and
collection of the Social Security Assistance Tax) and, if necessary, with assistance from the
government.
Taxation of pension income
Retirement and pensions are taxed by the Social Insurance Assistance Tax (IASS). This
is an annual tax (paid monthly) and liabilities are taxed progressively.
The monthly income scale in effect is the following:
Social security contributions paid by pensioners
Pensioners (retirees and pensioners), with the exception of the IASS, do not contribute
to social security.
Social assistance programmes for old-age population
Social pension
In addition to the benefits granted by the contributory insurance scheme, there are
two non-contributory benefits for those who do not meet the minimum requirements in
the amount of UYU 5 000 per month. The first, known as old-age assistance, is for people
aged 65 or older and younger than 70 who do not have the resources to cover their basic
needs, live in homes that present substandard living conditions. The second, known as
old-age or disability pension, is aimed at all inhabitants of the Republic who do not have
enough resources to cover their basic needs and who are 70 years or older or who, at any
age, are fully disabled and cannot perform any remunerated work.
BPC ranges From To Rate (%)
To 8 BPC 0 19 336 0
More than 8 to 15 BPC 19 337 36 255 10
More than 15 to 50 BPC 36 256 120 850 20
More than 50 BPC 120 851 25

4. PENSIONS AT A GLANCE/LATIN AMERICA AND THE CARRIBEAN – COUNTRY PROFILES – URUGUAY
PENSIONS AT A GLANCE: LATIN AMERICA AND THE CARIBBEAN © OECD, THE WORLD BANK AND IDB 2014172
Pension modelling results: Uruguay
MenMedian earner
Individual earnings, multiple of average
Women (where different) 0.5 0.75 1.0 1.5 2.0
Gross relative pension level 42.5 26.2 39.4 52.5 79.2 126.6
(% average gross earnings)
Net relative pension level 54.1 34.8 50.3 65.9 95.7 148.4
(% net average earnings)
Gross replacement rate 52.5 52.5 52.5 52.5 52.8 63.3
(% individual gross earnings)
Net replacement rate 66.3 67.7 66.5 65.9 64.4 75.2
(% individual net earnings)
Gross pension wealth 12.1 12.1 12.1 12.1 12.2 14.1
(multiple of individual gross earnings) 14.5 14.5 14.5 14.5 14.6 16.8
Net pension wealth 12.1 12.1 12.1 12.1 12.2 14.1
(multiple of individual gross earnings) 12.5 13.0 12.5 12.3 11.9 13.3
1 2 http://dx.doi.org/10.1787/888933161821
0 0.25 0.50 0.75 1.00 1.25 1.50 1.75 2.00 0 0.25 0.50 0.75 1.00 1.25 1.50 1.75 2.00
0 0.25 0.50 0.75 1.00 1.25 1.50 1.75 2.00 0 0.25 0.50 0.75 1.00 1.25 1.50 1.75 2.00
2.5
2.0
1.5
1.0
0.5
0
2.5
2.0
1.5
1.0
0.5
0
1.25
1.00
0.75
0.50
0.25
0
1.25
1.00
0.75
0.50
0.25
0
Gross relative pension level Gross replacement rate
Net and gross relative pension levels Net and gross replacement rates
Individual earnings, proportion of average earnings Individual earnings, proportion of average earnings
Proportion of economy-wide average earnings Proportion of individual earnings
Proportion of economy-wide average earnings Proportion of individual earnings
Individual earnings, proportion of average earnings Individual earnings, proportion of average earnings
GrossNet
Earnings-relatedDC

4. PENSIONS AT A GLANCE/LATIN AMERICA AND THE CARRIBEAN – COUNTRY PROFILES – VENEZUELA
PENSIONS AT A GLANCE: LATIN AMERICA AND THE CARIBBEAN © OECD, THE WORLD BANK AND IDB 2014 173
Venezuela
Venezuela: Pension systemin 2010
The pension system has a basiccomponent and an income-related,defined-benefit component. Those whoare not eligible for a basic pensionreceive a social assistance benefit.
Key indicators
Venezuela LAC26
Average earnings VEF 42 800 30 000
USD 10 000 7 000
Public pension spending % of GDP 4.8 3.1
Life expectancy At birth 74.6 73.6
At age 65 17.3 17.4
Population over age 65 % of working-age population 10.7 12.3
Qualifying conditionsThe retirement age is 60 for men and 55 for women with a contribution record of at
least 750 weeks. The retirement age is lower for those who work in arduous jobs. Working
beyond retirement age is permitted. The insured that do not qualify for an old-age pension
may if they choose, wait until they qualify or else receive a one-time payment equivalent
to 10% of the sum previous contributions.
Benefit calculation
Old-age pension
The old-age pension benefit is equal to the national minimum wage. In 2010 the
minimum wage was VEF 1 223.89 and in 2012 VEF 1 780.45, and in September 2012 it was
increased to VEF 2 047.52. The pension is increased annually along with increases in the
national minimum wage.
The survivors’ pension benefit is also equal to the current minimum wage.
Old-age allowance
An old-age allowance is given to individuals of retirement age, but who have not met
the contribution conditions. The pension guarantee is equal to 10% of the sum of previous
contribution. Benefits are adjusted with wage and price changes.
Variant careers
Early retirement
Early retirement is not possible unless the insured works in hazardous environments
or environments that may lead to premature old age. The age limit may be reduced up to
one year for every four years worked in such conditions, not to exceed five years. If these
conditions are not met, the pension is not granted until the qualifying requirements are
met.

4. PENSIONS AT A GLANCE/LATIN AMERICA AND THE CARRIBEAN – COUNTRY PROFILES – VENEZUELA
PENSIONS AT A GLANCE: LATIN AMERICA AND THE CARIBBEAN © OECD, THE WORLD BANK AND IDB 2014174
Late retirement
Pensions are paid from the date of eligibility, when the application is submitted within
the year following that date. If the application is made later than that, the pension will
begin to be paid starting on the date that the pension is requested.
There is an additional payment of 5% of the pension for each year that it is postponed
after the insured reaches retirement age. Even though the law provides for this, in reality it
is not applied and payment begins on the date that the pension is requested.
Personal income tax and social security contributions
Taxation of workers
Employees pay income tax when they receive net annual earnings above 1 000 tax
units (TUs). People engaged in agricultural, livestock, fishing, and fish farming work at the
primary level pay taxes on gross earnings above 2 524 TUs.
Net earnings above the minimum wage up to 1 000 TUs are taxed at 6%, between
1 001 TU and 1 500 TU at 9%, between 1 501 TU and 2 000 TU at 12%, between 2 001 TU and
2 500 TU at 16%, between 2 501 TU and 3 000 TU at 20%, between 3 001 TU and 4 000 TU at
24%, between 4 001 TU and 6 000 TU at 29% and above 6 000 TU at 34%.
For 2010, the tax unit was VEF 65 (1 TU = 65 VEF). In 2012 the tax unit was equal to
VEF 90.
Social security contributions paid by workers
Private sector workers contribute 4% of their earnings to social security and up to a
ceiling equal to five minimum wages. This contribution earns them the right to long-term
benefits from old-age, invalidity, survivors’ and disability, and short-term benefits related
to compensation for medical leave or maternity leave. The contributions of the insured
also finance health, maternity and marriage benefits.
The employer pays contributions that depend on the level of the work entity:
minimum risk, 9%, medium risk, 10%, and maximum risk, 11%, of the workers’ wages.
Taxation of pensioners
Pensions are not taxed.
Social security contributions paid by pensioners
Retirees and pensioners are exempt from social contributions. If they continue to work
and receive remuneration, they contribute 4%.
Social assistance programmes for old-age population
Social pension
The social pension programme known as Gran Misión en Amor Mayor guarantees an
old-age pension from the age of 55 for women and age 60 for men, who never contributed
to the Venezuelan Social Security Institute (IVSS), and who live in families with incomes
below the minimum wage.

4. PENSIONS AT A GLANCE/LATIN AMERICA AND THE CARRIBEAN – COUNTRY PROFILES – VENEZUELA
PENSIONS AT A GLANCE: LATIN AMERICA AND THE CARIBBEAN © OECD, THE WORLD BANK AND IDB 2014 175
Pension modelling results: Venezuela
MenMedian earner
Individual earnings, multiple of average
Women (where different) 0.5 0.75 1.0 1.5 2.0
Gross relative pension level 84.6 68.8 81.5 94.2 119.6 145.1
(% average gross earnings) 80.7 66.4 78.0 89.5 112.6 135.6
Net relative pension level 88.4 71.9 85.2 98.5 125.1 151.7
(% net average earnings) 84.4 69.5 81.5 93.6 117.7 141.8
Gross replacement rate 104.4 137.6 108.7 94.2 79.8 72.5
(% individual gross earnings) 99.7 132.9 104.0 89.5 75.1 67.8
Net replacement rate 109.1 143.7 113.6 98.5 83.1 75.4
(% individual net earnings) 104.2 138.8 108.7 93.6 78.2 70.5
Gross pension wealth 18.9 24.9 19.7 17.1 14.4 13.1
(multiple of individual gross earnings) 22.5 30.0 23.5 20.2 17.0 15.3
Net pension wealth 17.8 23.4 18.5 16.0 13.6 12.3
(multiple of individual gross earnings) 21.2 28.2 22.1 19.0 15.9 14.4
1 2 http://dx.doi.org/10.1787/888933161837
0 0.25 0.50 0.75 1.00 1.25 1.50 1.75 2.00 0 0.25 0.50 0.75 1.00 1.25 1.50 1.75 2.00
0 0.25 0.50 0.75 1.00 1.25 1.50 1.75 2.00 0 0.25 0.50 0.75 1.00 1.25 1.50 1.75 2.00
2.5
2.0
1.5
1.0
0.5
0
2.5
2.0
1.5
1.0
0.5
0
1.50
1.25
1.00
0.75
0.50
0.25
0
1.50
1.25
1.00
0.75
0.50
0.25
0
Gross relative pension level Gross replacement rate
Net and gross relative pension levels Net and gross replacement rates
Individual earnings, proportion of average earnings Individual earnings, proportion of average earnings
Proportion of economy-wide average earnings Proportion of individual earnings
Proportion of economy-wide average earnings Proportion of individual earnings
Individual earnings, proportion of average earnings Individual earnings, proportion of average earnings
GrossNet
Earnings-related


ORGANISATION FOR ECONOMIC CO-OPERATIONAND DEVELOPMENT
The OECD is a unique forum where governments work together to address the economic, social and
environmental challenges of globalisation. The OECD is also at the forefront of efforts to understand and
to help governments respond to new developments and concerns, such as corporate governance, the
information economy and the challenges of an ageing population. The Organisation provides a setting
where governments can compare policy experiences, seek answers to common problems, identify good
practice and work to co-ordinate domestic and international policies.
The OECD member countries are: Australia, Austria, Belgium, Canada, Chile, the Czech Republic,
Denmark, Estonia, Finland, France, Germany, Greece, Hungary, Iceland, Ireland, Israel, Italy, Japan, Korea,
Luxembourg, Mexico, the Netherlands, New Zealand, Norway, Poland, Portugal, the Slovak Republic, Slovenia,
Spain, Sweden, Switzerland, Turkey, the United Kingdom and the United States. The European Union takes
part in the work of the OECD.
OECD Publishing disseminates widely the results of the Organisation’s statistics gathering and
research on economic, social and environmental issues, as well as the conventions, guidelines and
standards agreed by its members.
THE WORLD BANK
The World Bank is a vital source of financial and technical assistance for developing countries. It is
made up of two unique development institutions owned by 188 member countries: the International Bank
for Reconstruction and Development (IBRD) and the International Development Association (IDA).These
institutions play different but collaborative roles to advance the vision of an inclusive and sustainable
globalisation. The IBRD focuses on middle income and credit-worthy poor countries, while IDA focuses on
the poorest countries. Together they provide interest-free loans, interest-free credits, and grants to
developing countries for a wide array of purposes, including investments in education, health, public
administration, infrastructure, financial and private sector development, agriculture, and environmental
and natural resource management. The World Bank’s work focuses on achieving the Millennium
Development Goals by working with partners to alleviate poverty.
INTER-AMERICAN DEVELOPMENT BANK
Established in 1959, the IDB is the main source of multilateral financing and expertise for sustainable
economic, social and institutional development in Latin America and the Caribbean. To help the región
achieve greater economic and social progress, the IDB supports clients in the design of projects, and
provides financing, technical assistance and knowledge services to support Development interventions. In
addition, the IDB draws on the expertise of specialists in a wide range of fields in order to conduct Research
and seminars addressing key challenges for the region and evidence of successful interventions.
The IDB has developed strategies for four sector priorities: Social policy for equity and productivity;
institutions for growth and social welfare; competitive regional and global international integration; and
climate change adaptation and mitigation and sustainable and renewable energy.
The IDB shareholders are 48 member countries, including 26 Latin American and Caribbean borrowing
members, who hold a majority ownership.
OECD PUBLISHING, 2, rue André-Pascal, 75775 PARIS CEDEX 16
(81 2014 18 1 P) ISBN 978-92-64-22054-6 – 2014

Consult this publication on line at http://dx.doi.org/10.1787/pension_glance-2014-en.
This work is published on the OECD iLibrary, which gathers all OECD books, periodicals and statistical databases.Visit www.oecd-ilibrary.org for more information.
Pensions at a Glance:Latin America and the Caribbean
Pensions at a Glance: Latin America and the CaribbeanContentsIntroduction
Executive summary
Chapter 1. Policy issues: Coverage and adequacy
Chapter 2. Key demographic indicators
Chapter 3. Key pension policy indicators
Chapter 4. Pensions at a Glance: Latin America and the Caribbean – Country profi les
ISBN 978-92-64-22054-681 2014 18 1 P
Pen
sion
s at a Glance
: Latin A
merica an
d th
e Carib
bean
9HSTCQE*ccafeg+