What makes Newcrest different · The information in this presentation that relates ... all material...
67
Sandeep Biswas Managing Director and Chief Executive Officer Bank of Montreal Global Metals & Mining Conference, 27 February 2017 What makes Newcrest different
Transcript of What makes Newcrest different · The information in this presentation that relates ... all material...

Sandeep BiswasManaging Director and Chief Executive Officer
Bank of Montreal Global Metals & Mining Conference, 27 February 2017
What makes Newcrest different

Disclaimer
1
Forward Looking Statements
This presentation includes forward looking statements. Forward looking statements can generally be identified by the use of words such as “may”, “will”,
“expect”, “intend”, “plan”, “estimate”, “anticipate”, “continue”, “outlook” and “guidance”, or other similar words and may include, without limitation, statements
regarding plans, strategies and objectives of management, anticipated production or construction commencement dates and expected costs or production
outputs. The Company continues to distinguish between outlook and guidance. Guidance statements relate to the current financial year. Outlook statements
relate to years subsequent to the current financial year.
Forward looking statements inherently involve known and unknown risks, uncertainties and other factors that may cause the Company’s actual results,
performance and achievements to differ materially from statements in this presentation. Relevant factors may include, but are not limited to, changes in
commodity prices, foreign exchange fluctuations and general economic conditions, increased costs and demand for production inputs, the speculative nature of
exploration and project development, including the risks of obtaining necessary licences and permits and diminishing quantities or grades of reserves, political
and social risks, changes to the regulatory framework within which the Company operates or may in the future operate, environmental conditions including
extreme weather conditions, recruitment and retention of personnel, industrial relations issues and litigation.
Forward looking statements are based on the Company’s good faith assumptions as to the financial, market, regulatory and other relevant environments that
will exist and affect the Company’s business and operations in the future. The Company does not give any assurance that the assumptions will prove to be
correct. There may be other factors that could cause actual results or events not to be as anticipated, and many events are beyond the reasonable control of
the Company. Readers are cautioned not to place undue reliance on forward looking statements. Forward looking statements in these materials speak only at
the date of issue. Except as required by applicable laws or regulations, the Company does not undertake any obligation to publicly update or revise any of the
forward looking statements or to advise of any change in assumptions on which any such statement is based.
Competent Person’s Statement
The information in this presentation that relates to 31 December 2016 Mineral Resources or Ore Reserves has been extracted from the release titled “Annual
Mineral Resources and Ore Reserves Statement – 31 December 2016” dated 13 February 2017 (the original release). Newcrest confirms that it is not aware of
any new information or data that materially affects the information included in the original release and, in the case of Mineral Resources or Ore Reserves, that
all material assumptions and technical parameters underpinning the estimates in the original release continue to apply and have not materially changed.
Newcrest confirms that the form and context in which the competent person’s findings are presented have not been materially modified from the original
release.
Non-IFRS Financial Information
Newcrest results are reported under International Financial Reporting Standards (IFRS) including EBIT and EBITDA. This presentation also includes non-IFRS
information including Underlying profit (profit after tax before significant items attributable to owners of the parent company), All-In Sustaining Cost (determined
in accordance with the World Gold Council Guidance Note on Non-GAAP Metrics released June 2013), AISC Margin (realised gold price less AISC per ounce
sold (where expressed as USD), or realised gold price less AISC per ounce sold divided by realised gold price (where expressed as a %)), Interest Coverage
Ratio (EBITDA/Interest payable for the relevant period), Free cash flow (cash flow from operating activities less cash flow related to investing activities),
EBITDA margin (EBITDA expressed as a percentage of revenue) and EBIT margin (EBIT expressed as a percentage of revenue). These measures are used
internally by Management to assess the performance of the business and make decisions on the allocation of resources and are included in this presentation to
provide greater understanding of the underlying performance of Newcrest’s operations. The non-IFRS information has not been subject to audit or review by
Newcrest’s external auditor and should be used in addition to IFRS information. Reconciliations of non-IFRS measures to the most appropriate IFRS
measure are included on slides 59-60 of this presentation.
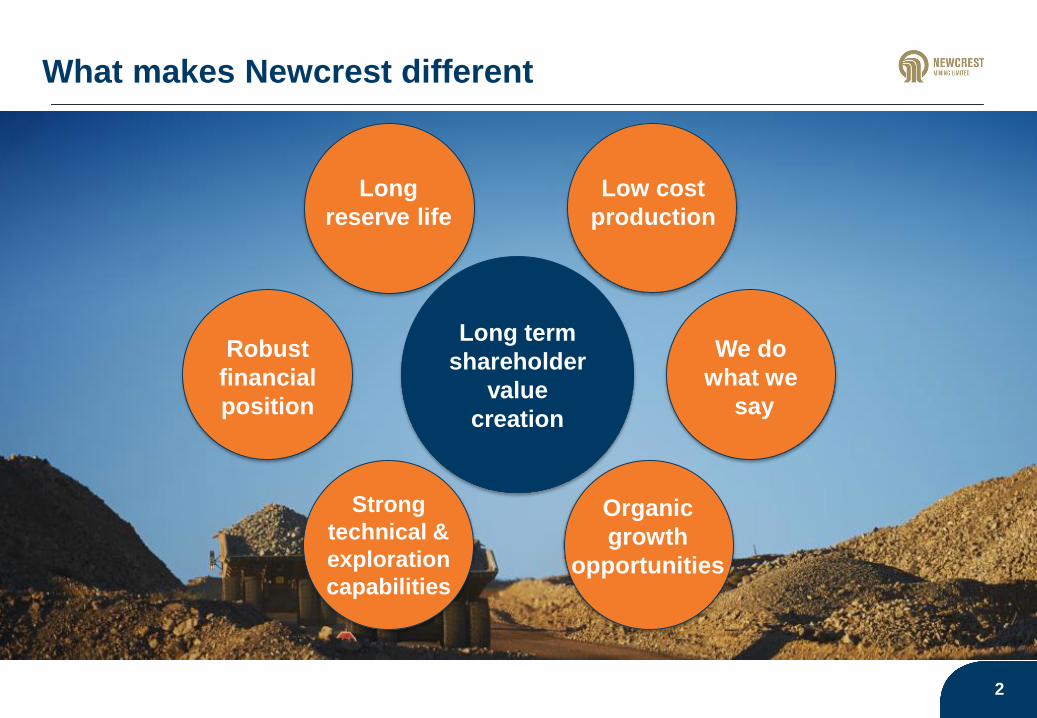
What makes Newcrest different
2
Long term
shareholder
value
creation
Long
reserve life
Low cost
production
Robust
financial
position
Organic
growth
opportunities
We do
what we
say
Strong
technical &
exploration
capabilities

Newcrest’s long reserve life
3
Note: Width of bubble size represents relative size of gold reserves,
indicative AISC margin based on $1,200 gold price
1 The data points represent each company's performance for the 12 months ended 31 December 2016. AISC data has been obtained from company statements and is calculated on a per ounce of gold sales basis.
Interest expense has been obtained from company statements. Interest expense has been divided by attributable gold sales obtained from company statements (or attributable gold equivalent ounces when only that is
available, where by-product reserves have been converted to gold equivalent at spot market prices)
2 Reserves reflect proven and probable gold reserves (contained metal) as at 31 December 2016 (other than Goldcorp which is 30 June 2016 and Gold Fields which is 31 December 2015) obtained from company
statements. Reserve life is indicative and calculated as proven and probable gold reserves (contained metal) divided by gold production for the 12 months ended 31 December 2016. The reserve life calculation does not
take into account gold recovery rates. Proven and probable gold reserve numbers and relevant production numbers have been adjusted to reflect announced divestments and acquisitions (including the divestment of
Hidden Valley by Newcrest)
Ind
icati
ve
AIS
C M
arg
in -
Inte
res
t E
xp
US
$ p
er
oun
ce
1
Indicative Reserve life years1,2
Newcrest
Gold Fields
Barrick
AngloGoldKinross
Newmont
Goldcorp
$0
$100
$200
$300
$400
$500
0 5 10 15 20 25 30 35

Reserve life of “productive”2
assets
4
1 The data points represent each company's performance for the 12 months ended 31 December 2016. AISC data has been obtained from company statements and is calculated on a per ounce of gold sales basis.
Interest expense has been obtained from company statements. Interest expense has been divided by attributable gold sales obtained from company statements (or attributable gold equivalent ounces when only that is
available, where by-product reserves have been converted to gold equivalent at spot market prices)
2 Reserves reflect proven and probable gold reserves (contained metal) as at 31 December 2016 (other than Goldcorp which is 30 June 2016 and Gold Fields which is 31 December 2015) obtained from company
statements. Reserve life is indicative and calculated as proven and probable gold reserves (contained metal) divided by gold production for the 12 months ended 31 December 2016. The reserve life calculation does not
take into account gold recovery rates. Proven and probable gold reserve numbers and relevant production numbers have been adjusted to reflect announced divestments and acquisitions (including the divestment of
Hidden Valley by Newcrest). Reserves adjusted for certain projects and assets that are not operational, dormant and/or are announced divestments. Specifically, reported reserves have been adjusted to exclude the
following: Newcrest Golpu, Namosi. Barrick: Cerro Casale (75%), Pascua-Lama, Kalgoorlie. Newmont: Conga, Ahafo Underground. Goldcorp: Coffee, Borden, Camino Rojo, Los Filos. Kinross: Cerro Casale (25%).
AngloGold: Obuasi. Gold Fields – Gruyere (50%)
Ind
icati
ve
AIS
C M
arg
in -
Inte
res
t E
xp
US
$p
er
oun
ce
1
Indicative Reserve life years1,2
Note: Width of bubble size represents relative size of gold reserves,
indicative AISC margin based on $1,200 gold price
Newcrest
Gold Fields
Barrick
AngloGoldKinross
Newmont
Goldcorp
$0
$100
$200
$300
$400
$500
0 5 10 15 20 25 30 35

Low cost production
5
AIS
C +
In
tere
st
Ex
pe
ns
e U
S$
pe
r o
un
ce
1
1 The data points represent each company's performance for the 12 months ended 31 December 2016. AISC data has been obtained from company statements and is calculated on a per ounce of gold sales
basis. Interest expense has been obtained from company statements. Interest expense has been divided by attributable gold sales obtained from company statements (or attributable gold equivalent ounces
when only that is available)
$650
$750
$850
$950
$1,050
AngloGold Kinross Gold Fields Newmont Goldcorp Barrick Newcrest
AISC/oz. Interest/oz.

Enterprise Value to Gold Equivalent Reserve Ounce1
61 Source: FactSet and company reports.
Note: Gold equivalent values based on spot commodity prices as at 21 February 2017. Enterprise values based on latest available information as at 21 February 2017
$0
$200
$400
$600
$800
$1,000

7
Unique suite of capabilities in the gold industry
Block CavingSublevel Caving
Reef
Open pit
Narrow VeinSelective
Underground
Bulk
Underground
Pressure oxidation
Cyanide & carbon in leach
Large scale comminution
Copper-gold flotationProcessing
Lihir, Telfer,
Bonikro
Telfer Gosowong Telfer Cadia

8
Value add through technical innovation
2001-2011
Ridgeway
Sublevel Cave
2009 - 2016
Ridgeway Deeps
Block Cave
2012 +
Cadia East
Block Cave
Ridgeway sublevel cave ~A$11/t2 ore mined
Ridgeway Deeps Block Cave ~A$7/t ore mined
Cadia East Block Cave ~A$6/t ore mined
1 Historical ore reserve and mineral resource figures sourced from Newcrest annual reports from 2000 to 2016.
2 Total mining costs includes all underground mining, crushing, conveying to surface and underground maintenance. Note does not include any surface crushing and conveying.
Ridgeway Sublevel Cave cost is average for FY2003-2011, Ridgeway Deeps cost is average for FY2013-2016 and Cadia East cost is average for first half FY17
0
20
40
2000 2001 2002 2003 2004 2005 2006 2007 2008 2009 2010 2011 2012 2013 2014 2015 2016
Ore reserve & Mineral resource enhanced by bulk underground mining approach1
Ore Reserve Mineral Resource

Cadia throughput growth potential
9
Ore mined by source (quarterly)
• PC2 still in ramp-up
• All PC2 drawbells expected to be fired by
end of FY17
• Targeting mill throughput of 28mtpa through
debottlenecking
• Mill permit currently 32mtpa
• Expect completion of mill expansion study by
end of March 2017
0
1
2
3
4
5
6
7
Ma
r-1
2
Jun-1
2
Sep
-12
Dec-1
2
Ma
r-1
3
Jun-1
3
Sep
-13
Dec-1
3
Ma
r-1
4
Jun-1
4
Sep
-14
Dec-1
4
Ma
r-1
5
Jun-1
5
Sep
-15
Dec-1
5
Ma
r-1
6
Jun-1
6
Sep
-16
Dec-1
6
PC1 PC2 Ridgeway
Ore
min
ed
(kt)

10
Cadia East - Indicative mine plans1,2
1 Subject to market and operating conditions and will require additional block caves. Any mine development and associated capital expenditure beyond 2017 is subject to
Board approval. See slides 57 and 58 for details as to the ore reserves at Cadia East that underpin the indicative mine plan
2 Indicative only and should not be construed as guidance
PC1 PC2
PC6
PC9PC7
PC3PC5
PC8
PC10
PC4
PC11
PC1
PC2
PC10
Schematic for illustrative purposes only
High value
Medium value
Low value
PC3PC5
PC4
Schematic for illustrative purposes only
28mtpa Baseline 32mtpa Upgrade
Timing
(Years)
Total material
movement
Plant Feed
(Mt)
Average Gold
grade g/t
Average
Copper grade
%
FY17 – 19 ~82 ~82 ~1.22 ~0.36
FY20 – 22 ~84 ~84 ~0.91 ~0.40
FY23 – 25 ~84 ~84 ~0.57 ~0.32
FY26 – 36 ~308 ~308 ~0.49 ~0.30
FY37+ Remaining Reserves
Timing
(Years)
Total material
movement
Plant Feed
(Mt)
Average Gold
grade g/t
Average
Copper grade
%
FY17 – 19 ~82 ~82 ~1.22 ~0.37
FY20 – 22 ~96 ~96 ~0.87 ~0.39
FY23 – 25 ~96 ~96 ~0.54 ~0.32
FY26 – 36 ~352 ~352 ~0.47 ~0.29
FY37+ Remaining Reserves

Lihir’s improvement journey
11
382
339
315
374
431
469
434 10.3
9.810.1
11.4
11.8
12.4 12.5
H1 H2 H1 H2 H1 H2 H1
FY14 FY15 FY16 FY17
Gold production (koz) Milling throughput (annualised mt)
(37)
84
42
84 87
220
123
1,105
1,219 1,239
1,085
890
779
913
H1 H2 H1 H2 H1 H2 H1
FY14 FY15 FY16 FY17
Free cashflow $m AISC per ounce
Gold production has increased… ...driving lower AISC and higher free cash flow

Increasing plant availability at Lihir
12
Targets for improved reliabilityImprovement activities
• Mill feed chutes
• Mill liners
• Conveyor belts
• Piping and launders
• Mill lube system
• Increased runtime from ~70% to ~80%
• Benchmark runtime of ~90%
• Key is maintenance practices and
discipline
• Improvement not reliant on large capex
AISC falls in line with increased production
Jun-14Sep-14
Dec-14
Mar-15
Jun-15
Sep-15 Dec-15
Mar-16Jun-16
Sep-16Dec-16
$0
$200
$400
$600
$800
$1,000
$1,200
$1,400
140 160 180 200 220 240 260
Quarterly production (koz)
All-
In S
usta
inin
g C
ost
(US
$/o
z)

Lihir’s indicative mine plan
13
1 As per Newcrest Annual Statement of Mineral Resources and Ore Reserves as at 31 December 2016. Full mineral resources and ore reserves tables can be found on slides 55 to 58
2 Indicative only and should not be construed as guidance. Estimates are from a prefeasibility study and as such were prepared with the objective of being subject to an accuracy range of ±25%. Subject
to further study, investment approval, receipt of all necessary permits and approvals and are subject to changes in market and operating conditions and engineering.
See release dated 15 February 2016 for further details. See slide 57 for details as to the ore reserves that underpin the indicative mine plan
3 Includes sheeting material and crusher rehandle
4 Plant feed = Ex-pit + Stockpile feed
Timing
(Years)Stage Sources
Total Material
Moved (Mt)3 Waste (Mt)Tonnes to
Stockpiles (Mt)
Ex-pit Tonnes
Fed (Mt)
Stockpile Tonnes
Fed (Mt)Plant Feed (Mt)4 Average Feed
Grade g/t
FY17-21 1Minifie & Lienetz, medium grade
stockpiles, and pre-strip320 - 330 160 - 170 30 - 35 25 - 30 40 - 45 65 - 75 ~2.7
FY22–26 2Lienetz & Kapit, medium / low grade
stockpiles and pre-strip360 - 370 150 - 160 60 - 65 27 - 32 38 – 43 65 - 75 ~2.4
FY27–31 3Lienetz & Kapit and low grade
stockpiles340 - 350 150 - 160 45 - 50 38 - 43 27 – 32 65 - 75 ~2.8
FY32+ 4 Remaining Reserves Subject to on-going study
Dry Tonnes
(Millions)
Grade
(g/t)
Insitu Gold
(Moz)
Ore Reserves 360 2.3 26
Mineral
Resources800 2.2 56
Gold
Mineral Resource & Ore Reserves1
Indicative mine plan based on PFS2

Using data science to solve real problems
14
• Cadia - Optimised Real-time Bogging (ORB) system• Automated dispatch system driven by a complex
mathematical algorithm
• Developed for Newcrest
• Optimises bogger movements for cave shape and
downstream plant feed
• Has increased productivity by 20%
• Lihir - Mill overload predictive model• Previously, had 200+ mill overload events in a 1 year period
• This resulted in downtime and throughput rate loss
• Analysed 360 million rows of data across 130 variables
• Now able to predict mill overload events 1 hour beforehand
and take corrective action
• Implemented January 2017
Visualisation predicting mill overload as seen by site asset operation centre operators
Operator using Optimised Real-time Bogging system
Gauge – Action Required

Near term(0-2yrs)
Medium term
(2-10yr)
Longer term(10+yr)
Strong organic growth pipeline1
15
• Lihir 14mtpa mill throughput
rate2
• Cadia 28mtpa mill
throughput rate2
• Lihir beyond 14mtpa mill
throughput rate2
• Cadia plant expansion
• Golpu development
• Telfer drilling for new areas
• Near surface West African
deposits & Indonesian
epithermal targets
• Early stage entry pipeline
• Porphyry exploration targets
• Application of block caving
expertise to new areas
• Technology step change
advancements
1 Subject to further study, investment approval, receipt of all necessary permits and approvals and market and operating conditions and engineering
2 This should not be construed as production guidance from the Company now or in the future. Potential production and throughput rates are subject to a range of contingencies
which may affect performance

Experienced exploration team
16
Long life mines = time to explore
Smarter targeting for deeper deposits
Ability to mine all types of ore bodies
1
2
3
Source: Minex consulting 2016
Depth of Discoveries
Approach to smarter targeting

Exploration Potential - Early stage entry arrangements
17
Nicaragua
Topacio project
(O & FI)
Ecuador
SolGold investment
(EI)
New Zealand
• LNJV Gold Project (FI)
• Rahu project (FI)
Australia
• Second Junction Reefs project (JV)
PNG
• Wamum project (100%)
• Tatau / Big Tabar Island
(O & FI)
Indonesia
• Antam Alliance
Cote d’Ivoire
• Séguéla project (O)
• OSEAD project (FI)
• Kodal Minerals – Dabakala (FI)
• Cape Lambert Dabakala (100%)
• Randgold HoA (50% JV)
Key:
• FI = Farm-in
• JV = Joint Venture
• 100% = 100% Newcrest tenement
• EI = Equity investment in company
• O = Option
Existing search space
Knowledge build
New search space
Argentina
Pedernales
epithermal/porphyry
project (FI)

Robust financial position
18
Six consecutive halves of positive free cash flow
$0
$200
$400
$600
$800
FY14 H2 FY15 H1 FY15 H2 FY16 H1 FY16 H2 FY17 H1
$m
• Strong free cash flow generation
• $1.8bn of net debt reduction
• Gearing ratio 34% 21%
• Leverage ratio 2.6x 1.3x
• Recommenced paying dividends
Over the last two-and-a-half years

Good debt structure and clean balance sheet
191 All Newcrest’s debt is denominated in USD
2 Relative to other major gold peers. Provision (discounted) of $254m at 31 December 2016, reflecting an estimate of ~$300m (undiscounted).
Maturity profile as at 31 December 20161
($m
)
-
300
600
900
1,200
FY17 FY18 FY19 FY20 FY21 FY22 FY23 FY24 FY25 FY42
US Private Placement Notes Corporate Bonds
• No goodwill remaining on the balance sheet
• No unfunded pension liabilities
• Relatively low level of future mine rehabilitation costs2

What makes Newcrest different
20
~27 years1
reserve life
$770H1 FY17 AISC per ounce
1 2 LOW COST PRODUCERHAVE A LOT OF GOLD
>3 yearsof maintaining or exceeding
Group guidance
DO WHAT WE SAY3
Lihir, Cadia
and Golpu
Exploration capability
Mine and process all
types of gold orebodies
4 5 EXPLORATION &
TECHNICAL CAPABILITY
ORGANIC GROWTH
1.3xNet Debt / EBITDA leverage
ratio2 at 31 December 2016
FINANCIALLY ROBUST6
1 Reserve life is indicative and calculated as proven and probable gold reserves (contained metal) as at 31 December 2016 divided by gold production for the 12 months ended 31 December
2016 excluding the production from the divested Hidden Valley. The reserve life calculation does not take into account gold recovery rates and therefore estimate of reserve life does not
necessarily equate to operating mine life
2 Based on Net Debt as of 31 December 2016 and EBITDA for the 12 months to 31 December 2016

21
Q&A

22
Appendices
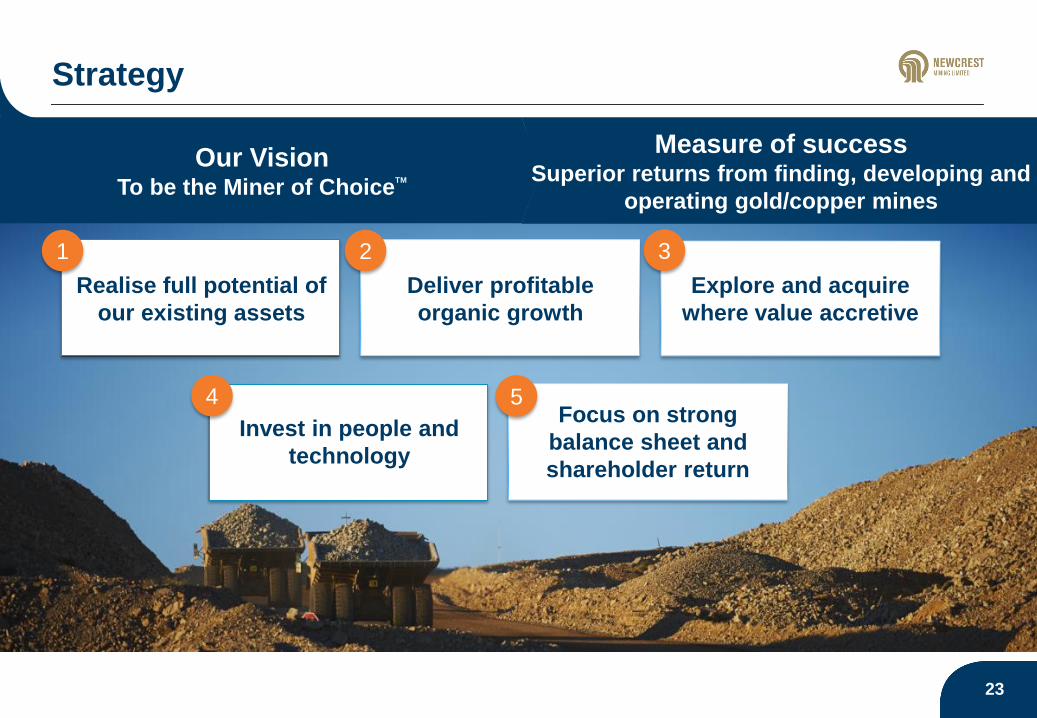
Strategy
23
1 2
Deliver profitable
organic growth
Realise full potential of
our existing assets
Explore and acquire
where value accretive
3
Our VisionTo be the Miner of Choice
TM
Measure of successSuperior returns from finding, developing and
operating gold/copper mines
4 5
Invest in people and
technology
Focus on strong
balance sheet and
shareholder return

2424

H1 FY17 TRIFR (per million man hours)
25
Safety update
0
2
4
6
8
10
12
14
Group Cadia Telfer Gosowong Bonikro Lihir
Critical Control Management Verifications1
1,995
96,163
Field
testing
underway
Process Safety
• Baseline review of all sites completed
• Finalising updated piping and
instrumentation diagrams for future risk
identification
1 Since commencement February 2016

H1 FY17 highlights
261 Based on Net Debt as at 31 December 2016 and EBITDA for the 12 months to 31 December 2016
1 2ON TRACK TO MEET
PRODUCTION GUIDANCESTRONG CASH FLOW
GENERATION
1.23moz Au H1FY17
49kt Cu H1FY17
3 PROGRESSED GROWTH
OPTIONS
4 REDUCED DEBT,
DIVIDEND ANNOUNCED
Leverage ratio 1.3x1
Gearing ratio 20.8%
Interim dividend of US 7.5 cents
• Operating cash flow $601m
• Investing cash flow $343m
• Free cash flow $258m

Our performance Edge
27
The visionOur relentless drive to realise the
full potential of our assets
Measure of successSafely maximising cash generation
Stretch Targets
Aspirational targets that drive
breakthrough thinking and
step-change innovation
Owner’s Mindset
A strong owner’s mindset and
behaviours with a bias to action
and a high-performance,
no-nonsense culture
Operating discipline
Rapidly identify and capture
opportunities to safely increase
free cash flow
1 2 3
+ +
Performance Edge is a key source of our competitive advantage to become the
Miner of ChoiceTM

Maintaining our focus on EDGE
Management operating system and frontline
engagement
Strengthening
our asset
management
Improving
operational
stability and
predictability
Unlocking
value through
technology
and digital
Value
drivers
Enablers
Capture of potential additional value
Increasing workforce participation in Edge
Operating model
• Edge program FY17
• Improve business performance
• Conducted opportunity reviews
• Increased focus on Technology and
Digital to identify opportunities
• Examples
• Improving the productivity in the
Telfer M-Reefs
• Improving the control logic in the
Cadia SAOC
• Trialling fixed choke removal and
new blast tube designs in Lihir
autoclaves
• Gosowong pillar extraction method
28

Our people plan
2929
Our people visionTalented people working together to
their full potential
Measure of successHigh performance no-nonsense culture with top
quartile organisational health
The right structure, systems
and tools to effectively recruit,
develop, reward and retain our
global workforce
The right people in the right
roles with the right skills,
working in high performing
teams and building careers
Our different backgrounds and
perspectives help us find better
ways and make Newcrest a
better place to work
Adopt high performance practices in everything we do
Get the basics
right
Develop our
people and
capability
Create a diverse
and inclusive
environment
1 2 3
+ +

H1 FY17 summary by asset
30
Lihir
Pro
duction k
oz
AIS
C $
/oz
Hig
hlig
hts
Cadia Telfer
• Achieved 13mtpa mill
throughput rate target
• Total plant shut in Sept Qtr
• Increased stripping and
sustaining capex
• PC1 and PC2 connected
• Achieved 26.4mtpa mill
throughput rate in Dec Qtr
• Progressed plant expansion
study
• Developing the Western
Flanks
• Exploration for near mine
deposits
318 350 287
382 374
H1 H2 H1 H2 H1
FY15 FY16 FY17
315 374
431 469
434
H1 H2 H1 H2 H1
FY15 FY16 FY17
275 245 243 219 222
H1 H2 H1 H2 H1
FY15 FY16 FY17
210 197 246 295 258
H1 H2 H1 H2 H1
FY15 FY16 FY17
1,239 1,085
890 779
913
H1 H2 H1 H2 H1
FY15 FY16 FY17
760 824 955 979 1,026
H1 H2 H1 H2 H1
FY15 FY16 FY17

H1 FY17 summary by asset
31
Gosowong Bonikro
• Increasing production following
recommencement of mining
(post 2016 geotechnical event)
• Improved production and unit
cost
• Contributed $20m in free
cash flow
Pro
duction k
oz
AIS
C $
/oz
Hig
hlig
hts
134
197
141
57
123
H1 H2 H1 H2 H1
FY15 FY16 FY17
48 72 74 64 67
H1 H2 H1 H2 H1
FY15 FY16 FY17
794 651 737
1,494
867
H1 H2 H1 H2 H1
FY15 FY16 FY17
988
574 797
1,106 1,078
H1 H2 H1 H2 H1
FY15 FY16 FY17

Cadia – Cash generation plus growth potential
32
Key Statistics
Production (koz) All-In Sustaining Cost ($/oz) Free Cash Flow ($m)4
Site Process
Gold Reserve Life: ~33 years1
Gold Reserves: 25 moz
Gold Resources: 43 moz
Copper Reserves: 4.4 mt
Copper Resources: 8.7 mt
FY17 Prod. Guidance:730-820koz Au,
~65ktCu2
FY16 AISC: $274/oz
Permitted Processing: 32mtpa
Workforce (FTE)3: 712 employees,
421 contractors
(Dec 2016)
Element Description
Mining Panel Cave mining from
Cadia East (Panel Cave 1
and 2), with underground
crushing and conveyor to
surface
Processing High pressure grinding rolls,
SAG mills, ball mills,
flotation and gravity
concentration
Output Principally copper/gold
concentrate with some gold
doré
1 Reserve life is indicative and calculated as proven and probable gold reserves (contained metal) as at 31 December 2016 divided by gold production for the 12 months ended 31 December
2016. The reserve life calculation does not take into account gold recovery rates and therefore estimate reserve life does not necessarily equate to operating mine life. Full gold and copper
mineral resources and ore reserves tables can be found on slides 55 to 58
2 Achievement of guidance is subject to market and operating conditions
3 Employees are Newcrest directly employed FTEs, contractor FTEs include full time embedded contractors and project, replacement labour and other contractors
4 Free cash flow is before interest and tax
Cadia
306 287 318
350 287
382 374
H1 H2 H1 H2 H1 H2 H1
FY14 FY15 FY16 FY17
278 322
210 197 246
295 258
H1 H2 H1 H2 H1 H2 H1
FY14 FY15 FY16 FY17
103134 130
358
154
328267
H1 H2 H1 H2 H1 H2 H1
FY14 FY15 FY16 FY17

Cadia – PC1 and PC2 connection occurred
33
• Safely and successfully connected Panel Cave 1 (PC1) to Panel Cave 2 (PC2)
• Reduces major hazard risk
• Continue to monitor PC2 progression to surface breakthrough
EXTRACTION DRIVE 102EXTRACTION DRIVE 102

Cadia mill expansion – progress update1
34
• Increase throughput through debottlecking opportunities
• Select process plant capital configuration
• Targeting completion of PFS in Q3 FY17
• Targeting completion of Plant Expansion FS by end FY18
• Ongoing engagement with community and stakeholders
• Targeting completion of equipment installation in ~FY20
1 Target dates are subject to further study, investment approval, receipt of all necessary permits and approvals and are subject to changes in market and operating conditions and
engineering
Execution
Prefeasibility
Study
Feasibility
Study
Permitting &
Community
On track
On track
28mtpa In progress
On track

Review of historical Cadia East capital costs
35
ItemApproximate Cost
(A$M)Physical Cost Rate Detail
Mine
Decline ~240 8km x 2 declines A$15,000/m Concrete roadways, cuddies, stockpiles, etc.
Conveyors & Transfer stations ~170 8km A$20,000/m Conveyors to surface
PC1 Macro-block ~210 70,000m2
A$3,000/m2
PC2 Macro-block ~300 100,000m2
A$3,000/m2
Crusher station ~450 3 crushers A$150mIncludes excavation, all equipment and transfer
conveyor to main incline conveyor
Ventilation ~320 4 circuits A$80m/circuit Raises, fans, lateral developement, etc.
Mine services ~100Equipment, dewatering, heavy vehicle
reticulation, workshops, etc.
Surface
Concentrator upgrades ~350
Concentrate dewatering ~30
Infrastructure ~90 Roads, tailings, water, power, buildings
Studies & project delivery ~400CS, PFS, FS + Project Delivery (EPCM, Owners,
Temp Facilities, Spares) + Corporate Costs
Total approximate cost ~2,660

Lihir – Turnaround continues
36
Key StatisticsSite Process
Gold Reserve Life: ~29 years1
Gold Reserves: 26 moz
Gold Resources: 56 moz
FY17 Prod. Guidance: 880-980koz Au2
FY16 AISC: $830/oz
Workforce (FTE)3: 2,331 employees
2,085 contractors
(Dec 2016)
Element Description
Mining Open pit drill, blast, load
and haul mining, currently in
Phase 9 of Minifie Pit and
Phase 14 in Lienitz.
Substantial stockpiles
Processing Crushing, grinding, flotation,
pressure oxidation, NCA
circuit
Output Gold dore
1 Reserve life is indicative and calculated as proven and probable gold reserves (contained metal) as at 31 December 2016 divided by gold production for the 12 months ended 31 December
2016. The reserve life calculation does not take into account gold recovery rates and therefore estimate reserve life does not necessarily equate to operating mine life. Full gold mineral
resources and ore reserves tables can be found on slides 55 to 58
2 Achievement of guidance is subject to market and operating conditions
3 Employees are Newcrest directly employed FTEs, contractor FTEs include full time embedded contractors and project, replacement labour and other contractors
4 Free cash flow is before interest and tax
Production (koz) All-In Sustaining Cost ($/oz) Free Cash Flow ($m)4
Lihir
382 339 315
374 431
469 434
H1 H2 H1 H2 H1 H2 H1
FY14 FY15 FY16 FY17
1,105 1,219 1,239
1,085 890
779 913
H1 H2 H1 H2 H1 H2 H1
FY14 FY15 FY16 FY17
(37)
8442
84 87
220
123
H1 H2 H1 H2 H1 H2 H1
FY14 FY15 FY16 FY17

Lihir - Increasing mill throughput intensity
37
• First stage of increasing mill throughput is increasing intensity
• Experience to date:
Increasing
Max
Capacity
Focus on
operations
Removing
constraints
• Change in operating strategy in December 2014 removed
autoclave as a constraint
• Able to process all material via flotation circuit when required
• Continue to upgrade equipment (eg conveyor drives, flotation
circuit pump capacity)
• Increased SAG and ball mill power utilisation
• Increased focus on pebble crusher utilisation and efficiency
• Process control, instrumentation and automation

Partial oxidation – a refresher
38
Microcrystalline pyrite1
Crystalline (blocky) pyrite1
• More reactive and high gold grades
• Particle oxidises more rapidly,
liberating gold faster
• Less reactive and low gold grades
• Gold on rim liberated first, but low
grade, pyrite core takes
substantially longer to oxidise1 Shown for illustrative purposes, represent the end members of pyrite types
Old Operating Strategy (pre Dec 2014)
Current Operating Strategy (post Dec 2014)
Ore Types
• Focus on metallurgical recovery
• Oxidise 90% of sulphur
• Only process ore with certain sulphur
characteristics
• Residence time ~70 minutes
• If autoclave capacity constrained (e.g. for
repair) rest of plant slows down
• Maximise economic recovery of gold
• Oxidation varies to feed sulphur rate
• Much less constrained by sulphur content
• If autoclave capacity constrained (e.g. for
repair) rest of plant continues, increased
material sent to floatation

Recovery focus of Float Tails Leach Stage 2
39
Flotation
Neutralisation
Carbon
Adsorption
(NCA)
Pressure Oxidation
(POX)
Final
Tails
Cyclone Thickener
Oxidised
Slurry Tank
Fine sulphides and
cyanide soluble gold
Float tails
Open / close valve
Closed at
flotation start
up, otherwise
open
Open at
flotation start
up, otherwise
closed
• Start up loss minimisation
When flotation starts up, all
output goes to POX rather than
direct to tails. Once circuit is
settled, float tails redirected via
cyclone
• Float tails leach (stage 2)
• Currently ~15% of gold
processed through
floatation is lost
• Stage 2 will decrease float
losses
Other improvements:
• New carbon kiln in NCA circuit
to reduce fouling of carbon &
reduce soluble gold loss
Slurry
Slurry
Concentrate
Start up loss
minimisation
Float Tails LeachExplanation

Wafi-Golpu Potential – An update1
40
Wafi-Golpu
Near term drilling completed with 5 holes - data interpretation in progress
Refining hydrogeological models to improve interpretation
Evaluating alternate terrestrial storage & deep sea tailings (DSTP) options, including DSTP environmental monitoring
Assessing multiple Port options
Ongoing assessment of power alternatives
To be progressed once Special Mining Lease, fiscal stability and Board approvals are obtained
Geotechnical
interpretation
Hydrology
Port
Tailings
Management
Power
Access
Declines
1 Newcrest owns 50% of the project (if the PNG government exercises full buy-in option, Newcrest’s ownership would reduce to 35%)
41
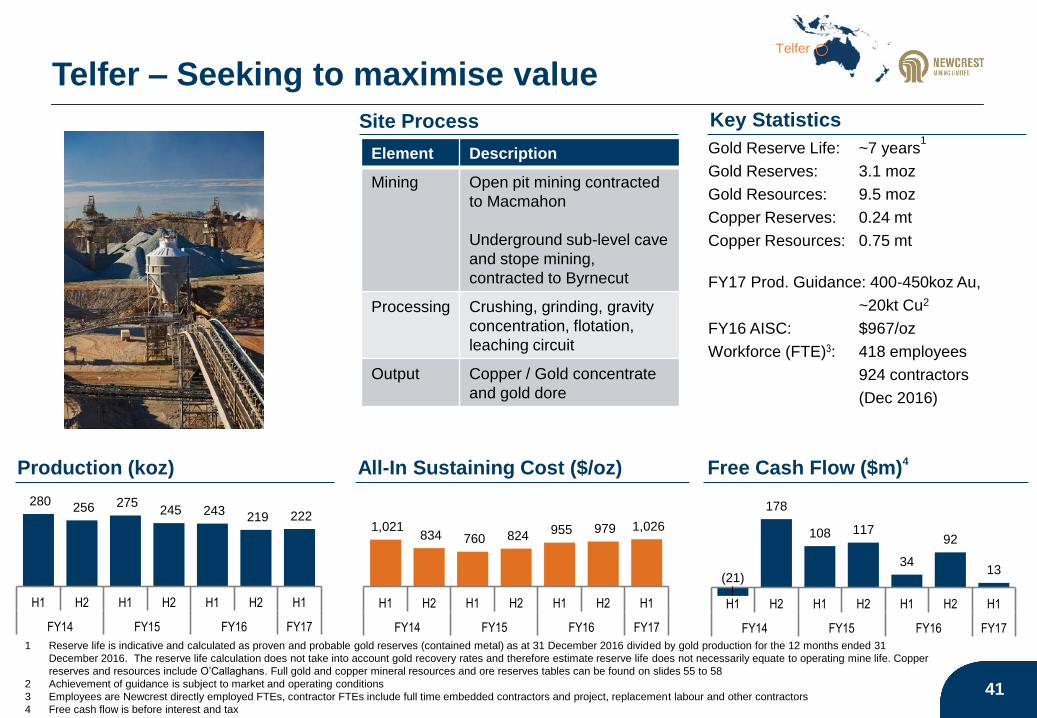
Key StatisticsSite Process
Gold Reserve Life: ~7 years1
Gold Reserves: 3.1 moz
Gold Resources: 9.5 moz
Copper Reserves: 0.24 mt
Copper Resources: 0.75 mt
FY17 Prod. Guidance: 400-450koz Au,
~20kt Cu2
FY16 AISC: $967/oz
Workforce (FTE)3: 418 employees
924 contractors
(Dec 2016)
Element Description
Mining Open pit mining contracted
to Macmahon
Underground sub-level cave
and stope mining,
contracted to Byrnecut
Processing Crushing, grinding, gravity
concentration, flotation,
leaching circuit
Output Copper / Gold concentrate
and gold dore
1 Reserve life is indicative and calculated as proven and probable gold reserves (contained metal) as at 31 December 2016 divided by gold production for the 12 months ended 31
December 2016. The reserve life calculation does not take into account gold recovery rates and therefore estimate reserve life does not necessarily equate to operating mine life. Copper
reserves and resources include O’Callaghans. Full gold and copper mineral resources and ore reserves tables can be found on slides 55 to 58
2 Achievement of guidance is subject to market and operating conditions
3 Employees are Newcrest directly employed FTEs, contractor FTEs include full time embedded contractors and project, replacement labour and other contractors
4 Free cash flow is before interest and tax
Production (koz) All-In Sustaining Cost ($/oz) Free Cash Flow ($m)4
Telfer
Telfer – Seeking to maximise value
280 256 275
245 243 219 222
H1 H2 H1 H2 H1 H2 H1
FY14 FY15 FY16 FY17
1,021 834 760 824
955 979 1,026
H1 H2 H1 H2 H1 H2 H1
FY14 FY15 FY16 FY17
(21)
178
108 117
34
92
13
H1 H2 H1 H2 H1 H2 H1
FY14 FY15 FY16 FY17

Telfer – New techniques identified new drill targets
42
• Seismic survey and development of new structural and mineralisation model has identified
new targets that sit outside the current area of drilling
• Plans for targets to be drill tested in the next six months
Potential
Target
West Dome Main Dome Projected
Pit Outline
DHTEL_01 DHTEL_02
Potential Target
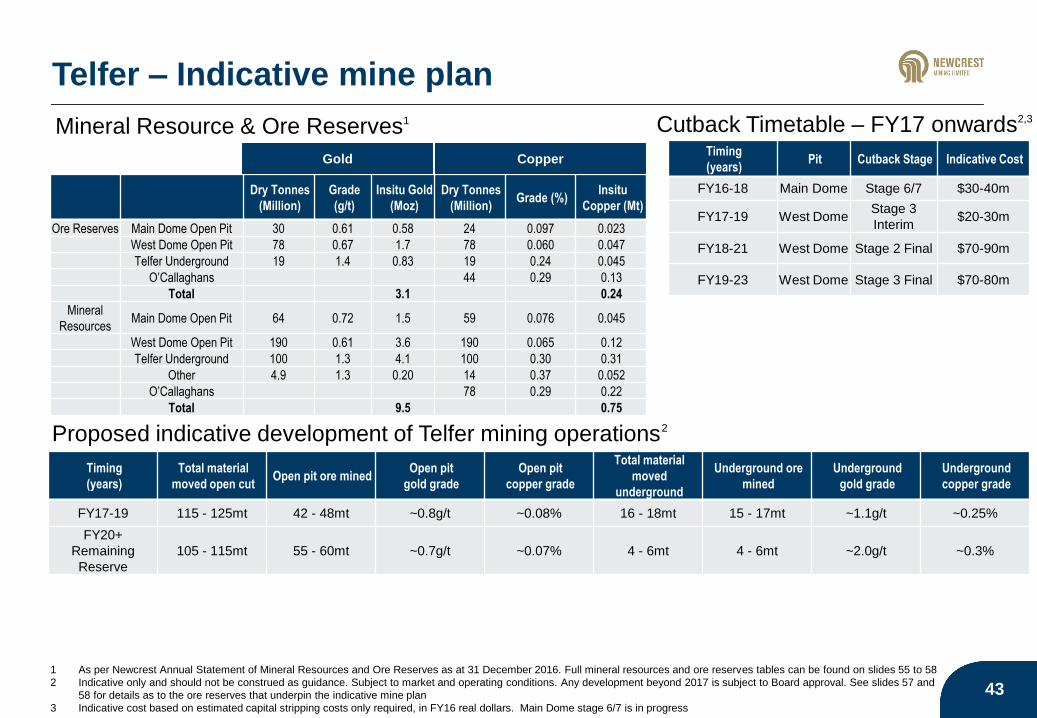
Telfer – Indicative mine plan
43
Timing
(years)
Total material
moved open cutOpen pit ore mined
Open pit
gold grade
Open pit
copper grade
Total material
moved
underground
Underground ore
mined
Underground
gold grade
Underground
copper grade
FY17-19 115 - 125mt 42 - 48mt ~0.8g/t ~0.08% 16 - 18mt 15 - 17mt ~1.1g/t ~0.25%
FY20+
Remaining
Reserve
105 - 115mt 55 - 60mt ~0.7g/t ~0.07% 4 - 6mt 4 - 6mt ~2.0g/t ~0.3%
Proposed indicative development of Telfer mining operations2
1 As per Newcrest Annual Statement of Mineral Resources and Ore Reserves as at 31 December 2016. Full mineral resources and ore reserves tables can be found on slides 55 to 58
2 Indicative only and should not be construed as guidance. Subject to market and operating conditions. Any development beyond 2017 is subject to Board approval. See slides 57 and
58 for details as to the ore reserves that underpin the indicative mine plan
3 Indicative cost based on estimated capital stripping costs only required, in FY16 real dollars. Main Dome stage 6/7 is in progress
Cutback Timetable – FY17 onwards2,3
Timing
(years)Pit Cutback Stage Indicative Cost
FY16-18 Main Dome Stage 6/7 $30-40m
FY17-19 West DomeStage 3
Interim$20-30m
FY18-21 West Dome Stage 2 Final $70-90m
FY19-23 West Dome Stage 3 Final $70-80m
43
Dry Tonnes
(Million)
Grade
(g/t)
Insitu Gold
(Moz)
Dry Tonnes
(Million)Grade (%)
Insitu
Copper (Mt)
Ore Reserves Main Dome Open Pit 30 0.61 0.58 24 0.097 0.023
West Dome Open Pit 78 0.67 1.7 78 0.060 0.047
Telfer Underground 19 1.4 0.83 19 0.24 0.045
O’Callaghans 44 0.29 0.13
Total 3.1 0.24
Mineral
ResourcesMain Dome Open Pit 64 0.72 1.5 59 0.076 0.045
West Dome Open Pit 190 0.61 3.6 190 0.065 0.12
Telfer Underground 100 1.3 4.1 100 0.30 0.31
Other 4.9 1.3 0.20 14 0.37 0.052
O’Callaghans 78 0.29 0.22
Total 9.5 0.75
Gold Copper
Mineral Resource & Ore Reserves1

Gosowong – Operations resumed
44
Key Statistics1
Site Process
Gold Reserve Life: ~3 years2
Gold Reserves: 0.58 moz
Gold Resources: 1.4 moz
FY17 Prod. Guidance: 220-270koz Au3
FY16 AISC: $935/oz
Workforce (FTE)4: 1,130 employees
629 contractors
(Dec 2016)
Production (koz) All-In Sustaining Cost ($/oz) Free Cash Flow ($m)5
1 The figures shown represent 100%. Newcrest owns 75% of Gosowong through its holding in PT Nusa Halmahera Minerals, an incorporated joint venture
2 Reserve life is indicative and calculated as proven and probable gold reserves (contained metal) as at 31 December 2016 divided by gold production for the 12 months ended 31
December 2016. The reserve life calculation does not take into account gold recovery rates and therefore estimate reserve life does not necessarily equate to operating mine life. Full
gold mineral resources and ore reserves tables can be found on slides 55 to 58
3 Achievement of guidance is subject to market and operating conditions
4 Employees are Newcrest directly employed FTEs, contractor FTEs include full time embedded contractors and project, replacement labour and other contractors
5 Free cash flow is before interest and tax
Gosowong
Element Description
Mining Underground mining using
predominantly underhand
cut-and-fill (Kencana) and
long hole stopes with paste
fill (Toguraci)
Processing Crushing, grinding, gravity,
leaching
Output Gold and silver dore
149
196
134
197
141
57
123
H1 H2 H1 H2 H1 H2 H1
FY14 FY15 FY16 FY17
911
625 794
651 737
1,494
867
H1 H2 H1 H2 H1 H2 H1
FY14 FY15 FY16 FY17
6881 83
104
75
(27)
47
H1 H2 H1 H2 H1 H2 H1
FY14 FY15 FY16 FY17
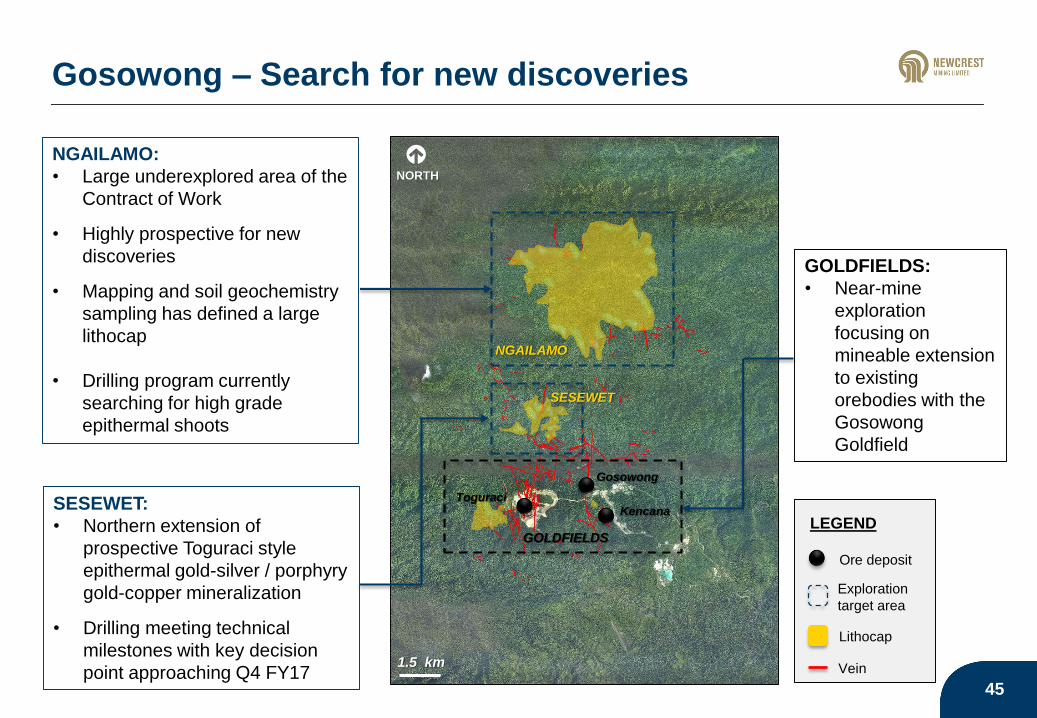
Gosowong – Search for new discoveries
NGAILAMO
NORTH
1.5 km
Gosowong
KencanaToguraciSESEWET:
• Northern extension of
prospective Toguraci style
epithermal gold-silver / porphyry
gold-copper mineralization
• Drilling meeting technical
milestones with key decision
point approaching Q4 FY17
GOLDFIELDS
GOLDFIELDS:
• Near-mine
exploration
focusing on
mineable extension
to existing
orebodies with the
Gosowong
Goldfield
NGAILAMO:
• Large underexplored area of the
Contract of Work
• Highly prospective for new
discoveries
• Mapping and soil geochemistry
sampling has defined a large
lithocap
• Drilling program currently
searching for high grade
epithermal shoots
SESEWET
LEGEND
Exploration
target area
Vein
Ore deposit
Lithocap
45
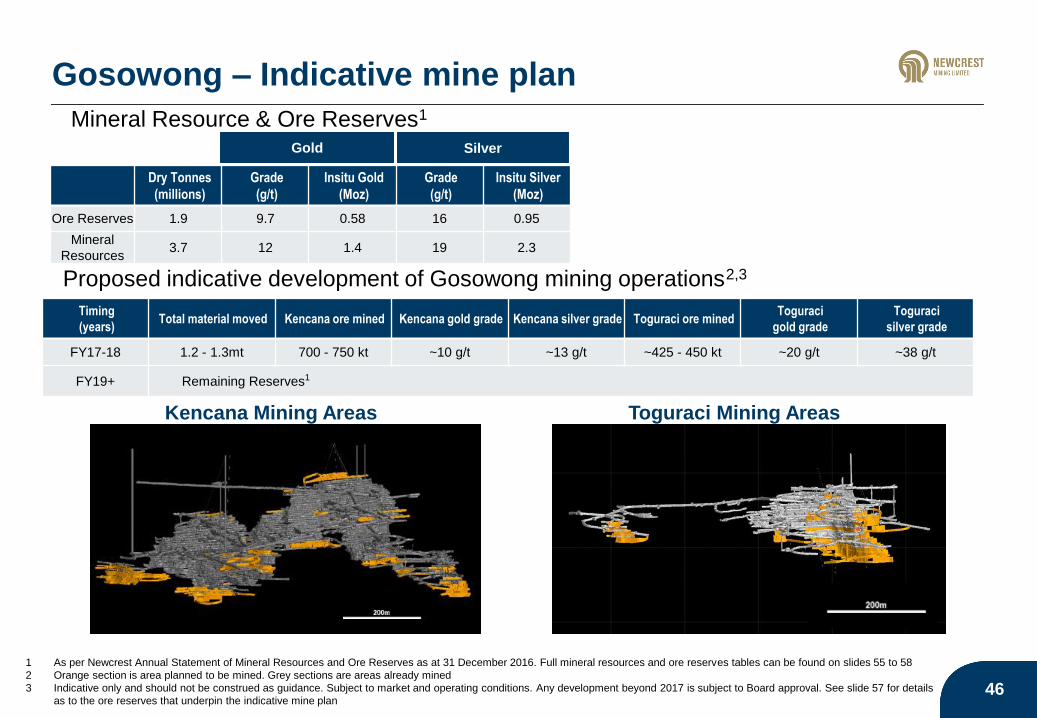
Gosowong – Indicative mine plan
Timing
(years)Total material moved Kencana ore mined Kencana gold grade Kencana silver grade Toguraci ore mined
Toguraci
gold grade
Toguraci
silver grade
FY17-18 1.2 - 1.3mt 700 - 750 kt ~10 g/t ~13 g/t ~425 - 450 kt ~20 g/t ~38 g/t
FY19+ Remaining Reserves1
Proposed indicative development of Gosowong mining operations2,3
1 As per Newcrest Annual Statement of Mineral Resources and Ore Reserves as at 31 December 2016. Full mineral resources and ore reserves tables can be found on slides 55 to 58
2 Orange section is area planned to be mined. Grey sections are areas already mined
3 Indicative only and should not be construed as guidance. Subject to market and operating conditions. Any development beyond 2017 is subject to Board approval. See slide 57 for details
as to the ore reserves that underpin the indicative mine plan46
Kencana Mining Areas Toguraci Mining Areas
Dry Tonnes
(millions)
Grade
(g/t)
Insitu Gold
(Moz)
Grade
(g/t)
Insitu Silver
(Moz)
Ore Reserves 1.9 9.7 0.58 16 0.95
Mineral
Resources3.7 12 1.4 19 2.3
Gold Silver
Mineral Resource & Ore Reserves1

Bonikro – Solid cash flow
47
Key Statistics1
Site Process
Gold Reserve Life: ~3 years2
Gold Reserves: 0.43 moz
Gold Resources: 1.2 moz
FY17 Prod. Guidance: 120-145koz Au3
FY16 AISC: $941/oz
Workforce (FTE)4: 533 employees
502 contractors
(Dec 2016)
Element Description
Mining Open pit drill, blast, load and
haul mining at Hiré pits
(approximately 15km from
Bonikro)
Processing Crushing, grinding, gravity,
carbon-in-leach
Output Gold dore
1 The figures shown represent 100%. Bonikro includes mining and near-mine exploration interests in Cote d’Ivoire which are held by the following entities: LGL Mines CI SA (of which Newcrest
owns 89.89%) and Newcrest Hiré CI SA (of which Newcrest owns 89.89%)
2 Reserve life is indicative and calculated as proven and probable gold reserves (contained metal) as at 31 December 2016 divided by gold production for the 12 months ended 31 December
2016. The reserve life calculation does not take into account gold recovery rates and therefore estimate reserve life does not necessarily equate to operating mine life. Full gold mineral
resources and ore reserves tables can be found on slides 55 to 58
3 Achievement of guidance is subject to market and operating conditions
4 Employees are Newcrest directly employed FTEs, contractor FTEs include full time embedded contractors and project, replacement labour and other contractors
5 Free cash flow is before interest and tax
Production (koz) All-In Sustaining Cost ($/oz) Free Cash Flow ($m)5
Bonikro
40
55 48
72 74 64 67
H1 H2 H1 H2 H1 H2 H1
FY14 FY15 FY16 FY17
1,368
914 988
574 797
1,106 1,078
H1 H2 H1 H2 H1 H2 H1
FY14 FY15 FY16 FY17
(4)
31
1
41
2419 20
H1 H2 H1 H2 H1 H2 H1
FY14 FY15 FY16 FY17

Bonikro – Indicative mine plan
Proposed indicative development of Bonikro mining operations2
1 As per Newcrest Annual Statement of Mineral Resources and Ore Reserves as at 31 December 2016. Full mineral resources and ore reserves tables can be found on slides 55 to 58
2 Indicative only and should not be construed as guidance. Subject to market and operating conditions. Any development beyond 2017 is subject to Board approval. See slide 57 for
details as the ore reserves that underpin the indicative mine plan. 48
Dry Tonnes
(Millions)
Grade
(g/t)
Insitu Gold
(Moz)
Ore Reserves 11 1.2 0.43
Mineral
Resources29 1.3 1.2
Gold
Mineral Resource & Ore Reserves1
TimingSources
Total Material
Moved (Mt)Waste (Mt)
Tonnes to
Stockpiles (Mt)
Ex-pit Tonnes
Fed (Mt)
Stockpile Tonnes
Fed (Mt)Plant Feed (Mt)
Average Feed
Grade g/t (Years)
FY17-18
Akissi-so Pit
29 - 33 25 - 28 0 – 0.5 3 - 4 ~1 4 - 5 ~2.0 - 2.2Assondji-so Pit
Chappelle Pit
Bonikro LG Stockpile
FY19-22Remaining Reserves
(LG Stockpile)

Antenna
Porphyry
Gabbro
Agouti
Boulder
Séguéla
100 km
AFRICA
Yamoussoukro
Abidjan
CÔTE D’IVOIRE
Antenna Prospect
• New zone of
mineralisation
discovered
• Drilling ongoing to
define extent and
controls of the
mineralisation
Porphyry Prospect
• Drilling testing of
the second priority
target underway
Séguéla
• Portfolio of gold targets
defined
• Drilling testing of first target
Antenna – intersected high
grade mineralisation
Séguéla – Emerging gold belt
49
256 km
Bonikro Mine

Improved profitability
50
Underlying Profit Movement
($m
)
• Statutory profit of $187m & Underlying profit of $273m
• Statutory profit and Underlying profit increased 131% and 333% compared to prior period1
• $62m increase due to gold and copper sales volumes
• $201m increase due to gold and copper price increases
• Income tax expense increased due to higher profit
1 Prior period refers to H1 FY16
63
200 1 1943
(2)
5
(15)
40
(6) (1)(76)
2 273
H1
FY
16
Gold
price
Co
ppe
r p
rice
Gold
sale
s v
olu
mes
Co
ppe
r sale
s v
olu
me
s
Silv
er
reve
nue
Ope
ratin
g c
osts
FX
on o
pe
ratin
g c
osts
De
pre
cia
tion
FX
on d
ep
recia
tion
Co
rpora
te a
nd
oth
er
Inco
me t
ax e
xpen
se
No
n c
ontr
olli
ng
in
tere
sts
H1
FY
17
Operating Costs
$(10) million
Depreciation &
Amortisation
$34 million
Revenue
$261 million

Cadia, 267Lihir, 123
Gosowong, 47
Bonikro, 20
Telfer, 13 Hidden Valley, 4
Free cash flow positive at all sites
51
($m
)
1 Free cash flow is before income tax paid
2 Average realised gold price of $1,277 per ounce is the US$ spot prices at the time of sale per unit of metal sold (net of hedges of Telfer gold production only) excluding the impact of
price related finalisations for metals in concentrate
3 Telfer AISC margin calculated with reference to the Group average realised gold price
All In Sustaining Cost margin H1 FY172
$/oz
507
1019
410 364251 199 25
Free cash flow1 by site H1 FY17
$m
3

Newcrest’s H1 FY17 margins
52
Operating Margins
%
All In Sustaining Cost margin H1 FY17
$/oz
Production H1 FY17
koz
507
1019
410 364 251 199 25
1,230
374123
434222 67 11
35%
12%
31%
43%
23%
38%
43%
26%
40%
H1 FY16 H2 FY16 H1 FY17
EBITDA EBIT AISC

40% Replacement of Reserves
20% Diversity
20% Grow th
Comparative cost
position33%
Relative Total
Shareholder Return (TSR)
33% ROCE
33%
An aligned executive remuneration structure
531 Personal measures represent those of the CEO. Each of the CEO, CFO and other Executives have different personal measures
Short Term Incentive Criteria1
Long Term Incentive Criteria

Long-term metal assumptions used for Reserves
and Resources estimates1
54
Long Term Metal
Assumptions
Newcrest &
MMJV
Gold Price US$1,300/oz
Copper Price US$3.40/lb
Silver Price US$21.00/oz
Mineral Resources Estimates
Gold Price US$1,200/oz
Copper Price US$3.00/lb
Silver Price US$18.00/oz
Ore Reserves Estimates
Long Term FX Rate USD:AUD 0.80
1 As per Newcrest Annual Statement of Mineral Resources and Ore Reserves as at 31 December 2016

Mineral Resources and Ore Reserves
55
31 December 2016 Gold Mineral Resources1
1 As per Newcrest Annual Statement of Mineral Resources and Ore Reserves as at 31 December 2016
NOTE: Data is reported to two significant figures to reflect appropriate precision in the estimate and this may cause some apparent discrepancies in totals1 Gosowong (inclusive of Toguraci and Kencana) is owned and operated by PT Nusa Halmahera Minerals, an incorporated joint venture company (Newcrest 75%). The figures shown represent 100% of the Mineral Resource.2 Bonikro is inclusive of mining and exploration interests in Côte d’Ivoire held by LGL Mines CI SA (Newcrest, 89.89%) and Newcrest Hiré CI SA (Newcrest 89.89%). The figures shown represent 100% of the Mineral Resource. 3 MMJV refers to projects owned by the Morobe Mining unincorporated joint ventures between subsidiaries of Newcrest (50%) and Harmony Gold Mining Company Limited (50%). The figures shown represent 50% of the Mineral
Resource.4 Namosi refers to the Namosi unincorporated joint venture, in which Newcrest has a 70.75% interest. The figures shown represent 70.75% of the Mineral Resource at December 2016 compared to 70.67% of the Mineral Resource
at December 2015.
Dec-16 Mineral Resources
Operational Provinces
Cadia East Underground 0.18 1.1 3,000 0.38 - - 3,000 0.38 36 2,800 0.40 36
Ridgeway Underground - - 110 0.56 41 0.38 150 0.51 2.4 150 0.51 2.5
Other 140 0.47 120 0.38 39 0.40 310 0.43 4.2 310 0.43 4.2
Total Cadia Province 43 43
Main Dome Open Pit 16 0.40 49 0.83 0.27 0.65 64 0.72 1.5 62 0.74 1.5
West Dome Open Pit - - 180 0.61 7.7 0.60 190 0.61 3.6 170 0.65 3.6
Telfer Underground - - 84 1.2 18 1.5 100 1.3 4.1 110 1.5 5.7
Other - - 0.44 2.9 4.4 1.1 4.9 1.3 0.20 4.9 1.3 0.20
Total Telfer Province 9.5 11
Lihir Glenn Patterson-Kane 86 2.1 600 2.2 120 2.1 800 2.2 56 820 2.2 57
Gosowong 1 Rob Taube - - 3.1 12 0.62 8.4 3.7 12 1.4 4.1 12 1.6
Bonikro 2 Paul Dunham 8.7 0.74 19 1.4 1.6 2.0 29 1.3 1.2 32 1.4 1.4
MMJV - Hidden Valley Operations (50%) 3 Greg Job - - - - - - - - - 42 1.6 2.1
Total Operational Provinces 110 120
Non-Operational Provinces
MMJV - Golpu / Wafi & Nambonga (50%) 3 Paul Dunham / Greg Job - - 400 0.86 99 0.74 500 0.83 13 500 0.83 13
Namosi JV (70.75%) 4 Vik Singh - - 1,300 0.11 220 0.10 1,500 0.11 5.4 1,500 0.11 5.4
Marsden Stephen Guy - - - - - - - - - 180 0.20 1.1
Total Non-Operational Provinces 19 20
Total Gold Mineral Resources 130 140
Stephen Guy
James Biggam
Insitu Gold
(million
ounces)
Dry
Tonnes
(million)
Measured Resource Indicated Resource Inferred Resource Dec-16 Total ResourceComparison to Dec-15
Total Resource
Gold
Grade
(g/t Au)
Dry
Tonnes
(million)
Gold
Grade
(g/t Au)
Insitu Gold
(million
ounces)
Dry
Tonnes
(million)
Gold
Grade
(g/t Au)
Gold Mineral Resources(inclusive of Gold Ore Reserves)
Dry
Tonnes
(million)
Gold
Grade
(g/t Au)
Dry
Tonnes
(million)
Gold
Grade
(g/t Au)
Competent Person

Mineral Resources and Ore Reserves
56
31 December 2016 Copper Mineral Resources1
1 As per Newcrest Annual Statement of Mineral Resources and Ore Reserves as at 31 December 2016
NOTE: Data is reported to two significant figures to reflect appropriate precision in the estimate and this may cause some apparent discrepancies in totals5 MMJV refers to projects owned by the Morobe Mining unincorporated joint ventures between subsidiaries of Newcrest (50%) and Harmony Gold Mining Company Limited (50%). The figures shown represent 50% of the Mineral
Resource.6 Namosi refers to the Namosi unincorporated joint venture, in which Newcrest has a 70.75% interest. The figures shown represent 70.75% of the Mineral Resource at December 2016 compared to 70.67% of the Mineral Resource
at December 2015.
Dec-16 Mineral Resources
Operational Provinces
Cadia East Underground 0.18 0.33 3,000 0.26 - - 3,000 0.26 7.8 2,800 0.26 7.4
Ridgeway Underground - - 110 0.30 41 0.40 150 0.33 0.48 150 0.33 0.49
Other 140 0.13 120 0.17 39 0.25 310 0.16 0.49 310 0.16 0.49
Total Cadia Province 8.7 8.4
Main Dome Open Pit 10 0.10 49 0.070 0.27 0.056 59 0.076 0.045 56 0.095 0.053
West Dome Open Pit - - 180 0.065 7.7 0.075 190 0.065 0.12 170 0.057 0.10
Telfer Underground - - 84 0.28 18 0.44 100 0.30 0.31 110 0.31 0.35
Other - - - - 14 0.37 14 0.37 0.052 14 0.37 0.052
O'Callaghans - - 69 0.29 9.0 0.24 78 0.29 0.22 78 0.29 0.22
Total Telfer Province 0.75 0.78
Total Operational Provinces 9.5 9.2
Non-Operational Provinces
MMJV - Golpu / Wafi & Nambonga (50%) 5 Paul Dunham / Greg Job - - 340 1.1 88 0.71 430 1.0 4.4 430 1.0 4.4
Namosi JV (70.75%) 6 Vik Singh - - 1,300 0.34 220 0.41 1,500 0.35 5.4 1,500 0.35 5.3
Marsden Stephen Guy - - - - - - - - - 180 0.38 0.67
Total Non-Operational Provinces - Copper 10 10
Total Copper Mineral Resources 19 20
Dry
Tonnes
(million)
Copper Mineral Resources(inclusive of Copper Ore Reserves)
Dry
Tonnes
(million)
Copper
Grade
(% Cu)
Dry
Tonnes
(million)
Copper
Grade
(% Cu)
Copper
Grade
(% Cu)
Dry
Tonnes
(million)
Copper
Grade
(% Cu)
Comparison to Dec-15
Total Resource
Dry
Tonnes
(million)
Copper
Grade
(% Cu)
Insitu Copper
(million
tonnes)
Insitu Copper
(million
tonnes)
Measured Resource Indicated Resource Inferred Resource
Competent Person
Dec-16 Total Resource
James Biggam
Stephen Guy

Mineral Resources and Ore Reserves
57
31 December 2016 Gold Ore Reserves1
1 As per Newcrest Annual Statement of Mineral Resources and Ore Reserves as at 31 December 2016
Note: Data is reported to two significant figures to reflect appropriate precision in the estimate and this may cause some apparent discrepancies in totals.9 Gosowong (inclusive of Toguraci and Kencana) is owned and operated by PT Nusa Halmahera Minerals, an incorporated joint venture company (Newcrest 75%). The figures shown represent 100% of the Ore Reserve.10 Bonikro is inclusive of mining and exploration interests in Côte d’Ivoire held by LGL Mines CI SA (Newcrest, 89.89%) and Newcrest Hiré CI SA (Newcrest 89.89%). The figures shown represent 100% of the Ore Reserve.11 MMJV refers to projects owned by the Morobe Mining unincorporated joint ventures between subsidiaries of Newcrest (50%) and Harmony Gold Mining Company Limited (50%). The figures shown represent 50% of the Ore Reserve.12 Namosi refers to the Namosi unincorporated joint venture, in which Newcrest has a 70.75% interest. The figures shown represent 70.75% of the Ore Reserve at December 2016 compared to 70.67% of the Ore Reserve at December 2015.
Dec-16 Ore Reserves
Operational Provinces
Cadia East Underground - - 1,500 0.48 1,500 0.48 23 1,500 0.47 23
Ridgeway Underground - - 80 0.54 80 0.54 1.4 82 0.55 1.4
Other 23 0.30 67 0.59 90 0.52 1.5 90 0.52 1.5
Total Cadia Province 25 26
Main Dome Open Pit 16 0.40 14 0.85 30 0.61 0.58 40 0.63 0.82
West Dome Open Pit - - 78 0.67 78 0.67 1.7 84 0.68 1.8
Telfer Underground - - 19 1.4 19 1.4 0.83 24 1.4 1.1
Total Telfer Province 3.1 3.8
Lihir Steven Butt 86 2.1 280 2.3 360 2.3 26 370 2.3 28
Gosowong 9 Mark Kaesehagen - - 1.9 9.7 1.9 9.7 0.58 1.8 13 0.76
Bonikro 10 Daniel Moss 8.7 0.74 2.7 2.6 11 1.2 0.43 13 1.3 0.54
MMJV - Hidden Valley Operations (50%) 11 Greg Job - - - - - - - 14 1.7 0.78
Total Operational Provinces 56 59
Non-Operational Provinces
MMJV - Golpu (50%) 11 Pasqualino Manca - - 190 0.91 190 0.91 5.5 190 0.91 5.5
Namosi JV (70.75%) 12 - - 940 0.12 940 0.12 3.7 940 0.12 3.7
Total Non-Operational Provinces 9.2 9.2
Total Gold Ore Reserves 65 69
Dry
Tonnes
(million)
Gold
Grade
(g/t Au)
Insitu Gold
(million
ounces)
Gold
Grade
(g/t Au)
Dry
Tonnes
(million)
Gold
Grade
(g/t Au)
Insitu Gold
(million
ounces)
Competent Person
Proved Reserve Probable Reserve Dec-16 Total ReserveComparison to Dec-15
Total Reserve
Gold Ore ReservesDry
Tonnes
(million)
Gold
Grade
(g/t Au)
Dry
Tonnes
(million)
Ron Secis
Geoff Newcombe
Geoff Newcombe

Mineral Resources and Ore Reserves
58
31 December 2016 Copper Ore Reserves1
1 As per Newcrest Annual Statement of Mineral Resources and Ore Reserves as at 31 December 2016
Note: Data is reported to two significant figures to reflect appropriate precision in the estimate and this may cause some apparent discrepancies in totals.13 MMJV refers to projects owned by the Morobe Mining unincorporated joint ventures between subsidiaries of Newcrest (50%) and Harmony Gold Mining Company Limited (50%). The figures shown represent 50% of the Ore Reserve.14 Namosi refers to the Namosi unincorporated joint venture, in which Newcrest has a 70.75% interest. The figures shown represent 70.75% of the Ore Reserve at December 2016 compared to 70.67% of the Ore Reserve at December
2015.
Dec-16 Ore Reserves
Operational Provinces
Cadia East Underground - - 1,500 0.28 1,500 0.28 4.0 1,500 0.27 4.2
Ridgeway Underground - - 80 0.28 80 0.28 0.23 82 0.29 0.23
Other 23 0.14 67 0.15 90 0.14 0.13 90 0.14 0.13
Total Cadia Province 4.4 4.5
Main Dome Open Pit 10 0.10 14 0.091 24 0.097 0.023 34 0.091 0.031
West Dome Open Pit - - 78 0.060 78 0.060 0.047 84 0.058 0.049
Telfer Underground - - 19 0.24 19 0.24 0.045 24 0.28 0.067
O'Callaghans - - 44 0.29 44 0.29 0.13 47 0.28 0.13
Total Telfer Province 0.24 0.28
Total Operational Provinces 4.6 4.8
Non-Operational Provinces
MMJV - Golpu (50%) 13 Pasqualino Manca - - 190 1.3 190 1.3 2.4 190 1.3 2.4
Namosi JV (70.75%) 14 Geoff Newcombe - - 940 0.37 940 0.37 3.5 940 0.37 3.5
Total Non-Operational Provinces 5.9 5.9
Total Copper Ore Reserves 11 11
Dry
Tonnes
(million)
Copper
Grade
(% Cu)
Competent Person
Proved Reserve Probable Reserve
Copper Ore ReservesDry
Tonnes
(million)
Copper
Grade
(% Cu)
Dry
Tonnes
(million)
Copper
Grade
(% Cu)
Insitu Copper
(million
tonnes)
Dry
Tonnes
(million)
Copper
Grade
(% Cu)
Insitu Copper
(million
tonnes)
Comparison to Dec-15 Total
ReserveDec-16 Total Reserve
Geoff Newcombe
Ron Secis

“Underlying Profit” reconciliation
59
6 months ended 31 December 2016
US$m
31 December 2015
US$m
Statutory Profit 187 81
Loss on business divestment 10 -
Net investment hedge loss1
62 -
Write-down of non-current assets1
14 -
Gain on disposal of investment - (18)
Total Significant Items 86 (18)
Underlying Profit2
273 63
Non-controlling interests3
6 8
Income tax expense4
118 42
Net finance costs 66 75
EBIT 463 188
Depreciation and amortisation 320 357
EBITDA 783 545
1 After tax and non-controlling interests
2 Underlying profit has been presented to assist in the assessment of the relative performance of the Group
3 Excludes significant items attributable to non-controlling interests
4 Excludes income tax applicable to significant items

AISC and AIC to cost of sales reconciliation
60
6 months to 31 December 2016 6 months to 31 December 2015
US$m US$/oz US$m US$/oz
Gold sales (koz)1 1,215 1,199
Cost of Sales 1,292 1,063 1,316 1,099
less Depreciation and amortisation (313) (258) (347) (290)
less By-product revenue (255) (210) (213) (178)
plus Corporate costs 26 21 27 22
plus Sustaining exploration 3 3 7 6
plus Production stripping and underground mine development 46 38 19 16
plus Sustaining capital expenditure 126 104 99 82
plus Rehabilitation accretion and amortisation 11 9 15 12
All-In Sustaining Costs 936 770 923 770
plus Non-sustaining capital expenditure 103 84 68 56
plus Non-sustaining exploration 20 16 11 10
All-In Cost 1,059 870 1,002 837
1 For the 6 months ended 31 December 2016 production and sales volumes include 1,220 gold ounces and 138 tonnes of copper related to the development of the Cadia East
project. For the 6 months ended 31 December 2015, the comparable volumes were 778 gold ounces and 122 tonnes of copper. Expenditure associated with this production and
revenue from the sales are capitalised and not included in the operating profit calculations

Operating costs – exchange rate exposure estimates
61
Newcrest is a US dollar reporting entity, its operating costs will vary in accordance with the movements in
its operating currencies where those costs are not denominated in US dollars. The table below shows
indicative currency exposures on operating costs by site:
USD AUD PGK IDR CFA Other Total
Cadia 15% 85% - - - - 100%
Telfer 15% 85% - - - - 100%
Lihir 40% 25% 30% - - 5% 100%
Gosowong 35% 5% - 60% - - 100%
Bonikro 55% 5% - - 40% - 100%
Group 30% 50% 10% 5% 3% 2% 100%

Operating costs – indicative costs by type
62
Labour2 Consumables
Maintenance
(excl labour)
and Parts
Energy and
FuelOther3 Total
Cadia 40% 15% 15% 20% 10% 100%
Telfer 35% 15% 15% 15% 20% 100%
Lihir 40% 15% 20% 15% 10% 100%
Gosowong 40% 20% 5% 15% 20% 100%
Bonikro 45% 15% 20% 5% 15% 100%
Group 40% 15% 15% 15% 15% 100%
1 Operating costs excludes realisation costs including royalties, concentrate freight and TC/RCs
2 Labour data includes salaries, on costs, contractor costs, consultant costs, training and incentive payments
3 Other includes a range of costs, including travel, community and environment, inward freight and insurance
The below represents an indicative exposure on operating costs1 by a variety of spend types (FY16)
(excluding Hidden Valley)

Foreign exchange sensitivities1
and oil hedges
63
1 Each sensitivity is calculated on a standalone basis and formulated on the basis of assumptions which, amongst other things, include the level of costs incurred, the currency in
which those costs are incurred and production levels. Sensitivities are rounded to nearest whole million dollar. Information provided on current information and is subject to
market and operating conditions
2 Rates rounded to nearest $1 (rate) and volume to the nearest thousand (bbl, Mt). Totals may not match sum due to rounding. Amounts represent approximately 50% of
expected usage for 12 months January 2017 to December 2017. For the period from 1 January 2018, Newcrest will adjust its hedging policy to only hedge 50% of power
generation fuel at Lihir and Gosowong, and 50% of fuel for non-power requirements at Lihir
Site Parameter MovementApproximate Full Year
EBIT Impact (US$m)
Cadia AUD/USD +0.01 AUD (0.73 → 0.74) (7)
Telfer AUD/USD +0.01 AUD (0.73 → 0.74) (2)
Lihir USD/PGK -0.1 PGK (3.1 → 3.0) (10)
Gosowong USD/IDR -1,000 IDR (14,000 → 13,000) (10)
Bonikro USD/CFA -50 CFA (544 → 494) (5)
Group AUD/USD +0.01 AUD (0.73 → 0.74) (15)
Site2 FuelJanuary 2017 – December 2017
Hedge volume/rateUnit
Cadia Gasoil 44 ’000 bbl
Lihir Gasoil 162 ’000 bbl
Telfer Gasoil 115 ’000 bbl
Gosowong Gasoil 117 ’000 bbl
Total Gasoil 438 ’000 bbl
Average hedge rate 58 $/bbl
Lihir HSFO 105 ’000 Metric tonne
Average hedge rate 255 $/Metric tonne

FY17 guidance1
64
Element Cadia Lihir Telfer Goso-
wong
Bonikro Hidden
Valley
Corp /
Other
Group
Gold Production (koz) 730-820 880-980 400-450 220-270 120-145 ~10 - 2,350-2,600
Copper Production (kt) ~65 - ~20 - - - - 80-90
AISC ($m) 230-270 765-850 450-480 200-230 130-150 10-15 75-85 1,880-2,060
Capital Expenditure
- Production Stripping2 - 60-75 15-20 - 10-15 - - 85-110
- Sustaining Capital2 70-80 105-125 55-65 30-45 10-15 ~1 ~15 295-335
- Major Capital 85-105 30-35 20-30 - - - 20-30 165-200
Total Capital 155-185 195-235 90-115 30-45 20-30 ~1 35-45 545-645
Exploration3
60-80
Depreciation 675 - 735
1 Achievement of guidance is subject to operating and market conditions
2 Production stripping and sustaining capital shown above are included in All-In Sustaining Cost
3 Exploration is not included in Total Capital

65

NEWCREST MINING LIMITED
66
Board
Peter Hay Non-Executive Chairman
Sandeep Biswas Managing Director and CEO
Gerard Bond Finance Director and CFO
Philip Aiken AM Non-Executive Director
Roger Higgins Non-Executive Director
Winifred Kamit Non-Executive Director
Rick Lee AM Non-Executive Director
Xiaoling Liu Non-Executive Director
Vickki McFadden Non-Executive Director
John Spark Non-Executive Director
Company Secretaries
Francesca Lee & Claire Hannon
Registered & Principal Office
Level 8, 600 St Kilda Road, Melbourne, Victoria, Australia 3004
Telephone: +61 (0)3 9522 5333
Facsimile: +61 (0)3 9522 5500
Email: [email protected]
Website: www.newcrest.com.au
Stock Exchange Listings
Australian Securities Exchange (Ticker NCM)
New York ADR’s (Ticker NCMGY)
Port Moresby Stock Exchange (Ticker NCM)
Forward Shareholder Enquiries to
Link Market Services
Tower 4, 727 Collins Street
Docklands, Victoria, 3008
Australia
Telephone: 1300 554 474
+61 1300 554 474
Facsimile: +61 (0)2 9287 0303
Email: [email protected]
Website: www.linkmarketservices.com.au
Investor Enquiries
Chris Maitland
+61 3 9522 5717
+1 (844) 310-1232
Ryan Skaleskog
+61 3 9522 5407
+1 (844) 310-1232 from
Media Enquiries
Anna Freeman
+61 3 9522 5548