What is the energy of the future?
16
What is the Energy of the Future? Nicolas Meilhan Principal Consultant, Frost & Sullivan April 2015
-
Upload
nicolas-meilhan -
Category
Business
-
view
6.689 -
download
1
Transcript of What is the energy of the future?

What is the Energy of the Future?
Nicolas Meilhan
Principal Consultant, Frost & Sullivan
April 2015

2
Evolution of world primary energy consumption - Million tons of oil equivalent , 1860 to 2012 -
What is the energy of the past? Oil remains by far the main source of world energy, but has lost market share to gas and coal
Sources: Shilling et al., 1977, et BP Statistical Review, 2013
30%
27%
22%
8%
6%
4%
2%
80%
Biomass
Nuclear
Natural gas
Coal Oil
Hydro
Wind, solar &
geothermal

3
Isn’t coal the energy of the past? Yes it is as it fuelled the industrial revolution during the 18th century. But it might as well be
the energy of the future as it could surpass oil as the most primary energy used by 2030
Electricity production from coal - % of total electricity production, 2012 -
Source: World Bank, BP Statistical Review of World Energy 2014
Coal currently provides 40% of the world's electricity needs, accounts for 40% of
CO2 emissions and as much as 60% of CO2 emissions increase since 2000
1 %
5 %
10 %
15 %
20 %
25 %
30 %
35 %
40 %
0 %
45 %
50 %
Coal consumption per capita - Tons of oil equivalent, 2013 -

What do we use this energy for? Transport is almost exclusively based on oil, while industry relies on massive coal and gas
usage
* Including non-energetic use
Sources: BP Energy Outlook 2035, IEA
World primary energy consumption mix - % of million tons of oil equivalent, 2013 -
4
Hydroelectricity
+ Nuclear Energy
+ Renewables
Natural gas
Industry* Transport Agriculture, residential,
commercial & public service
Oil
Coal
46% 17% 36%
95%
12% 21%
39%
28%
13%
25%
28%
34% 19%
22%
31%
28%
34%
2% 3%
Brazil Mexico
Switzerland
Belgium India
Spain
Italy Sounth Korea
Netherlands
United Kingdom
France Japan
Germany
China
United States
0
500
1000
1500
2000
2500
0% 10% 20% 30% 40% 50% 60% 70% 80% 90%
Exp
ort
s o
f g
oo
d &
se
rvic
es (
bn
$)
Electricity production from coal (% of total electricity production)
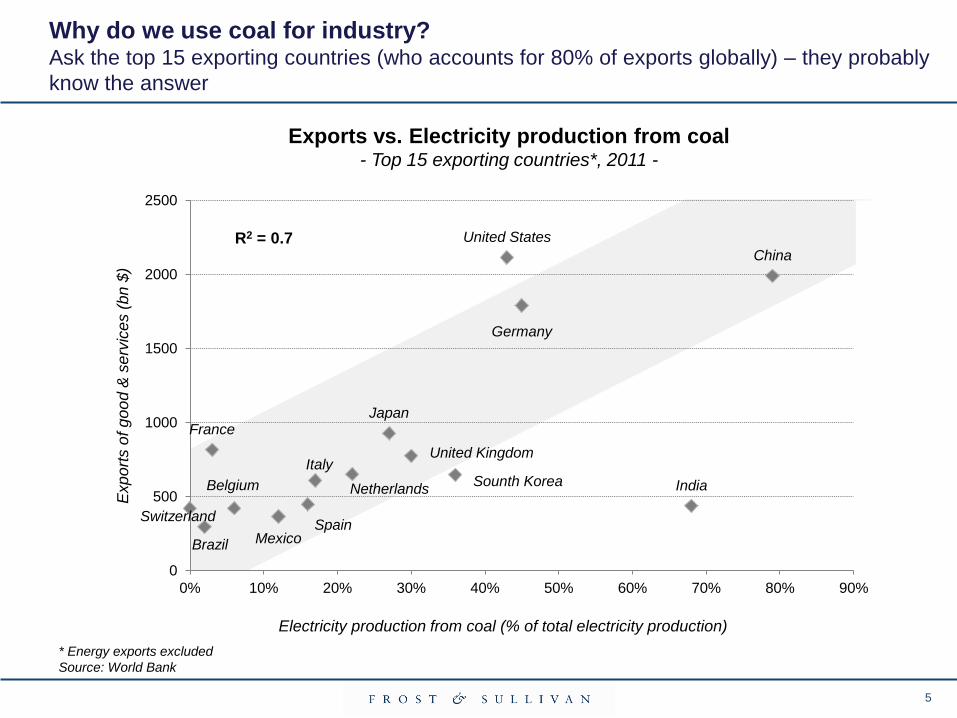
Why do we use coal for industry? Ask the top 15 exporting countries (who accounts for 80% of exports globally) – they probably
know the answer
* Energy exports excluded
Source: World Bank
5
Exports vs. Electricity production from coal - Top 15 exporting countries*, 2011 -
R2 = 0.7

Why do we use oil for transport? 1kg of oil contains as much energy as in 100 kg of batteries
Source : Pierre-René Bauquis, Richard Heinberg
Energy density of energy vectors used in transport
Energy density
Sp
ecific
en
erg
y
6
“If the building of the Great Pyramid required 10,000 people working for 20 years, then the
petroleum based energy used in the US on an average day build 100 Great Pyramids”
Richard Heinberg

Are we really running out of fossil fuels? Knowing whether we’ll still have fossil fuels in 2100 is not the issue – the critical issue is
for how long we will have affordable oil to fuel our economy (and our cars..)
Liquid fuels extraction simulation - 1900 to 2100 -
7
“It's not the size of the tank which matters, but the size of the tap”
Jean-Marie Bourdaire
Extr
actio
n in
bill
ion
s o
f o
il b
arr
els
pe
r ye
ar
Source : Jean-Marie Bourdaire, Patrick Brocorens

8
Do we really need affordable oil to fuel our global economy? Four of the last five global recessions were preceded by an oil shock
Economic Recession vs. Oil Price
Source: Steven Kopits, June 2009, Douglas Westwood, Oil: What price can America afford?, EIA, NBER

Houston, we have a problem Higher cost new oil projects require $80/bbl+ oil price to be profitable while oil demand (hence
GDP per capita) contracts when oil price surpasses $100 in the US and $120 in China
9
Breakeven price of for various US plays (single well) tight oil B
rea
ke
ve
n p
rice
(U
S$
/bb
l)
Source: The Oxford Institute for Energy Studies Mars 2014, Douglas-Westwood Associates
Source: TPH and HPDI (Global Shale Conference, 21 November 2013); BE required for 10% IRR, including
capital recovery. The authors indicate that the chart includes large number of conventional and non-
conventional which generally have less attractive economics. Grey color chow major production plays
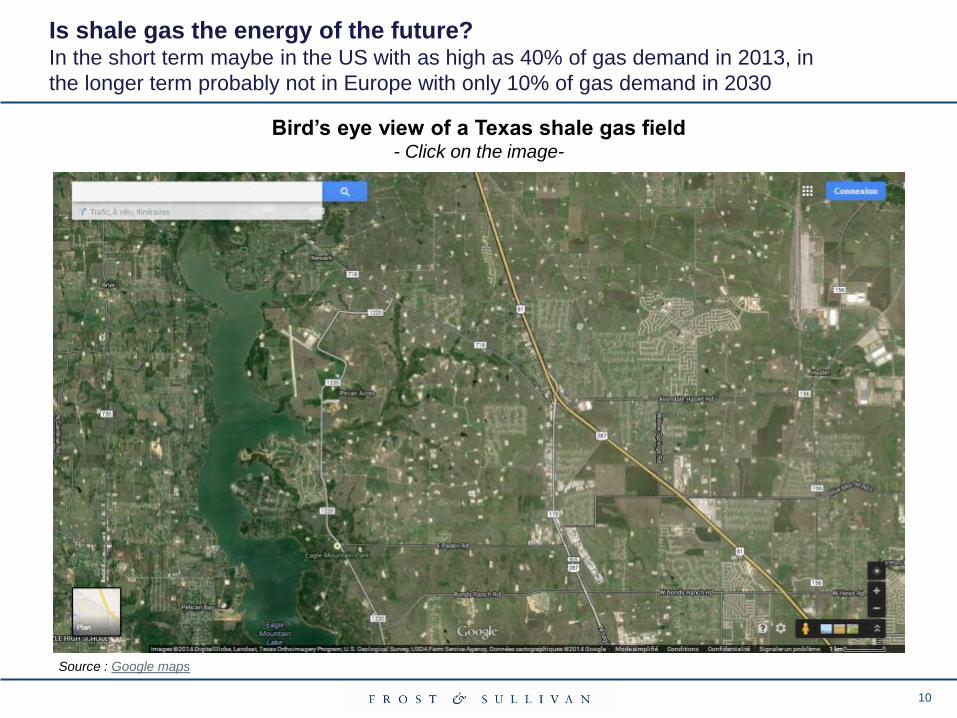
Is shale gas the energy of the future? In the short term maybe in the US with as high as 40% of gas demand in 2013, in
the longer term probably not in Europe with only 10% of gas demand in 2030
10
Bird’s eye view of a Texas shale gas field - Click on the image-
Source : Google maps

Is space that important when it comes to energy? Energy surfacic density must be considered when looking at the energy of the future – The
less space we have, the less choice we have!
Source: David MacKay, a reality check on renewables
11
Energy surfacic density
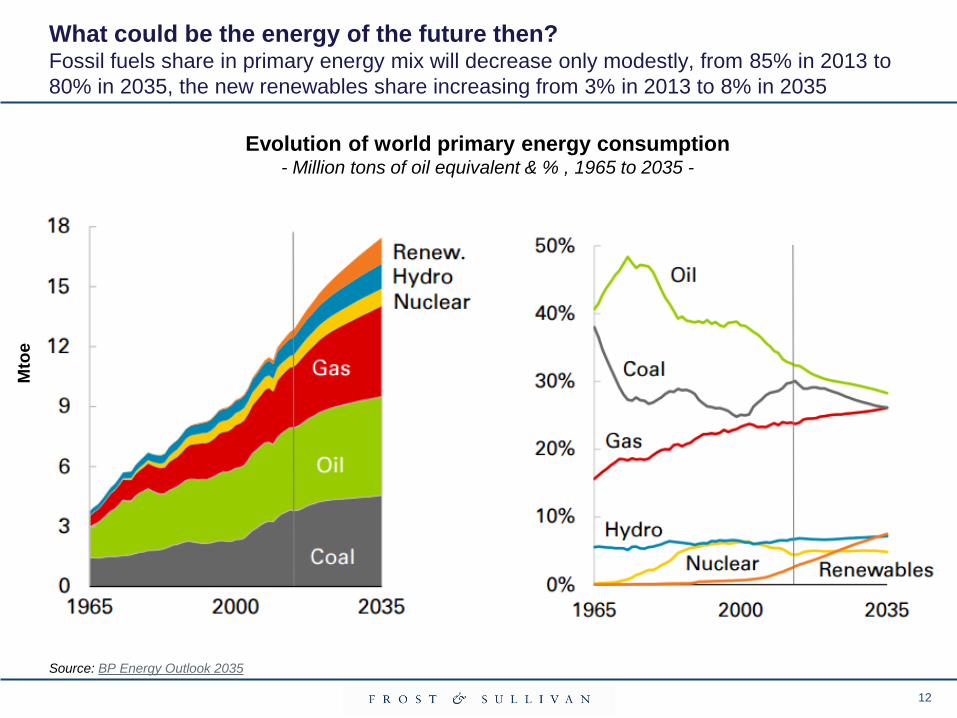
What could be the energy of the future then? Fossil fuels share in primary energy mix will decrease only modestly, from 85% in 2013 to
80% in 2035, the new renewables share increasing from 3% in 2013 to 8% in 2035
Source: BP Energy Outlook 2035
Mto
e
Evolution of world primary energy consumption - Million tons of oil equivalent & % , 1965 to 2035 -
12

85%
66%
47%
41%
38% 37%
31% 30% 29% 28%
23% 20% 19%
16%
11% 9% 9%
7% 6% 6%
1%
6 45 5 284 51 20 34 30 24 333 26 18 134 159 325 248 2852 2266 200 474 271
Solar
Wind
Geothermal & Biomass
Biofuels
Hydro electric
Can’t we just use renewable energies like our ancestors did in Middle Ages? Countries which inherited large significant forests, hydraulic or geothermal potential might get
close to it – for others, it will be much more difficult unless consumption significantly decreases
13
Sources: BP Statistical Review of World Energy 2014, Frost & Sullivan analysis
Iceland Costa Rica
Brazil Norway New Zealand
Sweden Finland Austria
Canada Denmark
China Portugal
Italy
Spain
France Japan
Germany
USA
Primary energy
consumption
(Mtoe)
Share of renewable energies in primary energy
consumption of selected countries - 2013, in % -
EU average = 11%
WW average= 9%
Switzerland
United Kingdom
South Korea
Mtoe figures for power generation are converted on the basis of thermal equivalence assuming 38% conversion efficiency in a modern thermal power station

What will life after fossil fuels look like? It will be pretty difficult without strong energy savings
14
Mtoe figures for power generation are converted on the basis of thermal equivalence assuming 38% conversion efficiency in a modern thermal power station
Potential renewable energy production - Million tons of oil equivalent per year -
453 2 000
Additional
Hydro
140
Biofuels
2 850
Biomass Total
Renewable
7 Gtoe
2 263
Wind
power
10 000
226
Geothermal
power
1 000
?
Total
20 Gtoe
[TWh]
[Mtoe] 688 3 040
Current
Hydro
453
2 000
Solar
power
15 compared to
2013
20 billions panels of
1m2
15 compared to 2013
cover 0,5 million km2)
25% of forests
exploited at 3 toe/ha
9.5 million km²
dedicated
8 billion
people
at 2.5
toe/year?
10% of current
arable land at 1 toe/ha
1.4 million
km² dedicated
Source: Philippe Bihouix, BP Statistical Review of World Energy 2014, Frost & Sullivan

15
What is the real energy of the future then? The one we will not use!
Note : koe = kilogram of oil equivalent ; best available technology in 1995 Source: Bernard Multon, ENS Cachan ; Commissariat au plan
Sector
koe /
person
In 1995
koe /
person
Best
techno (1)
Comments
Housing
Heating 740 300 • Norms
Kitchen devices 35 25 • Best equipment
Other devices 70 35 • Standby systems
Tertiary
Heating 415 200 • Norms
Specific usages 90 50 • Standby systems
Food 360 250 • 50% saving on cold and
cooking
Industry
Intermediary products
625 450 • Recycling, eco processes
Equipments 150 130
Transports
Persons 490 250 • 4 liters / 100 km vehicles
Goods 315 200 • Truck power reduction, rail
freight
Total 3290 1890
• Almost 50% energy
reduction with no real
change in comfort…not
enough but a good start !
• But we have a strong
inertia issue due to
installed base
replacement speed…
Standby of electrical
devices…5 to 6 TWh in
France : almost one
nuclear reactor !
Nicolas Meilhan Principal Consultant
Energy & Transportation Practices
(+33) 1 42 81 23 24
nicolas [email protected]