What Is a Pareto Chart? - Air University · What Is a Pareto Chart? ... EXERCISE 2A PARETO CHART...
23
PARETO CHART VIEWGRAPH 1 What Is a Pareto Chart? • Bar chart arranged in descending order of height from left to right • Bars on left relatively more important than those on right • Separates the "vital few" from the "trivial many" (Pareto Principle)
-
Upload
dinhnguyet -
Category
Documents
-
view
232 -
download
1
Transcript of What Is a Pareto Chart? - Air University · What Is a Pareto Chart? ... EXERCISE 2A PARETO CHART...

PARETO CHART VIEWGRAPH 1
What Is a Pareto Chart?
• Bar chart arranged in descending
order of height from left to right
• Bars on left relatively more important
than those on right
• Separates the "vital few" from the
"trivial many" (Pareto Principle)
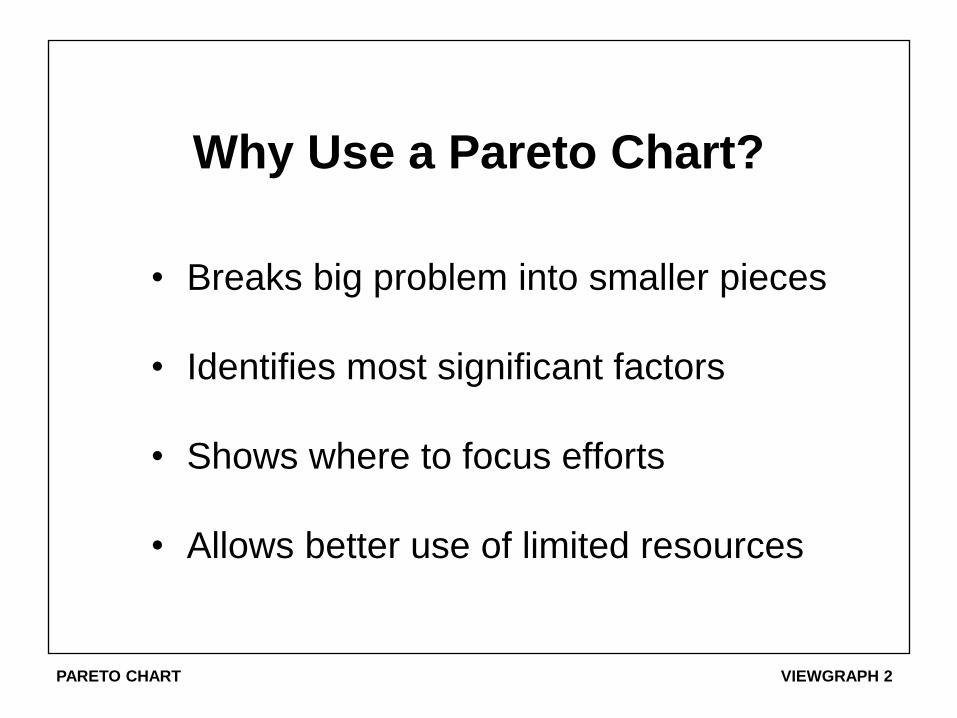
PARETO CHART VIEWGRAPH 2
Why Use a Pareto Chart?
• Breaks big problem into smaller pieces
• Identifies most significant factors
• Shows where to focus efforts
• Allows better use of limited resources
PARETO CHART VIEWGRAPH 3
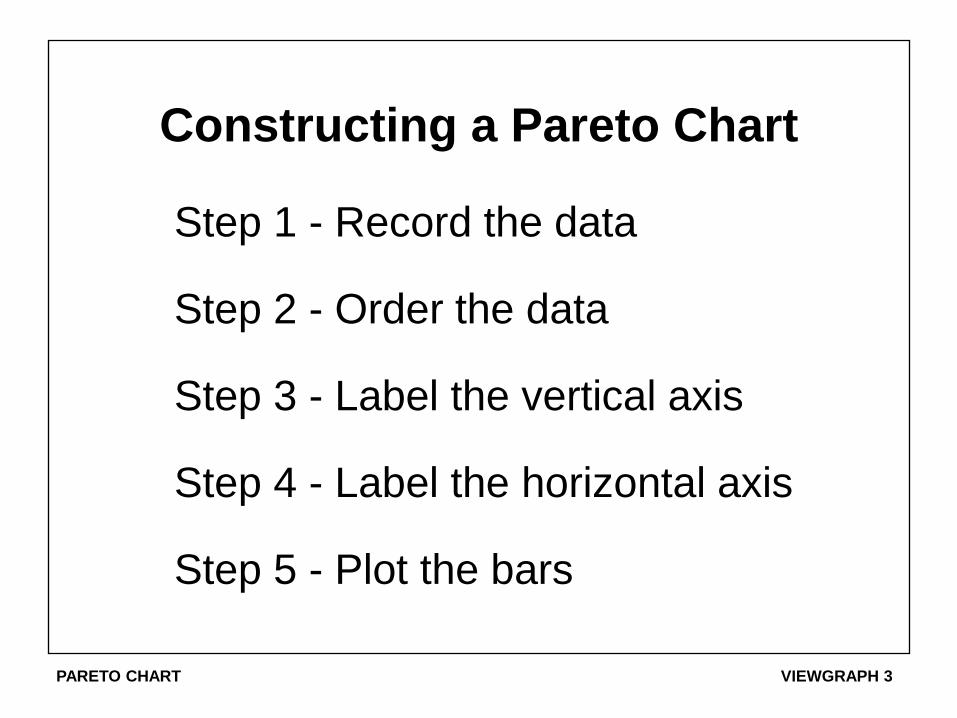
Constructing a Pareto Chart
Step 1 - Record the data
Step 2 - Order the data
Step 3 - Label the vertical axis
Step 4 - Label the horizontal axis
Step 5 - Plot the bars
PARETO CHART VIEWGRAPH 4
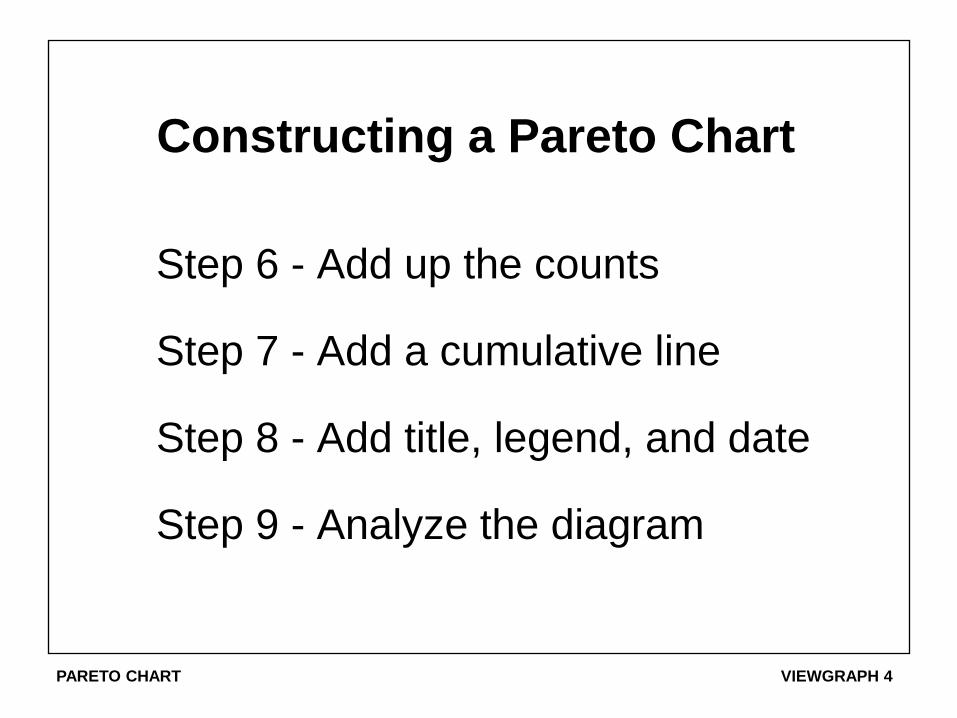
Constructing a Pareto Chart
Step 6 - Add up the counts
Step 7 - Add a cumulative line
Step 8 - Add title, legend, and date
Step 9 - Analyze the diagram

PARETO CHART VIEWGRAPH 5
Analysis Sheet Example
Outstanding Debts
Category Amount ($)
School tuition (monthly installments) 2,030
Visa 2,007
2,000 Church pledge (monthly installments)
1,983 Mastercard
Balance of car loan 1,971
Home improvement loan balance 1,956
Total 11,947
PARETO CHART VIEWGRAPH 6
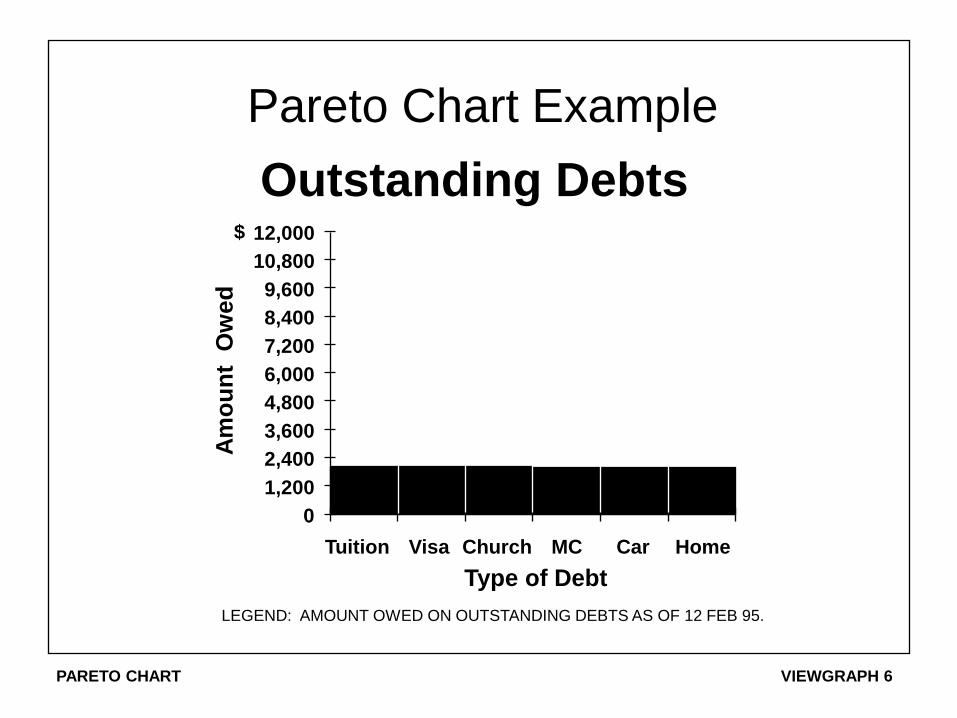
Pareto Chart Example
Outstanding Debts
LEGEND: AMOUNT OWED ON OUTSTANDING DEBTS AS OF 12 FEB 95.
0
1,200
2,400
3,600
4,800
6,000
7,200
8,400
9,600
10,800
12,000
Tuition Visa Church MC Car Home
Type of Debt
Am
ou
nt
Ow
ed
$
PARETO CHART VIEWGRAPH 7
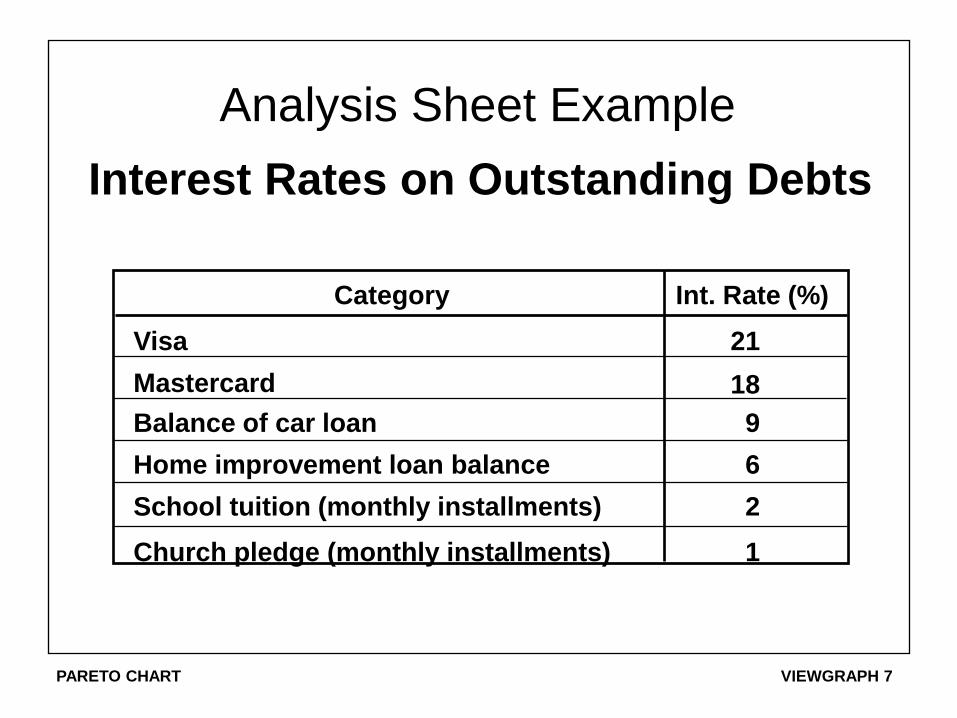
Analysis Sheet Example
Interest Rates on Outstanding Debts
Category Int. Rate (%)
Mastercard
Home improvement loan balance
School tuition (monthly installments)
Visa
Balance of car loan
21
18
9
2
Church pledge (monthly installments) 1
6
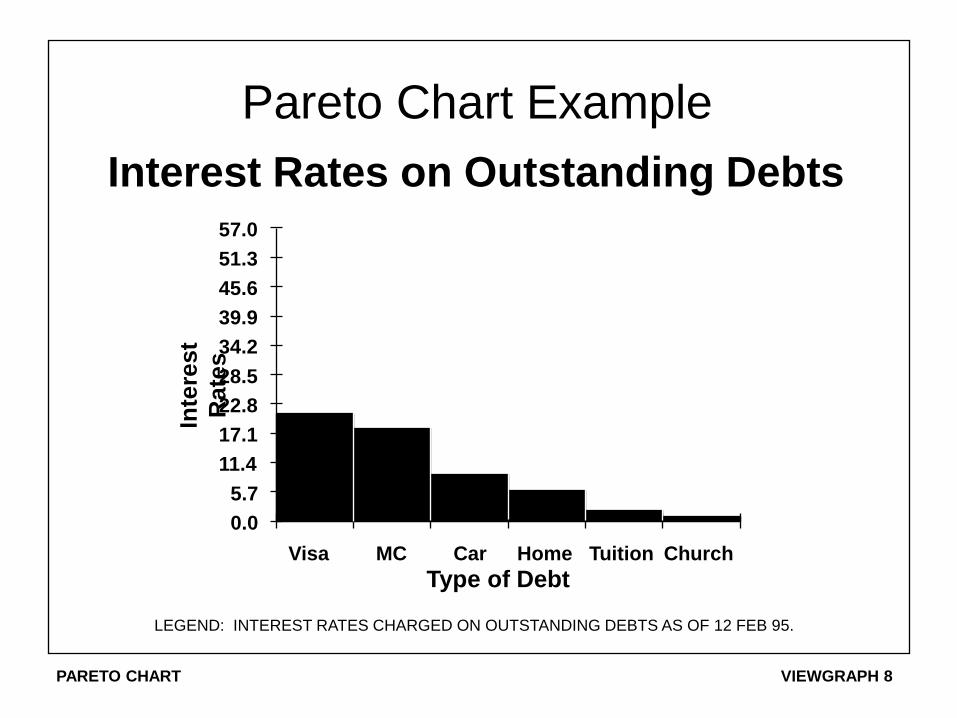
PARETO CHART VIEWGRAPH 8
Pareto Chart Example
Interest Rates on Outstanding Debts
Type of Debt
0.0
5.7
11.4
17.1
22.8
28.5
34.2
39.9
45.6
51.3
57.0
Visa MC Car Home Tuition Church
Inte
rest
Rate
s
LEGEND: INTEREST RATES CHARGED ON OUTSTANDING DEBTS AS OF 12 FEB 95.
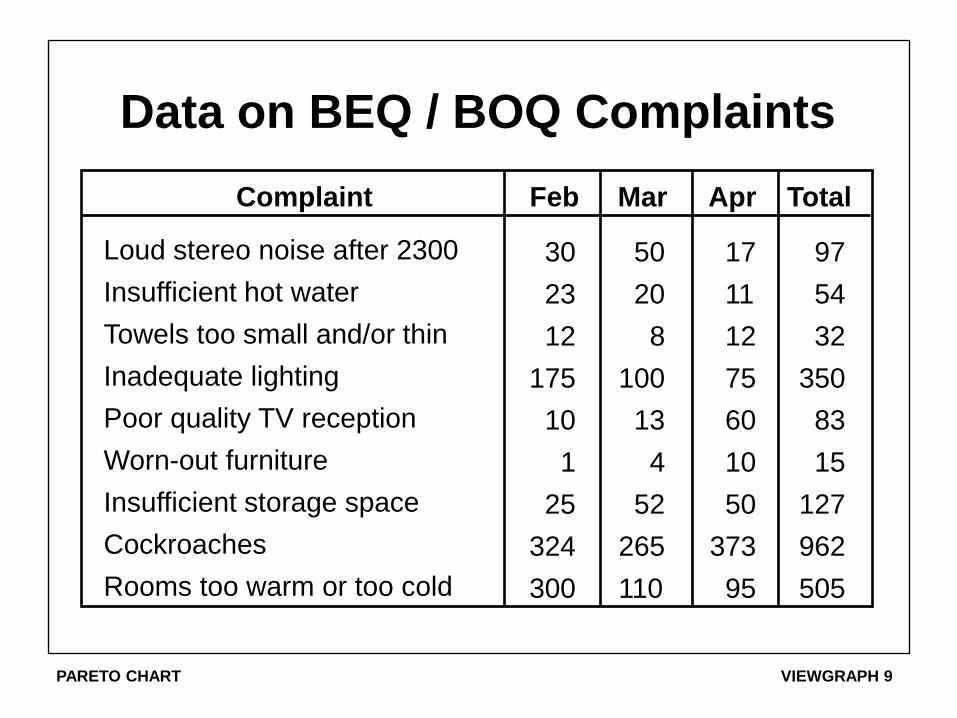
PARETO CHART VIEWGRAPH 9
Data on BEQ / BOQ Complaints
Complaint Feb Mar Apr Total
Loud stereo noise after 2300
Insufficient hot water
Towels too small and/or thin
Inadequate lighting
Poor quality TV reception
Worn-out furniture
Insufficient storage space
Cockroaches
Rooms too warm or too cold
30
23
12
175
10
1
25
324
300
50
20
8
100
13
4
52
265
110
17
11
12
75
60
10
50
373
95
97
54
32
350
83
15
127
962
505
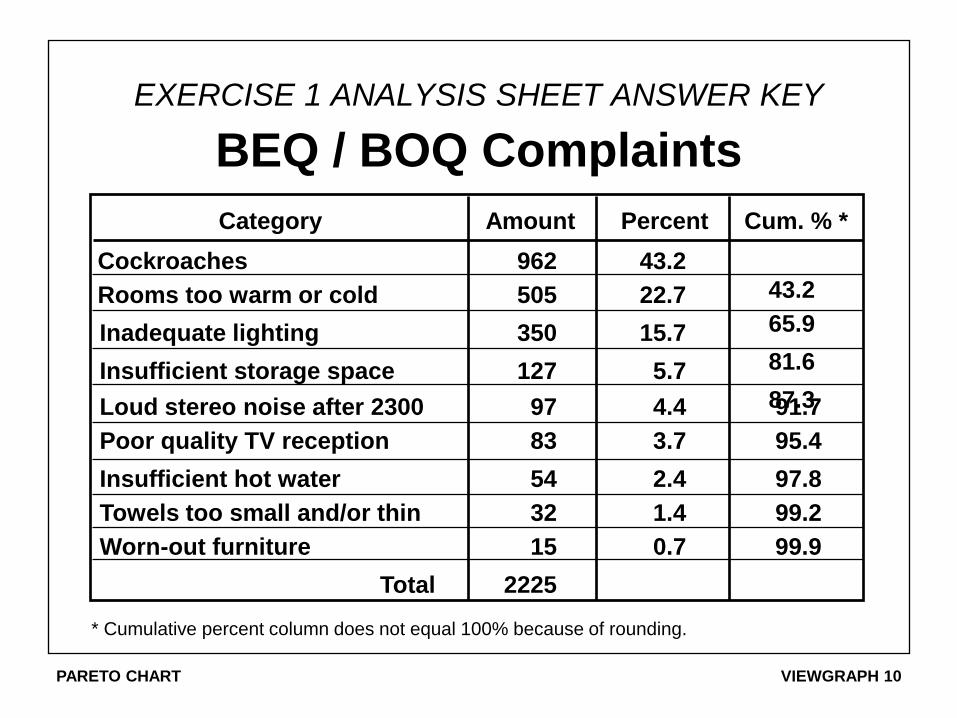
PARETO CHART VIEWGRAPH 10
EXERCISE 1 ANALYSIS SHEET ANSWER KEY
BEQ / BOQ Complaints
Category Amount Percent Cum. % *
962 43.2
43.2 505 22.7
65.9 350 15.7
81.6 127 5.7
87.3
54 2.4 97.8
32 1.4 99.2
Cockroaches
Rooms too warm or cold
Inadequate lighting
Insufficient storage space
97 4.4 91.7 Loud stereo noise after 2300
83 3.7 95.4 Poor quality TV reception
Insufficient hot water
Towels too small and/or thin
Worn-out furniture 15 0.7 99.9
Total 2225
* Cumulative percent column does not equal 100% because of rounding.
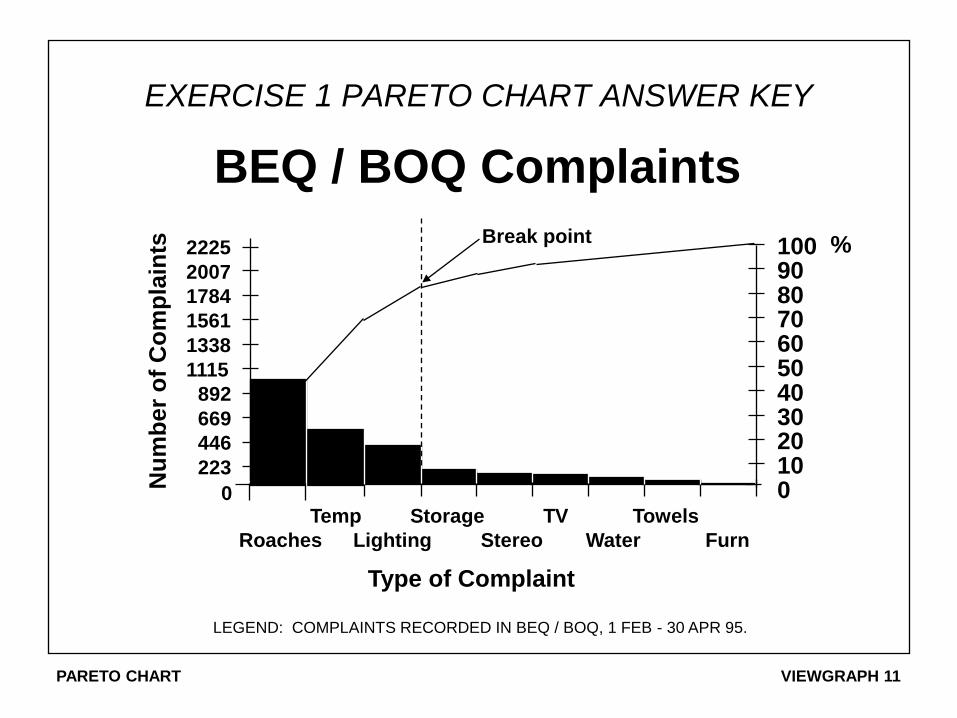
PARETO CHART VIEWGRAPH 11
EXERCISE 1 PARETO CHART ANSWER KEY
LEGEND: COMPLAINTS RECORDED IN BEQ / BOQ, 1 FEB - 30 APR 95.
BEQ / BOQ Complaints
Roaches
Temp
Lighting
Storage
Stereo
TV
Water
Towels
Furn
0
223
446
669
892
1115
1338
1561
1784
2007
Type of Complaint
Nu
mb
er
of
Co
mp
lain
ts
0 10 20 30 40 50 60 70 80 90 100 % 2225
Break point

PARETO CHART VIEWGRAPH 12
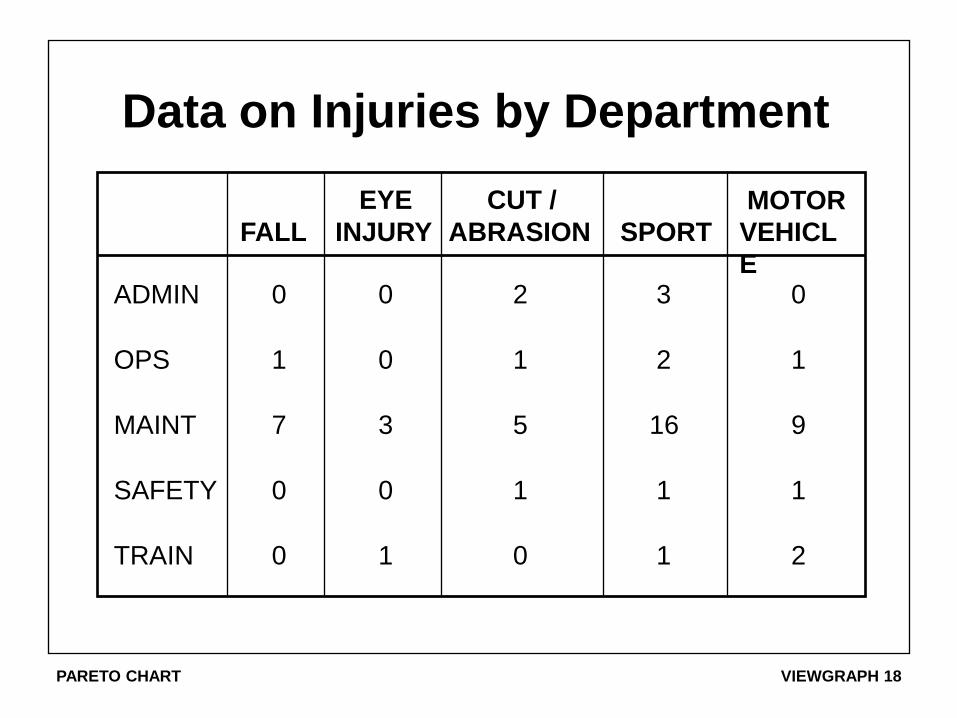
Data on Injuries by Department
FALL
EYE
INJURY
CUT /
ABRASION SPORT
MOTOR
VEHICL
E ADMIN 0 0 2 3 0
OPS 1 0 1 2 1
MAINT 7 3 5 16 9
SAFETY 0 0 1 1 1
TRAIN 0 1 0 1 2
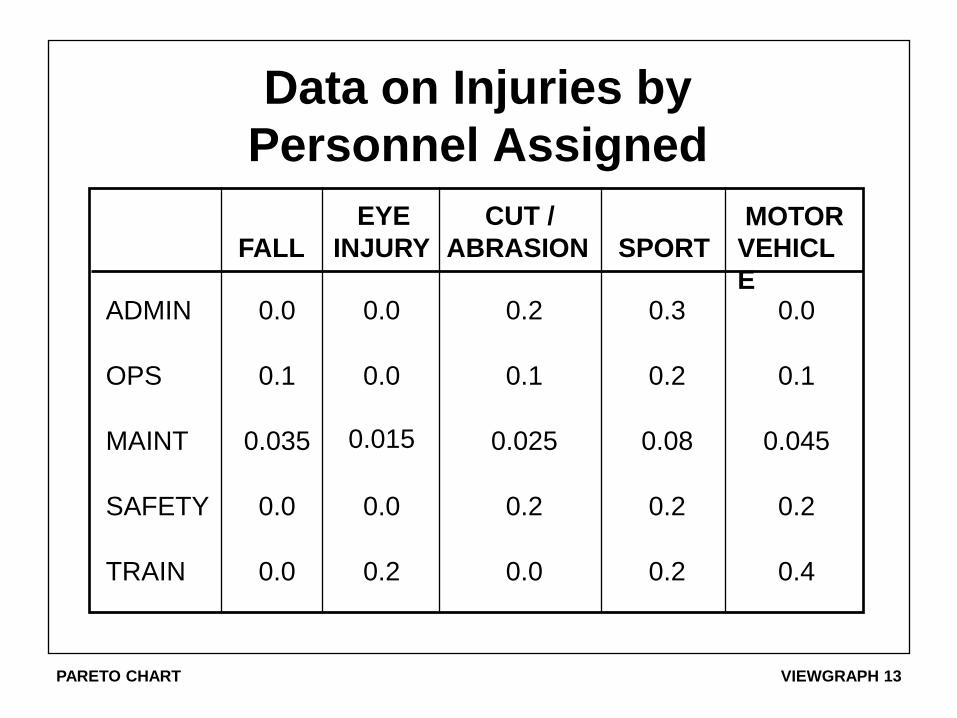
PARETO CHART VIEWGRAPH 13
Data on Injuries by
Personnel Assigned
FALL
EYE
INJURY
CUT /
ABRASION SPORT
MOTOR
VEHICL
E 0.0 0.0 0.2 0.3 0.0
0.1 0.0 0.1 0.2 0.1
0.035 0.015 0.025 0.08 0.045
0.0 0.0 0.2 0.2 0.2
ADMIN
OPS
MAINT
SAFETY
TRAIN 0.0 0.2 0.0 0.2 0.4
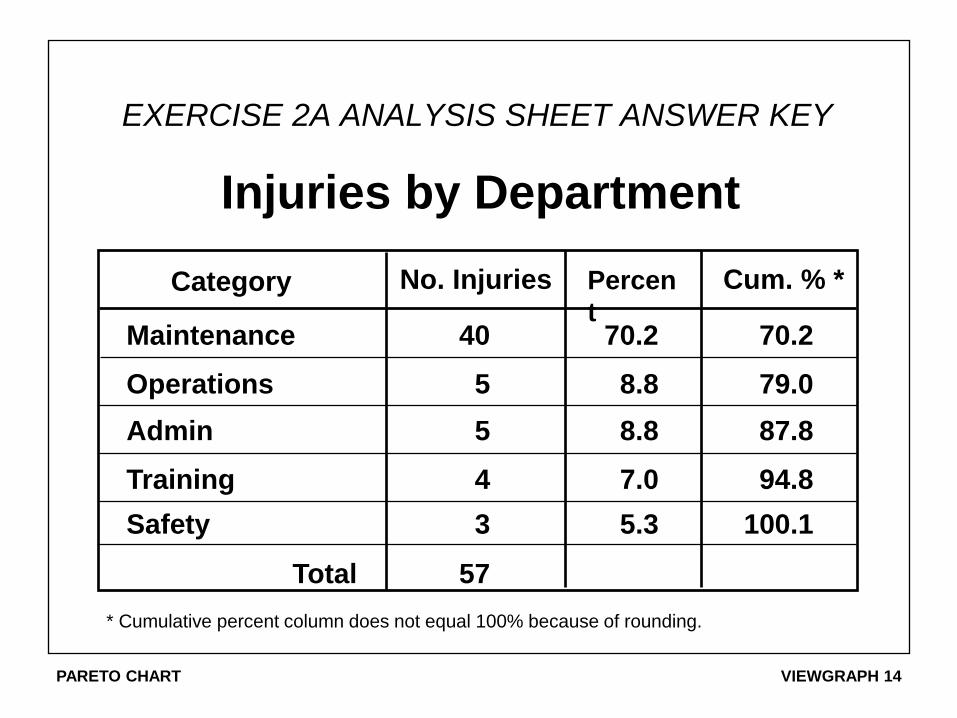
PARETO CHART VIEWGRAPH 14
EXERCISE 2A ANALYSIS SHEET ANSWER KEY
Injuries by Department
* Cumulative percent column does not equal 100% because of rounding.
Category Cum. % * No. Injuries
Total
Maintenance
Operations
Admin
Training
Safety
70.2
87.8
94.8
79.0
100.1
57
40
5
4
5
3
70.2
8.8
7.0
8.8
5.3
Percen
t
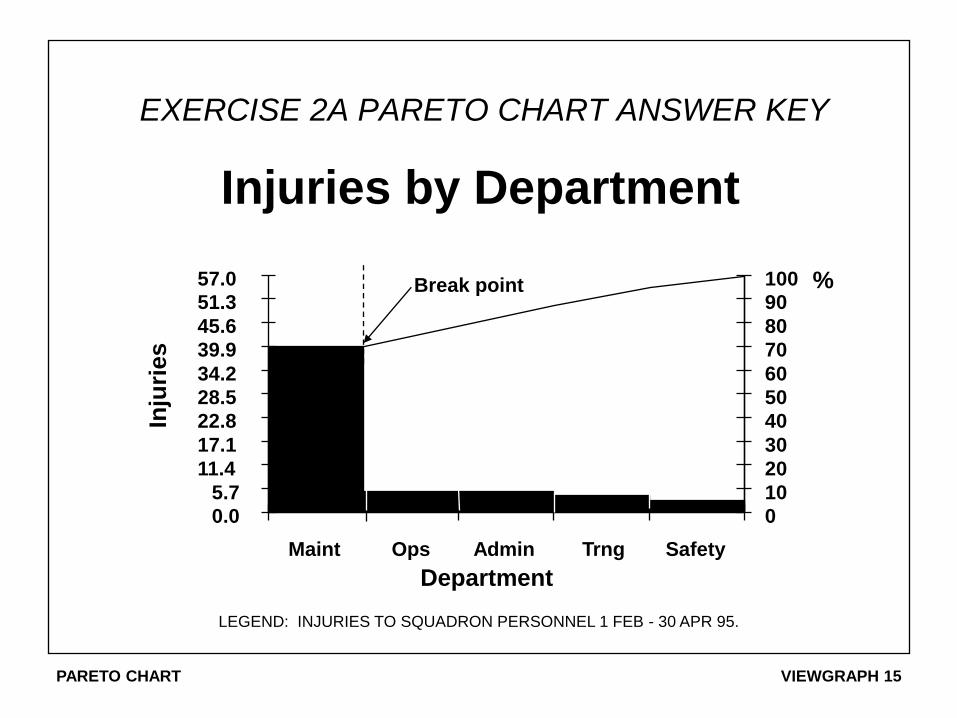
PARETO CHART VIEWGRAPH 15
EXERCISE 2A PARETO CHART ANSWER KEY
LEGEND: INJURIES TO SQUADRON PERSONNEL 1 FEB - 30 APR 95.
Injuries by Department
Department
0.0
5.7
11.4
17.1
22.8
28.5
34.2
39.9
45.6
51.3
57.0
Maint Ops Admin Trng Safety
Inju
ries
0
10
20
30
40
50
60
70
80
90
100 % Break point

PARETO CHART VIEWGRAPH 16
EXERCISE 2B ANALYSIS SHEET ANSWER KEY
Injuries by Personnel Assigned
* Cumulative percent column does not equal 100% because of rounding.
Category Cum. % *
Training
Admin
Operations
Maintenance
Injury Rate
0.80
0.50
0.50
0.20
57.2
75.1
93.0
100.1
Total 2.80
Safety 0.80 28.6 28.6
28.6
17.9
17.9
7.1
Percent
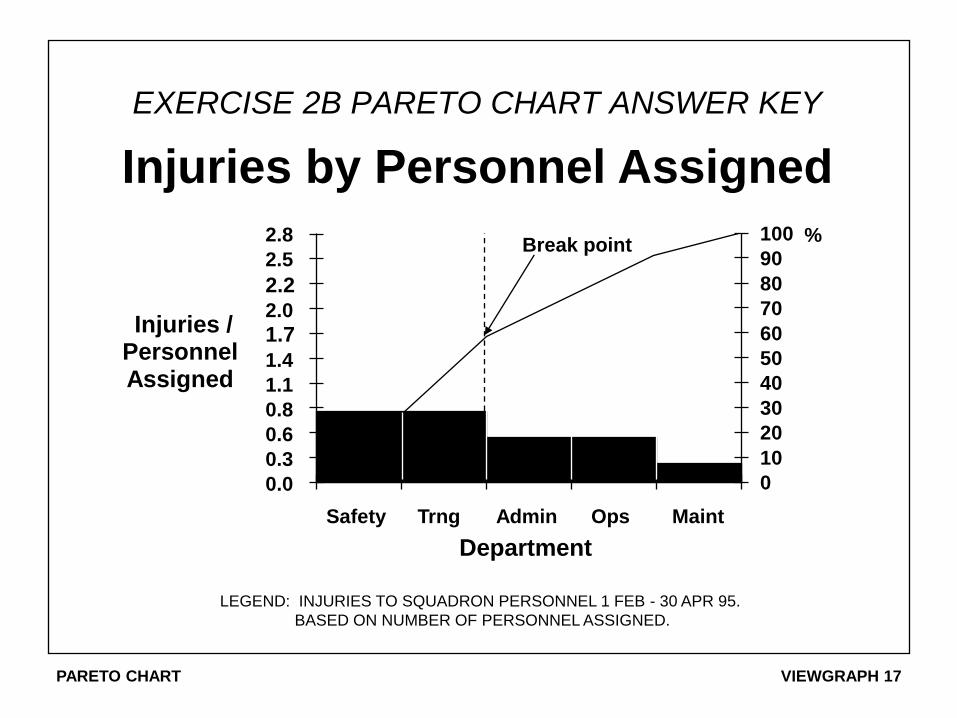
PARETO CHART VIEWGRAPH 17
EXERCISE 2B PARETO CHART ANSWER KEY
Injuries by Personnel Assigned
LEGEND: INJURIES TO SQUADRON PERSONNEL 1 FEB - 30 APR 95.
BASED ON NUMBER OF PERSONNEL ASSIGNED.
Department
0.0
0.3
0.6
0.8
1.1
1.4
1.7 2.0
2.2
2.5
2.8
Safety Trng Admin Ops Maint
Injuries / Personnel Assigned
0
10
20
30
40
50
60
70
80
90
100 % Break point
PARETO CHART VIEWGRAPH 18
Data on Injuries by Department
FALL
EYE
INJURY
CUT /
ABRASION SPORT
MOTOR
VEHICL
E ADMIN 0 0 2 3 0
OPS 1 0 1 2 1
MAINT 7 3 5 16 9
SAFETY 0 0 1 1 1
TRAIN 0 1 0 1 2

PARETO CHART VIEWGRAPH 19
EXERCISE 2C ANALYSIS SHEET ANSWER KEY
Injuries by Type
Sports
Motor vehicle
Cuts/abrasions
Falls
Eye injuries
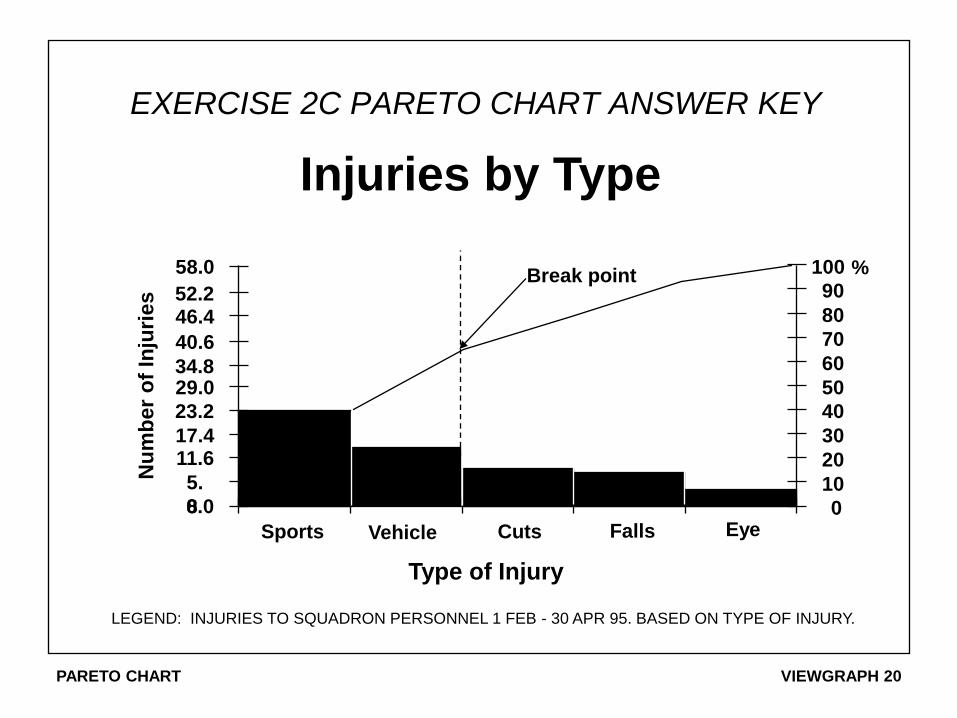
40.4
22.8
15.8
14.0
7.0
40.4
63.2
79.0
93.0
100.0
Total
23
13
9
8
4
57
Category No. Injuries Cum. % Percent
PARETO CHART VIEWGRAPH 20
EXERCISE 2C PARETO CHART ANSWER KEY
Injuries by Type
LEGEND: INJURIES TO SQUADRON PERSONNEL 1 FEB - 30 APR 95. BASED ON TYPE OF INJURY.
5.
8
17.4
0.0
29.0
40.6
46.4
11.6
23.2
34.8
52.2
58.0
Sports Vehicle Cuts Falls Eye
Type of Injury
Nu
mb
er
of
Inju
ries
0
10
20
30
40
50
60
70
80
90
100 % Break point
PARETO CHART VIEWGRAPH 21
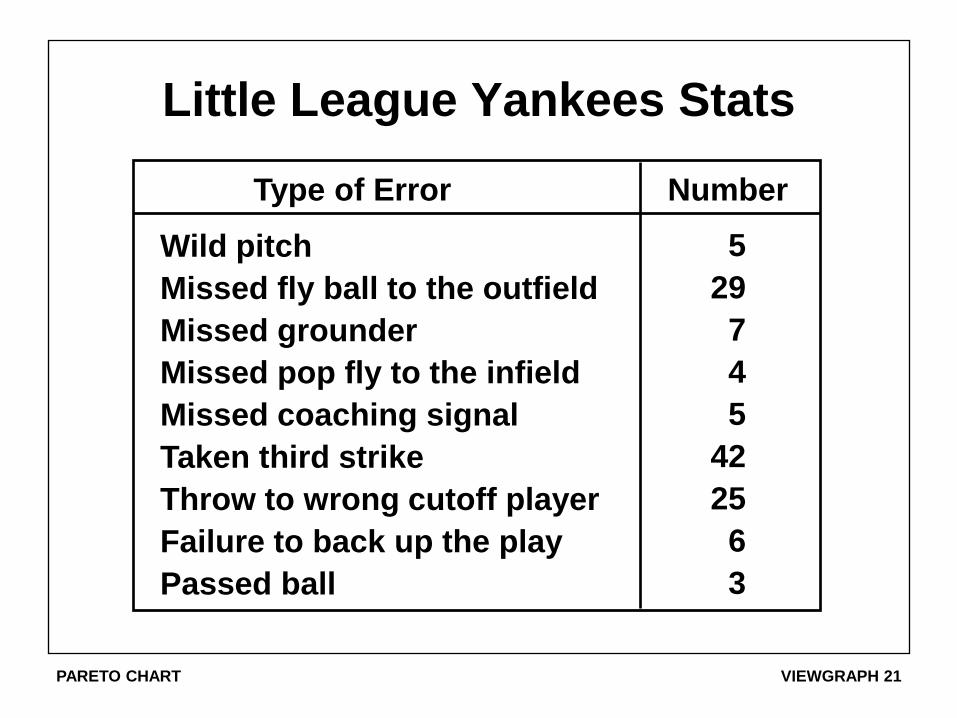
Little League Yankees Stats
Type of Error Number
5
29
7
4
5
42
25
6
Wild pitch
Missed fly ball to the outfield
Missed grounder
Missed pop fly to the infield
Missed coaching signal
Taken third strike
Throw to wrong cutoff player
Failure to back up the play
Passed ball 3
PARETO CHART VIEWGRAPH 22
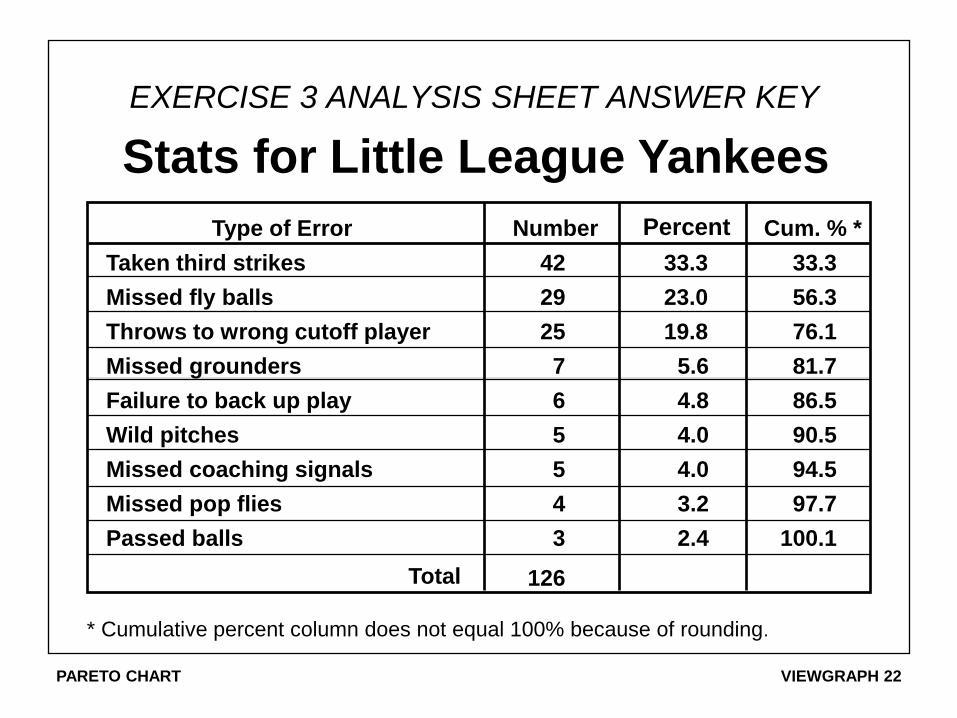
EXERCISE 3 ANALYSIS SHEET ANSWER KEY
Stats for Little League Yankees
Type of Error Number Cum. % *
33.3 33.3
23.0 56.3
19.8 76.1
5.6 81.7
4.8 86.5
4.0 90.5
4.0 94.5
3.2 97.7
Taken third strikes
Missed fly balls
Throws to wrong cutoff player
Missed grounders
Failure to back up play
Wild pitches
Missed coaching signals
Missed pop flies
Passed balls 2.4 100.1
Total
42
29
25
7
6
5
5
4
3
126
Percent
* Cumulative percent column does not equal 100% because of rounding.
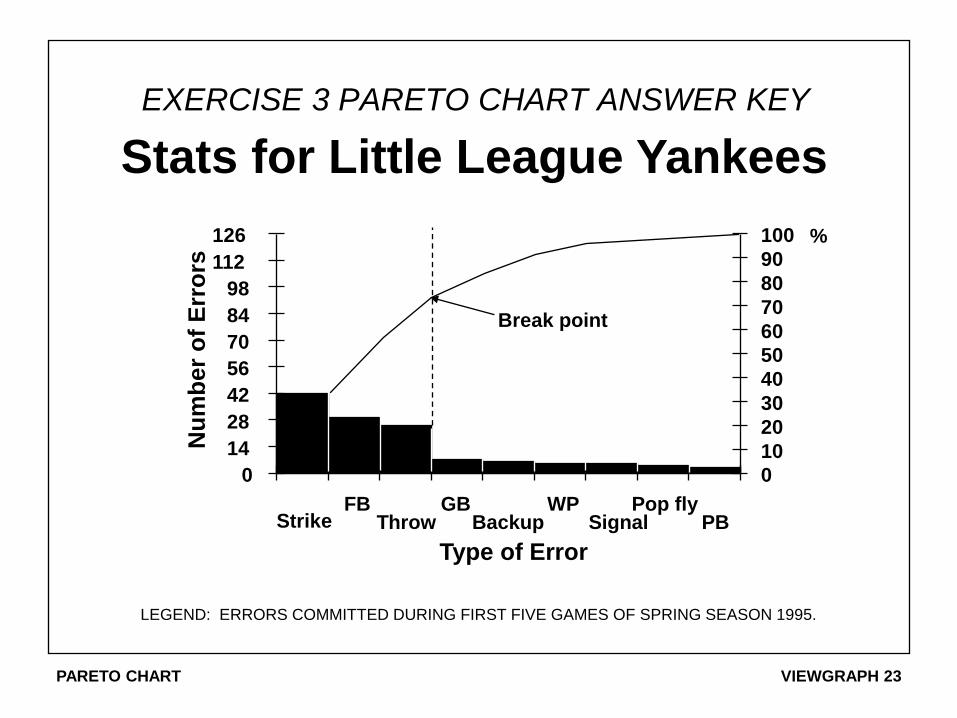
PARETO CHART VIEWGRAPH 23
EXERCISE 3 PARETO CHART ANSWER KEY
LEGEND: ERRORS COMMITTED DURING FIRST FIVE GAMES OF SPRING SEASON 1995.
0
14
28
42
56
70
84
98
112
126
Strike FB
Throw GB
Backup WP
Signal Pop fly
PB
Type of Error
Nu
mb
er
of
Err
ors
0
10
20
30
40
50
60
70
80
90
100 %
Stats for Little League Yankees
Break point