Descriptive Statistics. Pie Chart Pareto Scattered Plot Stem and Leaf Time Series graph Dot Plot.
15
Chapter 2 Descriptive Statistics
-
Upload
alexander-stevens -
Category
Documents
-
view
236 -
download
3
Transcript of Descriptive Statistics. Pie Chart Pareto Scattered Plot Stem and Leaf Time Series graph Dot Plot.
Chapter 2
Descriptive Statistics

2.2 More Graphs and Displays
Pie Chart
Pareto
Scattered Plot
Stem and Leaf
Time Series graph
Dot Plot

A Stem and Leaf plot is a way to display quantitative data.
This is a relatively new method way of displaying data.In a stem and leaf and leaf plot , each number is separated into a stem (the leftmost digit or digits) and leaf (the rightmost digits) Leaf
values
Stemvalues
192225262728293034363742
434446484849525355575862
Benefit: A stem and leaf plot is similar to a histogram except all of the original data is still there (not embedded in classes or buckets)

Example Stem and Leaf plot
In 2013 Major league first basemen hit the following number of homeruns: 25, 30, 22, 14, 15, 17, 17, 53, 36, 20, 20, 20, 44, 17, 15, 21, 36, 22, 23, 24, 23
Since the data includes 10s, 20s, 30s, 40s and 50s your stems will be1, 2, 3, 4, and 5
Step 1 : decide on the stems
12345
50
2
Data can be ordered or unordered

A dot plot is another way to display quantitative data.
Data is displayed above a horizontal axis. Each dot is a single instance of the corresponding number on the x axis
Horizontal axis should extend to cover all data, even outliersOutliers are unusual data. They don’t seem to fit in the data set
Four instances
of 25
An example of an outlier in the data set above would have been a number > 40
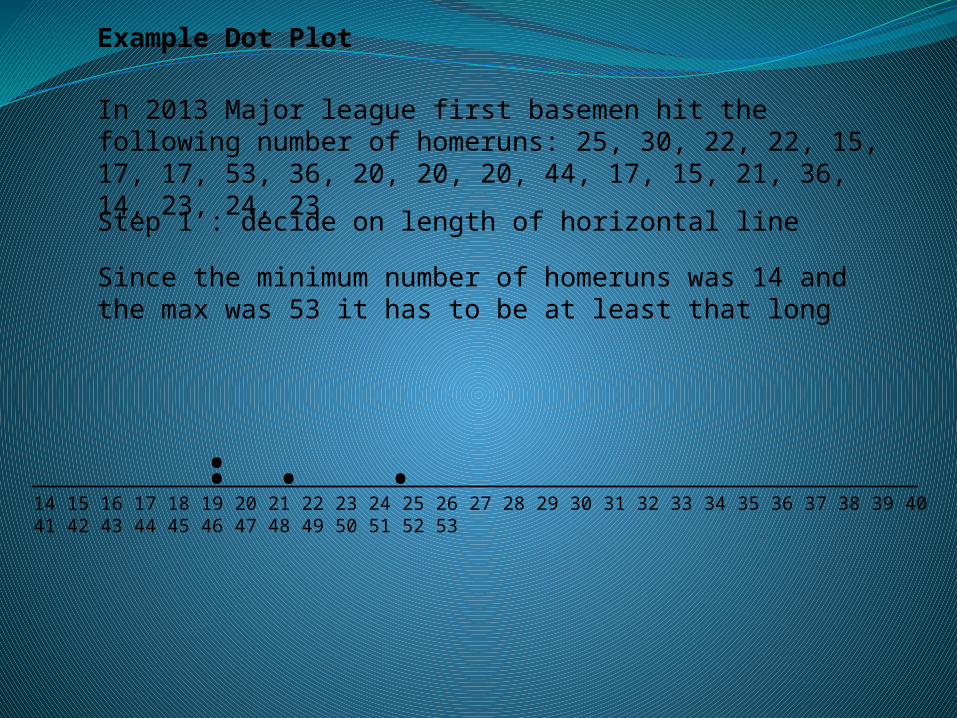
Example Dot Plot
In 2013 Major league first basemen hit the following number of homeruns: 25, 30, 22, 22, 15, 17, 17, 53, 36, 20, 20, 20, 44, 17, 15, 21, 36, 14, 23, 24, 23
Since the minimum number of homeruns was 14 and the max was 53 it has to be at least that long
Step 1 : decide on length of horizontal line
14 15 16 17 18 19 20 21 22 23 24 25 26 27 28 29 30 31 32 33 34 35 36 37 38 39 40 41 42 43 44 45 46 47 48 49 50 51 52 53
. ...

Pie charts provide a convenient way of looking at qualitative data.
A Pie Chart divided into sectors that represent the categories.
The area of each sector is proportional to the frequency of each category.
Benefit: At a quick glance you can see that most fatalities were from cars
fRelative Frequency Angle
Cars 20,260 0.56 202o
Trucks 12,260 0.34 122o
Motorcycles 3,067 0.08 29o
Other 610 0.02 72o
56%34%
8%
2%
Motor Vehicle Occupants Killed in 2001
CarsTrucksMotorcyclesOther

Example Pie Chart
In 2008 Crisco conducted a national survey as the pie preference of Americans
The study revealed that 9% preferred Cherry, 19% Apple, 12% Pecan, 8% Lemon meringue, 13% Pumpkin, 10% Banana cream and 29% preferred some other pie.
The first step is to prepare a frequency distribution chart with relative frequencies.
Relative frequency
Apple 0.19Pumpkin 0.13Pecan 0.12Banana cream 0.1Cherry 0.09Lemon meringue 0.08Other 0.29
The next step is to, starting at 12:00 (straight up), insert appropriately sized sectors.
Apple19%
Pumpkin13%
Pecan12%Banana cream
10%Cherry
9%
Lemon meringue
8%
Other29%
Pie preferences of Amer-icans
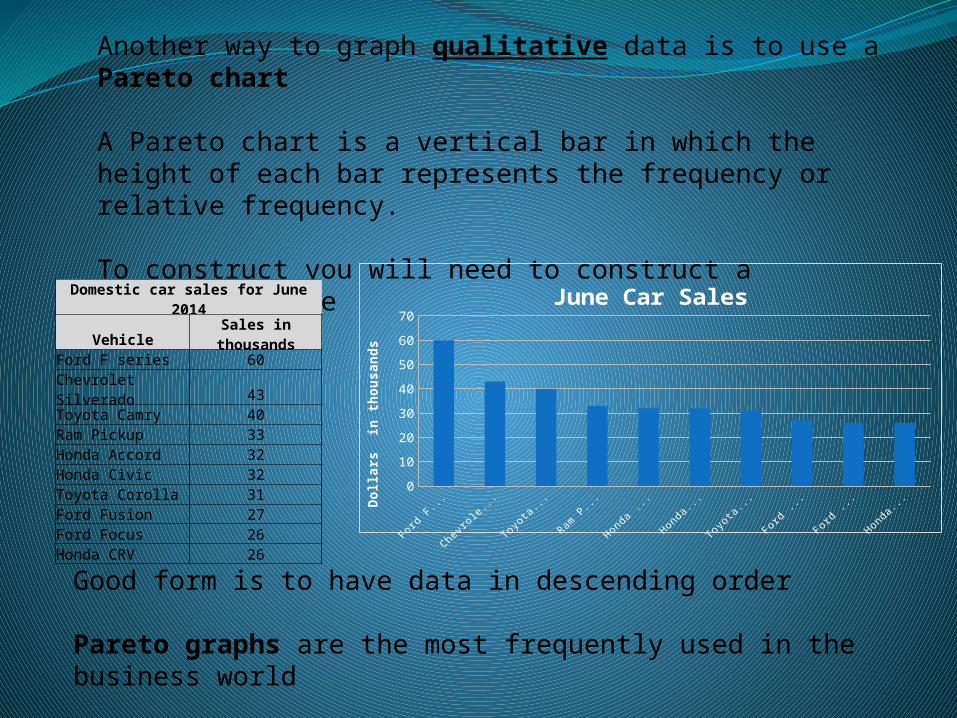
Another way to graph qualitative data is to use a Pareto chart
A Pareto chart is a vertical bar in which the height of each bar represents the frequency or relative frequency.
To construct you will need to construct a frequency table
Pareto graphs are the most frequently used in the business world
Domestic car sales for June 2014Vehicle Sales in thousands
Ford F series 60Chevrolet Silverado 43Toyota Camry 40Ram Pickup 33Honda Accord 32Honda Civic 32Toyota Corolla 31Ford Fusion 27Ford Focus 26Honda CRV 26
0
10
20
30
40
50
60
70
June Car Sales
Doll
ars
in
thousa
nds
Good form is to have data in descending order

Example Pareto Chart/Graph
According to Business Life the 10 richest Hollywood male actor/celebrities are: Arnold Swarzenegger($300M), Tom Hanks($350M), Jack Nicholson($385M), Merv Griffin($1000M), Shakruch Khan($600M), Michael Douglass($290M), Johnnie Depp($360M), Sylvester Stallone($430M), Tom Cruise ($400M) and Mel Gibson($640M).To make a Pareto you will need to put them and their respective earnings in a table…in descending order
Actor Dollars ($$$) in MillionsMerv Griffin 1000Mel Gibson 640Shakruk Khan 600Sylvestor Stallone 430Tom Cruise 400Jack Nicholson 385Johnnie Depp 360Tom Hanks 350Arnold S 300Michael Douglas 290
Mer
v Griffin
Mel
Gib
son
Shakr
uk K
han
Sylve
stor
Sta
llone
Tom
Cru
ise
Jack
Nic
hols
on
John
nie
Dep
p
Tom
Han
ks
Arnol
d S
Mic
hael
Dou
glas
0
400
800
1200
Richest Actors
$$$s
in M
illi
ons
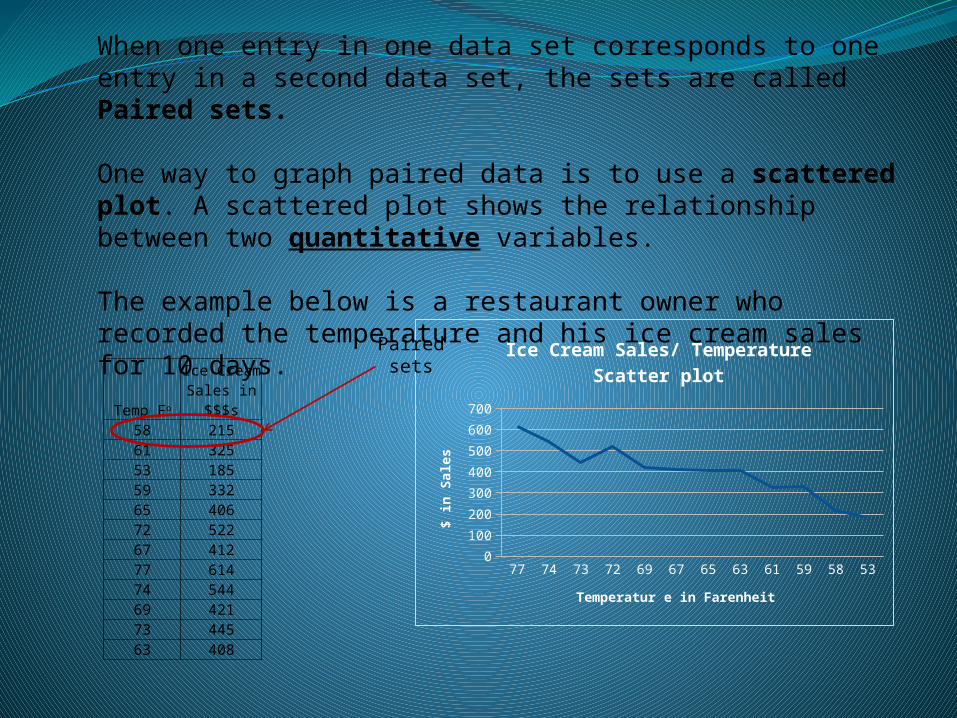
When one entry in one data set corresponds to one entry in a second data set, the sets are called Paired sets.
One way to graph paired data is to use a scattered plot. A scattered plot shows the relationship between two quantitative variables.
The example below is a restaurant owner who recorded the temperature and his ice cream sales for 10 days.
Temp FoIce Cream Sales in $$$s
58 21561 32553 18559 33265 40672 52267 41277 61474 54469 42173 44563 408
77 74 73 72 69 67 65 63 61 59 58 530
100
200
300
400
500
600
700
Ice Cream Sales/ Temperature Scatter plot
Temperatur e in Farenheit
$ i
n S
ale
s
Paired sets

Example Scatter Plot and Paired Data set
A teacher asked her students to write the number of hours they had studied at the bottom of a test.
After grading she put the scores and hours studied in a paired data matrix
She then graphed the points to look for trends
She decided that the hours studied would be the y axis, and the score would be the x axis………but this was just a preference.
30 40 50 60 70 80 90 1000
1
2
3
4
5
6
7
8
Study vs Final Score graph
Score
Hours
stu
die
d
Score
Study Hours
50 1
40 1
75 2
65 2
80 3
90 5
80 6
90 7
85 7
100 7

A data set that is composed of quantitative entries taken at regular intervals is Time Series.
You can use a time series chart to graph a time series.
The chart below breaks time down in year and season (x axis) and production in thousands of tons (y axis).

Example Time Series
A teacher teacher assigned her students to do a time series graph for the 21st century Dow Jones highs.
The first thing the student does is make a table full of ordered pairs (years and highs) of data from the Dow Jones Industrial site.
Year Dow Jones Yearly high
2000 110002001 113002002 106002003 100002004 106002005 107002006 109002007 141002008 130002009 105002010 112002011 128002012 135002013 162002014 17000
Next, plot each ordered pair on a line graph
2000
2001
2002
2003
2004
2005
2006
2007
2008
2009
2010
2011
2012
2013
2014
0
2000
4000
6000
8000
10000
12000
14000
16000
18000
Dow Jones HistoryYearl
y I
ndex H
igh

Graph the following Data. Use the appropriate graphs.
Year
Voters in
million voters
2008 1312004 1222012 1211992 1062000 1051996 961984 931988 921980 861976 81
New Mexico
121,589 sq mi
Nevada110,560
sq mi
Texas268,580
sq mi
Oregon98,380 sq
mi
Wyoming97,813 sq
mi
Alaska663,267
sq mi
Colorado104,093
sq mi
Arizona113,998
sq mi
Montana147,042
sq mi
California163,695
sq mi