What hypothesis to test in the fly? Quantitative data ... · • Quantitative data collection •...
34
Lecture overview • What hypothesis to test in the fly? • Quantitative data collection • Visual physiology conventions (“Methods”) Course 9.17: Brain Laboratory, Brain and Cognitive Sciences 1
Transcript of What hypothesis to test in the fly? Quantitative data ... · • Quantitative data collection •...
Lecture overview
• What hypothesis to test in the fly? • Quantitative data collection • Visual physiology conventions (“Methods”)
Course 9.17: Brain Laboratory, Brain and Cognitive Sciences
1
Lecture overview
• What hypothesis to test in the fly? • Quantitative data collection • Visual physiology conventions (“Methods”)
Course 9.17: Brain Laboratory, Brain and Cognitive Sciences
2
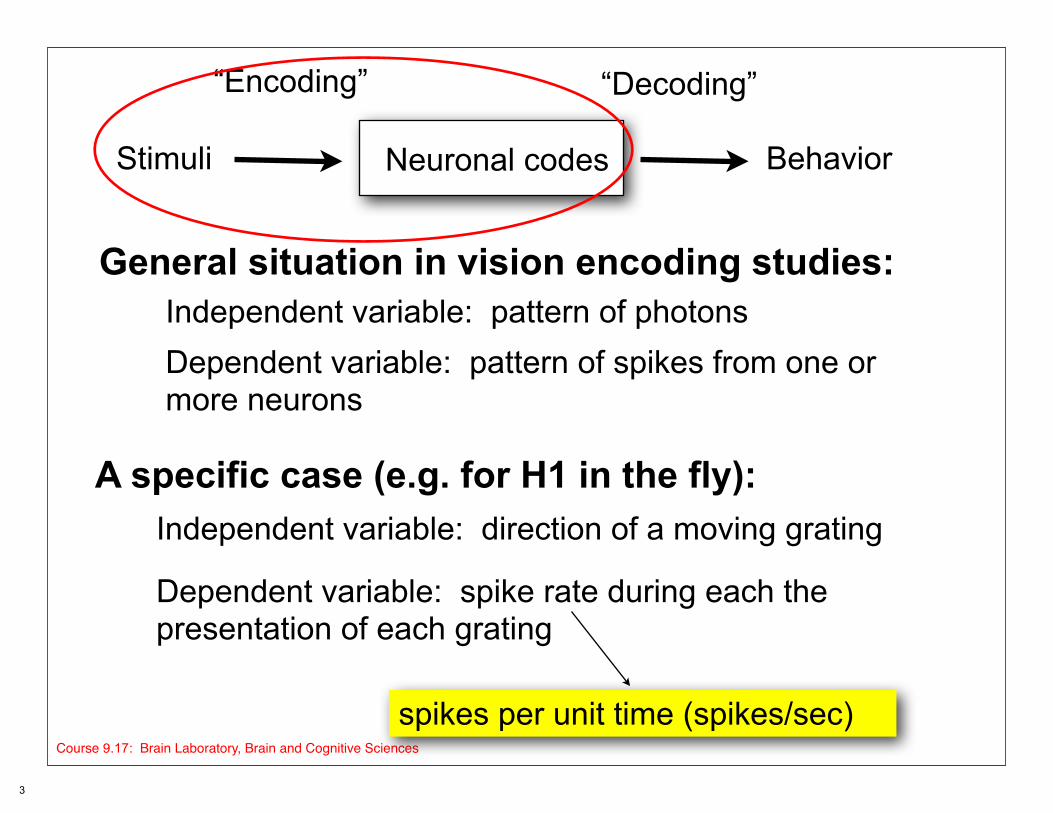
Stimuli BehaviorNeuronal codes
“Encoding” “Decoding”
General situation in vision encoding studies: Independent variable: pattern of photons Dependent variable: pattern of spikes from one or more neurons
A specific case (e.g. for H1 in the fly): Independent variable: direction of a moving grating
Course 9.17: Brain Laboratory, Brain and Cognitive Sciences
Dependent variable: spike rate during each the presentation of each grating
spikes per unit time (spikes/sec)
3
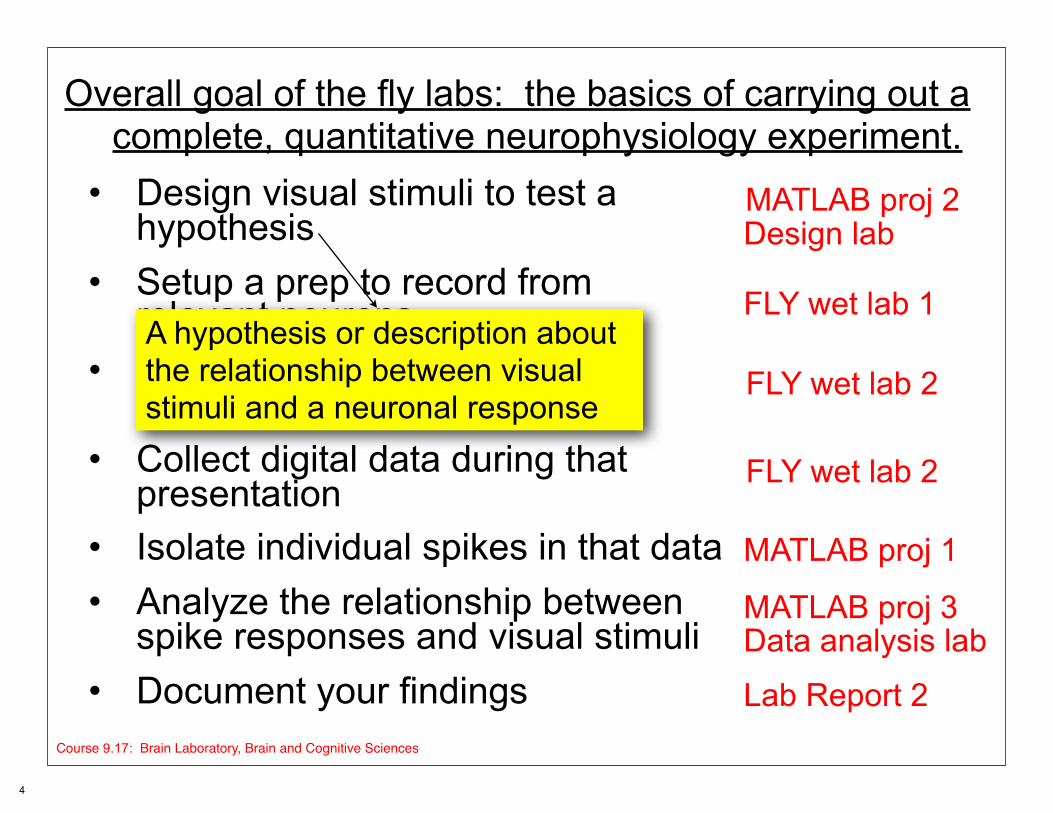
Overall goal of the fly labs: the basics of carrying out a complete, quantitative neurophysiology experiment.
• Design visual stimuli to test a hypothesis
• Setup a prep to record from
•
• Collect digital data during that
relevant neurons Present your visual stimuli in acontrolled, repeatable manner
A hypothesis or description about the relationship between visual stimuli and a neuronal response
presentation • Isolate individual spikes in that data • Analyze the relationship between
spike responses and visual stimuli • Document your findings
MATLAB proj 2 Design lab
FLY wet lab 1
FLY wet lab 2
FLY wet lab 2
MATLAB proj 1
MATLAB proj 3 Data analysis lab
Lab Report 2 Course 9.17: Brain Laboratory, Brain and Cognitive Sciences
4
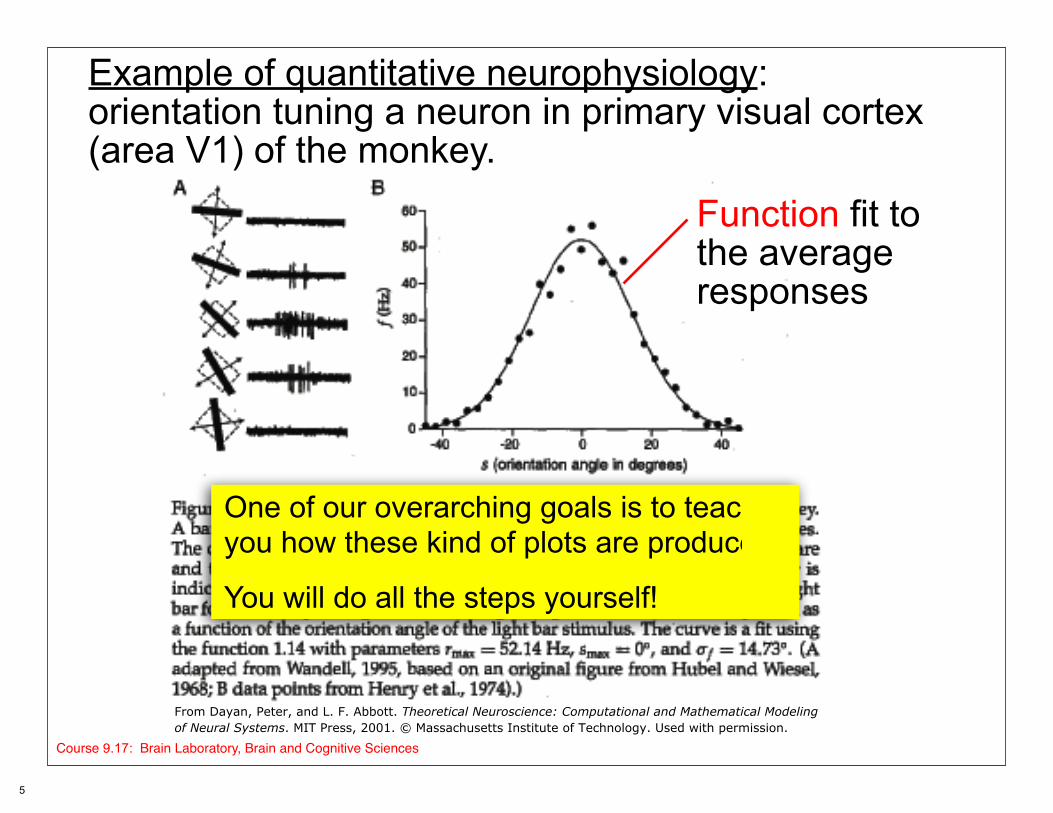
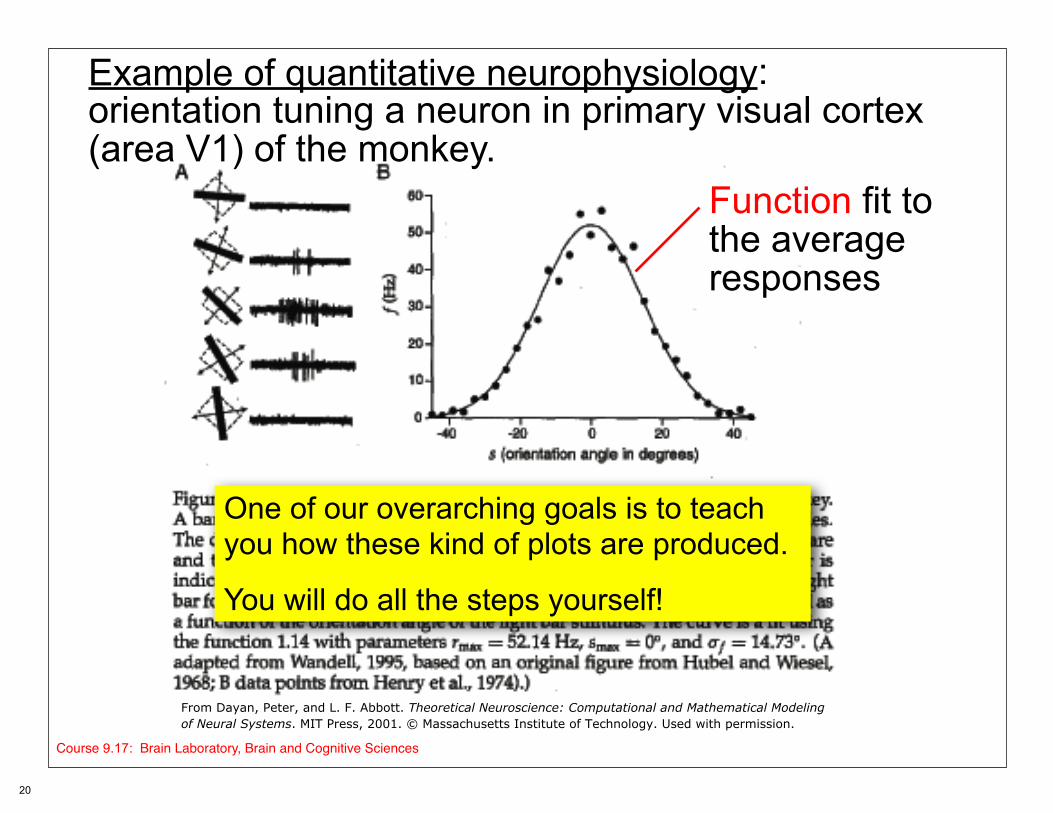
Example of quantitative neurophysiology: orientation tuning a neuron in primary visual cortex(area V1) of the monkey.
Function fit to the average responses
One of our overarching goals is to teach you how these kind of plots are produced.
You will do all the steps yourself!
From Dayan, Peter, and L. F. Abbott. Theoretical Neuroscience: Computational and Mathematical Modeling of Neural Systems. MIT Press, 2001. © Massachusetts Institute of Technology. Used with permission.
Course 9.17: Brain Laboratory, Brain and Cognitive Sciences
5
Lecture overview
• What hypothesis to test in the fly? • Quantitative data collection • Visual physiology conventions (“Methods”)
Course 9.17: Brain Laboratory, Brain and Cognitive Sciences
6
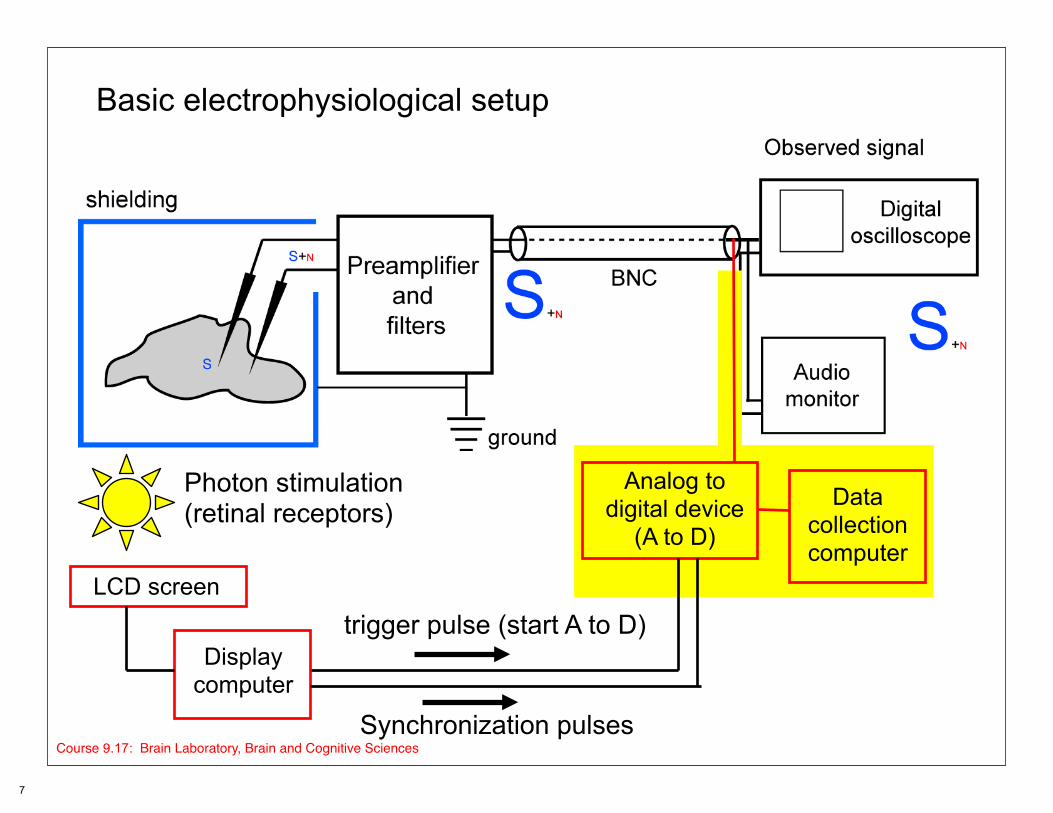
Basic electrophysiological setup
trigger pulse (start A to D)
Photon stimulation (retinal receptors)
Display computer
LCD screen
Analog to digital device
(A to D)
Data collection computer
Synchronization pulsesCourse 9.17: Brain Laboratory, Brain and Cognitive Sciences
7

We must have some way of saving the voltage signal so that we can find the spikes (action potentials) later
A single action potential
Analog to digital device (A to D)
Number of samples taken every second: 1000 (1 kHz sampling)
2000 (2 kHz sampling)
4000 (4 kHz sampling)
What sampling rate is optimal?
Are there downsides to sampling faster?
*Sample at 2x the highest frequency in the signal to get a perfect reproduction of the signal (= “Nyquist
Course 9.17: Brain Laboratory, Brain and Cognitive Sciences sampling rate”).
Dig
ital
Ana
log
1 ms (1/1000 sec) Reprinted by permission from Macmillan Publishers Ltd: Nature.Source: Hodgkin, A. L., and A. F. Huxley. "Action PotentialsRecorded from Inside a Nerve Fibre." Nature 144(1946): 710-11. © 1946.
8
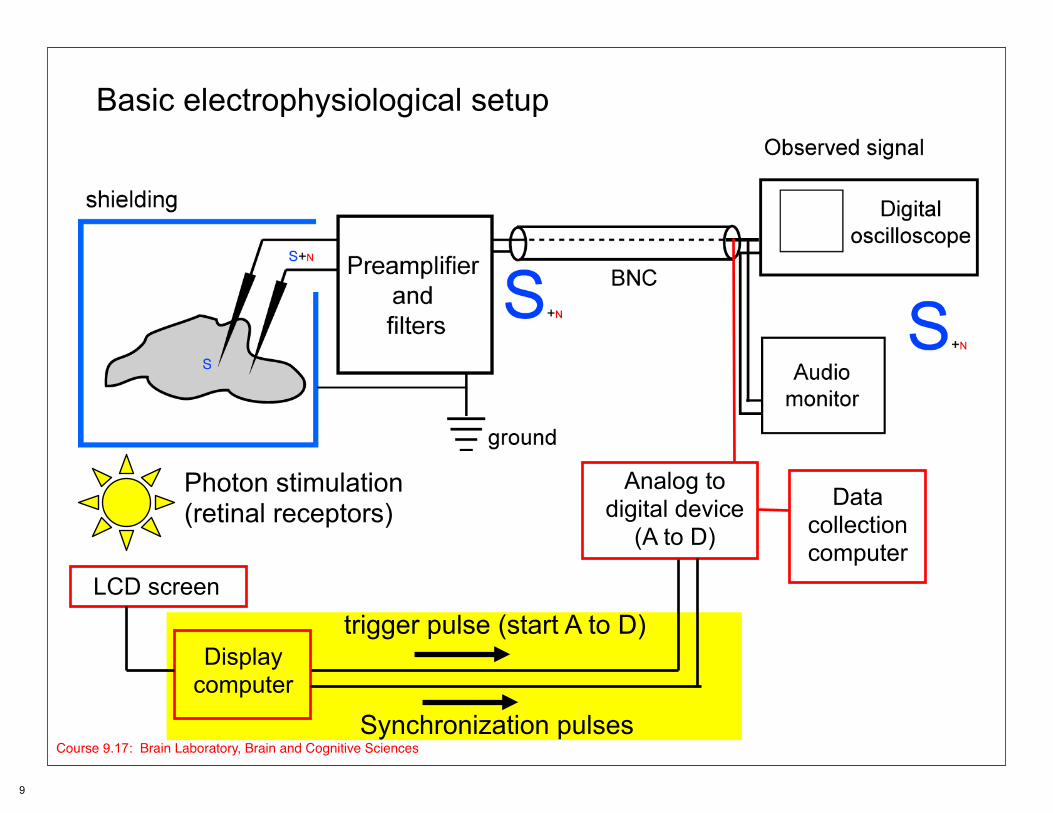
Basic electrophysiological setup
trigger pulse (start A to D)
Data collection computer
Display computer
Synchronization pulses
LCD screen
Photon stimulation (retinal receptors)
Analog to digital device
(A to D)
Course 9.17: Brain Laboratory, Brain and Cognitive Sciences
9
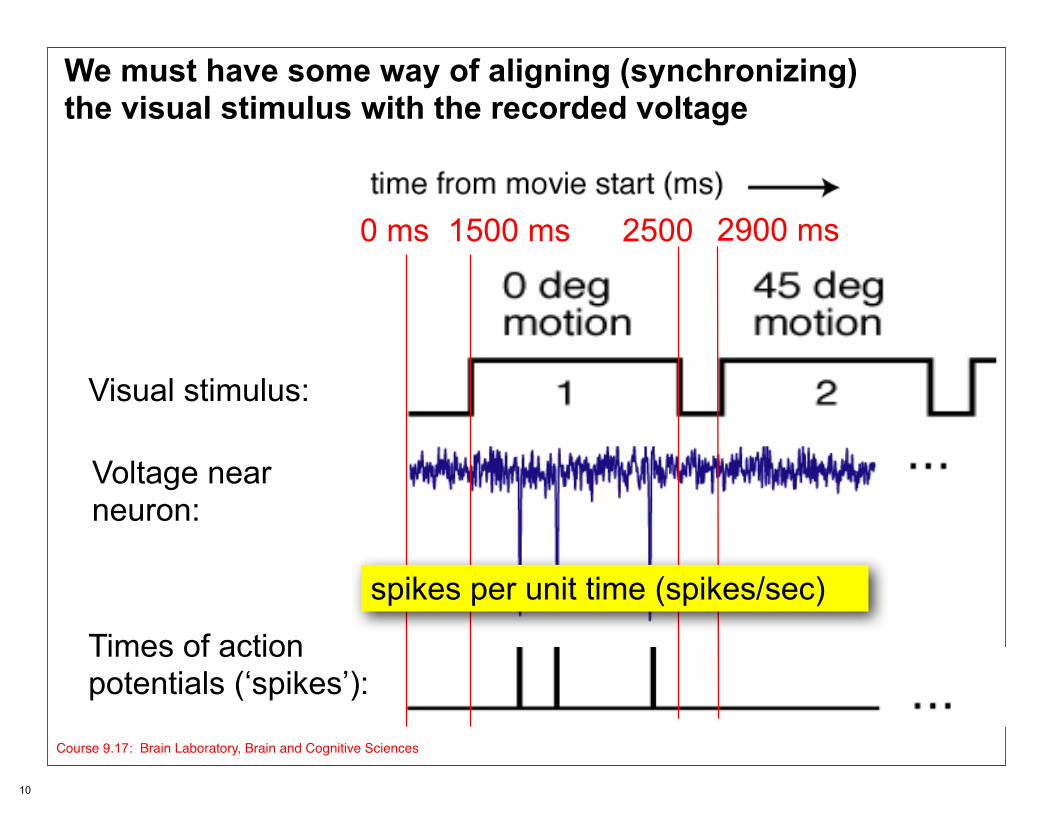
We must have some way of aligning (synchronizing) the visual stimulus with the recorded voltage
0 ms 1500 ms 2500 2900 ms
Visual stimulus:
Voltage near neuron:
Times of action potentials (‘spikes’):
spikes per unit time (spikes/sec)
Course 9.17: Brain Laboratory, Brain and Cognitive Sciences
10

First steps to quantitative physiology (science):
• Ability to accurately repeat conditions.
• Control of variables -- only change one thing at a time!
Stimulus run 1:
Stimulus run 2:
Course 9.17: Brain Laboratory, Brain and Cognitive Sciences
11
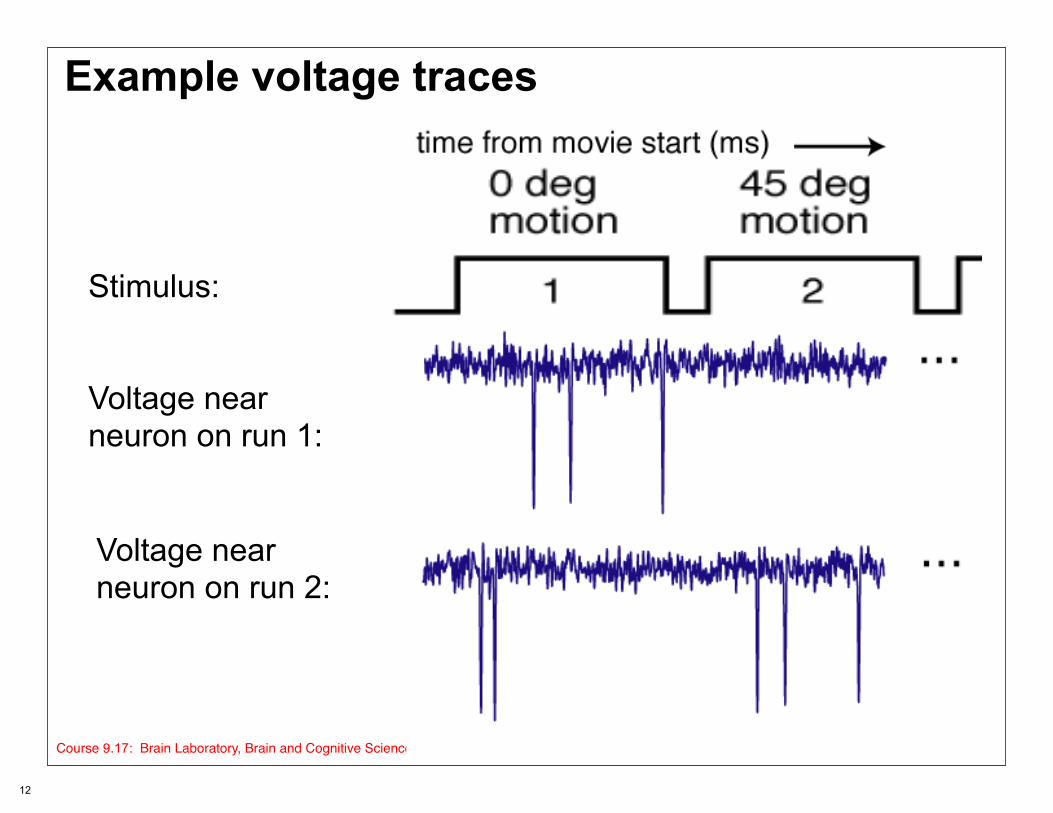
Example voltage traces
Stimulus:
Voltage near neuron on run 1:
Voltage near neuron on run 2:
Course 9.17: Brain Laboratory, Brain and Cognitive Sciences
12
Course 9.02: Brain Laboratory, Brain and Cognitive Sciences
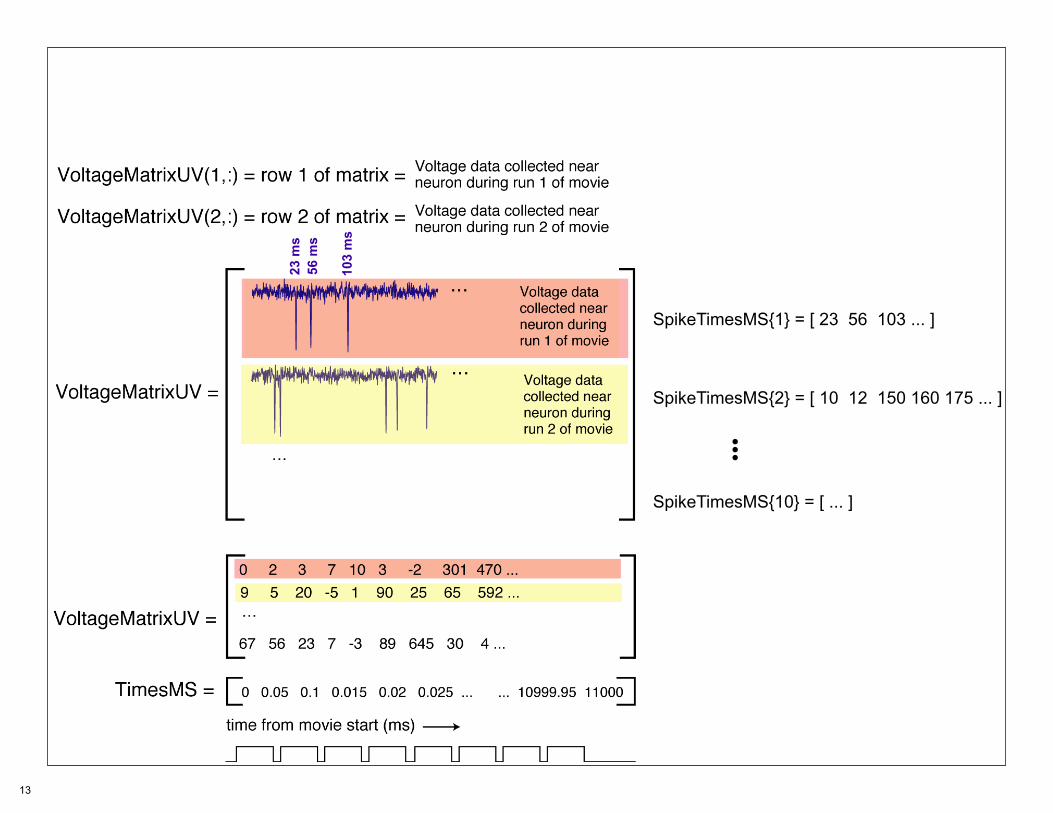
SpikeTimesMS{1} = [ 23 56 103 ... ]
SpikeTimesMS{2} = [ 10 12 150 160 175 ... ]
...
SpikeTimesMS{10} = [ ... ]
23 m
s56
ms
103
ms
13
Spike sorting:
You learned how to so spike detection in Matlab Tutorial 1. However, that was relatively clean data. Your data file may be much messier and may contain many artifacts that you should try to deal with. For example, if the fly moves, this creates a lot of noise in the voltage trace, and a simple spike detector might count this noise as spikes. Thus, you should NOT blindly run a spike detector, but should examine your data closely and make sure the spike detector is doing something reasonable.
Course 9.17: Brain Laboratory, Brain and Cognitive Sciences
14
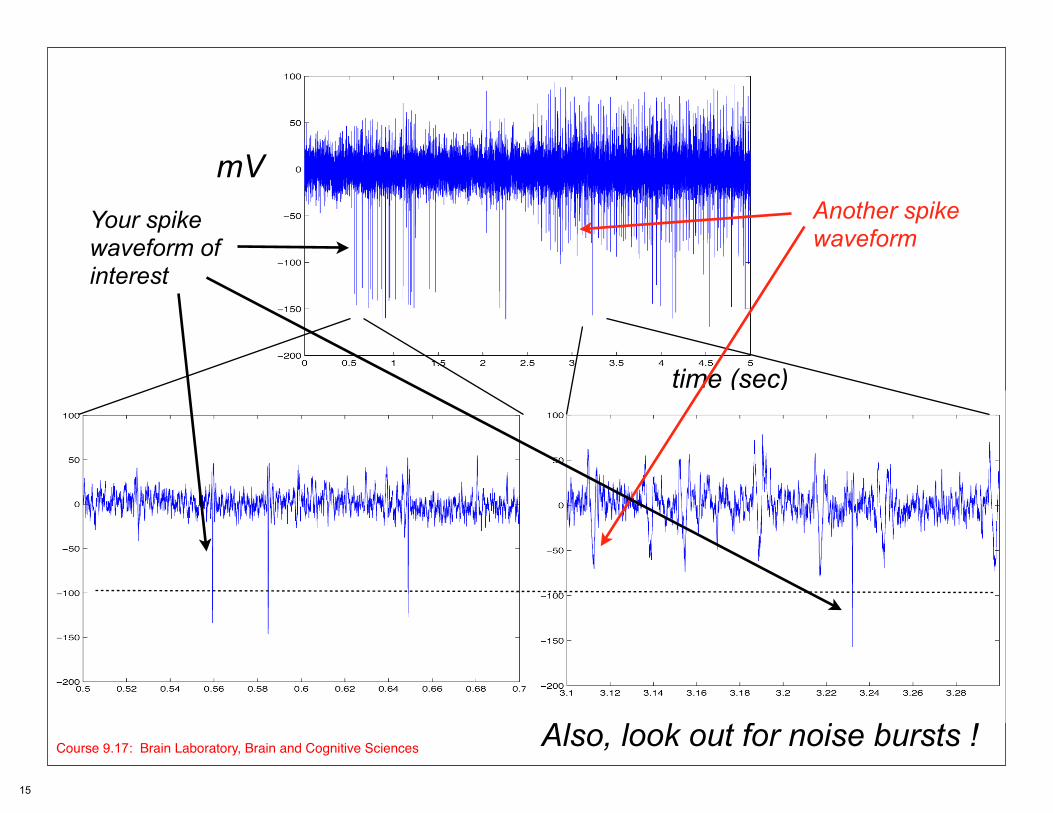
mV Another spikeYour spike waveformwaveform of
interest
Also, look out for noise bursts !
time (sec)
Course 9.17: Brain Laboratory, Brain and Cognitive Sciences
15
H1 cell Post-stimulus time histogram (PSTH)
Figure 4 removed due to copyright restrictions. Eckert, Hendrik. "Functional Properties of the HI-Neurone in the Third OpticGanglion of the Blowfly, Phaenicia." Journal of Comparative Physiology A 135, no. 1 (1980): 29-39.
Course 9.17: Brain Laboratory, Brain and Cognitive Sciences
16
10.1007/BF00660179.
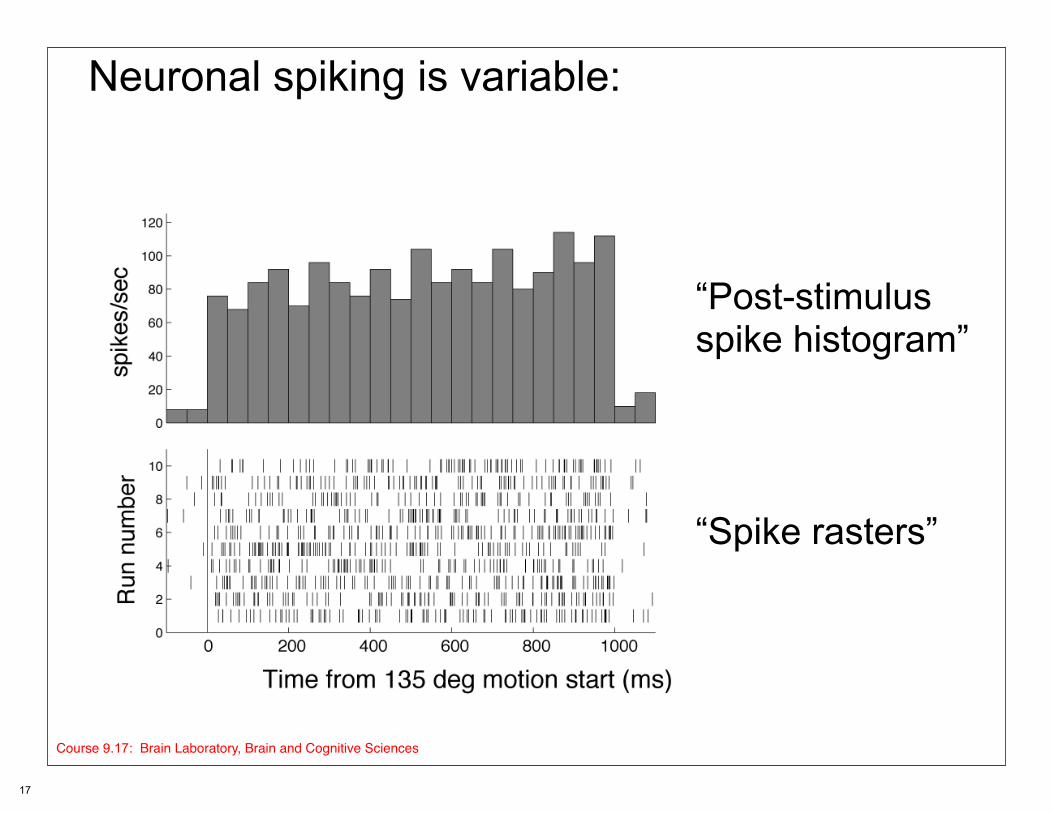
Neuronal spiking is variable:
“Post-stimulus spike histogram”
“Spike rasters”
Course 9.17: Brain Laboratory, Brain and Cognitive Sciences
17

What is a key analysis parameter here?
What are key underlying assumptions that allow usto collapse the 10 trials together?
“Post-stimulus spike histogram”
“Spike rasters”
Course 9.17: Brain Laboratory, Brain and Cognitive Sciences
18
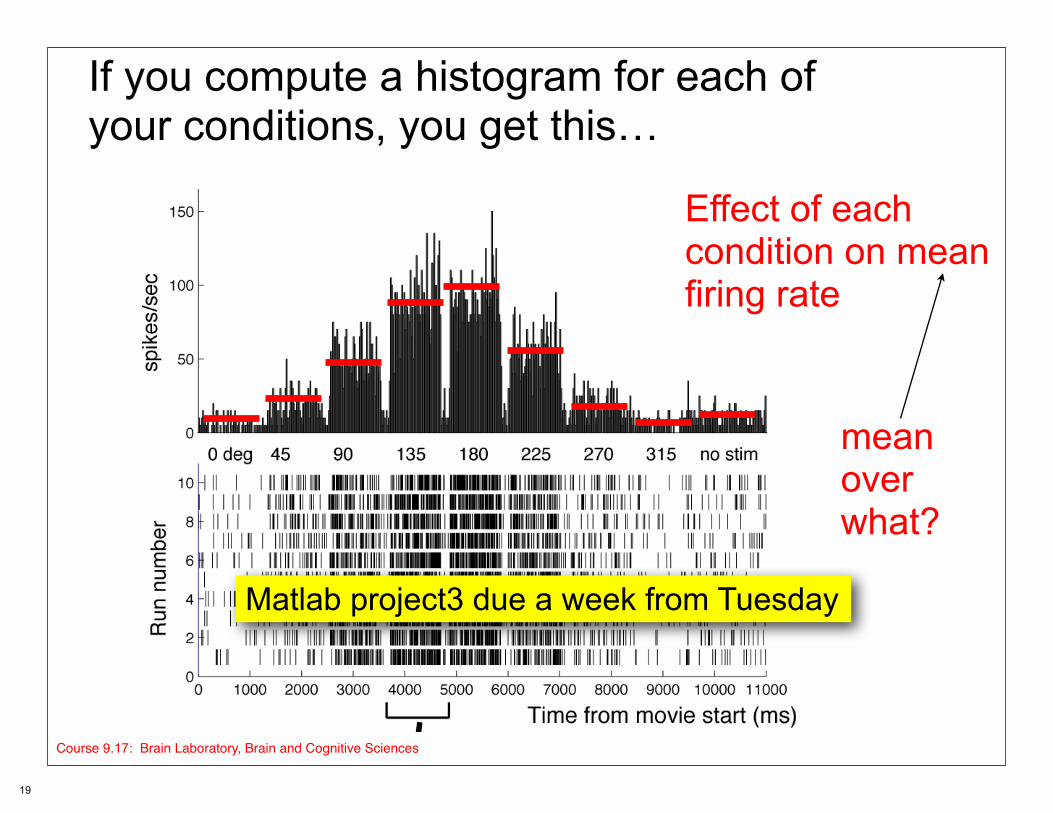
If you compute a histogram for each of your conditions, you get this…
Effect of each condition on mean firing rate
Matlab project3 due a week from Tuesday
mean over what?
Course 9.17: Brain Laboratory, Brain and Cognitive Sciences
19
Example of quantitative neurophysiology: orientation tuning a neuron in primary visual cortex(area V1) of the monkey.
Function fit to the average responses
One of our overarching goals is to teach you how these kind of plots are produced.
You will do all the steps yourself!
From Dayan, Peter, and L. F. Abbott. Theoretical Neuroscience: Computational and Mathematical Modelingof Neural Systems. MIT Press, 2001. © Massachusetts Institute of Technology. Used with permission.
Course 9.17: Brain Laboratory, Brain and Cognitive Sciences
20
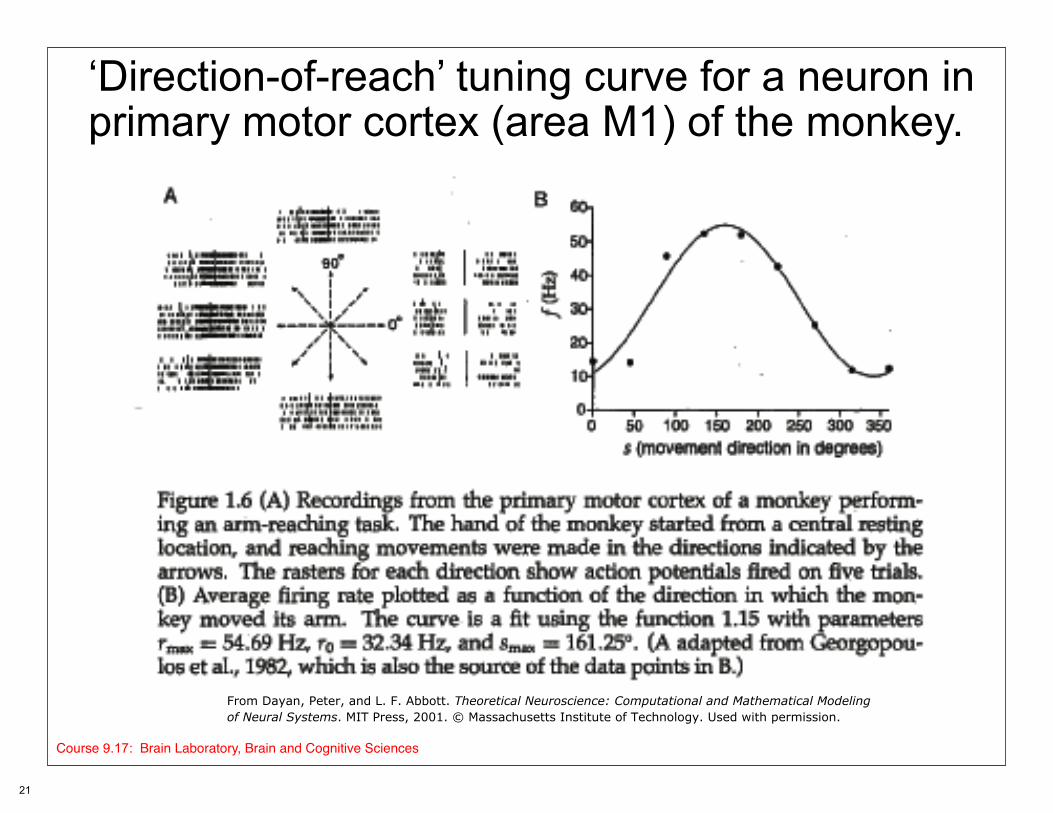
‘Direction-of-reach’ tuning curve for a neuron in primary motor cortex (area M1) of the monkey.
From Dayan, Peter, and L. F. Abbott. Theoretical Neuroscience: Computational and Mathematical Modelingof Neural Systems. MIT Press, 2001. © Massachusetts Institute of Technology. Used with permission.
Course 9.17: Brain Laboratory, Brain and Cognitive Sciences
21
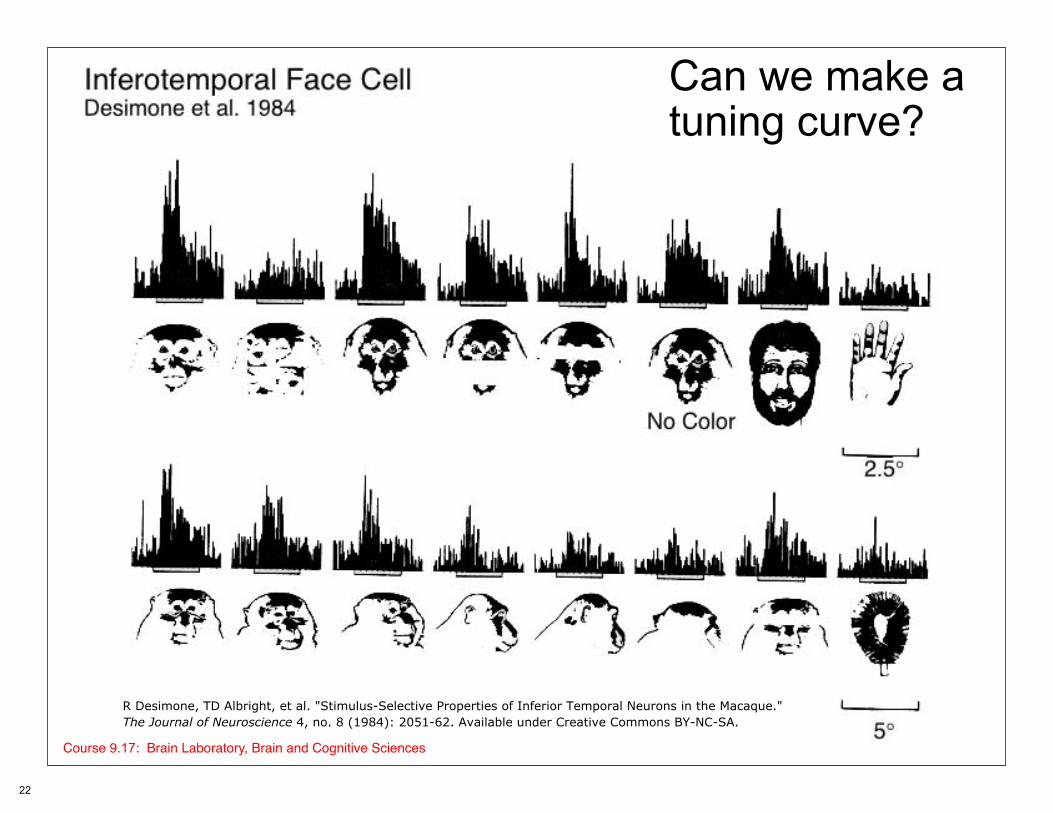
Can we make a tuning curve?
Course 9.17: Brain Laboratory, Brain and Cognitive Sciences
22
R Desimone, TD Albright, et al. "Stimulus-Selective Properties of Inferior Temporal Neurons in the Macaque."The Journal of Neuroscience 4, no. 8 (1984): 2051-62. Available under Creative Commons BY-NC-SA.
Tuning curves: what are they good for? • Show the data (nice summary) • Describe trends in the data (function fit) • Predict response to other stimuli ? • Describe the neuron’s role in behavior ???
Tuning curves: downsides Emphasize mean firing rates. Msec-scale
timing of individual spikes is ignored Not everything we are interested in can be
plotted along a single axis Course 9.17: Brain Laboratory, Brain and Cognitive Sciences
23
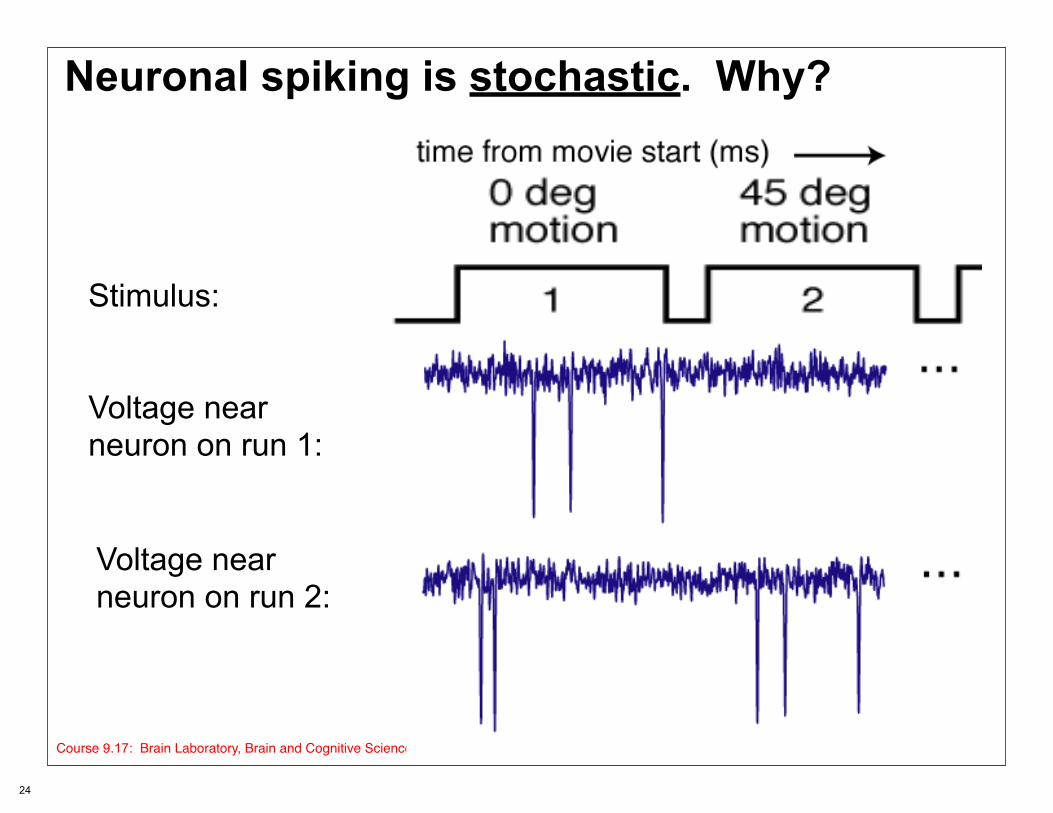
Neuronal spiking is stochastic. Why?
Stimulus:
Voltage near neuron on run 1:
Voltage near neuron on run 2:
Course 9.17: Brain Laboratory, Brain and Cognitive Sciences
24
Lecture overview
• What hypothesis to test in the fly? • Quantitative data collection • Visual physiology conventions (“Methods”)
Course 9.17: Brain Laboratory, Brain and Cognitive Sciences
25
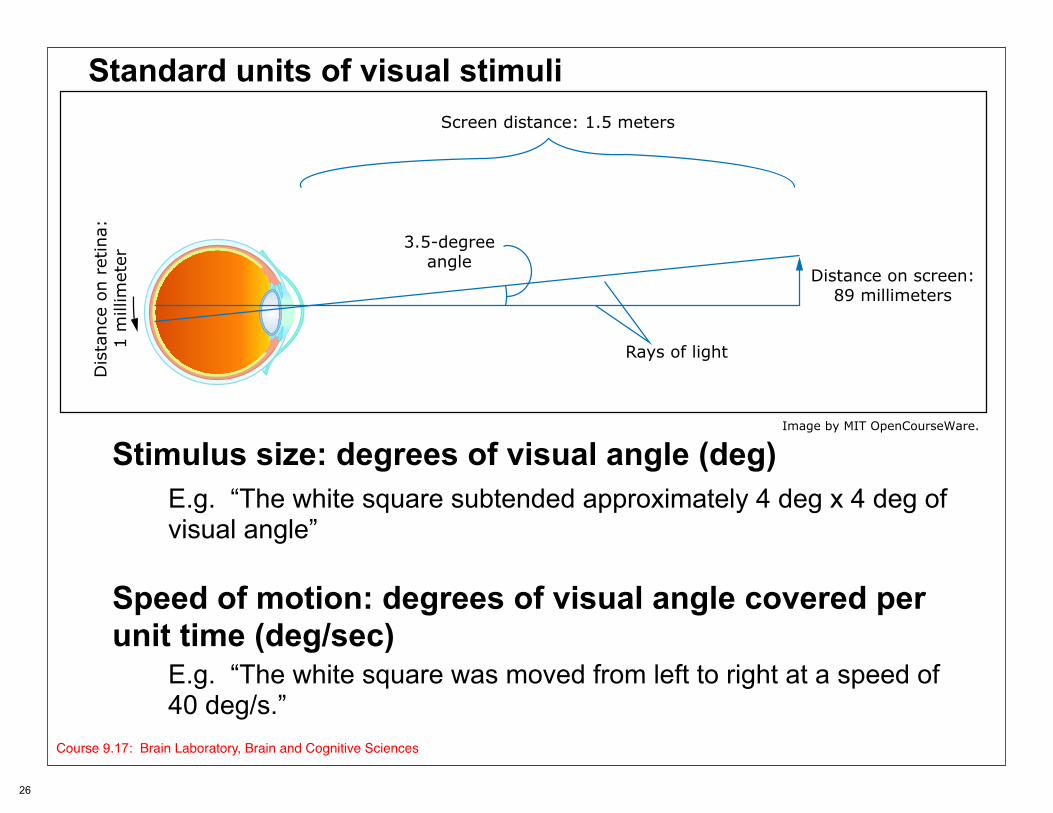
Standard units of visual stimuli
Stimulus size: degrees of visual angle (deg) E.g. “The white square subtended approximately 4 deg x 4 deg of visual angle”
Speed of motion: degrees of visual angle covered per unit time (deg/sec)
E.g. “The white square was moved from left to right at a speed of 40 deg/s.”
Course 9.17: Brain Laboratory, Brain and Cognitive Sciences
26
Distance on screen:89 millimeters
Rays of light
3.5-degreeangle
Screen distance: 1.5 metersD
ista
nce
on r
etin
a:1
mill
imet
er
Image by MIT OpenCourseWare.

Standard units of visual stimuli: receptive field maps in vertebrates
Center of receptive field
Size (diameter) of receptive field
© MGraw-Hill Companies. All rights reserved. This content isexcluded from our Creative Commons license. For moreinformation, see http://ocw.mit.edu/help/faq-fair-use/.
0
Center of gaze (center of the retina)
deg
(ele
vatio
n)
0 deg (azimuth)
Course 9.17: Brain Laboratory, Brain and Cognitive Sciences
27
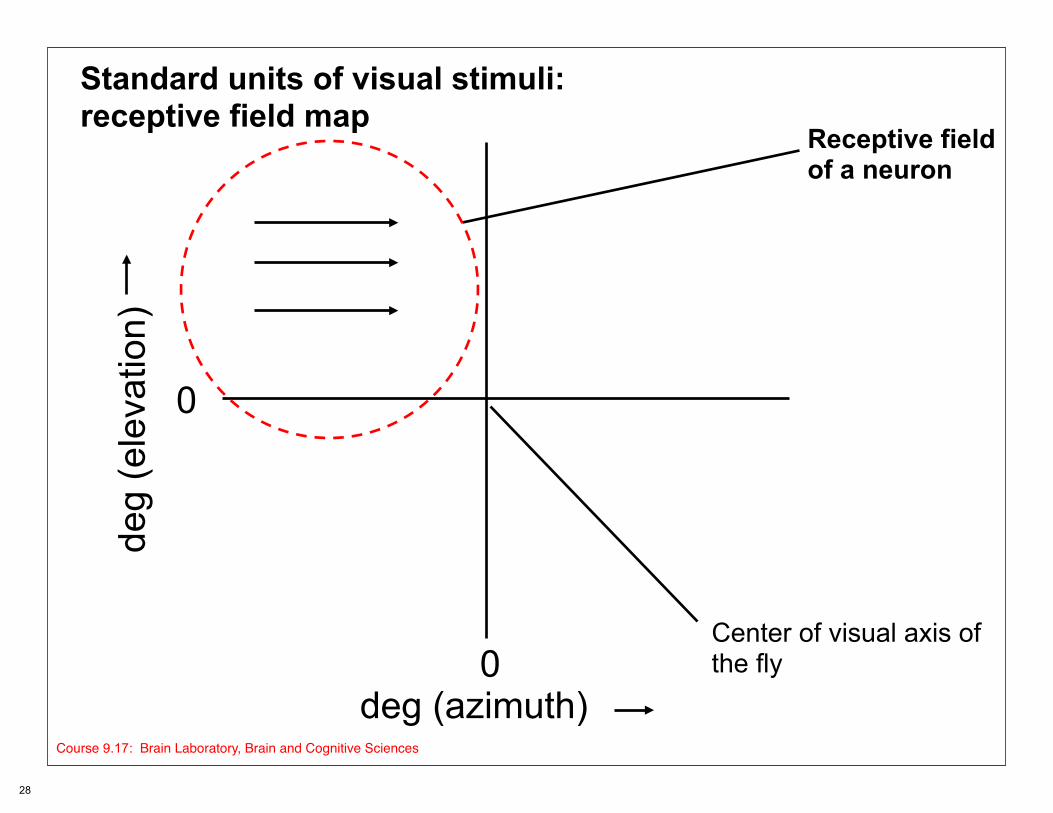
Standard units of visual stimuli: receptive field map
Receptive field of a neuron
deg
(ele
vatio
n)
Center of visual axis of
0
0 the fly
deg (azimuth) Course 9.17: Brain Laboratory, Brain and Cognitive Sciences
28
TIO
ons sal,
(obt(LP
VI
(b) fly’
d
The V1 neuronMO
FIGURE 8. Response fields of the neurhemisphere (f, frontal; c, caudal; d, dorelevation of 0 deg. Local motion tuning indicates the local preferred direction
MOTION-SENSITIVE
FIGURE 8. Rsponse fields of the neurons Hl (a) and Vl hemisphere (f, frontal; c, caudal; d, dorsal, v, ventral). The elevation of 0 deg. Local motion tuning (obtained with standar
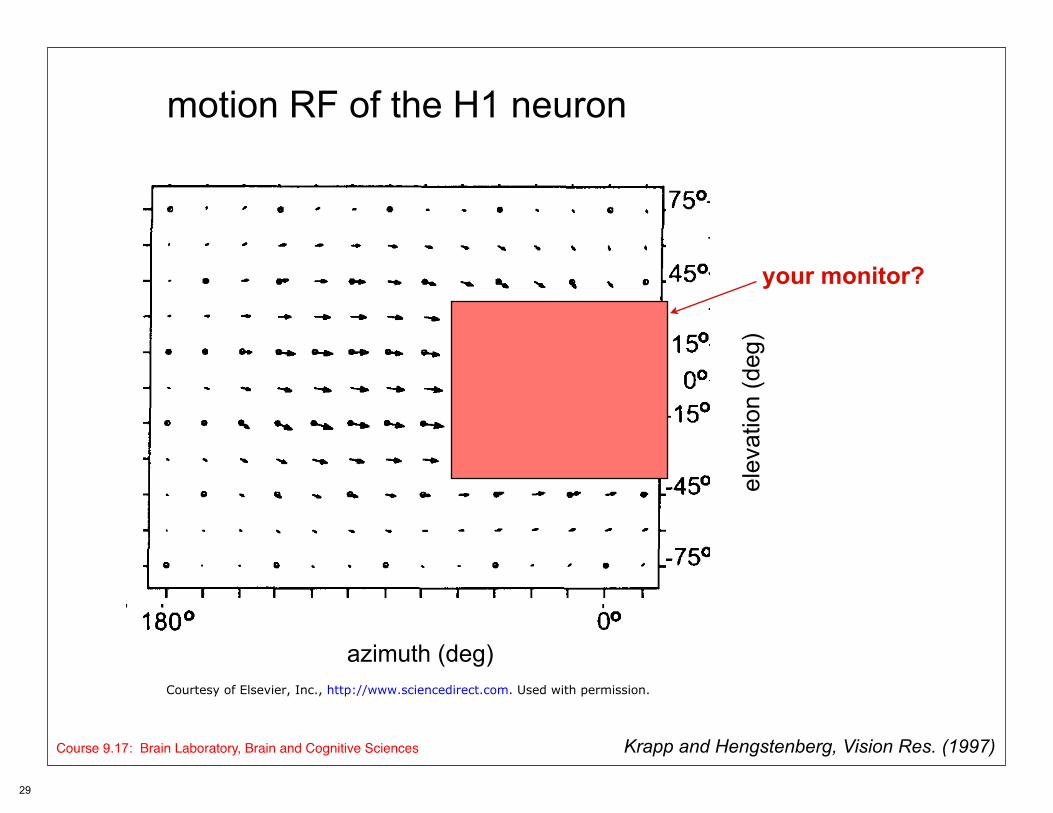
motion RF of the H1 neuron
elev
atio
n (d
eg)
your monitor?
azimuth (deg) Courtesy of Elsevier, Inc., http://www.sciencedirect.com. Used with permission.
Course 9.17: Brain Laboratory, Brain and Cognitive Sciences Krapp and Hengstenberg, Vision Res. (1997)
29
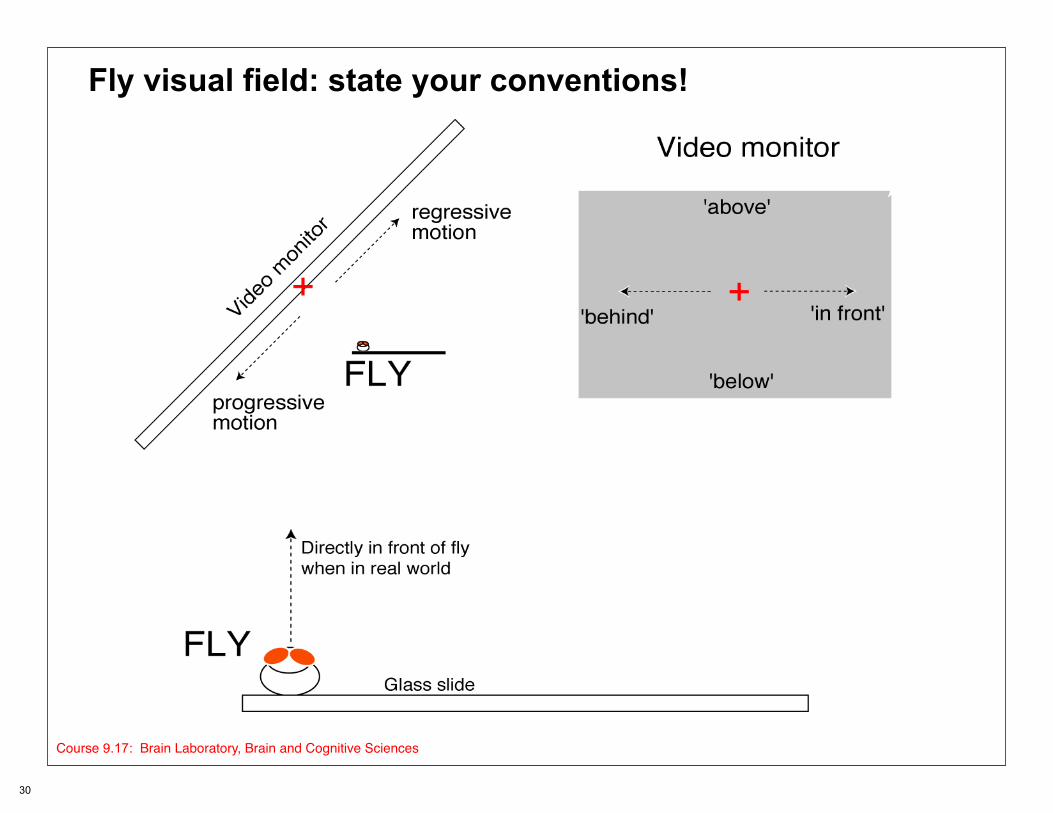
Fly visual field: state your conventions!
Course 9.17: Brain Laboratory, Brain and Cognitive Sciences
30
Course 9.02: Brain Laboratory, Brain and Cognitive Sciences
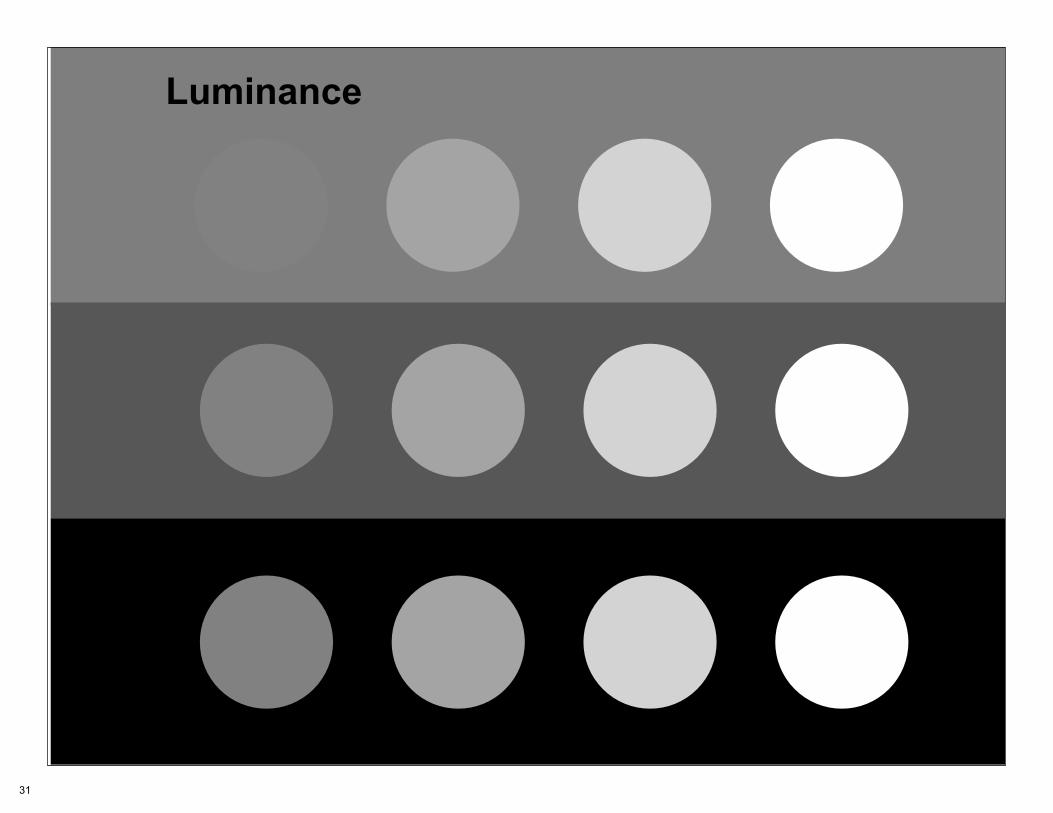
Luminance
31
Course 9.17: Brain Laboratory, Brain and Cognitive Sciences
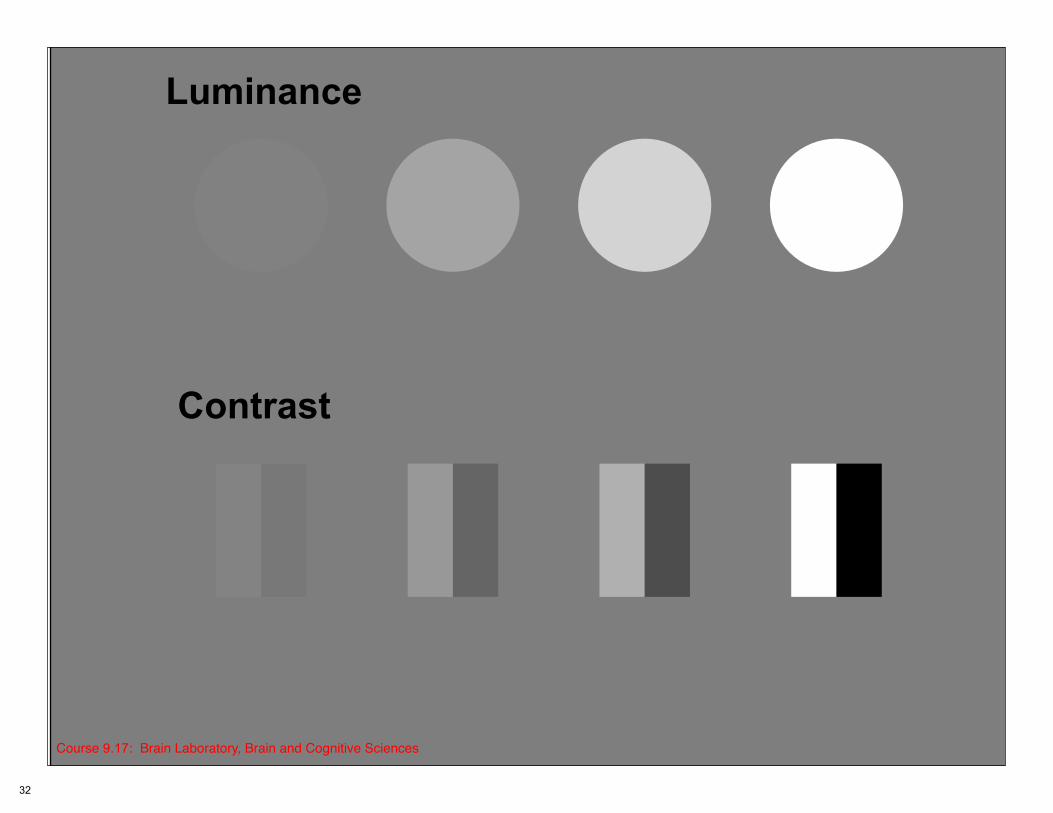
Luminance
Contrast
32

Basic units of visual stimuli
- luminance: amount of light (~photons) emitted from a particular area per unit time (units: candela/m2)
- contrast: range of luminance relative to the total luminance (e.g. Michelson contrast = ( Lmax - Lmin ) / (Lmax + Lmin) )
For your lab report:
assume that your display monitor has:
maximum luminance of 100 cd/m2 (full white, pixel value = 255 in Matlab matrix)
minimum luminance of 1 cd/m2 (deepest black, pixel value = 0 in Matlab matrix)
Course 9.17: Brain Laboratory, Brain and Cognitive Sciences
33

MIT OpenCourseWarehttp://ocw.mit.edu
9.17 Systems Neuroscience LabSpring 2013 For information about citing these materials or our Terms of Use, visit: http://ocw.mit.edu/terms.