What four states are doing to support local data-driven...
34
ISSUES & ANSWERS REL 2012–No. 118 At Pennsylvania State University What four states are doing to support local data-driven decisionmaking: policies, practices, and programs
Transcript of What four states are doing to support local data-driven...

I S S U E S & A N S W E R S R E L 2 0 1 2 – N o . 1 1 8
At Pennsylvania State University
What four states are doing to support local data-driven decisionmaking: policies, practices, and programs
I S S U E S&ANSWERS R E L 2 0 12 – N o . 11 8
At Pennsylvania State University
What four states are doing to support local data-driven decisionmaking: policies, practices, and programs
November 2011
Prepared by
Michael A. Gottfried RAND Corporation
Gina S. Ikemoto RAND Corporation
Nate Orr RAND Corporation
Cheryl Lemke Metiri Group
WA
OR
ID
MT
NV
CA
UT
AZ
WY
ND
SD
NE
KSCO
NM
TX
OK
CO
AR
LA
MS AL GA
SC
NC
VAWV
KY
TN
PA
NY
FL
AK
NJ
MN
WI
IA
IL IN
MI
OH
VT
NH
ME
MDDE
DCMO
At Pennsylvania State University
Issues & Answers is an ongoing series of reports from short-term Fast Response Projects conducted by the regional educa-tional laboratories on current education issues of importance at local, state, and regional levels. Fast Response Project topics change to reflect new issues, as identified through lab outreach and requests for assistance from policymakers and educa-tors at state and local levels and from communities, businesses, parents, families, and youth. All Issues & Answers reports meet Institute of Education Sciences standards for scientifically valid research.
November 2011
This report was prepared for the Institute of Education Sciences (IES) under Contract ED-06-CO-0029 by Regional Edu-cational Laboratory Mid-Atlantic administered by Pennsylvania State University. The content of the publication does not necessarily reflect the views or policies of IES or the U.S. Department of Education nor does mention of trade names, com-mercial products, or organizations imply endorsement by the U.S. Government.
This report is in the public domain. While permission to reprint this publication is not necessary, it should be cited as:
Gottfried, M., Ikemoto, G., Orr, N., and Lemke, C. (2011). What four states are doing to support local data-driven decision-making: policies, practices, and programs. (Issues & Answers Report, REL 2012–No. 118). Washington, DC: U.S. Department of Education, Institute of Education Sciences, National Center for Education Evaluation and Regional Assistance, Regional Educational Laboratory Mid-Atlantic. Retrieved from http://ies.ed.gov/ncee/edlabs.
This report is available on the regional educational laboratory website at http://ies.ed.gov/ncee/edlabs.

Summary
What four states are doing to support local data-driven decisionmaking: policies, practices, and programs
REL 2012–No. 118
This report documents how four state education agencies are supporting local data-driven decisionmaking through their policies, practices, and programs for creating data systems, improving data access and use, and building district and school capacity to use data.
The broad implementation of standards-based accountability presents new opportunities and incentives for data use in education. The increase in data for districts and schools has intensified interest in data-driven decision-making at all levels of the education system. Data-driven decisionmaking—systematically collecting and analyzing an array of data, from administrative to achievement—guides decisions that improve student and school performance.
This report, responding to District of Colum-bia Office of State Superintendent of Education and Pennsylvania Department of Education requests, describes how Arkansas, Florida, Texas, and Virginia are supporting local data-driven decisionmaking. These states were chosen because they reported implementing the largest number of features of state longitu-dinal data systems and associated supports for local use (U.S. Department of Education 2009). The study documents statewide policies, prac-tices, and programs for creating data systems,
improving access to data, and building district and school capacity to use the data.
Two questions guide this study:
• What policies or practices in Arkansas, Florida, Texas, and Virginia support local use of data for education purposes?
• How do Arkansas, Florida, Texas, and Vir-ginia support local use of data in selected state education agency–administered programs?
Data were collected over May–July 2010, and the study included systematic reviews of the four state education agencies’ websites and interviews with 16 state administrators (8 administrators of statewide data policies and systems and 8 of data-driven decisionmaking support to local users). Data collection and analysis were guided largely by an analytical framework developed by Data Quality Cam-paign (2009), a national initiative to improve the collection, availability, and use of high- quality data.
This study found that the four states have implemented a range of policies and practices in all three categories of the study’s analytical framework:
• Creating, expanding, and linking data systems. The four states have created and

iv Summary
built state repositories and are expanding the types of data collected and warehoused to better equip districts and schools to rig-orously assess whether students, schools, and districts are meeting state college readiness requirements and career readi-ness expectations.
• Ensuring data access and use. The four states have implemented policies and prac-tices to help local educators and adminis-trators access, understand, and use data effectively. In doing so, they are making data and analyses timely, readily available, and easy to understand for parents, educa-tors, and policymakers.
• Building district and school capacity to use data. The four states have focused on strengthening local human resource capability, mainly through partnerships and professional development. By build-ing local capacity to access and analyze data stored in state longitudinal data systems, the states intend to help local
policymakers and practitioners use data to inform key policy questions on perfor-mance and improvement.
In addition to state policies, the study also identified five state programs supporting district and school use of data (one in Florida, two in Texas, and two in Virginia).
References
Data Quality Campaign. (2009). The next step: using longitudinal data systems to improve student success. Retrieved June 19, 2009, from www.dataqualitycampaign.org/files/NextStep.pdf.
U.S. Department of Education, National Center for Education Statistics. (2009). Statewide Longitudinal Data Systems grant program: de-signing, developing, implementing, and using longitudinal data systems to improve student learning. Retrieved June 20, 2009, from http://nces.ed.gov/Programs/SLDS/index.asp.
November 2011

Table of conTenTs v
Table of conTenTs
Why this study? 1State support for local data-driven decisionmaking is important 1What the Mid-Atlantic Region states want to know 3
Research questions 3
Findings 3Statewide policies and practices that support local data use 3States reporting that at least half of all 48 features are in operation 4
Study limitations 17
Suggestions for future research 17
Appendix A Summaries of studies with strong findings on state education agency support for local data-driven decisionmaking 19
Appendix B Study methods 20
Notes 26
References 27
Boxes
1 Key terms 2
2 Data and methodology 4
B1 Data-driven decisionmaking analytical codes 24
Figures
1 Three areas of accessible school-level data in the Arkansas Department of Education Data Center 8
2 The three offices that provide information technology infrastructure and support for the Virginia Department of Education 10
Tables
1 Policies and practices in use in Arkansas, Florida, Texas, and Virginia, 2009 6
2 Preparing school-, district-, and state-level reports in Florida 9
B1 Statewide longitudinal data system features by state, as identified by the National Center for Education Statistics, 2009 21

Why ThiS STudy? 1
This report documents how four state education agencies are supporting local data-driven decisionmaking through their policies, practices, and programs for creating data systems, improving data access and use, and building district and school capacity to use data.
Why This sTudy?
The broad implementation of standards-based accountability presents new opportunities and incentives for data use in education. The increase in data for districts and schools has intensified interest in data-driven decisionmaking at all levels of the education system.
Data-driven decisionmaking is “teachers, princi-pals, and administrators systematically collecting and analyzing various types of data, including demographic, administrative, process, percep-tual, and achievement data, to guide a range of decisions to help improve the success of students and schools” (Hamilton et al. 2009, p. 46). Dur-ing the process, educators combine raw data with stakeholder expertise to diagnose problems and generate hypotheses that can improve outcomes for both students and schools (Mandinach, Honey, and Light 2006; Marsh, Pane, and Hamilton 2006). See box 1 for definitions of key terms.
This report, responding to District of Columbia Office of State Superintendent of Education and Pennsylvania Department of Education re-quests, describes how Arkansas, Florida, Texas, and Virginia are supporting local data-driven decisionmaking. These states were chosen because they reported implementing the largest number of features of state longitudinal data systems and as-sociated supports for local use (U.S. Department of Education 2009). The study documents statewide policies, practices, and programs for creating data systems, improving access to data, and building district and school capacity to use the data.1
This study complements the Institute of Education Sciences practice guide on data-driven decision-making, Using student achievement data to sup-port instructional decision making (Hamilton et al. 2009). Whereas the practice guide documents the critical need for local capacity to use data in education decisionmaking, this study looks at how state education agencies are attempting to support local data-driven decisionmaking.
State support for local data-driven decisionmaking is important
Although some organizations have issued policy recommendations on ways state education agencies can support local data-driven decision-making, there is limited empirical research on the topic. LaPointe et al. (2009) examined how states support data-driven decisionmaking in districts

2 WhaT four STaTeS are doing To SupporT local daTa-driven deciSionmaking
box 1
Key terms
Data. Information maintained by state education agencies, districts, schools, and teachers. Can include assessment data, demographic and school-level data on students and staff, state test scores, and financial information.
Data-driven decisionmaking. The systematic collection and analysis of various types of data—including input, process, outcome, and satisfac-tion data—by teachers, principals, and administrators to guide decisions that help students and schools succeed.
Data Quality Campaign. A na-tional initiative to improve the collection, availability, and use of high- quality data. One of its primary efforts is to provide states with the tools and resources to help them implement and use longitudinal data systems.
Data system (or data warehouse). A centralized repository combin-ing data from a range of sources to provide an integrated view of data sources and a uniform interface for data access.
Data tools. Software that allows teachers and administrators to
collect, organize, and analyze data for decisionmaking. Includes software on individual personal computers and online tools.
Longitudinal data system. A data system containing information over multiple years in multiple schools. The system tracks years of student and teacher demographic data, test scores, assessments, and other information.
Policy. A deliberate mandate or guide to achieve rational outcomes.
Practice. A customary way of operat-ing or behaving.
and schools in the Northeast and Islands Region and focused on the use of student achievement data. In an earlier study, Marsh et al. (2006) syn-thesized the findings from a number of studies on data-driven decisionmaking and suggested that other types of data can also be valuable in district, school, and state education agency policy deci-sions. Those data can involve other measures of student performance —d ropout rates, nonpromo-tion indicators, student-level attendance records (Gottfried 2010), and patterns of absence behavior (Gottfried 2009)— and nonachievement measures, including school financing, student demograph-ics, quality of instruction, and opinions from teachers, students, parents, and the community (Ikemoto and Marsh 2007; see appendix A for a list of relevant studies). This report examines policies and practices that address many types of data.
Data can guide improvement at many levels. Students and instructors can evaluate progress toward achievement outcomes, teachers and principals can assess issues of instruction and curriculum, and administrators and districts can evaluate mobility and dropout. The poten-tial of data-driven decisionmaking, however,
can be realized only if districts and schools and districts have greater access to data and the tools to use it.
Federal regulations and funding have spurred this access — engaging state education agencies more in creating and maintaining robust data systems. In 2009, the American Recovery and Reinvestment Act increased by $260 million the funding for state longitudinal data systems (Hamilton et al. 2009). And the Statewide Longitudinal Data Systems grant program allocated $150 million to 27 states in fiscal year 2010 (U.S. Department of Education 2009).
Increasing access alone, however, does not neces-sarily improve institutional knowledge or student outcomes (Crawford et al. 2008). Districts and schools need to know how to use the data ef-fectively. And they often lack the adequate skills and knowledge to formulate questions, select indicators, interpret results, and develop solutions (Choppin 2002; Feldman and Tung 2001; Marsh, Pane, and Hamilton 2006; Mason 2002; Supovitz and Klein 2003). States can thus help educators interpret data and apply new knowledge to inform decisions and actions.
findingS 3
What the Mid-Atlantic Region states want to know
Researchers and policymakers are calling on state education agencies to do more to support district and school data-driven decisionmaking, and states across the country are grappling with how to take on these new roles.
Regional Educational Laboratory Mid-Atlantic Region wants to know what states outside the region are doing to create data systems, improve data access and use, and provide professional development for building district and school capacity for data-driven decisionmaking. Local education agencies are seeking leadership and support for professional development, data organization, systems approaches to data collec-tion and use, warehousing data, and establishing comprehensive data systems and data cultures. Understanding the policies and practices of other states can inform the Mid-Atlantic Region states on more ways they can provide this support.
ReseaRch quesTions
Two research questions guide this study:
• What policies or practices in Arkansas, Florida, Texas, and Virginia support local use of data for education purposes?
• How do Arkansas, Florida, Texas, and Vir-ginia support local use of data in selected state education agency–administered programs?
Data, derived from the National Center of Edu-cation Statistics (U.S. Department of Education 2009), were collected from state education agency websites, government and professional association reports, and interviews with four administrators from each state. Data collection and analysis were guided largely by an analytical framework devel-oped by Data Quality Campaign (2009; see box 2 for a description of the data and methodology and appendix B for more detail).
findings
Analysis of interviews of state education agency officials and web-based materials shows that state education agencies are working to advance local policy promoting data-driven decision-making. States have already taken steps to establish state longitudi-nal data systems and to expand data collection, information sources, and warehousing capac-ity. Now, the states are turning to the next step: building the capacity of educators to use the data and inform and drive education decisions. States are doing this by providing professional development, tools, and resources to encourage local data collection, analysis, and decisionmaking; partnering with external groups to analyze data; and implement-ing programs that support data use.
These types of programs may facilitate a data infrastructure and a data culture (the develop-ment of larger human resource capacity) in which state education agencies support local uses of data systematically across all programs.
Statewide policies and practices that support local data use
All three types of policies and practices identified as important in supporting local data use were being used by the four sample states (table 1).
Creating, expanding, and linking data systems. All four states have built state repositories; three have expanded the types of data collected and ware-housed beyond student performance data. Only Texas has conducted or funded program evalua-tion to generate findings that could inform local decisionmaking.
state education
agencies are working
to advance local policy
promoting data-driven
decisionmaking. states
have already established
state longitudinal data
systems and expanded
data collection,
information sources,
and warehousing
capacity. now, they are
building the capacity of
educators to use the data
and inform and drive
education decisions

4 WhaT four STaTeS are doing To SupporT local daTa-driven deciSionmaking
box 2
Data and methodology
The research team selected four state education agencies by analyzing data from the National Center for Educa-tion Statistics (U.S. Department of Education 2009). The center awarded grants to 42 states (including the District of Columbia) to develop
their longitudinal data systems and required grantees to report which ofthe 48 features of statewide longi-tudinal data systems and supports they had in operation. (See table B1 in appendix B for a list of the states and features.)
These self- reported data, along with two criteria, were used to identify the four states that had in operation the largest number of features of state longitudinal data systems and associ-ated supports for local use. The two criteria were:
• Having in operation at least half of all 48 features.
• Having in operation at least 5 of 9 features related to provid-ing local users (teachers, school leaders, and school district staff) with access to student-level data and professional development/training on accessing and using data (including data access and understanding for local education agencies/districts and schools, data quality training programs for schools and local education agencies, and using data to impact education for local education agencies/districts and schools).
Arkansas, Florida, Texas, and Vir-ginia ranked the highest among the 42 states on both criteria (see tables).
Data on state education agency policies and practices for supporting local data use were collected from the agencies’ websites, government and professional association reports, and interviews with 16 state admin-istrators (2 statewide data policy and system administrators and 2 program administrators from each state).
(conTinued)
states reporting that at least half of all 48 features are in operation
features in operation
State number percent
Texas 40 83
arkansas 38 79
florida 37 77
virginia 34 71
mississippi 29 60
michigan 29 60
massachusetts 27 56
utah 25 52
ohio 24 50
Note: Only the 42 state education agencies participating in the federal State Longitudinal Data System grant program were assessed.
Source: U.S. Department of Education 2009.
states reporting that at least 5 of 9 selected features related to access to student-level data and professional development/training are in operation
features in operation
State number percent
Texas 7 78
virginia 7 78
arkansas 6 67
florida 6 67
Tennessee 6 67
mississippi 5 56
Note: Only the 42 state education agencies participating in the federal State Longitudinal Data System grant program were assessed.
Source: U.S. Department of Education 2009.

findingS 5
interview. Interviewees were probed to correct, clarify, and add informa-tion on agency policies and practices supporting data use, types of data supported, and strategies to improve the design and implementation of the policies and practices.
Interview questions for the two pro-gram administrators probed for de-tails on the program and descriptions of how related policies and practices supported local use of data, such as making additional data available to districts and schools, building district and school capacity to analyze data, providing opportunities for local edu-cation agencies to exchange ideas on data use, and establishing incentives or rewards for local education agen-cies that use data to inform practice.
Data collection and analysis were guided largely by an analytical
framework outlined by Data Quality Campaign (2009). This framework led to probes on three types of poli-cies and practices: creating, expand-ing, and linking data systems; ensur-ing data access and use; and building district and school capacity to use data. This framework was used to code search results from state educa-tion agency, federal, and professional association websites. Summaries for each state detailed which poli-cies and practices each state educa-tion agency was implementing in each area of the framework. States were considered to be implement-ing a particular policy or practice when it was reported by at least one interviewee or website, unless it was refuted by another source. State ad-ministrators reviewed the summary and commented on the findings. (See appendix B for more details on the methodology.)
box 2 (conTinued)
Data and methodology
To select potential interviewees, the study team first identified the key administrator for data policy in each state through a search of state agency websites. Working with each contact, the study team selected four interviewees in each agency: one administrator knowledgeable about data policy; one who oversees data systems; and two with primary re-sponsibility for overseeing programs that support local data use. The state policy administrator identified these two programs.
Two semistructured (partially open-ended) interview protocols were used: one for the data policy and data systems administrators and another for the program administrators. The first two interviewees at each agency received a copy of a summary report (developed from web searches and document reviews) before the
Building state repositories. All four states have constructed data systems (data warehouses) that consolidate, link, and integrate data convention-ally stored in separate repositories. All four states reported local use of these data warehouses. Inter-viewees in each state also reported that local users can access data securely.
By consolidating fragmented data systems, state education agencies are creating a standardized database for local education agencies to custom-ize datasets and produce reports. Interviewees believed that local use of these data warehouses has been especially effective for improving educa-tion systems and schools because local educa-tion agencies contributed to planning the state warehouses, thus ensuring that local stakeholders’ needs were addressed. These warehouses have
also allowed districts to compare their schools’ performances with that of other districts or the state as a whole.
Interview data from each state provide examples of state education agency practices that have connected local users to large, longitudinal data system warehouses.
In Arkansas, the data warehouse is a longitudi-nal system for state and federal accountability reporting. It records information, stores it in a file (snapshot) of each district database, and houses historical snapshots. The Arkansas Department of Education data center and other resources, such as the National Office for Research on Measure-ment and Evaluation Systems, are populated with data from the warehouse. Confidentiality is fully

6 WhaT four STaTeS are doing To SupporT local daTa-driven deciSionmaking
Table 1
Policies and practices in use in arkansas, florida, Texas, and Virginia, 2009
Type of policy or practice arkansas florida Texas virginia
Creating, expanding, and linking data systems
building state repositories ✔ ✔ ✔ ✔
expanding the types of data collected and warehoused ✔ ✔ ✔
conducting or funding program evaluation ✔
Ensuring access and use of data
providing access to individual- and school-level data while protecting privacy ✔ ✔ ✔ ✔
creating school-, district-, and state-level reports ✔ ✔ ✔ ✔
providing information technology infrastructure and support ✔ ✔ ✔ ✔
providing access to findings from research and evaluation studies ✔ ✔
Building capacity to use data
partnering with external groups to analyze data ✔ ✔ ✔ ✔
providing professional development ✔ ✔ ✔ ✔
providing tools and resources to enable local data collection, analysis, and decisionmaking ✔ ✔ ✔ ✔
Source: Authors’ analysis of data described in text; types of policies and practices were adapted from Data Quality Campaign (2009).
maintained in these data systems; the data include no personal identification.
For standardizing and warehousing data, the Florida Department of Education has one unit that collects longitudinal data on PreK–12 and com-munity college students and on students after they leave the education system. Another unit struc-tures and links the data in the warehouse. The state warehouse helps districts and schools track student performance and mobility over time and across districts. Further, a department interviewee reported that these state repositories enable dis-tricts to compare their schools’ performances with those of similar districts.
The Texas Education Agency student data system is consolidating two large state repositories to facilitate local use of data: the Public Education Information Management System and the Texas PK–16 Public Education Information Resource. This larger, centralized warehouse encompasses a wide range of information on students, teachers, and other school system personnel. An inter-viewee reported that this warehouse links student data (course completion, attendance, dropout,
transfer, disciplinary) with teacher data (teacher certification, a count of Texas school district employees).
Virginia’s Educational Informational Manage-ment System is a warehouse of longitudinal data provided by each division to the state.2 The system houses state assessment data collected over the past 11 years and student-level assessment data over the past 5 years. In addition to state assess-ment data, the warehouse contains postsecondary enrollment data, as well as Advanced Placement, SAT, and ACT scores; PSAT scores will eventually be included.
Expanding the types of data collected and ware-housed. Arkansas, Florida, and Virginia reported expanding local education agency data collection beyond academic measures and performance sta-tistics. The additional information includes school-level information in all three states, financial data in Arkansas and Florida, facilities data in Florida, and health/child care data in Virginia.
With a broader range of data, the three states provide districts and schools with new measures

findingS 7
to quantify the challenges students face within and outside school, help local stakeholders identify students at risk of failure, and design targeted interventions. Having up-to-date, integrated information on finances and student performance allows districts to evaluate the relationship be-tween expenditures on programs, such as profes-sional development and teacher training, and student outcomes.
Arkansas’s data warehouse merges student achievement, school, and financial data, based on information entered daily, creating a rich source of longitudinal data. Financial data are updated every two weeks, and student data are updated monthly.
Florida has merged student data with noneduca-tional information, such as data from the state departments of labor and family assistance as well as law enforcement agencies. The PK–20 Educa-tion Data Warehouse incorporates information on school facilities, student characteristics, staffing, curriculum, and direct financial aid to college students to provide local stakeholders with a range of data from state sources, from kindergarten through college. In 2009, the Florida Department of Education received a $1.58 million U.S. Depart-ment of Education grant to expand the types of data collected and warehoused.
With a U.S. Department of Health and Human Services grant, Virginia has launched Project Child HANDS (Child Care Subsidy, Health and Early Education: Helping Analyze Needed Data Securely), integrating data from different sources and allowing local users to analyze data on child-care quality and other related factors.
Conducting or funding program evaluation. Only Texas has state education agency offices or units assigned to conduct or fund program evalua-tion to inform local data-driven decisionmaking. The Texas Education Agency commissions and conducts program evaluations, and Texas educa-tion research centers3 compile and store data from the Texas Education Agency, the Texas Higher
Education Coordinat-ing Board, and the Texas Workforce Commission. This warehouse of student data enables research-ers to conduct program evaluations using student outcome data that follow the education trajectory of Texas students from prekindergarten through college and even into the Texas workforce.
Ensuring access and use of data. All four states provide access to individual- and school-level data while protecting privacy; create school-, district-, and state-level reports; and provide information technology infrastructure and support. Texas and Virginia also provide access to findings from evaluation and research studies.
Providing access to individual- and school-level data while protecting privacy. All four states reported their intent to make data easier for local stakeholders— including educators and administrators — to access, understand, and use, while protecting student privacy. Each state allows school administrators, teachers, and district staff to access student-, school-, district-, and state-level information.
Having access to a centralized database of indi-vidual- and school-level data allows teachers and administrators to quickly and accurately identify underperforming students, student subgroups, and schools. Each state has reported that these data have been accessed by school and district staff to track students who are at risk for poor academic outcomes. The data are also used to monitor and track performance at the school and district levels.
The Arkansas Department of Education data center provides districts and schools with access to student, school, district, county, state, and federal raw data (figure 1). The warehouse, a web-based reporting system, allows stakeholders to view information based on their needs and level of
all four states provide
access to individual- and
school-level data while
protecting privacy;
create school-, district-,
and state-level reports;
and provide information
technology infrastructure
and support

8 WhaT four STaTeS are doing To SupporT local daTa-driven deciSionmaking
figure 1
Three areas of accessible school-level data in the arkansas department of education data center
Arkansas Department ofEducation Data Center:
School information
Schooldemographics
Schoolpersonnel
Schoolfinances
• Home language by school
• Status counts (Limited English Proficiency, Individualized Education Program)
• Dropouts and withdrawals by race/ethnicity
• Enrollment by race/ethnicity (state and school level)
• Graduates by gender and race
• Course enrollment by gender and race
• Homeless counts
• Free or reduced-price lunch counts
• Retention data
• List of certified personnel by school
• Teacher–school assignment
• Teacher experience
• Teacher certifica-tions
• Teacher gender information
• Hire date for staff
• District years of experience for staff
• Building losses
• Poverty index by county and school
• Program and agency funding
• Property values by school district
• Underpayments by district
Source: Created by the research team based on information synthesized across Arkansas state websites.
responsibility for students. Each user gets a unique ID that requires authentication when signing into the system and that determines which reports a user can access.
Florida teachers use a login to access and down-load individual student information, including their students’ current and previous statewide assessment scores. Also, a district can monitor and track its performance and compare it with others. Unique student IDs and other methods are used to comply with the privacy rules of the Family Educational Rights and Privacy Act.
The Texas Education Agency has implemented a variety of systems that allow each school to access individual-level data received from the schools, which they can download into a readable format. Districts and schools can also obtain school-level
data, including geographic information for each campus, counts of economically disadvantaged students, student enrollment, budget informa-tion, and financial data. Data that could identify a school have been made anonymous for public use.
Virginia’s Educational Informational Manage-ment System gives principals and teachers access to individual- and school-level data on enrollment, demographics, student achievement, finances, safety, and other areas. Reports can be customized to users’ needs. The warehouse contains a watch-list for principals and teachers to monitor students at risk of failure based on key measures, such as test performance, attendance, retention, and age.
Creating school-, district-, and state-level reports. All four states have also prepared reports for districts that identify issues, analyze performance, and answer key questions at the school, district, and state levels, providing local users online access to findings. Texas and Virginia also allow schools to access reports that identify and monitor the progress of students at-risk for failure.
The Arkansas Department of Education website provides districts access to state education agency school performance reports. The reports include indicators used to measure each school’s progress in areas such as achievement, access, retention, discipline, demographics, choice, and finances. The state monitors and tracks online access of these reports to gauge the extent of their use.
The Florida Department of Education provides online reports that allow the general public to monitor and evaluate progress and performance at the school, district, and state levels. These reports include academic progress, demographic details, and graduation rates (table 2).
The Texas Education Agency has built a range of online systems that allow districts to download classroom and school reports. These reports contain detailed student enrollment numbers; academic, disciplinary, and demographic data; and information on school graduation rates,

findingS 9
Table 2
Preparing school-, district-, and state-level reports in florida
report
acT, SaT, and advanced placement reports
description
provide acT/SaT results by district and school and advanced placement results by district, school, exam score, and test-taker.
community college reports provide statistics on community college enrollment, personnel, admissions, facilities, and students. current and historical reports are available.
florida comprehensive assessment Test demographic results
provide customized demographic reports by state, district, and school. reports can be customized by grade. reports on florida comprehensive assessment Test scores are available for the current year as well as historically.
florida performs provides an assessment of how florida is doing in areas of education that affect the quality of life for students, families, and communities (such as student and school performance, high school completion, and education funding).
florida School indicators report provides numerous indicators of school status and performance. report includes public elementary, middle, and high schools for all florida school districts.
high school feedback reports provides historical pregraduation indicators for florida’s public high school students by district.
national reporting System publishes federal adult education and literacy reports, including college and district data.
performance profiles provide customized reports with comparison data that demonstrate the progress of florida’s students and schools by state and legislative district (reports are organized by house and Senate district number).
prek–12 reports and publications
provide information on prek–12 students, staff, and schools, including on student demographics, school dropout rates, teacher demographics and experience, and school enrollment. reports are available for states, districts, and schools.
State university system reports provide data related to the state university system, including on student demographics, enrollment reports, and school finances.
Source: Authors’ analysis of data described in text.
attendance, admission rates, accountability rat-ings, budgets and finances, and teacher salaries. Many reports monitor the progress of students at risk of failure and can be accessed as PDFs by all schools and districts.
The Virginia Department of Education website provides the general public access to report cards at the school, division, and state levels. The report cards provide information on student achieve-ment, accountability ratings, attendance, program completion, school safety, and teacher quality.
Providing information technology infrastructure and support. All four states reported that being user-friendly, consistent, current, and relevant are goals of their longitudinal data systems. All four states have initiatives to maintain informa-tion technology infrastructure and support, thereby enhancing local data use. The interviewees
reported that they hoped to sustain financial and human capital investments for maintaining and growing these systems. They also hoped to create demand among educators and administrators for data sharing by keeping a large information data-base that follows students, teachers, and schools.
The Arkansas Department of Education data center and Hive4 are online systems for local data use. The department provides upkeep for all data servers, manages help desks, and provides email assistance with the data center website. The department also sends employees to help districts with on-site technical issues.
The Florida Department of Education has recently reengineered its systems, many of which were developed in the 1980s. The state’s goal is to ensure that newer district data systems are compatible with all state data systems, including the K–12

10 WhaT four STaTeS are doing To SupporT local daTa-driven deciSionmaking
student and staff database, community college student and staff database, workforce education database, and state college database.
The Texas Education Agency has also provided online support to help districts find and purchase software applicable to their data needs.
The Virginia Department of Education houses three offices that help local education agencies de-velop and maintain information technology infra-structure and offer support in the use of education technology in schools (figure 2). These offices train administrators and teachers and provide techni-cal assistance to schools. They also manage online computer systems and data networks, maintain computer applications and databases, and imple-ment state technology standards at the local level.
figure 2
The three offices that provide information technology infrastructure and support for the Virginia department of education
Virginia Department ofEducation: local education
agency access to informationtechnology support
Division ofTechnology,Career, and
AdultEducation
Office ofEducationalInformation
Management
Office ofEducationalTechnology
Provides program training to administra-tors and teachers in integrating education technology in the learning process. The division oversees the day-to-day operation of the Virginia Depart-ment of Education network and computer systems, manages and analyzes education data, and offers education technology training and assistance and materials.
Develops and maintains the Virginia Department of Education’s computer applications, oversees the department’s database for local education agency access, and reports federal accountability results.
Serves as a consultant to schools in the effective use of educa-tional technology and updates them on emerging educational technologies and current research. Addi-tionally, the office pro-vides support related to facilities technology planning, program evaluation, and implementation of the Computer/Technology Standards for Students and Technology Stan-dards for Instructional Personnel.
Source: Created by the research team based on information synthesized across Virginia state websites.
To further support the use of technology in improving classroom instruction, the department awarded eight regional consortia Ed Tech grants for a total of approximately $5 million. These competitive subgrants, distributed over five years beginning in 2009/10, are for learning how to use technology to enhance teaching. Grantees can use the funds to support activities that promote the use of technology to collect, manage, and analyze data that could inform and enhance teaching and school improvement efforts.
Providing access to findings from research and evaluation studies. In making report data available to a diversity of users, Texas and Virginia have designed their data warehouses to be easily ac-cessible for evaluation and to include reports that are easy to comprehend. These reports provide abundant information on several of these states programs or initiatives for stakeholders interested in learning about their effectiveness.
The Texas Education Agency’s program evalua-tion unit provides school districts, charter schools, state agency program staff, and the general public with access to federal and state evaluation reports. Results are organized by content area: campus-wide reform projects; charter schools; dropout pre-vention; early childhood education projects; high school and college preparation initiatives; initia-tives for students with limited English proficiency; out-of-school learning opportunities; professional development for educators; science, technology, engineering, and mathematics initiatives; teacher incentive programs; and other reports. The agency also provides on its website a portal dedicated to helping the public more easily access data or products so it can evaluate how well the schools are educating the state’s children.
The Virginia Department of Education publishes an annual report with research on school divisions and individual schools that failed to establish and maintain the commonwealth’s public education standards (also known as Standards of Quality). It also conducts several program evaluations, the results of which are posted on its website
findingS 11
when completed, typically under the appropri-ate program office. The department also reports other statistics on program area websites, where stakeholders often look for data. Research results and reports are posted in a variety of places on the department website and are often summarized and presented to the state board of education (and subsequently posted on the department website as part of the board’s meeting agenda).
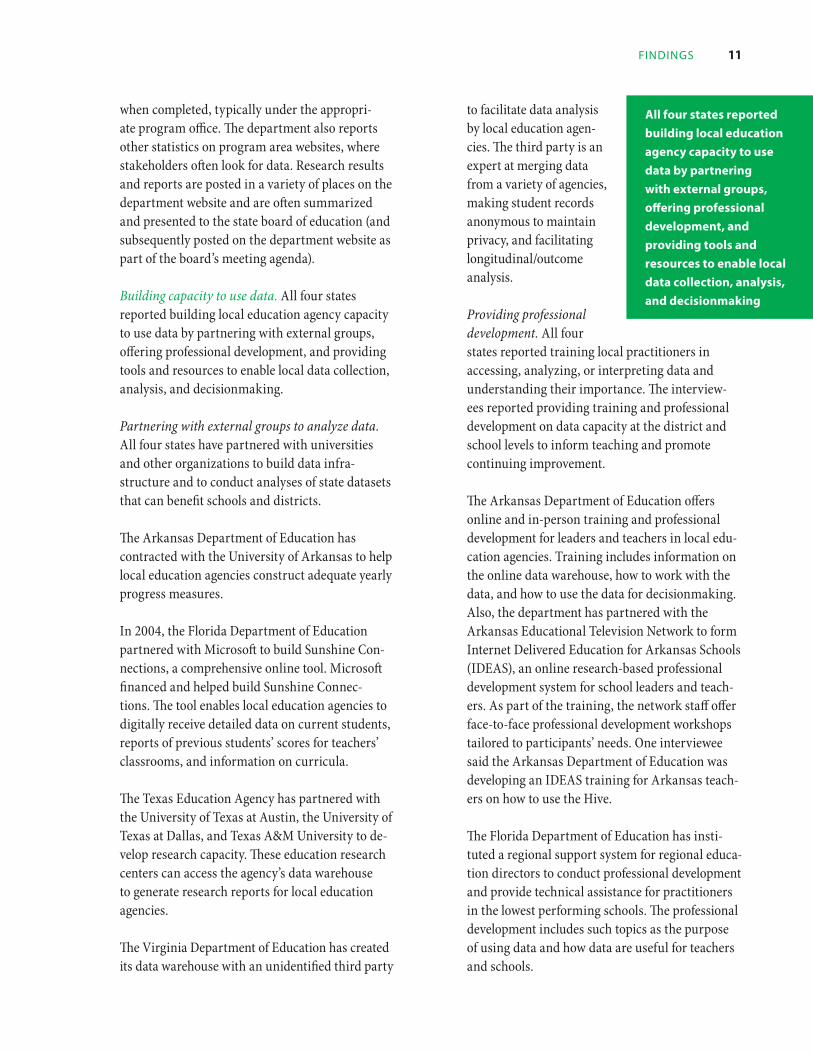
Building capacity to use data. All four states reported building local education agency capacity to use data by partnering with external groups, offering professional development, and providing tools and resources to enable local data collection, analysis, and decisionmaking.
Partnering with external groups to analyze data. All four states have partnered with universities and other organizations to build data infra-structure and to conduct analyses of state datasets that can benefit schools and districts.
The Arkansas Department of Education has contracted with the University of Arkansas to help local education agencies construct adequate yearly progress measures.
In 2004, the Florida Department of Education partnered with Microsoft to build Sunshine Con-nections, a comprehensive online tool. Microsoft financed and helped build Sunshine Connec-tions. The tool enables local education agencies to digitally receive detailed data on current students, reports of previous students’ scores for teachers’ classrooms, and information on curricula.
The Texas Education Agency has partnered with the University of Texas at Austin, the University of Texas at Dallas, and Texas A&M University to de-velop research capacity. These education research centers can access the agency’s data warehouse to generate research reports for local education agencies.
The Virginia Department of Education has created its data warehouse with an unidentified third party
to facilitate data analysis by local education agen-cies. The third party is an expert at merging data from a variety of agencies, making student records anonymous to maintain privacy, and facilitating longitudinal/outcome analysis.
Providing professional development. All four states reported training local practitioners in accessing, analyzing, or interpreting data and understanding their importance. The interview-ees reported providing training and professional development on data capacity at the district and school levels to inform teaching and promote continuing improvement.
The Arkansas Department of Education offers online and in-person training and professional development for leaders and teachers in local edu-cation agencies. Training includes information on the online data warehouse, how to work with the data, and how to use the data for decisionmaking. Also, the department has partnered with the Arkansas Educational Television Network to form Internet Delivered Education for Arkansas Schools (IDEAS), an online research-based professional development system for school leaders and teach-ers. As part of the training, the network staff offer face-to-face professional development workshops tailored to participants’ needs. One interviewee said the Arkansas Department of Education was developing an IDEAS training for Arkansas teach-ers on how to use the Hive.
The Florida Department of Education has insti-tuted a regional support system for regional educa-tion directors to conduct professional development and provide technical assistance for practitioners in the lowest performing schools. The professional development includes such topics as the purpose of using data and how data are useful for teachers and schools.
all four states reported
building local education
agency capacity to use
data by partnering
with external groups,
offering professional
development, and
providing tools and
resources to enable local
data collection, analysis,
and decisionmaking
12 WhaT four STaTeS are doing To SupporT local daTa-driven deciSionmaking
The Texas Education Agency fo-cuses its professional development on content evaluation. It trains teachers to use online sources to evaluate students based on testing data for a subject area. The train-ing on monitoring student prog-ress focuses on what to look for and how to intervene. The Texas Education Agency helps fund
professional development through its Schools, Teachers, Administrators, and Regions grants, which offer up to $500,000 to establish profes-sional learning communities that develop careful planning, supportive leadership, and data-driven decisionmaking.
Professional development in school and division data use is a Virginia Department of Educa-tion goal (offered through a webinar program). Included in the professional development are workshops and webinars for superintendents, principals, and teachers; online training for test results use; and in-person meetings to help divisions and schools collect data not normally collected at the state level. Virginia’s Division of Assessment and School Improvement’s Office of Test Administration, Scoring, and Reporting provides annual professional development to local school divisions at the regional level. The focus of the regional training is on ways that district personnel can support teachers’ use of data in their teaching practice. Divisions can request more professional development or technical assistance at any time. The professional development includes using assessment and other data to improve stu-dent achievement. It teaches users how to access information in Virginia’s Educational Informa-tional Management System.
Providing tools and resources to enable local data collection, analysis, and decisionmaking. All four states reported providing data tools and resources, such as software, and online tools, webpages, and data collection systems, to local education agen-cies. These tools and resources support educators by providing user-friendly platforms that help
school personnel analyze data and simplify the decisionmaking process.
The Arkansas Department of Education provides business intelligence tools (software designed to analyze and present data) and grants software li-censes to educators at the district level, enabling it to monitor reports generated at the local level. The department requires that all districts use a student management and student financial software sys-tem and provides high-speed Internet connections for ease of use.
The Florida Department of Education provides districts with Sandbox, an online tool to evaluate curriculum content by standards. The department encourages educators and administrators to use this tool for analyses.
The Texas Education Agency supports local decisionmaking by providing access to best practices through its Best Practices Clearing-house, a virtual resource enabling schools to share evidence-based best practices. The clearing house provides online tools that orga-nize its best practices summaries by district and school type, content area, evidence type (quan-titative, qualitative, or theory-based), and award type. The clearinghouse also offers best practice standards, links to webinars, and further re-search and resources for districts to collect data and guide decisions.
Virginia uses the schools interoperability frame-work, which allows school data systems to be shared, reduces duplicate data entry, improves consistency, and promotes data accuracy. The framework is a common online format to ac-count for the fact that each school could have a different student information system, library system, or food vendor system. When a school enters information into an online database, the framework system converts the information to a common online format for compatibility with all other systems. It does so behind the scenes, without adding to schools’ already heavy data-input burdens.
all four states reported
providing data tools
and resources, such as
software, and online
tools, webpages,
and data collection
systems, to local
education agencies

findingS 13
State education agency–administered programs that support local data use
In addition to statewide policies, programs can shape district and school data practices. State education agency programs may initiate local data collection and use and determine how local users collect and use data. The agencies exert this programmatic influence through their program guidelines, professional development, and report-ing requirements.
Each state education agency was asked to identify two programs that support local data use. Some of these cases exemplified how programs could sup-port schools and districts; others lacked descrip-tions and examples of how the program supported local data use. Five cases provided clear illustra-tions of programs supporting district and school use of data (one in Florida, two in Texas, and two in Virginia).
Florida’s regional support system and regional executive directors. To support schools directly, the Florida Department of Education created a regional system of assistance for schools and districts failing to meet state education perfor-mance standards. Each regional team, led by a regional executive director, provides professional development and guidance to struggling schools in consultation with the school’s district. Some of these supports are related to data use and analysis.
The U.S. Department of Education selected Florida to participate in the Differentiated Accountability Pilot initiative beginning in the 2008/09 school year. The initiative streamlines federal and state accountability systems and allows the state greater flexibility in providing technical assistance and interventions to schools with the greatest need. The initiative classifies schools by achievement on the Florida Comprehensive Assessment Test (FCAT). Generally, the lowest performing schools get the most state education agency support. And under the initiative, these schools are required to implement the most robust interventions to boost school performance.
The lowest performing schools must administer a benchmark assessment at the beginning of each school year, followed by midyear assessments (in addition to smaller interim assessments). Regional teams stress the importance of selecting assess-ments aligned with and predictive of the FCAT. However, districts make the final decision on the assessments. Once the district has selected the assessments, the regional team builds capacity at the district and school levels to analyze assessment data and determines appropriate interventions for struggling students.
The regional team promotes “data chats” at all educator and leadership levels to strengthen the data analysis capabilities of school staff and lead-ership. In the classroom, teachers talk with their students about each set of assessment results, iden-tify areas of strength and weakness, and discuss why students selected certain answers (correct and incorrect). Teachers then discuss their classes’ assessment data with the principal. Finally, prin-cipals discuss their school’s assessment data with the district superintendent and regional director. The goal of each data chat is to increase the ability of district and school staff to use and analyze diag-nostic test data and to discuss how interventions could be modified to improve student achievement and school performance. The regional directors provide guideline protocols for these multilevel data chats, and instruction specialists from the regional support teams often model the data chat protocol to align with school staff.
Texas’s Statewide Tools for Teaching Excellence project. Statewide Tools for Teaching Excellence was originally formed in 2007 by seven Texas districts and funded by a grant from the Mi-chael and Susan Dell Foundation. In 2009/10, the five districts with
The u.s. department
of education selected
florida to participate
in the differentiated
accountability Pilot
initiative, which
streamlines federal and
state accountability
systems and allows
the state greater
flexibility in providing
technical assistance and
interventions to schools
with the greatest need

14 WhaT four STaTeS are doing To SupporT local daTa-driven deciSionmaking
the program since its inception received additional Texas Educa-tion Agency funding.5 Technical assistance is provided by Edvance Research, Inc.
The project implements a perfor-mance management system for schools and districts so that data analysis, intervention planning, and monitoring can affect stu-dents positively and become part of district and school culture.
At the heart of the project is a three-module tool called Perfor-mance Management Pathways.
The first module is a set of 75 leading (current) and lagging (historical) indicators developed by the participating districts in consultation with Edvance Research. School leaders can review these indicators to determine the challenges their schools face. Lagging indicators are primarily student performance measures — the Texas As-sessment of Knowledge and Skills (TAKS), SAT, and ACT scores — and graduation rates, student demographic indicators, and other data from the Texas Education Agency’s Public Education Infor-mation Management System. Leading indicators are derived from the schools’ student information systems and incorporate such measures as student and teacher attendance, teacher turnover, mas-ter schedules (used to link students to teachers), enrollment in advanced placement courses, course failure, and discipline.
The second module is an interventions database. Edvance Research evaluates and rates interven-tions and links them to the indicators derived in the first module. Each district’s project team identifies key candidate interventions through the online links. The project team can then sort, compare, and read feedback from other districts that have implemented the interventions.
The third module supports planning, implement-ing, and monitoring selected interventions. Users
are guided through planning and implementing an intervention, and then districts decide the style of reports needed to help them evaluate its effectiveness and its influence on indicators of interest. This module provides districts with what the state considers solid evidence for continued funding and implementation of an intervention or justification to consider alternative programs. Ac-cording to the Texas Education Agency, this type of evidence is often lacking when districts must decide whether to continue funding education interventions.
The program also supports professional develop-ment through the Performance Management Academy, a series of training modules (online and three face-to-face meetings annually) designed to strengthen understanding of performance management and help build district capacity to implement and sustain performance manage-ment strategies. Participants from all five districts receive training and can share what they have learned with colleagues from around the state.
Texas’s District Awards for Teacher Excellence (DATE) program. DATE is a pay-for-performance program that funds districtwide incentive plans to reward educators who demonstrate success in im-proving student achievement. The Texas Education Agency established DATE to spur schools to use staff, resources, and data measurement to define high-quality teachers. The program intends to help schools design a data system that can measure teacher quality more effectively. Many schools in Texas had been active in this area before DATE, but others were not. This program was established to encourage many more schools to use data to evaluate teachers.
Although the Texas legislature appropriates funds for DATE, participating districts decide on the district incentive plan, including performance measures and funding allotments. The program operated in 2008/09 and 2009/10, with 2007/08 serving as a year of preprogram technical as-sistance for participating school districts. DATE funding is available to any Texas school district
The Texas education
agency has recognized
that districts have much
to learn from each other
in implementing teacher
incentive programs.
it also recognizes that
there are differences
between large urban
districts and small rural
ones and so it places
large urban districts
in one group and
small to medium-size
districts in another

findingS 15
that participates in required technical assis-tance for the program (as defined by the state) and submits a grant application detailing their performance incentive plan. At least 60 percent of DATE funds must be used to reward teachers and principals who help improve student academic achievement. The remaining 40 percent may be used in other ways, such as for stipends for mentor teachers, instructional coaches, and master teach-ers. It also may be spent on professional develop-ment or on improving local data capabilities to support instruction and adherence to the incentive plan.
Approximately 500 districts participated in 2007/08, but only 200 participated in 2008/09 and 2009/10. According to a state education agency official, the districts choosing not to implement DATE tended to do so because they were un-prepared to take on the politics of an incentive program (not all teachers would receive mon-etary rewards) or because they felt they did not have the data resources or expertise to design an implementable and fair incentive plan, even with DATE financial support. Still, the 200 districts that continue to participate represent more than half of Texas public school students and teachers.
The Texas Education Agency partnered with the Institute for Public School Initiatives at the University of Texas at Austin to help implement DATE. Districts received training or materi-als to help them create effective incentive plans, identify performance-based assessments for local use, develop measures of value-added student improvement, and build data systems or increase the capacity of existing systems to implement the teacher incentive program.
Although some districts had already dedicated significant staff and resources to data and value-added measures before participating in DATE, many others were new to these concepts and systems. DATE prompted many of these inexperi-enced districts to define high-quality teacher and to explain how best to design a data system mea-suring teacher quality by that definition. Beyond
the technical assistance provided by the University of Texas, districts could spend DATE program dollars to hire a data analyst or acquire and imple-ment student performance diagnostics other than the TAKS, to best measure achievement growth or subjects not tested under the TAKS.
Finally, the Texas Education Agency has rec-ognized that districts have much to learn from each other in implementing teacher incentive programs. However, there are differences between large urban districts and small rural ones. There-fore, in organizing DATE conferences and train-ing, the agency seeks to place large urban districts in one group and small to medium-size districts in another. State officials believe that these groupings make it more likely that districts will have similar resource constraints and share similar challenges in implementing DATE.
Virginia Early Warning System. The Virginia Early Warning System is a data tool designed to improve on-time graduation. It has been piloted in four Virginia school divisions (equivalent to districts) since 2008/09. The program was developed by the Virginia Department of Education, the National High School Center, and the Appalachian Regional Comprehensive Center. It allows schools and divisions to assess historical student factors from grades 7 and 8 and make subsequent systemic changes to improve the ability of incoming grade 9 students to navigate and successfully complete high school. For example, divisions might evalu-ate the characteristics of incoming at-risk students and determine that many are arriving from certain middle schools; they might decide that supports and interven-tions at those middle schools would contribute to long-term improve-ment in on-time gradua-tion. The system enables schools and divisions to determine short-term
The Virginia early
Warning system allows
schools and divisions
to assess historical
student factors from
grades 7 and 8 and make
subsequent systemic
changes to improve
the ability of incoming
grade 9 students to
navigate and successfully
complete high school
16 WhaT four STaTeS are doing To SupporT local daTa-driven deciSionmaking
strategies and interventions to help their cur-rent at-risk students, assess the effectiveness of interventions by reanalyzing indicators for grade 9 forward, and potentially recalculate an at-risk composite score based on a student’s demographic and academic data.
School divisions enter state and local data into the early warning spreadsheet. The divisions use the extract file generated by the Virginia Department of Education to import local school data, such as grades. State data —s uch as Standards of Learning scores, attendance, and demographics— can be combined with any division’s extract file to further populate the spreadsheet. The Virginia Early Warning System then produces a composite at-risk score for every incoming grade 9 student based on attendance, grades, behavior, and Standards of Learning (Virginia’s statewide accountability tests) scores for grades 7 and 8. The composite score enables rating all incoming grade 9 students as “on track” for timely graduation or “off track.” Students are then assigned an intervention based on their at-risk score — higher risk students are viewed as needing different interventions than lower risk students— and their specific challenges (attendance, behavior, academics, combination of challenges).
The composite at-risk score was calibrated by the Virginia Department of Education’s work with the four pilot school divisions. The department used lists of students considered at risk for not graduat-ing on time and experimented with point totals for indicators correlated with untimely graduation. During calibration, program leaders and pilot divisions decided that any student who failed the reading Standards of Learning in both grades 7
and 8 should receive an automatic score in the “off track” category, since students with great difficulty reading will not be able to stay in high school without significant support. The department also conducted a validation study of the rating tool and compos-ite score system, finding that it
predicts students who will fail to earn a regular or advanced high school diploma.
Virginia’s Early Intervention Reading Initiative. The Early Intervention Reading Initiative was established in 1997 by the Virginia Department of Education, with funds allocated to help schools and divisions identify children needing extra literacy instruction and to provide early interven-tion services to prevent future reading problems for students with diagnosed needs. Schools that chose to participate implemented the initiative in kindergarten or grade 1. In 2000/01, the state expanded the initiative through grade 3.
To identify students in need of additional reading instruction and inform teachers on their students’ knowledge of literacy fundamentals, the schools administer the Phonological Awareness Literacy Screening (PALS). Used voluntarily by 99 percent of Virginia divisions, this screening assesses young children’s knowledge of the important literacy fundamentals that predict future reading success. Midyear assessments and PALS Quick Checks allow for monitoring student progress throughout the year.
Teachers access their students’ PALS data by logging into the PALS website, managed by the University of Virginia’s Curry School of Educa-tion. Principals who log in can view results for all students in their school. Approximately 15,000 teachers in Virginia have logged into the site. The PALS office maintains a hotline and email system to answer teacher and administrator questions on how to access and use the data. According to one interviewee, the office receives an average of 3,000 emails and 6,000 phone calls each year.
The Early Intervention Reading Initiative is well beyond the rollout and initial training phase. However, teachers can attend summer regional training sessions or as needed to learn how to use PALS data to guide literacy instruction. The Virginia Department of Education and the PALS office also host an annual symposium called the Early Reading Institute, which often covers teach-ing practices that use PALS data, such as strategies
The policies and
practices discussed in
this report are not an
exhaustive list of the four
states’ efforts to promote
and support local data-
driven decisionmaking
SuggeSTionS for fuTure reSearch 17
to group students by reading level. The office also hosts Early Intervention Reading Initiative presentations at teacher and principal association meetings throughout the state.
The Virginia Department of Education has recently begun making portions of PALS data available on its Educational Informational Management System (described above in the section on “Creat-ing, expanding, and linking data systems”) as well, so that teachers and school and division leaders can view benchmark data along with other student performance and demographic metrics. However, the system does not provide the level of detail avail-able on the PALS website (drilling down into what constitutes the baseline score, or subscores, on such areas as word concept or rhyming).
sTudy limiTaTions
This study has several limitations:
The policies and practices discussed in this report are not an exhaustive list of the four states’ ef-forts to promote and support local data-driven decisionmaking. Although data were systemati-cally collected, some relevant information could have been missed in the web searches and the limited number of interviews of state officials. A policy or practice found in web searches would have been left out of the report if no interview-ees confirmed its existence. Also, interviewees’ imperfect information could have resulted in the exclusion of some policies or practices.
• The report does not distinguish between poli-cies and practices because state respondents used these terms interchangeably.
• State education agency activities in data-driven decisionmaking are evolving, so stud-ies conducted at a different time could have slightly different findings.
• Because this study examines the four states that have implemented the largest number
of system features in support of local data use, the findings cannot be general-ized to a broader set of states.
• This report focused on how state educa-tion agencies support local data use with-out discussing local perspectives. Local stakeholders might not always agree with the agency perspective on what constitutes support of their data use in general or in decisionmaking.
• The data on operational features of the 42 statewide longitudinal data system grantees were self-reported by state officials to the National Center for Education Statistics. The accuracy of the data was not verified by the center or by the research team, so some data could have been misreported. For example, state officials might have misunderstood the meaning of certain terms in the data collec-tion instrument. The research team cannot be sure that the longitudinal data system in each study state actually had all the features reported by officials. Moreover, data on the operational features of statewide longitudinal data systems were considered only for the 42 state education agencies with a Statewide Longitudinal Data System grant from the National Center for Education Statistics. Some states without such a grant might also have met the selection criteria.
suggesTions foR fuTuRe ReseaRch
This report suggests several areas for additional research.
This study focused on the states with the highest percentage of features intended to support local
This study focused
on the states with the
highest percentage of
features intended to
support local use of
data. further research
could compare these
states with those that
have lower percentages
of systems and
supports in operation

18 WhaT four STaTeS are doing To SupporT local daTa-driven deciSionmaking
use of data (U.S. Department of Education 2009). Further research could compare these states with those that have lower percentages of systems and supports in operation:
• What are the key differences between state education agencies that have operationalized many features of statewide longitudinal data systems and supports and those that have operationalized fewer features?
• What would state education agency program directors in states with many operationalized features of statewide longitudinal data sys-tems and supports suggest to those in states with fewer operationalized features?
With a broader view of the policies and practices in other states, further research could evaluate those of schools and districts in more detail:
• What are the characteristics of schools and districts that have implemented a wide range of state education agency policies and prac-tices aimed at data-driven decisionmaking?
• Are there regional trends that determine local data use and analysis?
• What characteristics of state education agency policies and practices do schools and districts find most and least valuable?
This study identifies key policies and practices that state education agencies expect will support local data-driven decisionmaking. Since the study did not collect data from districts or schools, informa-tion is lacking on whether and how schools and districts are actually supported. Future research could sample districts and schools and evaluate whether and how their data-driven decision-making is shaped by state education agency data systems and supports:
• To what extent do schools and districts draw on state data systems to inform their data-driven decisionmaking? What factors enable or hinder access and use of state data systems?
• To what extent do schools and districts receive professional and technical assistance for data-driven decisionmaking from their state educa-tion agencies? To what extent do they find the support useful?

appendix a. SummarieS of STudieS WiTh STrong findingS on STaTe educaTion agency SupporT 19
aPPendix a summaRies of sTudies WiTh sTRong findings on sTaTe educaTion agency suPPoRT foR local daTa-dRiVen decisionmaking
Although little systematic research exists on how state education agencies support local data use, several empirical studies suggest that states can and should help develop longitudinal data systems and provide infrastructure to support greater access to and use of data at the district and school levels. The research team reviewed 71 references on data use in districts and schools, which were collected systematically by querying “‘data system’ OR ‘data driven decision making’ OR ‘data use’” on Google. Five empirical studies referenced a state role in supporting local data use, motivating and informing this study.
LaPointe et al. (2009) finds that state education agencies in the Regional Educational Labora-tory Northeast and Islands Region were imple-menting four key components to support data collection and use: a centralized data system/warehouse, tools for data analysis and reporting, training on data systems/warehouses and tools, and professional development in using data for decisionmaking.
In their comprehensive review of research on data and evidence use in district central offices, Honig and Coburn (2008) found that data use is shaped by policy. The authors recommend that federal, state, and local policymakers consider allocating time and resources for greater collaboration and professional development around data use and that they promote and fund partnerships among external organizations and district offices to assist with data use.
In a policy brief drawing on findings from a research project with more than 20 studies of Cali-fornia’s finance and governance systems (http://irepp.stanford.edu/projects/cafinance.htm), Loeb and Plank (2007, p. 4) recommend that, California “[provide] infrastructure and training to support data analysis and use at all levels of the education system” to ensure data quality and timeliness This included investments in employment of special-ized personnel, professional development, and time for educators to make use of the data.
Palaich, Good, and Van der Ploeg (2004, p. 9), in a policy brief analyzing past, present, and future uses of education data, recommend that state education agencies assume five key responsibili-ties associated with effective use of data: “define and prioritize what to study and measure; ensure that student, school, and system performance are measured meaningfully; manage and integrate disparate data sources (infrastructure, security, access); report the data in useful and timely ways; and build the technical and human capacity to use the data effectively in the schools and centrally.”
Data Quality Campaign (2009) contends that the next big hurdle in using statewide longitudinal data systems is less in technology and more in human resources — learning how to use the data appropriately to inform progress. Analyzing data on the features states have implemented in their building of longitudinal data systems, collected over three years, Data Quality Campaign rec-ommends three new targets for state education agencies for use of data. Two targets focus on local education agencies: to ensure that data can be ac-cessed, analyzed, used, and communicated to all stakeholders to promote continuing improvement; and to build the capacity of all stakeholders to use longitudinal data for effective decision making.

20 WhaT four STaTeS are doing To SupporT local daTa-driven deciSionmaking
aPPendix b sTudy meThods
This study conducted nested comparative cases (Yin 2003) of four state education agencies with policies, practices, and programs explicitly intended to support local data use. The study ques-tions were informed by data collected from website searches, interviews of state education agency officials, and document reviews. The sample selec-tion, data collection, and analytical methods are described below.
Sample selection
The National Center for Education Statistics awarded grants to 42 states (including the Dis-trict of Columbia) to develop their longitudinal data systems.6 Data published by the center (U.S. Department of Education 2009) were analyzed to identify the study sample.
The National Center for Education Statistics re-quired grantees to report how many of the 48 fea-tures of state longitudinal data systems and sup-ports they had in operation and posted the results on its website (table B1). Two criteria were used to examine this data and choose the study states (Ar-kansas, Florida, Texas, and Virginia). Data for the other 38 states can be found at http://nces.ed.gov/Programs/SLDS/pdf/features_summary.pdf.
The first criterion was that the state had reported having in operation at least half the 48 features of a state longitudinal data system, as identi-fied and grouped into seven categories in U.S. Department of Education (2009). The second was that the state had reported having in operation at least 5 of 9 features related to two categories: providing local users with access to student-level data, and professional development/training. The second criterion was based on suggestions in the literature (see appendix A) that states should support local education agency data use by providing better access to data and that professional development builds local education agency capacity to use data. This criterion was
deemed necessary because it was possible for a state to operationalize many of the 48 features without focusing on access and professional development.
Data collection
Data were collected over May–July 2010 through three activities: reviewing state education agency websites, searching for reports from governmental and professional organizations, and interviewing state education agency officials.
Reviewing public state education agency web-sites. One research team member searched each state education agency’s official website and coded the results according to the predeter-mined (not extracted from the data) analytical framework described below. The Google search used the phrase “‘data system’ OR ‘data driven decision making’ OR ‘data use.’” The search date was recorded and the search results were saved as a PDF. The results were numbered, and the following inclusion criteria were applied: meets the definition of a policy or the defini-tion of a practice (see box 1 in main report); was initiated at the state education agency level in Arkansas, Florida, Texas, or Virginia; is associ-ated with aspects of data use (interpretation, analysis, decisionmaking) at the local (district or school) level; and is currently in place. These criteria were applied to each search result until 10 results in a row were encountered that were either excluded from or redundant with previ-ous results. The results were examined in the order Google generated them, sorted with the most relevant results (according to Google) first. Google generated 26 results for Arkansas, 304 for Florida, 167 for Texas, and 222 for Virginia.
Searching for reports from governmental and professional associations. The following govern-mental and professional association websites were searched for publications that provided informa-tion on state support of data use:
• ACHIEVE: http://www.achieve.org/.
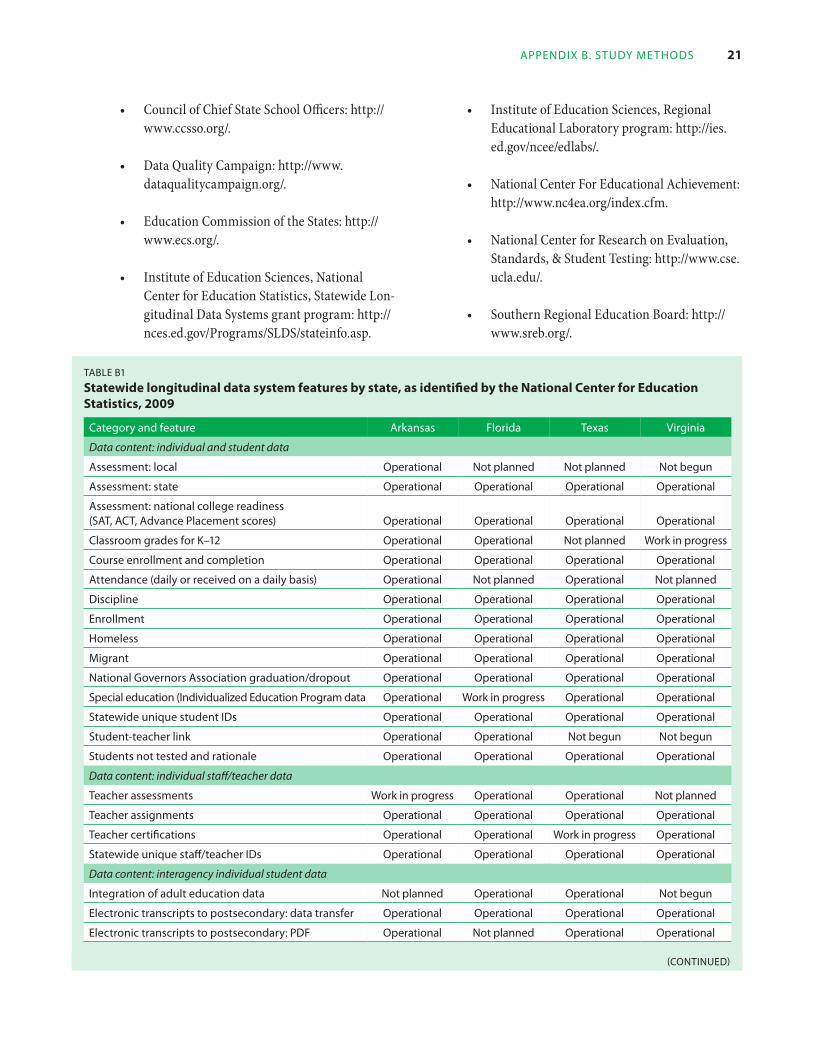
appendix b. STudy meThodS 21
• Council of Chief State School Officers: http://www.ccsso.org/.
• Data Quality Campaign: http://www.dataqualitycampaign.org/.
• Education Commission of the States: http://www.ecs.org/.
• Institute of Education Sciences, National Center for Education Statistics, Statewide Lon-gitudinal Data Systems grant program: http://nces.ed.gov/Programs/SLDS/stateinfo.asp.
• Institute of Education Sciences, Regional Educational Laboratory program: http://ies.ed.gov/ncee/edlabs/.
• National Center For Educational Achievement: http://www.nc4ea.org/index.cfm.
• National Center for Research on Evaluation, Standards, & Student Testing: http://www.cse.ucla.edu/.
• Southern Regional Education Board: http://www.sreb.org/.
Table b1
statewide longitudinal data system features by state, as identified by the national center for education statistics, 2009
category and feature arkansas florida Texas virginia
Data content: individual and student data
assessment: local operational not planned not planned not begun
assessment: state operational operational operational operational
assessment: national college readiness (SaT, acT, advance placement scores) operational operational operational operational
classroom grades for k–12 operational operational not planned Work in progress
course enrollment and completion operational operational operational operational
attendance (daily or received on a daily basis) operational not planned operational not planned
discipline operational operational operational operational
enrollment operational operational operational operational
homeless operational operational operational operational
migrant operational operational operational operational
national governors association graduation/dropout operational operational operational operational
Special education (individualized education program data operational Work in progress operational operational
Statewide unique student ids operational operational operational operational
Student-teacher link operational operational not begun not begun
Students not tested and rationale operational operational operational operational
Data content: individual staff/teacher data
Teacher assessments Work in progress operational operational not planned
Teacher assignments operational operational operational operational
Teacher certifications operational operational Work in progress operational
Statewide unique staff/teacher ids operational operational operational operational
Data content: interagency individual student data
integration of adult education data not planned operational operational not begun
electronic transcripts to postsecondary: data transfer operational operational operational operational
electronic transcripts to postsecondary: pdf operational not planned operational operational
(conTinued)

22 WhaT four STaTeS are doing To SupporT local daTa-driven deciSionmaking
Table b1 (conTinued)
statewide longitudinal data system features by state, as identified by the national center for education statistics, 2009
category and feature
electronic student data exchange among k-12 Schools
arkansas
operational
florida
operational
Texas
operational
virginia
operational
electronic student data exchange with other states not planned not planned not planned not planned
integration of postsecondary data Work in progress operational operational Work in progress
integration of workforce data Work in progress operational operational not begun
prekindergarten (beyond special education)
Data content: school- or agency-level data
geocoded data (giS): school or agency level
operational
operational
operational
operational
operational
operational
operational
not planned
facility data: school level operational operational not planned operational
collection and submission of all federally required data operational operational operational operational
finance: local education agency/district level operational operational operational operational
finance: school level not planned operational operational not planned
Standardized course codes
Access to student level data (via authentication)
business intelligence tools for schools/teachers
operational
operational
operational
Work in progress
operational
Work in progress
operational
operational
local education agency/district staff operational Work in progress operational operational
parents not begun not planned operational operational
publicly accessible policy on data access for researchers operational operational operational operational
published policy on data use Work in progress operational not begun operational
publicly accessible school/grade-level achievement growth model data (based on individual student growth measures)
Professional development/training
data access and understanding for local education agencies/districts and schools
operational
operational
operational
operational
operational
operational
not planned
operational
data quality training program for schools and local education agencies Work in progress operational operational Work in progress
using data to impact education for local education agencies/districts and schools operational operational operational operational
data system features
business rules to identify invalid data entries operational operational operational operational
comprehensive metadata (with history of code changes and policies affecting data) for statewide longitudinal data systems operational operational operational not begun
comprehensive data dictionary for statewide longitudinal data systems operational Work in progress operational operational
data audit system: measuring data quality/validity/reliability operational operational operational operational
external evaluation of data availability and use (from statewide longitudinal data systems) operational Work in progress operational operational
functioning comprehensive agencywide data management and governance policies and procedures Work in progress Work in progress operational operational
Source: U.S. Department of Education 2009.

appendix b. STudy meThodS 23
These websites were selected because they pub-lish reports on state policies and practices or on data use at the state level. The searches included combinations of the following phrases/terms: each state name (full state names and the abbreviations AR, FL, TX, and VA), “policy OR practice,” and “data OR decision making.” The search yielded 70 publications, but only 11 detailed the policies or practices the four state education agencies were implementing to support local data use. Of these 11 reports, 6 detailed the policies and practices in Texas, 5 in Florida, 4 in Virginia, and 4 in Arkansas.
Interviewing state education agency officials. Four representatives from each state education agency were interviewed for one hour. Initially, a contact for each was identified through a search of each agency website for its key administrator for data policy. The research team worked with each contact to identify four interviewees in each agency: one administrator knowledgeable in data policy; one who oversees data systems; and two with primary responsibility for oversee-ing programs that support local data use. The state policy administrator identified the two programs.
Two semistructured (partially open-ended) interview protocols were implemented: one for the data policy and data systems administrators and another for the program administrators. The first two interviewees received a copy of a sum-mary report (developed from web searches and document reviews) before the interview and were probed to correct, clarify, and add information on agency policies and practices to support data use, types of data supported, and strategies to improve the design and implementation of the policies and practices.
In addition, the state policy administrator was asked to recommend programs that best support local data use. Objective sampling criteria were not implemented, as this study was not designed to find “typical” examples or to generalize findings to all programs. Given that state support for data use
is a fairly new area of emphasis for state educa-tion agencies, the research team anticipated that many programs might not provide such support and wanted to ensure that the sampled programs would provide relevant data.
Interview questions for the program adminis-trators probed for details on the program and descriptions of how related policies and practices supported local use of data by making additional data available to districts and schools, build-ing district and school capacity to analyze data, providing opportunities for local education agencies to exchange ideas related to data use, and establishing incentives or rewards for local educa-tion agencies that use data to inform practice. Interviewees sometimes volunteered artifacts that provided more detail on policies and practices. Notes were recorded for all interviews.
Data analysis
Before data were collected, a set of analytical codes was drafted based largely on a framework developed by Data Quality Campaign (2009; box B1). This framework articulates a set of poli-cies and practices that states can implement to support data use. However, because the frame-work does not focus on support for schools and districts in particular, three dimensions were added based on findings from the Institute for Education Sciences practice guide on data use (Hamilton et al. 2009).
Given that the analytical framework develop-ment process should be iterative to improve the fit of codes with the empirical data and make findings more reliable (Maxwell 1996; Merriam 1998; Miles and Huberman 1994), two research-ers independently tested the codes on a set of 10 search results. This led to a reorganization of the framework, the addition of seven codes, and a refinement of the language of existing codes. (The research team also examined whether the codes should be revised after using them to code interview data but found that revisions were not necessary at that time.)

24 WhaT four STaTeS are doing To SupporT local daTa-driven deciSionmaking
box b1
Data-driven decisionmaking analytical codes
1. Creating, expanding, and linking data systems.a. Link state K–12 data systems
with early learning, postsec-ondary education, work-force, social services, and other critical state agency data systems.
b. Build data warehouses that integrate student, staff, financial, and facility data.
c. Expand the types of data collected and warehoused (adding grade levels of test-ing, interim assessment data, new measures of college readiness, or demographics).1
d. Other.
2. Ensuring access and use of data.a. Implement systems to pro-
vide all stakeholders timely access to the information they need while protecting student privacy.
b. Create progress reports with individual student data that provide information that educators, parents, and students can use to improve student performance.
c. Create reports that include longitudinal statistics on school systems and groups of students to guide school-, district- and state-level improvement efforts.
d. Provide information tech-nology infrastructure and support.1
e. Other.
3. Building capacity to use data.a. Develop a purposeful
research agenda and col-laborate with universities, researchers, and intermedi-ary groups to explore the data for useful information.
b. Implement policies and promote practices, including professional development and credentialing, to ensure that educators know how to
access, analyze, and use data appropriately.
c. Promote strategies to raise awareness of available data and ensure that all key stakeholders, including state policymakers, know how to access, analyze, and use the information.
d. Provide data collection tools (assessments, surveys, observation protocols), analysis tools (software), and knowledge resources (access to best practice guides for instructional and school improvement strategies) that educators can use locally for data collection, analysis, and decisionmaking.1
e. Other.
4. Other.
Note1. Code added by research team.
Source: Data Quality Campaign 2009; authors’ compilation of study records.
The state education agency website data was analyzed first. Each search result was assigned at least one analytical code if the website evidenced a policy or practice. The website and its codes were entered into an Excel spreadsheet. Two researchers independently coded all the search results for one state. Interrater reliability was measured by calcu-lating a Cohen’s Kappa of 0.82, suggesting strong agreement between raters. One researcher coded the material for the other three states.
After the search results were coded, a summary report was written for each state synthesizing find-ings related to its policies and practices for sup-porting local data use, the types of data they were
supporting, and the strategies they had pursued to improve the design and implementation of the policies and practices. The outline of these reports matched that of the analytical codes.
For each code, the research team wrote summary bullets that named the policy or practice identi-fied by the web search and described the policy or practice in a sentence or two.7 The bullets were linked to the original source of the associated policy or practice. Data from government and association reports (and added to the policies or practices as bullets) were thus folded into this summary report. For example, if a report named a new policy or practice, another summary bullet

appendix b. STudy meThodS 25
was added in the appropriate section, including a citation to the report that informed the bullet. In most cases, however, the reports identified policies and practices already identified through the web search. In these cases, citations were added to the report to record instances of findings supported by multiple sources.
A similar process was used to add data from the policy and data system interviewees (including from responses and artifacts provided by the interview-ees) to the state summary reports. Per the protocols, interviewees were asked to review the summary reports to add missing policies and practices and to note if any information appeared misclassified or outdated. Interviewees were also asked to clarify whether and how their state’s policies and practices support district and school data use.
Although the original plan was to transcribe and code the interview notes, it became problematic due to the artifact-based interviews. For example, when an interviewee referred to “the second bullet in section 2c” of the summary report, standalone transcripts provided insufficient information for the researchers to code the response.
Instead, interview notes were entered directly into the summary report. For example, if an inter-viewee elaborated on the Texas Early Warning Data System project and how it supported schools and districts, these notes were added as a subbullet to the bullet summarizing that project and cited the interviewee as the source of the added infor-mation. This approach— organizing the interview notes by the codes— eliminated the need to code the interview notes separately.
Two researchers took notes for the first three interviews (with a data policy administrator, a data systems administrator, and an administrator with oversight for a local education agency–related program that supported agency data in a single state) and independently coded the notes. They then compared their results and arrived at consis-tent coding for those interview data. And through this process, the research team kept track of data sources and identified the instances where mul-tiple data sources supported a particular finding.
After analyzing the results, the research team found that the data supported some components of the framework but not others. There was no evidence that the states were supporting local data use through 1.a, 2.b, or 3.c. Although states were sometimes undertaking these activities, the purpose was not related to supporting local data use. These categories were thus excluded from the findings.
Evidence collected through the “other” categories supported the addition of two categories of policies and practices: “conducting or funding program evaluation” and “providing access to findings from research and evaluation studies.” Some of the titles of other categories were rephrased to more accurately reflect the data. For example, 3.a was rephrased from “developing a purposeful research agenda and collaborating with universities, re-searchers, and intermediary groups to explore the data for useful information” to “partnering with external groups to analyze data.” The latter phrase more accurately depicted policies and practices that the sample states used to support local data use.
26 WhaT four STaTeS are doing To SupporT local daTa-driven deciSionmaking
noTes
Several people provided information and insight on the inner workings of state policies and practices. From Arkansas, the authors thank Jim Boardman, Deborah Coffman, Cody Decker, and Neil Gibson; from Florida, Nancy Copa, Stuart Greenburg, Jeff Sellers, and Nikolai Vitti; from Texas, Kathleen Barfield, Jerel Booker, Priscilla Aquino Garza, Jan Lindsey, Brian Rawson, and Lizette Reynolds; and from Virginia, Mark Allan, Bethann Canada, Deborah Jonas, and Kathleen Smith.
The authors also thank Julie A. Marsh for her intellectual leadership on the study design, methodology, and proposal; James Coley for re-search assistance, including tireless coding of state education agency websites; and the six anonymous reviewers who provided thoughtful feedback under a very tight timeline.
Although this report has acknowledged the indi-viduals that provided information in interviews, it maintains confidentiality by not attributing any information to individuals and not identifying any districts.
1. This study set out to distinguish policies (deliberate mandates or guides to achieve rational outcomes) from practices (customary ways of operation or behavior), but it turned out that this distinction was not always salient to respondents. They often blended the two types of activities in their responses, and many of the state actions they described had elements of both. Thus this report uses the terms in combination. The distinction is not critical to the report because the overall goal is to describe what each state is doing on a practical level.
2. Virginia uses division instead of district, but the meaning is the same.
3. Authorized by the Texas Legislature in 2006, the Texas education research centers were estab-lished at the University of Texas at Austin, the University of Texas at Dallas, and Texas A&M University to conduct research that benefits education in the state. With data from several state agencies, the three centers can evaluate state and federal education programs, teacher preparation programs, special language pro-grams, and school district business practices.
4. The Arkansas Department of Education’s Hive is an online community enabling education practitioners to share and discuss student achievement data collected by the depart-ment. It provides data on school performance and growth in a format that makes the results easier to see and compare. On it are Arkansas benchmark and end-of-course scores by district or county in a variety of graphics. Comparisons of data between two districts are also possible.
5. The program’s planning phase began in seven districts in 2007, but two dropped out after district leadership changed in the first year of implementation.
6. The states that did not receive grants were Alabama, Delaware, New Jersey, New Mexico, Oklahoma, South Dakota, Vermont, West Virginia, and Wyoming.
7. For example, a finding written in the Texas summary report in the section on expanding the types of data collected and warehoused stated: “As part of its Early Warning Data System Pilot Project, the [Texas Education Agency] is expanding the types of data it collects by creating indicators of risk and an intervention database. Districts and high schools can use the system to identify stu-dents at risk of being retained or dropping out and target interventions accordingly.”

referenceS 27
RefeRences
Choppin, J. (2002). Data use in practice: examples from the school level. Paper presented at the annual Conference of the American Educational Research Association, New Orleans, LA.
Crawford, V.M., Schlager, M., Penuel, W.R., and Toyama, Y. (2008). Supporting the art of teaching in a data-rich, high performance learning environment. In E.B. Man-dinach and M. Honey (Eds.), Linking data and learning (pp. 109–29). New York: Teachers College Press.
Data Quality Campaign. (2009). The next step: using lon-gitudinal data systems to improve student success. Re-trieved June 19, 2009, from www.dataqualitycampaign.org/files/NextStep.pdf.
Feldman, J., and Tung, R. (2001). Whole school reform: how schools use the data-based inquiry and decision making process. Seattle, WA: American Educational Research Association.
Gottfried, M.A. (2009). Excused versus unexcused: how student absences in elementary school affect academic achievement. Educational Evaluation and Policy Analy-sis, 31(4), 392–419.
Gottfried, M.A. (2010). Evaluating the relationship between student attendance and achievement in urban elemen-tary and middle schools: an instrumental variables approach. American Education Research Journal, 47(2), 434–65.
Hamilton, L., Halverson, R., Jackson, S., Mandinach, E., Supovitz, J., and Wayman, J. (2009). Using student achievement data to support instructional decision making (NCEE 2009-4067). Washington, DC: U.S. De-partment of Education, Institute of Education Sciences, National Center for Education Evaluation and Regional Assistance. Retrieved August 1, 2010, from http://ies.ed.gov/ncee/wwc/publications/practiceguides/.
Honig, M.I., and Coburn, C. (2008). Evidence-based deci-sion making in school district central offices: toward a policy and research agenda. Educational Policy, 22(4), 578–608.
Ikemoto, G.S., and Marsh, J.A. (2007). Cutting through the “data-driven” mantra: different conceptions of data-driven decision making. In P.A. Moss (Ed.), Evidence and decision making (pp. 105–31). Malden, MA: Black-well Publishing.
LaPointe, M.A., Brett, J., Kagle, M., Midouhas, E., Sánchez, M.T., Oh, Y., and North, C. (2009). How state education agencies in the Northeast and Islands Region support data-driven decision making in districts and schools (Issues & Answers Report, REL 2009–072). Wash-ington, DC: U.S. Department of Education, Institute of Education Sciences, National Center for Education Evaluation and Regional Assistance, Regional Edu-cational Laboratory Northeast and Islands. Retrieved June 19, 2009, from http://ies.ed.gov/ncee/edlabs/regions/northeast/pdf/REL_2009072.pdf/.
Loeb, S., and Plank, D. (2007). Continuous improvement in California education: data systems and policy learning. Berkeley, CA: Policy Analysis for California Education.
Mandinach, E.B., Honey, M., and Light, D. (2006). A theo-retical framework for data-driven decision making. San Francisco, CA: American Educational Research Association, EDC Center for Children and Technology.
Marsh, J., Pane, J., and Hamilton, L. (2006). Making sense of data-driven decision making in education: evidence from recent RAND research. Retrieved June 19, 2009, from www.rand.org/pubs/occasional_papers/OP170/.
Mason, S. (2002). Turning data into knowledge: lessons from six Milwaukee public schools. Madison, WI: Wisconsin Center for Education Research.
Maxwell, J.A. (1996). Qualitative research design: an interactive approach. Thousand Oaks, CA: SAGE Publications.
Merriam, S.B. (1998). Qualitative research and case study applications in education. San Francisco, CA: Jossey-Bass.
Miles, M.B., and Huberman, A.M. (1994). Qualitative data analysis: an expanded sourcebook (2nd ed.). Thousand Oaks, CA: SAGE Publications.

28 WhaT four STaTeS are doing To SupporT local daTa-driven deciSionmaking
Palaich, R.M., Good, D.G., and Van der Ploeg, A. (2004, June). State education data systems that increase learning and improve accountability (Policy Issues 16). Naperville, IL: Learning Point Associates.
Supovitz, J.A., and Klein, V. (2003). Mapping a course for improved student learning: how innovative schools systematically use student performance data to guide improvement. Philadelphia, PA: Consortium for Policy Research in Education, University of Pennsylvania Graduate School of Education.
U.S. Department of Education, National Center for Educa-tion Statistics. (2009). Statewide Longitudinal Data Sys-tems grant program: designing, developing, implement-ing, and using longitudinal data systems to improve student learning. Retrieved June 20, 2009, from http://nces.ed.gov/Programs/SLDS/index.asp.
Yin, R.K. (2003). Case study research: design and methods (3rd ed.). Thousand Oaks, CA: Sage Publications.